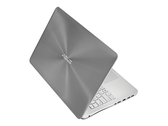
Notebookcheck Logo

AMD FX-7600P

AMD FX-7600P

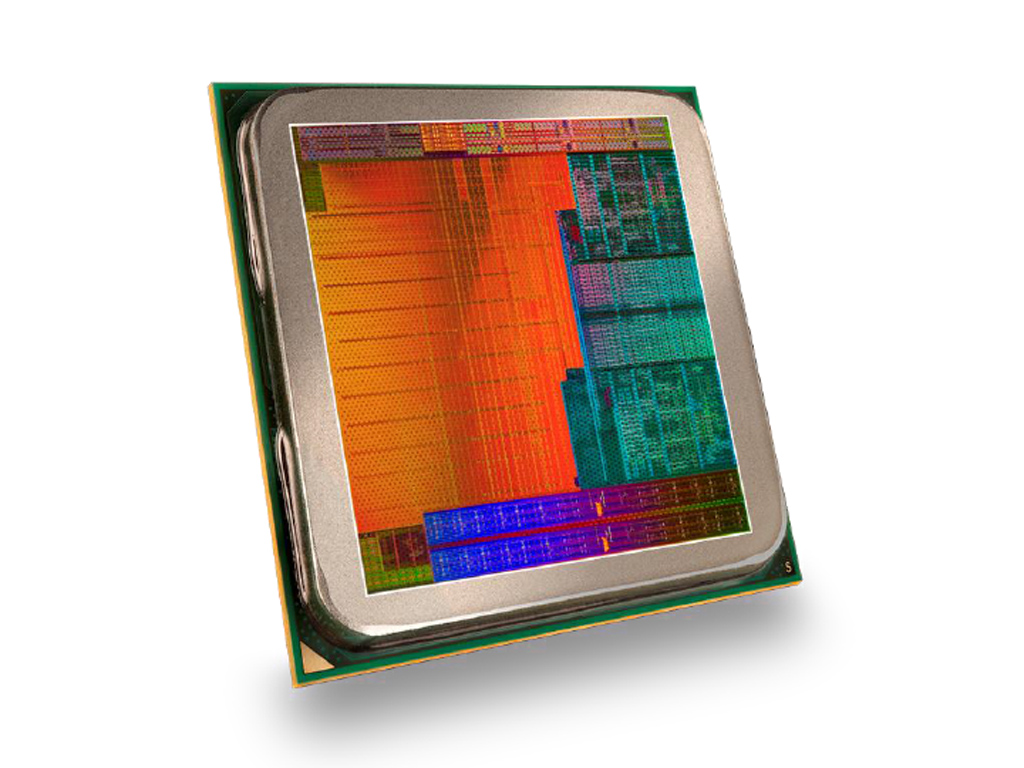
AMD FX-7600P是一款基于Kaveri架构的中端四核处理器。它最早发布于2014年6月,为笔记本电脑设计,由GlobalFoundries生产,采用了28纳米SHP技术。除了两个运算模块共四个运行于2.7-3.6GHz的运算核心,它还集成了一块配备了512个GCN着色器、运行于686MHz的Radeon R7显示芯片,和一个双通道DDR3-2133内存控制器。 架构 Kaveri架构是2013年的Richland架构(如A10-5750M)处理器的继任者,代号为Steamroller,是模块化的Bulldozer设计之后的第三代产品。它有了一些重大的改变,包括改进的解码器(现在每个整值核心都配备了一个),优化的分支预测,和每个模组从64KB提高到96KB的L1缓存。这些优化使得它单位时钟频率的性能略高于Richland APU。更多关于Kaveri架构的信息请参考我们的详细分析: AMD Kaveri笔记本平台分析 性能 根据较早的基准测试结果,FX-7600P提供了与Ivy Bridge架构的Intel i3-3110M接近的性能表现。FX-7600P在多线程测试中的表现更好,而Core i3在单线程测试中的更胜一筹。总体来说,FX-7600P可以胜任日常的多任务处理(Office,上网,多媒体),和一些大型程序。 图形 FX-7600P中配备的Radeon R7(Kaveri)显卡提供了最高686MHz的核心频率和512个着色单元。由于这款显卡的设计基于GCN 1.1架构,所以支持DirectX 11.2 T2和Mantle标准。另外,它同样支持对很多应用程序例如Adobe Photoshop通过OpenCL提供硬件加速。 在3D性能方面,这款显卡由于较高的运算能力和最高DDR3-2133的内存支持而有不错的表现。因此,Radeon R7仅仅比Intel的Iris Pro Graphics 5200略慢,与GeForce GT 730M独立显卡相当。在2014年第二季度,它是最快的笔记本电脑集成显卡之一,可以在中低设置和WXGA分辨率下流畅运行大部分最新游戏。 功耗 这款处理器的整体功耗为35W,接近于其他中端处理器。因此,FX-7600P最适合于14寸或更大的笔记本电脑。

SeriesAMD Kaveri
CodenameKaveri

Series: Kaveri Kaveri

AMD FX-7600P « 2.7 - 3.6 GHz4 / 4 cores
AMD A10-7400P2.5 - 3.4 GHz4 / 4 cores
AMD A8-7200P2.4 - 3.3 GHz4 / 4 cores
AMD FX-75002.1 - 3.3 GHz4 / 4 cores
AMD A10 Pro-7350B2.1 - 3.3 GHz4 / 4 cores
AMD A10-73001.9 - 3.2 GHz4 / 4 cores
AMD A8 Pro-7150B1.9 - 3.2 GHz4 / 4 cores
AMD A8-71001.8 - 3 GHz4 / 4 cores
AMD A6 Pro-7050B2.2 - 3 GHz2 / 2 cores
AMD A6-70002.2 - 3 GHz2 / 2 cores
Clock Rate2700 - 3600 MHz
Front Side BusBGA (FP3)
Level 1 Cache256 KB
Level 2 Cache4 MB
Number of Cores / Threads4 / 4
Power Consumption (TDP = Thermal Design Power)35 Watt
Transistor Count2410 Million
Manufacturing Technology28 nm
Die Size245 mm2
Max. Temperature105 °C
FeaturesSSE (1, 2, 3, 3S, 4.1, 4.2, 4A), x86-64, AES, AVX, FMA, DDR3-2133 Controller
GPUAMD Radeon R7 (Kaveri) (600 - 686 MHz)
64 Bit64 Bit support
Architecturex86
Announcement Date06/04/2014
Product Link (external)www.amd.com

Benchmarks

Cinebench R23 - Cinebench R23 Multi Core
949 Points (1%)
AMD E1-2100
202 -79%
...
709 -25%
735 -23%
Intel Pentium B970
792 -17%
AMD A10-5745M
830 -13%
830 -13%
Intel Core i3-5010U
834 -12%
AMD A6-5200
843 -11%
911 -4%
943 -1%
AMD FX-7600P
949
Intel Celeron N4100
961 1%
Intel Pentium Gold 4425Y
964 2%
992 5%
1072 13%
Intel Celeron N4120
1149 21%
1149 21%
1175 24%
Intel Celeron J4125
1203 27%
Intel Core i3-5005U
1225 29%
...
32782 3354%
max:
107681 11247%
0%
100%
Cinebench R23 - Cinebench R23 Single Core
481 Points (20%)
AMD A10-5745M
74.4 -85%
...
Intel Pentium Gold 4425Y
388 -19%
Intel Core i3-5010U
411 -15%
Intel Celeron N4120
416.5 -13%
Intel Pentium B970
418 -13%
Intel Celeron J4125
425.3 -12%
430 -11%
438 -9%
439 -9%
452 -6%
AMD FX-7600P
481
Intel Core i3-5005U
499 4%
513 7%
Intel Pentium Gold 4415U
529 10%
539 12%
567 18%
576 20%
584 21%
588 22%
603 25%
...
2017 319%
max:
2351 389%
0%
100%
Cinebench R20 - Cinebench R20 CPU (Single Core)
177 Points (20%)
Cinebench R20 - Cinebench R20 CPU (Multi Core)
439 Points (1%)
Cinebench R15 - Cinebench R15 CPU Multi 64 Bit
min: 211     avg: 223.7     median: 228 (1%)     max: 232 Points
AMD A4-1200
31 -86%
...
Intel Core i5-3337U
211 -6%
212.5 -5%
213.4 -5%
Intel Core i3-5015U
214 -4%
Intel Core m5-6Y54
215 -4%
Intel Core i3-5010U
216.8 -3%
219 -2%
Intel Core i3-10100Y
220 -2%
Intel Celeron J4125
223.4 0%
AMD FX-7600P
223.7
Intel Core i5-3437U
224 0%
AMD PRO A12-9800B
225.3 1%
225.5 1%
226 1%
226.5 1%
Intel Core i5-4200U
226.6 1%
Intel Core i3-7020U
227 1%
Intel Celeron N4120
227 1%
228 2%
...
5600 2403%
max:
15842 6982%
0%
100%
Cinebench R15 - Cinebench R15 CPU Single 64 Bit
min: 72     avg: 74.3     median: 75 (23%)     max: 76 Points
AMD A4-1200
19 -74%
...
AMD A10-9620P
72 -3%
Intel Celeron 3865U
72 -3%
Intel Celeron J4125
72.5 -2%
AMD A12-9720P
72.5 -2%
73 -2%
73.3 -1%
Intel Celeron N4120
73.6 -1%
73.8 -1%
74 0%
AMD FX-7600P
74.3
Intel Core i5-4202Y
74.3 0%
AMD A10-9600P
74.8 1%
AMD A10-5750M
75.5 2%
AMD PRO A12-9800B
75.7 2%
76 2%
76 2%
Intel Core i3-4158U
77 4%
Intel Core i5-4300Y
77 4%
Intel Pentium 3825U
77 4%
...
311 319%
max:
332 347%
0%
100%
Cinebench R11.5 - Cinebench R11.5 CPU Multi 64 Bit
min: 2.38     avg: 2.5     median: 2.5 (3%)     max: 2.68 Points
Cinebench R11.5 - Cinebench R11.5 CPU Single 64 Bit
min: 0.81     avg: 0.8     median: 0.8 (21%)     max: 0.88 Points
Cinebench R10 - Cinebench R10 Rend. Single (32bit)
min: 2472     avg: 2590     median: 2555 (15%)     max: 2742 points
Cinebench R10 - Cinebench R10 Rend. Multi (32bit)
min: 6602     avg: 7256     median: 7418 (5%)     max: 7749 points
Cinebench R10 - Cinebench R10 Rend. Multi (64bit)
9715 Points (7%)
Cinebench R10 - Cinebench R10 Rend. Single (64bit)
3531 Points (4%)
wPrime 2.10 - wPrime 2.0 1024m *
565 s (7%)
wPrime 2.10 - wPrime 2.0 32m *
min: 16.3     avg: 16.4     median: 16.4 (3%)     max: 16.5 s
WinRAR - WinRAR 4.0
min: 1200     avg: 1500     median: 1500 (2%)     max: 1800 points
X264 HD Benchmark 4.0 - x264 Pass 2
17.6 fps (6%)
X264 HD Benchmark 4.0 - x264 Pass 1
min: 75.5     avg: 81.5     median: 81.5 (19%)     max: 87.5 fps
HWBOT x265 Benchmark v2.2 - HWBOT x265 4k Preset
1.6 fps (3%)
TrueCrypt - TrueCrypt Serpent
min: 0.217     avg: 0.2     median: 0.2 (0%)     max: 0.221 GB/s
TrueCrypt - TrueCrypt Twofish
min: 0.35     avg: 0.4     median: 0.4 (6%)     max: 0.357 GB/s
TrueCrypt - TrueCrypt AES
min: 1.7     avg: 1.8     median: 1.8 (5%)     max: 1.8 GB/s
Blender - Blender 3.3 Classroom CPU *
4512 Seconds (57%)
R Benchmark 2.5 - R Benchmark 2.5 *
1.4 sec (31%)
3DMark 06 - CPU - 3DMark 06 - CPU
min: 3023     avg: 3400     median: 3569 (8%)     max: 3608 Points
Super Pi mod 1.5 XS 1M - Super Pi mod 1.5 XS 1M *
min: 21.3     avg: 22.4     median: 22.4 (5%)     max: 23.5 s
Super Pi mod 1.5 XS 2M - Super Pi mod 1.5 XS 2M *
50.6 s (2%)
Super Pi Mod 1.5 XS 32M - Super Pi mod 1.5 XS 32M *
1179 s (5%)
3DMark Vantage - 3DM Vant. Perf. CPU no Physx
min: 5981     avg: 6755     median: 6754.5 (6%)     max: 7528 Points
3DMark 11 - 3DM11 Performance Physics
min: 2348     avg: 2584     median: 2467 (7%)     max: 2938 Points
3DMark - 3DMark Ice Storm Physics
min: 23143     avg: 25133     median: 25132.5 (20%)     max: 27122 Points
3DMark - 3DMark Ice Storm Extreme Physics
26957 Points (22%)
3DMark - 3DMark Ice Storm Unlimited Physics
29378 Points (25%)
3DMark - 3DMark Cloud Gate Physics
min: 2123     avg: 2203     median: 2202.5 (6%)     max: 2282 Points
3DMark - 3DMark Fire Strike Standard Physics
min: 2956     avg: 3255     median: 3254.5 (6%)     max: 3553 Points
3DMark - 3DMark Time Spy CPU
1243 Points (5%)
Geekbench 5.5 - Geekbench 5.1 - 5.4 64 Bit Single-Core
487 points (21%)
AMD E1-2100
125 -74%
...
433.5 -11%
Intel Celeron 3867U
434 -11%
Intel Pentium B970
435 -11%
Intel Celeron N4120
442 -9%
AMD A10-4600M
446 -8%
AMD A4-5150M
454 -7%
Intel Celeron J4125
454.2 -7%
464 -5%
Intel Celeron 5205U
480 -1%
AMD FX-7600P
487
Qualcomm Snapdragon 850
488 0%
491.7 1%
AMD A10-5750M
493 1%
510 5%
531 9%
Intel Core i3-5005U
531 9%
Intel Core i7-2675QM
536 10%
556 14%
AMD 3015Ce
564 16%
...
2331 379%
0%
100%
Geekbench 5.5 - Geekbench 5.1 - 5.4 64 Bit Multi-Core
1438 points (3%)
Geekbench 3 - Geekbench 3 32 Bit Multi-Core
min: 5210     avg: 5308     median: 5307.5 (9%)     max: 5405 points
Geekbench 3 - Geekbench 3 32 Bit Single-Core
min: 1861     avg: 1893     median: 1892.5 (37%)     max: 1924 points
Geekbench 3 - Geekbench 3 64 Bit Multi-Core
5715 points (9%)
Geekbench 3 - Geekbench 3 64 Bit Single-Core
1998 points (30%)
Geekbench 2 - 32 Bit - Geekbench Stream
min: 2503     avg: 3297     median: 3297 (27%)     max: 4091 Points
Geekbench 2 - 32 Bit - Geekbench Memory
min: 2247     avg: 2767     median: 2767 (25%)     max: 3287 Points
Geekbench 2 - 32 Bit - Geekbench Floating Point
min: 5275     avg: 5334     median: 5334 (10%)     max: 5393 Points
Geekbench 2 - 32 Bit - Geekbench Integer
min: 6242     avg: 6317     median: 6316.5 (13%)     max: 6391 Points
Geekbench 2 - 32 Bit - Geekbench Total Score
min: 4824     avg: 4961     median: 4960.5 (13%)     max: 5097 Points
Mozilla Kraken 1.1 - Kraken 1.1 Total Score *
min: 2466     avg: 2886     median: 2610.5 (3%)     max: 3856 ms
Sunspider - Sunspider 1.0 Total Score *
min: 142.1     avg: 201.3     median: 201.3 (2%)     max: 260.5 ms
Octane V2 - Octane V2 Total Score
min: 10177     avg: 14762     median: 17046 (15%)     max: 17063 Points
WebXPRT 4 - WebXPRT 4 Score
74.1 Points (21%)
WebXPRT 3 - WebXPRT 3 Score
95.2 Points (20%)
- Range of benchmark values for this graphics card
- Average benchmark values for this graphics card
* Smaller numbers mean a higher performance

v1.28
log 25. 05:36:03

#0 no ids found in url (should be separated by "_") +0s ... 0s

#1 not redirecting to Ajax server +0s ... 0s

#2 did not recreate cache, as it is less than 5 days old! Created at Tue, 25 Jun 2024 05:30:22 +0200 +0.001s ... 0.001s

#3 no comparison url found in template nbc.compare_page_2 needed +0.007s ... 0.008s

#4 no comparison url found in template nbc.compare_page_2 needed +0s ... 0.008s

#5 no comparison url found in template nbc.compare_page_2 needed +0s ... 0.008s

#6 no comparison url found in template nbc.compare_page_2 needed +0s ... 0.009s

#7 no comparison url found in template nbc.compare_page_2 needed +0s ... 0.009s

#8 no comparison url found in template nbc.compare_page_2 needed +0s ... 0.009s

#9 no comparison url found in template nbc.compare_page_2 needed +0s ... 0.009s

#10 no comparison url found in template nbc.compare_page_2 needed +0s ... 0.009s

#11 no comparison url found in template nbc.compare_page_2 needed +0s ... 0.009s

#12 composed specs +0s ... 0.01s

#13 did output specs +0s ... 0.01s

#14 getting avg benchmarks for device 5987 +0.004s ... 0.013s

#15 got single benchmarks 5987 +0.015s ... 0.028s

#16 got avg benchmarks for devices +0s ... 0.028s

#17 min, max, avg, median took s +0.973s ... 1.002s

#18 no comparison url found in template nbc.compare_page_2 needed +0s ... 1.002s

#19 return log +0s ... 1.002s

Please share our article, every link counts!

»移动处理器 对比
所有移动处理器的对比


»移动处理器 基准测试
所有已有笔记本电脑中使用的处理器的基准测试成绩 (桌面处理器或移动处理器)

Other CPUs of the series Kaveri

» AMD FX-7600P
   4x 2.7 GHz - 3.6 GHz
» AMD A10-7400P
   4x 2.5 GHz - 3.4 GHz
» AMD A8-7200P
   4x 2.4 GHz - 3.3 GHz
» AMD FX-7500
   4x 2.1 GHz - 3.3 GHz
» AMD A10 Pro-7350B
   4x 2.1 GHz - 3.3 GHz
» AMD A10-7300
   4x 1.9 GHz - 3.2 GHz
» AMD A8 Pro-7150B
   4x 1.9 GHz - 3.2 GHz
» AMD A8-7100
   4x 1.8 GHz - 3 GHz
» AMD A6 Pro-7050B
   2x 2.2 GHz - 3 GHz
» AMD A6-7000
   2x 2.2 GHz - 3 GHz

Surrounding CPUs

+ AMD A10-9600P
   4x 2.4 GHz - 3.3 GHz
+ AMD PRO A8-9600B
   4x 2.4 GHz - 3.3 GHz
+ Intel Core i3-3110M
   2x 2.4 GHz
+ Intel Core 2 Duo T9900
   2x 3.06 GHz
+ Intel Core 2 Duo T9800
   2x 2.92 GHz
» AMD FX-7600P
   4x 2.7 GHz - 3.6 GHz
- Intel Pentium 4405U
   2x 2.1 GHz
- Intel Core i5-480M
   2x 2.67 GHz - 2.93 GHz
- Intel Core i7-2649M
   2x 2.3 GHz - 3.2 GHz
- Intel Core i5-540M
   2x 2.53 GHz - 3.07 GHz
- Intel Core i5-460M
   2x 2.53 GHz - 2.8 GHz
> Notebookcheck中文版(NBC中国) > FAQ / 小提示/ 技术参数 > 移动处理器 —— 基准测试成绩列表 > AMD Kaveri FX-7600P 笔记本处理器
Klaus Hinum (Update: 2014-07-31)