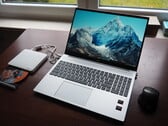
Notebookcheck Logo

AMD Radeon 740M

AMD Radeon 740M

AMD Radeon 740M 是 Ryzen 7040 系列笔记本电脑(Phoenix,如 Ryzen 5 7540U)的集成 GPU。iGPU 基于全新的RDNA3架构,12 个 CU 中只有 4 个(= 256 个着色器),主频高达 2.5 GHz(取决于 CPU 型号)。740M 支持硬件光线追踪,但性能太慢,无法在当前游戏中使用。

由于核心数量和时钟频率减少,性能明显低于 Radeon 760M780M.

由于采用了现代 4 纳米工艺和巧妙的省电功能,功耗相对较低(据 AMD 称)。前两个型号的整个芯片的 TDP 可配置在 15 - 30 瓦之间。

AMD Radeon 700M Series

Radeon 780M 768 @ 1.5 - 3 GHz
Radeon 760M 512 @ 1.5 - 2.8 GHz
Radeon 740M 256 @ 1.5 - 2.5 GHz
CodenamePhoenix
ArchitectureRDNA 3
Pipelines256 - unified
Raytracing Cores4
Core Speed1500 - 2500 (Boost) MHz
Shared Memoryyes
APIDirectX 12_2, OpenGL 4.6, OpenCL 2.1, Vulkan 1.3
Power Consumption30 Watt (30 - 15 Watt TGP)
technology4 nm
Displays4 Displays (max.), HDMI 2.1, DisplayPort 2.1
FeaturesMiracast, FreeSync, Adaptive-Sync, UHBR10, HDR Metadata, SmartShift MAX, SmartAccess Memory, 8k60 AV1, 8k43 H.265, 4k175 H.264 De- and Encode
Date of Announcement23.05.2023
CPU in Radeon 740MGPU Base SpeedGPU Boost / Turbo
AMD Ryzen Z16 x 3200 MHz, 30 W? MHz? MHz
AMD Ryzen 5 PRO 7540U6 x 3200 MHz, 15 W? MHz2500 MHz
AMD Ryzen 5 2206 x 3200 MHz, 28 W? MHz2800 MHz
min. - max.? MHz2500 - 2800 MHz

Benchmarks

Performance Rating - 3DMark 11 + Fire Strike + Time Spy
1.5 pt (5%)
AMD Radeon HD 8180
0.04488 -97%
...
NVIDIA GeForce GTX 960M
1.336 -13%
1.353 -12%
NVIDIA Quadro P620
1.446 -6%
1.453 -6%
1.453 -6%
1.462 -5%
NVIDIA Quadro P1000
1.482 -4%
NVIDIA Quadro K5100M
1.483 -4%
AMD Radeon 660M
1.5 -3%
AMD Radeon 740M
1.544
AMD Radeon HD 8970M
1.559 1%
NVIDIA GeForce GTX 765M SLI
1.57 2%
AMD Radeon RX 460 (Laptop)
1.581 2%
1.593 3%
1.62 5%
NVIDIA GeForce GTX 780M
1.623 5%
AMD Radeon R9 M290X
1.638 6%
1.713 11%
NVIDIA GeForce GTX 1050 Max-Q
1.749 13%
...
14.3 826%
max:
NVIDIA GeForce RTX 5090
33.3 2057%
0%
100%
3DMark - 3DMark Time Spy Score
min: 1802     avg: 1856     median: 1855.5 (5%)     max: 1909 Points
3DMark - 3DMark Time Spy Graphics
min: 1600     avg: 1650     median: 1649.5 (3%)     max: 1699 Points
Intel UHD Graphics 605
113 -93%
...
1322 -20%
AMD Radeon Pro 560
1376 -17%
NVIDIA Quadro P620
1388 -16%
NVIDIA Quadro P1000
1395 -15%
AMD Radeon 660M
1442 -13%
1497 -9%
AMD Radeon Pro 560X
1614 -2%
NVIDIA GeForce GTX 1050 Max-Q
1615 -2%
1616 -2%
AMD Radeon 740M
1650
1656 0%
1672 1%
1724 4%
Intel Iris Xe MAX Graphics
1735 5%
AMD Radeon RX 560X (Laptop)
1788 8%
1796 9%
1810 10%
NVIDIA T500 Laptop GPU
1814 10%
1847 12%
...
19434 1078%
max:
NVIDIA GeForce RTX 5090
46337 2708%
0%
100%
3DMark - 3DMark Cloud Gate Score
min: 21552     avg: 21931     median: 21931 (21%)     max: 22310 Points
3DMark - 3DMark Cloud Gate Graphics
min: 30354     avg: 30557     median: 30557 (8%)     max: 30760 Points
3DMark - 3DMark Fire Strike Standard Score
min: 4525     avg: 4603     median: 4603 (7%)     max: 4681 Points
3DMark - 3DMark Fire Strike Standard Graphics
min: 4843     avg: 4989     median: 4989 (5%)     max: 5135 Points
3DMark - 3DMark Ice Storm Graphics
min: 182534     avg: 208348     median: 208348 (23%)     max: 234161 Points
3DMark 11 - 3DM11 Performance Score
min: 7334     avg: 7613     median: 7613 (9%)     max: 7892 Points
3DMark 11 - 3DM11 Performance GPU
min: 6932     avg: 7211     median: 7211 (6%)     max: 7490 Points
171.8 -98%
...
AMD Radeon Pro 460
6749 -6%
AMD Radeon R9 M290X
6817 -5%
AMD Radeon R9 M390
6819 -5%
NVIDIA Quadro K5100M
6894 -4%
6901 -4%
7042 -2%
7061 -2%
NVIDIA GeForce GTX 1050 Max-Q
7142 -1%
AMD Radeon HD 8970M
7180 0%
AMD Radeon 740M
7211
7372 2%
7536 5%
AMD Radeon Pro 560X
7590 5%
7662 6%
NVIDIA GeForce GTX 780M
7692 7%
AMD Radeon RX 460 (Laptop)
7793 8%
NVIDIA T500 Laptop GPU
7808 8%
NVIDIA GeForce GTX 765M SLI
7944 10%
AMD Radeon RX 560X (Laptop)
7970 11%
...
59943 731%
max:
NVIDIA GeForce RTX 5090
129772 1700%
0%
100%
3DMark Vantage
3DM Vant. Perf. total +
3DMark Vantage - 3DM Vant. Perf. total
24621 Points (7%)
3DM Vant. Perf. GPU no PhysX +
3DMark Vantage - 3DM Vant. Perf. GPU no PhysX
21237 Points (12%)
ATI Radeon HD 3200
62 -100%
...
AMD FirePro M6100
18724 -12%
NVIDIA Quadro M2000M
19354 -9%
19797 -7%
AMD Radeon RX 560X (Laptop)
19829 -7%
20547 -3%
AMD Radeon 660M
20571 -3%
20575 -3%
AMD Radeon HD 8970M
20876 -2%
NVIDIA GeForce GT 755M SLI
21102 -1%
AMD Radeon 740M
21237
21394 1%
21641 2%
NVIDIA Quadro P1000
21687 2%
21740 2%
NVIDIA Quadro P620
21759 2%
22986 8%
23042 8%
23092 9%
23936 13%
...
132443 524%
max:
170928 705%
0%
100%
3DMark 06 3DMark 06 - Standard 1280x1024 +
3DMark 06
min: 29777     avg: 30167     median: 30166.5 (39%)     max: 30556 Points
Cinebench R10 Cinebench R10 Shading (32bit) +
Cinebench R10 - Cinebench R10 Shading (32bit)
14024 points (10%)
Cinebench R15
Cinebench R15 OpenGL 64 Bit +
Cinebench R15 - Cinebench R15 OpenGL 64 Bit
min: 142.2     avg: 151.7     median: 151.7 (9%)     max: 161.2 fps
Cinebench R15 OpenGL Ref. Match 64 Bit +
Cinebench R15 - Cinebench R15 OpenGL Ref. Match 64 Bit
97.9 % (98%)
GFXBench - GFXBench 5.0 Aztec Ruins High Tier Offscreen
37.4 fps (7%)
3.3 -91%
...
AMD Radeon 540X
24.9 -33%
AMD Radeon RX Vega 7
26.8 -28%
27 -28%
NVIDIA Quadro P520
29.56 -21%
33.3 -11%
AMD Radeon RX 550X (Laptop)
33.4 -11%
AMD Radeon 660M
33.5 -10%
34.7 -7%
34.74 -7%
AMD Radeon 740M
37.4
44.4 19%
44.86 20%
45 20%
45.07 21%
NVIDIA GeForce GTX 1050 Max-Q
48.1 29%
48.6 30%
NVIDIA GeForce GTX 1050 Ti Max-Q
49.5 32%
AMD Radeon 680M
51.7 38%
AMD Radeon RX 560X (Laptop)
52.4 40%
...
536 1333%
0%
100%
GFXBench - GFXBench 5.0 Aztec Ruins Normal Tier Offscreen
99.4 fps (7%)
Basemark GPU 1.2 - Basemark GPU 1.2 Vulkan Official Medium Offscreen 1080
104.6 fps (3%)
Geekbench 6.3 - Geekbench 6.3 GPU OpenCL
min: 10125     avg: 11270     median: 11269.5 (3%)     max: 12414 points
Geekbench 6.3 - Geekbench 6.3 GPU Vulkan
min: 12189     avg: 14236     median: 14235.5 (4%)     max: 16282 points
LuxMark v2.0 64Bit - LuxMark v2.0 Room GPU
364 Samples/s (1%)
LuxMark v2.0 64Bit - LuxMark v2.0 Sala GPU
739 Samples/s (1%)
ComputeMark v2.1 - ComputeMark v2.1 Result
4080 points (3%)
Power Consumption - Furmark Stress Test Power Consumption - external Monitor *
41.8 Watt (6%)
0510152025303540Tooltip
Power Consumption - Cyberpunk 2077 Power Consumption 150cd *
min: 42.5     avg: 42.8     median: 42.8 (14%)     max: 43 Watt
05101520253035404550Tooltip
Power Consumption - Cyberpunk 2077 Power Consumption - external Monitor *
39.1 Watt (5%)
0510152025303540Tooltip
Power Consumption - Power Efficiency - Cyberpunk 2077 ultra
0.3 fps per Watt (37%)
- Range of benchmark values for this graphics card
red legend - Average benchmark values for this graphics card
* Smaller numbers mean a higher performance

Game Benchmarks

The following benchmarks stem from our benchmarks of review laptops. The performance depends on the used graphics memory, clock rate, processor, system settings, drivers, and operating systems. So the results don't have to be representative for all laptops with this GPU. For detailed information on the benchmark results, click on the fps number.

low 1920x1080
9.9  fps    + Compare + 📈 Graph
» The benchmarks indicate that the game is not playable in the tested settings.
Stalker 2

Stalker 2

2024
low 1920x1080
10.2  fps    + Compare + 📈 Graph
med. 1920x1080
8.3  fps    + Compare + 📈 Graph
high 1920x1080
6.7  fps    + Compare + 📈 Graph
ultra 1920x1080
5.5  fps    + Compare + 📈 Graph
» The benchmarks indicate that the game is not playable in the tested settings.
low 1920x1080
27  fps    + Compare
med. 1920x1080
23  fps    + Compare
high 1920x1080
14  fps    + Compare
ultra 1920x1080
13  fps    + Compare
» The benchmarks indicate that the game is not playable in the tested settings.
low 1920x1080
23.9  fps    + Compare + 📈 Graph
med. 1920x1080
15.3  fps    + Compare + 📈 Graph
high 1920x1080
9.8  fps    + Compare + 📈 Graph
ultra 1920x1080
6.9  fps    + Compare + 📈 Graph
» The benchmarks indicate that the game is not playable in the tested settings.
low 1920x1080
46  fps    + Compare + 📈 Graph
med. 1920x1080
35.7  fps    + Compare + 📈 Graph
high 1920x1080
25.8  fps    + Compare + 📈 Graph
ultra 1920x1080
24.4  fps    + Compare + 📈 Graph
» With all tested laptops playable in detail settings med..
low 1920x1080
19.9  fps    + Compare + 📈 Graph
med. 1920x1080
14.3  fps    + Compare + 📈 Graph
high 1920x1080
11.9  fps    + Compare + 📈 Graph
ultra 1920x1080
10.5  fps    + Compare + 📈 Graph
» The benchmarks indicate that the game is not playable in the tested settings.
low 1920x1080
10.1  fps    + Compare + 📈 Graph
med. 1920x1080
9.6  fps    + Compare + 📈 Graph
high 1920x1080
8.9  fps    + Compare + 📈 Graph
ultra 1920x1080
7.8  fps    + Compare + 📈 Graph
» The benchmarks indicate that the game is not playable in the tested settings.
low 1920x1080
13.7  fps    + Compare + 📈 Graph
med. 1920x1080
10.4  fps    + Compare + 📈 Graph
high 1920x1080
9.7  fps    + Compare + 📈 Graph
ultra 1920x1080
8.8  fps    + Compare + 📈 Graph
» The benchmarks indicate that the game is not playable in the tested settings.
low 1920x1080 cinem.
7  fps    + Compare + 📈 Graph
med. 1920x1080 cinem.
6.4  fps    + Compare + 📈 Graph
high 1920x1080 cinem.
4.9  fps    + Compare + 📈 Graph
ultra 1920x1080 cinem.
3.9  fps    + Compare + 📈 Graph
» The benchmarks indicate that the game is not playable in the tested settings.
low 1920x1080
24.7  fps    + Compare + 📈 Graph
med. 1920x1080
17.9  fps    + Compare + 📈 Graph
high 1920x1080
13.4  fps    + Compare + 📈 Graph
ultra 1920x1080
12.4  fps    + Compare + 📈 Graph
» The benchmarks indicate that the game is not playable in the tested settings.
low 1920x1080
30.6  fps    + Compare + 📈 Graph
med. 1920x1080
18.4  fps    + Compare + 📈 Graph
high 1920x1080
13.6  fps    + Compare + 📈 Graph
ultra 1920x1080
11.5  fps    + Compare + 📈 Graph
» The benchmarks indicate that the game is not playable in the tested settings.
F1 24

F1 24

2024
low 1920x1080
41  fps    + Compare
med. 1920x1080
35  fps    + Compare
high 1920x1080
24  fps    + Compare
ultra 1920x1080
2  fps    + Compare
» With all tested laptops playable in detail settings low.
low 1920x1080
8.1  fps    + Compare + 📈 Graph
med. 1920x1080
8  fps    + Compare + 📈 Graph
high 1920x1080
5.8  fps    + Compare + 📈 Graph
» The benchmarks indicate that the game is not playable in the tested settings.
low 1920x1080
18.5  fps    + Compare + 📈 Graph
med. 1920x1080
15.7  fps    + Compare + 📈 Graph
high 1920x1080
12.9  fps    + Compare + 📈 Graph
ultra 1920x1080
9.5  fps    + Compare + 📈 Graph
» The benchmarks indicate that the game is not playable in the tested settings.
low 1920x1080
12.3  fps    + Compare + 📈 Graph
high 1920x1080
11.5  fps    + Compare + 📈 Graph
» The benchmarks indicate that the game is not playable in the tested settings.
low 1920x1080
18.1  fps    + Compare + 📈 Graph
med. 1920x1080
15.4  fps    + Compare + 📈 Graph
high 1920x1080
11  fps    + Compare + 📈 Graph
ultra 1920x1080
10.6  fps    + Compare + 📈 Graph
» The benchmarks indicate that the game is not playable in the tested settings.
low 1920x1080
38.8  fps    + Compare + 📈 Graph
med. 1920x1080
32.1  fps    + Compare + 📈 Graph
high 1920x1080
25.1  fps    + Compare + 📈 Graph
ultra 1920x1080
16.7  fps    + Compare + 📈 Graph
» With all tested laptops playable in detail settings low.
low 1920x1080
19.2  fps    + Compare + 📈 Graph
med. 1920x1080
14.7  fps    + Compare + 📈 Graph
high 1920x1080
12.9  fps    + Compare + 📈 Graph
ultra 1920x1080
12.3  fps    + Compare + 📈 Graph
» The benchmarks indicate that the game is not playable in the tested settings.
low 1920x1080
11.4  fps    + Compare + 📈 Graph
med. 1920x1080
10.5  fps    + Compare + 📈 Graph
high 1920x1080
8.3  fps    + Compare + 📈 Graph
ultra 1920x1080
5.8  fps    + Compare + 📈 Graph
» The benchmarks indicate that the game is not playable in the tested settings.
Palworld

Palworld

2024
low 1920x1080
42  fps    + Compare + 📈 Graph
med. 1920x1080
35.2  fps    + Compare + 📈 Graph
high 1920x1080
17.3  fps    + Compare + 📈 Graph
ultra 1920x1080
15.4  fps    + Compare + 📈 Graph
» With all tested laptops playable in detail settings med..
med. 1920x1080
129.5  fps    + Compare + 📈 Graph
high 1920x1080
93.1  fps    + Compare + 📈 Graph
ultra 1920x1080
87.4  fps    + Compare + 📈 Graph
» With all tested laptops playable in detail settings ultra.
low 1920x1080
34.3  fps    + Compare + 📈 Graph
med. 1920x1080
27.3  fps    + Compare + 📈 Graph
high 1920x1080
18.2  fps    + Compare + 📈 Graph
ultra 1920x1080
11.1  fps    + Compare + 📈 Graph
» The benchmarks indicate that the game is not playable in the tested settings.
low 1920x1080
32.9  fps    + Compare + 📈 Graph
med. 1920x1080
29.6  fps    + Compare + 📈 Graph
high 1920x1080
25.8  fps    + Compare + 📈 Graph
ultra 1920x1080
19.5  fps    + Compare + 📈 Graph
» The benchmarks indicate that the game is not playable in the tested settings.
low 1920x1080
9.5  fps    + Compare
med. 1920x1080
8.5  fps    + Compare
high 1920x1080
7.1  fps    + Compare
ultra 1920x1080
6.9  fps    + Compare
» The benchmarks indicate that the game is not playable in the tested settings.
low 1920x1080
11  fps    + Compare + 📈 Graph
med. 1920x1080
9.3  fps    + Compare + 📈 Graph
high 1920x1080
8.5  fps    + Compare + 📈 Graph
» The benchmarks indicate that the game is not playable in the tested settings.
low 1920x1080
13.9  fps    + Compare + 📈 Graph
med. 1920x1080
12.8  fps    + Compare + 📈 Graph
high 1920x1080
10  fps    + Compare + 📈 Graph
ultra 1920x1080
7.7  fps    + Compare + 📈 Graph
» The benchmarks indicate that the game is not playable in the tested settings.
low 1920x1080
58.2  fps    + Compare
med. 1920x1080
41.1  fps    + Compare
high 1920x1080
22  fps    + Compare
ultra 1920x1080
16.7  fps    + Compare
» With all tested laptops playable in detail settings med..
low 1920x1080
28  fps    + Compare
med. 1920x1080
23  fps    + Compare
high 1920x1080
22  fps    + Compare
ultra 1920x1080
16  fps    + Compare
» The benchmarks indicate that the game is not playable in the tested settings.
low 1920x1080
72.7  fps    + Compare + 📈 Graph
med. 1920x1080
59.9  fps    + Compare + 📈 Graph
high 1920x1080
30.1  fps    + Compare + 📈 Graph
ultra 1920x1080
20.9  fps    + Compare + 📈 Graph
» With all tested laptops playable in detail settings med..
low 1920x1080
20.5 21.5 ~ 21 fps    + Compare
med. 1920x1080
16 16.5 ~ 16 fps    + Compare
high 1920x1080
13.3 13.8 ~ 14 fps    + Compare
ultra 1920x1080
10.4 10.6 ~ 11 fps    + Compare
» The benchmarks indicate that the game is not playable in the tested settings.
Additional Benchmarks
30min Start Ultra Preset (FSR off) 1920x1080
9.5
10.1
low 1920x1080
20.2 21.7 ~ 21 fps    + Compare + 📈 Graph
med. 1920x1080
16.4 16.4 ~ 16 fps    + Compare + 📈 Graph
high 1920x1080
12 13.5 ~ 13 fps    + Compare + 📈 Graph
ultra 1920x1080
10.8 12.8 ~ 12 fps    + Compare + 📈 Graph
» The benchmarks indicate that the game is not playable in the tested settings.
Lies of P

Lies of P

2023
low 1920x1080
27.3  fps    + Compare + 📈 Graph
med. 1920x1080
23.7  fps    + Compare + 📈 Graph
high 1920x1080
20.1  fps    + Compare + 📈 Graph
ultra 1920x1080
19  fps    + Compare + 📈 Graph
» The benchmarks indicate that the game is not playable in the tested settings.
low 1920x1080
22  fps    + Compare
med. 1920x1080
20  fps    + Compare
high 1920x1080
16  fps    + Compare
ultra 1920x1080
13  fps    + Compare
» The benchmarks indicate that the game is not playable in the tested settings.
low 1920x1080
33.3  fps    + Compare + 📈 Graph
med. 1920x1080
25.1  fps    + Compare + 📈 Graph
high 1920x1080
22.5  fps    + Compare + 📈 Graph
ultra 1920x1080
17.8  fps    + Compare + 📈 Graph
» The benchmarks indicate that the game is not playable in the tested settings.
low 1920x1080
22.9  fps    + Compare + 📈 Graph
med. 1920x1080
21.4  fps    + Compare + 📈 Graph
high 1920x1080
19.2  fps    + Compare + 📈 Graph
ultra 1920x1080
14.8  fps    + Compare + 📈 Graph
» The benchmarks indicate that the game is not playable in the tested settings.
low 1920x1080
18.5  fps    + Compare + 📈 Graph
» The benchmarks indicate that the game is not playable in the tested settings.
low 1920x1080
17.9  fps    + Compare + 📈 Graph
med. 1920x1080
13.5  fps    + Compare + 📈 Graph
high 1920x1080
11.4  fps    + Compare + 📈 Graph
» The benchmarks indicate that the game is not playable in the tested settings.
low 1920x1080
37.1  fps    + Compare
med. 1920x1080
29.4  fps    + Compare
high 1920x1080
22.8  fps    + Compare
ultra 1920x1080
22.6  fps    + Compare
» With all tested laptops playable in detail settings low.
low 1920x1080
31  fps    + Compare + 📈 Graph
med. 1920x1080
22.8  fps    + Compare + 📈 Graph
high 1920x1080
13.1  fps    + Compare + 📈 Graph
ultra 1920x1080
12.9  fps    + Compare + 📈 Graph
» The benchmarks indicate that the game is not playable in the tested settings.
Returnal

Returnal

2023
low 1920x1080
18  fps    + Compare
med. 1920x1080
17  fps    + Compare
high 1920x1080
14  fps    + Compare
ultra 1920x1080
11  fps    + Compare
» The benchmarks indicate that the game is not playable in the tested settings.
low 1920x1080
22.2  fps    + Compare + 📈 Graph
med. 1920x1080
16.5  fps    + Compare + 📈 Graph
high 1920x1080
12.8  fps    + Compare + 📈 Graph
ultra 1920x1080
9.9  fps    + Compare + 📈 Graph
» The benchmarks indicate that the game is not playable in the tested settings.
Strange Brigade

Strange Brigade

2018
low 1280x720
109.7 126.8 ~ 118 fps    + Compare
med. 1920x1080
42.6 46.6 ~ 45 fps    + Compare
high 1920x1080
34.5 36.9 ~ 36 fps    + Compare
ultra 1920x1080
28.1 30.3 ~ 29 fps    + Compare
» With most tested laptops playable in detail settings high.
low 1280x720
32.6 36.3 ~ 34 fps    + Compare
med. 1920x1080
25.1 25.7 ~ 25 fps    + Compare
high 1920x1080
20.3 20.7 ~ 21 fps    + Compare
» The benchmarks indicate that the game is not playable in the tested settings.
low 1280x720
50.7 51.4 ~ 51 fps    + Compare
med. 1920x1080
23.1 23.5 ~ 23 fps    + Compare
high 1920x1080
17.4 17.6 ~ 18 fps    + Compare
» With all tested laptops playable in detail settings low.
low 1280x720
116.7 120.9 ~ 119 fps    + Compare
med. 1366x768
100.1 103.1 ~ 102 fps    + Compare
high 1920x1080
63 68.2 ~ 66 fps    + Compare
ultra 1920x1080
53.7 58.9 ~ 56 fps    + Compare
» With all tested laptops playable in detail settings ultra.
GTA V

GTA V

2015
low 1024x768
133.1 135.8 ~ 134 fps    + Compare
med. 1366x768
118 124.4 ~ 121 fps    + Compare
high 1920x1080
41.4 44.8 ~ 43 fps    + Compare
ultra 1920x1080
13.1 18.5 ~ 16 fps    + Compare
» With all tested laptops playable in detail settings high.
Additional Benchmarks
Normal/Off 4xAF 1920x1080
92.6
lowmed.highultraQHD4K
Indiana Jones and the Great Circle9.89
Stalker 210.28.276.675.5
Call of Duty Black Ops 627231413
Until Dawn23.915.39.826.94
EA Sports FC 254635.725.824.4
God of War Ragnarök19.914.311.910.5
Final Fantasy XVI10.19.638.897.82
Space Marine 213.710.49.718.78
Star Wars Outlaws7.046.354.863.92
Once Human24.717.913.412.4
The First Descendant30.618.413.611.5
F1 244135242
Senua's Saga Hellblade 28.067.965.77
Ghost of Tsushima18.515.712.99.53
Dragon's Dogma 212.311.5
Horizon Forbidden West18.115.41110.6
Last Epoch38.832.125.116.7
Helldivers 219.214.712.912.3
Enshrouded11.410.58.345.79
Palworld4235.217.315.4
Prince of Persia The Lost Crown129.593.187.4
Ready or Not34.327.318.211.1
The Finals32.929.625.819.5
Avatar Frontiers of Pandora9.58.57.16.9
Alan Wake 2119.318.49
Lords of the Fallen13.912.8107.65
Total War Pharaoh58.241.12216.7
Assassin's Creed Mirage28232216
Counter-Strike 272.759.930.120.9
Cyberpunk 2077 2.2 Phantom Liberty21161411
Baldur's Gate 321161312
Lies of P27.323.720.119
The Crew Motorfest22201613
Armored Core 633.325.122.517.8
Atlas Fallen22.921.419.214.8
Ratchet & Clank Rift Apart18.5
Resident Evil 4 Remake17.913.511.4
Company of Heroes 337.129.422.822.6
Atomic Heart3122.813.112.9
Returnal18171411
Hogwarts Legacy22.216.512.89.94
Strange Brigade118453629
X-Plane 11.11342521
Final Fantasy XV Benchmark512318
Dota 2 Reborn1191026656
GTA V1341214316
< 30 fps
< 60 fps
< 120 fps
≥ 120 fps
28
13
3
1
33
7
1
2
39
3
2
36
1
1


For more games that might be playable and a list of all games and graphics cards visit our Gaming List

v1.28
log 23. 04:52:52

#0 ran 0s before starting gpusingle class +0s ... 0s

#1 no ids found in url (should be separated by "_") +0s ... 0s

#2 not redirecting to Ajax server +0s ... 0s

#3 did not recreate cache, as it is less than 5 days old! Created at Sat, 22 Feb 2025 20:41:55 +0100 +0.001s ... 0.001s

#4 no comparison url found in template nbc.compare_page_1 needed +0.031s ... 0.032s

#5 no comparison url found in template nbc.compare_page_1 needed +0s ... 0.032s

#6 composed specs +0s ... 0.032s

#7 did output specs +0s ... 0.032s

#8 start showIntegratedCPUs +0s ... 0.032s

#9 getting avg benchmarks for device 11588 +0.031s ... 0.063s

#10 got single benchmarks 11588 +0.014s ... 0.078s

#11 got avg benchmarks for devices +0s ... 0.078s

#12 min, max, avg, median took s +0.625s ... 0.702s

#13 before gaming benchmark output +0s ... 0.703s

#14 Got 196 rows for game benchmarks. +0.021s ... 0.724s

#15 composed SQL query for gamebenchmarks +0s ... 0.724s

#16 got data and put it in $dataArray +0.027s ... 0.751s

#17 benchmarks composed for output. +1.46s ... 2.211s

#18 no comparison url found in template nbc.compare_page_1 needed +0.004s ... 2.215s

#19 return log +0s ... 2.215s

Please share our article, every link counts!
Mail Logo

» Comparison of GPUs
Detailed list of all laptop GPUs sorted by class and performance.

» Benchmark List
Sort and restrict laptop GPUs based on performance in synthetic benchmarks.

» Notebook Gaming List
Playable games for each graphics card and their average FPS results.

Class 1

Class 2

GeForce RTX 5060 Laptop *
M1 Max 32-Core GPU *
GeForce RTX 2070 Super Mobile
M1 Max 24-Core GPU *
Quadro RTX 5000 Max-Q
Radeon RX 8050S *
Radeon RX 5700M *
GeForce GTX 1080 Mobile
Quadro RTX 4000 (Laptop)
M1 Pro 16-Core GPU *
Radeon PRO W6600M *
GeForce RTX 2070 Super Max-Q
Quadro RTX 4000 Max-Q *
M1 Pro 14-Core GPU *
Quadro P5200
GeForce RTX 5050 Laptop *
Quadro RTX 3000 Max-Q *
Quadro P4200
Radeon RX 8040S *
Arc 140T *
Quadro P5000 Max-Q *
Arc 130T *
GeForce GTX 980 (Laptop)
Quadro P4000
Quadro P4000 Max-Q
Quadro P3200
Radeon RX 580X (Laptop) *
Radeon RX 580 (Laptop)
Radeon Pro 5300M
Radeon RX 5300M
Quadro P3000 Max-Q *
Quadro T2000 Max-Q *
Radeon Pro WX 7100 *
Radeon RX 570X (Laptop) *

Class 3

Radeon RX 570 (Laptop) *
Radeon RX 470 (Laptop) *
Quadro T1000 Max-Q *
Vega M GH
Quadro M5000M
GeForce GTX 1050 Ti Mobile
Radeon 680M
Quadro P2000
Quadro P2000 Max-Q
Quadro M4000M
T500 Laptop GPU *
Radeon R9 M395X
GeForce GTX 1050 Ti Max-Q *
Radeon Pro Vega 16
WX Vega M GL
Radeon R9 M485X
Quadro M3000M
FirePro W7170M
Radeon R9 M395
GeForce GTX 1050 Max-Q *
Radeon 660M
Radeon Pro WX 4150 *
Radeon RX 560X (Laptop)
Radeon RX 560 (Laptop)
Radeon RX 460 (Laptop)
Quadro P1000
Radeon R9 M390
Xe MAX
Radeon Pro 560X
Radeon Pro 560
Radeon Pro 460
Radeon Pro WX 4130 *
GeForce GTX 960M
Quadro P620 *
Radeon RX 550X (Laptop)
Radeon Pro WX 3200 *
Radeon Pro 555X
Radeon Pro 555
Radeon Pro 455
Quadro P600
Arc Graphics 3-core (Arrow Lake) *
Quadro M2000M
Radeon RX 540X *
Radeon Pro WX 2100 *
Radeon Pro WX 3100 *
Arc Graphics 2-core (Arrow Lake) *
GeForce GTX 950M
Radeon Pro 450
Radeon 630
Radeon 540X *
Radeon R9 M385X
Quadro P520
Quadro M1000M
GeForce 945M
Quadro P500 *
Iris Plus Graphics G7 (Ice Lake 64 EU) *
Vega 10 *
Iris Pro Graphics 580
FirePro W5170M *
Radeon R9 M370X
Vega 9
FirePro W5130M
UHD Graphics Xe G4 48EUs *
UHD Graphics 32EUs
UHD Graphics Xe 32EUs (Tiger Lake-H) *
UHD Graphics 750
UHD Graphics 730
Vega 7
Radeon R7 M465
Iris Pro Graphics 6200
Vega 8
GeForce 940M
Iris Plus Graphics G4 (Ice Lake 48 EU)
Quadro M600M
FirePro W4190M
Radeon R9 M375
Radeon R7 M445
Iris Plus Graphics 650
Iris Graphics 550
Radeon 625
Vega 6 *
Iris Plus Graphics 640
Iris Graphics 540
UHD Graphics 24EUs (Alder Lake-N) *
Radeon R7 M360
GeForce 920M
Radeon 620
Radeon R7 M340
Radeon 610
Radeon 610M *
Vega 6 *
UHD Graphics G1 (Ice Lake 32 EU)
UHD Graphics Xe 16EUs (Tiger Lake-H) *
HD Graphics 530
Radeon R5 (Bristol Ridge)
Adreno 690 *
Adreno 685 *
Adreno 680 *
Radeon R5 M330
GeForce 910M
HD Graphics 520

Class 4

Radeon R5 M320 *
Radeon R5 M315 *
Radeon R5 M420 *
Vega 2 *
UHD Graphics 617
UHD Graphics 615
HD Graphics 515
UHD Graphics 610
HD Graphics 510
UHD Graphics 605
Radeon R4 (Stoney Ridge)
Radeon R2 (Stoney Ridge)
VideoCore VII *
UHD Graphics 600
HD Graphics (Braswell)

* Approximate position of the graphics adapter