Notebookcheck Logo

AMD Radeon HD 7660G

AMD Radeon HD 7660G

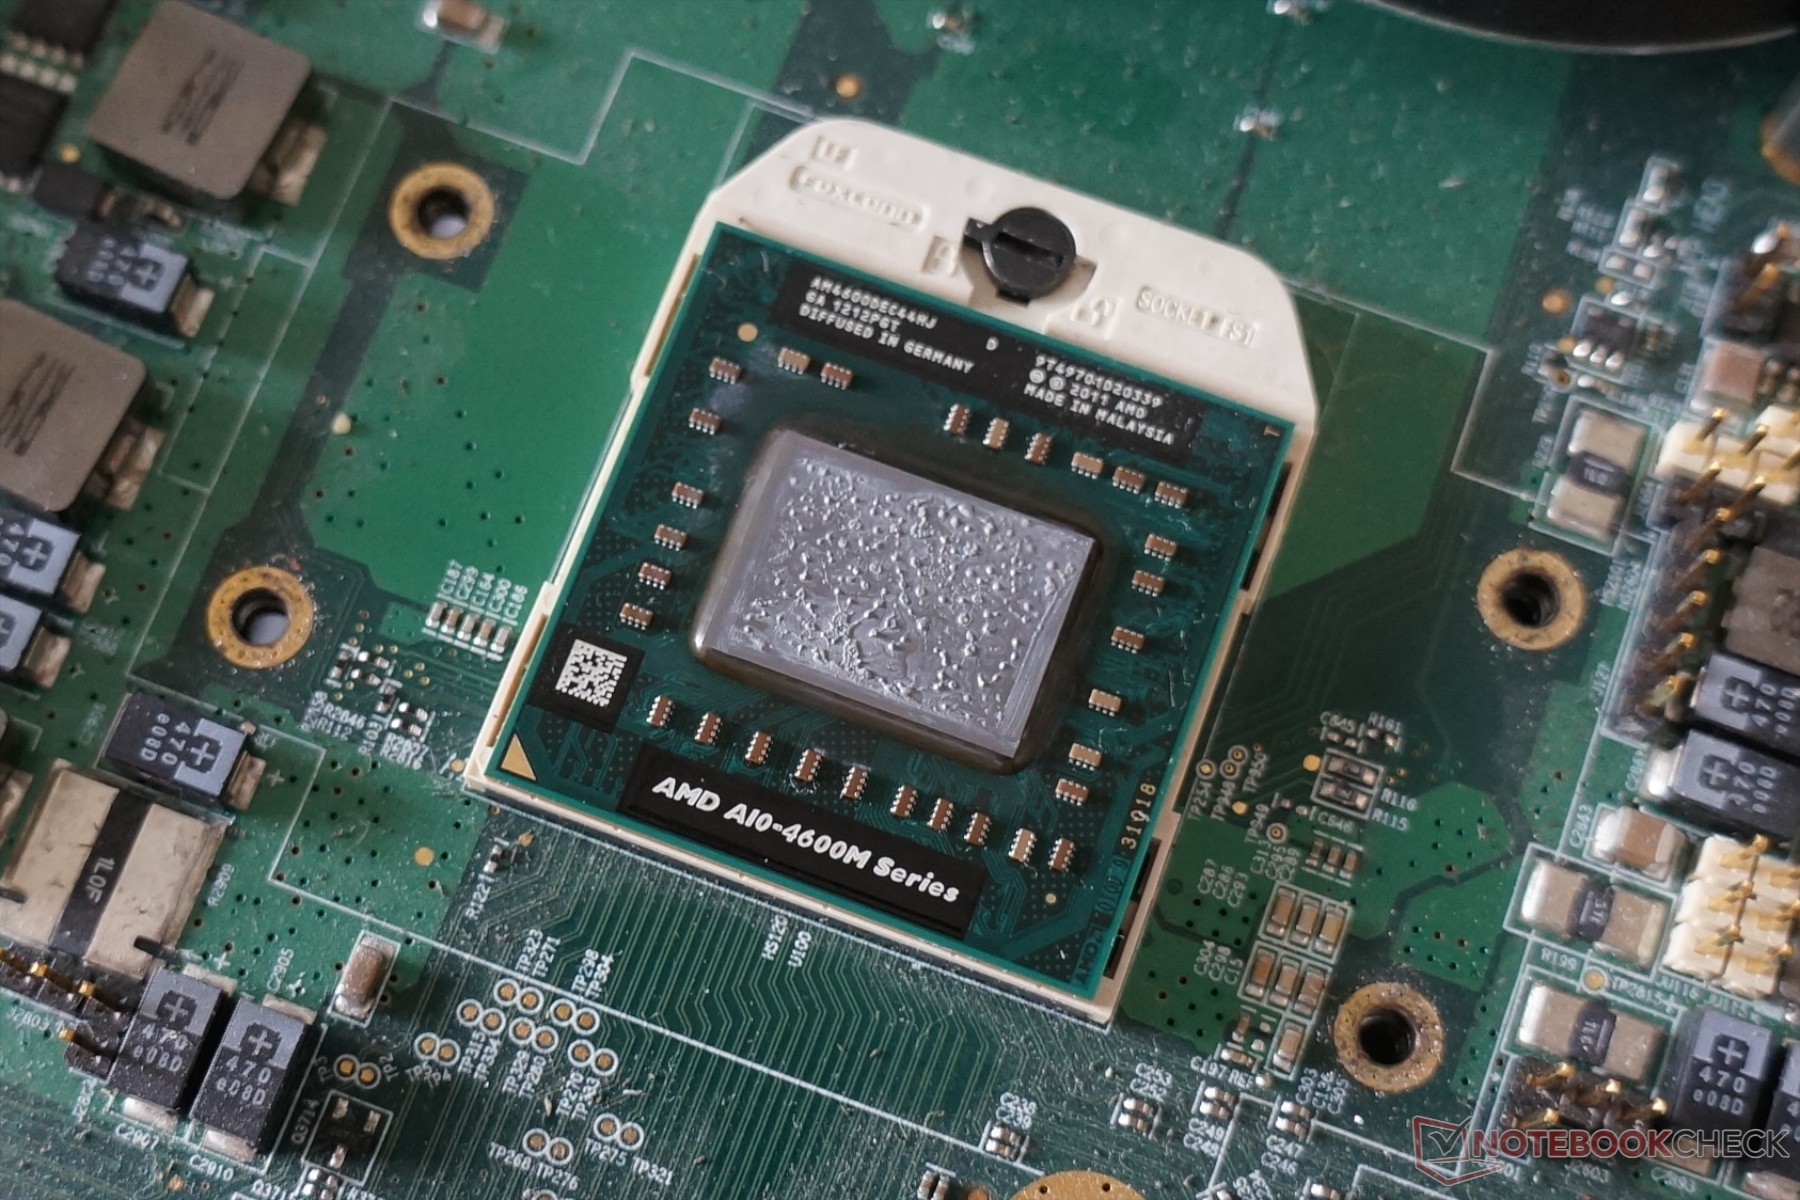
AMD的Radeon HD7660G或HD7660G是在三位一体的APU AMD处理器的图形卡。它是最快的版本和特点是只在A10系列。它是基于VLIW4架构的Radeon HD 6900系列计算机,并没有提供一个专门的图形存储器。三位一体得名由于这样的事实,它由三个不同的体系结构零件。 CPU内核的基础上的打桩机架构的(推土机继任者),北方群岛6900台式机系列架构的GPU核心()和视频处理引擎和多显示器连接新南群岛(HD 7900系列GPU架构的GPU核心) 集成UVD3视频解码器(的Avivo HD)允许多视图编解码器(MVC)的全解码,MPEG-4第2部分(DIVX,XVID),MPEG-4 AVC/H.264高清视频和Adobe Flash。的Radeon HD7660G的性能不同,所使用的基准。在合成像3DMark 11的基准,它到达专用的Radeon HD7670M的水平。然而,在游戏中(时间和播放设置),性能更加类似的AMD Radeon HD 6630M独立。因此,性能显着优于英特尔HD Graphics4000的Ivy Bridge四核心型号。着色器的芯片也可以用于一般的计算。更多信息和基准,OpenCL和DirectCompute11的测试中可以找到我们的三位一体测试的A10-4600M。 APU还在生产32nm和最A10系列零件应归入一个35瓦的TDP,HD7660G13-14英寸向上的笔记本电脑最适合。

Radeon HD 7000G Series

Radeon HD 7660G 384 @ 0.5 - 0.69 GHz
Radeon HD 7620G 384 @ 0.36 - 0.5 GHz
Radeon HD 7640G 256 @ 0.5 - 0.69 GHz
Radeon HD 7600G 384 @ 0.32 - 0.42 GHz
Radeon HD 7500G 256 @ 0.33 - 0.42 GHz
Radeon HD 7520G 192 @ 0.5 - 0.69 GHz
Radeon HD 7420G 128 @ 0.48 - 0.66 GHz
Radeon HD 7400G 192 @ 0.33 - 0.42 GHz
CodenameTrinity
ArchitectureTerascale 3
Pipelines384 - unified
Core Speed497 - 686 (Boost) MHz
Shared Memoryyes
APIDirectX 11, Shader 5.0, OpenGL 4.2
Transistor Count1.3 Million
technology32 nm
Notebook Sizemedium sized
Date of Announcement15.05.2012
Information24 TMUs, 68 ROPs, 6 Compute Units (OpenCL 1.2)
CPU in Radeon HD 7660GGPU Base SpeedGPU Boost / Turbo
AMD A10-4600M4 x 2300 MHz, 35 W497 MHz686 MHz
AMD A10-4657M4 x 2300 MHz, 35 W497 MHz686 MHz
min. - max.497 MHz686 MHz

Benchmarks

3DMark - 3DMark Ice Storm Unlimited Graphics
65558 Points (7%)
3DMark - 3DMark Ice Storm Extreme Graphics
45460 Points (6%)
3DMark - 3DMark Cloud Gate Score
min: 4106     avg: 4190     median: 4190 (4%)     max: 4274 Points
3DMark - 3DMark Cloud Gate Graphics
min: 6200     avg: 6409     median: 6408.5 (2%)     max: 6617 Points
3DMark - 3DMark Ice Storm Graphics
min: 61503     avg: 63146     median: 63145.5 (8%)     max: 64788 Points
3DMark 11 - 3DM11 Performance Score
min: 1135     avg: 1144     median: 1147 (2%)     max: 1150 Points
3DMark 11 - 3DM11 Performance GPU
min: 1056     avg: 1057     median: 1057 (1%)     max: 1058 Points
171.8 -84%
...
982 -7%
990 -6%
990 -6%
Intel HD Graphics 5000
993 -6%
993 -6%
1013 -4%
Intel HD Graphics 515
1013 -4%
1015 -4%
1039 -2%
AMD Radeon HD 7660G
1057
1061 0%
AMD Radeon HD 6570M
1067 1%
1079 2%
1102 4%
1106 5%
1107 5%
Intel Iris Graphics 5100
1112 5%
1119 6%
1141 8%
...
59943 5571%
max:
106023 9931%
0%
100%
3DMark Vantage
3DM Vant. Perf. total +
3DMark Vantage - 3DM Vant. Perf. total
min: 4476     avg: 4523     median: 4523 (1%)     max: 4570 Points
3DM Vant. Perf. GPU no PhysX +
3DMark Vantage - 3DM Vant. Perf. GPU no PhysX
min: 4090     avg: 4133     median: 4133 (2%)     max: 4176 Points
ATI Radeon HD 3200
62 -98%
...
3866 -6%
NVIDIA GeForce GT 720M
3868 -6%
3881 -6%
3968 -4%
3969 -4%
3995 -3%
4005 -3%
AMD Radeon R5 M335
4032 -2%
NVIDIA GeForce 9800M GTX
4123 0%
AMD Radeon HD 7660G
4133
NVIDIA GeForce 910M
4151 0%
AMD Radeon HD 8650G
4169 1%
4212 2%
Intel HD Graphics 515
4218 2%
4229 2%
4236 2%
4243 3%
4277 3%
NVIDIA GeForce GTX 260M
4316 4%
...
132443 3105%
max:
170928 4036%
0%
100%
3DMark 2001SE - 3DMark 2001 - Standard
22817 Points (24%)
3DMark 03 - 3DMark 03 - Standard
min: 20650     avg: 21128     median: 21128 (11%)     max: 21606 Points
3DMark 05 - 3DMark 05 - Standard
min: 9865     avg: 10550     median: 10550 (12%)     max: 11235 Points
Intel Graphics Media Accelerator (GMA) 500
133.4 -99%
...
AMD Radeon HD 7640G + HD 7610M Dual Graphics
9759 -7%
Intel HD Graphics 5000
9763 -7%
NVIDIA Quadro FX 1600M
9963 -6%
NVIDIA GeForce Go 7800 GTX SLI
9969 -6%
NVIDIA GeForce Go 7900 GS SLI
9996 -5%
NVIDIA GeForce Go 7950 GTX SLI
10256 -3%
10403 -1%
NVIDIA GeForce GT 130M
10417 -1%
10461 -1%
AMD Radeon HD 7660G
10550
10556 0%
NVIDIA GeForce Go 7900 GTX SLI
10585 0%
NVIDIA GeForce GT 230M
10689 1%
AMD Radeon R5 M335
10717 2%
10786 2%
10949 4%
11125 5%
11140 6%
NVIDIA Quadro FX 770M
11161 6%
...
61850 486%
max:
87172 726%
0%
100%
3DMark 06 3DMark 06 - Standard 1280x1024 +
3DMark 06
min: 7316     avg: 7317     median: 7317 (10%)     max: 7318 Points
Unigine Valley 1.0 - Unigine Valley 1.0 DX
4.5 fps (1%)
Unigine Heaven 2.1 - Heaven 2.1 high
min: 9.6     avg: 12.3     median: 12.3 (2%)     max: 15 fps
0.6 -95%
...
11.13 -10%
11.3 -8%
11.4 -7%
11.4 -7%
11.53 -6%
11.9 -3%
11.9 -3%
12.06 -2%
12.07 -2%
AMD Radeon HD 7660G
12.3
12.6 2%
12.7 3%
Intel HD Graphics 5000
12.97 5%
13.48 10%
Intel HD Graphics 510
13.5 10%
13.65 11%
AMD Radeon R5 M330
13.7 11%
NVIDIA Quadro K610M
13.8 12%
14 14%
...
532 4225%
0%
100%
SPECviewperf 11
specvp11 snx-01 +
SPECviewperf 11 - specvp11 snx-01
6.3 fps (4%)
specvp11 tcvis-02 +
SPECviewperf 11 - specvp11 tcvis-02
3 fps (2%)
specvp11 sw-02 +
SPECviewperf 11 - specvp11 sw-02
12.1 fps (9%)
specvp11 proe-05 +
specvp11 maya-03 +
SPECviewperf 11 - specvp11 maya-03
6.9 fps (5%)
specvp11 lightwave-01 +
SPECviewperf 11 - specvp11 lightwave-01
15 fps (16%)
specvp11 ensight-04 +
SPECviewperf 11 - specvp11 ensight-04
15.2 fps (7%)
specvp11 catia-03 +
Windows 7 Experience Index - Win7 Gaming graphics
6.7 Points (85%)
Windows 7 Experience Index - Win7 Graphics
6.7 Points (85%)
Cinebench R10 Cinebench R10 Shading (32bit) +
Cinebench R10 - Cinebench R10 Shading (32bit)
min: 5510     avg: 5577     median: 5576.5 (4%)     max: 5643 points
Cinebench R11.5 Cinebench R11.5 OpenGL 64 Bit +
Cinebench R11.5 - Cinebench R11.5 OpenGL 64 Bit
min: 29.5     avg: 30.2     median: 29.9 (10%)     max: 31.2 fps
Cinebench R15
Cinebench R15 OpenGL 64 Bit +
Cinebench R15 - Cinebench R15 OpenGL 64 Bit
min: 23.8     avg: 29.2     median: 30.3 (2%)     max: 32.54 fps
Cinebench R15 OpenGL Ref. Match 64 Bit +
Cinebench R15 - Cinebench R15 OpenGL Ref. Match 64 Bit
98 % (98%)
GFXBench (DX / GLBenchmark) 2.7
GFXBench T-Rex HD Offscreen C24Z16 +
GFXBench (DX / GLBenchmark) 2.7 - GFXBench T-Rex HD Offscreen C24Z16
93 fps (1%)
LuxMark v2.0 64Bit - LuxMark v2.0 Room GPU
77 Samples/s (0%)
LuxMark v2.0 64Bit - LuxMark v2.0 Sala GPU
179 Samples/s (0%)
ComputeMark v2.1 - ComputeMark v2.1 Result
771 points (1%)
- Range of benchmark values for this graphics card
- Average benchmark values for this graphics card
* Smaller numbers mean a higher performance

Game Benchmarks

The following benchmarks stem from our benchmarks of review laptops. The performance depends on the used graphics memory, clock rate, processor, system settings, drivers, and operating systems. So the results don't have to be representative for all laptops with this GPU. For detailed information on the benchmark results, click on the fps number.

low 1280x720
15.8  fps    + Compare
med. 1920x1080
10.2  fps    + Compare
high 1920x1080
9.3  fps    + Compare
» The benchmarks indicate that the game is not playable in the tested settings.
low 1280x720
47.4  fps    + Compare
med. 1366x768
49.3  fps    + Compare
high 1920x1080
40  fps    + Compare
ultra 1920x1080
32  fps    + Compare
» With all tested laptops playable in detail settings high.
Dirt 4

Dirt 4

2017
low 1280x720
29.6  fps    + Compare
» The benchmarks indicate that the game is not playable in the tested settings.
low 1280x720
37.4  fps    + Compare
med. 1920x1080
22.2  fps    + Compare
» With all tested laptops playable in detail settings low.
low 1024x768
46.5  fps    + Compare
med. 1366x768
32.2  fps    + Compare
high 1920x1080
11.9  fps    + Compare
» With all tested laptops playable in detail settings low.
Mad Max

Mad Max

2015
med. 1366x768
16.8  fps    + Compare
» The benchmarks indicate that the game is not playable in the tested settings.
low 1280x720
48.3  fps    + Compare
med. 1366x768
29.8  fps    + Compare
high 1920x1080
15.5  fps    + Compare
ultra 1920x1080
14.5  fps    + Compare
» With all tested laptops playable in detail settings low.
low 1024x768
15.1  fps    + Compare
» The benchmarks indicate that the game is not playable in the tested settings.
low 1024x768
89  fps    + Compare
med. 1366x768
27.3  fps    + Compare
» With all tested laptops playable in detail settings low.
low 1024x768
20  fps    + Compare
» The benchmarks indicate that the game is not playable in the tested settings.
low 1024x768
36  fps    + Compare
med. 1366x768
24.7  fps    + Compare
high 1920x1080
13.5  fps    + Compare
ultra 1920x1080
11  fps    + Compare
» With all tested laptops playable in detail settings low.
Fifa 15

Fifa 15

2014
high 1366x768
32 (!)  fps    + Compare
ultra 1920x1080
18.7  fps    + Compare
» The benchmarks indicate that the game is not playable in the tested settings.
low 1024x768
40.2  fps    + Compare
med. 1366x768
24.3  fps    + Compare
» With all tested laptops playable in detail settings low.
low 1024x768
82  fps    + Compare
med. 1366x768
39  fps    + Compare
high 1920x1080
20  fps    + Compare
ultra 1920x1080
12.5  fps    + Compare
» With all tested laptops playable in detail settings med..
low 1024x768
18.7  fps    + Compare + 📈 Graph
» The benchmarks indicate that the game is not playable in the tested settings.
low 1280x720
32.1  fps    + Compare + 📈 Graph
med. 1280x720
30.6  fps    + Compare
high 1920x1080
13.9  fps    + Compare
» The benchmarks indicate that the game is not playable in the tested settings.
low 1024x768
40  fps    + Compare
med. 1366x768
28.9  fps    + Compare
high 1366x768
19.1  fps    + Compare
ultra 1920x1080
10.3  fps    + Compare
» With all tested laptops playable in detail settings low.
Titanfall

Titanfall

2014
low 1024x768
51.8  fps    + Compare
med. 1366x768
26.7  fps    + Compare
» With all tested laptops playable in detail settings low.
Thief

Thief

2014
low 1024x768
15.6  fps    + Compare
med. 1366x768
12.9  fps    + Compare
high 1366x768
10.2  fps    + Compare
ultra 1920x1080
5  fps    + Compare
» The benchmarks indicate that the game is not playable in the tested settings.
low 1024x768
25  fps    + Compare
med. 1366x768
20.5  fps    + Compare
high 1366x768
10.7  fps    + Compare
ultra 1920x1080
4.4  fps    + Compare
» The benchmarks indicate that the game is not playable in the tested settings.
low 1024x768
42.8  fps    + Compare
med. 1366x768
19.2  fps    + Compare
high 1366x768
8.7  fps    + Compare
ultra 1920x1080
5.8  fps    + Compare
» With all tested laptops playable in detail settings low.
low 1024x768
21 22 ~ 22 fps    + Compare
med. 1366x768
18.6  fps    + Compare
» The benchmarks indicate that the game is not playable in the tested settings.
low 1024x768
37  fps    + Compare
med. 1366x768
24.6  fps    + Compare
high 1366x768
12.8  fps    + Compare
ultra 1920x1080
3.4  fps    + Compare
» With all tested laptops playable in detail settings low.
low 1024x768
27.9 36.4 ~ 32 fps    + Compare
med. 1366x768
20.9 25.9 ~ 23 fps    + Compare
high 1366x768
13.4 (!) 16.4 ~ 15 fps    + Compare
ultra 1920x1080
5.2 (!) 5.5 ~ 5 fps    + Compare
» The benchmarks indicate that the game is not playable in the tested settings.
low 1024x768
56  fps    + Compare
med. 1366x768
33  fps    + Compare
high 1366x768
18  fps    + Compare
ultra 1920x1080
7  fps    + Compare
» With all tested laptops playable in detail settings low.
F1 2013

F1 2013

2013
low 1024x768
43 54 ~ 49 fps    + Compare
med. 1366x768
32 37 ~ 35 fps    + Compare
high 1366x768
28 35 ~ 32 fps    + Compare
ultra 1920x1080
16  fps    + Compare
» With all tested laptops playable in detail settings low.
Fifa 14

Fifa 14

2013
low 1024x768
122  fps    + Compare
med. 1366x768
109  fps    + Compare
high 1366x768
100  fps    + Compare
ultra 1920x1080
65  fps    + Compare
» With all tested laptops playable in detail settings ultra.
low 1024x768
40  fps    + Compare
med. 1366x768
31  fps    + Compare
high 1366x768
22.5  fps    + Compare
ultra 1920x1080
11.3  fps    + Compare
» With all tested laptops playable in detail settings low.
low 1280x720
25.6  fps    + Compare
med. 1366x768
23.8  fps    + Compare
high 1366x768
12.5  fps    + Compare
ultra 1920x1080
7.2  fps    + Compare
» The benchmarks indicate that the game is not playable in the tested settings.
low 1024x768
39.4  fps    + Compare
med. 1366x768
18.4  fps    + Compare
high 1366x768
7.8  fps    + Compare
ultra 1920x1080
5  fps    + Compare
» With all tested laptops playable in detail settings low.
low 1024x768
30  fps    + Compare
med. 1366x768
26.4  fps    + Compare
high 1366x768
9.3  fps    + Compare
ultra 1920x1080
4.1  fps    + Compare
» The benchmarks indicate that the game is not playable in the tested settings.
Dota 2

Dota 2

2013
low 1024x768
49.4  fps    + Compare
med. 1366x768
31.7  fps    + Compare
ultra 1920x1080
17.6  fps    + Compare
» With all tested laptops playable in detail settings low.
low 1024x768
16.4 17.2 ~ 17 fps    + Compare
med. 1366x768
12.2 14.7 ~ 13 fps    + Compare
high 1366x768
5.4 7.7 ~ 7 fps    + Compare
ultra 1920x1080
3 3.7 ~ 3 fps    + Compare
» The benchmarks indicate that the game is not playable in the tested settings.
GRID 2

GRID 2

2013
low 1024x768
74  fps    + Compare
med. 1366x768
47  fps    + Compare
high 1366x768
34  fps    + Compare
ultra 1920x1080
12.5  fps    + Compare
» With all tested laptops playable in detail settings med..
low 1024x768
24.9  fps    + Compare
med. 1366x768
20.2  fps    + Compare
high 1366x768
9.6  fps    + Compare
ultra 1920x1080
5.1  fps    + Compare
» The benchmarks indicate that the game is not playable in the tested settings.
low 1280x720
56  fps    + Compare
med. 1366x768
28.1  fps    + Compare
high 1366x768
23.7  fps    + Compare
ultra 1920x1080
6.8  fps    + Compare
» With all tested laptops playable in detail settings low.
low 1024x768
127  fps    + Compare
med. 1366x768
50  fps    + Compare
high 1366x768
31.5  fps    + Compare
ultra 1920x1080
11.1  fps    + Compare
» With all tested laptops playable in detail settings med..
SimCity

SimCity

2013
low 1024x768
35.8  fps    + Compare
med. 1366x768
22.8  fps    + Compare
high 1366x768
16.3  fps    + Compare
ultra 1920x1080
6.4  fps    + Compare
» With all tested laptops playable in detail settings low.
low 1024x768
54.8  fps    + Compare
med. 1366x768
28.8  fps    + Compare
high 1366x768
18.7  fps    + Compare
ultra 1920x1080
8.5  fps    + Compare
» With all tested laptops playable in detail settings low.
Crysis 3

Crysis 3

2013
low 1024x768
28 28.2 ~ 28 fps    + Compare
med. 1366x768
15 17.1 ~ 16 fps    + Compare
» The benchmarks indicate that the game is not playable in the tested settings.
low 1024x768
90.7  fps    + Compare
med. 1366x768
41.6  fps    + Compare
high 1366x768
32.9  fps    + Compare
ultra 1920x1080
19.9  fps    + Compare
» With all tested laptops playable in detail settings med..
Far Cry 3

Far Cry 3

2012
low 1024x768
33.9  fps    + Compare
med. 1366x768
20  fps    + Compare
high 1366x768
11.8  fps    + Compare
ultra 1920x1080
3.5  fps    + Compare
» The benchmarks indicate that the game is not playable in the tested settings.
med. 1366x768
16  fps    + Compare
high 1366x768
14.3  fps    + Compare
ultra 1920x1080
9.8  fps    + Compare
» The benchmarks indicate that the game is not playable in the tested settings.
low 1024x768
22.7  fps    + Compare
med. 1366x768
20.2  fps    + Compare
high 1366x768
10.6  fps    + Compare
ultra 1920x1080
3.7  fps    + Compare
» The benchmarks indicate that the game is not playable in the tested settings.
low 1024x768
61  fps    + Compare
med. 1366x768
42  fps    + Compare
high 1366x768
19.6  fps    + Compare
ultra 1920x1080
12.4  fps    + Compare
» With all tested laptops playable in detail settings med..
low 1024x768
29.1  fps    + Compare
med. 1366x768
22.7  fps    + Compare
high 1366x768
14.6  fps    + Compare
ultra 1920x1080
8.7  fps    + Compare
» The benchmarks indicate that the game is not playable in the tested settings.
low 1024x768
36.5  fps    + Compare
med. 1366x768
25  fps    + Compare
high 1366x768
19.1  fps    + Compare
ultra 1920x1080
11.8  fps    + Compare
» With all tested laptops playable in detail settings low.
low 1024x768
47  fps    + Compare
med. 1366x768
40.2  fps    + Compare
high 1366x768
36.4  fps    + Compare
ultra 1920x1080
20.7  fps    + Compare
» With all tested laptops playable in detail settings high.
low 1024x768
59.4  fps    + Compare
med. 1366x768
29.2  fps    + Compare
high 1366x768
24.8  fps    + Compare
ultra 1920x1080
13.5  fps    + Compare
» With all tested laptops playable in detail settings low.
Fifa 13

Fifa 13

2012
low 1024x768
140  fps    + Compare
med. 1366x768
97  fps    + Compare
high 1366x768
94  fps    + Compare
ultra 1920x1080
62  fps    + Compare
» With all tested laptops playable in detail settings ultra.
F1 2012

F1 2012

2012
low 1024x768
39  fps    + Compare
med. 1366x768
33  fps    + Compare
high 1366x768
32  fps    + Compare
ultra 1920x1080
14  fps    + Compare
» With all tested laptops playable in detail settings low.
low 1024x768
39  fps    + Compare
med. 1366x768
33  fps    + Compare
high 1366x768
23  fps    + Compare
ultra 1920x1080
13.4  fps    + Compare
» With all tested laptops playable in detail settings low.
Torchlight 2

Torchlight 2

2012
low 1024x768
57.1  fps    + Compare
med. 1366x768
45.4  fps    + Compare
ultra 1920x1080
39.2  fps    + Compare
» With all tested laptops playable in detail settings ultra.
low 1024x768
28.4  fps    + Compare
high 1366x768
14.8  fps    + Compare
ultra 1920x1080
7.4  fps    + Compare
» The benchmarks indicate that the game is not playable in the tested settings.
high 1366x768
58  fps    + Compare
ultra 1920x1080
39  fps    + Compare
» With all tested laptops playable in detail settings ultra.
med. 1366x768
41.1  fps    + Compare
ultra 1920x1080
24  fps    + Compare
» With all tested laptops playable in detail settings med..
low 1024x768
47.4  fps    + Compare
med. 1366x768
35.9  fps    + Compare
high 1366x768
16.4  fps    + Compare
ultra 1920x1080
5.6  fps    + Compare
» With all tested laptops playable in detail settings med..
low 1024x768
24  fps    + Compare
med. 1366x768
16  fps    + Compare
» The benchmarks indicate that the game is not playable in the tested settings.
low 1024x768
26.2  fps    + Compare
med. 1366x768
15.4  fps    + Compare
» The benchmarks indicate that the game is not playable in the tested settings.
low 1024x768
24  fps    + Compare
med. 1366x768
24  fps    + Compare
high 1366x768
9  fps    + Compare
» The benchmarks indicate that the game is not playable in the tested settings.
low 1024x768
41  fps    + Compare
med. 1366x768
27  fps    + Compare
high 1366x768
25  fps    + Compare
ultra 1920x1080
9.9  fps    + Compare
» With all tested laptops playable in detail settings low.
low 1024x768
56 77 ~ 67 fps    + Compare
med. 1366x768
42 44 ~ 43 fps    + Compare
high 1366x768
26.5 41 ~ 34 fps    + Compare
ultra 1920x1080
20  fps    + Compare
» With all tested laptops playable in detail settings med..
low 1024x768
31.5  fps    + Compare
med. 1366x768
21.2  fps    + Compare
high 1366x768
17  fps    + Compare
ultra 1920x1080
8.5  fps    + Compare
» The benchmarks indicate that the game is not playable in the tested settings.
low 1280x720
32.5  fps    + Compare
high 1366x768
28.1  fps    + Compare
ultra 1920x1080
17  fps    + Compare
» The benchmarks indicate that the game is not playable in the tested settings.
Alan Wake

Alan Wake

2012
low 1024x768
28  fps    + Compare
med. 1366x768
17  fps    + Compare
ultra 1920x1080
8.2  fps    + Compare
» The benchmarks indicate that the game is not playable in the tested settings.
Anno 2070

Anno 2070

2011
low 1024x768
77  fps    + Compare
med. 1366x768
34  fps    + Compare
high 1366x768
22  fps    + Compare
ultra 1920x1080
11  fps    + Compare
» With all tested laptops playable in detail settings low.
low 1280x720
38  fps    + Compare
med. 1366x768
29  fps    + Compare
high 1366x768
20  fps    + Compare
ultra 1920x1080
10  fps    + Compare
» With all tested laptops playable in detail settings low.
low 1024x768
107  fps    + Compare
med. 1366x768
59  fps    + Compare
high 1366x768
36  fps    + Compare
ultra 1920x1080
19  fps    + Compare
» With all tested laptops playable in detail settings high.
low 1024x768
32  fps    + Compare
med. 1366x768
22  fps    + Compare
high 1366x768
17  fps    + Compare
ultra 1920x1080
6  fps    + Compare
» The benchmarks indicate that the game is not playable in the tested settings.
low 1024x768
52  fps    + Compare
med. 1366x768
43  fps    + Compare
high 1366x768
16  fps    + Compare
ultra 1920x1080
5  fps    + Compare
» With all tested laptops playable in detail settings med..
Fifa 12

Fifa 12

2011
low 800x600
157  fps    + Compare
med. 1024x768
94  fps    + Compare
high 1360x768
83  fps    + Compare
ultra 1920x1080
64  fps    + Compare
» With all tested laptops playable in detail settings ultra.
F1 2011

F1 2011

2011
low 800x600
60  fps    + Compare
med. 1024x768
36  fps    + Compare
high 1366x768
28  fps    + Compare
ultra 1920x1080
12  fps    + Compare
» With all tested laptops playable in detail settings med..
low 1024x768
83  fps    + Compare
high 1366x768
34  fps    + Compare
ultra 1920x1080
16  fps    + Compare
» With all tested laptops playable in detail settings low.
Dirt 3

Dirt 3

2011
low 800x600
87  fps    + Compare
med. 1024x768
47.5  fps    + Compare
high 1360x768
37.1  fps    + Compare
ultra 1920x1080
13.2  fps    + Compare
» With all tested laptops playable in detail settings high.
low 1024x768
21.5  fps    + Compare
med. 1366x768
17  fps    + Compare
high 1600x900
8  fps    + Compare
» The benchmarks indicate that the game is not playable in the tested settings.
Crysis 2

Crysis 2

2011
low 800x600
51  fps    + Compare
med. 1024x768
33  fps    + Compare
high 1366x768
26  fps    + Compare
ultra 1920x1080
9  fps    + Compare
» With all tested laptops playable in detail settings low.
Total War: Shogun 2

Total War: Shogun 2

2011
low 1024x768
98.9  fps    + Compare
med. 1280x720
26.5  fps    + Compare
» With all tested laptops playable in detail settings low.
Additional Benchmarks
CPU 1280x1024
14.1
high 1360x768
37  fps    + Compare
ultra 1920x1080
26  fps    + Compare
» With all tested laptops playable in detail settings high.
Civilization 5

Civilization 5

2010
low 1024x768
32.8  fps    + Compare
ultra 1920x1080
11.1  fps    + Compare
» The benchmarks indicate that the game is not playable in the tested settings.
Mafia 2

Mafia 2

2010
low 800x600
37.7  fps    + Compare
med. 1024x768
31.7  fps    + Compare
high 1360x768
27.9  fps    + Compare
ultra 1920x1080
21.7  fps    + Compare
» With all tested laptops playable in detail settings low.
low 1024x768
142  fps    + Compare
med. 1360x768
44  fps    + Compare
high 1360x768
29.5  fps    + Compare
ultra 1920x1080
17.8  fps    + Compare
» With all tested laptops playable in detail settings med..
Just Cause 2

Just Cause 2

2010
ultra 1920x1080
9.7  fps    + Compare
» The benchmarks indicate that the game is not playable in the tested settings.
low 800x600
50  fps    + Compare
med. 1360x768
33  fps    + Compare
high 1600x900
12  fps    + Compare
» With all tested laptops playable in detail settings low.
low 1024x768
57  fps    + Compare
med. 1366x768
37.7  fps    + Compare
high 1366x768
30.3  fps    + Compare
ultra 1920x1080
19  fps    + Compare
» With all tested laptops playable in detail settings med..
Stalker: Call of Pripyat

Stalker: Call of Pripyat

2010
ultra 1920x1200
9.4  fps    + Compare
» The benchmarks indicate that the game is not playable in the tested settings.
Resident Evil 5

Resident Evil 5

2009
low 800x600
66.8  fps    + Compare
high 1360x768
45.1  fps    + Compare
ultra 1920x1080
27  fps    + Compare
» With all tested laptops playable in detail settings high.
Colin McRae: DIRT 2

Colin McRae: DIRT 2

2009
low 800x600
62.3  fps    + Compare
med. 1024x768
48.2  fps    + Compare
high 1360x768
28.7  fps    + Compare
ultra 1920x1080
15.5  fps    + Compare
» With all tested laptops playable in detail settings med..
ArmA 2

ArmA 2

2009
ultra 1920x1080
9  fps    + Compare
» The benchmarks indicate that the game is not playable in the tested settings.
Sims 3

Sims 3

2009
med. 1024x768
60  fps    + Compare
high 1280x1024
30  fps    + Compare
» With all tested laptops playable in detail settings med..
F.E.A.R. 2

F.E.A.R. 2

2009
high 1280x1024
47  fps    + Compare
ultra 1920x1080
29  fps    + Compare
» With all tested laptops playable in detail settings high.
GTA IV - Grand Theft Auto

GTA IV - Grand Theft Auto

2008
med. 1024x768
30.2  fps    + Compare
high 1280x1024
23.6  fps    + Compare
» The benchmarks indicate that the game is not playable in the tested settings.
Left 4 Dead

Left 4 Dead

2008
high 1024x768
70  fps    + Compare
» With all tested laptops playable in detail settings high.
Far Cry 2

Far Cry 2

2008
low 640x480
110  fps    + Compare
high 1024x768
45.2  fps    + Compare
ultra 1920x1080
18.2  fps    + Compare
» With all tested laptops playable in detail settings high.
Trackmania Nations Forever

Trackmania Nations Forever

2008
low 640x480
167  fps    + Compare
high 1024x768
43  fps    + Compare
ultra 1920x1080
20  fps    + Compare
» With all tested laptops playable in detail settings high.
Supreme Commander - FA Bench

Supreme Commander - FA Bench

2007
low 1024x768
48.6  fps    + Compare
med. 1024x768
36.1  fps    + Compare
high 1024x768
32  fps    + Compare
ultra 1920x1080
16.7  fps    + Compare
» With all tested laptops playable in detail settings med..
World in Conflict - Benchmark

World in Conflict - Benchmark

2007
low 800x600
99  fps    + Compare
med. 1024x768
49  fps    + Compare
high 1024x768
32  fps    + Compare
ultra 1920x1080
12  fps    + Compare
» With all tested laptops playable in detail settings med..
Half Life 2 - Lost Coast Benchmark

Half Life 2 - Lost Coast Benchmark

2005
high 1024x768
119.2  fps    + Compare
» With all tested laptops playable in detail settings high.
Quake 4

Quake 4

2005
ultra 1024x768
62  fps    + Compare
» With all tested laptops playable in detail settings ultra.
World of Warcraft

World of Warcraft

2005
med. 1024x768
73  fps    + Compare
high 1280x1024
31  fps    + Compare
» With all tested laptops playable in detail settings med..
Quake 3 Arena - Timedemo

Quake 3 Arena - Timedemo

1999
high 1024x768
430  fps    + Compare
» With all tested laptops playable in detail settings high.
lowmed.highultraQHD4K
X-Plane 11.1115.810.29.28
Team Fortress 247.449.34032
Dirt 429.6
Rocket League37.422.2
Metal Gear Solid V46.532.211.9
Mad Max16.8
Dota 2 Reborn48.329.815.514.5
The Witcher 315.1
Dirt Rally8927.3
Civilization: Beyond Earth20
Alien: Isolation3624.713.511
Fifa 153218.7
Risen 3: Titan Lords40.224.3
GRID: Autosport82392012.5
Watch Dogs18.7
Wolfenstein: The New Order32.130.613.9
The Elder Scrolls Online4028.919.110.3
Titanfall51.826.7
Thief15.612.910.25
Assassin´s Creed IV: Black Flag2520.510.74.4
X-Plane 10.2542.819.28.75.8
Need for Speed: Rivals2218.6
Call of Duty: Ghosts3724.612.83.4
Battlefield 43223155
Batman: Arkham Origins5633187
F1 201349353216
Fifa 1412210910065
Total War: Rome II403122.511.3
Saints Row IV25.623.812.57.2
The Bureau: XCOM Declassified39.418.47.85
Splinter Cell: Blacklist3026.49.34.1
Dota 249.431.717.6
Company of Heroes 2171373
GRID 274473412.5
Metro: Last Light24.920.29.65.1
BioShock Infinite5628.123.76.8
StarCraft II: Heart of the Swarm1275031.511.1
SimCity35.822.816.36.4
Tomb Raider54.828.818.78.5
Crysis 32816
Dead Space 390.741.632.919.9
Far Cry 333.92011.83.5
Assassin´s Creed III1614.39.8
Hitman: Absolution22.720.210.63.7
Call of Duty: Black Ops 2614219.612.4
Need for Speed: Most Wanted29.122.714.68.7
Medal of Honor: Warfighter36.52519.111.8
Dishonored4740.236.420.7
World of Tanks v859.429.224.813.5
Fifa 13140979462
F1 201239333214
Borderlands 239332313.4
Torchlight 257.145.439.2
Guild Wars 228.414.87.4
Counter-Strike: GO5839
Darksiders II41.124
Sleeping Dogs47.435.916.45.6
The Secret World2416
Ghost Recon: Future Soldier26.215.4
Max Payne 324249
Dirt Showdown4127259.9
Diablo III67433420
Risen 2: Dark Waters31.521.2178.5
Mass Effect 332.528.117
Alan Wake28178.2
Anno 207077342211
The Elder Scrolls V: Skyrim38292010
CoD: Modern Warfare 3107593619
Battlefield 33222176
Batman: Arkham City5243165
Fifa 12157948364
F1 201160362812
Deus Ex Human Revolution833416
Dirt 38747.537.1213.2
The Witcher 2: Assassins of Kings21.5178
Crysis 25133269
Total War: Shogun 298.926.5
Call of Duty: Black Ops3726
Civilization 532.811.1
Mafia 237.731.727.921.7
StarCraft 21424429.517.8
Just Cause 29.7
Metro 2033503312
Dawn of War II - Chaos Rising5737.730.319
Stalker: Call of Pripyat9.4
Resident Evil 566.845.127
Colin McRae: DIRT 262.348.228.715.5
ArmA 29
Sims 36030
F.E.A.R. 24729
GTA IV - Grand Theft Auto30.223.6
Left 4 Dead70
Far Cry 211045.218.2
Trackmania Nations Forever1674320
Supreme Commander - FA Bench48.636.13216.7
World in Conflict - Benchmark99493212
Half Life 2 - Lost Coast Benchmark119.2
Quake 462
World of Warcraft7331
Quake 3 Arena - Timedemo430
< 30 fps
< 60 fps
< 120 fps
≥ 120 fps
20
41
16
6
40
33
5
48
23
5
1
67
3
4


For more games that might be playable and a list of all games and graphics cards visit our Gaming List

v1.28
log 26. 03:58:33

#0 no ids found in url (should be separated by "_") +0s ... 0s

#1 not redirecting to Ajax server +0s ... 0s

#2 did not recreate cache, as it is less than 5 days old! Created at Tue, 25 Jun 2024 05:31:39 +0200 +0.001s ... 0.001s

#3 no comparison url found in template nbc.compare_page_1 needed +0.041s ... 0.043s

#4 no comparison url found in template nbc.compare_page_1 needed +0s ... 0.043s

#5 no comparison url found in template nbc.compare_page_1 needed +0s ... 0.043s

#6 no comparison url found in template nbc.compare_page_1 needed +0s ... 0.044s

#7 no comparison url found in template nbc.compare_page_1 needed +0s ... 0.044s

#8 no comparison url found in template nbc.compare_page_1 needed +0s ... 0.044s

#9 no comparison url found in template nbc.compare_page_1 needed +0s ... 0.045s

#10 composed specs +0s ... 0.045s

#11 did output specs +0s ... 0.045s

#12 start showIntegratedCPUs +0s ... 0.045s

#13 getting avg benchmarks for device 2891 +0.015s ... 0.06s

#14 got single benchmarks 2891 +0.018s ... 0.078s

#15 got avg benchmarks for devices +0s ... 0.078s

#16 min, max, avg, median took s +0.591s ... 0.669s

#17 before gaming benchmark output +0s ... 0.669s

#18 Got 329 rows for game benchmarks. +0.009s ... 0.678s

#19 composed SQL query for gamebenchmarks +0s ... 0.678s

#20 got data and put it in $dataArray +0.06s ... 0.738s

#21 benchmarks composed for output. +2.899s ... 3.637s

#22 no comparison url found in template nbc.compare_page_1 needed +0.007s ... 3.644s

#23 return log +0s ... 3.644s

Please share our article, every link counts!

» Comparison of GPUs
Detailed list of all laptop GPUs sorted by class and performance.

» Benchmark List
Sort and restrict laptop GPUs based on performance in synthetic benchmarks.

» Notebook Gaming List
Playable games for each graphics card and their average FPS results.

Class 1

GeForce RTX 2080 Super Mobile

Class 2

M1 Max 32-Core GPU *
GeForce RTX 2070 Super Mobile
M1 Max 24-Core GPU *
Quadro RTX 5000 Max-Q
Radeon RX 5700M *
GeForce GTX 1080 Mobile
Quadro RTX 4000 (Laptop)
M1 Pro 16-Core GPU *
Radeon PRO W6600M *
GeForce RTX 2070 Super Max-Q
Quadro RTX 4000 Max-Q *
M1 Pro 14-Core GPU *
Quadro P5200
Quadro RTX 3000 Max-Q *
Quadro P4200
Quadro P5000 Max-Q *
GeForce GTX 980 (Laptop)
Quadro P4000
Quadro P4000 Max-Q
Quadro P3200
Radeon RX 580X (Laptop) *
Radeon RX 580 (Laptop)
Radeon Pro 5300M
Radeon RX 5300M
Quadro P3000 Max-Q *
Quadro T2000 Max-Q *
Radeon Pro WX 7100 *
Radeon RX 570X (Laptop) *
Radeon RX 570 (Laptop) *
Radeon RX 470 (Laptop) *
Quadro T1000 Max-Q *

Class 3

Vega M GH
Quadro M5000M
GeForce GTX 1050 Ti Mobile
Radeon 680M
Quadro P2000
Quadro P2000 Max-Q
Quadro M4000M
T500 Laptop GPU *
Radeon R9 M395X
GeForce GTX 1050 Ti Max-Q *
Radeon Pro Vega 16
WX Vega M GL
Radeon R9 M485X
Quadro M3000M
FirePro W7170M
Radeon R9 M395
GeForce GTX 1050 Max-Q *
Radeon 660M
Radeon Pro WX 4150 *
Radeon RX 560X (Laptop)
Radeon RX 560 (Laptop)
Radeon RX 460 (Laptop)
Quadro P1000
Radeon R9 M390
Xe MAX
Radeon Pro 560X
Radeon Pro 560
Radeon Pro 460
Radeon Pro WX 4130 *
GeForce GTX 960M
Quadro P620 *
Radeon RX 550X (Laptop)
Radeon Pro WX 3200 *
Radeon Pro 555X
Radeon Pro 555
Radeon Pro 455
Quadro P600
Quadro M2000M
Radeon RX 540X *
Radeon Pro WX 2100 *
Radeon Pro WX 3100 *
GeForce GTX 950M
Radeon Pro 450
Radeon 630
Radeon 540X *
Radeon R9 M385X
Quadro P520
Quadro M1000M
GeForce 945M
Quadro P500 *
Iris Plus Graphics G7 (Ice Lake 64 EU) *
Vega 10 *
Iris Pro Graphics 580
FirePro W5170M *
Radeon R9 M370X
Vega 9
FirePro W5130M
UHD Graphics Xe G4 48EUs *
UHD Graphics 32EUs
UHD Graphics Xe 32EUs (Tiger Lake-H) *
UHD Graphics 750
Vega 7
Radeon R7 M465
Iris Pro Graphics 6200
Vega 8
GeForce 940M
Iris Plus Graphics G4 (Ice Lake 48 EU)
Quadro M600M
FirePro W4190M
Radeon R9 M375
Radeon R7 M445
Iris Plus Graphics 650
Iris Graphics 550
Radeon 625
Vega 6 *
Iris Plus Graphics 640
Iris Graphics 540
UHD Graphics 24EUs (Alder Lake-N) *
Radeon R7 M360
GeForce 920M
Radeon 620
Radeon R7 M340
Radeon 610
Radeon 610M *
Vega 6 *
UHD Graphics G1 (Ice Lake 32 EU)
UHD Graphics Xe 16EUs (Tiger Lake-H) *
HD Graphics 530
Radeon R5 (Bristol Ridge)
Adreno 690 *
Adreno 685 *
Adreno 680 *
Radeon R5 M330
GeForce 910M
HD Graphics 520

Class 4

UHD Graphics 730
Radeon R5 M320 *
Radeon R5 M315 *
Radeon R5 M420 *
Vega 2 *
UHD Graphics 617
UHD Graphics 615
HD Graphics 515
UHD Graphics 610
HD Graphics 510
UHD Graphics 605
Radeon R4 (Stoney Ridge)
Radeon R2 (Stoney Ridge)
HD Graphics (Broadwell)
UHD Graphics 600
HD Graphics (Braswell)

Class 5

* Approximate position of the graphics adapter