Notebookcheck Logo

AMD Radeon R9 290X

AMD Radeon R9 290X

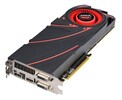
AMD Radeon R9 290X是一款为台式机设计的高端单GPU显卡,于2013年10月发布。它基于“Hawaii”架构,采用了28纳米制程技术。这款显卡提供了2816个着色器单元和512位的显存位宽(支持4GB DDR5显存,5000MHz带宽,和320GB/s传输速率)。 架构 Hawaii芯片架构基于GCN架构,并提供了一些改进。其中最重要的是它的前端翻了一倍并重新优化设计,二级缓存的容量和速度均有提升,与显存带宽的提高。另外,相对前作Radeon HD 7970,R9 290X提供了更多的着色器(2816),TMU(176)和ROP(64)。除了更高的性能,290X还新增了一些功能,例如对DirectX 11.2的支持。 性能 根据不同的游戏和设定,Radeon R9 290X的性能表现与NvidiaGeForce GTX Titan相近。因此,甚至是最快的移动处理器例如GeForce GTX 780M也在性能上被超出了近50%。 大型游戏例如《地铁:最后的曙光》可以在2560 x 1600分辨率下以最高设定流畅运行。在一些情况下,甚至在3840 x 2160即4K的超高清分辨率下也可以运行。 特性 R9 290X提供了对一些常见技术(像是Eyefinity)的支持,同时也支持一些创新的技术,例如True Audio和一个新的turbo加速模式。根据功耗和核心温度,显卡核心可以提升到最高10000MHz的频率。不过,这并没有官方的底频即最低限制。 功耗 得力于动态的频率调整和Zero Core技术,R9 290X在待机状态下非常节能。在高负载下,这款显卡通常有250W的功耗。

R9 Series

Radeon R9 290X 2816 @ 1 GHz512 Bit @ 5000 MHz
Radeon R9 280X 2048 @ 1 GHz384 Bit @ 6000 MHz
Radeon R9 270X 1280 @ 1.05 GHz256 Bit @ 5600 MHz
CodenameHawaii XT
ArchitectureGCN
Pipelines2816 - unified
Core Speed1000 MHz
Memory Speed5000 MHz
Memory Bus Width512 Bit
Memory TypeGDDR5
Max. Amount of Memory4 GB
Shared Memoryno
APIDirectX 12 (FL 12_0), OpenGL 4.3
Power Consumption250 Watt
Transistor Count6.2 Billion
technology28 nm
FeaturesMantle, Eyefinity, App Acceleration, CrossFire, PowerTune, ZeroCore, HD3D, TrueAudio
Date of Announcement24.10.2013
InformationPCI-E 3.0, HDMI mit 4K-Support
Link to Manufacturer Pagewww.amd.com

Benchmarks

Performance Rating - 3DMark 11 + Fire Strike + Time Spy
5.3 pt (16%)
AMD Radeon HD 8180
0.06605 -99%
...
NVIDIA GeForce GTX 780M SLI
4.6 -14%
Intel Arc A380
4.63 -13%
4.65 -13%
AMD Radeon RX Vega M GH
4.67 -13%
AMD Radeon HD 8970M Crossfire
4.72 -12%
4.75 -11%
4.81 -10%
AMD Radeon RX 580 (Laptop)
5.13 -4%
5.27 -1%
AMD Radeon R9 290X
5.34
5.38 1%
5.38 1%
NVIDIA GeForce GTX 970
5.45 2%
5.45 2%
5.52 3%
AMD Radeon RX 480 (Desktop)
5.55 4%
NVIDIA GeForce GTX 1650 Super (Desktop)
5.57 4%
NVIDIA Quadro P4000
5.58 4%
5.59 5%
...
33.3 524%
0%
100%
3DMark - 3DMark Time Spy Score
4114 Points (12%)
3DMark - 3DMark Time Spy Graphics
4003 Points (11%)
112 -97%
...
3610 -10%
3624 -9%
3650 -9%
3689 -8%
AMD Radeon RX 480 (Desktop)
3882 -3%
3883 -3%
Intel Arc A380
3915 -2%
AMD Radeon RX 570 (Desktop)
3958 -1%
NVIDIA Quadro P4000
3960 -1%
AMD Radeon R9 290X
4003
AMD Radeon RX 580 (Desktop)
4094 2%
NVIDIA Quadro P3200
4155 4%
NVIDIA GeForce GTX 1060 (Desktop)
4194 5%
4209 5%
4256 6%
4372 9%
4483 12%
AMD Radeon R9 Nano
4511 13%
4546 14%
...
36485 811%
0%
100%
3DMark - 3DMark Ice Storm Unlimited Graphics
min: 250909     avg: 324392     median: 332042 (38%)     max: 382574 Points
3DMark - 3DMark Ice Storm Extreme Graphics
min: 264357     avg: 314724     median: 314724 (40%)     max: 365090 Points
3DMark - 3DMark Cloud Gate Score
min: 19397     avg: 22992     median: 22197 (24%)     max: 27382 Points
3DMark - 3DMark Cloud Gate Graphics
min: 71039     avg: 73935     median: 73987 (19%)     max: 76778 Points
3DMark - 3DMark Fire Strike Standard Score
min: 9108     avg: 9769     median: 9835 (17%)     max: 10297 Points
3DMark - 3DMark Fire Strike Standard Graphics
min: 11425     avg: 11714     median: 11717 (13%)     max: 11998 Points
3DMark - 3DMark Ice Storm Graphics
min: 289088     avg: 330583     median: 291067 (35%)     max: 411593 Points
3DMark 11 - 3DM11 Performance Score
min: 12356     avg: 13377     median: 13415 (19%)     max: 14320 Points
3DMark 11 - 3DM11 Performance GPU
min: 15974     avg: 16166     median: 16167.5 (14%)     max: 16355 Points
171.8 -99%
...
14725 -9%
15135 -6%
AMD Radeon RX 580 (Laptop)
15223 -6%
NVIDIA Quadro P4000
15433 -5%
15619 -3%
15711 -3%
NVIDIA GeForce GTX 970
15780 -2%
15823 -2%
NVIDIA Quadro P4000 Max-Q
15837 -2%
AMD Radeon R9 290X
16166
NVIDIA Quadro P3200
16233 0%
16564 2%
NVIDIA GeForce GTX 980 (Laptop)
17028 5%
17113 6%
AMD Radeon R9 Nano
17282 7%
NVIDIA GeForce GTX 1060 (Desktop)
17348 7%
17465 8%
AMD Radeon R9 Fury
17543 9%
17562 9%
...
106023 556%
0%
100%
3DMark Vantage
3DM Vant. Perf. total +
3DMark Vantage - 3DM Vant. Perf. total
min: 31240     avg: 36823     median: 37284 (11%)     max: 41482 Points
3DM Vant. Perf. GPU no PhysX +
3DMark Vantage - 3DM Vant. Perf. GPU no PhysX
min: 36940     avg: 41832     median: 42403.5 (24%)     max: 45580 Points
ATI Radeon HD 3200
62 -100%
...
37644 -10%
38910 -7%
AMD Radeon HD 8970M Crossfire
39191 -6%
39213 -6%
40134 -4%
40628 -3%
40643 -3%
40697 -3%
AMD Radeon RX 580 (Desktop)
41558 -1%
AMD Radeon R9 290X
41832
NVIDIA Quadro P4000
42370 1%
AMD Radeon RX 570 (Desktop)
42386 1%
AMD Radeon RX 480 (Desktop)
42513 2%
42967 3%
NVIDIA GeForce GTX 780M SLI
43525 4%
43587 4%
44188 6%
44693 7%
NVIDIA GeForce GTX 980 (Laptop)
45346 8%
...
170928 309%
0%
100%
3DMark 06 3DMark 06 - Standard 1280x1024 +
3DMark 06
min: 23510     avg: 31591     median: 32271 (42%)     max: 38311 Points
Unigine Valley 1.0 - Unigine Valley 1.0 DX
64.2 fps (21%)
Unigine Heaven 3.0 - Unigine Heaven 3.0 DX 11
140 fps (46%)
Unigine Heaven 3.0 - Unigine Heaven 3.0 OpenGL
111 fps (49%)
Cinebench R10 Cinebench R10 Shading (32bit) +
Cinebench R10 - Cinebench R10 Shading (32bit)
min: 14284     avg: 14450     median: 14449.5 (10%)     max: 14615 points
Cinebench R11.5 Cinebench R11.5 OpenGL 64 Bit +
Cinebench R11.5 - Cinebench R11.5 OpenGL 64 Bit
min: 79.1     avg: 106.2     median: 117 (41%)     max: 122.5 fps
Cinebench R15
Cinebench R15 OpenGL 64 Bit +
Cinebench R15 - Cinebench R15 OpenGL 64 Bit
min: 90.6     avg: 126.5     median: 142 (8%)     max: 147 fps
Cinebench R15 OpenGL Ref. Match 64 Bit +
Cinebench R15 - Cinebench R15 OpenGL Ref. Match 64 Bit
98 % (98%)
GFXBench - GFXBench Car Chase Offscreen
210 fps (24%)
GFXBench 3.1 - GFXBench Manhattan ES 3.1 Offscreen
242 fps (5%)
GFXBench 3.0 - GFXBench 3.0 Manhattan Offscreen
min: 214     avg: 220     median: 220 (13%)     max: 226 fps
GFXBench (DX / GLBenchmark) 2.7
GFXBench T-Rex HD Offscreen C24Z16 +
GFXBench (DX / GLBenchmark) 2.7 - GFXBench T-Rex HD Offscreen C24Z16
min: 900     avg: 909     median: 909 (7%)     max: 918 fps
LuxMark v2.0 64Bit - LuxMark v2.0 Room GPU
1512 Samples/s (7%)
LuxMark v2.0 64Bit - LuxMark v2.0 Sala GPU
2974 Samples/s (5%)
ComputeMark v2.1 - ComputeMark v2.1 Result
8217 points (9%)
- Range of benchmark values for this graphics card
- Average benchmark values for this graphics card
* Smaller numbers mean a higher performance

Game Benchmarks

The following benchmarks stem from our benchmarks of review laptops. The performance depends on the used graphics memory, clock rate, processor, system settings, drivers, and operating systems. So the results don't have to be representative for all laptops with this GPU. For detailed information on the benchmark results, click on the fps number.

ultra 1920x1080
43.7  fps    + Compare
» With all tested laptops playable in detail settings ultra.
4K 3820x2160
124  fps    + Compare
high 1920x1080
60.1  fps    + Compare
ultra 1920x1080
30.5  fps    + Compare
4K 3840x2160
24.2  fps    + Compare
» With all tested laptops playable in detail settings high.
For Honor

For Honor

2017
ultra 1920x1080
76.5  fps    + Compare
4K 3840x2160
33.6  fps    + Compare
» With all tested laptops playable in detail settings ultra.
ultra 1920x1080
47.8  fps    + Compare
4K 3840x2160
23.6  fps    + Compare
» With all tested laptops playable in detail settings ultra.
ultra 1920x1080
86  fps    + Compare
4K 3840x2160
47.7  fps    + Compare
» With all tested laptops playable in detail settings ultra.
ultra 1920x1080
103  fps    + Compare
4K 3840x2160
61  fps    + Compare
» With all tested laptops playable in detail settings ultra.
4K 3840x2160
95  fps    + Compare
high 1920x1080
39.7  fps    + Compare
ultra 1920x1080
96  fps    + Compare
» With all tested laptops playable in detail settings ultra.
ultra 1920x1080
55  fps    + Compare
4K 3840x2160
51  fps    + Compare
» With all tested laptops playable in detail settings ultra.
Mafia 3

Mafia 3

2016
high 1920x1080
37  fps    + Compare
» With all tested laptops playable in detail settings high.
high 1920x1080
61.2  fps    + Compare
ultra 1920x1080
33.1  fps    + Compare
» With all tested laptops playable in detail settings high.
high 1920x1080
80.5  fps    + Compare
ultra 1920x1080
65.9  fps    + Compare
4K 3840x2160
28.6  fps    + Compare
» With all tested laptops playable in detail settings ultra.
Overwatch

Overwatch

2016
high 1920x1080
198  fps    + Compare
ultra 1920x1080
97  fps    + Compare
4K 3840x2160
65.4  fps    + Compare
» With all tested laptops playable in detail settings ultra.
med. 1920x1080
67.8  fps    + Compare
high 1920x1080
62.2  fps    + Compare
4K 3840x2160
26.5  fps    + Compare
» With all tested laptops playable in detail settings high.
ultra 1920x1080
61  fps    + Compare
4K 3840x2160
32.5  fps    + Compare
» With all tested laptops playable in detail settings ultra.
ultra 1920x1080
58  fps    + Compare
4K 3840x2160
32.5  fps    + Compare
» With all tested laptops playable in detail settings ultra.
ultra 1920x1080
50.7  fps    + Compare
4K 3840x2160
29.9  fps    + Compare
» With all tested laptops playable in detail settings ultra.
low 1024x768
149  fps    + Compare
med. 1366x768
102  fps    + Compare
high 1920x1080
65  fps    + Compare
ultra 1920x1080
50.5  fps    + Compare
4K 3840x2160
27.2  fps    + Compare
» With all tested laptops playable in detail settings ultra.
low 1024x768
186  fps    + Compare
med. 1366x768
159  fps    + Compare
high 1920x1080
118  fps    + Compare
ultra 1920x1080
104  fps    + Compare
4K 3840x2160
43.4  fps    + Compare
» With all tested laptops playable in detail settings ultra.
low 1024x768
78  fps    + Compare
med. 1366x768
75  fps    + Compare
high 1920x1080
64  fps    + Compare
ultra 1920x1080
5  fps    + Compare
4K 3840x2160
26.2  fps    + Compare
» With all tested laptops playable in detail settings high.
Fallout 4

Fallout 4

2015
low 1280x720
159  fps    + Compare
med. 1366x768
135  fps    + Compare
high 1920x1080
84  fps    + Compare
ultra 1920x1080
64  fps    + Compare
4K 3840x2160
31.6  fps    + Compare
» With all tested laptops playable in detail settings ultra.
low 1024x768
140  fps    + Compare
med. 1366x768
132  fps    + Compare
high 1920x1080
90  fps    + Compare
ultra 1920x1080
67  fps    + Compare
4K 3840x2160
31.1  fps    + Compare
» With all tested laptops playable in detail settings ultra.
Anno 2205

Anno 2205

2015
low 1024x768
170  fps    + Compare
med. 1366x768
126  fps    + Compare
high 1920x1080
66  fps    + Compare
ultra 1920x1080
26  fps    + Compare
4K 3840x2160
26.9  fps    + Compare
» With all tested laptops playable in detail settings high.
FIFA 16

FIFA 16

2015
low 1280x720
267  fps    + Compare
high 1366x768
256  fps    + Compare
ultra 1920x1080
206  fps    + Compare
4K 3840x2160
128  fps    + Compare
» With all tested laptops playable in detail settings ultra.
ultra 1920x1080
134  fps    + Compare
4K 3840 x 2160
57.9  fps    + Compare
» With all tested laptops playable in detail settings ultra.
low 1024x768
60  fps    + Compare
med. 1366x768
60  fps    + Compare
high 1920x1080
59.9  fps    + Compare
ultra 1920x1080
59.5  fps    + Compare
4K 3840x2160
46.8  fps    + Compare
» With all tested laptops playable in detail settings ultra.
Mad Max

Mad Max

2015
med. 1366x768
240  fps    + Compare
high 1920x1080
138  fps    + Compare
ultra 1920x1080
119  fps    + Compare
4K 3840x2160
47.3  fps    + Compare
» With all tested laptops playable in detail settings ultra.
ultra 1920x1080
136  fps    + Compare
4K 3840x2160
84  fps    + Compare
» With all tested laptops playable in detail settings ultra.
low 1280x720
114  fps    + Compare
med. 1366x768
101  fps    + Compare
high 1920x1080
72  fps    + Compare
4K 3840x2160
25  fps    + Compare
» With all tested laptops playable in detail settings high.
low 1024x768
179  fps    + Compare
med. 1366x768
123  fps    + Compare
high 1920x1080
75  fps    + Compare
ultra 1920x1080
29  fps    + Compare
4K 3840x2160
28.4  fps    + Compare
» With all tested laptops playable in detail settings high.
low 1024x768
441  fps    + Compare
med. 1366x768
163  fps    + Compare
high 1920x1080
137  fps    + Compare
ultra 1920x1080
97.4  fps    + Compare
4K 3840x2160
75.2  fps    + Compare
» With all tested laptops playable in detail settings ultra.
GTA V

GTA V

2015
low 1024x768
155  fps    + Compare
med. 1366x768
149  fps    + Compare
high 1920x1080
93  fps    + Compare
ultra 1920x1080
41  fps    + Compare
4K 3840x2160
51.8  fps    + Compare
» With all tested laptops playable in detail settings ultra.
low 1024x768
176  fps    + Compare
med. 1366x768
179  fps    + Compare
high 1920x1080
122  fps    + Compare
ultra 1920x1080
84  fps    + Compare
» With all tested laptops playable in detail settings ultra.
Evolve

Evolve

2015
high 1920x1080
125  fps    + Compare
ultra 1920x1080
103 (!)  fps    + Compare
» With all tested laptops playable in detail settings ultra.
The Crew

The Crew

2014
low 1280x720
60  fps    + Compare
med. 1366x768
60  fps    + Compare
high 1920x1080
60  fps    + Compare
ultra 1920x1080
59.9  fps    + Compare
» With all tested laptops playable in detail settings ultra.
Far Cry 4

Far Cry 4

2014
low 1024x768
122  fps    + Compare
med. 1366x768
115  fps    + Compare
high 1920x1080
94  fps    + Compare
ultra 1920x1080
80  fps    + Compare
» With all tested laptops playable in detail settings ultra.
low 1024x768
68  fps    + Compare
med. 1366x768
67  fps    + Compare
high 1920x1080
46  fps    + Compare
ultra 1920x1080
31.9  fps    + Compare
» With all tested laptops playable in detail settings high.
low 1024x768
119  fps    + Compare
med. 1366x768
91.3  fps    + Compare
high 1920x1080
86.6  fps    + Compare
ultra 1920x1080
67.5  fps    + Compare
» With all tested laptops playable in detail settings ultra.
low 1024x768
199  fps    + Compare
med. 1366x768
171  fps    + Compare
high 1920x1080
117  fps    + Compare
ultra 1920x1080
106  fps    + Compare
» With all tested laptops playable in detail settings ultra.
F1 2014

F1 2014

2014
low 1024x768
117  fps    + Compare
med. 1366x768
117  fps    + Compare
high 1920x1080
118  fps    + Compare
ultra 1920x1080
113  fps    + Compare
» With all tested laptops playable in detail settings ultra.
low 1024x768
68.7  fps    + Compare
med. 1366x768
68.7  fps    + Compare
high 1920x1080
62 67.5 ~ 65 fps    + Compare
» With all tested laptops playable in detail settings high.
low 1024x768
124 136 ~ 130 fps    + Compare
med. 1366x768
101 122 ~ 112 fps    + Compare
high 1920x1080
83 93 ~ 88 fps    + Compare
ultra 1920x1080
77.4 85 ~ 81 fps    + Compare
» With all tested laptops playable in detail settings ultra.
low 1024x768
179 255 ~ 217 fps    + Compare
med. 1366x768
160 211 ~ 186 fps    + Compare
high 1920x1080
131 146 ~ 139 fps    + Compare
ultra 1920x1080
108 115 ~ 112 fps    + Compare
» With all tested laptops playable in detail settings ultra.
low 1280x720
244  fps    + Compare
med. 1344x756
196  fps    + Compare
high 1920x1080
113 114 ~ 114 fps    + Compare
ultra 1920x1080
78 91 ~ 85 fps    + Compare
» With all tested laptops playable in detail settings ultra.
Fifa 15

Fifa 15

2014
ultra 1920x1080
204  fps    + Compare
4K 3840x2160
159  fps    + Compare
» With all tested laptops playable in detail settings ultra.
Sims 4

Sims 4

2014
ultra 1920x1080
93  fps    + Compare
» With all tested laptops playable in detail settings ultra.
low 1024x768
65  fps    + Compare
med. 1366x768
65  fps    + Compare
high 1920x1080
64  fps    + Compare
ultra 1920x1080
63  fps    + Compare
» With all tested laptops playable in detail settings ultra.
low 1024x768
253  fps    + Compare
med. 1366x768
129  fps    + Compare
high 1920x1080
118  fps    + Compare
ultra 1920x1080
92  fps    + Compare
» With all tested laptops playable in detail settings ultra.
high 1920x1080
45  fps    + Compare
ultra 1920x1080
35.4  fps    + Compare
» With all tested laptops playable in detail settings ultra.
high 1920x1080
56 58 ~ 57 fps    + Compare
ultra 1920x1080
55 57.6 ~ 56 fps    + Compare
» With all tested laptops playable in detail settings ultra.
high 1366x768
63 72 ~ 68 fps    + Compare
ultra 1920x1080
35 41 45 ~ 40 fps    + Compare
» With most tested laptops playable in detail settings ultra.
Thief

Thief

2014
low 1024x768
63  fps    + Compare
med. 1366x768
70  fps    + Compare
high 1366x768
70 74 106 ~ 83 fps    + Compare
ultra 1920x1080
62 64 73.5 ~ 67 fps    + Compare
» With all tested laptops playable in detail settings ultra.
ultra 1920x1080
48 59 ~ 54 fps    + Compare
» With all tested laptops playable in detail settings ultra.
ultra 1920x1080
78 78 78 ~ 78 fps    + Compare
4K 3840x2160
46.6  fps    + Compare
» With all tested laptops playable in detail settings ultra.
F1 2013

F1 2013

2013
high 1366x768
113 117 ~ 115 fps    + Compare
ultra 1920x1080
92 98 100 ~ 97 fps    + Compare
» With all tested laptops playable in detail settings ultra.
low 1024x768
217  fps    + Compare
med. 1366x768
172  fps    + Compare
high 1366x768
139  fps    + Compare
ultra 1920x1080
56.2 56.4 ~ 56 fps    + Compare
» With all tested laptops playable in detail settings ultra.
Dota 2

Dota 2

2013
ultra 1920x1080
109  fps    + Compare
» With all tested laptops playable in detail settings ultra.
ultra 1920x1080
43.7 52 ~ 48 fps    + Compare
» With all tested laptops playable in detail settings ultra.
low 1024x768
121 121 ~ 121 fps    + Compare
med. 1366x768
118 121 ~ 120 fps    + Compare
high 1366x768
104 112 ~ 108 fps    + Compare
ultra 1920x1080
77 78 ~ 78 fps    + Compare
» With all tested laptops playable in detail settings ultra.
high 1366x768
266  fps    + Compare
ultra 1920x1080
137  fps    + Compare
» With all tested laptops playable in detail settings ultra.
med. 1366x768
66  fps    + Compare
high 1366x768
60  fps    + Compare
ultra 1920x1080
57 60 ~ 59 fps    + Compare
» With all tested laptops playable in detail settings ultra.
ultra 1920x1080
128 130 ~ 129 fps    + Compare
» With all tested laptops playable in detail settings ultra.
ultra 1920x1080
116 122 122 ~ 120 fps    + Compare
» With all tested laptops playable in detail settings ultra.
ultra 1920x1080
280  fps    + Compare
» With all tested laptops playable in detail settings ultra.
ultra 1920x1080
69  fps    + Compare
» With all tested laptops playable in detail settings ultra.
ultra 1920x1080
260  fps    + Compare
» With all tested laptops playable in detail settings ultra.
ultra 1920x1080
185 187 ~ 186 fps    + Compare
» With all tested laptops playable in detail settings ultra.
Total War: Shogun 2

Total War: Shogun 2

2011
med. 1280x720
107  fps    + Compare
ultra 1920x1080
99 102 ~ 101 fps    + Compare
» With all tested laptops playable in detail settings ultra.
lowmed.highultraQHD4K
Playerunknown's Battlegrounds (PUBG)43.7
Team Fortress 2124
Ghost Recon Wildlands60.130.524.2
For Honor76.533.6
Dishonored 247.823.6
Call of Duty Infinite Warfare8647.7
Titanfall 210361
Farming Simulator 1795
Battlefield 139.796
Civilization VI5551
Mafia 337
Deus Ex Mankind Divided61.233.1
Mirror's Edge Catalyst80.565.928.6
Overwatch1989765.4
Ashes of the Singularity67.862.226.5
Need for Speed 20166132.5
Hitman 20165832.5
The Division50.729.9
Rise of the Tomb Raider1491026550.527.2
Star Wars Battlefront18615911810443.4
Assassin's Creed Syndicate787564526.2
Fallout 4159135846431.6
Call of Duty: Black Ops 3140132906731.1
Anno 2205170126662626.9
FIFA 16267256206128
World of Warships13457.9
Metal Gear Solid V606059.959.546.8
Mad Max24013811947.3
Dota 2 Reborn13684
Batman: Arkham Knight1141017225
The Witcher 3179123752928.4
Dirt Rally44116313797.475.2
GTA V155149934151.8
Battlefield Hardline17617912284
Evolve125103
The Crew60606059.9
Far Cry 41221159480
Assassin's Creed Unity68674631.9
Call of Duty: Advanced Warfare11991.386.667.5
Civilization: Beyond Earth199171117106
F1 2014117117118113
The Evil Within68.768.765
Ryse: Son of Rome1301128881
Alien: Isolation217186139112
Middle-earth: Shadow of Mordor24419611485
Fifa 15204159
Sims 493
Risen 3: Titan Lords65656463
GRID: Autosport25312911892
Watch Dogs4535.4
Wolfenstein: The New Order5756
The Elder Scrolls Online6840
Thief63708367
Call of Duty: Ghosts54
Battlefield 47846.6
F1 201311597
Total War: Rome II21717213956
Dota 2109
Company of Heroes 248
Metro: Last Light12112010878
Tomb Raider266137
Hitman: Absolution666059
Dishonored129
Borderlands 2120
Counter-Strike: GO280
Sleeping Dogs69
Diablo III260
Deus Ex Human Revolution186
Total War: Shogun 2107101
< 30 fps
< 60 fps
< 120 fps
≥ 120 fps


10
18


16
15

6
28
9
3
19
31
10


10
13
5
3

For more games that might be playable and a list of all games and graphics cards visit our Gaming List

v1.28
log 26. 03:57:58

#0 no ids found in url (should be separated by "_") +0s ... 0s

#1 not redirecting to Ajax server +0s ... 0s

#2 did not recreate cache, as it is less than 5 days old! Created at Tue, 25 Jun 2024 05:31:39 +0200 +0.001s ... 0.001s

#3 no comparison url found in template nbc.compare_page_1 needed +0.034s ... 0.035s

#4 no comparison url found in template nbc.compare_page_1 needed +0s ... 0.035s

#5 composed specs +0s ... 0.035s

#6 did output specs +0s ... 0.035s

#7 start showIntegratedCPUs +0s ... 0.035s

#8 getting avg benchmarks for device 5062 +0.032s ... 0.067s

#9 got single benchmarks 5062 +0.014s ... 0.081s

#10 got avg benchmarks for devices +0s ... 0.081s

#11 min, max, avg, median took s +0.601s ... 0.682s

#12 before gaming benchmark output +0s ... 0.682s

#13 Got 234 rows for game benchmarks. +0.009s ... 0.692s

#14 composed SQL query for gamebenchmarks +0s ... 0.692s

#15 got data and put it in $dataArray +0.046s ... 0.737s

#16 benchmarks composed for output. +1.917s ... 2.655s

#17 no comparison url found in template nbc.compare_page_1 needed +0.004s ... 2.659s

#18 return log +0s ... 2.659s

No reviews found for this graphics card.

Please share our article, every link counts!

» Comparison of GPUs
Detailed list of all laptop GPUs sorted by class and performance.

» Benchmark List
Sort and restrict laptop GPUs based on performance in synthetic benchmarks.

» Notebook Gaming List
Playable games for each graphics card and their average FPS results.

Class 1

NVIDIA RTX A6000 Desktop
Radeon Pro W6800 Desktop
NVIDIA Titan RTX Desktop
GeForce RTX 3070 Ti Desktop
Radeon RX 6750 XT Desktop
Radeon RX 6700 XT Desktop
NVIDIA GeForce RTX 3060 Ti Desktop
Radeon RX 6650 XT Desktop
GeForce RTX 2080 (Desktop) Desktop

Class 2

NVIDIA GeForce RTX 3060 Desktop
Titan X Pascal Desktop
Radeon VII Desktop
Radeon RX 5700 XT (Desktop) Desktop
GeForce GTX 1080 (Desktop) Desktop
GeForce RTX 2060 Super (Desktop) Desktop
Radeon RX 5700 (Desktop) Desktop
GeForce RTX 2060 (Desktop) Desktop
RX Vega 64 Desktop
RX Vega 56 Desktop
Radeon RX 5600 XT (Desktop) Desktop
Pro Vega 56 Desktop
GeForce GTX 1660 Ti (Desktop) Desktop
GeForce GTX 1660 Super (Desktop) Desktop
GeForce GTX 1660 (Desktop) Desktop
GeForce GTX 1650 Super (Desktop) Desktop
Radeon R9 Fury Desktop
Radeon R9 Nano Desktop
Radeon RX 580 Desktop
GeForce GTX 1060 (Desktop) Desktop
Radeon RX 570 Desktop
Radeon RX 480 Desktop
Arc A380 Desktop
GeForce GTX 970 Desktop

Class 3

GeForce GTX 960 Desktop
Radeon R7 370 Desktop
GeForce GTX 950 Desktop
T600 Desktop
UHD Graphics 32EUs
UHD Graphics 750
FirePro W4100 Desktop
FirePro W2100 Desktop

Class 4

UHD Graphics 730

* Approximate position of the graphics adapter