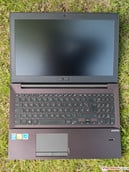
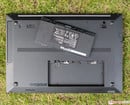
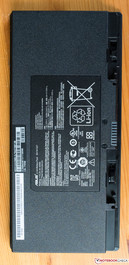
华硕 AsusPro B551LG-CN009G 笔记本电脑简短评测
| |||||||||||||||||||||||||
Brightness Distribution: 90 %
Center on Battery: 328 cd/m²
Contrast: 863:1 (Black: 0.38 cd/m²)
ΔE Color 3.7 | 0.5-29.43 Ø4.87
ΔE Greyscale 4.85 | 0.5-98 Ø5.1
63% AdobeRGB 1998 (Argyll 1.6.3 3D)
69.4% AdobeRGB 1998 (Argyll 2.2.0 3D)
96.7% sRGB (Argyll 2.2.0 3D)
67.3% Display P3 (Argyll 2.2.0 3D)
Gamma: 2.35
| Asus Pro B551LG-CN009G GeForce 840M, 4650U, Kingston SVP200S37A256G | HP EliteBook 850 G1-H5G44ET Radeon HD 8750M, 4600U, Intel SSD Pro 1500 Series SSDSC2BF180A4H | Lenovo ThinkPad S540 20B30059GE Radeon HD 8670M, 4200U, WDC WD10JPVX-08JC3T5 + Sandisk SSD U110 16GB | |
|---|---|---|---|
| Display | |||
| Display P3 Coverage | 67.3 | 50.8 -25% | 53.3 -21% |
| sRGB Coverage | 96.7 | 72.3 -25% | 76 -21% |
| AdobeRGB 1998 Coverage | 69.4 | 51.9 -25% | 54.6 -21% |
| Screen | |||
| Brightness middle | 328 | 264 -20% | 280 -15% |
| Brightness | 310 | 264 -15% | 274 -12% |
| Brightness Distribution | 90 | 83 -8% | 84 -7% |
| Black Level * | 0.38 | 0.64 -68% | 0.81 -113% |
| Contrast | 863 | 413 -52% | 346 -60% |
| Colorchecker dE 2000 * | 3.7 | 11.37 -207% | 10.84 -193% |
| Greyscale dE 2000 * | 4.85 | 13.09 -170% | 12.6 -160% |
| Gamma | 2.35 94% | 2.68 82% | 2.76 80% |
| CCT | 7077 92% | 12953 50% | 15823 41% |
| Color Space (Percent of AdobeRGB 1998) | 63 | 47 -25% | 48.7 -23% |
* ... smaller is better
| Cinebench R11.5 | |
| CPU Multi 64Bit (sort by value) | |
| Asus Pro B551LG-CN009G | |
| Asus B551LA-CN018G | |
| Dell XPS 12 Haswell | |
| Apple MacBook Air 11 inch 2013-06 1.7 GHz 256 GB | |
| HP EliteBook 850 G1-H5G44ET | |
| Lenovo ThinkPad S540 20B30059GE | |
| CPU Single 64Bit (sort by value) | |
| Asus Pro B551LG-CN009G | |
| Asus B551LA-CN018G | |
| Dell XPS 12 Haswell | |
| Apple MacBook Air 11 inch 2013-06 1.7 GHz 256 GB | |
| HP EliteBook 850 G1-H5G44ET | |
| Lenovo ThinkPad S540 20B30059GE | |
| Asus Pro B551LG-CN009G GeForce 840M, 4650U, Kingston SVP200S37A256G | HP EliteBook 850 G1-H5G44ET Radeon HD 8750M, 4600U, Intel SSD Pro 1500 Series SSDSC2BF180A4H | Lenovo ThinkPad S540 20B30059GE Radeon HD 8670M, 4200U, WDC WD10JPVX-08JC3T5 + Sandisk SSD U110 16GB | |
|---|---|---|---|
| PCMark 7 | 19% | -25% | |
| Score | 4176 | 5431 30% | 3021 -28% |
| Lightweight | 4585 | 5223 14% | 3620 -21% |
| Productivity | 3547 | 3929 11% | 2852 -20% |
| Creativity | 7115 | 8686 22% | 5066 -29% |
| PCMark 8 | |||
| Work Score Accelerated v2 | 3883 | 4908 26% | 4106 6% |
| Total Average (Program / Settings) | 23% /
21% | -10% /
-18% |
| PCMark 7 Score | 4176 points | |
| PCMark 8 Home Score Accelerated v2 | 2654 points | |
| PCMark 8 Creative Score Accelerated v2 | 3179 points | |
| PCMark 8 Work Score Accelerated v2 | 3883 points | |
Help | ||
| Asus Pro B551LG-CN009G GeForce 840M, 4650U, Kingston SVP200S37A256G | HP EliteBook 850 G1-H5G44ET Radeon HD 8750M, 4600U, Intel SSD Pro 1500 Series SSDSC2BF180A4H | Lenovo ThinkPad S540 20B30059GE Radeon HD 8670M, 4200U, WDC WD10JPVX-08JC3T5 + Sandisk SSD U110 16GB | |
|---|---|---|---|
| AS SSD | 54% | ||
| Seq Read | 214 | 454.6 112% | |
| 4K Read | 19.15 | 23.84 24% | |
| 4K-64 Read | 147 | 201.1 37% | |
| Score Read | 188 | 270 44% | |
| CrystalDiskMark 3.0 | 41% | -84% | |
| Read Seq | 217.4 | 426.5 96% | 99.3 -54% |
| Read 4k | 24.71 | 27.84 13% | 0.372 -98% |
| Read 4k QD32 | 145.2 | 164.7 13% | 0.794 -99% |
| Total Average (Program / Settings) | 48% /
48% | -84% /
-84% |
| Asus Pro B551LG-CN009G GeForce 840M, 4650U, Kingston SVP200S37A256G | HP EliteBook 850 G1-H5G44ET Radeon HD 8750M, 4600U, Intel SSD Pro 1500 Series SSDSC2BF180A4H | Lenovo ThinkPad S540 20B30059GE Radeon HD 8670M, 4200U, WDC WD10JPVX-08JC3T5 + Sandisk SSD U110 16GB | |
|---|---|---|---|
| 3DMark | -4% | -35% | |
| 1280x720 Cloud Gate Standard Graphics | 9429 | 8882 -6% | 4840 -49% |
| 1280x720 Cloud Gate Standard Physics | 2924 | 3127 7% | 2450 -16% |
| 1280x720 Cloud Gate Standard Score | 6309 | 6303 0% | 3977 -37% |
| 1920x1080 Fire Strike Graphics | 1605 | 1331 -17% | 829 -48% |
| 1920x1080 Fire Strike Physics | 4121 | 4218 2% | 3410 -17% |
| 1920x1080 Fire Strike Score | 1369 | 1241 -9% | 767 -44% |
| 3DMark Ice Storm Standard Score | 35857 points | |
| 3DMark Cloud Gate Standard Score | 6309 points | |
| 3DMark Fire Strike Score | 1369 points | |
Help | ||
| low | med. | high | ultra | |
|---|---|---|---|---|
| Anno 2070 (2011) | 120.3 | 62.5 | 39.3 | 19.5 |
| Max Payne 3 (2012) | 41.8 | 37.3 | 30.7 | |
| Medal of Honor: Warfighter (2012) | 66 | 45 | 36 | 13 |
| Call of Duty: Black Ops 2 (2012) | 73.3 | 58.5 | 39.7 | 26 |
| BioShock Infinite (2013) | 89.1 | 51.4 | 41.8 | 14.4 |
Noise Level
| Idle |
| 29.6 / 29.6 / 29.6 dB(A) |
| DVD |
| 36.2 / dB(A) |
| Load |
| 38.2 / 42.7 dB(A) |
 | ||
30 dB silent 40 dB(A) audible 50 dB(A) loud |
||
min: | ||
(±) The maximum temperature on the upper side is 40.7 °C / 105 F, compared to the average of 36.9 °C / 98 F, ranging from 21.1 to 71 °C for the class Multimedia.
(-) The bottom heats up to a maximum of 46 °C / 115 F, compared to the average of 39.2 °C / 103 F
(+) In idle usage, the average temperature for the upper side is 28.2 °C / 83 F, compared to the device average of 31.3 °C / 88 F.
(+) The palmrests and touchpad are cooler than skin temperature with a maximum of 27.3 °C / 81.1 F and are therefore cool to the touch.
(±) The average temperature of the palmrest area of similar devices was 28.8 °C / 83.8 F (+1.5 °C / 2.7 F).
| Off / Standby | |
| Idle | |
| Load |
|
Key:
min: | |
华硕的Asus Pro B551LG在“专业质量”这方面向我们提出了很多承诺,但从第一台测试机的表现来看,这些承诺都没有兑现。锐利的边角,一个坏掉的USB接口,不高的CPU性能和由于Nvidia Optimus驱动问题造成的Ice Storm测试分数过低,一块很慢的固态硬盘和不好用的数字键盘——问题都列出来还真是不少。根据与第二台测试机的对比,我们排除了其中的一些问题,不过有一部分仍然存在。
尽管如此,高质量的屏幕,坚固的机身,和出色的键盘质量,丰富的接口配备,不错的扬声器,和安全功能一样都是它不得不提的优势,这对于大多数商务用户来说都已足够,除非特别在意它过大的体积和重量。它的系统和显卡的性能可以满足大多最新游戏(包括大型游戏)的流畅运行要求。它功能的组合相当独特,这使得Asus Pro在竞争中占据了一个特别的角落,也使得它较高的价格有了更充分的理由。不过,第一个测试机的表现不佳使得我们在对它的印象中留了一丝遗憾。
注:本文是基于完整评测的缩减版本,阅读完整的英文评测,请点击这里。


