Notebookcheck Logo

Intel Graphics 4-Cores iGPU (Arc)

Intel Graphics 4-Core

配备 4 个内核的英特尔图形 iGPU 是基于 Xe LPG 架构(类似于专用 Arc GPU,但更注重效率)的集成显卡。它提供4 个 Xe 内核(64 个 Xe 向量引擎)、4 个光线跟踪单元、4 个采样器和 2 个像素后端。

与 H Meteor Lake CPU 中拥有 8 个内核的更强大变体相比,小型变体不能使用 Arc 名称。

iGPU 支持 DirectX 12 Ultimate(可能与桌面 Arc GPU 一样支持 DX 12_2)。图形处理器还支持 XeSS AI 超级采样。

Meteor Lake 的媒体引擎位于 SOC 芯片中,支持高达 8k60 10 位 HDR 的 MPEG2、AVC、VP9、HEVC 和 AV1 编码和解码。显示引擎也在 SoC 芯片中,支持 HDMI 2.1 和 DisplayPort 2.1 20G,最高支持 8K60 HDR。

Meteor Lake 芯片的 GPU 芯片在台积电以 5 纳米(5N 工艺)制造。

Arc LPG Series

Arc 8-Core 8 @ 2.3 GHz
Arc 7-Core 7 @ 2.2 GHz
Graphics 4-Core 4 @ 1.95 GHz
CodenameMeteor Lake iGPU
ArchitectureXe LPG
Pipelines4 - unified
Raytracing Cores4
Core Speed1950 (Boost) MHz
CacheL1: 768 KB
Shared Memoryno
APIDirectX 12_2, OpenGL 4.6, Vulkan 1.3
technology5 nm
DisplaysHDMI 2.1, DisplayPort 2.1 20G
Date of Announcement14.12.2023
CPU in Graphics 4-CoreGPU Base SpeedGPU Boost / Turbo
Intel Core Ultra 9 285K24 x 3200 MHz, 125 W? MHz? MHz
Intel Core Ultra 5 245K14 x 3600 MHz, 125 W? MHz1900 MHz
Intel Core Ultra 7 165U12 x 3800 MHz, 15 W? MHz2000 MHz
min. - max.? MHz1750 - 2000 MHz

Benchmarks

Performance Rating - 3DMark 11 + Fire Strike + Time Spy
2.3 pt (7%)
AMD Radeon HD 8180
0.06404 -97%
...
NVIDIA Quadro K5100M
2.12 -9%
AMD Radeon 660M
2.14 -9%
AMD Radeon HD 8970M
2.23 -5%
NVIDIA GeForce GTX 765M SLI
2.24 -4%
AMD Radeon RX 460 (Laptop)
2.26 -3%
2.27 -3%
2.27 -3%
NVIDIA GeForce GTX 780M
2.32 -1%
AMD Radeon R9 M290X
2.34 0%
Intel Graphics 4-Cores iGPU (Arc)
2.34
2.45 5%
NVIDIA GeForce GTX 1050 Max-Q
2.5 7%
2.58 10%
2.62 12%
2.68 15%
2.69 15%
2.71 16%
Intel Iris Xe MAX Graphics
2.8 20%
AMD Radeon RX 560X (Laptop)
2.8 20%
...
20.4 772%
max:
33.3 1323%
0%
100%
3DMark - 3DMark Time Spy Score
min: 1876     avg: 2111     median: 2152 (6%)     max: 2318 Points
3DMark - 3DMark Time Spy Graphics
min: 1668     avg: 1890     median: 1930 (5%)     max: 2075 Points
Intel UHD Graphics 605
113 -94%
...
1672 -12%
1690 -11%
1699 -10%
1724 -9%
Intel Iris Xe MAX Graphics
1735 -8%
AMD Radeon RX 560X (Laptop)
1788 -5%
1796 -5%
1810 -4%
NVIDIA T500 Laptop GPU
1814 -4%
Intel Graphics 4-Cores iGPU (Arc)
1890
1989 5%
2021 7%
NVIDIA Quadro P2000
2046 8%
NVIDIA Quadro P2000 Max-Q
2049 8%
AMD Radeon Pro WX Vega M GL
2062 9%
2070 10%
2116 12%
AMD Radeon Pro Vega 16
2198 16%
AMD Radeon 680M
2219 17%
...
19434 928%
max:
36259 1818%
0%
100%
3DMark - 3DMark Ice Storm Unlimited Graphics
min: 295187     avg: 302030     median: 302030 (30%)     max: 308872 Points
3DMark - 3DMark Ice Storm Extreme Graphics
min: 75102     avg: 97775     median: 97774.5 (11%)     max: 120447 Points
3DMark - 3DMark Cloud Gate Score
min: 19423     avg: 21871     median: 22016.5 (21%)     max: 24122 Points
3DMark - 3DMark Cloud Gate Graphics
min: 23935     avg: 28268     median: 29641 (7%)     max: 31234 Points
3DMark - 3DMark Fire Strike Standard Score
min: 3952     avg: 4782     median: 4975 (8%)     max: 5295 Points
3DMark - 3DMark Fire Strike Standard Graphics
min: 4284     avg: 5113     median: 5295 (6%)     max: 5554 Points
3DMark - 3DMark Ice Storm Graphics
min: 89439     avg: 123865     median: 123864 (14%)     max: 158290 Points
3DMark - 3DMark Wild Life Unlimited
14464 Points (7%)
3DMark - 3DMark Wild Life Extreme Unlimited
min: 3438     avg: 3560     median: 3559.5 (4%)     max: 3681 Points
3DMark - 3DMark Night Raid
min: 18070     avg: 19035     median: 19035 (18%)     max: 20000 Points
3DMark - 3DMark Night Raid Graphics Score
min: 21828     avg: 22686     median: 22686 (9%)     max: 23544 Points
3DMark 11 - 3DM11 Performance Score
min: 6340     avg: 7151     median: 7250.5 (9%)     max: 7632 Points
3DMark 11 - 3DM11 Performance GPU
min: 6007     avg: 6683     median: 6726 (6%)     max: 7109 Points
171.8 -97%
...
NVIDIA GeForce GTX 775M
6071 -9%
6074 -9%
6119 -8%
6142 -8%
AMD Radeon 660M
6332 -5%
6353 -5%
6407 -4%
6422 -4%
6638 -1%
Intel Graphics 4-Cores iGPU (Arc)
6683
6736 1%
AMD Radeon Pro 460
6749 1%
AMD Radeon R9 M290X
6817 2%
AMD Radeon R9 M390
6819 2%
NVIDIA Quadro K5100M
6894 3%
7042 5%
7061 6%
NVIDIA GeForce GTX 1050 Max-Q
7142 7%
AMD Radeon HD 8970M
7180 7%
...
59943 797%
max:
104201 1459%
0%
100%
Cinebench R15
Cinebench R15 OpenGL 64 Bit +
Cinebench R15 - Cinebench R15 OpenGL 64 Bit
min: 92.6     avg: 102     median: 103.5 (6%)     max: 112 fps
Cinebench R15 OpenGL Ref. Match 64 Bit +
Cinebench R15 - Cinebench R15 OpenGL Ref. Match 64 Bit
97.8 % (98%)
GFXBench - GFXBench 5.0 4K Aztec Ruins High Tier Offscreen
min: 16.8173     avg: 18.8     median: 18.8 (8%)     max: 20.7 fps
GFXBench - GFXBench 5.0 Aztec Ruins High Tier Offscreen
min: 37.3169     avg: 43.2     median: 43.2 (8%)     max: 49.1 fps
3.3 -92%
...
AMD Radeon RX Vega 7
26.8 -38%
27 -38%
NVIDIA Quadro P520
29.56 -32%
33.3 -23%
AMD Radeon RX 550X (Laptop)
33.4 -23%
AMD Radeon 660M
33.5 -22%
34.74 -20%
37.4 -13%
42.4 -2%
Intel Graphics 4-Cores iGPU (Arc)
43.21
44.4 3%
44.86 4%
45 4%
NVIDIA GeForce GTX 1050 Max-Q
48.1 11%
48.6 12%
NVIDIA GeForce GTX 1050 Ti Max-Q
49.5 15%
AMD Radeon 680M
52 20%
AMD Radeon RX 560X (Laptop)
52.4 21%
53.4 24%
...
536 1140%
0%
100%
GFXBench - GFXBench 5.0 Aztec Ruins Normal Tier Offscreen
min: 91.8253     avg: 110.7     median: 110.7 (8%)     max: 129.5 fps
GFXBench - GFXBench Car Chase Offscreen
min: 75.6254     avg: 82.6     median: 82.6 (9%)     max: 89.5 fps
GFXBench 3.1 - GFXBench Manhattan ES 3.1 Offscreen
min: 117.479     avg: 139.7     median: 139.7 (3%)     max: 161.9 fps
GFXBench 3.0 - GFXBench 3.0 Manhattan Offscreen
min: 173.822     avg: 215.2     median: 215.2 (13%)     max: 256.6 fps
GFXBench (DX / GLBenchmark) 2.7
GFXBench T-Rex HD Offscreen C24Z16 +
GFXBench (DX / GLBenchmark) 2.7 - GFXBench T-Rex HD Offscreen C24Z16
min: 370.774     avg: 418.6     median: 418.6 (3%)     max: 466.5 fps
Basemark GPU 1.2 - Basemark GPU 1.2 Vulkan Official Medium Offscreen 1080
min: 104.6     avg: 144.5     median: 104.6 (1%)     max: 315 fps
Basemark GPU 1.2 - Basemark GPU 1.2 Vulkan Official High Offscreen 2160
3.6 fps (1%)
Geekbench 6.3 - Geekbench 6.3 GPU OpenCL
min: 12919     avg: 16559     median: 16588.5 (5%)     max: 19056 points
Geekbench 6.3 - Geekbench 6.3 GPU Vulkan
min: 12449     avg: 17853     median: 18177.5 (5%)     max: 19957 points
Power Consumption - Furmark Stress Test Power Consumption - external Monitor *
min: 25.3     avg: 29.6     median: 29.2 (4%)     max: 38 Watt
05101520253035404550Tooltip
Power Consumption - The Witcher 3 Power Consumption - external Monitor *
min: 24.4     avg: 27.7     median: 26.8 (4%)     max: 32.2 Watt
05101520253035Tooltip
Power Consumption - Witcher 3 Power Consumption *
min: 27.4     avg: 32.3     median: 30.7 (7%)     max: 41.5 Watt
051015202530354045Tooltip
Power Consumption - Witcher 3 ultra Power Efficiency
min: 0.4313     avg: 0.5     median: 0.5 (43%)     max: 0.544 fps per Watt
Power Consumption - Cyberpunk 2077 Power Consumption 150cd *
min: 29.5     avg: 36.5     median: 37.8 (12%)     max: 40.5 Watt
05101520253035404550Tooltip
Power Consumption - Cyberpunk 2077 Power Consumption - external Monitor *
min: 31.8     avg: 36.5     median: 36.6 (5%)     max: 41.4 Watt
05101520253035404550Tooltip
Emissions Witcher 3 Fan Noise +
Emissions - Witcher 3 Fan Noise
min: 27.3     avg: 37.3     median: 37 (59%)     max: 44.9 dB(A)
- Range of benchmark values for this graphics card
red legend - Average benchmark values for this graphics card
* Smaller numbers mean a higher performance

Game Benchmarks

The following benchmarks stem from our benchmarks of review laptops. The performance depends on the used graphics memory, clock rate, processor, system settings, drivers, and operating systems. So the results don't have to be representative for all laptops with this GPU. For detailed information on the benchmark results, click on the fps number.

F1 24

F1 24

2024
low 1920x1080
36.3 39.2 40.6 ~ 39 fps    + Compare
med. 1920x1080
31.2 33.8 36.8 ~ 34 fps    + Compare
high 1920x1080
26.9  fps    + Compare
ultra 1920x1080
7.3  fps    + Compare
» With all tested laptops playable in detail settings low.
low 1920x1080
17.2 17.6 17.8 18.5 18.9 19.3 19.4 19.5 20.2 20.3 20.9 21.6 ~ 19 fps    + Compare
med. 1920x1080
13.8 14.2 15 15.1 15.3 15.8 15.9 16.1 16.5 16.7 16.9 17.6 ~ 16 fps    + Compare
high 1920x1080
11.9 11.9 12.4 12.7 12.8 12.8 13 13.7 13.7 14.3 14.4 14.9 ~ 13 fps    + Compare
ultra 1920x1080
10.3 10.6 10.8 11.1 11.2 11.3 11.7 12 12.2 12.5 12.7 13 ~ 12 fps    + Compare
» The benchmarks indicate that the game is not playable in the tested settings.
Additional Benchmarks
Low Preset (FSR off) 1280x720
31.7
32.5
32.8
29.1
26.9
27.7
28
27.8
28.7
25.6
29.4
30min Start Ultra Preset (FSR off) 1920x1080
10.2
9.3
10.1
8
11.6
11.2
8.7
low 1920x1080
14.7 15 15.4 16.2 16.4 17.7 17.8 18.6 18.8 21.5 ~ 17 fps    + Compare + 📈 Graph
med. 1920x1080
12.3 12.4 12.6 12.8 13.4 14.2 14.5 15.5 16.1 ~ 14 fps    + Compare + 📈 Graph
high 1920x1080
10.6 11 11 12 12.2 13.2 14.6 ~ 12 fps    + Compare + 📈 Graph
ultra 1920x1080
10.5 10.6 11.5 11.9 12.1 13.9 ~ 12 fps    + Compare + 📈 Graph
» The benchmarks indicate that the game is not playable in the tested settings.
Additional Benchmarks
Low Preset 1280x720
24.9
26
26.6
28.8
28.5
25.4
21.4
34.7
F1 23

F1 23

2023
low 1920x1080
40.1 43.8 ~ 42 fps    + Compare
med. 1920x1080
37.3 39.8 ~ 39 fps    + Compare
high 1920x1080
23.9 26 ~ 25 fps    + Compare
ultra 1920x1080
7.1  fps    + Compare
» With all tested laptops playable in detail settings med..
Additional Benchmarks
Ultra Low Preset TAA 1280x720
63.9
F1 22

F1 22

2022
low 1920x1080
39.9 41.7 43.3 43.8 44.4 46.3 46.6 ~ 44 fps    + Compare
med. 1920x1080
34.1 35.9 39.7 40.5 41.9 42 42 ~ 39 fps    + Compare
high 1920x1080
25 29.5 30.8 31 ~ 29 fps    + Compare
ultra 1920x1080
7 7.6 8 ~ 8 fps    + Compare
» With most tested laptops playable in detail settings med..
Additional Benchmarks
Ultra Low Preset 16xAF TAA 1280x720
77.2
63.7
63.9
60.6
72.5
71.3
73.1
low 1920x1080
24.1 27.2 27.6 29.9 30.2 30.8 ~ 28 fps    + Compare
med. 1920x1080
21.1 22.9 22.9 24 24.2 ~ 23 fps    + Compare
high 1920x1080
14.1 16.1 16.1 16.3 16.8 ~ 16 fps    + Compare
ultra 1920x1080
11.3 12.3 12.7 13.6 13.8 ~ 13 fps    + Compare
» The benchmarks indicate that the game is not playable in the tested settings.
Additional Benchmarks
Lowest Preset (DX12) 1280x720
61.8
57.5
54.8
49
51.3
50.7
50
Strange Brigade

Strange Brigade

2018
low 1280x720
73.7 85.6 107.2 111.2 115 117.1 118.1 118.4 120.4 121.1 123 ~ 110 fps    + Compare
med. 1920x1080
32.9 40.9 41 47 49.1 49.7 50 50 50.8 51.4 52.1 ~ 47 fps    + Compare
high 1920x1080
26.6 31.8 33.1 34.7 37.7 39.2 39.6 39.8 40 40.7 41.9 ~ 37 fps    + Compare
ultra 1920x1080
22.9 25.1 25.9 26.6 28.4 29.9 30.2 30.3 31.2 32 33.3 ~ 29 fps    + Compare
» With most tested laptops playable in detail settings high.
Far Cry 5

Far Cry 5

2018
low 1280x720
33 38 38 41 45 46 47 48 48 50 51 ~ 44 fps    + Compare + 📈 Graph
med. 1920x1080
20 20 23 24 24 25 25 25 25 28 28 ~ 24 fps    + Compare + 📈 Graph
high 1920x1080
19 19 21 22 23 23 23 24 25 25 26 ~ 23 fps    + Compare + 📈 Graph
ultra 1920x1080
18 18 18 21 21 21 21 22 22 23 23 ~ 21 fps    + Compare + 📈 Graph
» With most tested laptops playable in detail settings low.
Additional Benchmarks
Low Preset TAA 1920x1080
26
28
low 1280x720
31.2 33.8 34.7 35 35.6 35.7 36.2 36.5 36.8 37.6 37.6 37.8 40 41.2 ~ 36 fps    + Compare
med. 1920x1080
25.2 25.9 27.3 28 28.2 28.2 28.3 28.4 28.9 29.7 30.1 30.3 31.4 31.9 ~ 29 fps    + Compare
high 1920x1080
20.8 22.8 23.2 23.3 23.4 23.4 23.6 23.6 24.1 24.8 25.3 25.4 26 27.1 ~ 24 fps    + Compare
» With most tested laptops playable in detail settings low.
low 1280x720
33.7 35.4 35.7 36.2 36.9 37.4 37.6 38.5 42.3 42.7 46.6 48.1 48.2 48.6 ~ 41 fps    + Compare
med. 1920x1080
17.1 19.5 19.7 20.8 22 23 23.4 23.6 24.1 24.2 24.3 25.2 25.9 26 ~ 23 fps    + Compare
high 1920x1080
12.2 14.6 14.7 15.7 16.3 16.3 16.7 17.3 17.4 17.5 18.2 18.2 18.5 19.1 ~ 17 fps    + Compare
» With most tested laptops playable in detail settings low.
low 1280x720
74.1 75.2 82.6 85 89.9 90.4 91.4 91.8 92.5 92.8 92.9 93.8 96.2 101.9 ~ 89 fps    + Compare
med. 1366x768
43.7 48.6 52.2 52.4 53.9 54.3 57.7 58.9 59.7 60.7 67.3 69 72.2 72.7 ~ 59 fps    + Compare
high 1920x1080
48.4 49.7 50.7 51.4 52.8 52.9 57.2 60.4 61 61.1 61.6 61.6 61.6 62.2 ~ 57 fps    + Compare
ultra 1920x1080
45.5 47.9 48 48 50 54 54.2 56 56.6 56.9 57.3 57.6 58.3 60.4 ~ 54 fps    + Compare
» With all tested laptops playable in detail settings ultra.
low 1024x768
66.5 79.6 86.8 88.3 91 92.1 92.1 92.9 ~ 86 fps    + Compare + 📈 Graph
med. 1366x768
41.3 49.6 51.1 52.2 56.2 57 57 57 ~ 53 fps    + Compare + 📈 Graph
high 1920x1080
21.4 28 28.4 28.5 31 32.4 32.4 33.3 ~ 29 fps    + Compare + 📈 Graph
ultra 1920x1080
11.9 14.9 15 15.5 16.3 17.6 17.9 17.9 ~ 16 fps    + Compare + 📈 Graph
» With all tested laptops playable in detail settings med..
GTA V

GTA V

2015
low 1024x768
94 102.8 103.9 109.9 114.3 135.5 139.1 142.9 ~ 118 fps    + Compare
med. 1366x768
91.1 91.7 95.7 109 109.3 110.4 115.9 123.9 ~ 106 fps    + Compare
high 1920x1080
17 17.6 21.4 21.6 21.9 22.1 22.2 24.2 ~ 21 fps    + Compare
ultra 1920x1080
6.9 7.6 8.8 8.8 8.9 8.9 9 9.5 ~ 9 fps    + Compare
» With all tested laptops playable in detail settings med..
Additional Benchmarks
Normal/Off 4xAF 1920x1080
83.7
61.9
90.1
88.1
65.6
75.8
70.1
Lowest Settings possible 1920x1080
91.5
66.9
88.6
102.2
76.5
85.3
77.3
lowmed.highultraQHD4K
F1 24393426.97.33
Cyberpunk 2077 2.1 Phantom Liberty19161312
Baldur's Gate 317141212
F1 234239257.14
F1 224439298
Tiny Tina's Wonderlands28231613
Strange Brigade110473729
Far Cry 544242321
X-Plane 11.11362924
Final Fantasy XV Benchmark412317
Dota 2 Reborn89595754
The Witcher 386532916
GTA V118106219
< 30 fps
< 60 fps
< 120 fps
≥ 120 fps
3
6
4
6
6
1
11
2

10
1


For more games that might be playable and a list of all games and graphics cards visit our Gaming List

v1.28
log 20. 19:12:32

#0 ran 0s before starting gpusingle class +0s ... 0s

#1 no ids found in url (should be separated by "_") +0s ... 0s

#2 not redirecting to Ajax server +0s ... 0s

#3 did not recreate cache, as it is less than 5 days old! Created at Tue, 19 Nov 2024 05:32:27 +0100 +0.001s ... 0.001s

#4 no comparison url found in template nbc.compare_page_1 needed +0.024s ... 0.025s

#5 no comparison url found in template nbc.compare_page_1 needed +0s ... 0.025s

#6 composed specs +0s ... 0.025s

#7 did output specs +0s ... 0.025s

#8 start showIntegratedCPUs +0s ... 0.025s

#9 getting avg benchmarks for device 12259 +0.027s ... 0.052s

#10 got single benchmarks 12259 +0.068s ... 0.12s

#11 got avg benchmarks for devices +0s ... 0.12s

#12 min, max, avg, median took s +0.644s ... 0.764s

#13 before gaming benchmark output +0s ... 0.765s

#14 Got 429 rows for game benchmarks. +0.064s ... 0.829s

#15 composed SQL query for gamebenchmarks +0s ... 0.829s

#16 got data and put it in $dataArray +0.009s ... 0.838s

#17 benchmarks composed for output. +0.587s ... 1.425s

#18 no comparison url found in template nbc.compare_page_1 needed +0.004s ... 1.429s

#19 return log +0s ... 1.429s

Notebook reviews with Intel Graphics 4-Cores iGPU (Arc) graphics card

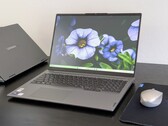
戴尔Latitude 7450 2 合 1 评测

戴尔Latitude 7450 二合一笔记本电脑评测:多功能商务可折叠笔记本电脑,在大多数方面都表现出色

戴尔Latitude 7450 2 合 1 机型采用英特尔酷睿至强 7 165U vPro 处理器,性能出色,同时还为商务人士的移动办公量身定制了一系列强大的功能。戴尔甚至还提供了一系列强大的工具,让 IT 管理人员满意而归。不过,与上一代产品相比,戴尔的改进是循序渐进的,它的竞争对手,尤其是新的联想 ThinkPad...
Intel Core Ultra 7 165U | Intel Graphics 4-Cores iGPU (Arc) | 14.00" | 1.5 kg
Core Ultra 7 164U 性能首次亮相:戴尔Latitude 7350 可拆卸式评测

Core Ultra 7 164U 性能首次亮相:戴尔Latitude 7350 可拆卸式评测

最新的Latitude 7350 2 合 1 为微软 Surface Pro 9 带来了最强劲的竞争对手。戴尔系统有很多优点,包括不常见的酷睿Ultra U7处理器,但它并不是我们所期待的全垒打。...
Intel Core Ultra 7 164U | Intel Graphics 4-Cores iGPU (Arc) | 13.00" | 865 g
联想 ThinkPad T14 第 5 代英特尔笔记本电脑评测:可升级内存回归 T 系列

联想 ThinkPad T14 第 5 代英特尔笔记本电脑评测:可升级内存回归 T 系列

多年来,T 系列 ThinkPad 的模块化程度似乎越来越低。现在这种情况结束了,联想 ThinkPad T14 Gen 5 恢复了两个 SO-DIMM 插槽的设计。尽管流星湖 U 可以更快一些,但它仍是一款出色的办公笔记本电脑。...
Intel Core Ultra 7 155U | Intel Graphics 4-Cores iGPU (Arc) | 14.00" | 1.5 kg
联想 Yoga 7 二合一 14IML9 可折叠机评测:低于 700 美元的经典之作

联想 Yoga 7 二合一 14IML9 可折叠机评测:低于 700 美元的经典之作

Yoga 7 2-in-1 14 配备了现代人工智能就绪处理器等众多功能,性价比很高。不过,如果配置更高端的酷睿 H 和 OLED 选项,价格就会开始飙升。...
Intel Core Ultra 5 125U | Intel Graphics 4-Cores iGPU (Arc) | 14.00" | 1.6 kg
联想 ThinkPad T14s 第 5 代笔记本电脑评测:配备英特尔酷睿 Ultra 处理器的高端 T-ThinkPad

联想 ThinkPad T14s 第 5 代笔记本电脑评测:配备英特尔酷睿 Ultra 处理器的高端 T-ThinkPad

联想ThinkPad T14s Gen 5不仅带来了酷睿Ultra系列1(也称作流星湖)的更新,而且这款轻薄的ThinkPad T系列设备也进行了大刀阔斧的重新设计。不过,联想很久以来第一次取消了这款商务笔记本电脑的 AMD 选项。...
Intel Core Ultra 5 125U | Intel Graphics 4-Cores iGPU (Arc) | 14.00" | 1.3 kg

Dell Latitude 13 7350: Intel Core Ultra 5 135U, 13.30", 1.1 kg
  Review » Core Ultra 5 135U 性能首次亮相:戴尔Latitude 13 7350 笔记本电脑评测

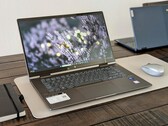
HP Envy x360 2-in-1 14-fc0078TU: Intel Core Ultra 5 125U, 14.00", 1.4 kg
  Review » 惠普 Envy x360 2 合 1 14 (2024) 笔记本电脑评测:近乎顶级的可折叠体验,让我们欲罢不能

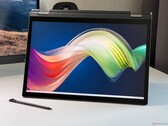
Lenovo ThinkPad X1 2in1 G9 21KE004AGE: Intel Core Ultra 7 165U, 14.00", 1.3 kg
  Review » 联想ThinkPad X1 2in1 G9评测--配备120Hz OLED且无TrackPoint按键的高端商务可折叠电脑

Lenovo ThinkBook 14 2-in-1 G4 IML: Intel Core Ultra 5 125U, 14.00", 1.6 kg
  Review » 联想 ThinkBook 14 二合一 G4 IML 评测:流星湖-U带来全新时尚外观

Lenovo Yoga 7 2-in-1 16IML9: Intel Core Ultra 5 125U, 16.00", 2.1 kg
  Review » Core Ultra 5 125U 性能首次亮相:联想 Yoga 7 二合一 16IML9 可折叠机评测

Lenovo Yoga Book 9 13IMU9: Intel Core Ultra 7 155U, 13.30", 1.4 kg
  Review » 联想 Yoga Book 9 13IMU9 二合一双屏幕评测:酷睿 7 155U 和 Arc 4 喜忧参半

Dell Latitude 9450 2-in-1: Intel Core Ultra 7 165U, 14.00", 1.6 kg
  Review » Core Ultra 7 165U 性能首次亮相:戴尔Latitude 9450 2 合 1 评测

HP Probook 440 G11: Intel Core Ultra 5 125U, 14.00", 1.4 kg
  External Review » HP Probook 440 G11

HP Pavilion 16-af0000ng: Intel Core Ultra 5 125U, 16.00", 1.8 kg
  External Review » HP Pavilion 16-af0000ng

HP EliteBook 830 G11: Intel Core Ultra 7 155U, 13.30", 1.3 kg
  External Review » HP EliteBook 830 G11

HP EliteBook 840 G11: Intel Core Ultra 7 155U, 14.00", 1.4 kg
  External Review » HP EliteBook 840 G11

HP EliteBook 660 G11: Intel Core Ultra 7 155U, 16.00", 1.7 kg
  External Review » HP EliteBook 660 G11

Lenovo ThinkPad T14 G5, Ultra 5 125U: Intel Core Ultra 5 125U, 14.00", 1.4 kg
  External Review » Lenovo ThinkPad T14 G5, Ultra 5 125U

Lenovo ThinkPad X12 Detachable G2: Intel Core Ultra 5 134U, 12.30", 1.1 kg
  External Review » Lenovo ThinkPad X12 Detachable G2

Acer TravelMate P4 Spin 14 TMP414RN-54: Intel Core Ultra 5 125U, 14.00", 1.5 kg
  External Review » Acer TravelMate P4 Spin 14 TMP414RN-54

Lenovo ThinkPad T16 Gen 3 21MN005XGE: Intel Core Ultra 5 125U, 16.00", 2 kg
  External Review » Lenovo ThinkPad T16 Gen 3 21MN005XGE

Lenovo ThinkBook 14 G7 IML, Ultra 5 125U: Intel Core Ultra 5 125U, 14.00", 1.4 kg
  External Review » Lenovo ThinkBook 14 G7 IML, Ultra 5 125U

HP ProBook 460 G11: Intel Core Ultra 5 125U, 16.00", 1.7 kg
  External Review » HP ProBook 460 G11

Lenovo ThinkPad L14 G5: Intel Core Ultra 7 155U, 14.00", 1.4 kg
  External Review » Lenovo ThinkPad L14 G5

HP EliteBook 860 G11: Intel Core Ultra 7 155U, 16.00", 1.7 kg
  External Review » HP EliteBook 860 G11

Acer Swift Lite 14 AI SFL14-51M: Intel Core Ultra 7 155U, 14.00", 1.3 kg
  External Review » Acer Swift Lite 14 AI SFL14-51M

Dell Latitude 7450 2-in-1: Intel Core Ultra 7 155U, 14.00", 1.1 kg
  External Review » Dell Latitude 7450 2-in-1

Asus ExpertBook CX5403, Core 5 125U: Intel Core Ultra 5 125U, 14.00", 1.4 kg
  External Review » Asus ExpertBook CX5403, Core 5 125U

Lenovo ThinkBook 14 2-in-1 G4 IML, Ultra 7 155U: Intel Core Ultra 7 155U, 14.00", 1.6 kg
  External Review » Lenovo ThinkBook 14 2-in-1 G4 IML, Ultra 7 155U

Lenovo ThinkPad L16 G1, Ultra 5 125U: Intel Core Ultra 5 125U, 16.00", 1.8 kg
  External Review » Lenovo ThinkPad L16 G1, Ultra 5 125U

HP Pavilion 16-af0000: Intel Core Ultra 7 155U, 16.00", 1.8 kg
  External Review » HP Pavilion 16-af0000

Asus ExpertBook B5404CMA: Intel Core Ultra 7 155U, 14.00", 1.4 kg
  External Review » Asus ExpertBook B5404CMA

Asus Zenbook S 13 UX5304MA: Intel Core Ultra 7 155U, 13.30", 1 kg
  External Review » Asus Zenbook S 13 UX5304MA

Lenovo ThinkPad X13 2-in-1 G5: Intel Core Ultra 7 155U, 13.30", 1.3 kg
  External Review » Lenovo ThinkPad X13 2-in-1 G5

Lenovo ThinkPad T14 G5 21ML005JGE: Intel Core Ultra 7 155U, 14.00", 1.5 kg
  External Review » Lenovo ThinkPad T14 G5 21ML005JGE

Dell Latitude 5450: Intel Core Ultra 7 155U, 14.00", 1.4 kg
  External Review » Dell Latitude 5450

Dell Latitude 5550: Intel Core Ultra 7 155U, 15.60", 1.6 kg
  External Review » Dell Latitude 5550

Dell Latitude 9450 2-in-1: Intel Core Ultra 7 165U, 14.00", 1.6 kg
  External Review » Dell Latitude 9450 2-in-1

Asus ExpertBook CX5403: Intel Core Ultra 7 155U, 14.00", 1.4 kg
  External Review » Asus ExpertBook CX5403

Dell Latitude 7350 Detachable 2024: Intel Core Ultra 7 164U, 13.30", 0.9 kg
  External Review » Dell Latitude 7350 Detachable 2024

Dell Latitude 13 7350, Ultra 7 165U: Intel Core Ultra 7 165U, 13.30", 1.3 kg
  External Review » Dell Latitude 13 7350, Ultra 7 165U

Lenovo ThinkBook 14 2-in-1 G4 IML: Intel Core Ultra 5 125U, 14.00", 1.6 kg
  External Review » Lenovo ThinkBook 14 2-in-1 G4 IML

Acer Aspire Vero AV16-51P, Ultra 5 125U: Intel Core Ultra 5 125U, 16.00", 1.8 kg
  External Review » Acer Aspire Vero AV16-51P, Ultra 5 125U

Dell Latitude 7450: Intel Core Ultra 7 165U, 14.00", 1.5 kg
  External Review » Dell Latitude 7450

Acer Chromebook Plus Spin 714-1H: Intel Core Ultra 5 125U, 14.00", 1.5 kg
  External Review » Acer Chromebook Plus Spin 714-1H

Dell Latitude 13 7350: Intel Core Ultra 5 135U, 13.30", 1.1 kg
  External Review » Dell Latitude 13 7350

Lenovo ThinkPad X1 2in1 G9 21KE004AGE: Intel Core Ultra 7 165U, 14.00", 1.3 kg
  External Review » Lenovo ThinkPad X1 2in1 G9 21KE004AGE

HP Envy x360 14-fc: Intel Core Ultra 7 155U, 14.00", 1.4 kg
  External Review » HP Envy x360 14-fc

Asus ZenBook S13 OLED UX5304MA: Intel Core Ultra 7 155U, 13.30", 1 kg
  External Review » Asus ZenBook S13 OLED UX5304MA

Lenovo Yoga 7 16IML9: Intel Core Ultra 5 125U, 16.00", 2 kg
  External Review » Lenovo Yoga 7 16IML9

Microsoft Surface Pro 10: Intel Core Ultra 5 135U, 13.00", 0.9 kg
  External Review » Microsoft Surface Pro 10

Lenovo Yoga Book 9 13IMU9: Intel Core Ultra 7 155U, 13.30", 1.4 kg
  External Review » Lenovo Yoga Book 9 13IMU9

HP Envy x360 14-fc0000: Intel Core Ultra 5 125U, 14.00", 1.4 kg
  External Review » HP Envy x360 14-fc0000

Lenovo ThinkBook 14 IML G4: Intel Core Ultra 5 125U, 14.00", 1.6 kg
  External Review » Lenovo ThinkBook 14 IML G4

Acer Aspire Vero AV16-51P: Intel Core Ultra 7 155U, 16.00", 1.8 kg
  External Review » Acer Aspire Vero AV16-51P

Lenovo ThinkPad T14 G5 21ML005JGE: Intel Core Ultra 7 155U, 14.00", 1.5 kg
   » 联想 ThinkPad T14 G5:近乎完美的商务笔记本电脑

Please share our article, every link counts!
Mail Logo

» Comparison of GPUs
Detailed list of all laptop GPUs sorted by class and performance.

» Benchmark List
Sort and restrict laptop GPUs based on performance in synthetic benchmarks.

» Notebook Gaming List
Playable games for each graphics card and their average FPS results.

Class 1

Class 2

M4 32-core GPU *
M1 Max 32-Core GPU *
GeForce RTX 2070 Super Mobile
M1 Max 24-Core GPU *
Quadro RTX 5000 Max-Q
Radeon RX 5700M *
GeForce GTX 1080 Mobile
Quadro RTX 4000 (Laptop)
M1 Pro 16-Core GPU *
Radeon PRO W6600M *
GeForce RTX 2070 Super Max-Q
Quadro RTX 4000 Max-Q *
M1 Pro 14-Core GPU *
Quadro P5200
Quadro RTX 3000 Max-Q *
Quadro P4200
Quadro P5000 Max-Q *
GeForce GTX 980 (Laptop)
Quadro P4000
Quadro P4000 Max-Q
Quadro P3200
Radeon RX 580X (Laptop) *
Radeon RX 580 (Laptop)
Radeon Pro 5300M
Radeon RX 5300M
Quadro P3000 Max-Q *
Quadro T2000 Max-Q *
Radeon Pro WX 7100 *
Radeon RX 570X (Laptop) *

Class 3

Radeon RX 570 (Laptop) *
Radeon RX 470 (Laptop) *
Quadro T1000 Max-Q *
Vega M GH
Quadro M5000M
GeForce GTX 1050 Ti Mobile
Radeon 680M
Quadro P2000
Quadro P2000 Max-Q
Quadro M4000M
T500 Laptop GPU *
Radeon R9 M395X
GeForce GTX 1050 Ti Max-Q *
Radeon Pro Vega 16
WX Vega M GL
Radeon R9 M485X
Quadro M3000M
FirePro W7170M
Radeon R9 M395
GeForce GTX 1050 Max-Q *
Radeon 660M
Radeon Pro WX 4150 *
Radeon RX 560X (Laptop)
Radeon RX 560 (Laptop)
Radeon RX 460 (Laptop)
Quadro P1000
Radeon R9 M390
Xe MAX
Radeon Pro 560X
Radeon Pro 560
Radeon Pro 460
Radeon Pro WX 4130 *
GeForce GTX 960M
Quadro P620 *
Radeon RX 550X (Laptop)
Radeon Pro WX 3200 *
Radeon Pro 555X
Radeon Pro 555
Radeon Pro 455
Quadro P600
Quadro M2000M
Radeon RX 540X *
Radeon Pro WX 2100 *
Radeon Pro WX 3100 *
GeForce GTX 950M
Radeon Pro 450
Radeon 630
Radeon 540X *
Radeon R9 M385X
Quadro P520
Quadro M1000M
GeForce 945M
Quadro P500 *
Iris Plus Graphics G7 (Ice Lake 64 EU) *
Vega 10 *
Iris Pro Graphics 580
FirePro W5170M *
Radeon R9 M370X
Vega 9
FirePro W5130M
UHD Graphics Xe G4 48EUs *
UHD Graphics 32EUs
UHD Graphics Xe 32EUs (Tiger Lake-H) *
UHD Graphics 750
UHD Graphics 730
Vega 7
Radeon R7 M465
Iris Pro Graphics 6200
Vega 8
GeForce 940M
Iris Plus Graphics G4 (Ice Lake 48 EU)
Quadro M600M
FirePro W4190M
Radeon R9 M375
Radeon R7 M445
Iris Plus Graphics 650
Iris Graphics 550
Radeon 625
Vega 6 *
Iris Plus Graphics 640
Iris Graphics 540
UHD Graphics 24EUs (Alder Lake-N) *
Radeon R7 M360
GeForce 920M
Radeon 620
Radeon R7 M340
Radeon 610
Radeon 610M *
Vega 6 *
UHD Graphics G1 (Ice Lake 32 EU)
UHD Graphics Xe 16EUs (Tiger Lake-H) *
HD Graphics 530
Radeon R5 (Bristol Ridge)
Adreno 690 *
Adreno 685 *
Adreno 680 *
Radeon R5 M330
GeForce 910M
HD Graphics 520

Class 4

Radeon R5 M320 *
Radeon R5 M315 *
Radeon R5 M420 *
Vega 2 *
UHD Graphics 617
UHD Graphics 615
HD Graphics 515
UHD Graphics 610
HD Graphics 510
UHD Graphics 605
Radeon R4 (Stoney Ridge)
Radeon R2 (Stoney Ridge)
VideoCore VII *
UHD Graphics 600
HD Graphics (Braswell)

* Approximate position of the graphics adapter