Notebookcheck Logo

NVIDIA GeForce GT 620M

NVIDIA GeForce GT 620M

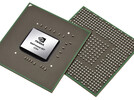
NVIDIA GeForce GT620M是一款入门级的DirectX 11兼容图形卡,宣布在2012年第一季度的笔记本电脑。可以根据其核心的40nm GF108芯片(类似的GeForce GT 525M)的新的功耗优化的28nm GF117芯片,64位或128位的DDR3内存。这两种架构仍然直接产生的Fermi一代。应当指出的GT620M的28nm版本不提供专用的图形端口,因此只能用于结合与Optimus。架构GF117的基础上优化的GF108费米芯片(GeForce®(精视™)GT 540M),并提供96个着色器,16个TMUs和4个ROPs。每个着色器核心时钟的两倍快,其余的图形芯片技术,这种技术被称为热的时钟。 GT 435M GPU(图形处理器)的页面上可以找到更详细的信息费米。同样性能的128位版本的GeForce GT620M(涡轮增压)执行旧的GeForce GT 540M,因为它们具有相似的时钟速率和核心架构。因此,现代和要求苛刻的游戏在中低设置在1366×768像素的分辨率播放。传闻中的64位版本可能会受到影响,减少带宽,并提供速度较慢的性能比较。拥有的着色器核心(也称为CUDA核心),可用于通用计算的API,CUDA,DirectCompute的2.1和OpenCL。 PhysX是理论上的可能,但GT620M是现代游戏的PhysX和3D渲染速度太慢,处理。根据NVIDIA的3D Vision不支持。 Nvidia宣称的Geforce GT620M的功耗应低于由于改进的效率的GF117架构GeForce GT 525M独立。

GeForce GT 600M Series

GeForce GT 650M SLI 768 @ 0.79 - 0.84 GHz2x 128 Bit @ 4000 MHz
GeForce GT 650M 384 @ 0.74 - 0.9 GHz128 Bit @ 1800 - 4000 MHz
GeForce GT 645M 384 @ 0.71 GHz128 Bit @ 1800 MHz
GeForce GT 640M 384 @ 0.63 - 0.65 GHz128 Bit @ 1800 - 4000 MHz
GeForce GT 640M LE 384 @ 0.5 GHz128 Bit @ 1800 - 4000 MHz
GeForce GT 635M 144 @ 0.66 - 0.75 GHz128/192 Bit @ 1800 MHz
GeForce GT 630M 96 @ 0.67 GHz128 Bit @ 1800 MHz
GeForce GT 625M 96 @ 0.63 GHz64 Bit @ 1800 MHz
GeForce GT 620M 96 @ 0.63 - 0.72 GHz64 / 128 Bit @ 1800 MHz
CodenameN13P-GLP / N13M-GS
ArchitectureFermi
Pipelines96 - unified
Core Speed625 - 715 (Boost) MHz
Shader Speed1250 MHz
Memory Speed1800 MHz
Memory Bus Width64 / 128 Bit
Memory TypeDDR3
Max. Amount of Memory1024 MB
Shared Memoryno
APIDirectX 11, Shader 5.0
technology40 nm
FeaturesPhysX, Verde Drivers, CUDA, Play, Optimus
Notebook Sizemedium sized
Date of Announcement22.03.2012

Benchmarks

Performance Rating - 3DMark 11 + Fire Strike + Time Spy
0.3 pt (1%)
AMD Radeon HD 8180
0.06605 -80%
...
AMD Radeon HD 7640G + HD 7610M Dual Graphics
0.302 -10%
0.302 -10%
Intel UHD Graphics 610
0.3022 -10%
Intel HD Graphics 515
0.315 -6%
0.3207 -5%
Intel HD Graphics 5000
0.3259 -3%
0.3262 -3%
0.3275 -3%
0.3325 -1%
NVIDIA GeForce GT 620M
0.336
NVIDIA Quadro K610M
0.3442 2%
0.3501 4%
0.351 4%
AMD Radeon R5 M230
0.3512 5%
0.3517 5%
AMD Radeon HD 6620G + HD 7670M Dual Graphics
0.354 5%
0.3599 7%
AMD Radeon HD 8550G
0.3608 7%
Intel HD Graphics 520
0.366 9%
...
21.1 6180%
max:
33.3 9811%
0%
100%
3DMark - 3DMark Cloud Gate Score
min: 3908     avg: 4023     median: 4022.5 (4%)     max: 4137 Points
3DMark - 3DMark Cloud Gate Graphics
min: 5261     avg: 5269     median: 5269 (1%)     max: 5277 Points
3DMark - 3DMark Fire Strike Standard Score
min: 695     avg: 696     median: 696 (1%)     max: 697 Points
3DMark - 3DMark Fire Strike Standard Graphics
min: 734     avg: 738     median: 737.5 (1%)     max: 741 Points
3DMark - 3DMark Ice Storm Graphics
min: 28021     avg: 47802     median: 55489 (7%)     max: 59895 Points
3DMark 11 - 3DM11 Performance Score
min: 793     avg: 1031     median: 1041.5 (1%)     max: 1145 Points
3DMark 11 - 3DM11 Performance GPU
min: 697     avg: 924     median: 933.5 (1%)     max: 1032 Points
3DMark Vantage
3DM Vant. Perf. total +
3DMark Vantage - 3DM Vant. Perf. total
min: 3550     avg: 4131     median: 4219 (1%)     max: 4464 Points
3DM Vant. Perf. GPU no PhysX +
3DMark Vantage - 3DM Vant. Perf. GPU no PhysX
min: 3205     avg: 3610     median: 3675.5 (2%)     max: 3898 Points
ATI Radeon HD 3200
62 -98%
...
NVIDIA GeForce GTS 160M
3374 -7%
Intel UHD Graphics 610
3375 -7%
3414 -5%
ATI Mobility Radeon HD 3870
3463 -4%
3509 -3%
3538 -2%
3544 -2%
NVIDIA Quadro K610M
3592 0%
3600 0%
NVIDIA GeForce GT 620M
3610
Intel HD Graphics 5000
3639 1%
3647 1%
3677 2%
3679 2%
NVIDIA GeForce 9800M GTS
3700 2%
NVIDIA GeForce 9800M GT
3725 3%
AMD Radeon HD 8550G
3741 4%
3750 4%
3752 4%
...
132443 3569%
max:
170928 4635%
0%
100%
3DMark 03 - 3DMark 03 - Standard
19622 Points (10%)
3DMark 05 - 3DMark 05 - Standard
min: 13823     avg: 14377     median: 14376.5 (16%)     max: 14930 Points
Intel Graphics Media Accelerator (GMA) 500
133.4 -99%
...
NVIDIA Quadro FX 3600M
13950 -3%
NVIDIA GeForce GT 720M
13952 -3%
14036 -2%
14084 -2%
NVIDIA GeForce 8700M GT SLI
14111 -2%
14205 -1%
14211 -1%
NVIDIA Quadro FX 2700M
14224 -1%
14352 0%
NVIDIA GeForce GT 620M
14377
14502 1%
NVIDIA GeForce GTX 260M SLI
14510 1%
NVIDIA GeForce 920M
14564 1%
NVIDIA GeForce GTS 250M
14733 2%
NVIDIA GeForce GTX 260M
14773 3%
14777 3%
AMD Radeon HD 6570M
14855 3%
NVIDIA GeForce 9800M GT
14869 3%
AMD Radeon R7 M260
14924 4%
...
61850 330%
max:
87172 506%
0%
100%
3DMark 06 3DMark 06 - Standard 1280x1024 +
3DMark 06
min: 4920     avg: 7010     median: 7462 (10%)     max: 8273 Points
Unigine Heaven 2.1 - Heaven 2.1 high
9.1 fps (2%)
0.6 -93%
...
7.7 -15%
AMD Radeon R2 (Stoney Ridge)
7.8 -14%
8.1 -11%
AMD Radeon R4 (Stoney Ridge)
8.35 -8%
8.7 -4%
8.867 -3%
8.9 -2%
Intel UHD Graphics 605
9 -1%
9 -1%
NVIDIA GeForce GT 620M
9.1
9.3 2%
9.585 5%
9.7 7%
AMD Radeon HD 8550G
9.8 8%
9.9 9%
10.05 10%
10.1 11%
10.1 11%
10.3 13%
...
532 5746%
0%
100%
SPECviewperf 11
specvp11 snx-01 +
SPECviewperf 11 - specvp11 snx-01
2.6 fps (2%)
specvp11 tcvis-02 +
specvp11 sw-02 +
SPECviewperf 11 - specvp11 sw-02
7.5 fps (6%)
specvp11 proe-05 +
specvp11 maya-03 +
SPECviewperf 11 - specvp11 maya-03
6.4 fps (5%)
specvp11 lightwave-01 +
SPECviewperf 11 - specvp11 lightwave-01
9.3 fps (10%)
specvp11 ensight-04 +
specvp11 catia-03 +
SPECviewperf 11 - specvp11 catia-03
4.1 fps (2%)
Windows 7 Experience Index - Win7 Gaming graphics
min: 6.5     avg: 6.6     median: 6.6 (84%)     max: 6.6 Points
Windows 7 Experience Index - Win7 Graphics
min: 4.6     avg: 5.7     median: 5.8 (73%)     max: 6.6 Points
Cinebench R10 Cinebench R10 Shading (32bit) +
Cinebench R10 - Cinebench R10 Shading (32bit)
min: 3304     avg: 4895     median: 4989 (4%)     max: 5683 points
Cinebench R11.5 Cinebench R11.5 OpenGL 64 Bit +
Cinebench R11.5 - Cinebench R11.5 OpenGL 64 Bit
min: 8.37     avg: 20.1     median: 22.2 (8%)     max: 27.41 fps
ComputeMark v2.1 - ComputeMark v2.1 Result
521 points (1%)
- Range of benchmark values for this graphics card
- Average benchmark values for this graphics card
* Smaller numbers mean a higher performance

Game Benchmarks

The following benchmarks stem from our benchmarks of review laptops. The performance depends on the used graphics memory, clock rate, processor, system settings, drivers, and operating systems. So the results don't have to be representative for all laptops with this GPU. For detailed information on the benchmark results, click on the fps number.

low 1024x768
35  fps    + Compare
med. 1366x768
25.8  fps    + Compare
high 1366x768
14.9  fps    + Compare
» The benchmarks indicate that the game is not playable in the tested settings.
low 1024x768
39  fps    + Compare
med. 1366x768
25  fps    + Compare
high 1366x768
18  fps    + Compare
» With all tested laptops playable in detail settings low.
low 1024x768
50 54.5 ~ 52 fps    + Compare
med. 1366x768
36 43.6 ~ 40 fps    + Compare
high 1366x768
31 38.4 ~ 35 fps    + Compare
» With all tested laptops playable in detail settings med..
low 1024x768
36  fps    + Compare
med. 1366x768
18  fps    + Compare
high 1366x768
16  fps    + Compare
» With all tested laptops playable in detail settings low.
Fifa 13

Fifa 13

2012
low 1024x768
140 152 171 195.9 ~ 165 fps    + Compare
med. 1366x768
93 113 137.5 139 159 ~ 128 fps    + Compare
high 1366x768
83 101.8 102 102 123 ~ 102 fps    + Compare
ultra 1920x1080
61.7 65 ~ 63 fps    + Compare
» With all tested laptops playable in detail settings ultra.
F1 2012

F1 2012

2012
low 1024x768
59  fps    + Compare
med. 1366x768
31  fps    + Compare
high 1366x768
29  fps    + Compare
» With all tested laptops playable in detail settings low.
low 1024x768
45 52.1 ~ 49 fps    + Compare
med. 1366x768
31 35.2 ~ 33 fps    + Compare
high 1366x768
21 29.6 ~ 25 fps    + Compare
» With all tested laptops playable in detail settings low.
low 1024x768
68 75.4 82.3 86 88.9 90.5 ~ 82 fps    + Compare
med. 1366x768
46 48.7 49 52.3 56.1 62.3 ~ 52 fps    + Compare
high 1366x768
29.1 34 36 43.1 48.1 53.1 ~ 41 fps    + Compare
ultra 1920x1080
21.1  fps    + Compare
» With most tested laptops playable in detail settings high.
low 1280x720
42 48 49 51.1 53 ~ 49 fps    + Compare
high 1366x768
29 31 33 35.9 36 ~ 33 fps    + Compare
ultra 1920x1080
21.8  fps    + Compare
» With all tested laptops playable in detail settings low.
Alan Wake

Alan Wake

2012
low 1024x768
31.7  fps    + Compare
med. 1366x768
16.5  fps    + Compare
» The benchmarks indicate that the game is not playable in the tested settings.
Anno 2070

Anno 2070

2011
low 1024x768
55.6 72 75.3 76.6 81.6 83 86.5 ~ 76 fps    + Compare
med. 1366x768
28.8 30.7 31.9 32.8 33 35.4 38 41.2 ~ 34 fps    + Compare
high 1366x768
19 19.7 19.7 20.7 21 21.4 22 25.2 ~ 21 fps    + Compare
ultra 1920x1080
9.9  fps    + Compare
» With all tested laptops playable in detail settings low.
low 1280x720
36.3 37.4 38 ~ 37 fps    + Compare
med. 1366x768
27.1 27.1 33 ~ 29 fps    + Compare
high 1366x768
18 19.5 25 ~ 21 fps    + Compare
» With all tested laptops playable in detail settings low.
low 1024x768
27.3 30.5 ~ 29 fps    + Compare
med. 1366x768
18.2 21 ~ 20 fps    + Compare
high 1366x768
14 16.3 ~ 15 fps    + Compare
» The benchmarks indicate that the game is not playable in the tested settings.
Fifa 12

Fifa 12

2011
low 800x600
245.3 288.5 ~ 267 fps    + Compare
med. 1024x768
84 154 160.8 ~ 133 fps    + Compare
high 1360x768
65.6 113.4 114.7 ~ 98 fps    + Compare
ultra 1920x1080
65.8  fps    + Compare
» With all tested laptops playable in detail settings ultra.
low 1024x768
95.3  fps    + Compare
high 1366x768
40.3  fps    + Compare
» With all tested laptops playable in detail settings high.
low 1024x768
136  fps    + Compare
med. 1360x768
46  fps    + Compare
high 1360x768
26  fps    + Compare
» With all tested laptops playable in detail settings med..
Risen

Risen

2009
med. 1024x768
33  fps    + Compare
high 1366x768
20.4  fps    + Compare
» The benchmarks indicate that the game is not playable in the tested settings.
lowmed.highultraQHD4K
Hitman: Absolution3525.814.9
Medal of Honor: Warfighter392518
Dishonored524035
World of Tanks v8361816
Fifa 1316512810263
F1 2012593129
Dirt Showdown493325
Diablo III82524121.12
Mass Effect 3493321.8
Alan Wake31.716.5
Anno 20707634219.87
The Elder Scrolls V: Skyrim372921
Battlefield 3292015
Fifa 122671339865.8
Deus Ex Human Revolution95.340.3
StarCraft 21364626
Risen3320.4
< 30 fps
< 60 fps
< 120 fps
≥ 120 fps
1
9
3
3
6
7

2
10
4
2
3

2


For more games that might be playable and a list of all games and graphics cards visit our Gaming List

v1.28
log 02. 01:00:02

#0 no ids found in url (should be separated by "_") +0s ... 0s

#1 not redirecting to Ajax server +0s ... 0s

#2 did not recreate cache, as it is less than 5 days old! Created at Mon, 01 Jul 2024 05:31:08 +0200 +0.001s ... 0.001s

#3 no comparison url found in template nbc.compare_page_1 needed +0.033s ... 0.034s

#4 no comparison url found in template nbc.compare_page_1 needed +0s ... 0.035s

#5 no comparison url found in template nbc.compare_page_1 needed +0s ... 0.035s

#6 no comparison url found in template nbc.compare_page_1 needed +0s ... 0.035s

#7 no comparison url found in template nbc.compare_page_1 needed +0s ... 0.035s

#8 no comparison url found in template nbc.compare_page_1 needed +0s ... 0.036s

#9 no comparison url found in template nbc.compare_page_1 needed +0s ... 0.036s

#10 no comparison url found in template nbc.compare_page_1 needed +0s ... 0.036s

#11 composed specs +0s ... 0.036s

#12 did output specs +0s ... 0.036s

#13 start showIntegratedCPUs +0s ... 0.036s

#14 getting avg benchmarks for device 2989 +0.029s ... 0.066s

#15 got single benchmarks 2989 +0.035s ... 0.1s

#16 got avg benchmarks for devices +0s ... 0.1s

#17 min, max, avg, median took s +0.532s ... 0.632s

#18 before gaming benchmark output +0s ... 0.632s

#19 Got 165 rows for game benchmarks. +0.012s ... 0.644s

#20 composed SQL query for gamebenchmarks +0s ... 0.644s

#21 got data and put it in $dataArray +0.013s ... 0.657s

#22 benchmarks composed for output. +0.558s ... 1.215s

#23 no comparison url found in template nbc.compare_page_1 needed +0.003s ... 1.218s

#24 return log +0s ... 1.218s

Notebook reviews with NVIDIA GeForce GT 620M graphics card


宏碁Aspire E1-571G笔记本测评

又好又便宜? 入门级的笔记本电脑约500欧元(约$651),可以发现一毛钱一打。宏碁有一个有趣的提议,采用了酷睿i3和独立显卡。阅读是否宏碁Aspire E1-571G是在我们的测试中同样有吸引力。...
Intel Core i3-3110M | NVIDIA GeForce GT 620M | 15.60" | 2.6 kg
 

回顾宏碁Aspire E1-571G笔记本

物美价廉? 入门级的笔记本电脑约500欧元(约$651),可以发现一毛钱一打。宏碁有一个有趣的提议,采用了酷睿i3和独立显卡。阅读是否宏碁Aspire E1-571G是在我们的测试中同样有吸引力。...
Intel Core i3-3110M | NVIDIA GeForce GT 620M | 15.60" | 2.6 kg
 

富士通Lifebook N5320M3501DE笔记本电脑测评

大生意 富士通Lifebook N532应该来代替台式电脑。随着一个17.3英寸的显示屏,众多的港口,以及主流的处理器和显卡符合要求。这个评论显示,如果笔记本说服我们的每一个细节。...
Intel Core i5-3210M | NVIDIA GeForce GT 620M | 17.30" | 3 kg
 

回顾德EasyNote TE11HC32328G50Mnks笔记本

新人 - 登山者? 它只是另一种便宜的Packard Bell公司的入门级笔记本,它真的以低廉的价格提供高质量的?我们审议的EasyNote TE11HC-32328G50Mnks。...
Intel Core i3-2328M | NVIDIA GeForce GT 620M | 15.60" | 2.5 kg
 

联想 ThinkPad Edge S430 笔记本测评

磨砂轻量级. 随着市场上的ThinkPad Edge S430联想带来了另一个边缘家庭子女。特别作为一种廉价的商用笔记本电脑市场赢得的个人用户和中小企业提供一个高分辨率的雾面显示屏 - 并承诺成功?...
Intel Core i5-3210M | NVIDIA GeForce GT 620M | 14.00" | 1.9 kg

Lenovo ThinkPad T430u: Intel Core i5-3317U, 14.00", 1.9 kg
  Review » 联想ThinkPad T430u 超级本测评

  Review » 联想ThinkPad T430u 超级本测评

  Review » 联想ThinkPad T430u 超级本测评

Lenovo IdeaCentre Horizon 27-57315077: Intel Core i7-3537U, 27.00", 8.3 kg
  External Review » Lenovo IdeaCentre Horizon 27-57315077

Please share our article, every link counts!

» Comparison of GPUs
Detailed list of all laptop GPUs sorted by class and performance.

» Benchmark List
Sort and restrict laptop GPUs based on performance in synthetic benchmarks.

» Notebook Gaming List
Playable games for each graphics card and their average FPS results.

Class 1

GeForce RTX 2080 Super Mobile

Class 2

M1 Max 32-Core GPU *
GeForce RTX 2070 Super Mobile
M1 Max 24-Core GPU *
Quadro RTX 5000 Max-Q
Radeon RX 5700M *
GeForce GTX 1080 Mobile
Quadro RTX 4000 (Laptop)
M1 Pro 16-Core GPU *
Radeon PRO W6600M *
GeForce RTX 2070 Super Max-Q
Quadro RTX 4000 Max-Q *
M1 Pro 14-Core GPU *
Quadro P5200
Quadro RTX 3000 Max-Q *
Quadro P4200
Quadro P5000 Max-Q *
GeForce GTX 980 (Laptop)
Quadro P4000
Quadro P4000 Max-Q
Quadro P3200
Radeon RX 580X (Laptop) *
Radeon RX 580 (Laptop)
Arc 130V *
Radeon Pro 5300M
Radeon RX 5300M
Quadro P3000 Max-Q *
Quadro T2000 Max-Q *
Radeon Pro WX 7100 *
Radeon RX 570X (Laptop) *
Radeon RX 570 (Laptop) *
Radeon RX 470 (Laptop) *
Quadro T1000 Max-Q *

Class 3

Vega M GH
Quadro M5000M
GeForce GTX 1050 Ti Mobile
Radeon 680M
Quadro P2000
Quadro P2000 Max-Q
Quadro M4000M
T500 Laptop GPU *
Radeon R9 M395X
GeForce GTX 1050 Ti Max-Q *
Radeon Pro Vega 16
WX Vega M GL
Radeon R9 M485X
Quadro M3000M
FirePro W7170M
Radeon R9 M395
GeForce GTX 1050 Max-Q *
Radeon 660M
Radeon Pro WX 4150 *
Radeon RX 560X (Laptop)
Radeon RX 560 (Laptop)
Radeon RX 460 (Laptop)
Quadro P1000
Radeon R9 M390
Xe MAX
Radeon Pro 560X
Radeon Pro 560
Radeon Pro 460
Radeon Pro WX 4130 *
GeForce GTX 960M
Quadro P620 *
Radeon RX 550X (Laptop)
Radeon Pro WX 3200 *
Radeon Pro 555X
Radeon Pro 555
Radeon Pro 455
Quadro P600
Quadro M2000M
Radeon RX 540X *
Radeon Pro WX 2100 *
Radeon Pro WX 3100 *
GeForce GTX 950M
Radeon Pro 450
Radeon 630
Radeon 540X *
Radeon R9 M385X
Quadro P520
Quadro M1000M
GeForce 945M
Quadro P500 *
Iris Plus Graphics G7 (Ice Lake 64 EU) *
Vega 10 *
Iris Pro Graphics 580
FirePro W5170M *
Radeon R9 M370X
Vega 9
FirePro W5130M
UHD Graphics Xe G4 48EUs *
UHD Graphics 32EUs
UHD Graphics Xe 32EUs (Tiger Lake-H) *
UHD Graphics 750
Vega 7
Radeon R7 M465
Iris Pro Graphics 6200
Vega 8
GeForce 940M
Iris Plus Graphics G4 (Ice Lake 48 EU)
Quadro M600M
FirePro W4190M
Radeon R9 M375
Radeon R7 M445
Iris Plus Graphics 650
Iris Graphics 550
Radeon 625
Vega 6 *
Iris Plus Graphics 640
Iris Graphics 540
UHD Graphics 24EUs (Alder Lake-N) *
Radeon R7 M360
GeForce 920M
Radeon 620
Radeon R7 M340
Radeon 610
Radeon 610M *
Vega 6 *
UHD Graphics G1 (Ice Lake 32 EU)
UHD Graphics Xe 16EUs (Tiger Lake-H) *
HD Graphics 530
Radeon R5 (Bristol Ridge)
Adreno 690 *
Adreno 685 *
Adreno 680 *
Radeon R5 M330
GeForce 910M
HD Graphics 520

Class 4

UHD Graphics 730
Radeon R5 M320 *
Radeon R5 M315 *
Radeon R5 M420 *
Vega 2 *
UHD Graphics 617
UHD Graphics 615
HD Graphics 515
UHD Graphics 610
HD Graphics 510
UHD Graphics 605
Radeon R4 (Stoney Ridge)
Radeon R2 (Stoney Ridge)
HD Graphics (Broadwell)
UHD Graphics 600
HD Graphics (Braswell)

Class 5

* Approximate position of the graphics adapter