Notebookcheck Logo

NVIDIA GeForce GTX 560M

NVIDIA GeForce GTX 560M

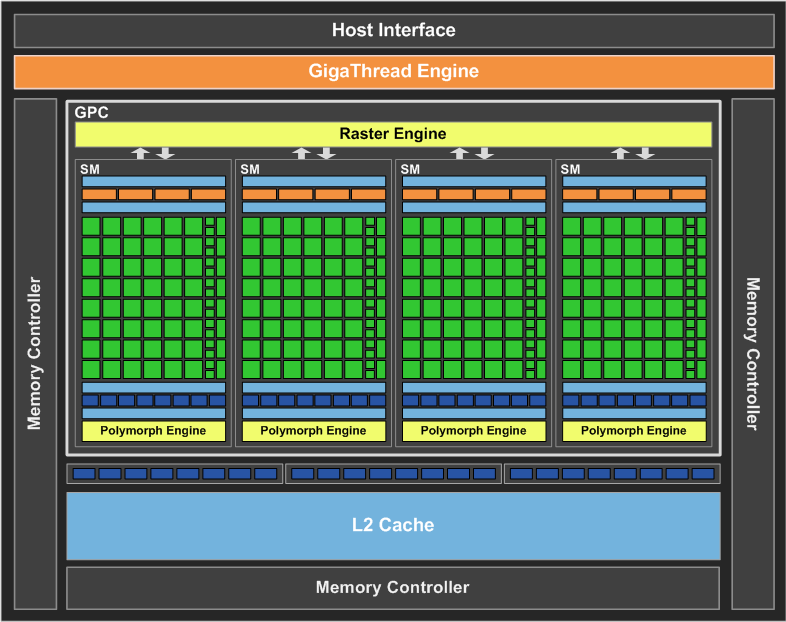
NVIDIA GeForce®(精视™)GTX 560M是一个高端的笔记本电脑的图形卡,2011年在Computex上宣布。它是基于作为Fermi架构的一部分,新的GF116核心。因此,支持DirectX 11和OpenGL 4.0。相比,它的前身,GeForce®(精视™)GTX 460M,560M,提供更高的时钟速度没有大幅增加的电力需求。 GF116核心本质上是一个优化的GF106核心具有相同的功能。该芯片提供了192个着色器和一个192位内存总线GDDR5。在GeForce®(精视™)GTX 460M文章的GF106架构上可以找到更多细节。 GeForce®(精视™)GTX 560M的性能是compareable旧的GeForce®(精视™)GTX 480M。在我们的测试中(见下面的基准),平均13%的速度比老GTX 460M GTX 560M。因此,唯一的要求非常苛刻的游戏(如“,”孤岛危机“,”孤岛危机2“尘埃3”地铁2033“)在最高设置和全高清分辨率播放不流利的反锯齿。其他流动及老游戏可以玩刷爆设置为2011年。查看在本页面目前许多游戏的相关详细游戏测试。由于GeForce®(精视™)GTX 460M,560M支持码流(蓝光)HD音频输出,通过HDMI。类似的Radeon HD 5850,GTX 460M可以将Dolby True HD和DTS-HD比特流明智的一个高保真接收器,没有质量损失。的的GTX560M提供的PureVideo HD视频解码技术,。视频处理器(VP4)支持的特征集C的GPU,因此能够完全解码MPEG-1,MPEG-2,MPEG-4第2部分(MPEG-4 ASP - 例如,DivX或XviD),VC-1 / WMV9,H.264(VLD,IDCT,运动补偿,去块“)。 X500测试仪能够解码VC-1编码的视频大象之梦约3-6%的CPU负载(根据任务管理器)。 H.264编码的大巴克兔子视频播放1-3%的CPU负载(包括1080p的视频)。此外,GPU能够解码两个1080p视频流同时(例如,​​蓝光画中画画面)。通过CUDA,OpenCL和DirectCompute 2.1的支持,GeForce®(精视™)GTX 560M可以使用一般的计算。例如,数据流处理器可以编码视频大大快于许多现代的CPU。 3D立体幻镜使笔记本电脑的一个内置3D功能的屏幕或外接3D电视送3D内容(3D游戏,3D网络流,3D照片,3D蓝光射线),如果笔记本电脑制造商的支持。的GeForce GTX 560M的功耗约75瓦(TDP包括MXM主板和内存),这是同级别的Mobility Radeon HD 5850 - 5870。如果没有在负载下,芯片的时钟频率为50/100兆赫(芯片/着色器)和200/400 MHz在2D模式和3D模式下,分别以节省电力。此外,500M系列支持擎天柱从英特尔和Nvidia的GPU集成显卡之间自动切换。然而,此功能是否被包括或不包括依赖笔记本电脑上的制造商。类似命名的台式机GeForce®(精视™)GTX 560Ti基于GF114芯片,并提供更多的着色器核心和更高的性能比GTX 560M。 GTX 550Ti基于GF116的是接近560M在性能方面,但它仍然具有相对更高的时钟速度。因此,与旧的台式机的GeForce GTS 450的560M的性能更加接近。

GeForce GTX 500M Series

GeForce GTX 580M SLI 768 @ 0.62 GHz256 Bit @ 1500 MHz
GeForce GTX 560M SLI 384 @ 0.78 GHz192 Bit @ 1250 MHz
GeForce GTX 580M 384 @ 0.62 GHz256 Bit @ 1500 MHz
GeForce GTX 570M 336 @ 0.58 GHz192 Bit @ 1150 MHz
GeForce GTX 560M 192 @ 0.78 GHz192 Bit @ 1250 MHz
CodenameN12E-GS
ArchitectureFermi
Pipelines192 - unified
Core Speed775 MHz
Shader Speed1550 MHz
Memory Speed1250 MHz
Memory Bus Width192 Bit
Memory TypeGDDR5
Max. Amount of Memory1536 MB
Shared Memoryno
APIDirectX 11, Shader 5.0
Transistor Count1.2 Billion
technology40 nm
FeaturesCUDA, PhysX, PureVideo HD VP4
Notebook Sizelarge
Date of Announcement30.05.2011

Benchmarks

3DMark 11 - 3DM11 Performance Score
min: 1924     avg: 2052     median: 2031 (3%)     max: 2255 Points
3DMark 11 - 3DM11 Performance GPU
min: 1777     avg: 1843     median: 1820 (2%)     max: 2009 Points
171.8 -91%
...
1749 -5%
1757 -5%
AMD Radeon R5 M335
1784 -3%
1792 -3%
AMD Radeon R7 (Carrizo)
1793 -3%
1807 -2%
NVIDIA Quadro K1100M
1819 -1%
1823 -1%
1831 -1%
NVIDIA GeForce GTX 560M
1843
1846 0%
AMD Radeon R7 M270
1858 1%
AMD Radeon R7 M260
1891 3%
AMD Radeon R7 M260X
1903 3%
1913 4%
Intel Iris Pro Graphics 5200
1916 4%
1926 5%
Qualcomm Adreno 685
1927 5%
1934 5%
...
59943 3152%
max:
106023 5653%
0%
100%
3DMark Vantage
3DM Vant. Perf. total +
3DMark Vantage - 3DM Vant. Perf. total
min: 8223     avg: 9230     median: 9300 (3%)     max: 10013 Points
3DM Vant. Perf. GPU no PhysX +
3DMark Vantage - 3DM Vant. Perf. GPU no PhysX
min: 7802     avg: 7999     median: 8003.5 (5%)     max: 8096 Points
ATI Radeon HD 3200
62 -99%
...
NVIDIA GeForce 9800M GT SLI
7591 -5%
Intel Iris Plus Graphics G4 (Ice Lake 48 EU)
7610 -5%
7614 -5%
NVIDIA GeForce GT 745M
7631 -5%
7645 -4%
7691 -4%
7782 -3%
7906 -1%
7990 0%
NVIDIA GeForce GTX 560M
7999
AMD Radeon R9 M375
8042 1%
8081 1%
Intel Iris Graphics 540
8220 3%
AMD Radeon HD 8790M
8407 5%
NVIDIA GeForce 9800M GTX SLI
8492 6%
AMD Radeon HD 8850M
8538 7%
8589 7%
AMD Radeon R7 M275DX
8607 8%
NVIDIA GeForce GT 750M
8624 8%
...
132443 1556%
max:
170928 2037%
0%
100%
3DMark 2001SE - 3DMark 2001 - Standard
41315 Points (43%)
3DMark 03 - 3DMark 03 - Standard
min: 37816     avg: 38532     median: 38157 (20%)     max: 40369 Points
3DMark 05 - 3DMark 05 - Standard
min: 21436     avg: 22649     median: 22198 (24%)     max: 24374 Points
Intel Graphics Media Accelerator (GMA) 500
133.4 -99%
...
21013 -7%
21185 -6%
AMD Radeon R7 M445
21189 -6%
21266 -6%
21287 -6%
NVIDIA GeForce GT 745M
21505 -5%
NVIDIA GeForce GTX 285M SLI
21611 -5%
21991 -3%
22463 -1%
NVIDIA GeForce GTX 560M
22649
22740 0%
NVIDIA GeForce GTX 950M
22798 1%
NVIDIA GeForce GTX 760M
22852 1%
23057 2%
23434 3%
23752 5%
AMD Radeon HD 8790M
23810 5%
23823 5%
24001 6%
...
61850 173%
max:
87172 285%
0%
100%
3DMark 06 3DMark 06 - Score Unknown Settings +
3DMark 06
16591 points (22%)
3DMark 06 - Standard 1280x1024 +
3DMark 06
min: 13838     avg: 15141     median: 15327 (20%)     max: 15844 Points
Unigine Heaven 2.1 - Heaven 2.1 high
min: 26.9     avg: 27.6     median: 27.5 (5%)     max: 29.3 fps
0.6 -98%
...
24 -13%
24 -13%
24.01 -13%
AMD Radeon RX Vega 8 (Ryzen 2000/3000)
25 -9%
NVIDIA GeForce GT 745M
25.4 -8%
26 -6%
Intel Iris Pro Graphics 5200
26.1 -5%
Intel HD Graphics 630
26.6 -3%
27.3 -1%
NVIDIA GeForce GTX 560M
27.56
AMD Radeon R9 M375
27.9 1%
27.9 1%
28.1 2%
NVIDIA GeForce 940M
28.3 3%
28.32 3%
28.5 3%
28.65 4%
NVIDIA Quadro K620M
29 5%
29.45 7%
...
532 1830%
0%
100%
SPECviewperf 11
specvp11 snx-01 +
SPECviewperf 11 - specvp11 snx-01
min: 2.32     avg: 2.3     median: 2.3 (1%)     max: 2.34 fps
specvp11 tcvis-02 +
SPECviewperf 11 - specvp11 tcvis-02
min: 0.81     avg: 0.8     median: 0.8 (0%)     max: 0.82 fps
specvp11 sw-02 +
SPECviewperf 11 - specvp11 sw-02
min: 5.9     avg: 6     median: 6 (5%)     max: 6.03 fps
specvp11 proe-05 +
SPECviewperf 11 - specvp11 proe-05
min: 1.05     avg: 1.1     median: 1.1 (1%)     max: 1.06 fps
specvp11 maya-03 +
SPECviewperf 11 - specvp11 maya-03
min: 6.47     avg: 7.3     median: 7.2 (5%)     max: 8.17 fps
specvp11 lightwave-01 +
SPECviewperf 11 - specvp11 lightwave-01
min: 8.96     avg: 9.3     median: 9.2 (10%)     max: 9.71 fps
specvp11 ensight-04 +
SPECviewperf 11 - specvp11 ensight-04
min: 19     avg: 19.3     median: 19.4 (9%)     max: 19.38 fps
specvp11 catia-03 +
SPECviewperf 11 - specvp11 catia-03
min: 4.86     avg: 5     median: 4.9 (3%)     max: 5.29 fps
Windows 7 Experience Index - Win7 Gaming graphics
min: 7.1     avg: 7.2     median: 7.2 (91%)     max: 7.2 Points
Windows 7 Experience Index - Win7 Graphics
min: 5.7     avg: 6.9     median: 7.2 (91%)     max: 7.2 Points
Cinebench R10 Cinebench R10 Shading (32bit) +
Cinebench R10 - Cinebench R10 Shading (32bit)
min: 4971     avg: 5457     median: 5407 (4%)     max: 6028 points
Cinebench R11.5 Cinebench R11.5 OpenGL 64 Bit +
Cinebench R11.5 - Cinebench R11.5 OpenGL 64 Bit
min: 37.6     avg: 40.8     median: 40 (14%)     max: 45.18 fps
- Range of benchmark values for this graphics card
- Average benchmark values for this graphics card
* Smaller numbers mean a higher performance

Game Benchmarks

The following benchmarks stem from our benchmarks of review laptops. The performance depends on the used graphics memory, clock rate, processor, system settings, drivers, and operating systems. So the results don't have to be representative for all laptops with this GPU. For detailed information on the benchmark results, click on the fps number.

low 1024x768
62.1  fps    + Compare
med. 1366x768
58.4  fps    + Compare
high 1366x768
18.8  fps    + Compare
ultra 1920x1080
15  fps    + Compare
» With all tested laptops playable in detail settings med..
low 1024x768
67.8  fps    + Compare
med. 1366x768
63  fps    + Compare
high 1366x768
60.5  fps    + Compare
ultra 1920x1080
23  fps    + Compare
» With all tested laptops playable in detail settings high.
low 1024x768
172.3  fps    + Compare
med. 1366x768
99.9  fps    + Compare
high 1366x768
61.3  fps    + Compare
ultra 1920x1080
44.2  fps    + Compare
» With all tested laptops playable in detail settings ultra.
low 1024x768
69.9  fps    + Compare
med. 1366x768
45.6  fps    + Compare
high 1366x768
37.9  fps    + Compare
ultra 1920x1080
17.5  fps    + Compare
» With all tested laptops playable in detail settings high.
low 1280x720
60  fps    + Compare
high 1366x768
59.8  fps    + Compare
ultra 1920x1080
44  fps    + Compare
» With all tested laptops playable in detail settings ultra.
Alan Wake

Alan Wake

2012
low 1024x768
64.9  fps    + Compare
med. 1366x768
42.2  fps    + Compare
ultra 1920x1080
16.2  fps    + Compare
» With all tested laptops playable in detail settings med..
Star Wars: The Old Republic

Star Wars: The Old Republic

2011
low 1024x768
70.2  fps    + Compare
high 1366x768
48.5  fps    + Compare
ultra 1920x1080
32  fps    + Compare
» With all tested laptops playable in detail settings high.
Anno 2070

Anno 2070

2011
low 1024x768
156.3  fps    + Compare
med. 1366x768
65.7  fps    + Compare
high 1366x768
41.2  fps    + Compare
ultra 1920x1080
20.1  fps    + Compare
» With all tested laptops playable in detail settings high.
low 1280x720
59  fps    + Compare
med. 1366x768
55.4  fps    + Compare
high 1366x768
40.8  fps    + Compare
ultra 1920x1080
21.3  fps    + Compare
» With all tested laptops playable in detail settings high.
low 1024x768
208.6  fps    + Compare
med. 1366x768
111.3  fps    + Compare
high 1366x768
72.1  fps    + Compare
ultra 1920x1080
44.5  fps    + Compare
» With all tested laptops playable in detail settings ultra.
low 1024x768
72 74.5 ~ 73 fps    + Compare + 📈 Graph
med. 1366x768
48.3 49.3 ~ 49 fps    + Compare + 📈 Graph
high 1366x768
37 37.9 ~ 37 fps    + Compare + 📈 Graph
ultra 1920x1080
15.5 19.2 ~ 17 fps    + Compare + 📈 Graph
» With all tested laptops playable in detail settings high.
low 1024x768
129  fps    + Compare
med. 1366x768
111  fps    + Compare
high 1366x768
51  fps    + Compare
ultra 1920x1080
21  fps    + Compare
» With all tested laptops playable in detail settings high.
Fifa 12

Fifa 12

2011
low 800x600
402.3  fps    + Compare + 📈 Graph
med. 1024x768
282.6  fps    + Compare + 📈 Graph
high 1360x768
208.3 218.2 220.1 ~ 216 fps    + Compare + 📈 Graph
ultra 1920x1080
140.8 143.7 145.5 ~ 143 fps    + Compare + 📈 Graph
» With all tested laptops playable in detail settings ultra.
F1 2011

F1 2011

2011
low 800x600
139  fps    + Compare + 📈 Graph
med. 1024x768
101  fps    + Compare + 📈 Graph
high 1366x768
76 78 80 ~ 78 fps    + Compare + 📈 Graph
ultra 1920x1080
32 32 34 ~ 33 fps    + Compare + 📈 Graph
» With all tested laptops playable in detail settings high.
low 1024x768
165.9 176.8 ~ 171 fps    + Compare + 📈 Graph
high 1366x768
71.4 71.7 72.8 ~ 72 fps    + Compare + 📈 Graph
ultra 1920x1080
27 27.2 27.4 ~ 27 fps    + Compare + 📈 Graph
» With all tested laptops playable in detail settings high.
Dirt 3

Dirt 3

2011
low 800x600
186.6 201.7 ~ 194 fps    + Compare
med. 1024x768
118.9 124.1 ~ 122 fps    + Compare
high 1360x768
81.4 82.3 85 85 ~ 83 fps    + Compare + 📈 Graph
ultra 1920x1080
22 22.6 23 23.3 ~ 23 fps    + Compare + 📈 Graph
» With all tested laptops playable in detail settings high.
Crysis 2

Crysis 2

2011
low 800x600
115.6  fps    + Compare + 📈 Graph
med. 1024x768
79.3  fps    + Compare + 📈 Graph
high 1366x768
58.2 59.4 60.9 ~ 60 fps    + Compare + 📈 Graph
ultra 1920x1080
19.4 20.1 20.9 ~ 20 fps    + Compare + 📈 Graph
» With all tested laptops playable in detail settings high.
low 800x600
123.4  fps    + Compare + 📈 Graph
med. 1024x768
100.1  fps    + Compare + 📈 Graph
high 1360x768
85.4 90 ~ 88 fps    + Compare + 📈 Graph
ultra 1920x1080
61.2 64 64.5 ~ 63 fps    + Compare + 📈 Graph
» With all tested laptops playable in detail settings ultra.
Fifa 11

Fifa 11

2010
low 800x600
369.9 461.7 629 ~ 487 fps    + Compare
med. 1024x768
281.6 308 320.8 ~ 303 fps    + Compare
high 1360x768
227.7 238.7 241 ~ 236 fps    + Compare
ultra 1920x1080
132.8 149 151.4 151.9 194.4 ~ 156 fps    + Compare
» With all tested laptops playable in detail settings ultra.
Mafia 2

Mafia 2

2010
low 800x600
108.5  fps    + Compare
med. 1024x768
83  fps    + Compare
high 1360x768
68.3  fps    + Compare
ultra 1920x1080
40.6 41.6 41.7 49 ~ 43 fps    + Compare
» With all tested laptops playable in detail settings ultra.
low 1024x768
234.9  fps    + Compare + 📈 Graph
med. 1360x768
86.2  fps    + Compare + 📈 Graph
high 1360x768
67.9  fps    + Compare + 📈 Graph
ultra 1920x1080
34.7 35 35.2 ~ 35 fps    + Compare + 📈 Graph
» With all tested laptops playable in detail settings high.
low 800x600
96.6 136 ~ 116 fps    + Compare + 📈 Graph
med. 1360x768
58.2 85.2 ~ 72 fps    + Compare + 📈 Graph
high 1600x900
28.2 30.6 35.3 ~ 31 fps    + Compare + 📈 Graph
ultra 1920x1080
10.9 11 14.2 ~ 12 fps    + Compare + 📈 Graph
» With all tested laptops playable in detail settings med..
low 1024x768
118.1  fps    + Compare + 📈 Graph
med. 1366x768
90.7  fps    + Compare + 📈 Graph
high 1366x768
66 67.5 69.8 ~ 68 fps    + Compare + 📈 Graph
ultra 1920x1080
32 34.3 34.4 35 ~ 34 fps    + Compare + 📈 Graph
» With all tested laptops playable in detail settings high.
low 800x600
194.9  fps    + Compare
med. 1024x768
95.4  fps    + Compare
high 1366x768
78.3  fps    + Compare
ultra 1920x1080
51.2 51.8 ~ 52 fps    + Compare
» With all tested laptops playable in detail settings ultra.
Risen

Risen

2009
low 800x600
118.6 122.6 ~ 121 fps    + Compare
med. 1024x768
65.6 75.8 ~ 71 fps    + Compare
high 1366x768
45.5 50.1 ~ 48 fps    + Compare
ultra 1920x1080
30.3 31 33.4 34.4 ~ 32 fps    + Compare
» With all tested laptops playable in detail settings high.
Resident Evil 5

Resident Evil 5

2009
low 800x600
143.5 147.7 ~ 146 fps    + Compare
high 1360x768
102.4  fps    + Compare
ultra 1920x1080
56.6 57.4 57.9 ~ 57 fps    + Compare
» With all tested laptops playable in detail settings ultra.
Need for Speed Shift

Need for Speed Shift

2009
low 800x600
80.1  fps    + Compare
med. 1024x768
68.9 107.7 ~ 88 fps    + Compare
high 1366x768
47.4 81.2 ~ 64 fps    + Compare
ultra 1920x1080
49 49.2 ~ 49 fps    + Compare
» With all tested laptops playable in detail settings ultra.
Colin McRae: DIRT 2

Colin McRae: DIRT 2

2009
low 800x600
71.6 135.1 ~ 103 fps    + Compare
med. 1024x768
65.3 105.1 ~ 85 fps    + Compare
high 1360x768
57.9 68 ~ 63 fps    + Compare
ultra 1920x1080
38.5 47 48.2 ~ 45 fps    + Compare
» With all tested laptops playable in detail settings ultra.
Anno 1404

Anno 1404

2009
ultra 1280x1024
52  fps    + Compare
» With all tested laptops playable in detail settings ultra.
Sims 3

Sims 3

2009
high 1280x1024
78  fps    + Compare
» With all tested laptops playable in detail settings high.
Racedriver: GRID

Racedriver: GRID

2008
low 800x600
137.1  fps    + Compare
med. 1024x768
109.2  fps    + Compare
high 1280x1024
98.6  fps    + Compare
» With all tested laptops playable in detail settings high.
Call of Duty 4 - Modern Warfare

Call of Duty 4 - Modern Warfare

2007
low 800x600
235.6  fps    + Compare
med. 1024x768
157.7  fps    + Compare
high 1280x1024
127.8  fps    + Compare
» With all tested laptops playable in detail settings high.
Supreme Commander - FA Bench

Supreme Commander - FA Bench

2007
ultra 1920x1080
43.3  fps    + Compare
» With all tested laptops playable in detail settings ultra.
Crysis - GPU Benchmark

Crysis - GPU Benchmark

2007
low 1024x768
127  fps    + Compare
med. 1024x768
89.5  fps    + Compare
high 1024x768
62.2 64.5 ~ 63 fps    + Compare
ultra 1920x1080
14.8 14.9 ~ 15 fps    + Compare
» With all tested laptops playable in detail settings high.
Crysis - CPU Benchmark

Crysis - CPU Benchmark

2007
low 1024x768
144.3  fps    + Compare
med. 1024x768
94  fps    + Compare
high 1024x768
60.1  fps    + Compare
ultra 1920x1080
14.1  fps    + Compare
» With all tested laptops playable in detail settings high.
World in Conflict - Benchmark

World in Conflict - Benchmark

2007
ultra 1920x1080
32  fps    + Compare
» The benchmarks indicate that the game is not playable in the tested settings.
Call of Juarez Benchmark

Call of Juarez Benchmark

2006
high 1024x768
70.7  fps    + Compare
» With all tested laptops playable in detail settings high.
Half Life 2 - Lost Coast Benchmark

Half Life 2 - Lost Coast Benchmark

2005
high 1024x768
228.5  fps    + Compare
» With all tested laptops playable in detail settings high.
lowmed.highultraQHD4K
Max Payne 362.158.418.815
Dirt Showdown67.86360.523
Diablo III172.399.961.344.2
Risen 2: Dark Waters69.945.637.917.5
Mass Effect 36059.844
Alan Wake64.942.216.2
Star Wars: The Old Republic70.248.532
Anno 2070156.365.741.220.1
The Elder Scrolls V: Skyrim5955.440.821.3
CoD: Modern Warfare 3208.6111.372.144.5
Battlefield 373493717
Batman: Arkham City1291115121
Fifa 12402.3282.6216143
F1 20111391017833
Deus Ex Human Revolution1717227
Dirt 31941228323
Crysis 2115.679.36020
Call of Duty: Black Ops123.4100.18863
Fifa 11487303236156
Mafia 2108.58368.343
StarCraft 2234.986.267.935
Metro 2033116723112
Battlefield: Bad Company 2118.190.76834
CoD Modern Warfare 2194.995.478.352
Risen121714832
Resident Evil 5146102.457
Need for Speed Shift80.1886449
Colin McRae: DIRT 2103856345
Anno 140452
Sims 378
Racedriver: GRID137.1109.298.6
Call of Duty 4 - Modern Warfare235.6157.7127.8
Supreme Commander - FA Bench43.3
Crysis - GPU Benchmark12789.56315
Crysis - CPU Benchmark144.39460.114.1
World in Conflict - Benchmark32
Call of Juarez Benchmark70.7
Half Life 2 - Lost Coast Benchmark228.5
< 30 fps
< 60 fps
< 120 fps
≥ 120 fps

1
13
18

5
19
4
1
9
20
4
14
16
1
2


For more games that might be playable and a list of all games and graphics cards visit our Gaming List

v1.28
log 02. 01:06:04

#0 no ids found in url (should be separated by "_") +0s ... 0s

#1 not redirecting to Ajax server +0s ... 0s

#2 did not recreate cache, as it is less than 5 days old! Created at Mon, 01 Jul 2024 05:31:08 +0200 +0.001s ... 0.001s

#3 no comparison url found in template nbc.compare_page_1 needed +0.042s ... 0.043s

#4 no comparison url found in template nbc.compare_page_1 needed +0s ... 0.044s

#5 no comparison url found in template nbc.compare_page_1 needed +0s ... 0.044s

#6 no comparison url found in template nbc.compare_page_1 needed +0s ... 0.044s

#7 composed specs +0s ... 0.044s

#8 did output specs +0s ... 0.044s

#9 start showIntegratedCPUs +0s ... 0.044s

#10 getting avg benchmarks for device 2481 +0.014s ... 0.058s

#11 got single benchmarks 2481 +0.054s ... 0.112s

#12 got avg benchmarks for devices +0s ... 0.112s

#13 min, max, avg, median took s +0.459s ... 0.571s

#14 before gaming benchmark output +0s ... 0.571s

#15 Got 205 rows for game benchmarks. +0.021s ... 0.593s

#16 composed SQL query for gamebenchmarks +0s ... 0.593s

#17 got data and put it in $dataArray +0.025s ... 0.618s

#18 benchmarks composed for output. +1.404s ... 2.022s

#19 no comparison url found in template nbc.compare_page_1 needed +0.004s ... 2.026s

#20 return log +0s ... 2.026s

No reviews found for this graphics card.

Please share our article, every link counts!

» Comparison of GPUs
Detailed list of all laptop GPUs sorted by class and performance.

» Benchmark List
Sort and restrict laptop GPUs based on performance in synthetic benchmarks.

» Notebook Gaming List
Playable games for each graphics card and their average FPS results.

Class 1

GeForce RTX 2080 Super Mobile

Class 2

M1 Max 32-Core GPU *
GeForce RTX 2070 Super Mobile
M1 Max 24-Core GPU *
Quadro RTX 5000 Max-Q
Radeon RX 5700M *
GeForce GTX 1080 Mobile
Quadro RTX 4000 (Laptop)
M1 Pro 16-Core GPU *
Radeon PRO W6600M *
GeForce RTX 2070 Super Max-Q
Quadro RTX 4000 Max-Q *
M1 Pro 14-Core GPU *
Quadro P5200
Quadro RTX 3000 Max-Q *
Quadro P4200
Quadro P5000 Max-Q *
GeForce GTX 980 (Laptop)
Quadro P4000
Quadro P4000 Max-Q
Quadro P3200
Radeon RX 580X (Laptop) *
Radeon RX 580 (Laptop)
Arc 130V *
Radeon Pro 5300M
Radeon RX 5300M
Quadro P3000 Max-Q *
Quadro T2000 Max-Q *
Radeon Pro WX 7100 *
Radeon RX 570X (Laptop) *
Radeon RX 570 (Laptop) *
Radeon RX 470 (Laptop) *
Quadro T1000 Max-Q *

Class 3

Vega M GH
Quadro M5000M
GeForce GTX 1050 Ti Mobile
Radeon 680M
Quadro P2000
Quadro P2000 Max-Q
Quadro M4000M
T500 Laptop GPU *
Radeon R9 M395X
GeForce GTX 1050 Ti Max-Q *
Radeon Pro Vega 16
WX Vega M GL
Radeon R9 M485X
Quadro M3000M
FirePro W7170M
Radeon R9 M395
GeForce GTX 1050 Max-Q *
Radeon 660M
Radeon Pro WX 4150 *
Radeon RX 560X (Laptop)
Radeon RX 560 (Laptop)
Radeon RX 460 (Laptop)
Quadro P1000
Radeon R9 M390
Xe MAX
Radeon Pro 560X
Radeon Pro 560
Radeon Pro 460
Radeon Pro WX 4130 *
GeForce GTX 960M
Quadro P620 *
Radeon RX 550X (Laptop)
Radeon Pro WX 3200 *
Radeon Pro 555X
Radeon Pro 555
Radeon Pro 455
Quadro P600
Quadro M2000M
Radeon RX 540X *
Radeon Pro WX 2100 *
Radeon Pro WX 3100 *
GeForce GTX 950M
Radeon Pro 450
Radeon 630
Radeon 540X *
Radeon R9 M385X
Quadro P520
Quadro M1000M
GeForce 945M
Quadro P500 *
Iris Plus Graphics G7 (Ice Lake 64 EU) *
Vega 10 *
Iris Pro Graphics 580
FirePro W5170M *
Radeon R9 M370X
Vega 9
FirePro W5130M
UHD Graphics Xe G4 48EUs *
UHD Graphics 32EUs
UHD Graphics Xe 32EUs (Tiger Lake-H) *
UHD Graphics 750
Vega 7
Radeon R7 M465
Iris Pro Graphics 6200
Vega 8
GeForce 940M
Iris Plus Graphics G4 (Ice Lake 48 EU)
Quadro M600M
FirePro W4190M
Radeon R9 M375
Radeon R7 M445
Iris Plus Graphics 650
Iris Graphics 550
Radeon 625
Vega 6 *
Iris Plus Graphics 640
Iris Graphics 540
UHD Graphics 24EUs (Alder Lake-N) *
Radeon R7 M360
GeForce 920M
Radeon 620
Radeon R7 M340
Radeon 610
Radeon 610M *
Vega 6 *
UHD Graphics G1 (Ice Lake 32 EU)
UHD Graphics Xe 16EUs (Tiger Lake-H) *
HD Graphics 530
Radeon R5 (Bristol Ridge)
Adreno 690 *
Adreno 685 *
Adreno 680 *
Radeon R5 M330
GeForce 910M
HD Graphics 520

Class 4

UHD Graphics 730
Radeon R5 M320 *
Radeon R5 M315 *
Radeon R5 M420 *
Vega 2 *
UHD Graphics 617
UHD Graphics 615
HD Graphics 515
UHD Graphics 610
HD Graphics 510
UHD Graphics 605
Radeon R4 (Stoney Ridge)
Radeon R2 (Stoney Ridge)
HD Graphics (Broadwell)
UHD Graphics 600
HD Graphics (Braswell)

Class 5

* Approximate position of the graphics adapter