Notebookcheck Logo

NVIDIA GeForce GTX 750 Ti
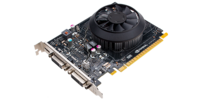
NVIDIA GeForce GTX 750 Ti

NVIDIA GeForce GTX 750 Ti是一款发布于2014年初的中端桌面显卡。它基于第一代的Maxwell架构,即GM107核心。Maxwell架构在设计上着重于功效,超出了前代的Kepler架构显卡,和同性能的AMD显卡芯片。GTX 750 Ti支持DirectX 11.2,但仅支持11_0级别。

GeForce GTX 750 Ti与采用相同芯片移动版的Nvidia Geforce GTX 860M相似,但860M运行于较低的时钟频率,因此性能也较低。


它的3D性能介于AMD产品线中的Radeon R7 260X和R7 265X之间,Nvidia产品线中的GTX 750和GTX 660之间。在我们的测试中,750 Ti无法在高设定和全高清分辨率下流畅运行要求较高的游戏(请参见下方的测试成绩)。


与之前提到的一样,GTX 750 Ti的功耗是它的一大强项,相比较慢的Radeon R7 260X好出很多。

GeForce GTX 700 Series

GeForce GTX 780 Ti 2880 @ 0.88 - 0.93 GHz384 Bit @ 3500 MHz
GeForce GTX 760 1152 @ 0.98 - 1.03 GHz256 Bit @ 3000 MHz
GeForce GTX 750 Ti 640 @ 1.02 - 1.09 GHz128 Bit @ 2700 MHz
CodenameGM107
ArchitectureMaxwell
Pipelines640 - unified
Core Speed1020 - 1085 (Boost) MHz
Memory Speed2700 MHz
Memory Bus Width128 Bit
Memory TypeGDDR5
Max. Amount of Memory2048 MB
Shared Memoryno
APIDirectX 11.2, Shader 5.0, OpenGL 4.4
Power Consumption60 Watt
Transistor Count1.9 Billion
technology28 nm
Features3D Vision, PhysX, CUDA, GPU Boost 2.0, GeForce Experience, Adaptive VSync
Date of Announcement18.02.2014
Link to Manufacturer Pagewww.nvidia.de

Benchmarks

Performance Rating - 3DMark 11 + Fire Strike + Time Spy
1.9 pt (6%)
AMD Radeon HD 8180
0.06404 -97%
...
1.72 -9%
NVIDIA GeForce GTX 860M
1.724 -9%
1.771 -7%
1.788 -6%
NVIDIA Quadro P600
1.803 -5%
NVIDIA GeForce GT 755M SLI
1.814 -4%
1.829 -4%
NVIDIA Quadro M2000M
1.836 -3%
NVIDIA T500 Laptop GPU
1.866 -2%
NVIDIA GeForce GTX 750 Ti
1.897
NVIDIA GeForce GTX 960M
1.907 1%
1.931 2%
NVIDIA Quadro P620
2.06 9%
2.07 9%
2.07 9%
2.09 10%
NVIDIA Quadro P1000
2.11 11%
NVIDIA Quadro K5100M
2.12 12%
AMD Radeon 660M
2.14 13%
...
33.3 1655%
0%
100%
3DMark - 3DMark Cloud Gate Score
17949 Points (17%)
3DMark - 3DMark Cloud Gate Graphics
31349 Points (8%)
3DMark - 3DMark Fire Strike Standard Score
4022 Points (7%)
3DMark - 3DMark Fire Strike Standard Graphics
4294 Points (5%)
3DMark - 3DMark Ice Storm Graphics
238977 Points (26%)
3DMark 11 - 3DM11 Performance Score
5741 Points (7%)
3DMark 11 - 3DM11 Performance GPU
5378 Points (5%)
171.8 -97%
...
5179 -4%
AMD Radeon Pro 555
5185 -4%
5213 -3%
5235 -3%
NVIDIA GeForce GTX 960M
5277 -2%
AMD Radeon Pro 560
5305 -1%
5310 -1%
5334 -1%
AMD Radeon RX 550X (Laptop)
5345 -1%
NVIDIA GeForce GTX 750 Ti
5378
AMD Radeon Pro 455
5388 0%
AMD FirePro M6100
5445 1%
AMD Radeon R9 M385X
5515 3%
5542 3%
NVIDIA GeForce GT 755M SLI
5673 5%
5850 9%
5885 9%
5910 10%
NVIDIA Quadro P620
5939 10%
...
104201 1838%
0%
100%
3DMark Vantage
3DM Vant. Perf. total +
3DMark Vantage - 3DM Vant. Perf. total
21608 Points (6%)
3DM Vant. Perf. GPU no PhysX +
3DMark Vantage - 3DM Vant. Perf. GPU no PhysX
20401 Points (11%)
ATI Radeon HD 3200
62 -100%
...
17897 -12%
NVIDIA GeForce GTX 860M
18067 -11%
18096 -11%
NVIDIA GeForce GTX 770M
18431 -10%
18618 -9%
AMD FirePro M6100
18724 -8%
NVIDIA Quadro M2000M
19354 -5%
19797 -3%
AMD Radeon RX 560X (Laptop)
19829 -3%
NVIDIA GeForce GTX 750 Ti
20401
20547 1%
AMD Radeon 660M
20571 1%
20575 1%
NVIDIA GeForce GTX 570
20620 1%
AMD Radeon HD 8970M
20876 2%
NVIDIA GeForce GT 755M SLI
21102 3%
21237 4%
21394 5%
21679 6%
...
170928 738%
0%
100%
Unigine Heaven 3.0 - Unigine Heaven 3.0 DX 11
54.3 fps (18%)
Unigine Heaven 2.1 - Heaven 2.1 high
75.2 fps (14%)
0.6 -99%
...
65.2 -13%
AMD Radeon HD 6870
67.7 -10%
NVIDIA GeForce GTX 960M
68.7 -9%
NVIDIA GeForce GTX 860M
68.9 -8%
NVIDIA GeForce GT 755M SLI
71.5 -5%
AMD FirePro M6100
72 -4%
NVIDIA Quadro M2000M
72.9 -3%
73.5 -2%
73.9 -2%
NVIDIA GeForce GTX 750 Ti
75.2
AMD Radeon HD 8970M
75.8 1%
76.8 2%
NVIDIA GeForce GTX 480
78.1 4%
78.5 4%
NVIDIA GeForce GTX 570
81.4 8%
82.2 9%
82.5 10%
83.8 11%
NVIDIA GeForce GTX 1050 Ti Max-Q
86 14%
...
532 607%
0%
100%
- Range of benchmark values for this graphics card
red legend - Average benchmark values for this graphics card
* Smaller numbers mean a higher performance

Game Benchmarks

The following benchmarks stem from our benchmarks of review laptops. The performance depends on the used graphics memory, clock rate, processor, system settings, drivers, and operating systems. So the results don't have to be representative for all laptops with this GPU. For detailed information on the benchmark results, click on the fps number.

F1 2014

F1 2014

2014
low 1024x768
133  fps    + Compare
med. 1366x768
130  fps    + Compare
high 1920x1080
125  fps    + Compare
ultra 1920x1080
98  fps    + Compare
» With all tested laptops playable in detail settings ultra.
low 1024x768
65.4  fps    + Compare
med. 1366x768
55  fps    + Compare
high 1920x1080
31.6  fps    + Compare
» With all tested laptops playable in detail settings med..
low 1024x768
77.4  fps    + Compare
med. 1366x768
53.5  fps    + Compare
high 1920x1080
25.7  fps    + Compare
ultra 1920x1080
23.8  fps    + Compare
» With all tested laptops playable in detail settings med..
low 1024x768
196.3  fps    + Compare
med. 1366x768
129  fps    + Compare
high 1920x1080
65  fps    + Compare
ultra 1920x1080
46.2  fps    + Compare
» With all tested laptops playable in detail settings ultra.
low 1280x720
126.4  fps    + Compare
med. 1344x756
76.4  fps    + Compare
high 1920x1080
43.4  fps    + Compare
ultra 1920x1080
29.2  fps    + Compare
» With all tested laptops playable in detail settings high.
Fifa 15

Fifa 15

2014
low 1280x720
253.2  fps    + Compare
high 1366x768
178.1  fps    + Compare
ultra 1920x1080
134.8  fps    + Compare
» With all tested laptops playable in detail settings ultra.
Sims 4

Sims 4

2014
low 1024x768
172.5  fps    + Compare
med. 1366x768
94.8  fps    + Compare
high 1920x1080
71.9  fps    + Compare
ultra 1920x1080
63  fps    + Compare
» With all tested laptops playable in detail settings ultra.
low 1024x768
57  fps    + Compare
med. 1366x768
67.2  fps    + Compare
high 1920x1080
46  fps    + Compare
ultra 1920x1080
37.4  fps    + Compare
» With all tested laptops playable in detail settings ultra.
low 1024x768
262.4  fps    + Compare
med. 1366x768
153.6  fps    + Compare
high 1920x1080
100.1  fps    + Compare
ultra 1920x1080
52.6  fps    + Compare
» With all tested laptops playable in detail settings ultra.
low 1024x768
85.7  fps    + Compare
med. 1366x768
72.4  fps    + Compare
high 1920x1080
29.4  fps    + Compare
» With all tested laptops playable in detail settings med..
low 1280x720
60  fps    + Compare
med. 1280x720
60  fps    + Compare
high 1920x1080
58.4  fps    + Compare
» With all tested laptops playable in detail settings high.
low 1024x768
99.1  fps    + Compare
med. 1366x768
97.1  fps    + Compare
high 1366x768
85.1  fps    + Compare
ultra 1920x1080
44  fps    + Compare
» With all tested laptops playable in detail settings ultra.
Thief

Thief

2014
low 1024x768
91.9  fps    + Compare
med. 1366x768
63.2  fps    + Compare
high 1366x768
53.4  fps    + Compare
ultra 1920x1080
27.6  fps    + Compare
» With all tested laptops playable in detail settings high.
low 1024x768
150.7  fps    + Compare
med. 1366x768
99.3  fps    + Compare
high 1366x768
58.6  fps    + Compare
ultra 1920x1080
34.6  fps    + Compare
» With all tested laptops playable in detail settings high.
low 1024x768
162.3  fps    + Compare
med. 1366x768
116.3  fps    + Compare
high 1366x768
81.8  fps    + Compare
ultra 1920x1080
33.3  fps    + Compare
» With all tested laptops playable in detail settings high.
low 1280x720
99.6  fps    + Compare
med. 1366x768
87.3  fps    + Compare
high 1366x768
56.1  fps    + Compare
ultra 1920x1080
34.3  fps    + Compare
» With all tested laptops playable in detail settings high.
Dota 2

Dota 2

2013
low 1024x768
119.9  fps    + Compare
med. 1366x768
119.6  fps    + Compare
ultra 1920x1080
100.2  fps    + Compare
» With all tested laptops playable in detail settings ultra.
GRID 2

GRID 2

2013
low 1024x768
191.9  fps    + Compare
med. 1366x768
152.3  fps    + Compare
high 1366x768
144  fps    + Compare
ultra 1920x1080
54.1  fps    + Compare
» With all tested laptops playable in detail settings ultra.
low 1024x768
123.6  fps    + Compare
med. 1366x768
103  fps    + Compare
high 1366x768
58.8  fps    + Compare
ultra 1920x1080
30.9  fps    + Compare
» With all tested laptops playable in detail settings high.
low 1280x720
233.3  fps    + Compare
med. 1366x768
140  fps    + Compare
high 1366x768
122.2  fps    + Compare
ultra 1920x1080
46.7  fps    + Compare
» With all tested laptops playable in detail settings ultra.
low 1024x768
347.4  fps    + Compare
med. 1366x768
179.3  fps    + Compare
high 1366x768
109.9  fps    + Compare
ultra 1920x1080
49.5  fps    + Compare
» With all tested laptops playable in detail settings ultra.
Crysis 3

Crysis 3

2013
low 1024x768
133.8  fps    + Compare
med. 1366x768
81.9  fps    + Compare
high 1366x768
54.3  fps    + Compare
ultra 1920x1080
20.4  fps    + Compare
» With all tested laptops playable in detail settings high.
Far Cry 3

Far Cry 3

2012
low 1024x768
132.6  fps    + Compare
med. 1366x768
118.7  fps    + Compare
high 1366x768
68.3  fps    + Compare
ultra 1920x1080
24.8  fps    + Compare
» With all tested laptops playable in detail settings high.
low 1024x768
95.4  fps    + Compare
med. 1366x768
89.2  fps    + Compare
high 1366x768
57.8  fps    + Compare
ultra 1920x1080
27.1  fps    + Compare
» With all tested laptops playable in detail settings high.
low 1024x768
124.4  fps    + Compare
high 1366x768
66.8  fps    + Compare
ultra 1920x1080
31.9  fps    + Compare
» With all tested laptops playable in detail settings high.
lowmed.highultraQHD4K
F1 201413313012598
The Evil Within65.45531.6
Ryse: Son of Rome77.453.525.723.8
Alien: Isolation196.31296546.2
Middle-earth: Shadow of Mordor126.476.443.429.2
Fifa 15253.2178.1134.8
Sims 4172.594.871.963
Risen 3: Titan Lords5767.24637.4
GRID: Autosport262.4153.6100.152.6
Watch Dogs85.772.429.4
Wolfenstein: The New Order606058.4
The Elder Scrolls Online99.197.185.144
Thief91.963.253.427.6
Call of Duty: Ghosts150.799.358.634.6
Battlefield 4162.3116.381.833.3
Saints Row IV99.687.356.134.3
Dota 2119.9119.6100.2
GRID 2191.9152.314454.1
Metro: Last Light123.610358.830.9
BioShock Infinite233.3140122.246.7
Tomb Raider347.4179.3109.949.5
Crysis 3133.881.954.320.4
Far Cry 3132.6118.768.324.8
Hitman: Absolution95.489.257.827.1
Guild Wars 2124.466.831.9
< 30 fps
< 60 fps
< 120 fps
≥ 120 fps

1
9
15

2
15
6
2
10
8
4
6
12
3
1


For more games that might be playable and a list of all games and graphics cards visit our Gaming List

v1.28
log 22. 02:06:27

#0 ran 0s before starting gpusingle class +0s ... 0s

#1 no ids found in url (should be separated by "_") +0s ... 0s

#2 not redirecting to Ajax server +0s ... 0s

#3 did not recreate cache, as it is less than 5 days old! Created at Thu, 19 Dec 2024 05:31:27 +0100 +0.001s ... 0.001s

#4 no comparison url found in template nbc.compare_page_1 needed +0.024s ... 0.025s

#5 no comparison url found in template nbc.compare_page_1 needed +0s ... 0.025s

#6 composed specs +0s ... 0.025s

#7 did output specs +0s ... 0.025s

#8 start showIntegratedCPUs +0s ... 0.025s

#9 getting avg benchmarks for device 5600 +0.024s ... 0.049s

#10 got single benchmarks 5600 +0.007s ... 0.056s

#11 got avg benchmarks for devices +0s ... 0.056s

#12 min, max, avg, median took s +0.252s ... 0.308s

#13 before gaming benchmark output +0s ... 0.308s

#14 Got 94 rows for game benchmarks. +0.003s ... 0.311s

#15 composed SQL query for gamebenchmarks +0s ... 0.311s

#16 got data and put it in $dataArray +0.016s ... 0.327s

#17 benchmarks composed for output. +0.753s ... 1.08s

#18 no comparison url found in template nbc.compare_page_1 needed +0.003s ... 1.083s

#19 return log +0s ... 1.083s

No reviews found for this graphics card.

Please share our article, every link counts!
Mail Logo

» Comparison of GPUs
Detailed list of all laptop GPUs sorted by class and performance.

» Benchmark List
Sort and restrict laptop GPUs based on performance in synthetic benchmarks.

» Notebook Gaming List
Playable games for each graphics card and their average FPS results.

Class 1

NVIDIA GeForce RTX 5090 * Desktop
NVIDIA GeForce RTX 5080 * Desktop
NVIDIA GeForce RTX 5070 Ti * Desktop
NVIDIA GeForce RTX 5070 * Desktop
NVIDIA GeForce RTX 5060 Ti * Desktop
NVIDIA RTX A6000 Desktop
NVIDIA GeForce RTX 5060 * Desktop
Radeon Pro W6800 Desktop
NVIDIA Titan RTX Desktop
GeForce RTX 3070 Ti Desktop
Radeon RX 6750 XT Desktop
Radeon RX 6700 XT Desktop
NVIDIA GeForce RTX 3060 Ti Desktop
Arc B580
Radeon RX 6650 XT Desktop
GeForce RTX 2080 (Desktop) Desktop

Class 2

NVIDIA GeForce RTX 3060 Desktop
Titan X Pascal Desktop
Radeon VII Desktop
Radeon RX 5700 XT (Desktop) Desktop
GeForce GTX 1080 (Desktop) Desktop
GeForce RTX 2060 Super (Desktop) Desktop
Radeon RX 5700 (Desktop) Desktop
GeForce RTX 2060 (Desktop) Desktop
RX Vega 64 Desktop
RX Vega 56 Desktop
Radeon RX 5600 XT (Desktop) Desktop
Pro Vega 56 Desktop
GeForce GTX 1660 Ti (Desktop) Desktop
GeForce GTX 1660 Super (Desktop) Desktop
RTX A2000 Desktop
GeForce GTX 1660 (Desktop) Desktop
GeForce GTX 1650 Super (Desktop) Desktop
Radeon R9 Fury Desktop
Radeon R9 Nano Desktop
Radeon RX 580 Desktop
GeForce GTX 1060 (Desktop) Desktop
Radeon RX 570 Desktop
Radeon RX 480 Desktop
Arc A380 Desktop
GeForce GTX 970 Desktop

Class 3

T1000 Desktop
GeForce GTX 960 Desktop
Radeon R7 370 Desktop
GeForce GTX 950 Desktop
T600 Desktop
UHD Graphics 32EUs
UHD Graphics 750
UHD Graphics 730
FirePro W4100 Desktop
FirePro W2100 Desktop

Class 4

VideoCore VII *

* Approximate position of the graphics adapter