Notebookcheck Logo

NVIDIA GeForce GTX 780 Ti
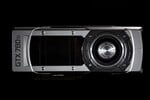
NVIDIA GeForce GTX 780 Ti

NVIDIA GeForce GTX 780 Ti是一款采用28纳米制程技术的基于Kepler架构的高端台式机显卡。它使用了GK110芯片的的所有2880个CUBA核心,是2014年初最快的单芯片显卡。780 Ti的速度相比命名相似的笔记本显卡Nvidia GTX 780M(采用了与台式GTX 770相同的GK104芯片,但时钟频率较低)快很多。

GeForce GTX 700 Series

GeForce GTX 780 Ti 2880 @ 0.88 - 0.93 GHz384 Bit @ 3500 MHz
GeForce GTX 760 1152 @ 0.98 - 1.03 GHz256 Bit @ 3000 MHz
GeForce GTX 750 Ti 640 @ 1.02 - 1.09 GHz128 Bit @ 2700 MHz
CodenameGK110
ArchitectureKepler
Pipelines2880 - unified
Core Speed875 - 928 (Boost) MHz
Memory Speed3500 MHz
Memory Bus Width384 Bit
Memory TypeGDDR5
Max. Amount of Memory3 GB
Shared Memoryno
APIDirectX 12 (FL 11_0), Shader 5.0, OpenGL 4.4
Power Consumption250 Watt
Transistor Count7.1 Billion
technology28 nm
FeaturesSLI, Purevideo, 3D Vision, PhysX, CUDA, GPU Boost 2.0, GeForce Experience, Adaptive VSync
Date of Announcement07.11.2013
Link to Manufacturer Pagewww.nvidia.de

Benchmarks

Performance Rating - 3DMark 11 + Fire Strike + Time Spy
5.2 pt (16%)
AMD Radeon HD 8180
0.06404 -99%
...
4.51 -14%
AMD Radeon RX Vega M GH
4.53 -13%
AMD Radeon HD 8970M Crossfire
4.57 -12%
4.61 -12%
4.66 -11%
AMD Radeon RX 580 (Laptop)
4.97 -5%
5.1 -2%
5.18 -1%
5.22 0%
NVIDIA GeForce GTX 780 Ti
5.22
NVIDIA GeForce GTX 970
5.28 1%
5.28 1%
5.28 1%
AMD Radeon RX 480 (Desktop)
5.38 3%
NVIDIA GeForce GTX 1650 Super (Desktop)
5.39 3%
NVIDIA Quadro P4000
5.41 4%
5.42 4%
5.47 5%
NVIDIA Quadro P3200
5.55 6%
...
33.3 538%
0%
100%
3DMark - 3DMark Cloud Gate Score
24263 Points (23%)
3DMark - 3DMark Cloud Gate Graphics
75688 Points (19%)
3DMark - 3DMark Fire Strike Standard Score
9974 Points (17%)
3DMark - 3DMark Fire Strike Standard Graphics
11812 Points (13%)
3DMark - 3DMark Ice Storm Graphics
352453 Points (39%)
3DMark 11 - 3DM11 Performance Score
13151 Points (17%)
3DMark 11 - 3DM11 Performance GPU
15619 Points (13%)
171.8 -99%
...
AMD Radeon RX 5300M
14412 -8%
14428 -8%
14692 -6%
14725 -6%
15135 -3%
AMD Radeon RX 580 (Laptop)
15223 -3%
15239 -2%
NVIDIA Quadro P4000
15433 -1%
15592 0%
NVIDIA GeForce GTX 780 Ti
15619
NVIDIA GeForce GTX 970
15780 1%
15823 1%
NVIDIA Quadro P4000 Max-Q
15837 1%
16166 4%
NVIDIA Quadro P3200
16233 4%
16564 6%
NVIDIA GeForce GTX 980 (Laptop)
17028 9%
17113 10%
AMD Radeon R9 Nano
17282 11%
...
104201 567%
0%
100%
3DMark Vantage
3DM Vant. Perf. total +
3DMark Vantage - 3DM Vant. Perf. total
38813 Points (11%)
3DM Vant. Perf. GPU no PhysX +
3DMark Vantage - 3DM Vant. Perf. GPU no PhysX
46186 Points (25%)
ATI Radeon HD 3200
62 -100%
...
42967 -7%
NVIDIA GeForce GTX 780M SLI
43525 -6%
43587 -6%
44188 -4%
44693 -3%
NVIDIA GeForce GTX 980 (Laptop)
45346 -2%
45827 -1%
Intel Arc A380
45909 -1%
45988 0%
NVIDIA GeForce GTX 780 Ti
46186
NVIDIA Quadro P3200
46624 1%
NVIDIA GeForce GTX 970
46855 1%
46945 2%
47209 2%
47227 2%
AMD Radeon R9 Fury
47402 3%
AMD Radeon R9 Nano
48859 6%
49207 7%
51344 11%
...
170928 270%
0%
100%
Unigine Heaven 3.0 - Unigine Heaven 3.0 DX 11
143.4 fps (47%)
Unigine Heaven 2.1 - Heaven 2.1 high
185.9 fps (35%)
0.6 -100%
...
NVIDIA GeForce GTX 590
136 -27%
139.4 -25%
149.7 -19%
150 -19%
151.3 -19%
AMD Radeon HD 8970M Crossfire
154.3 -17%
NVIDIA Quadro M5000M
155.3 -16%
NVIDIA GeForce GTX 780M SLI
163.2 -12%
164.2 -12%
NVIDIA GeForce GTX 780 Ti
185.9
199.4 7%
NVIDIA GeForce GTX 1080 Mobile
224.2 21%
NVIDIA Quadro RTX 5000 Max-Q
236.1 27%
532 186%
0%
100%
- Range of benchmark values for this graphics card
- Average benchmark values for this graphics card
* Smaller numbers mean a higher performance

Game Benchmarks

The following benchmarks stem from our benchmarks of review laptops. The performance depends on the used graphics memory, clock rate, processor, system settings, drivers, and operating systems. So the results don't have to be representative for all laptops with this GPU. For detailed information on the benchmark results, click on the fps number.

F1 2014

F1 2014

2014
low 1024x768
133  fps    + Compare
med. 1366x768
131  fps    + Compare
high 1920x1080
127  fps    + Compare
ultra 1920x1080
118  fps    + Compare
» With all tested laptops playable in detail settings ultra.
low 1024x768
66.1  fps    + Compare
med. 1366x768
65.7  fps    + Compare
high 1920x1080
64.7  fps    + Compare
» With all tested laptops playable in detail settings high.
low 1024x768
89.4  fps    + Compare
med. 1366x768
84.9  fps    + Compare
high 1920x1080
67.9  fps    + Compare
ultra 1920x1080
63.9  fps    + Compare
» With all tested laptops playable in detail settings ultra.
low 1024x768
250.3  fps    + Compare
med. 1366x768
234.4  fps    + Compare
high 1920x1080
166.6  fps    + Compare
ultra 1920x1080
116.3  fps    + Compare
» With all tested laptops playable in detail settings ultra.
low 1280x720
225.8  fps    + Compare
med. 1344x756
194.9  fps    + Compare
high 1920x1080
112.3  fps    + Compare
ultra 1920x1080
88  fps    + Compare
» With all tested laptops playable in detail settings ultra.
Fifa 15

Fifa 15

2014
low 1280x720
326.1  fps    + Compare
high 1366x768
284.4  fps    + Compare
ultra 1920x1080
268.7  fps    + Compare
» With all tested laptops playable in detail settings ultra.
Sims 4

Sims 4

2014
low 1024x768
168.9  fps    + Compare
med. 1366x768
102.1  fps    + Compare
high 1920x1080
92.3  fps    + Compare
ultra 1920x1080
90.4  fps    + Compare
» With all tested laptops playable in detail settings ultra.
low 1024x768
57.1  fps    + Compare
med. 1366x768
67.3  fps    + Compare
high 1920x1080
78.4  fps    + Compare
ultra 1920x1080
90  fps    + Compare
» With all tested laptops playable in detail settings ultra.
low 1024x768
284.3  fps    + Compare
med. 1366x768
159.9  fps    + Compare
high 1920x1080
139.4  fps    + Compare
ultra 1920x1080
122.6  fps    + Compare
» With all tested laptops playable in detail settings ultra.
low 1024x768
94.4  fps    + Compare
med. 1366x768
79.7  fps    + Compare
high 1920x1080
62.7  fps    + Compare
ultra 1920x1080
52.2  fps    + Compare
» With all tested laptops playable in detail settings ultra.
low 1280x720
60  fps    + Compare
med. 1280x720
60  fps    + Compare
high 1920x1080
60  fps    + Compare
ultra 1920x1080
60  fps    + Compare
» With all tested laptops playable in detail settings ultra.
low 1024x768
98.2  fps    + Compare
med. 1366x768
95.7  fps    + Compare
high 1366x768
90.1  fps    + Compare
ultra 1920x1080
58.6  fps    + Compare
» With all tested laptops playable in detail settings ultra.
Thief

Thief

2014
low 1024x768
98.2  fps    + Compare
med. 1366x768
96.3  fps    + Compare
high 1366x768
97.8  fps    + Compare
ultra 1920x1080
76.8  fps    + Compare
» With all tested laptops playable in detail settings ultra.
low 1024x768
170.1  fps    + Compare
med. 1366x768
154  fps    + Compare
high 1366x768
110.6  fps    + Compare
ultra 1920x1080
81.8  fps    + Compare
» With all tested laptops playable in detail settings ultra.
low 1024x768
171  fps    + Compare
med. 1366x768
147.9  fps    + Compare
high 1366x768
136  fps    + Compare
ultra 1920x1080
89  fps    + Compare
» With all tested laptops playable in detail settings ultra.
low 1280x720
99.6  fps    + Compare
med. 1366x768
87.7  fps    + Compare
high 1366x768
79.6  fps    + Compare
ultra 1920x1080
80.6  fps    + Compare
» With all tested laptops playable in detail settings ultra.
Dota 2

Dota 2

2013
low 1024x768
119.7  fps    + Compare
med. 1366x768
118.6  fps    + Compare
ultra 1920x1080
118.1  fps    + Compare
» With all tested laptops playable in detail settings ultra.
GRID 2

GRID 2

2013
low 1024x768
210.4  fps    + Compare
med. 1366x768
159  fps    + Compare
high 1366x768
148.9  fps    + Compare
ultra 1920x1080
129.9  fps    + Compare
» With all tested laptops playable in detail settings ultra.
low 1024x768
141.3  fps    + Compare
med. 1366x768
138.1  fps    + Compare
high 1366x768
123.9  fps    + Compare
ultra 1920x1080
80.9  fps    + Compare
» With all tested laptops playable in detail settings ultra.
low 1280x720
289.9  fps    + Compare
med. 1366x768
237.9  fps    + Compare
high 1366x768
218.6  fps    + Compare
ultra 1920x1080
116.4  fps    + Compare
» With all tested laptops playable in detail settings ultra.
low 1024x768
485.5  fps    + Compare
med. 1366x768
391  fps    + Compare
high 1366x768
309  fps    + Compare
ultra 1920x1080
148.6  fps    + Compare
» With all tested laptops playable in detail settings ultra.
Crysis 3

Crysis 3

2013
low 1024x768
146.2  fps    + Compare
med. 1366x768
135.7  fps    + Compare
high 1366x768
107.2  fps    + Compare
ultra 1920x1080
60.3  fps    + Compare
» With all tested laptops playable in detail settings ultra.
Far Cry 3

Far Cry 3

2012
low 1024x768
131.4  fps    + Compare
med. 1366x768
119.7  fps    + Compare
high 1366x768
100.2  fps    + Compare
ultra 1920x1080
65.6  fps    + Compare
» With all tested laptops playable in detail settings ultra.
low 1024x768
96  fps    + Compare
med. 1366x768
90  fps    + Compare
high 1366x768
80.1  fps    + Compare
ultra 1920x1080
74  fps    + Compare
» With all tested laptops playable in detail settings ultra.
low 1024x768
131.6  fps    + Compare
high 1366x768
72.9  fps    + Compare
ultra 1920x1080
66.4  fps    + Compare
» With all tested laptops playable in detail settings ultra.
lowmed.highultraQHD4K
F1 2014133131127118
The Evil Within66.165.764.7
Ryse: Son of Rome89.484.967.963.9
Alien: Isolation250.3234.4166.6116.3
Middle-earth: Shadow of Mordor225.8194.9112.388
Fifa 15326.1284.4268.7
Sims 4168.9102.192.390.4
Risen 3: Titan Lords57.167.378.490
GRID: Autosport284.3159.9139.4122.6
Watch Dogs94.479.762.752.2
Wolfenstein: The New Order60606060
The Elder Scrolls Online98.295.790.158.6
Thief98.296.397.876.8
Call of Duty: Ghosts170.1154110.681.8
Battlefield 4171147.913689
Saints Row IV99.687.779.680.6
Dota 2119.7118.6118.1
GRID 2210.4159148.9129.9
Metro: Last Light141.3138.1123.980.9
BioShock Infinite289.9237.9218.6116.4
Tomb Raider485.5391309148.6
Crysis 3146.2135.7107.260.3
Far Cry 3131.4119.7100.265.6
Hitman: Absolution969080.174
Guild Wars 2131.672.966.4
< 30 fps
< 60 fps
< 120 fps
≥ 120 fps

1
9
15


12
11


15
9

2
18
4


For more games that might be playable and a list of all games and graphics cards visit our Gaming List

v1.28
log 09. 11:35:53

#0 ran 0s before starting gpusingle class +0s ... 0s

#1 no ids found in url (should be separated by "_") +0s ... 0s

#2 not redirecting to Ajax server +0s ... 0s

#3 did not recreate cache, as it is less than 5 days old! Created at Fri, 08 Nov 2024 19:43:11 +0100 +0.001s ... 0.001s

#4 no comparison url found in template nbc.compare_page_1 needed +0.035s ... 0.036s

#5 no comparison url found in template nbc.compare_page_1 needed +0s ... 0.036s

#6 composed specs +0s ... 0.036s

#7 did output specs +0s ... 0.036s

#8 start showIntegratedCPUs +0s ... 0.036s

#9 getting avg benchmarks for device 5598 +0.026s ... 0.062s

#10 got single benchmarks 5598 +0.007s ... 0.069s

#11 got avg benchmarks for devices +0s ... 0.069s

#12 min, max, avg, median took s +0.22s ... 0.289s

#13 before gaming benchmark output +0s ... 0.289s

#14 Got 96 rows for game benchmarks. +0.003s ... 0.292s

#15 composed SQL query for gamebenchmarks +0s ... 0.292s

#16 got data and put it in $dataArray +0.015s ... 0.307s

#17 benchmarks composed for output. +0.905s ... 1.212s

#18 no comparison url found in template nbc.compare_page_1 needed +0.003s ... 1.215s

#19 return log +0s ... 1.215s

No reviews found for this graphics card.

Please share our article, every link counts!

» Comparison of GPUs
Detailed list of all laptop GPUs sorted by class and performance.

» Benchmark List
Sort and restrict laptop GPUs based on performance in synthetic benchmarks.

» Notebook Gaming List
Playable games for each graphics card and their average FPS results.

Class 1

NVIDIA RTX A6000 Desktop
Radeon Pro W6800 Desktop
NVIDIA Titan RTX Desktop
GeForce RTX 3070 Ti Desktop
Radeon RX 6750 XT Desktop
Radeon RX 6700 XT Desktop
NVIDIA GeForce RTX 3060 Ti Desktop
Radeon RX 6650 XT Desktop
GeForce RTX 2080 (Desktop) Desktop

Class 2

NVIDIA GeForce RTX 3060 Desktop
Titan X Pascal Desktop
Radeon VII Desktop
Radeon RX 5700 XT (Desktop) Desktop
GeForce GTX 1080 (Desktop) Desktop
GeForce RTX 2060 Super (Desktop) Desktop
Radeon RX 5700 (Desktop) Desktop
GeForce RTX 2060 (Desktop) Desktop
RX Vega 64 Desktop
RX Vega 56 Desktop
Radeon RX 5600 XT (Desktop) Desktop
Pro Vega 56 Desktop
GeForce GTX 1660 Ti (Desktop) Desktop
GeForce GTX 1660 Super (Desktop) Desktop
RTX A2000 Desktop
GeForce GTX 1660 (Desktop) Desktop
GeForce GTX 1650 Super (Desktop) Desktop
Radeon R9 Fury Desktop
Radeon R9 Nano Desktop
Radeon RX 580 Desktop
GeForce GTX 1060 (Desktop) Desktop
Radeon RX 570 Desktop
Radeon RX 480 Desktop
Arc A380 Desktop
GeForce GTX 970 Desktop
T1000 Desktop

Class 3

GeForce GTX 960 Desktop
Radeon R7 370 Desktop
GeForce GTX 950 Desktop
T600 Desktop
UHD Graphics 32EUs
UHD Graphics 750
UHD Graphics 730
FirePro W4100 Desktop
FirePro W2100 Desktop

Class 4

VideoCore VII *

* Approximate position of the graphics adapter