Notebookcheck Logo

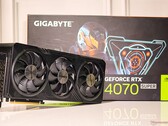
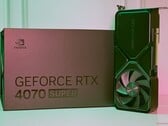
NVIDIA GeForce RTX 4070 SUPER

NVIDIA NVIDIA GeForce RTX 4070 SUPER

NvidiaGeForce RTX 4070 SUPER 是一款基于 Ada Lovelace 架构的高端桌面显卡。它使用 AD104 芯片,提供 7,168 个核心和 12 GB GDDR6X 显存(192 位总线,21 Gbits)。

RTX 4070S 的性能介于较早的 RTX 4070RTX 4070 Ti之间,属于 2024 年高端 GPU 的顶级产品。与 AMD GPU 相比,4070 Super 的速度与 AMD Radeon RX 7800 XT.这使得该 GPU 最适合 QHD 和高要求游戏(如《阿凡达潘多拉边境》、《阿伦觉醒 2》、《赛博朋克 2033》或《F1 23》)的最大细节。要求不高的游戏也能以 4K 格式流畅运行(《AC Mirage》、《Cod MW 3》......)。

AD104 芯片在台积电以 5 纳米(4N,带 EUV)工艺生产,TGP(图形总功率)为 200 瓦。

GeForce RTX 4000 Series

NVIDIA GeForce RTX 4090 16384 @ 2.24 - 2.52 GHz384 Bit @ 21000 MHz
NVIDIA GeForce RTX 4080 Super 10240 @ 2.3 - 2.55 GHz256 Bit @ 23000 MHz
NVIDIA GeForce RTX 4080 9728 @ 2.21 - 2.51 GHz256 Bit @ 22400 MHz
NVIDIA GeForce RTX 4070 Ti SUPER 8448 @ 2.34 - 2.61 GHz256 Bit @ 21000 MHz
NVIDIA GeForce RTX 4070 Ti 7680 @ 2.31 - 2.61 GHz192 Bit @ 21000 MHz
NVIDIA GeForce RTX 4070 SUPER 7168 @ 1.98 - 2.48 GHz192 Bit @ 21000 MHz
NVIDIA GeForce RTX 4070 5888 @ 1.92 - 2.48 GHz192 Bit @ 21000 MHz
NVIDIA GeForce RTX 4060 Ti 16G 4352 @ 2.31 - 2.54 GHz128 Bit @ 18000 MHz
NVIDIA GeForce RTX 4060 Ti 8G 4352 @ 2.31 - 2.54 GHz128 Bit @ 18000 MHz
NVIDIA GeForce RTX 4060 3072 @ 1.83 - 2.46 GHz128 Bit @ 17000 MHz
CodenameAD104
ArchitectureAda Lovelace
Pipelines7168 - unified
TMUs224
ROPs80
Raytracing Cores56
Tensor / AI Cores224
Core Speed1980 - 2475 (Boost) MHz
Theoretical Performance35.5 TFLOPS FP16, 35.5 TFLOPS FP32, 0.55 TFLOPS FP64
CacheL2: 48 MB
Memory Speed21000 effective = 1313 MHz
Memory Bus Width192 Bit
Memory TypeGDDR6X
Max. Amount of Memory12 GB
Shared Memoryno
Memory Bandwidth504.2 GB/s
APIDirectX 12 Ultimate, Shader 6.7, OpenGL 4.6, OpenCL 3.0, Vulkan 1.3
Power Consumption220 Watt
Transistor Count35.8 Billion
Die Size 295 mm²
technology5 nm
PCIe4.0 x16
Displays4 Displays (max.), HDMI 2.1, DisplayPort 1.4a
Date of Announcement17.01.2024
PredecessorNVIDIA GeForce RTX 4070

Benchmarks

Performance Rating - 3DMark 11 + Fire Strike + Time Spy
21.6 pt (65%)
3DMark - 3DMark Ice Storm Unlimited Graphics
min: 763636     avg: 766679     median: 766678 (77%)     max: 769721 Points
3DMark - 3DMark Ice Storm Extreme Graphics
min: 515758     avg: 517177     median: 517176 (61%)     max: 518595 Points
3DMark - 3DMark Cloud Gate Graphics
min: 170014     avg: 171098     median: 171098 (42%)     max: 172182 Points
3DMark - 3DMark Ice Storm Graphics
min: 559629     avg: 564567     median: 564567 (62%)     max: 569505 Points
3DMark - 3DMark Wild Life Unlimited
min: 134699     avg: 135490     median: 135490 (68%)     max: 136280 Points
Power Consumption - Furmark Stress Test Power Consumption - external Monitor *
min: 333     avg: 359     median: 345 (49%)     max: 413 Watt
0255075100125150175200225250275300325350375400425Tooltip
Power Consumption - The Witcher 3 Power Consumption - external Monitor *
min: 372     avg: 381.3     median: 382.5 (53%)     max: 388 Watt
0255075100125150175200225250275300325350375400425Tooltip
- Range of benchmark values for this graphics card
red legend - Average benchmark values for this graphics card
* Smaller numbers mean a higher performance

Game Benchmarks

The following benchmarks stem from our benchmarks of review laptops. The performance depends on the used graphics memory, clock rate, processor, system settings, drivers, and operating systems. So the results don't have to be representative for all laptops with this GPU. For detailed information on the benchmark results, click on the fps number.

med. 1920x1080
137.4  fps    + Compare + 📈 Graph
high 1920x1080
122.1 129.9 ~ 126 fps    + Compare + 📈 Graph
ultra 1920x1080
96.2 101.2 ~ 99 fps    + Compare + 📈 Graph
QHD 2560x1440
61.5 67.6 ~ 65 fps    + Compare + 📈 Graph
4K 3840x2160
33.9 34.6 ~ 34 fps    + Compare + 📈 Graph
4K DLSS 3840x2160
56.6 60.5 ~ 59 fps    + Compare + 📈 Graph
» With all tested laptops playable in detail settings ultra.
med. 1920x1080
226  fps    + Compare
high 1920x1080
179 184 ~ 182 fps    + Compare
ultra 1920x1080
165 166 ~ 166 fps    + Compare
QHD 2560x1440
118 120 ~ 119 fps    + Compare
4K 3840x2160
70 71 ~ 71 fps    + Compare
4K DLSS 3840x2160
99 100 ~ 100 fps    + Compare
» With all tested laptops playable in detail settings ultra.
med. 1920x1080
112.8  fps    + Compare + 📈 Graph
high 1920x1080
105.1 114.1 ~ 110 fps    + Compare + 📈 Graph
QHD 2560x1440
73.8 79.7 ~ 77 fps    + Compare + 📈 Graph
4K 3840x2160
40 42.7 ~ 41 fps    + Compare + 📈 Graph
4K DLSS 3840x2160
28.9 44.2 ~ 37 fps    + Compare + 📈 Graph
» With all tested laptops playable in detail settings high.
Additional Benchmarks
High Preset + High Ray Tracing 1920x1080
57.1
61.6
med. 1920x1080
205  fps    + Compare
high 1920x1080
193 204 ~ 199 fps    + Compare
ultra 1920x1080
157 169 ~ 163 fps    + Compare
QHD 2560x1440
121 130 ~ 126 fps    + Compare
4K 3840x2160
72 77 ~ 75 fps    + Compare
4K DLSS 3840x2160
99 106 ~ 103 fps    + Compare
» With all tested laptops playable in detail settings ultra.
low 1920x1080
186  fps    + Compare
med. 1920x1080
181.8  fps    + Compare
high 1920x1080
156.3 162.1 ~ 159 fps    + Compare
ultra 1920x1080
136.2 141.9 ~ 139 fps    + Compare
QHD 2560x1440
83.8 89.6 ~ 87 fps    + Compare
4K 3840x2160
38.4 38.9 ~ 39 fps    + Compare
» With all tested laptops playable in detail settings ultra.
Additional Benchmarks
Low Preset (FSR off) 1280x720
186.9
Ray Tracing Ultra Preset (DLSS off) 1920x1080
70.4
74
Ray Tracing Ultra Preset (DLSS off, no Path Tracing) 3840x2160
20.5
21.9
med. 1920x1080
228  fps    + Compare + 📈 Graph
high 1920x1080
198.8 203 ~ 201 fps    + Compare + 📈 Graph
ultra 1920x1080
194.3 203 ~ 199 fps    + Compare + 📈 Graph
QHD 2560x1440
140.3 142.7 ~ 142 fps    + Compare + 📈 Graph
4K 3840x2160
71.6 71.7 ~ 72 fps    + Compare + 📈 Graph
4K DLSS 3840x2160
115.4 119.7 ~ 118 fps    + Compare + 📈 Graph
» With all tested laptops playable in detail settings ultra.
F1 23

F1 23

2023
low 1920x1080
380 381 ~ 381 fps    + Compare
med. 1920x1080
398 406 ~ 402 fps    + Compare
high 1920x1080
344 357 ~ 351 fps    + Compare
ultra 1920x1080
122.4 125.9 ~ 124 fps    + Compare
QHD 2560x1440
78 81.2 ~ 80 fps    + Compare
4K 3840x2160
39 40.7 ~ 40 fps    + Compare
4K DLSS 3840x2160
66.8 69.7 ~ 68 fps    + Compare
» With all tested laptops playable in detail settings ultra.
Additional Benchmarks
Ultra Low Preset TAA 1280x720
312
331
med. 1920x1080
208  fps    + Compare
high 1920x1080
201.7 216.1 ~ 209 fps    + Compare
ultra 1920x1080
149.6 155.7 ~ 153 fps    + Compare
QHD 2560x1440
118 123.8 ~ 121 fps    + Compare
4K 3840x2160
73.6 78 ~ 76 fps    + Compare
» With all tested laptops playable in detail settings ultra.
Additional Benchmarks
Ultra Preset (without FSR Upscaling) + Full Ray-Tracing 1920x1080
94.1
97.6
F1 22

F1 22

2022
low 1920x1080
363 381 ~ 372 fps    + Compare
med. 1920x1080
386 403 ~ 395 fps    + Compare
high 1920x1080
321 340 ~ 331 fps    + Compare
ultra 1920x1080
128.7 136.3 ~ 133 fps    + Compare
QHD 2560x1440
83.1 88.8 ~ 86 fps    + Compare
4K 3840x2160
41.9 44.6 ~ 43 fps    + Compare
» With all tested laptops playable in detail settings ultra.
Additional Benchmarks
Ultra Low Preset 16xAF TAA 1280x720
452
492
med. 1920x1080
285  fps    + Compare + 📈 Graph
high 1920x1080
279 284 ~ 282 fps    + Compare + 📈 Graph
ultra 1920x1080
278 291 ~ 285 fps    + Compare + 📈 Graph
QHD 2560x1440
189.6 194.8 ~ 192 fps    + Compare + 📈 Graph
4K 3840x2160
87.5 92.7 ~ 90 fps    + Compare + 📈 Graph
» With all tested laptops playable in detail settings ultra.
Additional Benchmarks
Highest Settings + Maximum Ray Tracing 1920x1080
128.3
132.9
low 1920x1080
195.7  fps    + Compare
med. 1920x1080
184.1  fps    + Compare
high 1920x1080
156.5 161.8 ~ 159 fps    + Compare
ultra 1920x1080
141 146 ~ 144 fps    + Compare
QHD 2560x1440
91.3 92.8 ~ 92 fps    + Compare
4K 3840x2160
43.5 44.9 ~ 44 fps    + Compare
» With all tested laptops playable in detail settings ultra.
Additional Benchmarks
Low Preset 1280x720
191.5
Ray Tracing Ultra Preset (DLSS off) 1920x1080
68.9
71.5
Ray Tracing Ultra Preset (DLSS off) 3840x2160
20
21.1
med. 1920x1080
201  fps    + Compare + 📈 Graph
high 1920x1080
150.5 157 ~ 154 fps    + Compare + 📈 Graph
QHD 2560x1440
108 109.7 ~ 109 fps    + Compare + 📈 Graph
4K 3840x2160
52.8 54.5 ~ 54 fps    + Compare + 📈 Graph
» With all tested laptops playable in detail settings high.
Additional Benchmarks
High Quality Raytracing 1920x1080
70.9
72.1
Far Cry 6

Far Cry 6

2021
med. 1920x1080
206  fps    + Compare + 📈 Graph
high 1920x1080
181.8 193.7 ~ 188 fps    + Compare + 📈 Graph
ultra 1920x1080
143.9 160 173.6 ~ 159 fps    + Compare + 📈 Graph
QHD 2560x1440
139.4 145.9 ~ 143 fps    + Compare + 📈 Graph
4K 3840x2160
79 82.7 ~ 81 fps    + Compare + 📈 Graph
» With all tested laptops playable in detail settings ultra.
Additional Benchmarks
Ultra Graphics Quality + HD Textures + DXR TAA 1920x1080
134
144
med. 1920x1080
169.2  fps    + Compare + 📈 Graph
high 1920x1080
159.1  fps    + Compare + 📈 Graph
ultra 1920x1080
135.5 142.3 ~ 139 fps    + Compare + 📈 Graph
QHD 2560x1440
106 109.2 ~ 108 fps    + Compare + 📈 Graph
4K 3840x2160
61.4 63.4 ~ 62 fps    + Compare + 📈 Graph
» With all tested laptops playable in detail settings ultra.
Additional Benchmarks
Ultra Preset + Ultra Ray Tracing (DX12) 1920x1080
87.8
91.1
med. 1920x1080
233  fps    + Compare + 📈 Graph
high 1920x1080
216 226 ~ 221 fps    + Compare + 📈 Graph
QHD 2560x1440
156.8 161.5 ~ 159 fps    + Compare + 📈 Graph
4K 3840x2160
80.5 83.2 ~ 82 fps    + Compare + 📈 Graph
» With all tested laptops playable in detail settings high.
med. 1920x1080
193.6  fps    + Compare
high 1920x1080
179.3 184.2 ~ 182 fps    + Compare
ultra 1920x1080
163.4 166.6 ~ 165 fps    + Compare
QHD 2560x1440
125.4 131.2 ~ 128 fps    + Compare
4K 3840x2160
66.2 68.9 ~ 68 fps    + Compare
» With all tested laptops playable in detail settings ultra.
Control

Control

2019
med. 1920x1080
224  fps    + Compare + 📈 Graph
high 1920x1080
172.7 180.1 ~ 176 fps    + Compare + 📈 Graph
QHD 2560x1440
112.6 115.5 ~ 114 fps    + Compare + 📈 Graph
4K 3840x2160
57.4 58.2 ~ 58 fps    + Compare + 📈 Graph
4K DLSS 3840x2160
67.1 69 ~ 68 fps    + Compare + 📈 Graph
» With all tested laptops playable in detail settings high.
Additional Benchmarks
High Quality Preset & High Ray Tracing Preset (DX12) 1920x1080
113.8
116.7
High Quality Preset & High Ray Tracing Preset (DX12) 3840x2160
34.7
35.6
low 1280x720
267  fps    + Compare
med. 1920x1080
224  fps    + Compare
high 1920x1080
178.8 186.1 ~ 182 fps    + Compare
ultra 1920x1080
144.8 150.6 ~ 148 fps    + Compare
QHD 2560x1440
116.1 120.8 ~ 118 fps    + Compare
4K 3840x2160
72.8 76.1 ~ 74 fps    + Compare
» With all tested laptops playable in detail settings ultra.
Additional Benchmarks
Ultra Quality DXR 16xAF 1920x1080
121.7
126.3
med. 1920x1080
265  fps    + Compare
high 1920x1080
257 260 ~ 259 fps    + Compare
ultra 1920x1080
244 255 ~ 250 fps    + Compare
QHD 2560x1440
165.3 188 ~ 177 fps    + Compare
4K 3840x2160
91.5 96.7 ~ 94 fps    + Compare
» With all tested laptops playable in detail settings ultra.
Strange Brigade

Strange Brigade

2018
low 1280x720
570 601 ~ 586 fps    + Compare
med. 1920x1080
398 469 ~ 434 fps    + Compare
high 1920x1080
418 437 ~ 428 fps    + Compare
ultra 1920x1080
376 385 ~ 381 fps    + Compare
QHD 2560x1440
260 270 ~ 265 fps    + Compare
4K 3840x2160
130 134.7 ~ 132 fps    + Compare
» With all tested laptops playable in detail settings ultra.
Far Cry 5

Far Cry 5

2018
med. 1920x1080
203  fps    + Compare + 📈 Graph
high 1920x1080
199 201 ~ 200 fps    + Compare + 📈 Graph
ultra 1920x1080
188 191 ~ 190 fps    + Compare + 📈 Graph
QHD 2560x1440
181 185 ~ 183 fps    + Compare + 📈 Graph
4K 3840x2160
101 104 ~ 103 fps    + Compare + 📈 Graph
» With all tested laptops playable in detail settings ultra.
low 1280x720
226 233 ~ 230 fps    + Compare
med. 1920x1080
196.3 196.4 ~ 196 fps    + Compare
high 1920x1080
151.9 152.4 ~ 152 fps    + Compare
4K 3840x2160
129.1 131.7 ~ 130 fps    + Compare
» With all tested laptops playable in detail settings high.
low 1280x720
235 244 ~ 240 fps    + Compare
med. 1920x1080
234 235 ~ 235 fps    + Compare
high 1920x1080
194 197.1 ~ 196 fps    + Compare
QHD 2560x1440
148 150.5 ~ 149 fps    + Compare
4K 3840x2160
84.8 85.2 ~ 85 fps    + Compare
» With all tested laptops playable in detail settings high.
low 1280x720
244 250 ~ 247 fps    + Compare
med. 1366x768
228 229 ~ 229 fps    + Compare
high 1920x1080
221 223 ~ 222 fps    + Compare
ultra 1920x1080
208 209 ~ 209 fps    + Compare
4K 3840x2160
192.9 202 ~ 197 fps    + Compare
» With all tested laptops playable in detail settings ultra.
med. 1366x768
566  fps    + Compare + 📈 Graph
high 1920x1080
406 418 ~ 412 fps    + Compare + 📈 Graph
ultra 1920x1080
191.9 210 ~ 201 fps    + Compare + 📈 Graph
QHD 2560x1440
148.9 159.1 ~ 154 fps    + Compare + 📈 Graph
4K 3840x2160
129.4 136.7 ~ 133 fps    + Compare + 📈 Graph
» With all tested laptops playable in detail settings ultra.
Additional Benchmarks
Ultra Graphics & Postprocessing (HBAO+) 3840x2160
84.5
89.1
Medium Graphics & Postprocessing 1920x1080
471
GTA V

GTA V

2015
low 1024x768
187.7 188.3 ~ 188 fps    + Compare
med. 1366x768
187.6 187.9 ~ 188 fps    + Compare
high 1920x1080
186.9 186.9 ~ 187 fps    + Compare
ultra 1920x1080
158.8 160 ~ 159 fps    + Compare
QHD 2560x1440
147.2 148.2 ~ 148 fps    + Compare
4K 3840x2160
164.6 166.6 ~ 166 fps    + Compare
» With all tested laptops playable in detail settings ultra.
Additional Benchmarks
Highest Settings possible 16xAF 4xMSAA + FXAA 3840x2160
68.5
69
Normal/Off 4xAF 1920x1080
187.4
188.2
Lowest Settings possible 1920x1080
187.7
187.7
lowmed.highultraQHD4K
Avatar Frontiers of Pandora137.4126996534
Call of Duty Modern Warfare 3 202322618216611971
Alan Wake 2112.81107741
Assassin's Creed Mirage20519916312675
Cyberpunk 2077 2.1 Phantom Liberty186181.81591398739
Baldur's Gate 322820119914272
F1 233814023511248040
The Callisto Protocol207.9720915312176
F1 223723953311338643
Ghostwire Tokyo28528228519290
Cyberpunk 2077 1.6195.7184.11591449244
Dying Light 220115410954
Far Cry 620618815914381
Watch Dogs Legion169.2159.113910862
Mafia Definitive Edition23322115982
Borderlands 3193.618216512868
Control22417611458
Metro Exodus26722418214811874
Shadow of the Tomb Raider26525925017794
Strange Brigade586434428381265132
Far Cry 5203200190183103
X-Plane 11.11230196152130
Final Fantasy XV Benchmark24023519614985
Dota 2 Reborn247229222209197
The Witcher 3566412201154133
GTA V188188187159148166
< 30 fps
< 60 fps
< 120 fps
≥ 120 fps


10


1
25


1
25


1
19


11
13

8
13
5

For more games that might be playable and a list of all games and graphics cards visit our Gaming List

v1.28
log 21. 16:35:11

#0 ran 0s before starting gpusingle class +0s ... 0s

#1 no ids found in url (should be separated by "_") +0s ... 0s

#2 not redirecting to Ajax server +0s ... 0s

#3 did not recreate cache, as it is less than 5 days old! Created at Thu, 19 Dec 2024 05:31:27 +0100 +0.001s ... 0.001s

#4 no comparison url found in template nbc.compare_page_1 needed +0.033s ... 0.034s

#5 no comparison url found in template nbc.compare_page_1 needed +0s ... 0.034s

#6 no comparison url found in template nbc.compare_page_1 needed +0s ... 0.035s

#7 no comparison url found in template nbc.compare_page_1 needed +0s ... 0.035s

#8 no comparison url found in template nbc.compare_page_1 needed +0s ... 0.035s

#9 no comparison url found in template nbc.compare_page_1 needed +0s ... 0.036s

#10 no comparison url found in template nbc.compare_page_1 needed +0s ... 0.036s

#11 no comparison url found in template nbc.compare_page_1 needed +0s ... 0.036s

#12 no comparison url found in template nbc.compare_page_1 needed +0s ... 0.036s

#13 composed specs +0.001s ... 0.037s

#14 did output specs +0s ... 0.037s

#15 start showIntegratedCPUs +0s ... 0.037s

#16 getting avg benchmarks for device 12293 +0.028s ... 0.065s

#17 got single benchmarks 12293 +0.01s ... 0.076s

#18 got avg benchmarks for devices +0s ... 0.076s

#19 min, max, avg, median took s +0.53s ... 0.606s

#20 before gaming benchmark output +0s ... 0.606s

#21 Got 256 rows for game benchmarks. +0.119s ... 0.725s

#22 composed SQL query for gamebenchmarks +0s ... 0.725s

#23 got data and put it in $dataArray +0.016s ... 0.742s

#24 benchmarks composed for output. +1.751s ... 2.493s

#25 no comparison url found in template nbc.compare_page_1 needed +0.005s ... 2.498s

#26 return log +0s ... 2.498s

Please share our article, every link counts!
Mail Logo

» Comparison of GPUs
Detailed list of all laptop GPUs sorted by class and performance.

» Benchmark List
Sort and restrict laptop GPUs based on performance in synthetic benchmarks.

» Notebook Gaming List
Playable games for each graphics card and their average FPS results.

Class 1

NVIDIA RTX A6000 Desktop
Radeon Pro W6800 Desktop
NVIDIA Titan RTX Desktop
GeForce RTX 3070 Ti Desktop
Radeon RX 6750 XT Desktop
Radeon RX 6700 XT Desktop
NVIDIA GeForce RTX 3060 Ti Desktop
Arc B580
Radeon RX 6650 XT Desktop
GeForce RTX 2080 (Desktop) Desktop

Class 2

NVIDIA GeForce RTX 3060 Desktop
Titan X Pascal Desktop
Radeon VII Desktop
Radeon RX 5700 XT (Desktop) Desktop
GeForce GTX 1080 (Desktop) Desktop
GeForce RTX 2060 Super (Desktop) Desktop
Radeon RX 5700 (Desktop) Desktop
GeForce RTX 2060 (Desktop) Desktop
RX Vega 64 Desktop
RX Vega 56 Desktop
Radeon RX 5600 XT (Desktop) Desktop
Pro Vega 56 Desktop
GeForce GTX 1660 Ti (Desktop) Desktop
GeForce GTX 1660 Super (Desktop) Desktop
RTX A2000 Desktop
GeForce GTX 1660 (Desktop) Desktop
GeForce GTX 1650 Super (Desktop) Desktop
Radeon R9 Fury Desktop
Radeon R9 Nano Desktop
Radeon RX 580 Desktop
GeForce GTX 1060 (Desktop) Desktop
Radeon RX 570 Desktop
Radeon RX 480 Desktop
Arc A380 Desktop
GeForce GTX 970 Desktop

Class 3

T1000 Desktop
GeForce GTX 960 Desktop
Radeon R7 370 Desktop
GeForce GTX 950 Desktop
T600 Desktop
UHD Graphics 32EUs
UHD Graphics 750
UHD Graphics 730
FirePro W4100 Desktop
FirePro W2100 Desktop

Class 4

VideoCore VII *

* Approximate position of the graphics adapter

Klaus Hinum (Update: 2024-01-17)