

AMD Trinity和FX台式机处理器测评

For the original German article, see here.
Although we usually focus on mobile devices like smartphones, tablets, and notebooks, we will have a look at the current CPU series from AMD in this test. In the center of our interest are especially the three Trinity-APUs A4-5300, A8-5600K, and A10-5800K, which we will compare to the competition from Intel and the current CPU flagship from AMD, the FX-8350.
Apart from the performance of the processors, we will also evaluate the performance of their integrated graphics solutions. The one of the Trinity family is said to be especially powerful. How do the "smaller APUs" with partly significantly less units perform? Can they run current games smoothly with decent graphics quality?
对于原来的德语文章,见这里。
虽然我们通常专注于移动设备,如智能手机,平板电脑和笔记本电脑,我们将看看在当前的CPU系列AMD在本次测试。在我们的兴趣的中心,尤其是三三位一体的APU A4-5300,A8-5600K,A10-5800K,我们将与英特尔的竞争和当前的CPU来自AMD,FX-8350旗舰。
除了从处理器的性能,我们也将评估其集成图形解决方案的性能。三位一体的家族之一,据说是特别强大的。 “小APU的”少部分显着的单位怎么执行?他们能否顺利运行目前的游戏与体面的图形质量?
Test system
The components of our test systems partly directly come from the manufacturers and partly from retail shops:
- AMD processors: FX-8350, A10-5800K, A8-5600K, A4-5300 (made available by: AMD)
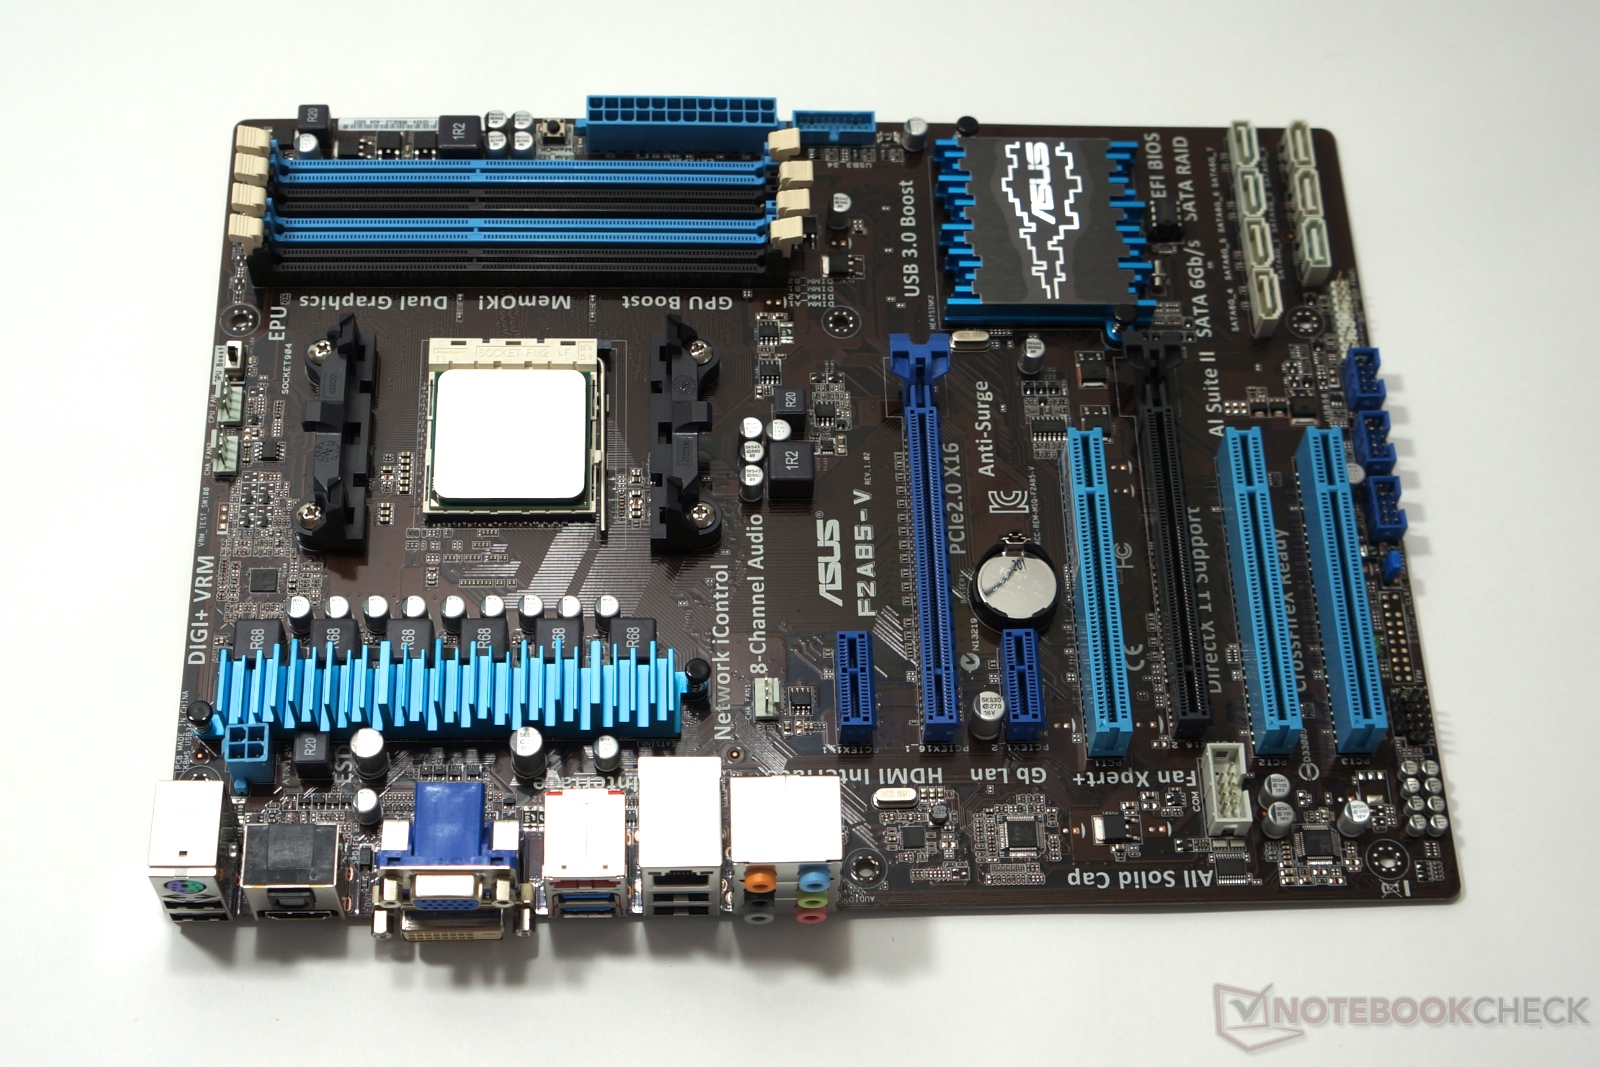
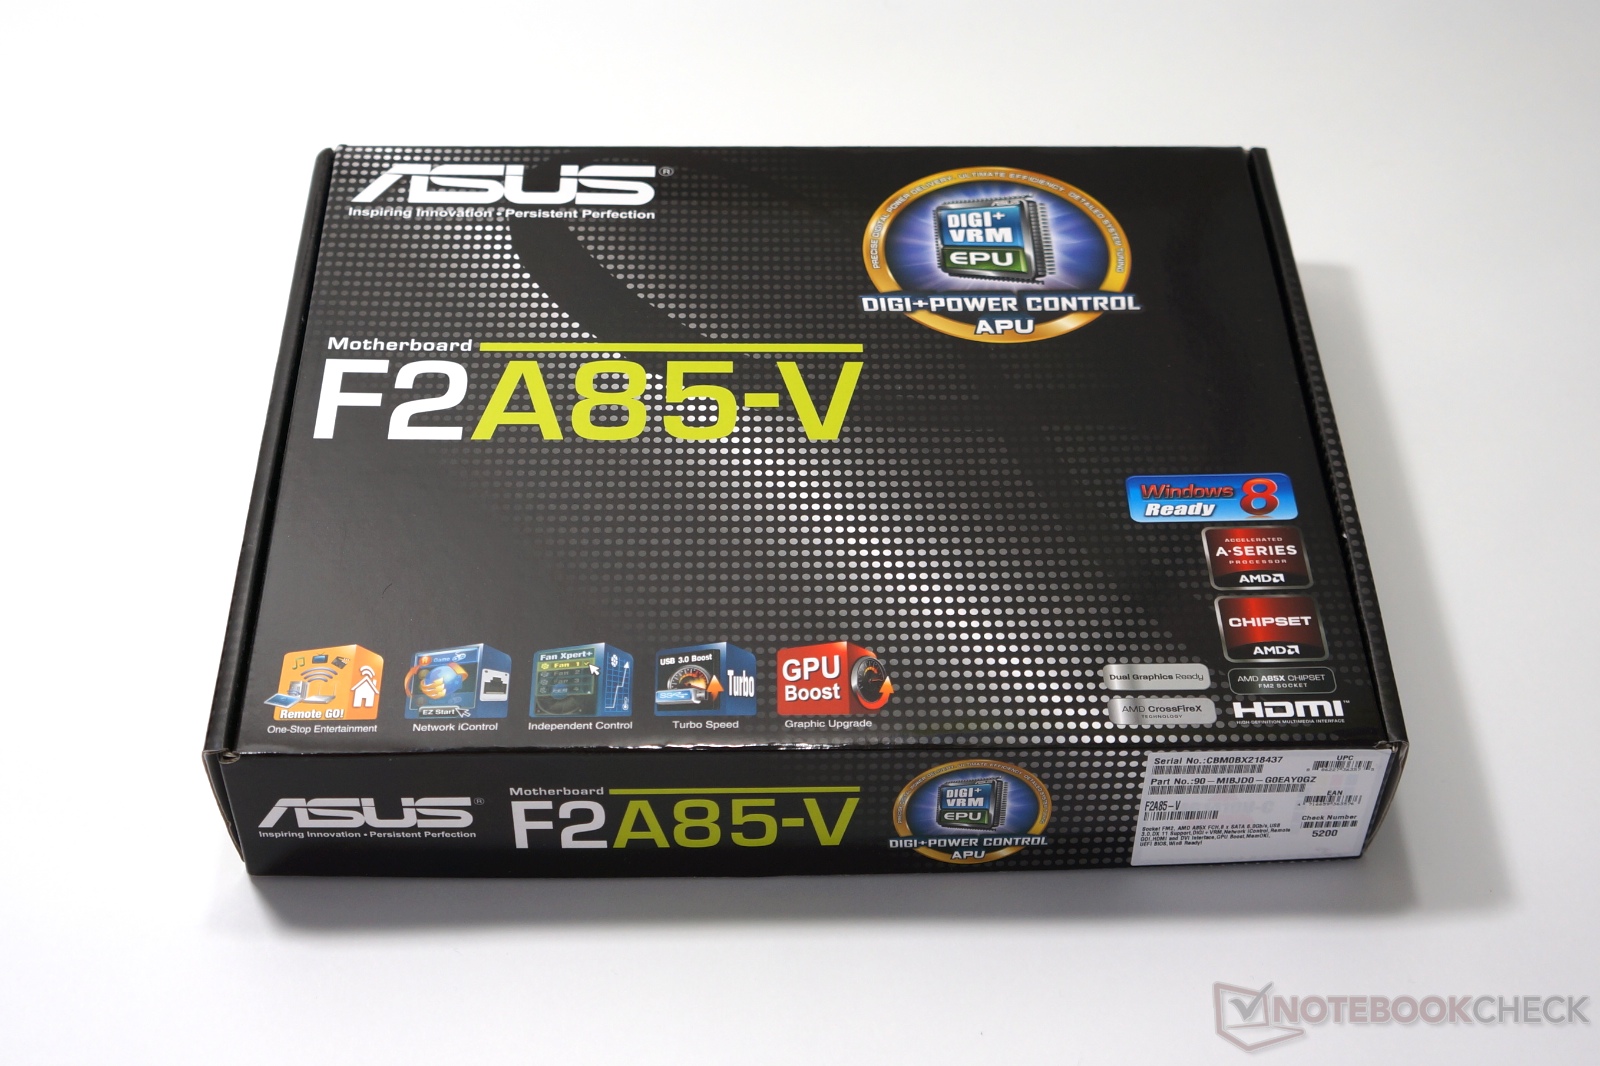
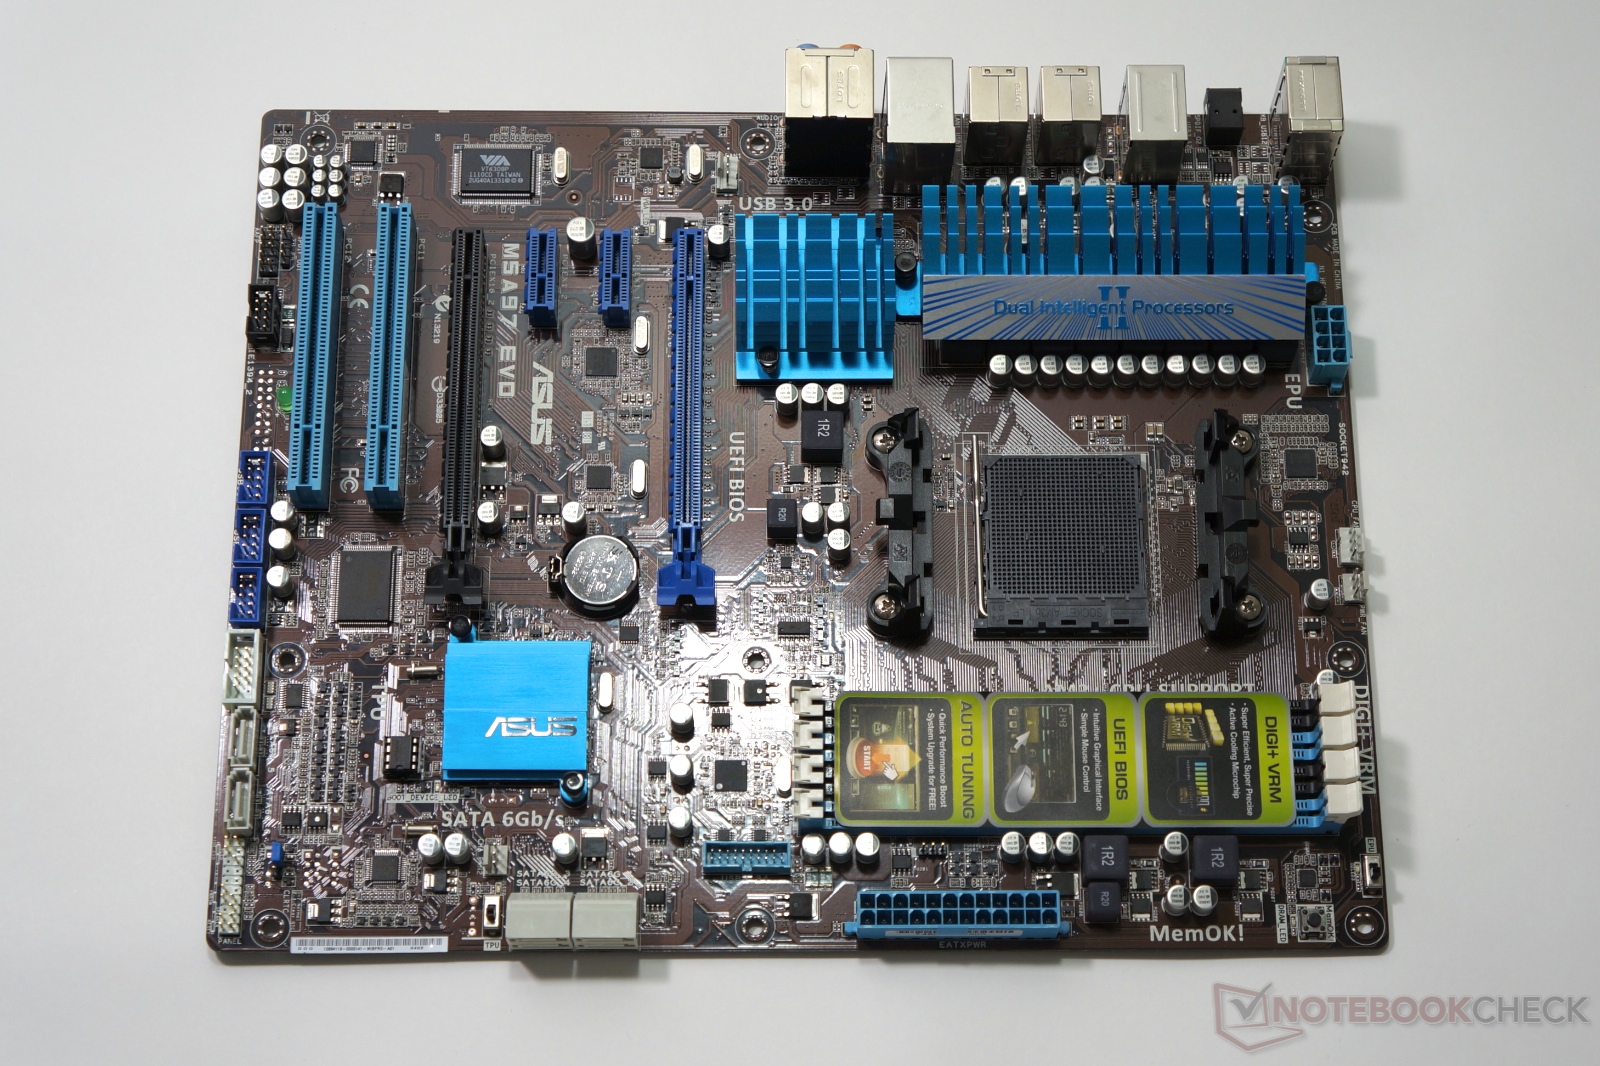
- AMD mainboards: Asus F2A85-V (FM2), M5A97 Evo (AM3+, BIOS 1006) (made available by: Asus)
- Intel processors: Core i7-3770K, Core i5-3550, Core i5-3470 (made available by: Intel); Core i3-3220, Pentium G860 (made available by: pco.co.at)
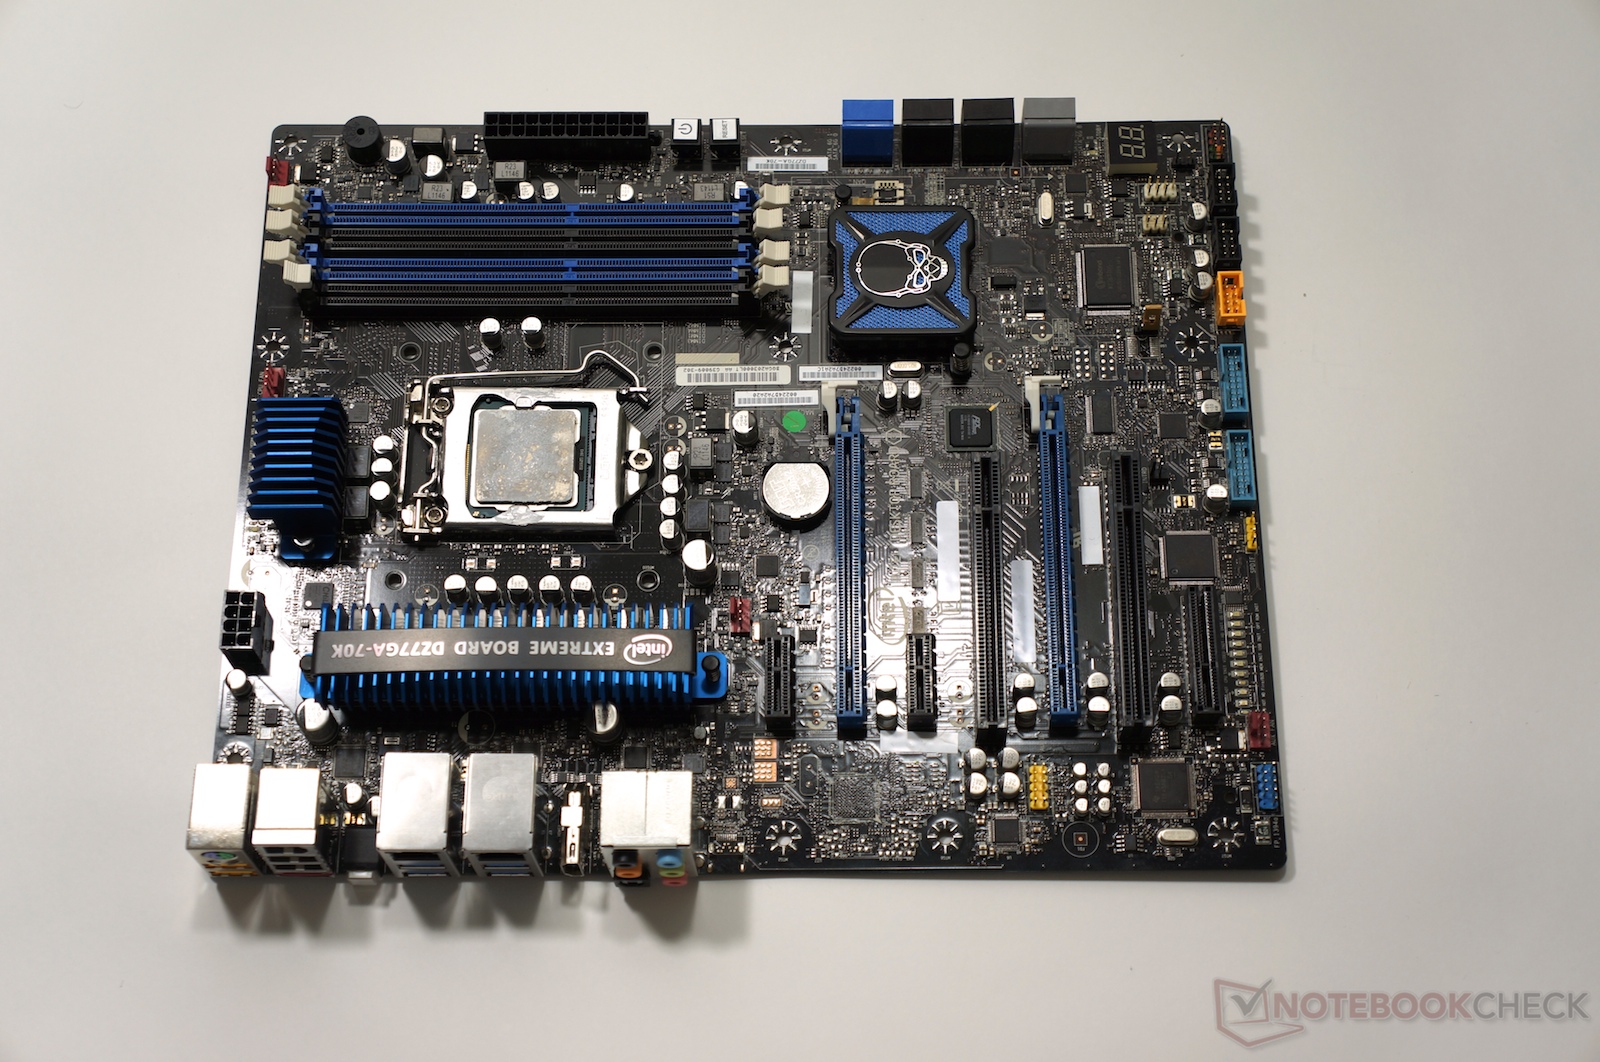
- Intel mainboard: DZ77GA-70K Pre-Sample (made available by: Intel)
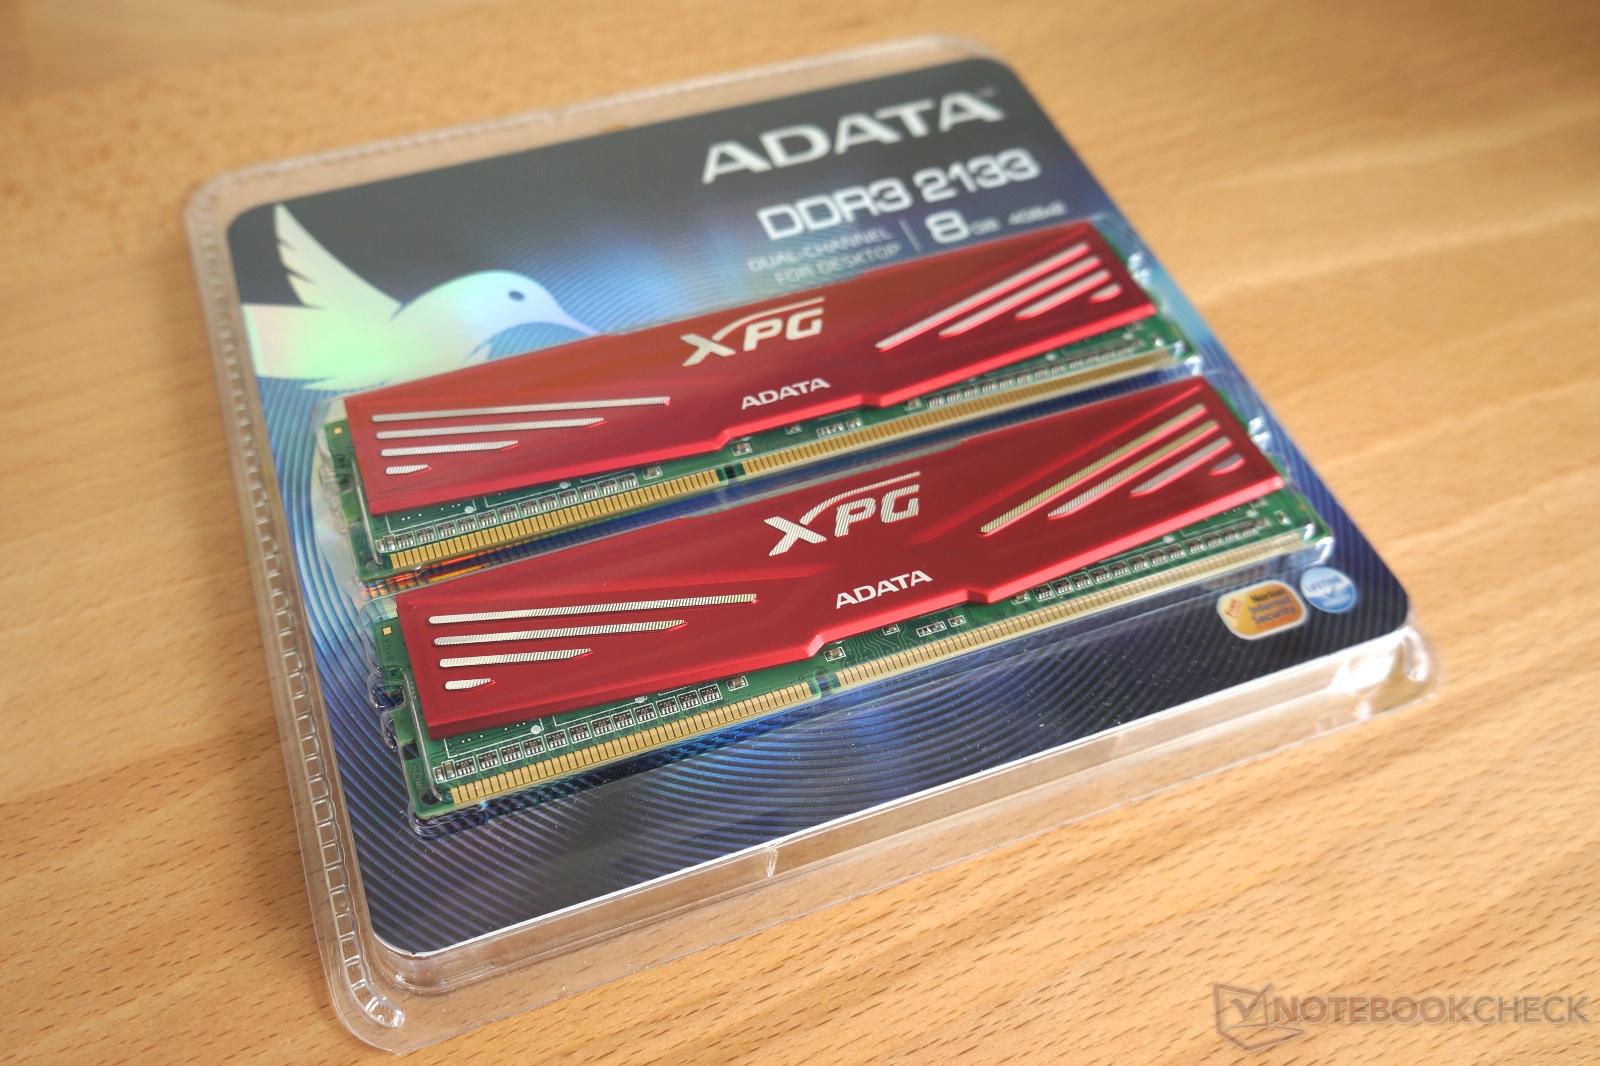
- RAM: 2x 4 GB ADATA XPG X Series DDR3-2133 (made available by: Adata)
- System drives: Intel SSD 520 and Samsung SSD 840 Pro
- Graphics drivers: 9.17.10.2932 (Intel), Catalyst 13.2 (AMD)

Contenders
An overview of the most important technical details of the AMD processors is available below. The linked special articles of our CPU database provide detailed information. The following Intel CPUs are also not described closer here: Pentium G860, Core i3-3220, Core i5-3470, Core i5-3550, and Core i7-3770K. In addition, we want to refer to our special articles to the Trinity architecture and the Ivy-Bridge series.
- AMD A10-5800K: 2 modules (4 integer cores, 2 FPUs), 3.8 - 4.2 GHz, Radeon HD 7660D (384 shader units, 800 MHz), 100 Watt TDP;
Special feature: free multiplier
- AMD A8-5600K: 2 modules (4 integer cores, 2 FPUs), 3.6 - 3.9 GHz, Radeon HD 7560D (256 shader units, 760 MHz), 100 Watt TDP;
Special feature: free multiplier
- AMD A4-5300: 1 module (2 integer cores, 1 FPU), 3.4 - 3.6 GHz,
Radeon HD 7480D (128 shader units, 724 MHz), 65 Watt TDP
- AMD FX-8350: 4 modules (8 integer cores, 4 FPUs), 4.0 - 4.2 GHz, 125 Watt TDP; Special features: free multiplier, no graphics unit
Processor Performance
| Cinebench R10 | |
| Rendering Single CPUs 64Bit (sort by value) | |
| A10-5800K DDR3-1600 | |
| A10-5800K DDR3-1866 | |
| A8-5600K | |
| A4-5300 | |
| FX-8350 | |
| i7-3770K | |
| Pentium G860 | |
| Core i3-3220 | |
| Core i5-3550 | |
| Core i5-3470 | |
| Rendering Multiple CPUs 64Bit (sort by value) | |
| A10-5800K DDR3-1600 | |
| A10-5800K DDR3-1866 | |
| A8-5600K | |
| A4-5300 | |
| FX-8350 | |
| i7-3770K | |
| Pentium G860 | |
| Core i3-3220 | |
| Core i5-3550 | |
| Core i5-3470 | |
| Rendering Single 32Bit (sort by value) | |
| A10-5800K DDR3-1600 | |
| A10-5800K DDR3-1866 | |
| A8-5600K | |
| A4-5300 | |
| FX-8350 | |
| i7-3770K | |
| Pentium G860 | |
| Core i3-3220 | |
| Core i5-3550 | |
| Core i5-3470 | |
| Rendering Multiple CPUs 32Bit (sort by value) | |
| A10-5800K DDR3-1600 | |
| A10-5800K DDR3-1866 | |
| A8-5600K | |
| A4-5300 | |
| FX-8350 | |
| i7-3770K | |
| Pentium G860 | |
| Core i3-3220 | |
| Core i5-3550 | |
| Core i5-3470 | |
| Cinebench R11.5 | |
| CPU Single 64Bit (sort by value) | |
| A10-5800K DDR3-1600 | |
| A10-5800K DDR3-1866 | |
| A8-5600K | |
| A4-5300 | |
| FX-8350 | |
| i7-3770K | |
| Pentium G860 | |
| Core i3-3220 | |
| Core i5-3550 | |
| Core i5-3470 | |
| CPU Multi 64Bit (sort by value) | |
| A10-5800K DDR3-1600 | |
| A10-5800K DDR3-1866 | |
| A8-5600K | |
| A4-5300 | |
| FX-8350 | |
| i7-3770K | |
| Pentium G860 | |
| Core i3-3220 | |
| Core i5-3550 | |
| Core i5-3470 | |
| Geekbench 2 - 32 Bit - Total Score (sort by value) | |
| A10-5800K DDR3-1600 | |
| A10-5800K DDR3-1866 | |
| A8-5600K | |
| A4-5300 | |
| FX-8350 | |
| i7-3770K | |
| Pentium G860 | |
| Core i3-3220 | |
| Core i5-3550 | |
| Core i5-3470 | |
| wPrime 2.10 - 32m (sort by value) | |
| A10-5800K DDR3-1600 | |
| A10-5800K DDR3-1866 | |
| A8-5600K | |
| A4-5300 | |
| FX-8350 | |
| i7-3770K | |
| Pentium G860 | |
| Core i3-3220 | |
| Core i5-3550 | |
| TrueCrypt | |
| AES Mean 100MB (sort by value) | |
| A10-5800K DDR3-1600 | |
| A10-5800K DDR3-1866 | |
| A8-5600K | |
| A4-5300 | |
| FX-8350 | |
| i7-3770K | |
| Pentium G860 | |
| Core i3-3220 | |
| Core i5-3550 | |
| Twofish Mean 100MB (sort by value) | |
| A10-5800K DDR3-1600 | |
| A10-5800K DDR3-1866 | |
| A8-5600K | |
| A4-5300 | |
| FX-8350 | |
| i7-3770K | |
| Pentium G860 | |
| Core i3-3220 | |
| Core i5-3550 | |
| Serpent Mean 100MB (sort by value) | |
| A10-5800K DDR3-1600 | |
| A10-5800K DDR3-1866 | |
| A8-5600K | |
| A4-5300 | |
| FX-8350 | |
| i7-3770K | |
| Pentium G860 | |
| Core i3-3220 | |
| Core i5-3550 | |
| X264 HD Benchmark 4.0 | |
| Pass 1 (sort by value) | |
| A10-5800K DDR3-1600 | |
| A10-5800K DDR3-1866 | |
| A8-5600K | |
| A4-5300 | |
| FX-8350 | |
| i7-3770K | |
| Pentium G860 | |
| Core i3-3220 | |
| Core i5-3550 | |
| Pass 2 (sort by value) | |
| A10-5800K DDR3-1600 | |
| A10-5800K DDR3-1866 | |
| A8-5600K | |
| A4-5300 | |
| FX-8350 | |
| i7-3770K | |
| Pentium G860 | |
| Core i3-3220 | |
| Core i5-3550 | |
| WinRAR - Result (sort by value) | |
| A10-5800K DDR3-1600 | |
| A10-5800K DDR3-1866 | |
| A8-5600K | |
| A4-5300 | |
| FX-8350 | |
| i7-3770K | |
| Pentium G860 | |
| Core i3-3220 | |
| Core i5-3550 | |
| 3DMark 06 - CPU - CPU Score (sort by value) | |
| A10-5800K DDR3-1600 | |
| A10-5800K DDR3-1866 | |
| A8-5600K | |
| A4-5300 | |
| FX-8350 GTX 470 | |
| i7-3770K | |
| Pentium G860 | |
| Core i3-3220 | |
| Core i5-3550 | |
| Core i5-3470 | |
* ... smaller is better
Gaming Performance
We will try to explain the vast quantity of numbers: On average, the fastest APU of the Trinity series, the A10-5800K, is about on par with the Intel Core i3-3220 of the Ivy Bridge generation. However, the results heavily depend on the benchmark: While the Core i3 especially profits from its high performance per MHz, the A10 takes advantage from its 4 integer cores. Therefore, the AMD processor performs better in well-parallelized applications and the i3 in single-threaded tasks. This gets especially obvious in the single and multi thread tests of Cinebench. Furthermore, there is another important difference: While only the more expensive Intel Core i5 and Core i7 CPUs implement the instruction set extension AES-NI, which accelerates encryption, AMD do not restrict this feature to special CPU series. So, the AMD CPUs perform better in TrueCrypt and similar tasks.
While the A8-5600K is only slightly slower than the A10-5800K because of its lower clock rate, the A4-5300 and A6-5400K (not tested here) are significantly slower. Only half of the two modules or four CPU cores of the Trinity chip are active in these two models and so, the performance is cut in half. As a result, the A4-5300's performance does not even come close to the dual core Pentium G860: AMD's CMT technology, the base of the innovative module design, can not reach the performance of "real" CPU cores.
The FX-8350, the Core i5-3470/3550, and the Core i7-3770K are at the top of the price and the performance ranking. Compared to the similarly expensive Core i5 models, the FX performs well and is even marginally better than the Intel on average. However, the AMD CPU profits from our application selection, as most of the applications are well-parallelized. The i7-3770K is still the undisputed winner. But, its unrivaled combination of performance, energy efficiency and OC potential is quite pricey.
我们会尽量解释广大号码数量:平均而言,最快的的APU Trinity系列,A10-5800K,是关于看齐,与英特尔酷睿i3-3220的Ivy Bridge的新一代。然而,其结果很大程度上取决于基准:虽然酷睿i3,尤其是利润,其每MHz的高性能,A10的优势,从它的4个整数核心。因此,AMD处理器进行更好的并行应用程序在单线程任务的i3。 CINEBENCH测试中的单和多线程,这变得尤为明显。此外,还有另外一个重要的区别:虽然只有更昂贵的英特尔酷睿i5和酷睿i7处理器执行的指令集扩展,加速AES-NI加密,AMD不限制此功能特殊的CPU系列。因此,AMD的CPU有更好的表现在TrueCrypt和类似任务。
虽然A8-5600K仅略低于A10-5800K由于其较低的时钟速率,A4-5300,A6-5400K(未测试)都明显较慢。两个模块或四个CPU核心,三位一体的芯片只有一半是活跃在这两个型号,性能等被削减了一半。因此,A4-5300的性能并不甚至接近双核心Pentium G860:AMD的CMT技术的创新模块设计的基础,不能达到“真实”的CPU核心的性能。
FX-8350,酷睿i5-3470/3550,和酷睿i7-3770K的价格在顶部的成绩排名。同样昂贵的酷睿i5机型相比,FX表现良好,甚至略微优于平均英特尔。然而,AMD的CPU利润从我们的应用程序选择,大部分应用的并行化。酷睿i7-3770K仍是无可争议的赢家。但是,其无与伦比的性能,能效和超频潜力的组合是相当昂贵的。
| 3DMark 06 - 1280x1024 Standard Score AA:0x AF:0x (sort by value) | |
| A10-5800K DDR3-1600 | |
| A10-5800K DDR3-1866 | |
| A8-5600K | |
| A4-5300 | |
| FX-8350 GTX 470 | |
| i7-3770K | |
| Pentium G860 | |
| Core i3-3220 | |
| Core i5-3550 | |
| Core i5-3470 | |
| 3DMark 11 - 1280x720 Performance GPU (sort by value) | |
| A10-5800K DDR3-1600 | |
| A10-5800K DDR3-1866 | |
| A8-5600K | |
| A4-5300 | |
| FX-8350 GTX 470 | |
| i7-3770K | |
| Core i3-3220 | |
| Core i5-3550 | |
| Core i5-3470 | |
| 3DMark Vantage - 1280x1024 P GPU no PhysX (sort by value) | |
| A10-5800K DDR3-1600 | |
| A10-5800K DDR3-1866 | |
| A8-5600K | |
| A4-5300 | |
| FX-8350 GTX 470 | |
| i7-3770K | |
| Pentium G860 | |
| Core i3-3220 | |
| Core i5-3550 | |
| Core i5-3470 | |
| 3DMark | |
| 1920x1080 Fire Strike Graphics (sort by value) | |
| A10-5800K DDR3-1600 | |
| A10-5800K DDR3-1866 | |
| A8-5600K | |
| A4-5300 | |
| FX-8350 GTX 470 | |
| i7-3770K | |
| Core i3-3220 | |
| Core i5-3550 | |
| Core i5-3470 | |
| 1280x720 Cloud Gate Standard Graphics (sort by value) | |
| A10-5800K DDR3-1600 | |
| A10-5800K DDR3-1866 | |
| A8-5600K | |
| A4-5300 | |
| FX-8350 GTX 470 | |
| i7-3770K | |
| Pentium G860 | |
| Core i3-3220 | |
| Core i5-3550 | |
| Core i5-3470 | |
| 1280x720 Ice Storm Standard Graphics (sort by value) | |
| A10-5800K DDR3-1600 | |
| A10-5800K DDR3-1866 | |
| A8-5600K | |
| A4-5300 | |
| FX-8350 GTX 470 | |
| i7-3770K | |
| Pentium G860 | |
| Core i3-3220 | |
| Core i5-3550 | |
| Core i5-3470 | |
Let's turn to the integrated graphics solutions. As expected Intel can hardly keep up with AMD in this aspect. This could change with the Haswell architecture expected shortly. So far, the Trinity APUs dominate the competition - that is apart from the smallest A4-5300. However, the performance also differs much within the APU series: The Radeon HD 7660D is more than double as fast as the severely cut down Radeon HD 7480D. The mid range Radeon HD 7560D positions itself in between the two and is just slightly faster than the HD Graphics 4000. Furthermore, the fastest model is still a multiple slower than a dedicated mid-range graphics card for about 80 Euro. The fast DDR3-1866 RAM also does not improve this. It only brings a performance gain of about 4 percent.
Meanwhile, you can find the HD Graphics (Sandy Bridge) and the HD Graphics 2500 at the tail end of the field. These are versions of the HD Graphics 3000 (Sandy Bridge) or HD Graphics 4000 (Ivy Bridge) with deactivated parts. As a result their performance is even lower. Furthermore, GPUs of the Sandy Bridge generation do not support DirectX 11. Therefore, they cannot run several benchmarks, e.g. 3DMark 11.
让我们把集成显卡解决方案。正如预期的那样,英特尔很难保持与AMD在这方面。与Haswell的架构,预计短期内这可能会改变。到目前为止,三位一体的APU的占主导地位的竞争 - 也就是从最小的A4-5300。不过,性能也存在很大的分歧内APU系列的Radeon HD7660D是严重砍伐的Radeon HD7480D快一倍以上。中档的Radeon HD7560D将自身定位在两者之间,只是略快于高清显卡4000。此外,最快的模式仍然是一个多慢于约80欧元,一个专用的中档显卡。快速的DDR3-1866内存也没有改善。它不仅带来了约4%的性能增益。
同时,你可以找到高清显卡的Sandy Bridge和高清显卡2500在尾部的领域。这些版本的高清显卡3000(Sandy Bridge的)或停用部分的高清显卡4000(Ivy Bridge的)。因此,他们的表现甚至更低。此外,Sandy Bridge的新一代的GPU不支持DirectX 11。因此,他们不能运行一些基准,例如3DMark 11的。
| Hitman: Absolution | |
| 1920x1080 Ultra Preset AA:4xMS AF:16x (sort by value) | |
| A10-5800K DDR3-1600 | |
| A10-5800K DDR3-1866 | |
| A8-5600K | |
| A4-5300 | |
| Core i5-3470 | |
| 1366x768 High Preset AA:2xMS AF:8x (sort by value) | |
| A10-5800K DDR3-1600 | |
| A10-5800K DDR3-1866 | |
| A8-5600K | |
| A4-5300 | |
| Core i5-3470 | |
| 1366x768 Medium Preset AF:2x (sort by value) | |
| A10-5800K DDR3-1600 | |
| A10-5800K DDR3-1866 | |
| A8-5600K | |
| A4-5300 | |
| Core i3-3220 | |
| Core i5-3470 | |
| 1024x768 Lowest Preset (sort by value) | |
| A10-5800K DDR3-1600 | |
| A10-5800K DDR3-1866 | |
| A8-5600K | |
| A4-5300 | |
| Core i3-3220 | |
| Core i5-3470 | |
| BioShock Infinite | |
| 1920x1080 Ultra Preset, DX11 (DDOF) (sort by value) | |
| A10-5800K DDR3-1600 | |
| A10-5800K DDR3-1866 | |
| A8-5600K | |
| A4-5300 | |
| FX-8350 GTX 470 | |
| 1366x768 High Preset (sort by value) | |
| A10-5800K DDR3-1600 | |
| A10-5800K DDR3-1866 | |
| A8-5600K | |
| A4-5300 | |
| FX-8350 GTX 470 | |
| 1366x768 Medium Preset (sort by value) | |
| A10-5800K DDR3-1600 | |
| A10-5800K DDR3-1600 | |
| A10-5800K DDR3-1866 | |
| A8-5600K | |
| A4-5300 | |
| FX-8350 GTX 470 | |
| 1280x720 Very Low Preset (sort by value) | |
| A10-5800K DDR3-1600 | |
| A10-5800K DDR3-1866 | |
| A8-5600K | |
| A4-5300 | |
| FX-8350 GTX 470 | |
| SimCity | |
| 1920x1080 Ultra / High AA:on (sort by value) | |
| A10-5800K DDR3-1600 | |
| A10-5800K DDR3-1866 | |
| A8-5600K | |
| A4-5300 | |
| FX-8350 GTX 470 | |
| 1366x768 High AA:on (sort by value) | |
| A10-5800K DDR3-1600 | |
| A10-5800K DDR3-1866 | |
| A8-5600K | |
| A4-5300 | |
| 1366x768 Medium (sort by value) | |
| A10-5800K DDR3-1600 | |
| A10-5800K DDR3-1866 | |
| A8-5600K | |
| A4-5300 | |
| Core i5-3550 | |
| 1024x768 Low (sort by value) | |
| A10-5800K DDR3-1600 | |
| A10-5800K DDR3-1866 | |
| A8-5600K | |
| A4-5300 | |
| FX-8350 GTX 470 | |
| Core i5-3550 | |
| Tomb Raider | |
| 1920x1080 Ultra Preset AA:FX AF:16x (sort by value) | |
| A10-5800K DDR3-1600 | |
| A10-5800K DDR3-1866 | |
| A8-5600K | |
| A4-5300 | |
| FX-8350 GTX 470 | |
| 1366x768 High Preset AA:FX AF:8x (sort by value) | |
| A10-5800K DDR3-1600 | |
| A10-5800K DDR3-1866 | |
| A8-5600K | |
| A4-5300 | |
| FX-8350 GTX 470 | |
| 1366x768 Normal Preset AA:FX AF:4x (sort by value) | |
| A10-5800K DDR3-1600 | |
| A10-5800K DDR3-1866 | |
| A8-5600K | |
| A4-5300 | |
| FX-8350 GTX 470 | |
| 1024x768 Low Preset (sort by value) | |
| A10-5800K DDR3-1600 | |
| A10-5800K DDR3-1866 | |
| A8-5600K | |
| A4-5300 | |
| FX-8350 GTX 470 | |
| F1 2012 | |
| 1920x1080 Ultra Preset AA:4xMS (sort by value) | |
| A10-5800K DDR3-1600 | |
| A10-5800K DDR3-1866 | |
| A8-5600K | |
| A4-5300 | |
| Core i3-3220 | |
| Core i5-3470 | |
| 1366x768 High Preset AA:2xMS (sort by value) | |
| A10-5800K DDR3-1600 | |
| A10-5800K DDR3-1866 | |
| A8-5600K | |
| A4-5300 | |
| Core i3-3220 | |
| Core i5-3470 | |
| 1366x768 Medium Preset (sort by value) | |
| A10-5800K DDR3-1600 | |
| A10-5800K DDR3-1866 | |
| A8-5600K | |
| A4-5300 | |
| Core i3-3220 | |
| Core i5-3470 | |
| 1024x768 Ultra Low Preset (sort by value) | |
| A10-5800K DDR3-1600 | |
| A10-5800K DDR3-1866 | |
| A8-5600K | |
| A4-5300 | |
| Core i3-3220 | |
| Core i5-3470 | |
One of the most interesting questions of this review is whether the APUs, especially the smaller ones, are capable of current 3D games. Let's start with the A10-5800K / Radeon HD 7660D: Depending on its graphical demands, a game can be run with about medium settings and a resolution of 1,366 x 768 pixels. So, most occasional gamers should be satisfied. Apart from Tomb Raider, which gets about 20 faster, a faster RAM hardly has an impact.
The A8-5600K / Radeon HD 7560D follow close behind the A10-5800K. Although it only features a third of the shader units, it is only 10 percent slower. Meanwhile, the A4-5300 / Radeon HD 7480D are only half as fast as the top model. This might not only be caused by the slower GPU, but also by the severely cut down CPU. So, the user has to live with 1,024 x 768 pixels and minimum details and this will still not guarantee smooth frame rates in all situations and games.
Further game tests are available in our always up-to-date graphics articles about the Radeon HD 7660D, Radeon HD 7560D, and Radeon HD 7480D.
As this review does not focus on Intel GPUs, we refer to the special articles of the HD Graphics, HD 2500, and the HD 4000 for further details. The ranking in our synthetic benchmarks and real games only marginally differs.
这次审查的最有趣的问题之一,是APU的,尤其是规模较小的,是否有能力,目前的3D游戏。让我们开始与A10-5800K/的Radeon HD7660D根据其图形需求的,一个游戏可以运行与中等设置,分辨率为1,366 x 768像素。所以,偶尔玩家最应该得到满足。除了从古墓丽影,得到约20更快,更快的内存几乎都有影响。
A8-5600K/的Radeon HD7560D紧跟背后的A10-5800K。虽然只设有一个三分之一的着色器单元,它是只有10%的速度较慢。同时,尽可能快的顶级型号A4-5300/的Radeon HD7480D只有一半。这不仅可能引起由较慢的GPU,而且由严重砍下CPU。因此,用户拥有1,024 x 768像素和最小的细节,这将仍然无法保证在所有情况下和游戏流畅的帧速率。
更多的游戏测试中我们总是最新的Radeon HD7560D,为Radeon HD7660D和Radeon HD7480D图形文章。
由于这篇评论并没有集中在英特尔的GPU,我们称之为高清显卡,HD2500和HD4000的特殊用品的进一步详情。在我们的合成基准测试和实际游戏的排名只有略微不同。
Compute Performance
| ComputeMark v2.1 | |
| 1024x600 Normal, QJuliaRayTrace (sort by value) | |
| A10-5800K DDR3-1600 | |
| A10-5800K DDR3-1866 | |
| A8-5600K | |
| A4-5300 | |
| i7-3770K | |
| Core i3-3220 | |
| Core i5-3550 | |
| Core i5-3470 | |
| 1024x600 Normal, Mandel Scalar (sort by value) | |
| A10-5800K DDR3-1600 | |
| A10-5800K DDR3-1866 | |
| A8-5600K | |
| A4-5300 | |
| i7-3770K | |
| Core i3-3220 | |
| Core i5-3550 | |
| Core i5-3470 | |
| 1024x600 Normal, Mandel Vector (sort by value) | |
| A10-5800K DDR3-1600 | |
| A10-5800K DDR3-1866 | |
| A8-5600K | |
| A4-5300 | |
| i7-3770K | |
| Core i3-3220 | |
| Core i5-3550 | |
| Core i5-3470 | |
| 1024x600 Normal, Fluid 2DTexArr (sort by value) | |
| A10-5800K DDR3-1600 | |
| A10-5800K DDR3-1866 | |
| A8-5600K | |
| A4-5300 | |
| i7-3770K | |
| Core i3-3220 | |
| Core i5-3550 | |
| Core i5-3470 | |
| 1024x600 Normal, Fluid 3DTex (sort by value) | |
| A10-5800K DDR3-1600 | |
| A10-5800K DDR3-1866 | |
| A8-5600K | |
| A4-5300 | |
| i7-3770K | |
| Core i3-3220 | |
| Core i5-3550 | |
| Core i5-3470 | |
| 1024x600 Normal, Score (sort by value) | |
| A10-5800K DDR3-1600 | |
| A10-5800K DDR3-1866 | |
| A8-5600K | |
| A4-5300 | |
| i7-3770K | |
| Core i3-3220 | |
| Core i5-3550 | |
| Core i5-3470 | |
| LuxMark v2.0 64Bit | |
| Room GPUs-only (sort by value) | |
| A10-5800K DDR3-1600 | |
| A10-5800K DDR3-1866 | |
| A8-5600K | |
| A4-5300 | |
| i7-3770K | |
| Core i3-3220 | |
| Core i5-3550 | |
| Core i5-3470 | |
| Sala GPUs-only (sort by value) | |
| A10-5800K DDR3-1600 | |
| A10-5800K DDR3-1866 | |
| A8-5600K | |
| A4-5300 | |
| i7-3770K | |
| Core i3-3220 | |
| Core i5-3550 | |
| Core i5-3470 | |
Thanks to standardized interfaces like OpenCL or DirectCompute the shader units of the integrated GPUs, can also perform general calculations. That is except for the Sandy Bridge graphics. Once again the AMD APUs perform better here. This said, Intel's HD 4000 can at least keep up with the A4-5300.
Please note: The recently introduced 15.31 driver significantly improved the OpenCL performance of Ivy Bridge GPUs. In Luxmark, the scores increased to 251 (Sala) and 163 points (Room) and exceed the Radeon HD 7660D's.
Today, there are still only few applications which profit from the compute features in practice. But, this should change in the medium term. So, a fast GPU should no longer only pay off in games. This is a further reason why AMD and Intel consider the graphics unit more and more important. AMD is still slightly better here, but Intel quickly recovers lost ground.
感谢的OpenCL或DirectCompute的集成GPU的着色器单元的标准化的接口,例如,也可以进行一般的计算。这是Sandy Bridge的图形除外。再次成为AMD的APU在这里有更好的表现。这表示,英特尔HD4000至少可以跟上A4-5300。
请注意:最近推出的15.31驱动显着改善的Ivy Bridge的GPU的OpenCL性能。在Luxmark,分数提高到251(撒拉族)和163点(室),并超过了Radeon HD7660D。
今天,仍然只有少数有利润的计算功能,在实践中的应用。但是,这应该在中期改变。所以,快速的GPU应该不再仅仅还清游戏。这是一个更深层次的原因,AMD和Intel的图形单元越来越重要考虑。 AMD仍是稍微好一点,但英特尔快速恢复失地。

Verdict
The APUs of the A series are inexpensive alternatives to the FX family without GPU and delivers sufficient performance reserves for many everyday tasks. Even the cheapest model, the A4-5300 for only about 40 Euro, more than suffices multimedia tasks, web surfing, and simple office tasks.
If you use more demanding software for image editing or video conversion (without GPU support) you should rather consider the A8-5600K (about 80 Euro) or the A10-5800K (about 100 Euro). As they feature double the modules and cores, they are more appropriate for excessive multitasking and shine with fast GPUs, which can run many of today's games without stuttering. If desired, the "K"-APUs can simply be overclocked by increasing the multiplier. If the cooling system works decently, 4.5 GHz are possible without problems in many scenarios. On the contrary, the Intel CPU counterparts of the Celeron, Pentium and i3 series do unfortunately not support overclocking, but have other advantages like significantly lower energy consumption (under load and partial load).
The energy consumption also is one of the biggest disadvantages of the FX-8350. If you do not need an integrated graphics solution, you'll get vast processing performance for comparably little money (about 170 Euro). In well-parallelized applications the FX even achieves a performance close to the Core i7-3770K, which costs about 100 Euro more. But, on average, it "only" delivers a performance about on par with Core i5 CPUs.
Finally, many thanks to Adata, Asus, the pco.co.at shop AMD, and Intel for making the respective components available to us!
A系列APU的FX系列没有GPU的廉价替代品,许多日常任务提供足够的性能储备。即使是最便宜的型号,只有大约40欧元的A4-5300,以上足以多媒体任务,网上冲浪,和简单的办公任务。
如果您使用的更苛刻的软件进行图像编辑或视频转换(不支持GPU),而应考虑A8-5600K(约80欧元)或A10-5800K(约100欧元)。因为它们拥有双模块和核心,他们更适合于过度的多任务处理和闪耀着快速的GPU,它可以运行许多今天的比赛,无口吃。如果需要的话,“K”的APU可以简单地通过增加乘法器超频。如果冷却系统的工作原理体面,4.5 GHz时,可能在许多情况下没有问题。相反,英特尔的赛扬,奔腾和酷睿i3系列CPU同行遗憾的是不支持超频,但有其他优势,如显着降低能源消耗(负荷和部分负荷下)。
的能量消耗也是对FX-8350的最大的缺点之一。如果你不需要一个集成的图形解决方案,您将获得广阔的加工性能可比一点钱(约170欧元)。在并行应用程序的FX甚至达到性能的酷睿i7-3770K,耗资约100欧元。但是,平均来说,它“只”提供性能上采用酷睿i5的CPU相提并论。
最后,非常感谢威刚,华硕店AMD pco.co.at,和英特尔为使各个组件提供给我们!
| A10-5800K DDR3-1600 Radeon HD 7660D, AMD A10-5800K | A10-5800K DDR3-1866 Radeon HD 7660D, AMD A10-5800K | A8-5600K Radeon HD 7560D, AMD A8-5600K | A4-5300 Radeon HD 7480D, AMD A4-5300, Intel SSD 520 Series SSDSC2CW240A | FX-8350 Radeon HD 6450 GDDR5, FX-8350, Intel SSD 520 Series SSDSC2CW240A | FX-8350 GTX 470 GeForce GTX 470, FX-8350, Intel SSD 520 Series SSDSC2CW240A | i7-3770K HD Graphics 4000, 3770K, Intel SSD 520 Series SSDSC2CW240A | Pentium G860 HD Graphics (Sandy Bridge), G860, Intel SSD 520 Series SSDSC2CW240A | Core i3-3220 HD Graphics 2500, 3220, Intel SSD 520 Series SSDSC2CW240A | Core i5-3550 HD Graphics 2500, 3550, Intel SSD 520 Series SSDSC2CW240A | Core i5-3470 HD Graphics 2500, 3470, Intel SSD 520 Series SSDSC2CW240A | |
|---|---|---|---|---|---|---|---|---|---|---|---|
| Cinebench R10 | -1% | -5% | -34% | 42% | 98% | -1% | 24% | 72% | 65% | ||
| Rendering Single CPUs 64Bit | 4221 | 4139 -2% | 3983 -6% | 3645 -14% | 4346 3% | 6972 65% | 4953 17% | 5847 39% | 6568 56% | 6328 50% | |
| Rendering Multiple CPUs 64Bit | 12987 | 12959 0% | 12505 -4% | 5867 -55% | 23538 81% | 27536 112% | 9063 -30% | 12546 -3% | 22729 75% | 21594 66% | |
| Rendering Single 32Bit | 3131 | 3056 -2% | 2941 -6% | 2734 -13% | 3201 2% | 5536 77% | 3964 27% | 4626 48% | 5191 66% | 5006 60% | |
| Rendering Multiple CPUs 32Bit | 9285 | 9266 0% | 8838 -5% | 4345 -53% | 16904 82% | 22190 139% | 7695 -17% | 10193 10% | 17762 91% | 17192 85% | |
| Cinebench R11.5 | -1% | -5% | -34% | 58% | 99% | -7% | 17% | 63% | 57% | ||
| CPU Single 64Bit | 1.04 | 1.02 -2% | 0.98 -6% | 0.91 -12% | 1.1 6% | 1.65 59% | 1.2 15% | 1.38 33% | 1.56 50% | 1.51 45% | |
| CPU Multi 64Bit | 3.3 | 3.33 1% | 3.2 -3% | 1.45 -56% | 6.89 109% | 7.88 139% | 2.34 -29% | 3.31 0% | 5.81 76% | 5.57 69% | |
| Geekbench 2 - 32 Bit | |||||||||||
| Total Score | 6969 | 6945 0% | 6520 -6% | 4268 -39% | 11198 61% | 12435 78% | 5393 -23% | 7008 1% | 8990 29% | 9721 39% | |
| wPrime 2.10 | |||||||||||
| 32m * | 15.9 | 15.9 -0% | 16.7 -5% | 35.5 -123% | 7.96 50% | 6.39 60% | 23.6 -48% | 14.66 8% | 9.98 37% | ||
| TrueCrypt | 0% | -5% | -57% | 96% | 90% | -64% | -43% | 31% | |||
| AES Mean 100MB | 1.9 | 1.9 0% | 1.8 -5% | 0.823 -57% | 3.6 89% | 3.9 105% | 0.229 -88% | 0.318 -83% | 2.7 42% | ||
| Twofish Mean 100MB | 0.38 | 0.379 0% | 0.36 -5% | 0.165 -57% | 0.749 97% | 0.678 78% | 0.179 -53% | 0.288 -24% | 0.448 18% | ||
| Serpent Mean 100MB | 0.209 | 0.208 0% | 0.198 -5% | 0.093 -56% | 0.423 102% | 0.392 88% | 0.102 -51% | 0.166 -21% | 0.28 34% | ||
| X264 HD Benchmark 4.0 | -1% | -5% | -55% | 64% | 79% | -39% | -11% | 51% | |||
| Pass 1 | 107.6 | 105.6 -2% | 102.4 -5% | 50 -54% | 139 29% | 172.3 60% | 70.3 -35% | 98.6 -8% | 163.8 52% | ||
| Pass 2 | 21.9 | 21.8 0% | 20.93 -4% | 9.62 -56% | 43.5 99% | 43.4 98% | 12.69 -42% | 18.82 -14% | 32.7 49% | ||
| WinRAR | |||||||||||
| Result | 2530 | 2472 -2% | 2449 -3% | 1347 -47% | 4562 80% | 3698 46% | 1655 -35% | 2695 7% | 3375 33% | ||
| 3DMark 06 - CPU | |||||||||||
| CPU Score | 4311 | 4464 4% | 4295 0% | 2284 -47% | 6648 54% | 7606 76% | 3065 -29% | 4019 -7% | 6405 49% | 6179 43% | |
| Total Average (Program / Settings) | -0% /
-0% | -4% /
-5% | -55% /
-49% | 64% /
64% | 54% /
54% | 78% /
85% | -31% /
-28% | -1% /
-1% | 46% /
50% | 51% /
57% |
* ... smaller is better