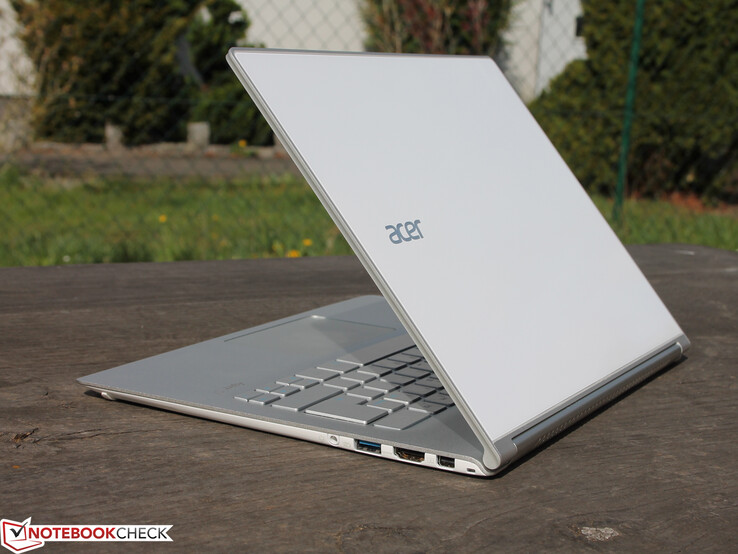
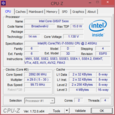
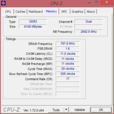
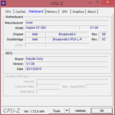
Acer Aspire S7 (2015) 超极本简短评测
» Notebookcheck多媒体笔记本电脑Top 10排名
» Notebookcheck游戏笔记本电脑Top 10排名
» Notebookcheck低价办公/商务笔记本电脑Top 10排名
» Notebookcheck高端办公/商务笔记本电脑Top 10排名
» Notebookcheck工作站笔记本电脑Top 10排名
» Notebookcheck亚笔记本电脑Top 10排名
» Notebookcheck超级本产品Top 10排名
» Notebookcheck变形本产品Top 10排名
» Notebookcheck平板电脑Top 10排名
» Notebookcheck智能手机Top 10排名
» Notebookcheck评测过最出色的笔记本电脑屏幕
» Notebookcheck售价500欧元以下笔记本电脑Top 10排名
» Notebookcheck售价300欧元以下笔记本电脑Top 10排名
| |||||||||||||||||||||||||
Brightness Distribution: 90 %
Center on Battery: 238 cd/m²
Contrast: 1565:1 (Black: 0.23 cd/m²)
ΔE Color 3.35 | 0.5-29.43 Ø4.87
ΔE Greyscale 3.62 | 0.5-98 Ø5.1
65% AdobeRGB 1998 (Argyll 1.6.3 3D)
71.1% AdobeRGB 1998 (Argyll 2.2.0 3D)
98.3% sRGB (Argyll 2.2.0 3D)
70.1% Display P3 (Argyll 2.2.0 3D)
Gamma: 2.51
| Acer Aspire S7-393-75508G25EWS IPS 2560x1440 | Dell XPS 13-9343 IPS 3200x1800 | Asus ZenBook UX305FA-FB003H IPS 3200x1800 | Apple MacBook Air 13 MD761D/B 2014-06 TN 1440x900 | Lenovo ThinkPad X250-20CLS06D00 IPS 1920x1080 | Asus Zenbook UX303LN-R4141H IPS 1920x1080 | Lenovo ThinkPad X1 Carbon 2015 IPS 2560x1440 | Apple MacBook Pro Retina 13 inch 2015-03 IPS 2560x1600 | |
|---|---|---|---|---|---|---|---|---|
| Display | 1% | -16% | -35% | 1% | -23% | -4% | ||
| Display P3 Coverage | 70.1 | 72 3% | 58.2 -17% | 44.14 -37% | 72.7 4% | 52.4 -25% | 65.9 -6% | |
| sRGB Coverage | 98.3 | 96 -2% | 83.3 -15% | 65.8 -33% | 97.5 -1% | 77.4 -21% | 97 -1% | |
| AdobeRGB 1998 Coverage | 71.1 | 71.6 1% | 60.1 -15% | 45.71 -36% | 71.4 0% | 54 -24% | 67.4 -5% | |
| Screen | -8% | -33% | -7% | -22% | -37% | -27% | -2% | |
| Brightness middle | 360 | 367.3 2% | 310 -14% | 280 -22% | 397 10% | 344 -4% | 252.3 -30% | 361 0% |
| Brightness | 341 | 372 9% | 309 -9% | 263 -23% | 357 5% | 339 -1% | 246 -28% | 342 0% |
| Brightness Distribution | 90 | 77 -14% | 90 0% | 84 -7% | 81 -10% | 88 -2% | 95 6% | 81 -10% |
| Black Level * | 0.23 | 0.178 23% | 0.75 -226% | 0.32 -39% | 0.44 -91% | 0.55 -139% | 0.426 -85% | 0.361 -57% |
| Contrast | 1565 | 2063 32% | 413 -74% | 875 -44% | 902 -42% | 625 -60% | 592 -62% | 1000 -36% |
| Colorchecker dE 2000 * | 3.35 | 5.92 -77% | 2.49 26% | 1.91 43% | 4.2 -25% | 5.45 -63% | 3.8 -13% | 1.82 46% |
| Greyscale dE 2000 * | 3.62 | 4.79 -32% | 1.89 48% | 2 45% | 3.1 14% | 4.53 -25% | 2.92 19% | 1.8 50% |
| Gamma | 2.51 88% | 2.42 91% | 2.36 93% | 2.26 97% | 2.6 85% | 2.27 97% | 2.08 106% | 2.49 88% |
| CCT | 6805 96% | 7013 93% | 6573 99% | 6724 97% | 6246 104% | 7458 87% | 6070 107% | 6417 101% |
| Color Space (Percent of AdobeRGB 1998) | 65 | 63 -3% | 54 -17% | 42 -35% | 64 -2% | 50.41 -22% | 61.9 -5% | |
| Color Space (Percent of sRGB) | 96.4 | 83.1 | 65.5 | 97.4 | 96.9 | |||
| Colorchecker dE 2000 max. * | 3.26 | |||||||
| Total Average (Program / Settings) | -4% /
-5% | -25% /
-28% | -7% /
-7% | -29% /
-25% | -18% /
-27% | -25% /
-26% | -3% /
-2% |
* ... smaller is better
| Cinebench R15 | |
| CPU Single 64Bit (sort by value) | |
| Acer Aspire S7-393-75508G25EWS | |
| Dell XPS 13-9343 | |
| Asus ZenBook UX305FA-FB003H | |
| Apple MacBook Air 13 MD761D/B 2014-06 | |
| Lenovo ThinkPad X250-20CLS06D00 | |
| Asus Zenbook UX303LN-R4141H | |
| HP EliteBook Folio 1040 G1 (H5F62ET) | |
| Lenovo ThinkPad X1 Carbon 2015 | |
| Apple MacBook Pro Retina 13 inch 2015-03 | |
| CPU Multi 64Bit (sort by value) | |
| Acer Aspire S7-393-75508G25EWS | |
| Dell XPS 13-9343 | |
| Asus ZenBook UX305FA-FB003H | |
| Apple MacBook Air 13 MD761D/B 2014-06 | |
| Lenovo ThinkPad X250-20CLS06D00 | |
| Asus Zenbook UX303LN-R4141H | |
| HP EliteBook Folio 1040 G1 (H5F62ET) | |
| Lenovo ThinkPad X1 Carbon 2015 | |
| Apple MacBook Pro Retina 13 inch 2015-03 | |
| Cinebench R11.5 | |
| CPU Single 64Bit (sort by value) | |
| Acer Aspire S7-393-75508G25EWS | |
| Dell XPS 13-9343 | |
| Dell XPS 13-9333 | |
| Asus ZenBook UX305FA-FB003H | |
| Apple MacBook Air 13 MD761D/B 2014-06 | |
| Lenovo ThinkPad X250-20CLS06D00 | |
| Asus Zenbook UX303LN-R4141H | |
| HP EliteBook Folio 1040 G1 (H5F62ET) | |
| Lenovo ThinkPad X1 Carbon 2015 | |
| Apple MacBook Pro Retina 13 inch 2015-03 | |
| Apple MacBook Pro Retina 13 inch 2015-03 | |
| CPU Multi 64Bit (sort by value) | |
| Acer Aspire S7-393-75508G25EWS | |
| Dell XPS 13-9343 | |
| Dell XPS 13-9333 | |
| Asus ZenBook UX305FA-FB003H | |
| Apple MacBook Air 13 MD761D/B 2014-06 | |
| Lenovo ThinkPad X250-20CLS06D00 | |
| Asus Zenbook UX303LN-R4141H | |
| HP EliteBook Folio 1040 G1 (H5F62ET) | |
| Lenovo ThinkPad X1 Carbon 2015 | |
| Apple MacBook Pro Retina 13 inch 2015-03 | |
| Apple MacBook Pro Retina 13 inch 2015-03 | |
| PCMark 7 - Score (sort by value) | |
| Acer Aspire S7-393-75508G25EWS | |
| Dell XPS 13-9343 | |
| Dell XPS 13-9333 | |
| Asus ZenBook UX305FA-FB003H | |
| Apple MacBook Air 13 MD761D/B 2014-06 | |
| Lenovo ThinkPad X250-20CLS06D00 | |
| Asus Zenbook UX303LN-R4141H | |
| HP EliteBook Folio 1040 G1 (H5F62ET) | |
| Lenovo ThinkPad X1 Carbon 2015 | |
| Apple MacBook Pro Retina 13 inch 2015-03 | |
| PCMark 7 Score | 5107 points | |
| PCMark 8 Home Score Accelerated v2 | 2911 points | |
| PCMark 8 Work Score Accelerated v2 | 3684 points | |
Help | ||
| Acer Aspire S7-393-75508G25EWS HD Graphics 5500, 5500U, 2x Kingston SMSR150S3256G (RAID 0) | Dell XPS 13-9343 HD Graphics 5500, 5200U, Lite-On IT L8T-256L9G | Asus ZenBook UX305FA-FB003H HD Graphics 5300, 5Y10, SanDisk SD7SN3Q256G1002 | Apple MacBook Air 13 MD761D/B 2014-06 HD Graphics 5000, 4260U, Apple SSD SD0256F | Lenovo ThinkPad X250-20CLS06D00 HD Graphics 5500, 5600U, Intel SSD Pro 2500 Series SSDSC2BF360A5L | Asus Zenbook UX303LN-R4141H GeForce 840M, 4510U, SanDisk SD6SB1M256G1002 | Lenovo ThinkPad X1 Carbon 2015 HD Graphics 5500, 5500U, Samsung SSD SM951 512 GB MZHPV512HDGL | Apple MacBook Pro Retina 13 inch 2015-03 Iris Graphics 6100, 5257U, Apple SSD SM0128G | |
|---|---|---|---|---|---|---|---|---|
| CrystalDiskMark 3.0 | -15% | -22% | -44% | -17% | 120% | 25% | ||
| Read Seq | 862 | 489.6 -43% | 465.8 -46% | 419.8 -51% | 409 -53% | 1332 55% | 1403 63% | |
| Write Seq | 371.1 | 424.2 14% | 438.7 18% | 228.6 -38% | 436.6 18% | 1480 299% | 657 77% | |
| Read 4k | 27.1 | 34.76 28% | 31 14% | 27.86 3% | 34.64 28% | 43.71 61% | 20.95 -23% | |
| Write 4k | 196.1 | 79.3 -60% | 70.3 -64% | 15.3 -92% | 100.7 -49% | 99.5 -49% | 32.43 -83% | |
| Read 512 | 578 | 371.9 -36% | 299.6 -48% | 355.2 -39% | 301.1 -48% | 988 71% | 810 40% | |
| Write 512 | 363.5 | 395.5 9% | 350.6 -4% | 203.3 -44% | 373 3% | 1393 283% | 648 78% | |
| AS SSD | -14% | -21% | -18% | -49% | -17% | 65% | 27% | |
| Score Total | 1067 | 1018 -5% | 928 -13% | 1086 2% | 523 -51% | 903 -15% | 1653 55% | 1844 73% |
| Score Write | 419 | 369 -12% | 301 -28% | 272 -35% | 122 -71% | 289 -31% | 614 47% | 313 -25% |
| Score Read | 440 | 425 -3% | 411 -7% | 542 23% | 266 -40% | 399 -9% | 683 55% | 1035 135% |
| 4K Read | 28.69 | 30.89 8% | 28.11 -2% | 14.34 -50% | 23.41 -18% | 29.76 4% | 39.9 39% | 20.6 -28% |
| 4K Write | 132.3 | 58.8 -56% | 59.4 -55% | 19.25 -85% | 14.05 -89% | 83.2 -37% | 91.3 -31% | 30.2 -77% |
| Seq Write | 357.8 | 416.8 16% | 371.6 4% | 516 44% | 258.3 -28% | 427.7 20% | 1209 238% | 616 72% |
| Seq Read | 888 | 484.7 -45% | 454.5 -49% | 642 -28% | 457.9 -48% | 437 -51% | 1339 51% | 1233 39% |
| Total Average (Program / Settings) | -15% /
-14% | -22% /
-22% | -18% /
-18% | -47% /
-47% | -17% /
-17% | 93% /
90% | 26% /
26% |
| 3DMark - 1280x720 Cloud Gate Standard Score (sort by value) | |
| Acer Aspire S7-393-75508G25EWS | |
| Dell XPS 13-9343 | |
| Asus ZenBook UX305FA-FB003H | |
| Apple MacBook Air 13 MD761D/B 2014-06 | |
| Lenovo ThinkPad X250-20CLS06D00 | |
| Asus Zenbook UX303LN-R4141H | |
| Lenovo ThinkPad X1 Carbon 2015 | |
| Apple MacBook Pro Retina 13 inch 2015-03 | |
| 3DMark 11 Performance | 1120 points | |
| 3DMark Ice Storm Standard Score | 49552 points | |
| 3DMark Cloud Gate Standard Score | 5267 points | |
| 3DMark Fire Strike Score | 769 points | |
Help | ||
| Fifa 15 - 1280x720 Low Preset (sort by value) | |
| Acer Aspire S7-393-75508G25EWS | |
| Lenovo ThinkPad X250-20CLS06D00 | |
| Asus Zenbook UX303LN-R4141H | |
| Apple MacBook Pro Retina 13 inch 2015-03 | |
| Middle-earth: Shadow of Mordor - 1280x720 Lowest Preset (sort by value) | |
| Acer Aspire S7-393-75508G25EWS | |
| Asus ZenBook UX305FA-FB003H | |
| Asus Zenbook UX303LN-R4141H | |
| Apple MacBook Pro Retina 13 inch 2015-03 | |
| Civilization: Beyond Earth - 1024x768 Minimum Preset (sort by value) | |
| Acer Aspire S7-393-75508G25EWS | |
| Apple MacBook Pro Retina 13 inch 2015-03 | |
| low | med. | high | ultra | |
|---|---|---|---|---|
| Fifa 15 (2014) | 40 | 28 | 17 | |
| Middle-earth: Shadow of Mordor (2014) | 22 | 15 | 8 | |
| Civilization: Beyond Earth (2014) | 42 | 19 | 11 |
| Acer Aspire S7-393-75508G25EWS i7 5500U | Dell XPS 13-9343 i5 5200U | Apple MacBook Air 13 MD761D/B 2014-06 i5 4260U | Lenovo ThinkPad X250-20CLS06D00 i7 5600U | Asus Zenbook UX303LN-R4141H i7 4510U | Apple MacBook Pro Retina 13 inch 2015-03 i5 5257U | Lenovo ThinkPad X1 Carbon 2015 i5 5300U | |
|---|---|---|---|---|---|---|---|
| Noise | -6% | -2% | 4% | 1% | -6% | 6% | |
| Idle Minimum * | 29.6 | 30.2 -2% | 28 5% | 29 2% | 29.5 -0% | 29 2% | 28.5 4% |
| Idle Average * | 29.6 | 30.3 -2% | 28 5% | 29 2% | 29.5 -0% | 29 2% | 28.6 3% |
| Idle Maximum * | 29.6 | 30.4 -3% | 28 5% | 30.3 -2% | 29.5 -0% | 29 2% | 28.8 3% |
| Load Average * | 37.5 | 34.4 8% | 40.5 -8% | 33.4 11% | 34.3 9% | 42.5 -13% | 30.7 18% |
| Load Maximum * | 37.2 | 48 -29% | 43.7 -17% | 33.7 9% | 38.2 -3% | 45.6 -23% | 36.9 1% |
* ... smaller is better
Noise Level
| Idle |
| 29.6 / 29.6 / 29.6 dB(A) |
| Load |
| 37.5 / 37.2 dB(A) |
 | ||
30 dB silent 40 dB(A) audible 50 dB(A) loud |
||
min: | ||
| Acer Aspire S7-393-75508G25EWS i7 5500U | Dell XPS 13-9343 i5 5200U | Asus ZenBook UX305FA-FB003H Core M 5Y10 | Apple MacBook Air 13 MD761D/B 2014-06 i5 4260U | Lenovo ThinkPad X250-20CLS06D00 i7 5600U | Asus Zenbook UX303LN-R4141H i7 4510U | Apple MacBook Pro Retina 13 inch 2015-03 i5 5257U | Lenovo ThinkPad X1 Carbon 2015 i5 5300U | |
|---|---|---|---|---|---|---|---|---|
| Heat | -9% | -2% | -1% | -10% | -17% | -7% | 3% | |
| Maximum Upper Side * | 39.8 | 40.6 -2% | 43.1 -8% | 43 -8% | 43.6 -10% | 55.7 -40% | 45.1 -13% | 36.2 9% |
| Maximum Bottom * | 38.4 | 41.2 -7% | 41.2 -7% | 40 -4% | 42.3 -10% | 51 -33% | 39.6 -3% | 38 1% |
| Idle Upper Side * | 26.7 | 31.2 -17% | 26.3 1% | 26 3% | 29.1 -9% | 26.6 -0% | 28.5 -7% | 26.4 1% |
| Idle Bottom * | 27.6 | 30.6 -11% | 26.2 5% | 26 6% | 30 -9% | 26.2 5% | 28.3 -3% | 27.4 1% |
* ... smaller is better
(+) The maximum temperature on the upper side is 39.8 °C / 104 F, compared to the average of 35.9 °C / 97 F, ranging from 21.4 to 59 °C for the class Subnotebook.
(+) The bottom heats up to a maximum of 38.4 °C / 101 F, compared to the average of 39.3 °C / 103 F
(+) In idle usage, the average temperature for the upper side is 24.9 °C / 77 F, compared to the device average of 30.8 °C / 87 F.
(+) The palmrests and touchpad are cooler than skin temperature with a maximum of 27.8 °C / 82 F and are therefore cool to the touch.
(±) The average temperature of the palmrest area of similar devices was 28.2 °C / 82.8 F (+0.4 °C / 0.8 F).
| Acer Aspire S7-393-75508G25EWS i7 5500U | Dell XPS 13 9343 Core i7 i7 5500U | Apple MacBook Air 13 MD761D/B 2014-06 Core M 5Y10 | Lenovo ThinkPad X250-20CLS06D00 i5 4260U | Asus Zenbook UX303LN-R4141H i7 5600U | Apple MacBook Pro Retina 13 inch 2015-03 i7 4510U | Lenovo ThinkPad X1 Carbon 2015 i5 5257U | Asus ZenBook UX305FA-FB003H i5 5300U | |
|---|---|---|---|---|---|---|---|---|
| Power Consumption | -46% | 7% | -14% | -34% | -45% | -3% | -8% | |
| Idle Minimum * | 4 | 6.6 -65% | 3.4 15% | 2.7 32% | 3.8 5% | 2.8 30% | 3.3 17% | 3.1 22% |
| Idle Average * | 5 | 9.3 -86% | 4 20% | 7 -40% | 7.2 -44% | 7.8 -56% | 6 -20% | 7.5 -50% |
| Idle Maximum * | 6.5 | 11 -69% | 5.8 11% | 8 -23% | 8.4 -29% | 8.1 -25% | 6.7 -3% | 8.6 -32% |
| Load Average * | 31.2 | 32.2 -3% | 32.4 -4% | 28.6 8% | 41.6 -33% | 52.4 -68% | 25 20% | 25.2 19% |
| Load Maximum * | 30.6 | 33.2 -8% | 32.2 -5% | 44.3 -45% | 51.9 -70% | 62.8 -105% | 39 -27% | 30.6 -0% |
* ... smaller is better
| Off / Standby | |
| Idle | |
| Load |
|
Key:
min: | |
| Acer Aspire S7-393-75508G25EWS i7 5500U | Dell XPS 13-9343 Non-Touch i5 5200U | Asus ZenBook UX305FA-FB003H Core M 5Y10 | Apple MacBook Air 13 MD761D/B 2014-06 i5 4260U | Lenovo ThinkPad X250-20CLS06D00 i7 5600U | Asus Zenbook UX303LN-R4141H i7 4510U | Apple MacBook Pro Retina 13 inch 2015-03 i5 5257U | Lenovo ThinkPad X1 Carbon 2015 i5 5300U | |
|---|---|---|---|---|---|---|---|---|
| Battery Runtime | 40% | 35% | -8% | -19% | 1% | 35% | 3% | |
| Reader / Idle | 838 | 1295 55% | 781 -7% | 648 -23% | 779 -7% | 779 -7% | 1690 102% | 984 17% |
| WiFi v1.3 | 464 | 598 29% | 298 -36% | 539 16% | 285 -39% | |||
| Load | 107 | 145 36% | 189 77% | 114 7% | 92 -14% | 117 9% | 94 -12% | 141 32% |
| H.264 | 396 | 342 | 466 | 581 | ||||
| WiFi | 408 | 515 | 325 | 580 | 401 |
Pros
Cons
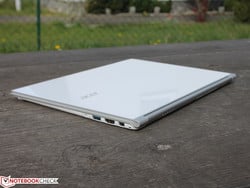
纤薄超级本,不容小觑的售价:Acer的Aspire S7-393 表现十分全面,得到了84%的总分。尽管这足以帮助它获得我们超极本Top 10排名中的一席之地,但还无法保证领先的位置(戴尔XPS 13-9343)。Aspire S7的优势在于高品质的轻盈机身。镜面QHD+屏幕的高分辨率可能并不适合所有人,而厂商也没有提供其他的磨砂或全高清分辨率机型可供选择。另一方面:这款测试机是德国市场上唯一的一个机型。
在高质量工艺和炫目设计之后,Aspire S7-393只有绚丽的屏幕和非常优秀的性能可以作为优势与其他高端产品相竞争。它在一些细节方面就稍逊一筹了,如屏幕亮度和电池续航时间。
它名副其实的优势是高性能,运行中保持清凉的表面,与通过DisplayPort转接器的接口扩展。Acer接受了关于接口不足的建议,为它搭配了DisplayPort转接器(VGA,以太网,USB)。不过,我们也不得不提Aspire S7为总分拖了后腿的一些劣势。它的屏幕采用了高光的镜面表面,加之亮度不足,在阳光下几乎无法使用。而升级和维护空间也十分有限,电池续航相比同类产品也较短。锐利的边缘在人体工程学上也值得质疑,在长期使用中可能会造成不便。而较差的摄像头成像质量与分辨率也十分不符合这款超极本1500欧元的定位。
注:本文是基于完整评测的缩减版本,阅读完整的英文评测,请点击这里。
Acer Aspire S7-393-75508G25EWS
- 05/22/2015 v4 (old)
Sebastian Jentsch


