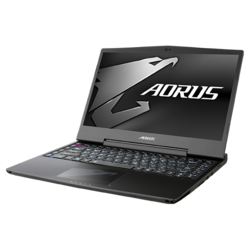
Aorus X3 Plus v7 (i7-7820HK, GTX 1060) Xotic PC Edition 笔记本电脑简短评测
» Notebookcheck多媒体笔记本电脑Top 10排名
» Notebookcheck游戏笔记本电脑Top 10排名
» Notebookcheck低价办公/商务笔记本电脑Top 10排名
» Notebookcheck高端办公/商务笔记本电脑Top 10排名
» Notebookcheck工作站笔记本电脑Top 10排名
» Notebookcheck亚笔记本电脑Top 10排名
» Notebookcheck超级本产品Top 10排名
» Notebookcheck变形本产品Top 10排名
» Notebookcheck平板电脑Top 10排名
» Notebookcheck智能手机Top 10排名
» Notebookcheck评测过最出色的笔记本电脑屏幕
» Notebookcheck售价500欧元以下笔记本电脑Top 10排名
» Notebookcheck售价300欧元以下笔记本电脑Top 10排名
| SD Card Reader | |
| average JPG Copy Test (av. of 3 runs) | |
| Eurocom Tornado F5 | |
| Aorus x3 Plus v7 | |
| Gigabyte Aero 15 | |
| Gigabyte Aero 14 | |
| MSI GS63VR 7RF-228US | |
| maximum AS SSD Seq Read Test (1GB) | |
| Eurocom Tornado F5 | |
| Aorus x3 Plus v7 | |
| Gigabyte Aero 15 | |
| Gigabyte Aero 14 | |
| MSI GS63VR 7RF-228US | |
| Networking | |
| iperf3 transmit AX12 | |
| MSI GS63VR 7RF-228US | |
| Alienware 13 R3 | |
| Eurocom Tornado F5 | |
| Gigabyte Aero 14 | |
| Aorus x3 Plus v7 | |
| Gigabyte Aero 15 | |
| iperf3 receive AX12 | |
| Gigabyte Aero 14 | |
| Gigabyte Aero 15 | |
| Alienware 13 R3 | |
| MSI GS63VR 7RF-228US | |
| Aorus x3 Plus v7 | |
| Eurocom Tornado F5 | |
| |||||||||||||||||||||||||
Brightness Distribution: 73 %
Center on Battery: 348 cd/m²
Contrast: 1200:1 (Black: 0.29 cd/m²)
ΔE Color 2.4 | 0.5-29.43 Ø4.87
ΔE Greyscale 2.3 | 0.5-98 Ø5.1
96% sRGB (Argyll 1.6.3 3D)
62% AdobeRGB 1998 (Argyll 1.6.3 3D)
67.5% AdobeRGB 1998 (Argyll 2.2.0 3D)
96.5% sRGB (Argyll 2.2.0 3D)
66.1% Display P3 (Argyll 2.2.0 3D)
Gamma: 2.21
| Aorus x3 Plus v7 Sharp SHP1401, IGZO TFT, 13.9", 3200x1800 | Alienware 13 R3 JJT6C_133KL05 (SDCA029), OLED, 13.3", 2560x1440 | Gigabyte Aero 14 LG Philips LP140QH1-SPF1 (LGD049A), IPS, 14", 2560x1440 | Razer Blade (2017) LP140WF3-SPD1, IPS, 14", 1920x1080 | Gigabyte Aero 15 N156HCA-EA1 (CMN15D7), IPS, 15.6", 1920x1080 | Eurocom Tornado F5 IPS, 15.6", 1920x1080 | MSI GS63VR 7RF-228US IPS, 15.6", 3840x2160 | Aorus X5 v6 AO-S107W516-PL-002 Panasonic MEI96A2 / VVX16T028J00, , 15.6", 2880x1620 | |
|---|---|---|---|---|---|---|---|---|
| Display | -4% | -2% | -9% | -26% | 5% | |||
| Display P3 Coverage | 66.1 | 64.4 -3% | 65.2 -1% | 64.5 -2% | 48.21 -27% | 71.7 8% | ||
| sRGB Coverage | 96.5 | 91.8 -5% | 92.5 -4% | 83 -14% | 72.6 -25% | 97.6 1% | ||
| AdobeRGB 1998 Coverage | 67.5 | 65.5 -3% | 66.5 -1% | 60.7 -10% | 49.81 -26% | 72.1 7% | ||
| Response Times | 54% | -5% | 3511% | 4251% | -8% | 200% | ||
| Response Time Grey 50% / Grey 80% * | 38 ? | 41 ? -8% | 25.2 ? 34% | 42.8 ? -13% | 33.6 ? 12% | 28 ? 26% | ||
| Response Time Black / White * | 24.4 ? | 2.8 ? 89% | 25 ? -2% | 24.8 ? -2% | 32 ? -31% | 31.2 ? -28% | 23.6 ? 3% | |
| PWM Frequency | 201.6 ? | 240 ? 19% | 21370 10500% | 26000 ? 12797% | 1351 ? 570% | |||
| Screen | 10% | -32% | -30% | -40% | -35% | -89% | -15% | |
| Brightness middle | 348 | 313 -10% | 290 -17% | 272 -22% | 320 -8% | 315.8 -9% | 274.2 -21% | 350 1% |
| Brightness | 359 | 310 -14% | 257 -28% | 277 -23% | 316 -12% | 310 -14% | 263 -27% | 296 -18% |
| Brightness Distribution | 73 | 87 19% | 79 8% | 84 15% | 90 23% | 90 23% | 92 26% | 79 8% |
| Black Level * | 0.29 | 0.3 -3% | 0.26 10% | 0.36 -24% | 0.33 -14% | 0.44 -52% | 0.4 -38% | |
| Contrast | 1200 | 967 -19% | 1046 -13% | 889 -26% | 957 -20% | 623 -48% | 875 -27% | |
| Colorchecker dE 2000 * | 2.4 | 2.54 -6% | 4.59 -91% | 4.59 -91% | 4.62 -93% | 5 -108% | 8 -233% | |
| Colorchecker dE 2000 max. * | 5.1 | 3.94 23% | 8.68 -70% | 8.49 -66% | 9.75 -91% | 10.1 -98% | 14.6 -186% | |
| Greyscale dE 2000 * | 2.3 | 1.43 38% | 4.32 -88% | 4.28 -86% | 6 -161% | 4.2 -83% | 9.1 -296% | |
| Gamma | 2.21 100% | 2.3 96% | 2.25 98% | 2.23 99% | 2.46 89% | 2.12 104% | 2.24 98% | |
| CCT | 6206 105% | 6337 103% | 7320 89% | 6848 95% | 6761 96% | 6107 106% | 5020 129% | |
| Color Space (Percent of AdobeRGB 1998) | 62 | 78 26% | 59 -5% | 55 -11% | 60 -3% | 54.5 -12% | 45.7 -26% | |
| Color Space (Percent of sRGB) | 96 | 97 1% | 92 -4% | 83 -14% | 92 -4% | 83 -14% | 72.1 -25% | |
| Total Average (Program / Settings) | 32% /
19% | -14% /
-23% | 1741% /
787% | 1403% /
772% | -17% /
-26% | 28% /
-23% | -5% /
-7% |
* ... smaller is better
Display Response Times
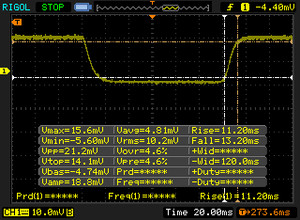
| ↔ Response Time Black to White | ||
|---|---|---|
| 24.4 ms ... rise ↗ and fall ↘ combined | ↗ 11.2 ms rise | |
| ↘ 13.2 ms fall | ||
| The screen shows good response rates in our tests, but may be too slow for competitive gamers. In comparison, all tested devices range from 0.1 (minimum) to 240 (maximum) ms. » 54 % of all devices are better. This means that the measured response time is worse than the average of all tested devices (20.8 ms). | ||
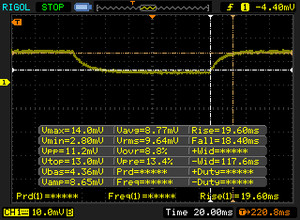
| ↔ Response Time 50% Grey to 80% Grey | ||
| 38 ms ... rise ↗ and fall ↘ combined | ↗ 19.6 ms rise | |
| ↘ 18.4 ms fall | ||
| The screen shows slow response rates in our tests and will be unsatisfactory for gamers. In comparison, all tested devices range from 0.165 (minimum) to 636 (maximum) ms. » 52 % of all devices are better. This means that the measured response time is worse than the average of all tested devices (32.5 ms). | ||
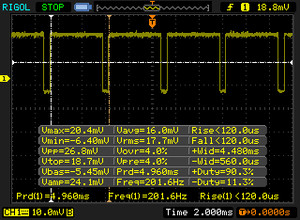
Screen Flickering / PWM (Pulse-Width Modulation)
| Screen flickering / PWM detected | 201.6 Hz | ≤ 50 % brightness setting | |
The display backlight flickers at 201.6 Hz (worst case, e.g., utilizing PWM) Flickering detected at a brightness setting of 50 % and below. There should be no flickering or PWM above this brightness setting. The frequency of 201.6 Hz is relatively low, so sensitive users will likely notice flickering and experience eyestrain at the stated brightness setting and below. In comparison: 53 % of all tested devices do not use PWM to dim the display. If PWM was detected, an average of 8516 (minimum: 5 - maximum: 343500) Hz was measured. | |||
| Cinebench R15 | |
| CPU Single 64Bit | |
| Eurocom Tornado F5 | |
| Aorus x3 Plus v7 | |
| Aorus X5 v6 AO-S107W516-PL-002 | |
| MSI GS63VR 7RF-228US | |
| Gigabyte Aero 15 | |
| Alienware 13 R3 | |
| Gigabyte Aero 14 | |
| Razer Blade (2017) | |
| CPU Multi 64Bit | |
| Eurocom Tornado F5 | |
| Aorus x3 Plus v7 | |
| Aorus X5 v6 AO-S107W516-PL-002 | |
| MSI GS63VR 7RF-228US | |
| Gigabyte Aero 15 | |
| Alienware 13 R3 | |
| Gigabyte Aero 14 | |
| Razer Blade (2017) | |
| Cinebench R11.5 | |
| CPU Single 64Bit | |
| Eurocom Tornado F5 | |
| Aorus x3 Plus v7 | |
| Gigabyte Aero 15 | |
| Alienware 13 R3 | |
| MSI GS63VR 7RF-228US | |
| CPU Multi 64Bit | |
| Eurocom Tornado F5 | |
| Aorus x3 Plus v7 | |
| Gigabyte Aero 15 | |
| MSI GS63VR 7RF-228US | |
| Alienware 13 R3 | |
| Cinebench R10 | |
| Rendering Multiple CPUs 32Bit | |
| Aorus x3 Plus v7 | |
| Eurocom Tornado F5 | |
| MSI GS63VR 7RF-228US | |
| Rendering Single 32Bit | |
| Aorus x3 Plus v7 | |
| Eurocom Tornado F5 | |
| MSI GS63VR 7RF-228US | |
| wPrime 2.10 - 1024m | |
| Aorus x3 Plus v7 | |
| MSI GS63VR 7RF-228US | |
| Aorus X5 v6 AO-S107W516-PL-002 | |
| Eurocom Tornado F5 | |
* ... smaller is better
| PCMark 8 | |
| Home Score Accelerated v2 | |
| Eurocom Tornado F5 | |
| Gigabyte Aero 15 | |
| MSI GS63VR 7RF-228US | |
| Razer Blade (2017) | |
| Alienware 13 R3 | |
| Gigabyte Aero 14 | |
| Aorus x3 Plus v7 | |
| Work Score Accelerated v2 | |
| Eurocom Tornado F5 | |
| Gigabyte Aero 15 | |
| MSI GS63VR 7RF-228US | |
| Razer Blade (2017) | |
| Alienware 13 R3 | |
| Gigabyte Aero 14 | |
| Aorus x3 Plus v7 | |
| Creative Score Accelerated v2 | |
| Eurocom Tornado F5 | |
| MSI GS63VR 7RF-228US | |
| Alienware 13 R3 | |
| Aorus x3 Plus v7 | |
| PCMark 7 Score | 5966 points | |
| PCMark 8 Home Score Accelerated v2 | 3266 points | |
| PCMark 8 Creative Score Accelerated v2 | 4278 points | |
| PCMark 8 Work Score Accelerated v2 | 4605 points | |
Help | ||
| Aorus x3 Plus v7 Toshiba NVMe THNSN5512GPU7 | Alienware 13 R3 Toshiba NVMe THNSN5256GPUK | Gigabyte Aero 14 LiteOn CX2-8B256 | Razer Blade (2017) Samsung PM951 NVMe MZVLV256 | Gigabyte Aero 15 Lite-On CX2-8B512-Q11 | Eurocom Tornado F5 Samsung SSD 960 Pro 512 GB m.2 | MSI GS63VR 7RF-228US Samsung SM961 MZVKW512HMJP m.2 PCI-e | Aorus X5 v6 AO-S107W516-PL-002 LiteOn CX2-8B256 | |
|---|---|---|---|---|---|---|---|---|
| CrystalDiskMark 3.0 | -23% | -14% | -38% | -6% | 12% | 7% | -12% | |
| Read Seq | 1498 | 1373 -8% | 1584 6% | 1122 -25% | 1769 18% | 2145 43% | 2141 43% | 1605 7% |
| Write Seq | 1324 | 789 -40% | 795 -40% | 311 -77% | 1133 -14% | 1724 30% | 1621 22% | 767 -42% |
| Read 512 | 966 | 1070 11% | 985 2% | 682 -29% | 891 -8% | 715 -26% | 499.7 -48% | 952 -1% |
| Write 512 | 1221 | 405.6 -67% | 814 -33% | 310 -75% | 1069 -12% | 967 -21% | 1531 25% | 724 -41% |
| Read 4k | 44.8 | 37.65 -16% | 44.93 0% | 34.8 -22% | 44.7 0% | 55.9 25% | 54.2 21% | 46.13 3% |
| Write 4k | 156 | 140.2 -10% | 131.2 -16% | 134.3 -14% | 123.3 -21% | 180.6 16% | 158.2 1% | 143.2 -8% |
| Read 4k QD32 | 700 | 593 -15% | 602 -14% | 565 -19% | 645 -8% | 744 6% | 632 -10% | 644 -8% |
| Write 4k QD32 | 517 | 311.2 -40% | 441 -15% | 308 -40% | 490.5 -5% | 634 23% | 527 2% | 486.2 -6% |
| 3DMark | |
| 1280x720 Cloud Gate Standard Graphics | |
| Eurocom Tornado F5 | |
| Aorus X5 v6 AO-S107W516-PL-002 | |
| Gigabyte Aero 15 | |
| Alienware 13 R3 | |
| Aorus x3 Plus v7 | |
| Gigabyte Aero 14 | |
| MSI GS63VR 7RF-228US | |
| 1920x1080 Fire Strike Graphics | |
| Aorus X5 v6 AO-S107W516-PL-002 | |
| Eurocom Tornado F5 | |
| Aorus x3 Plus v7 | |
| Gigabyte Aero 14 | |
| Alienware 13 R3 | |
| MSI GS63VR 7RF-228US | |
| Gigabyte Aero 15 | |
| Razer Blade (2017) | |
| 3DMark Ice Storm Standard Score | 33625 points | |
| 3DMark Cloud Gate Standard Score | 20785 points | |
| 3DMark Fire Strike Score | 10361 points | |
| 3DMark Fire Strike Extreme Score | 5532 points | |
Help | ||
| BioShock Infinite - 1920x1080 Ultra Preset, DX11 (DDOF) (sort by value) | |
| Aorus x3 Plus v7 | |
| Eurocom Tornado F5 | |
| MSI GS63VR 7RF-228US | |
| Aorus X5 v6 AO-S107W516-PL-002 | |
| Metro: Last Light - 1920x1080 Very High (DX11) AF:16x (sort by value) | |
| Aorus x3 Plus v7 | |
| Eurocom Tornado F5 | |
| MSI GS63VR 7RF-228US | |
| Thief - 1920x1080 Very High Preset AA:FXAA & High SS AF:8x (sort by value) | |
| Aorus x3 Plus v7 | |
| MSI GS63VR 7RF-228US | |
| Aorus X5 v6 AO-S107W516-PL-002 | |
| The Witcher 3 - 1920x1080 Ultra Graphics & Postprocessing (HBAO+) (sort by value) | |
| Aorus x3 Plus v7 | |
| Gigabyte Aero 14 | |
| Razer Blade (2017) | |
| Gigabyte Aero 15 | |
| MSI GS63VR 7RF-228US | |
| Aorus X5 v6 AO-S107W516-PL-002 | |
| Rise of the Tomb Raider - 1920x1080 Very High Preset AA:FX AF:16x (sort by value) | |
| Aorus x3 Plus v7 | |
| Razer Blade (2017) | |
| Eurocom Tornado F5 | |
| MSI GS63VR 7RF-228US | |
| Ashes of the Singularity - 1920x1080 high (sort by value) | |
| Aorus x3 Plus v7 | |
| Eurocom Tornado F5 | |
| Doom - 1920x1080 Ultra Preset AA:SM (sort by value) | |
| Aorus x3 Plus v7 | |
| Eurocom Tornado F5 | |
| MSI GS63VR 7RF-228US | |
| Fallout 4 - 1920x1080 Ultra Preset AA:T AF:16x (sort by value) | |
| Aorus x3 Plus v7 | |
| Eurocom Tornado F5 | |
| MSI GS63VR 7RF-228US | |
| low | med. | high | ultra | |
|---|---|---|---|---|
| BioShock Infinite (2013) | 109 | |||
| Metro: Last Light (2013) | 82 | |||
| Thief (2014) | 42 | |||
| The Witcher 3 (2015) | 40 | |||
| Fallout 4 (2015) | 77 | |||
| Rise of the Tomb Raider (2016) | 65 | |||
| Ashes of the Singularity (2016) | 50 | |||
| Doom (2016) | 97 | |||
| Mafia 3 (2016) | 45 |
Noise Level
| Idle |
| 31.4 / 37 / 40.8 dB(A) |
| Load |
| 50 / 53.6 dB(A) |
 | ||
30 dB silent 40 dB(A) audible 50 dB(A) loud |
||
min: | ||
| Aorus x3 Plus v7 GeForce GTX 1060 Mobile, i7-7820HK, Toshiba NVMe THNSN5512GPU7 | Alienware 13 R3 GeForce GTX 1060 Mobile, i7-7700HQ, Toshiba NVMe THNSN5256GPUK | Gigabyte Aero 14 GeForce GTX 1060 Mobile, i7-7700HQ, LiteOn CX2-8B256 | Razer Blade (2017) GeForce GTX 1060 Mobile, i7-7700HQ, Samsung PM951 NVMe MZVLV256 | Gigabyte Aero 15 GeForce GTX 1060 Mobile, i7-7700HQ, Lite-On CX2-8B512-Q11 | Eurocom Tornado F5 GeForce GTX 1070 Mobile, i7-7700K, Samsung SSD 960 Pro 512 GB m.2 | MSI GS63VR 7RF-228US GeForce GTX 1060 Mobile, i7-7700HQ, Samsung SM961 MZVKW512HMJP m.2 PCI-e | Aorus X5 v6 AO-S107W516-PL-002 GeForce GTX 1070 Mobile, 6820HK, LiteOn CX2-8B256 | |
|---|---|---|---|---|---|---|---|---|
| Noise | 15% | 9% | 10% | 10% | 6% | 11% | 1% | |
| off / environment * | 29.1 | 29 -0% | 31 -7% | 31 -7% | 29.4 -1% | 28.8 1% | ||
| Idle Minimum * | 31.4 | 29 8% | 31 1% | 30 4% | 32 -2% | 33.3 -6% | 33.1 -5% | 33.4 -6% |
| Idle Average * | 37 | 30 19% | 32 14% | 30 19% | 33 11% | 33.5 9% | 33.1 11% | 34.2 8% |
| Idle Maximum * | 40.8 | 31 24% | 33 19% | 30 26% | 34 17% | 33.5 18% | 34 17% | 35 14% |
| Load Average * | 50 | 36 28% | 42 16% | 51 -2% | 39 22% | 44.2 12% | 37.2 26% | 53.3 -7% |
| Witcher 3 ultra * | 53.6 | 45 16% | 43 20% | 46.1 14% | ||||
| Load Maximum * | 53.6 | 49 9% | 53 1% | 51 5% | 50 7% | 52.5 2% | 47.1 12% | 57 -6% |
* ... smaller is better
(-) The maximum temperature on the upper side is 46.8 °C / 116 F, compared to the average of 40.4 °C / 105 F, ranging from 21.2 to 68.8 °C for the class Gaming.
(-) The bottom heats up to a maximum of 55.2 °C / 131 F, compared to the average of 43.2 °C / 110 F
(+) In idle usage, the average temperature for the upper side is 25 °C / 77 F, compared to the device average of 33.9 °C / 93 F.
(±) Playing The Witcher 3, the average temperature for the upper side is 32.6 °C / 91 F, compared to the device average of 33.9 °C / 93 F.
(+) The palmrests and touchpad are cooler than skin temperature with a maximum of 27 °C / 80.6 F and are therefore cool to the touch.
(±) The average temperature of the palmrest area of similar devices was 28.9 °C / 84 F (+1.9 °C / 3.4 F).
Aorus x3 Plus v7 audio analysis
(±) | speaker loudness is average but good (72.5 dB)
Bass 100 - 315 Hz
(-) | nearly no bass - on average 18.4% lower than median
(±) | linearity of bass is average (12.6% delta to prev. frequency)
Mids 400 - 2000 Hz
(+) | balanced mids - only 1.6% away from median
(±) | linearity of mids is average (7.1% delta to prev. frequency)
Highs 2 - 16 kHz
(+) | balanced highs - only 4% away from median
(±) | linearity of highs is average (8% delta to prev. frequency)
Overall 100 - 16.000 Hz
(±) | linearity of overall sound is average (25.5% difference to median)
Compared to same class
» 90% of all tested devices in this class were better, 3% similar, 8% worse
» The best had a delta of 6%, average was 18%, worst was 132%
Compared to all devices tested
» 77% of all tested devices were better, 5% similar, 19% worse
» The best had a delta of 4%, average was 24%, worst was 134%
Alienware 13 R3 audio analysis
(±) | speaker loudness is average but good (79 dB)
Bass 100 - 315 Hz
(±) | reduced bass - on average 14.8% lower than median
(±) | linearity of bass is average (10% delta to prev. frequency)
Mids 400 - 2000 Hz
(+) | balanced mids - only 3.8% away from median
(+) | mids are linear (6.2% delta to prev. frequency)
Highs 2 - 16 kHz
(+) | balanced highs - only 3.6% away from median
(+) | highs are linear (6.9% delta to prev. frequency)
Overall 100 - 16.000 Hz
(±) | linearity of overall sound is average (18.4% difference to median)
Compared to same class
» 57% of all tested devices in this class were better, 8% similar, 35% worse
» The best had a delta of 6%, average was 18%, worst was 132%
Compared to all devices tested
» 38% of all tested devices were better, 8% similar, 54% worse
» The best had a delta of 4%, average was 24%, worst was 134%
| Off / Standby | |
| Idle | |
| Load |
|
Key:
min: | |
| Aorus x3 Plus v7 i7-7820HK, GeForce GTX 1060 Mobile, Toshiba NVMe THNSN5512GPU7, IGZO TFT, 3200x1800, 13.9" | Alienware 13 R3 i7-7700HQ, GeForce GTX 1060 Mobile, Toshiba NVMe THNSN5256GPUK, OLED, 2560x1440, 13.3" | Gigabyte Aero 14 i7-7700HQ, GeForce GTX 1060 Mobile, LiteOn CX2-8B256, IPS, 2560x1440, 14" | Razer Blade (2017) i7-7700HQ, GeForce GTX 1060 Mobile, Samsung PM951 NVMe MZVLV256, IPS, 1920x1080, 14" | Gigabyte Aero 15 i7-7700HQ, GeForce GTX 1060 Mobile, Lite-On CX2-8B512-Q11, IPS, 1920x1080, 15.6" | Eurocom Tornado F5 i7-7700K, GeForce GTX 1070 Mobile, Samsung SSD 960 Pro 512 GB m.2, IPS, 1920x1080, 15.6" | MSI GS63VR 7RF-228US i7-7700HQ, GeForce GTX 1060 Mobile, Samsung SM961 MZVKW512HMJP m.2 PCI-e, IPS, 3840x2160, 15.6" | Aorus X5 v6 AO-S107W516-PL-002 6820HK, GeForce GTX 1070 Mobile, LiteOn CX2-8B256, , 2880x1620, 15.6" | |
|---|---|---|---|---|---|---|---|---|
| Power Consumption | 21% | 18% | 29% | 9% | -46% | 2% | -70% | |
| Idle Minimum * | 15.1 | 7 54% | 8 47% | 7.5 50% | 12 21% | 21.2 -40% | 14.5 4% | 23.3 -54% |
| Idle Average * | 15.8 | 12 24% | 13 18% | 12.1 23% | 15 5% | 25.1 -59% | 17.3 -9% | 30.1 -91% |
| Idle Maximum * | 16.7 | 18 -8% | 20 -20% | 14.3 14% | 20 -20% | 26.3 -57% | 17.4 -4% | 31 -86% |
| Load Average * | 110.9 | 76 31% | 78 30% | 73.5 34% | 82 26% | 169.4 -53% | 93 16% | 195.8 -77% |
| Witcher 3 ultra * | 135 | 110 19% | 108 20% | 111 18% | 128.8 5% | |||
| Load Maximum * | 170.4 | 161 6% | 146 14% | 110.2 35% | 161 6% | 202.4 -19% | 242 -42% |
* ... smaller is better
| Aorus x3 Plus v7 i7-7820HK, GeForce GTX 1060 Mobile, 74 Wh | Alienware 13 R3 i7-7700HQ, GeForce GTX 1060 Mobile, 76 Wh | Gigabyte Aero 14 i7-7700HQ, GeForce GTX 1060 Mobile, 94 Wh | Razer Blade (2017) i7-7700HQ, GeForce GTX 1060 Mobile, 70 Wh | Gigabyte Aero 15 i7-7700HQ, GeForce GTX 1060 Mobile, 94.24 Wh | Eurocom Tornado F5 i7-7700K, GeForce GTX 1070 Mobile, 75.24 Wh | MSI GS63VR 7RF-228US i7-7700HQ, GeForce GTX 1060 Mobile, 65 Wh | Aorus X5 v6 AO-S107W516-PL-002 6820HK, GeForce GTX 1070 Mobile, 94.2 Wh | |
|---|---|---|---|---|---|---|---|---|
| Battery Runtime | 3% | 66% | 86% | 30% | -33% | -22% | -49% | |
| Reader / Idle | 477 | 524 10% | 909 91% | 638 34% | 291 -39% | 386 -19% | 242 -49% | |
| WiFi v1.3 | 293 | 320 9% | 524 79% | 545 86% | 422 44% | 216 -26% | 232 -21% | |
| Load | 100 | 90 -10% | 129 29% | 112 12% | 67 -33% | 75 -25% | ||
| WiFi | 182 |
Pros
Cons
X3 Plus v7是一款雄心勃勃的设备。Aorus继续推动,将强大的硬件配备到一个紧凑的空间里。不幸的是,X3用力过猛,使得最终的结果充满妥协。虽然有一些明确的亮点,但是其他方面却削减到了平均水平,甚至可能削减了错误的地方。
X3的设计非常出色。迷人的表面加上细腻的音响效果,同样漂亮的外壳,采用金属材质使设备显得高档。全高清屏幕也令人惊叹。图像和文字足够锐利,颜色鲜艳且准确,即使在阳光直射的情况下,屏幕仍然保持亮丽清晰。游戏表现同样让人印象深刻。令人惊叹的是,现在用户还可以在笔记本电脑中获得桌面级别(或更好)的性能。此外,超频处理器和显卡的选项是不错的补充; 更多的灵活性增加了它的价值。
不幸的是,这种表现是有代价的。外壳太小,无法很好管理强大的内部部件所产生的热量,从而迫使风扇速度飞快地飙升,因为它们试图散掉足够的热量来保持事态发展。最终的结果是笔记本很响,运行时很热,并可能在严重的压力下热节流。而且,电源提供的大量功率消耗,可能会引起一些问题。 再次提醒,用户在将笔记本电脑推到极限时应谨慎。
总的来说,我们喜欢Aorus X3 Plus v7。它有很好的表现,但对比于 嘉艺科技 Aero 14 和 外星人 13, X3在其他方面有不足。平庸的键盘,令人沮丧的触摸板以及散热和噪音问题,使得X3达不到轻薄型游戏笔记本电脑的顶尖水平。
虽然Aorus X3 Plus v7在小机身中提供令人印象深刻的性能,但是我们认为,该设备做出了太多的妥协。寻找便携式设备的游戏玩家有更平衡的选择。
Aorus x3 Plus v7
- 05/16/2017 v6 (old)
Sam Medley


