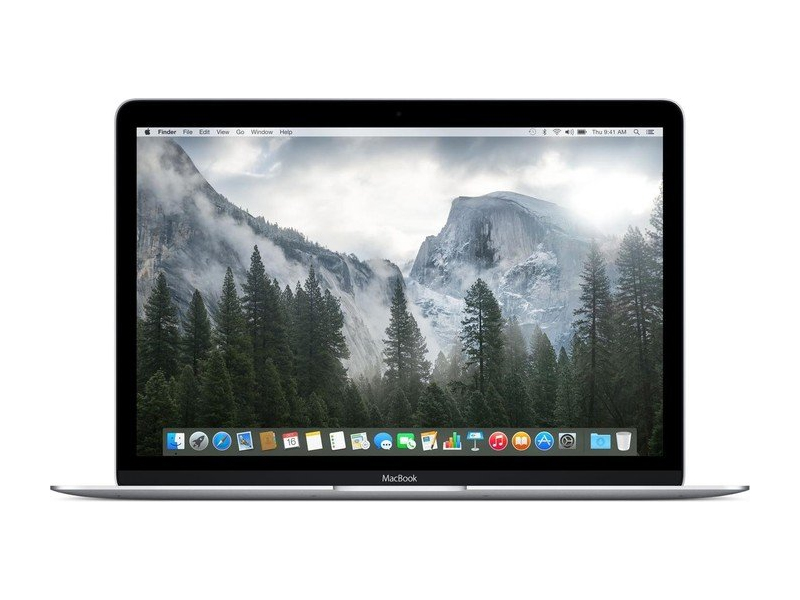
Apple MacBook 12 (2015年初) 1.1 GHz 简短评测
Apple MacBook 12 (Early 2015) 1.1 GHz
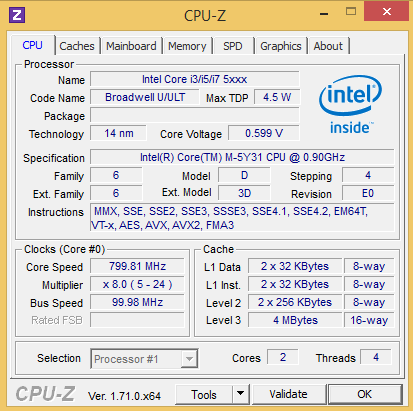
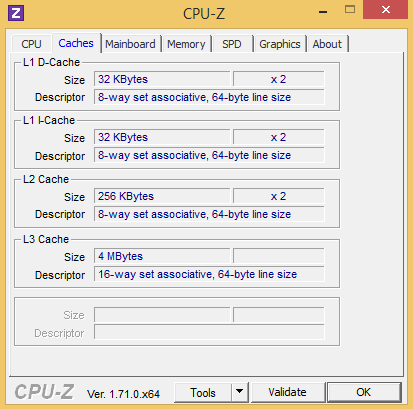
Processor
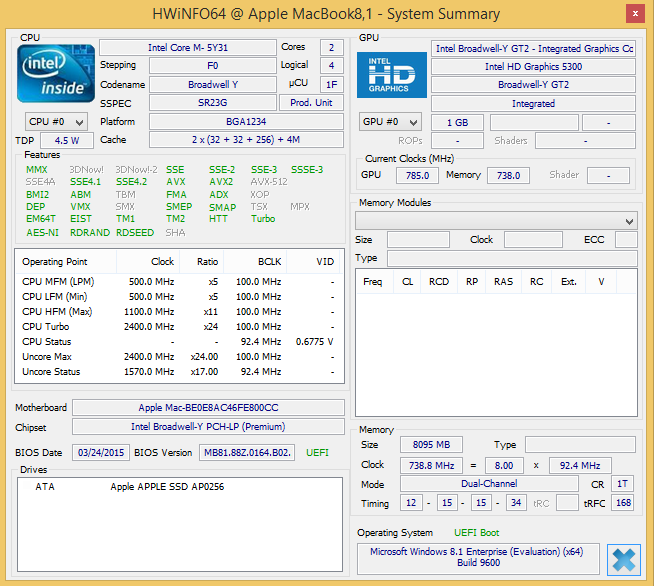
Intel Core M-5Y31 2c/4t 2 x 0.9 - 2.4 GHz, Broadwell
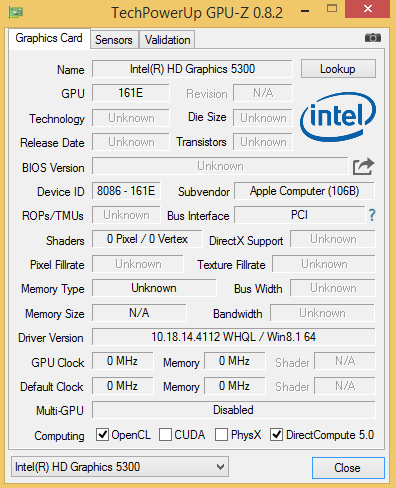
Graphics adapter
Intel HD Graphics 5300, Core: 850 MHz, RAM: 800 MHz, 双通道内存, 10.18.14.4112
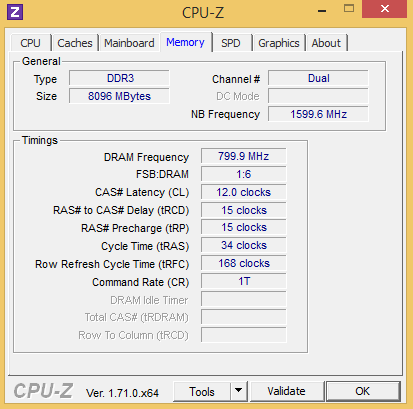
Memory
8 GB
, 双通道 LPDDR3-1600, 板载, 无插槽
Display
12.00 inch 16:10, 2304 x 1440 pixel 226 PPI, Apple APPA027, IPS 面板, LED 背光, glossy: yes
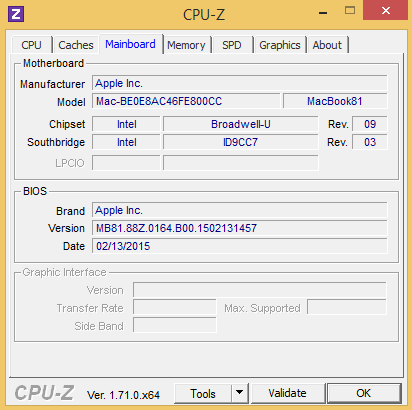
Mainboard
Intel Broadwell-Y PCH-LP (Premium)
Storage
Apple SSD AP0256, 256 GB
, NVMe协议, 231 GB free
Weight
920 g, Power Supply: 169 g
Price
1449 Euro
Links
Note: The manufacturer may use components from different suppliers including display panels, drives or memory sticks with similar specifications.
| |||||||||||||||||||||||||
Apple APPA027 tested with X-Rite i1Pro 2
Maximum: 345 cd/m² (Nits) Average: 324.7 cd/m²Brightness Distribution: 90 %
Center on Battery: 345 cd/m²
Contrast: 1065:1 (Black: 0.324 cd/m²)
ΔE ColorChecker Calman: 1.62 | ∀{0.5-29.43 Ø4.75}
ΔE Greyscale Calman: 1.88 | ∀{0.09-98 Ø5}
95.5% sRGB (Argyll 1.6.3 3D)
61.8% AdobeRGB 1998 (Argyll 1.6.3 3D)
68.7% AdobeRGB 1998 (Argyll 3D)
95.6% sRGB (Argyll 3D)
67.6% Display P3 (Argyll 3D)
Gamma: 2.55
CCT: 6411 K
| Apple MacBook 12 (Early 2015) 1.1 GHz 2304 x 1440 (IPS) | Apple MacBook Pro Retina 13 inch 2015-03 2560 x 1600 (IPS) | Apple MacBook Air 11 inch 2015-03 1366 x 768 (TN) | Asus Zenbook UX305FA-FC004H 1920 x 1080 (IPS) | Dell XPS 13-9343 3200 x 1800 (IPS) | |
|---|---|---|---|---|---|
| Display | -1% | -39% | -5% | 4% | |
| Display P3 Coverage (%) | 67.6 | 65.9 -3% | 40.56 -40% | 64.2 -5% | 72 7% |
| sRGB Coverage (%) | 95.6 | 97 1% | 60.6 -37% | 91.9 -4% | 96 0% |
| AdobeRGB 1998 Coverage (%) | 68.7 | 67.4 -2% | 41.95 -39% | 65.4 -5% | 71.6 4% |
| Screen | -5% | -42% | -65% | -30% | |
| Brightness middle (cd/m²) | 345 | 361 5% | 368 7% | 351 2% | 367.3 6% |
| Brightness (cd/m²) | 325 | 342 5% | 349 7% | 341 5% | 372 14% |
| Brightness Distribution (%) | 90 | 81 -10% | 90 0% | 93 3% | 77 -14% |
| Black Level * (cd/m²) | 0.324 | 0.361 -11% | 0.493 -52% | 0.33 -2% | 0.178 45% |
| Contrast (:1) | 1065 | 1000 -6% | 746 -30% | 1064 0% | 2063 94% |
| Colorchecker dE 2000 * | 1.62 | 1.82 -12% | 3.29 -103% | 6.5 -301% | 5.92 -265% |
| Colorchecker dE 2000 max. * | 2.51 | 3.26 -30% | 5.22 -108% | ||
| Greyscale dE 2000 * | 1.88 | 1.8 4% | 3.06 -63% | 7.19 -282% | 4.79 -155% |
| Gamma | 2.55 86% | 2.49 88% | 2.68 82% | 2.07 106% | 2.42 91% |
| CCT | 6411 101% | 6417 101% | 6397 102% | 6692 97% | 7013 93% |
| Color Space (Percent of AdobeRGB 1998) (%) | 61.8 | 61.9 0% | 38.8 -37% | 59.6 -4% | 63 2% |
| Color Space (Percent of sRGB) (%) | 95.5 | 96.9 1% | 91.8 -4% | 96.4 1% | |
| Total Average (Program / Settings) | -3% /
-4% | -41% /
-41% | -35% /
-50% | -13% /
-22% |
* ... smaller is better
| Cinebench R15 | |
| CPU Single 64Bit (sort by value) | |
| Apple MacBook 12 (Early 2015) 1.1 GHz | |
| Apple MacBook 12 (Early 2015) 1.1 GHz | |
| Microsoft Surface 3 | |
| Asus Zenbook UX305FA-FC004H | |
| Dell XPS 13-9343 Non-Touch | |
| Dell XPS 13 9343 Core i7 | |
| Apple MacBook Pro Retina 13 inch 2015-03 | |
| CPU Multi 64Bit (sort by value) | |
| Apple MacBook 12 (Early 2015) 1.1 GHz | |
| Apple MacBook 12 (Early 2015) 1.1 GHz | |
| Microsoft Surface 3 | |
| Asus Zenbook UX305FA-FC004H | |
| Dell XPS 13-9343 Non-Touch | |
| Dell XPS 13 9343 Core i7 | |
| Apple MacBook Pro Retina 13 inch 2015-03 | |
| Mozilla Kraken 1.1 - Total (sort by value) | |
| Apple MacBook 12 (Early 2015) 1.1 GHz | |
| Asus Zenbook UX305FA-FC004H | |
| Dell XPS 13 9343 Core i7 | |
| Apple MacBook Pro Retina 13 inch 2015-03 | |
| Octane V2 - Total Score (sort by value) | |
| Apple MacBook 12 (Early 2015) 1.1 GHz | |
| Asus Zenbook UX305FA-FC004H | |
| Dell XPS 13 9343 Core i7 | |
| Apple MacBook Pro Retina 13 inch 2015-03 | |
* ... smaller is better
| Apple MacBook 12 (Early 2015) 1.1 GHz Apple SSD AP0256 | Apple MacBook Pro Retina 13 inch 2015-03 Apple SSD SM0128G | Apple MacBook Air 11 inch 2015-03 Apple SSD SM0128F | Asus ZenBook UX305FA-FB003H SanDisk SD7SN3Q256G1002 | Lenovo ThinkPad X1 Carbon 2015 Samsung SSD SM951 512 GB MZHPV512HDGL | |
|---|---|---|---|---|---|
| AS SSD | 46% | -5% | 31% | 151% | |
| Seq Read (MB/s) | 716 | 1233 72% | 630 -12% | 454.5 -37% | 1339 87% |
| Seq Write (MB/s) | 475.8 | 616 29% | 283.5 -40% | 371.6 -22% | 1209 154% |
| 4K Read (MB/s) | 17.55 | 20.6 17% | 18.32 4% | 28.11 60% | 39.9 127% |
| 4K Write (MB/s) | 26.26 | 30.2 15% | 25.54 -3% | 59.4 126% | 91.3 248% |
| 4K-64 Read (MB/s) | 838 | 891 6% | 355 -58% | 337.3 -60% | 510 -39% |
| 4K-64 Write (MB/s) | 94.4 | 221.2 134% | 169.4 79% | 204.9 117% | 402.2 326% |

Apple SSD AP0256
Sequential Read:
725 MB/s
Sequential Write:
499.5 MB/s
512K Read:
376.7 MB/s
512K Write:
430.8 MB/s
4K Read:
16.56 MB/s
4K Write:
27.34 MB/s
4K QD32 Read:
176.1 MB/s
4K QD32 Write:
95.8 MB/s
| Mozilla Kraken 1.1 - Total (sort by value) | |
| Apple MacBook 12 (Early 2015) 1.1 GHz | |
| Apple MacBook Pro Retina 13 inch 2015-03 | |
| Asus Zenbook UX305FA-FC004H | |
| Dell XPS 13 9343 Core i7 | |
| Peacekeeper - --- (sort by value) | |
| Apple MacBook 12 (Early 2015) 1.1 GHz | |
| Apple MacBook Pro Retina 13 inch 2015-03 | |
| Asus Zenbook UX305FA-FC004H | |
| Dell XPS 13 9343 Core i7 | |
| Octane V2 - Total Score (sort by value) | |
| Apple MacBook 12 (Early 2015) 1.1 GHz | |
| Apple MacBook Pro Retina 13 inch 2015-03 | |
| Asus Zenbook UX305FA-FC004H | |
| Dell XPS 13 9343 Core i7 | |
| PCMark 8 | |
| Home Score Accelerated v2 (sort by value) | |
| Apple MacBook 12 (Early 2015) 1.1 GHz | |
| Apple MacBook Pro Retina 13 inch 2015-03 | |
| Asus Zenbook UX305FA-FC004H | |
| Dell XPS 13 9343 Core i7 | |
| Microsoft Surface 3 | |
| Creative Score Accelerated v2 (sort by value) | |
| Apple MacBook 12 (Early 2015) 1.1 GHz | |
| Apple MacBook Pro Retina 13 inch 2015-03 | |
| Asus Zenbook UX305FA-FC004H | |
| Dell XPS 13 9343 Core i7 | |
| Work Score Accelerated v2 (sort by value) | |
| Apple MacBook 12 (Early 2015) 1.1 GHz | |
| Apple MacBook Pro Retina 13 inch 2015-03 | |
| Asus Zenbook UX305FA-FC004H | |
| Dell XPS 13 9343 Core i7 | |
* ... smaller is better
| PCMark 8 Home Score Accelerated v2 | 2671 points | |
| PCMark 8 Creative Score Accelerated v2 | 3276 points | |
| PCMark 8 Work Score Accelerated v2 | 3488 points | |
Help | ||
| 3DMark 11 - 1280x720 Performance (sort by value) | |
| Apple MacBook 12 (Early 2015) 1.1 GHz | |
| Asus ZenBook UX305FA-FB003H | |
| Dell XPS 13-9343 | |
| Apple MacBook Air 11 inch 2015-03 | |
| Microsoft Surface 3 | |
| 3DMark | |
| 1280x720 Ice Storm Standard Score (sort by value) | |
| Apple MacBook 12 (Early 2015) 1.1 GHz | |
| Asus ZenBook UX305FA-FB003H | |
| Dell XPS 13-9343 | |
| Apple MacBook Air 11 inch 2015-03 | |
| 1280x720 Cloud Gate Standard Score (sort by value) | |
| Apple MacBook 12 (Early 2015) 1.1 GHz | |
| Asus ZenBook UX305FA-FB003H | |
| Dell XPS 13-9343 | |
| Apple MacBook Air 11 inch 2015-03 | |
| 1920x1080 Fire Strike Score (sort by value) | |
| Apple MacBook 12 (Early 2015) 1.1 GHz | |
| Asus ZenBook UX305FA-FB003H | |
| Dell XPS 13-9343 | |
| Apple MacBook Air 11 inch 2015-03 | |
| GFXBench (DX / GLBenchmark) 2.7 - 1920x1080 T-Rex Offscreen (sort by value) | |
| Apple MacBook 12 (Early 2015) 1.1 GHz | |
| Apple iPad Air 2 2014 | |
| GFXBench 3.0 - 1920x1080 1080p Manhattan Offscreen (sort by value) | |
| Apple MacBook 12 (Early 2015) 1.1 GHz | |
| Apple iPad Air 2 2014 | |
| 3DMark 06 Standard Score | 5991 points | |
| 3DMark Vantage P Result | 3242 points | |
| 3DMark 11 Performance | 898 points | |
| 3DMark Ice Storm Standard Score | 41018 points | |
| 3DMark Cloud Gate Standard Score | 4274 points | |
| 3DMark Fire Strike Score | 620 points | |
Help | ||
| Diablo III | |
| 1024x768 Low / off (sort by value) | |
| Apple MacBook 12 (Early 2015) 1.1 GHz | |
| Apple MacBook Pro Retina 13 inch 2015-03 | |
| Microsoft Surface 3 | |
| Intel NUC5i5RYH | |
| 1366x768 Medium / low (sort by value) | |
| Apple MacBook 12 (Early 2015) 1.1 GHz | |
| Apple MacBook Pro Retina 13 inch 2015-03 | |
| Microsoft Surface 3 | |
| Intel NUC5i5RYH | |
| 1366x768 High AA:on (sort by value) | |
| Apple MacBook 12 (Early 2015) 1.1 GHz | |
| Apple MacBook Pro Retina 13 inch 2015-03 | |
| Intel NUC5i5RYH | |
| Counter-Strike: GO | |
| 1024x768 (Very) Low (sort by value) | |
| Apple MacBook 12 (Early 2015) 1.1 GHz | |
| Apple MacBook Pro Retina 13 inch 2015-03 | |
| Microsoft Surface 3 | |
| 1366x768 Medium (sort by value) | |
| Apple MacBook 12 (Early 2015) 1.1 GHz | |
| Apple MacBook Pro Retina 13 inch 2015-03 | |
| Microsoft Surface 3 | |
| 1366x768 High AA:2x MS AF:4x (sort by value) | |
| Apple MacBook 12 (Early 2015) 1.1 GHz | |
| Apple MacBook Pro Retina 13 inch 2015-03 | |
| Microsoft Surface 3 | |
| Tomb Raider | |
| 1024x768 Low Preset (sort by value) | |
| Apple MacBook 12 (Early 2015) 1.1 GHz | |
| Asus Zenbook UX305FA-FC004H | |
| Apple MacBook Pro Retina 13 inch 2015-03 | |
| Microsoft Surface 3 | |
| Intel NUC5i5RYH | |
| 1366x768 Normal Preset AA:FX AF:4x (sort by value) | |
| Apple MacBook 12 (Early 2015) 1.1 GHz | |
| Asus Zenbook UX305FA-FC004H | |
| Apple MacBook Pro Retina 13 inch 2015-03 | |
| Microsoft Surface 3 | |
| Intel NUC5i5RYH | |
| 1366x768 High Preset AA:FX AF:8x (sort by value) | |
| Apple MacBook 12 (Early 2015) 1.1 GHz | |
| Asus Zenbook UX305FA-FC004H | |
| Apple MacBook Pro Retina 13 inch 2015-03 | |
| Intel NUC5i5RYH | |
| Dota 2 | |
| 1024x768 Low / Off, Render Quality: 40 % (sort by value) | |
| Apple MacBook 12 (Early 2015) 1.1 GHz | |
| Apple MacBook Pro Retina 13 inch 2015-03 | |
| Microsoft Surface 3 | |
| 1366x768 Medium / On, Render Quality: 70 % (sort by value) | |
| Apple MacBook 12 (Early 2015) 1.1 GHz | |
| Apple MacBook Pro Retina 13 inch 2015-03 | |
| Microsoft Surface 3 | |
| 1920x1080 High / On, Render Quality: 100 % (sort by value) | |
| Apple MacBook 12 (Early 2015) 1.1 GHz | |
| Apple MacBook Pro Retina 13 inch 2015-03 | |
| low | med. | high | ultra | |
|---|---|---|---|---|
| Diablo III (2012) | 57.1 | 31.1 | 28.9 | 20 |
| Counter-Strike: GO (2012) | 62 | 49.7 | 25.1 | 19.8 |
| Tomb Raider (2013) | 49.1 | 25.2 | 16.5 | 7.9 |
| BioShock Infinite (2013) | 33.8 | 18.8 | 15.5 | |
| Dota 2 (2013) | 48 | 23.2 | 14.9 |
(±) The average temperature for the upper side under maximal load is 37.5 °C / 100 F, compared to the average of 30.8 °C / 87 F for the devices in the class Subnotebook.
(-) The maximum temperature on the upper side is 45.7 °C / 114 F, compared to the average of 35.9 °C / 97 F, ranging from 21.4 to 59 °C for the class Subnotebook.
(-) The bottom heats up to a maximum of 49.4 °C / 121 F, compared to the average of 39.2 °C / 103 F
(+) In idle usage, the average temperature for the upper side is 30.6 °C / 87 F, compared to the device average of 30.8 °C / 87 F.
(±) The palmrests and touchpad can get very hot to the touch with a maximum of 37.1 °C / 98.8 F.
(-) The average temperature of the palmrest area of similar devices was 28.2 °C / 82.8 F (-8.9 °C / -16 F).
Power Consumption
| Off / Standby | |
| Idle | |
| Load |
|
Key:
min: | |
| Apple MacBook 12 (Early 2015) 1.1 GHz 40 Wh | Apple MacBook Air 11 inch 2015-03 38 Wh | Apple MacBook Pro Retina 13 inch 2015-03 75 Wh | Asus ZenBook UX305FA-FB003H 45 Wh | Microsoft Surface 3 28 Wh | |
|---|---|---|---|---|---|
| Battery runtime | -15% | 9% | -10% | -11% | |
| Reader / Idle (h) | 23.5 | 28.2 20% | 13 -45% | 13.8 -41% | |
| H.264 (h) | 7.1 | 9.7 37% | 6.6 -7% | ||
| WiFi v1.3 (h) | 7.6 | 8.5 12% | 9 18% | 7.3 -4% | |
| Load (h) | 2.6 | 1.5 -42% | 1.6 -38% | 3.2 23% | 2.9 12% |
| WiFi (h) | 6.8 | 7.1 |
Pros
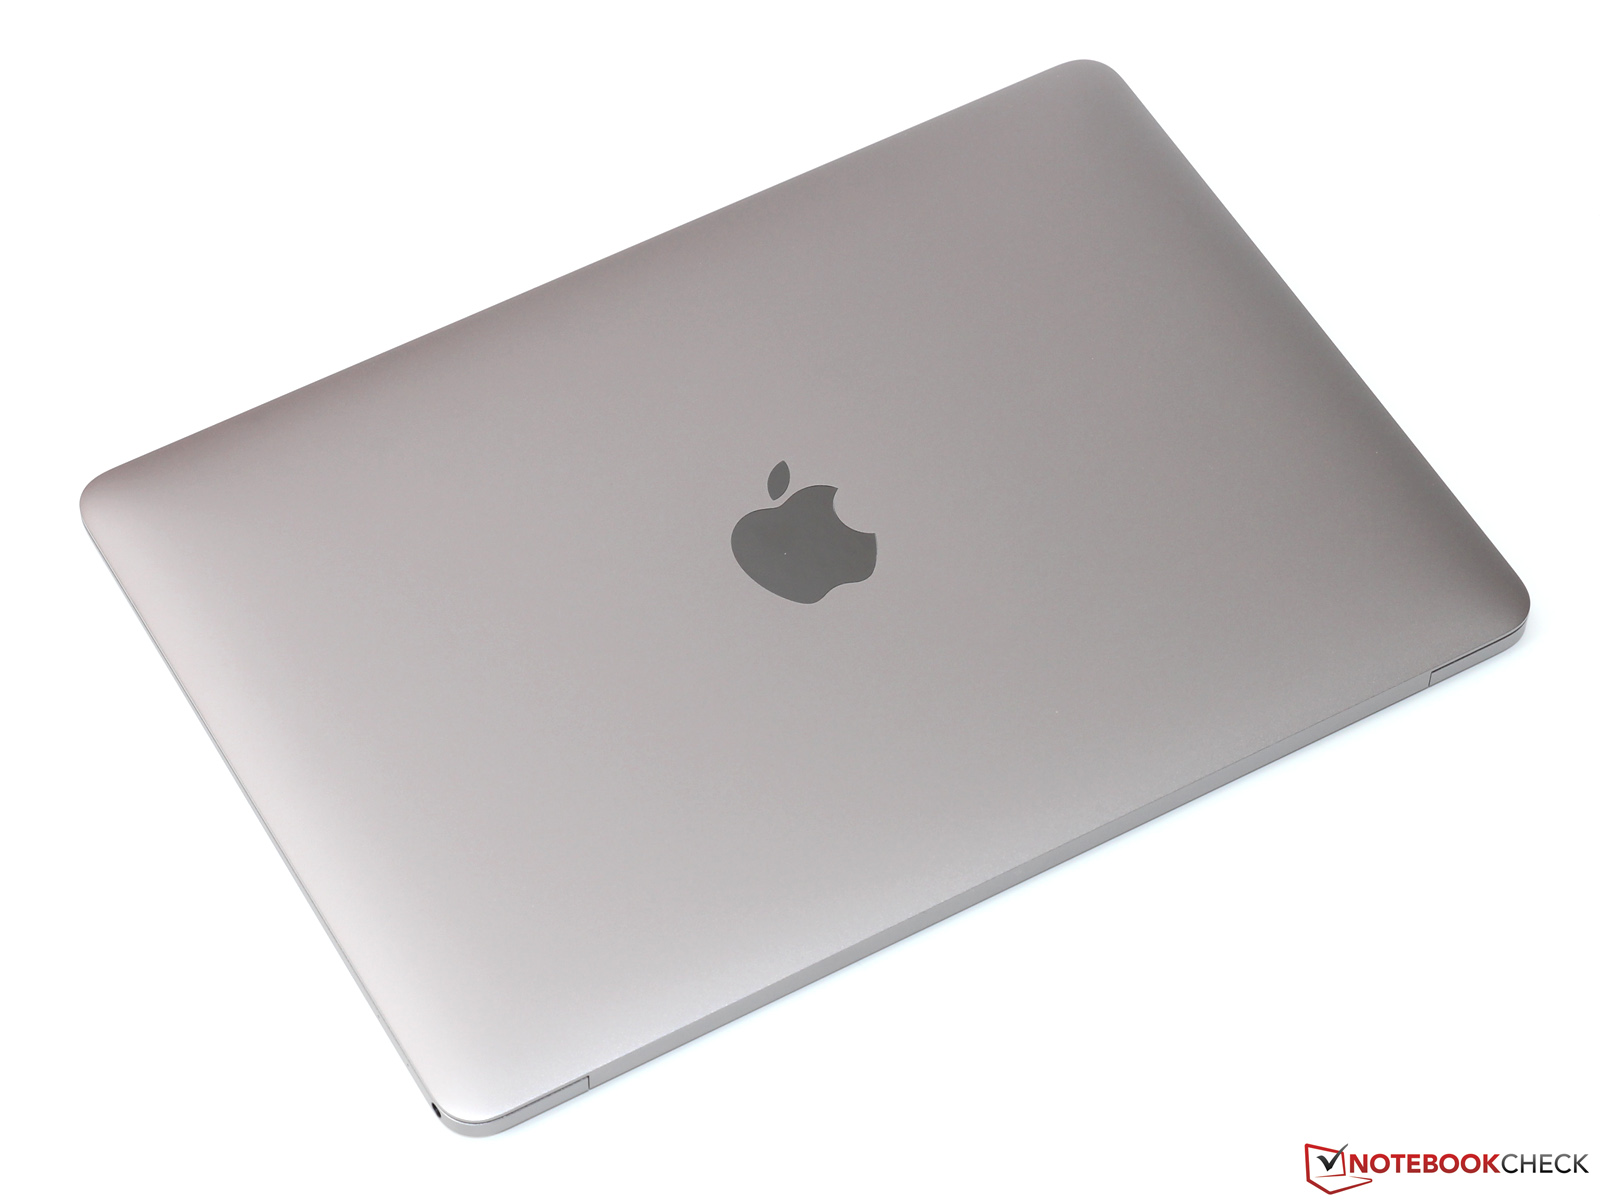
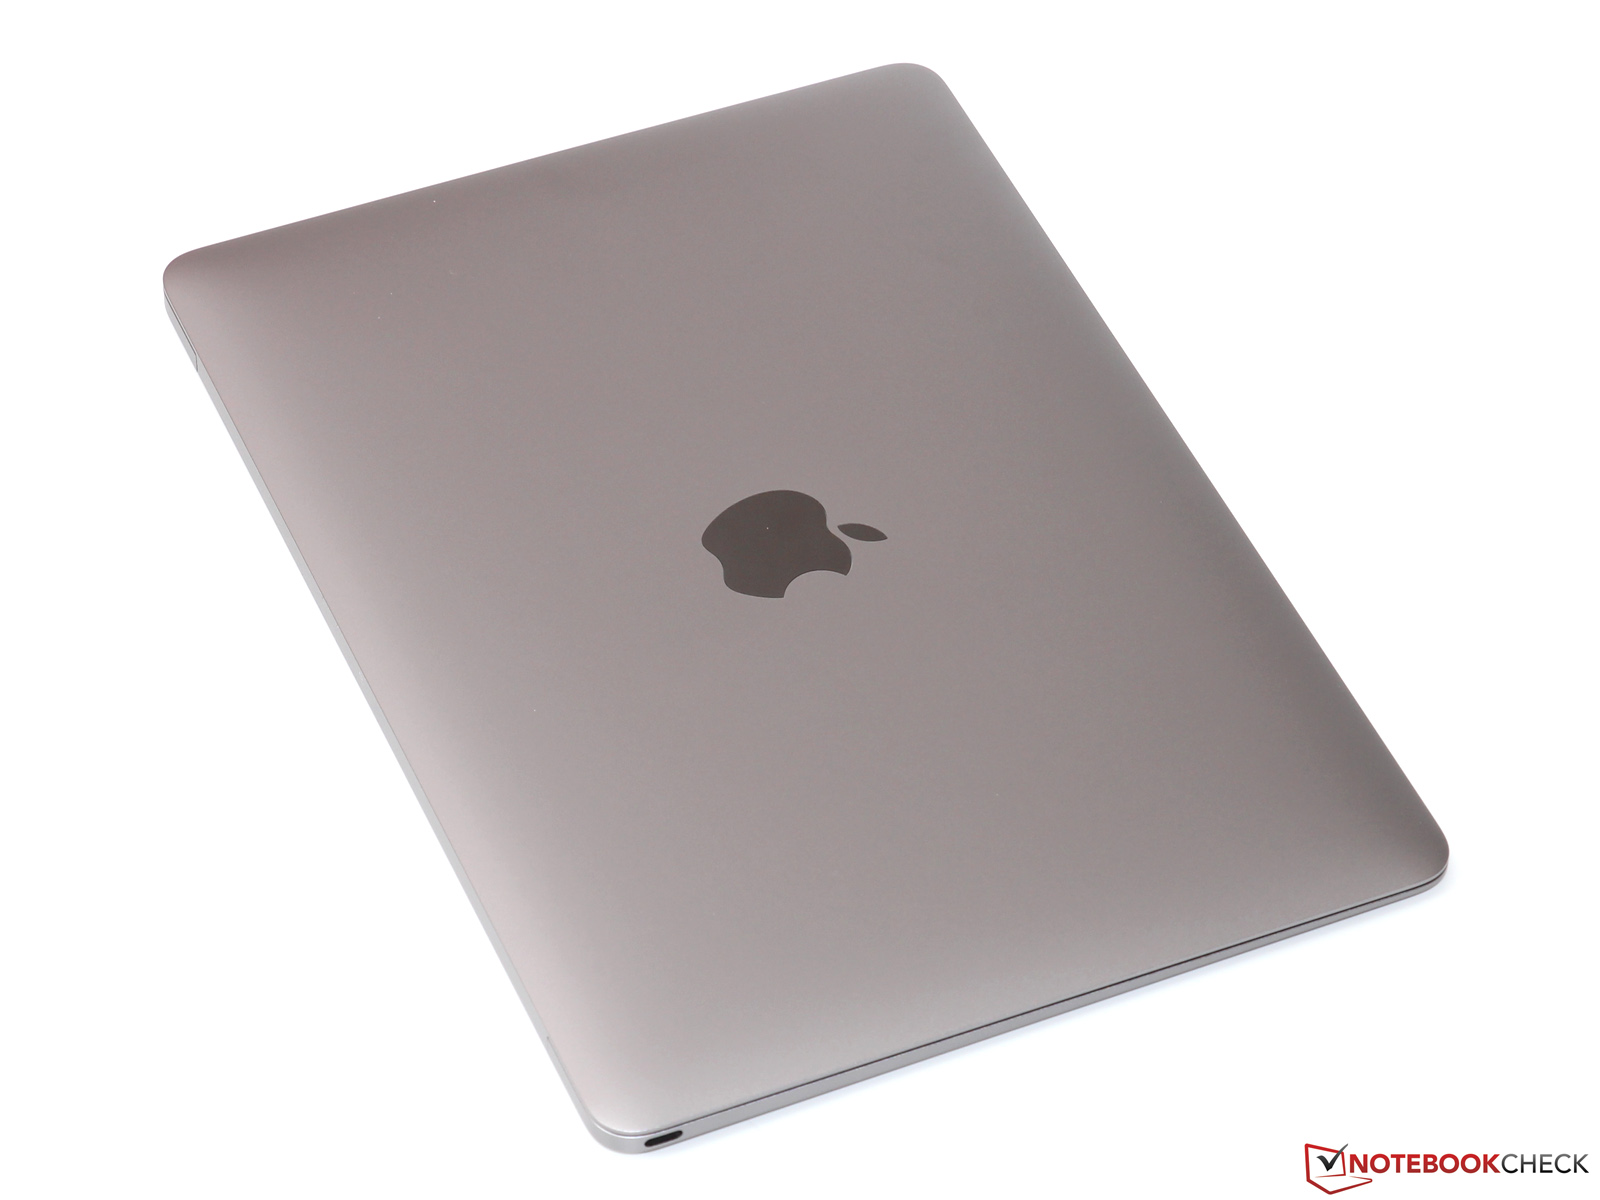
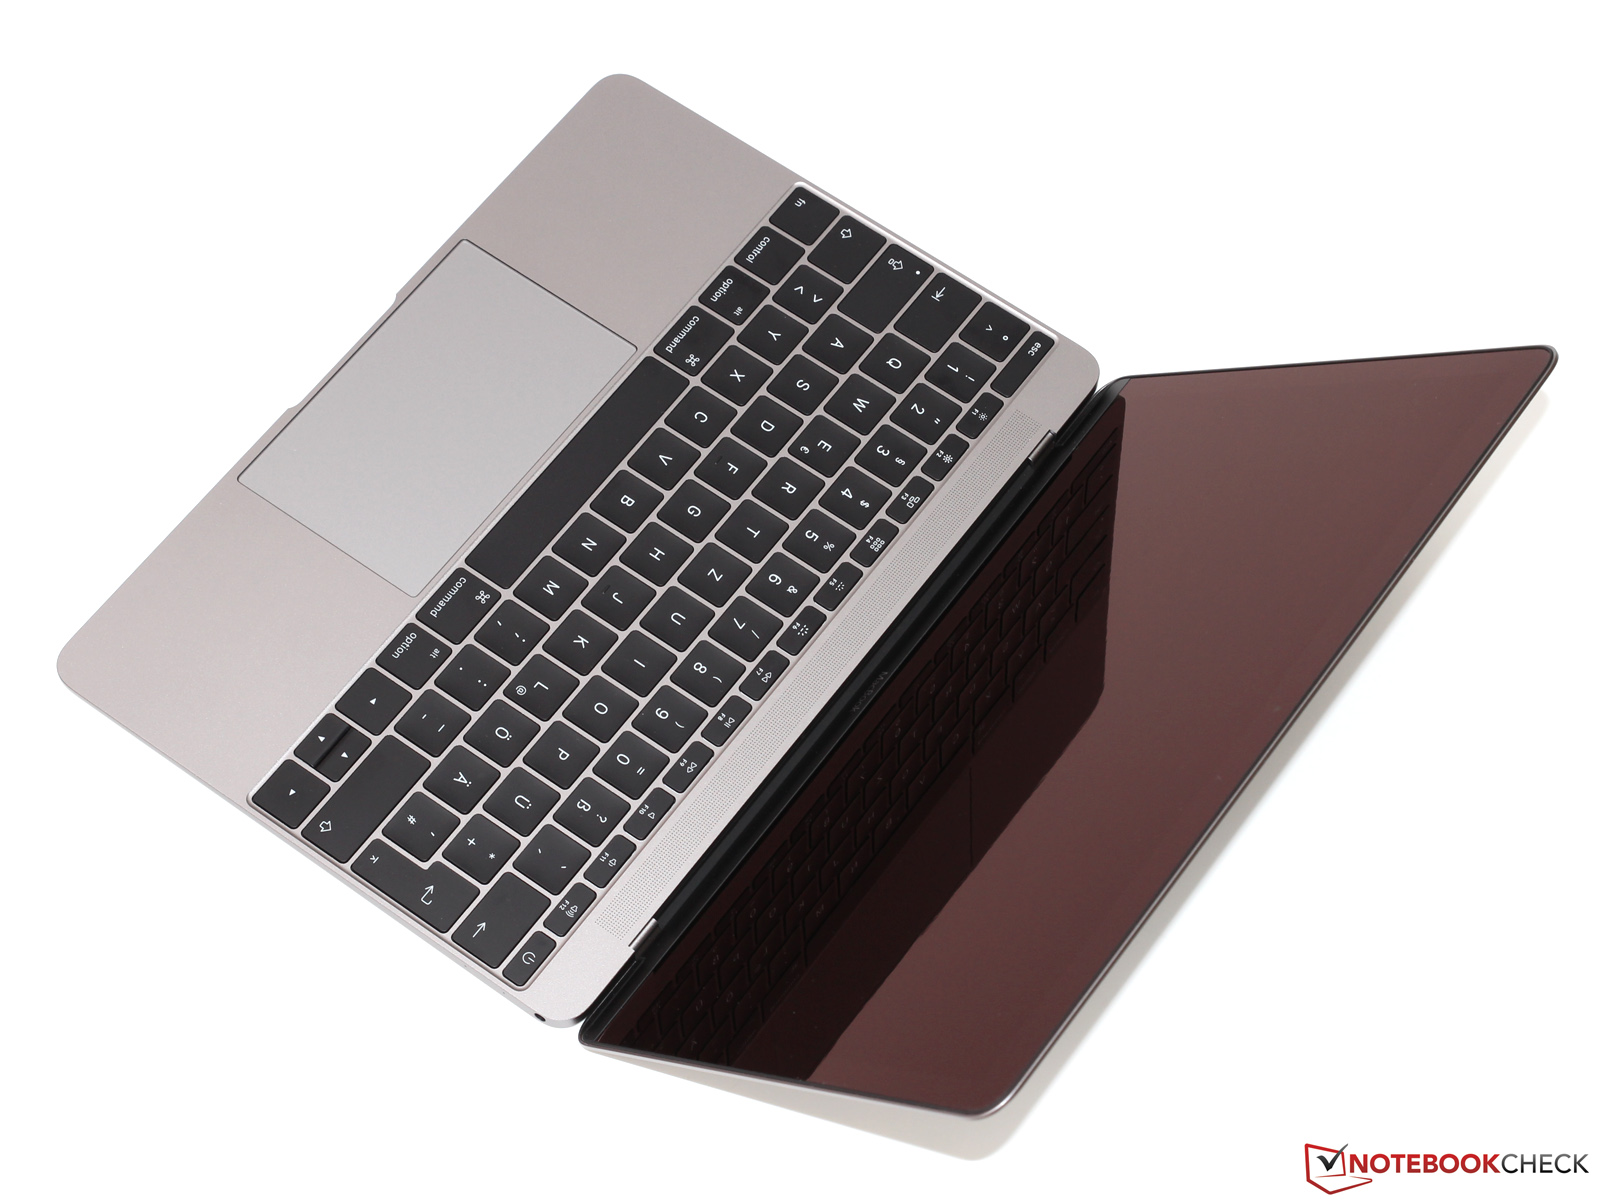
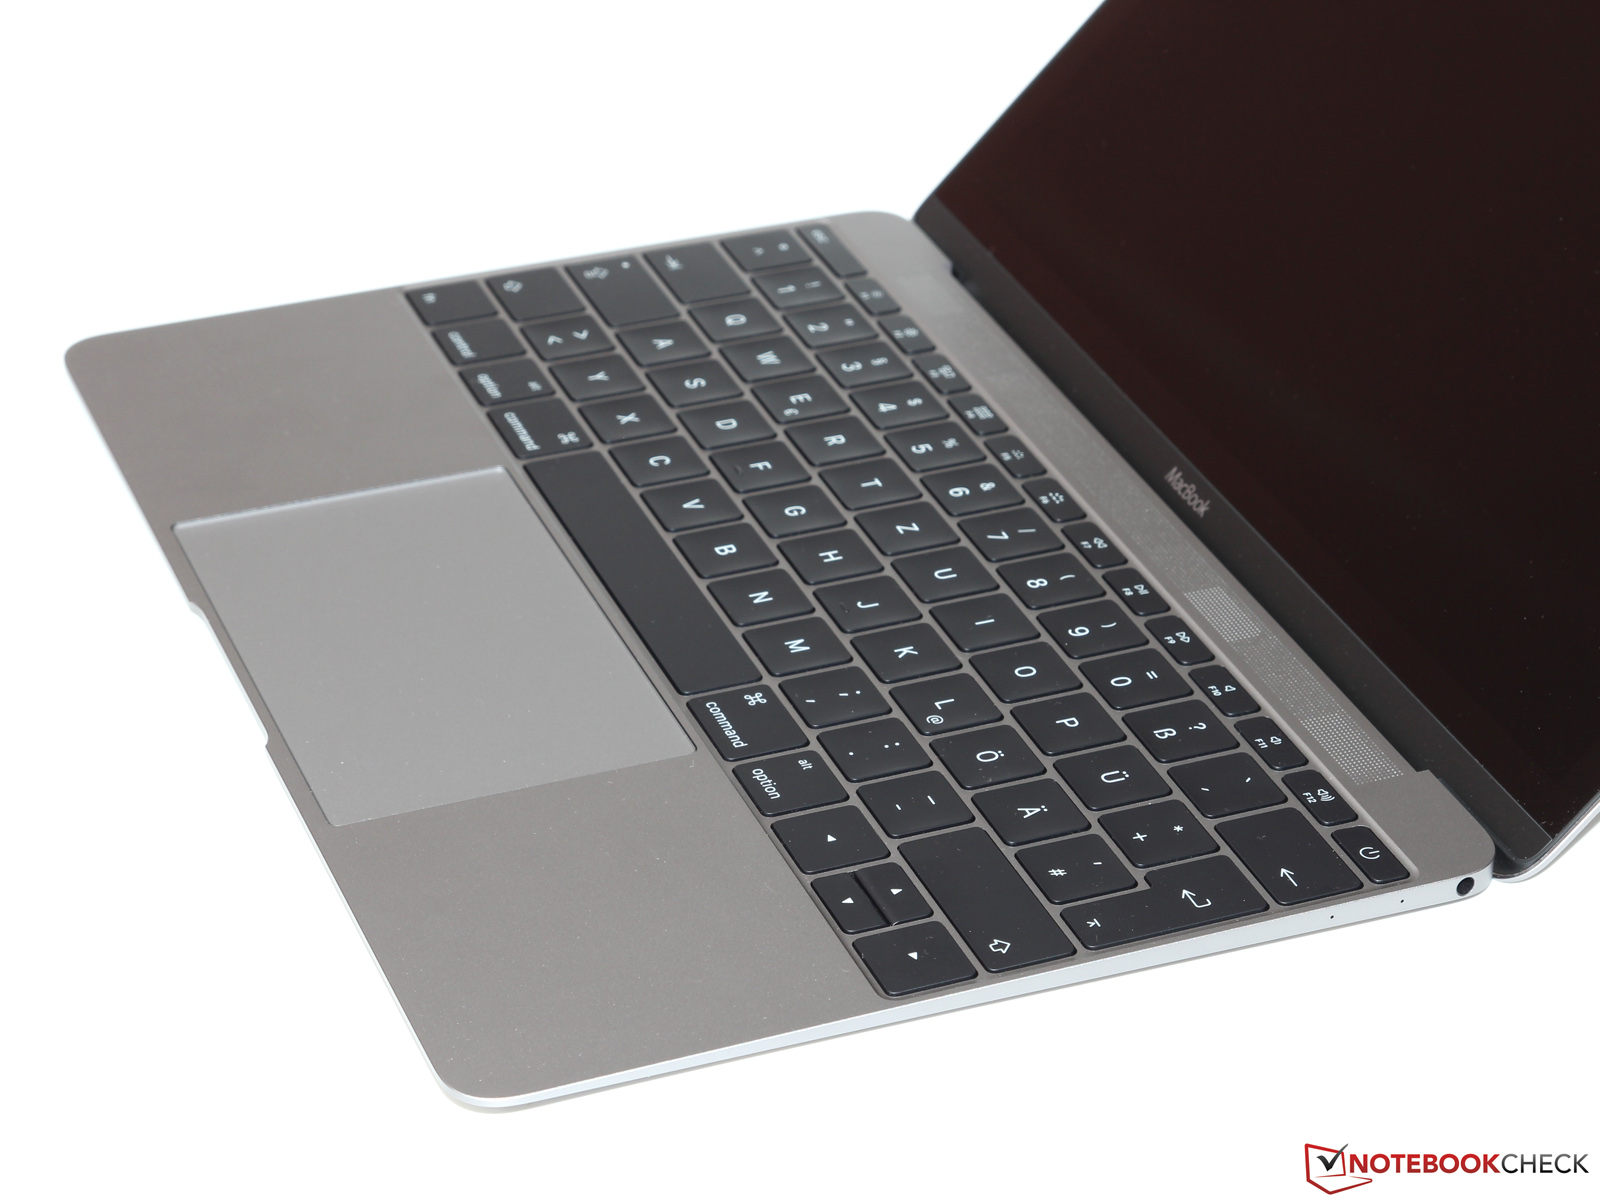
+ 精致的机身工艺和高稳定性
+ 超低重量,紧凑尺寸
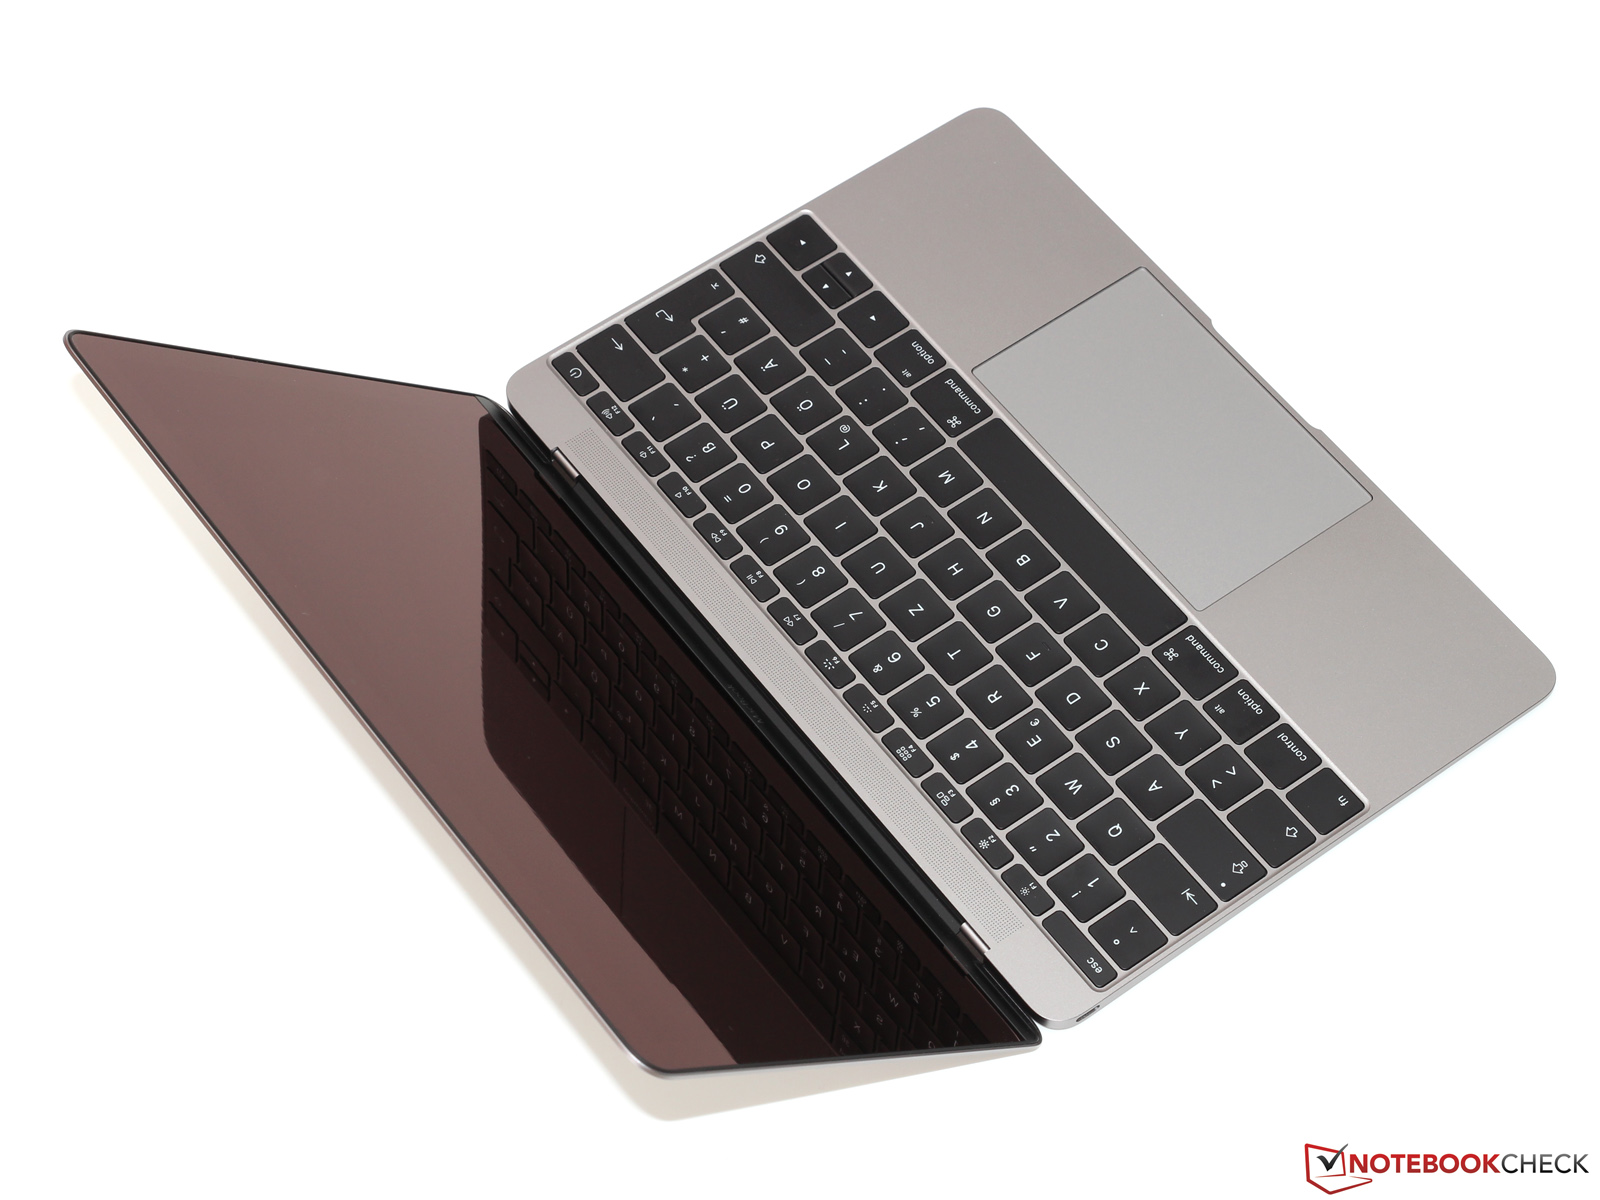
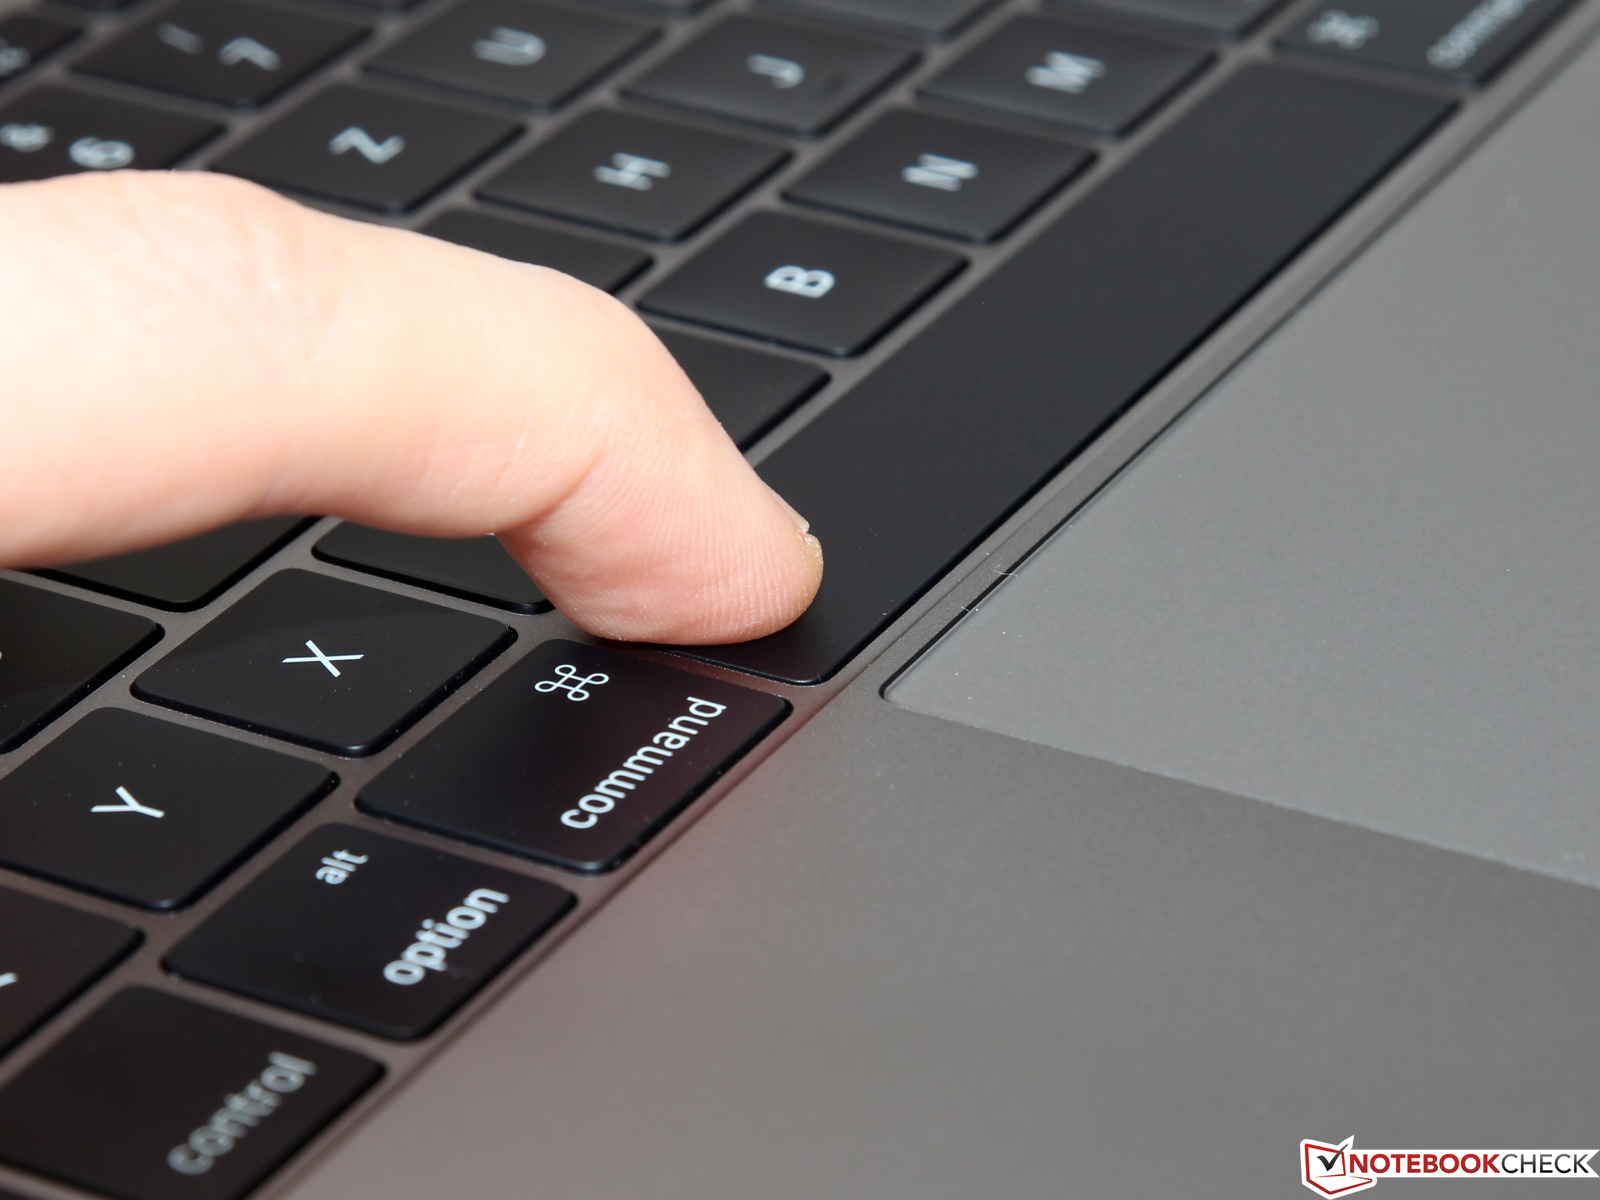
+ 出色的触控板
+ 非常明亮的Retina屏幕,可视角度宽广
+ 优秀的日常使用性能
+ 不错的电池续航时间
+ 无风扇设计
+ 强劲的扬声器
Cons
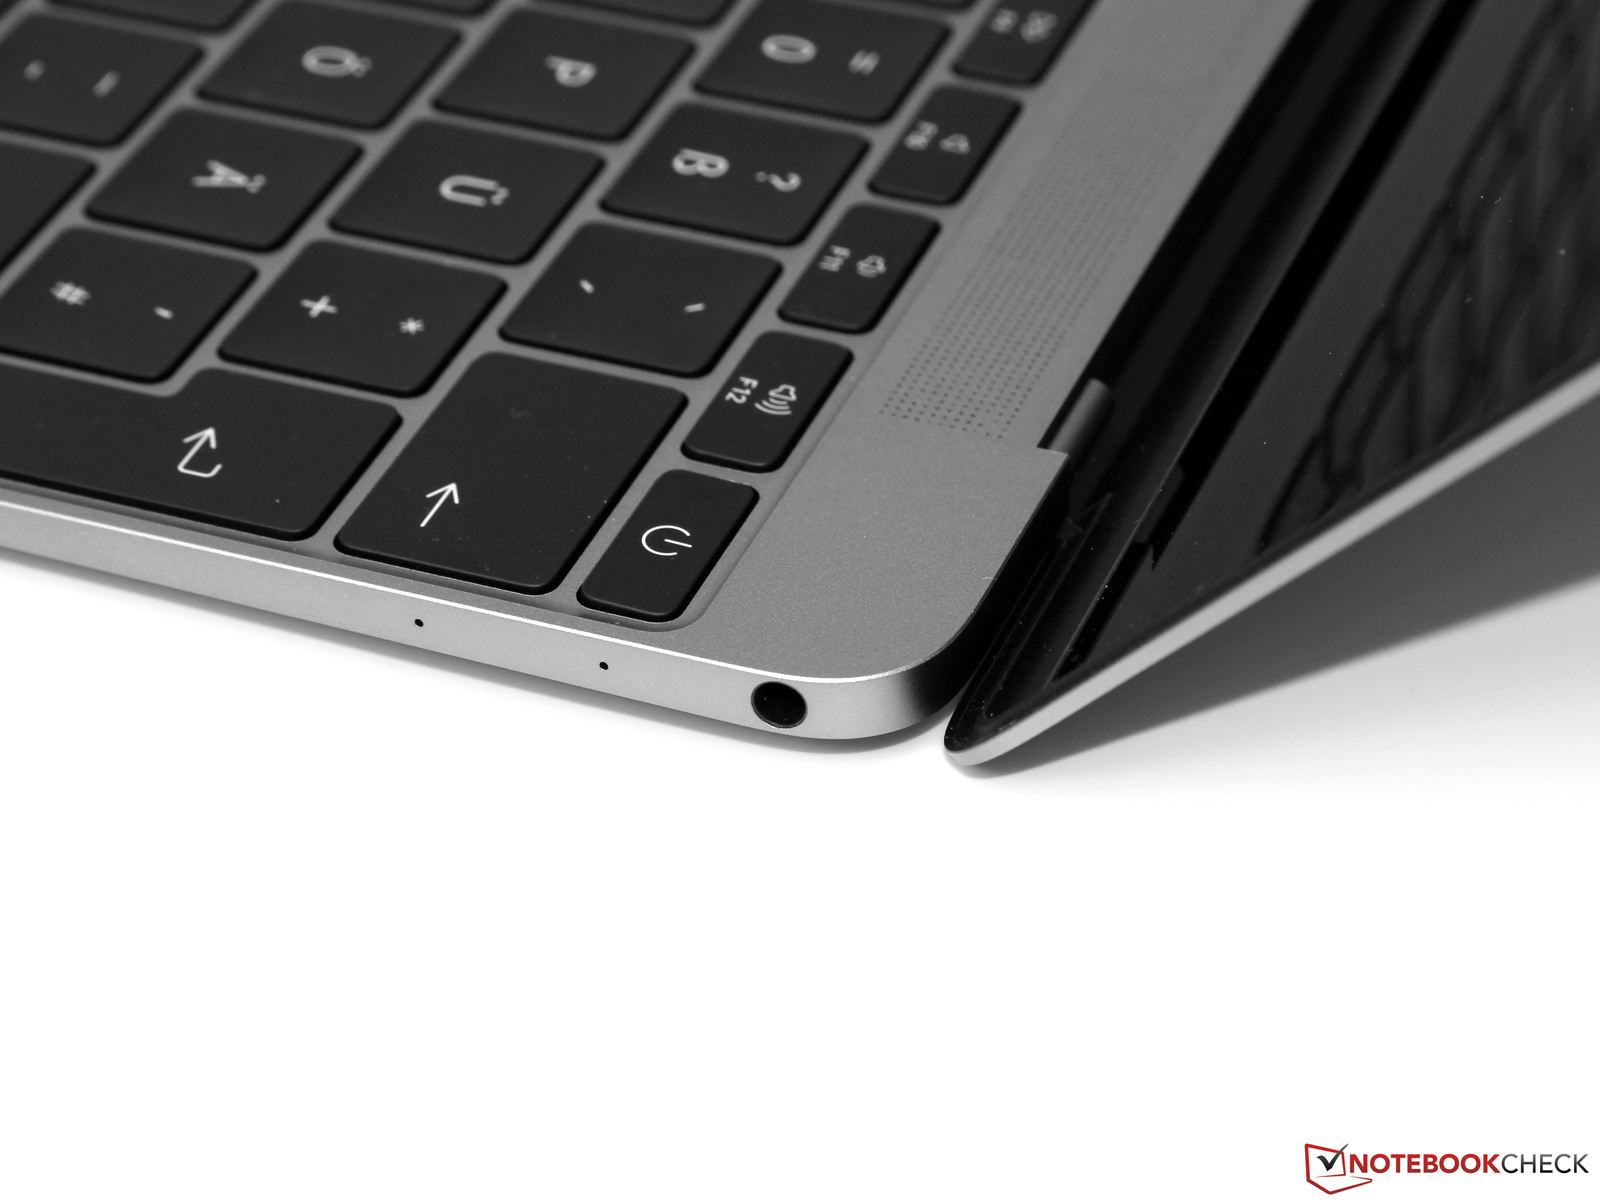
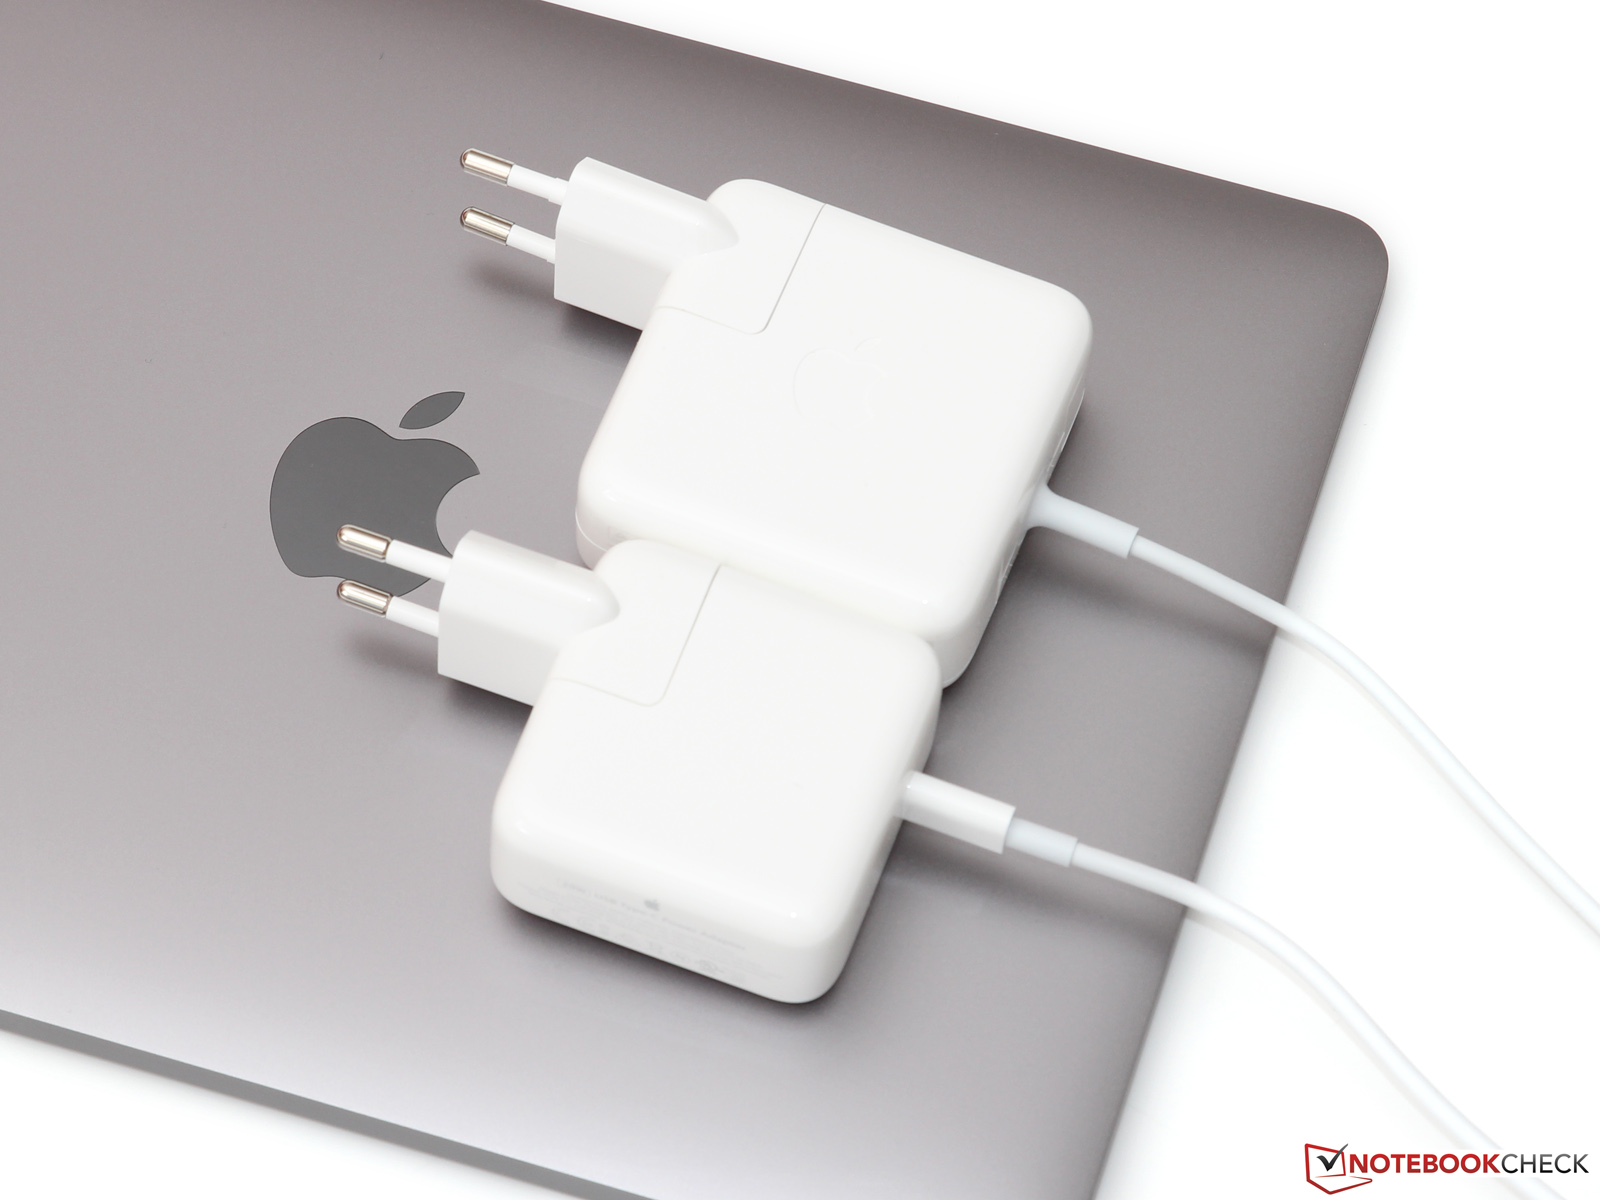
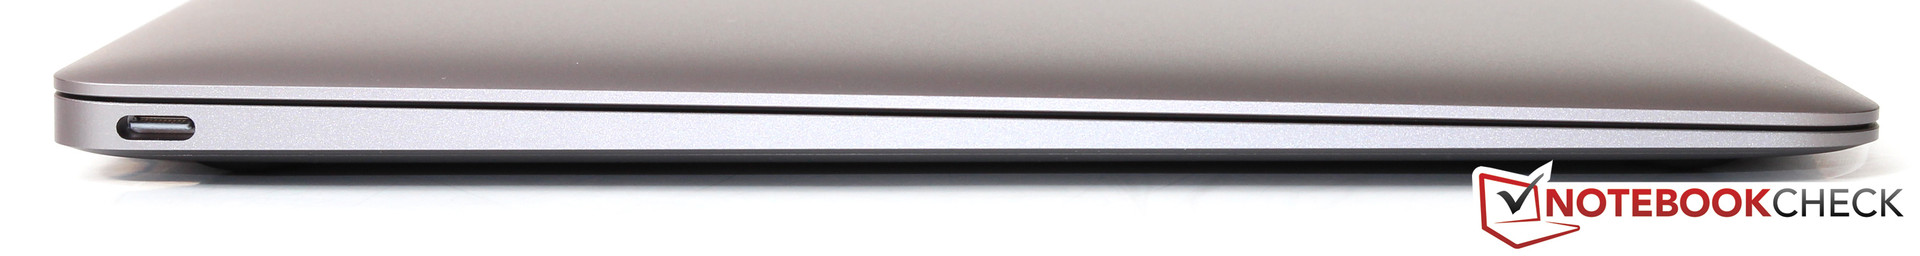
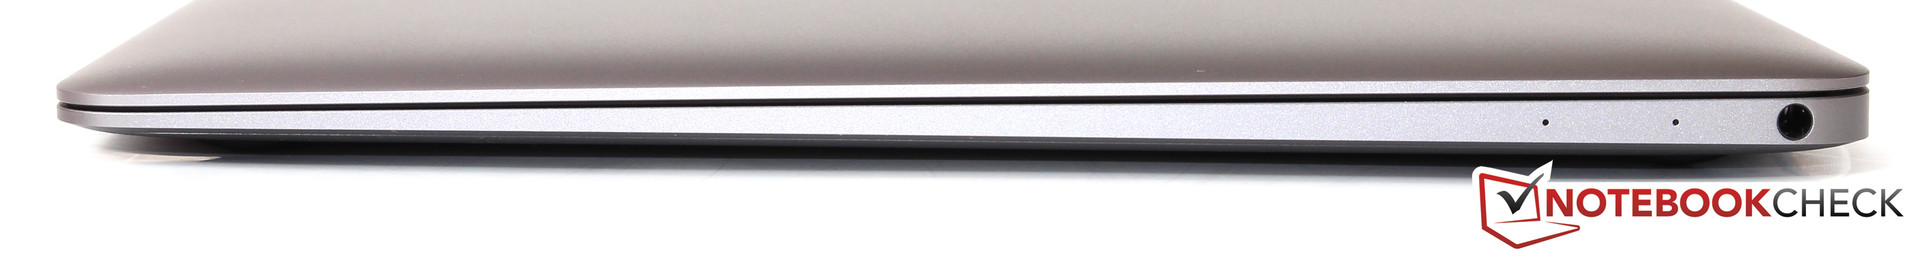
- 只有一个整合电源/USB接口
- 较差的摄像头质量
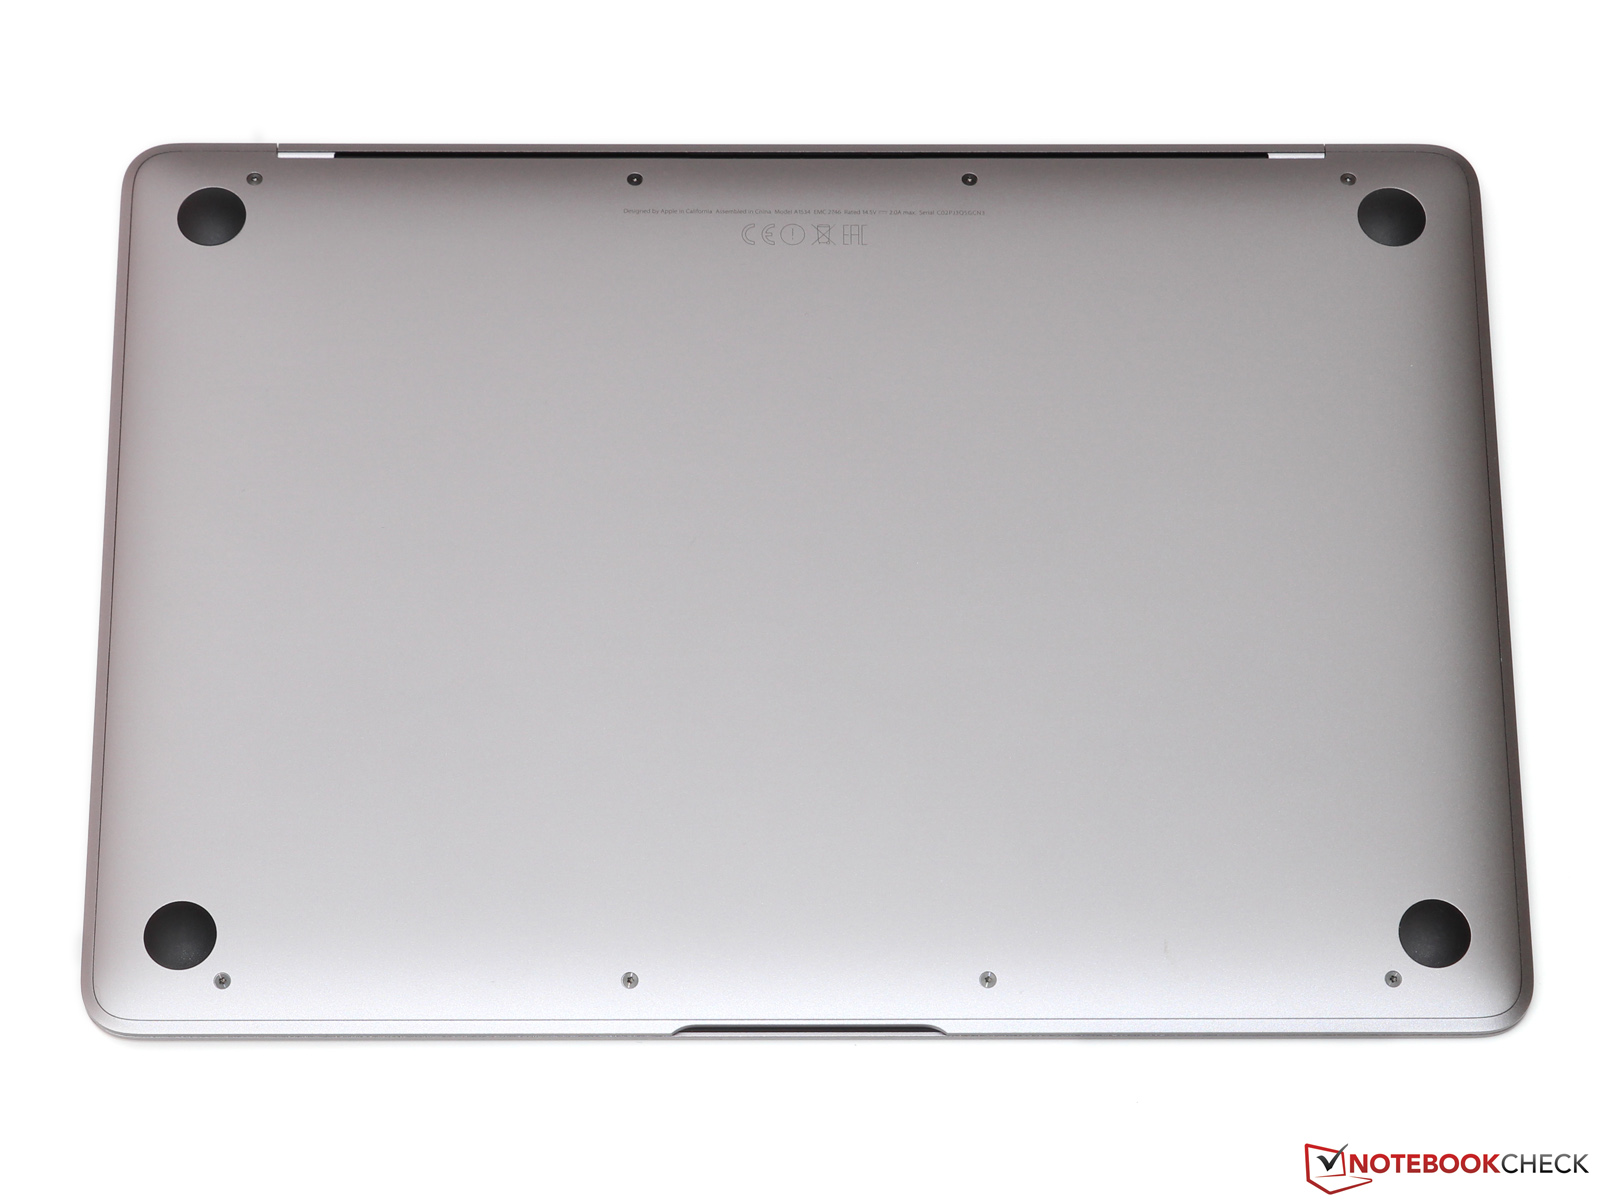
- 无可维护升级空间
- 高售价,配件昂贵
- 仅12个月质保
我们可以一上来就抱怨接口的贫弱,缺少维护升级空间和低3D性能——当然这些问题确实值得考虑。而是需要考虑到这款MacBook的定位,和相应地这些问题是否真的有那么严重。
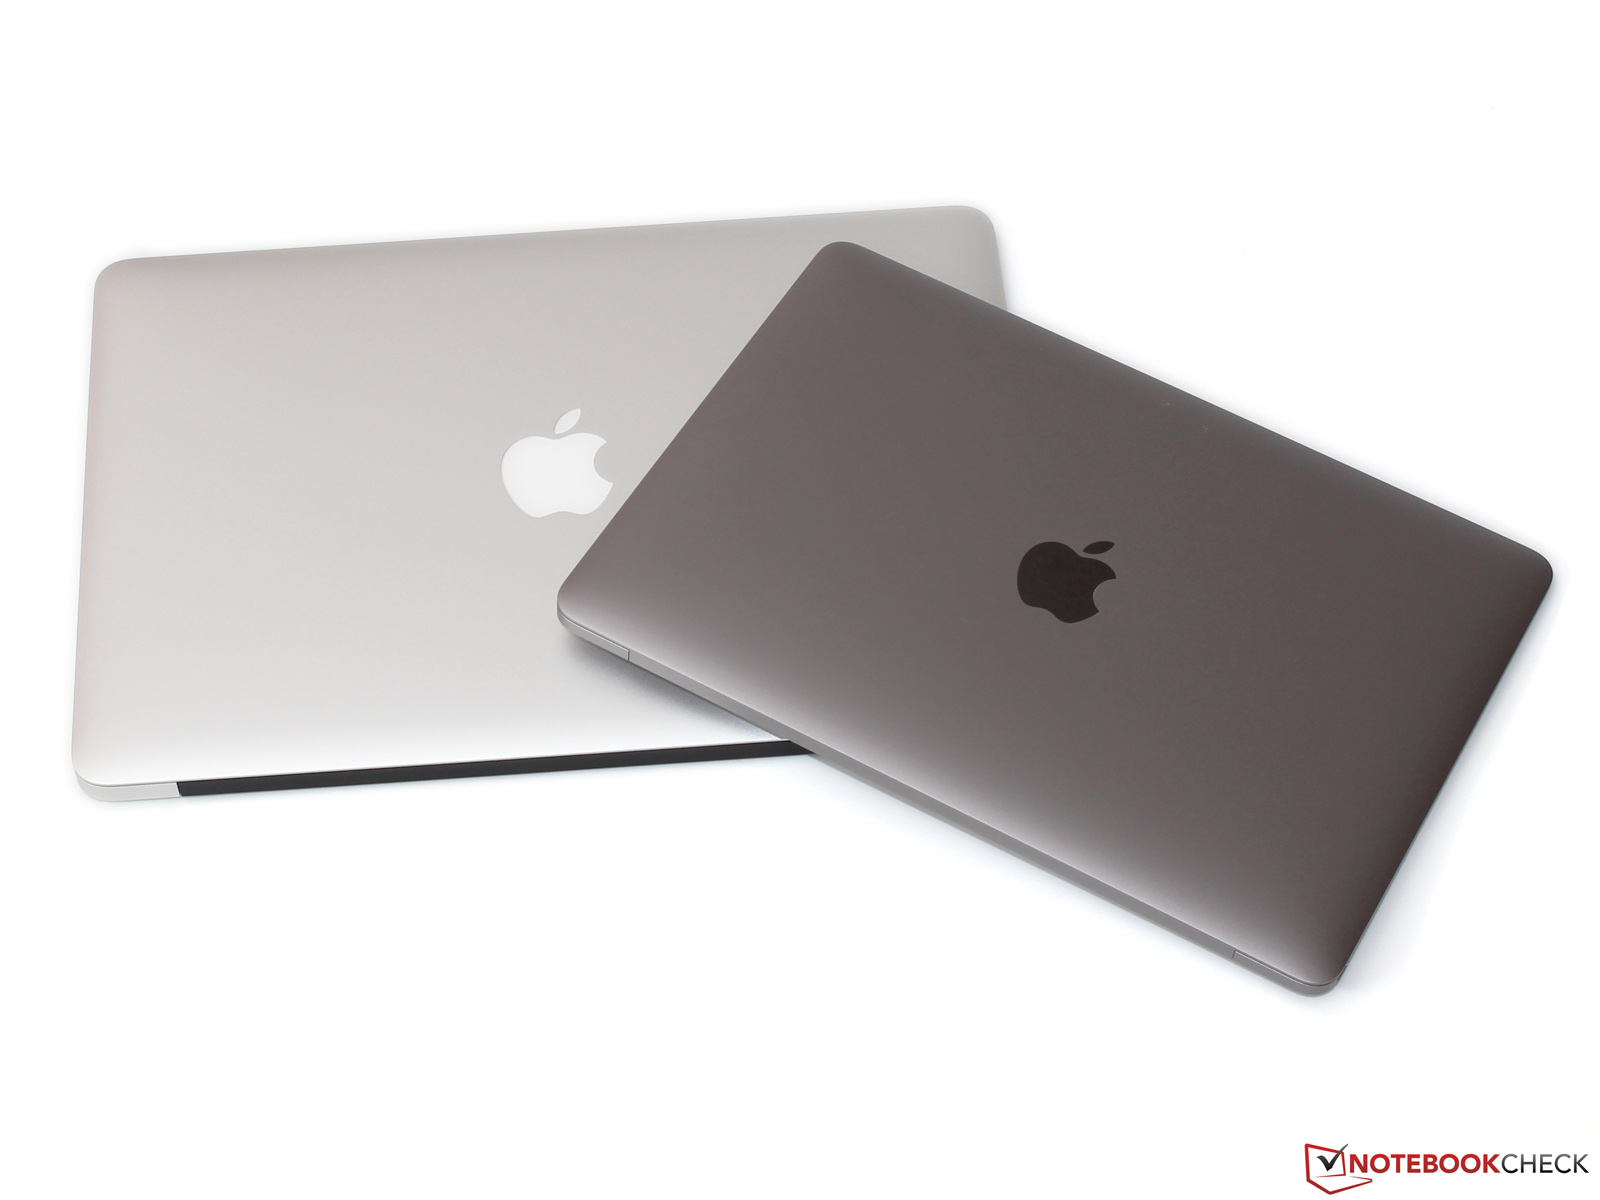
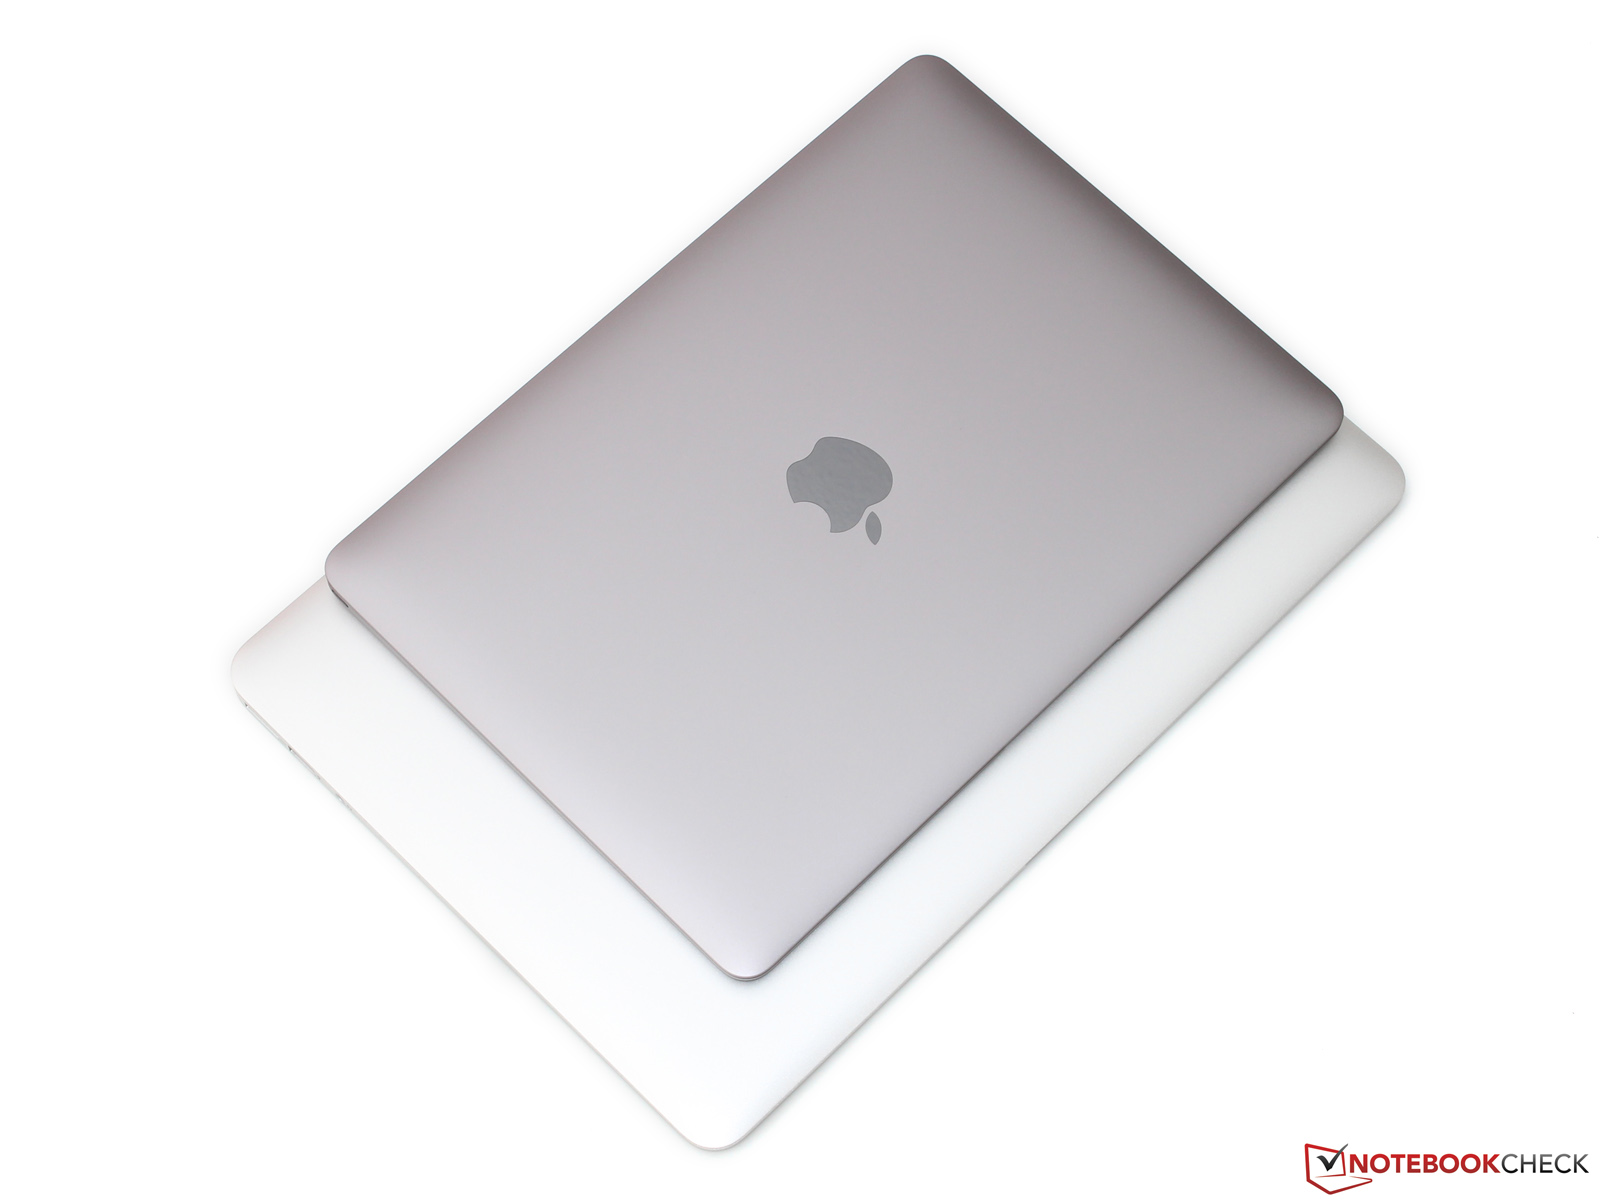
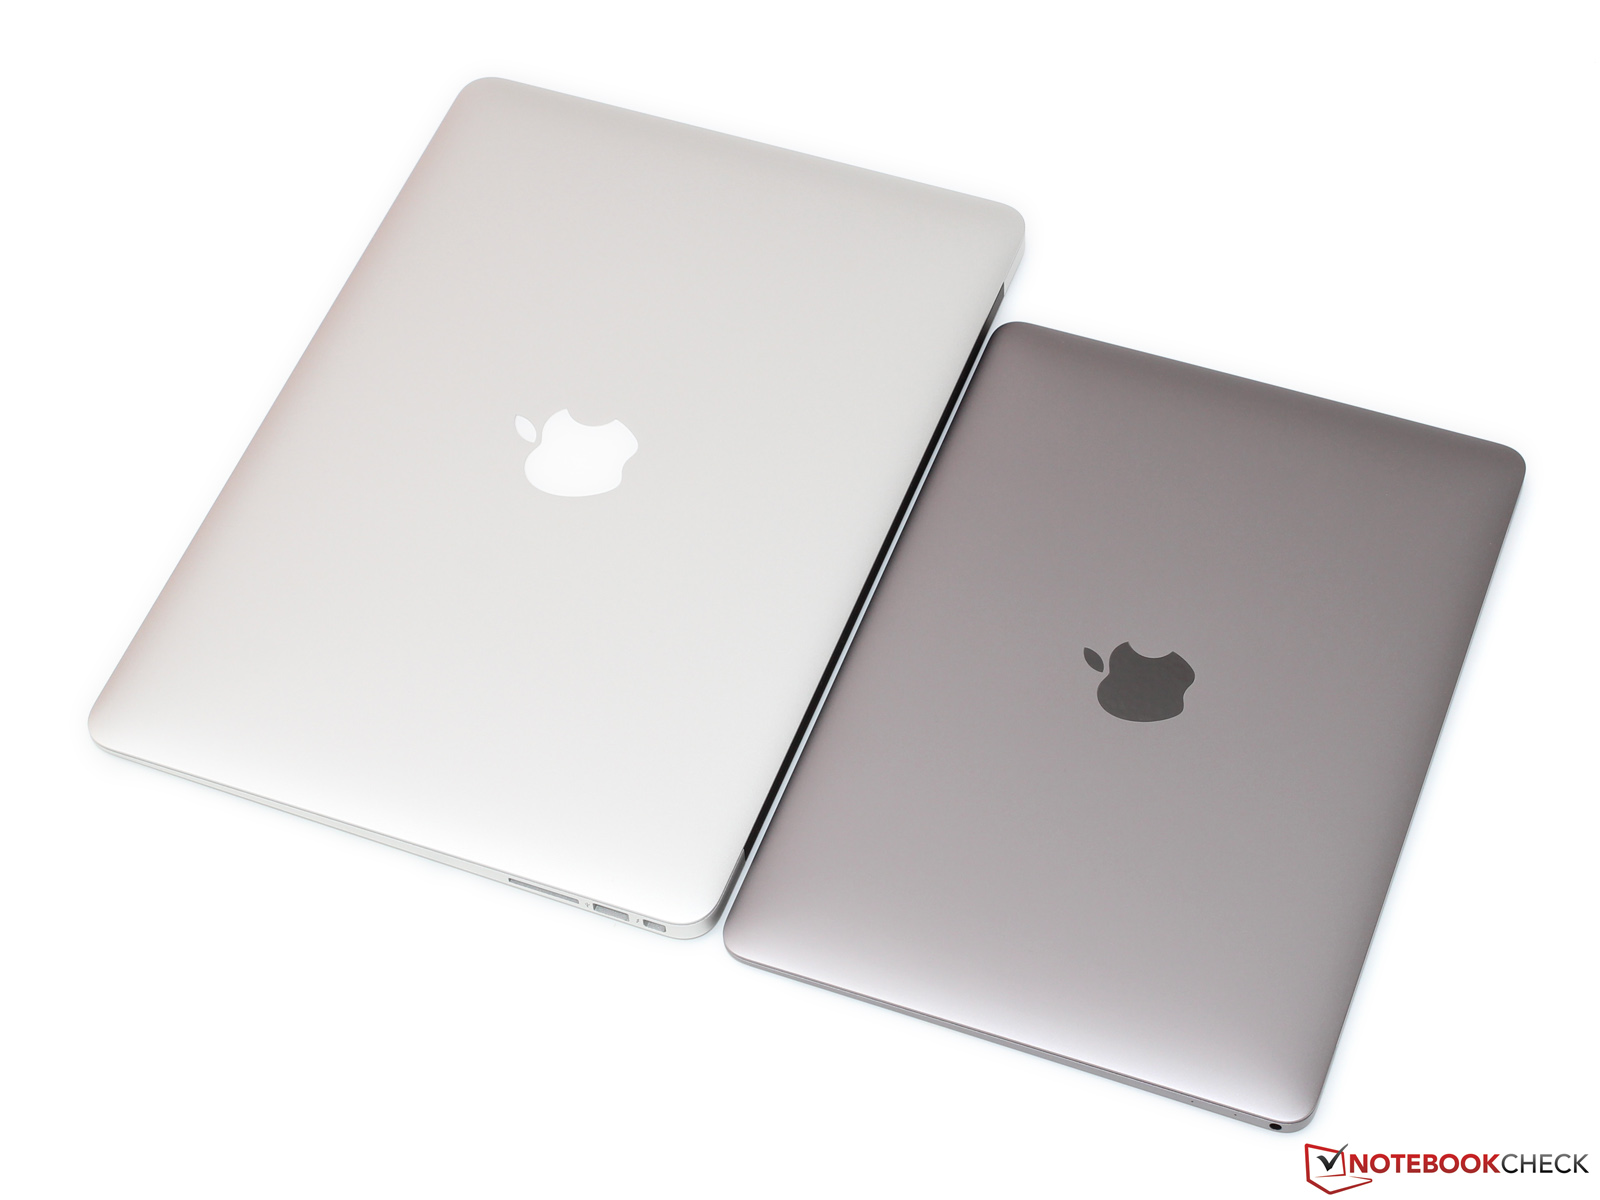
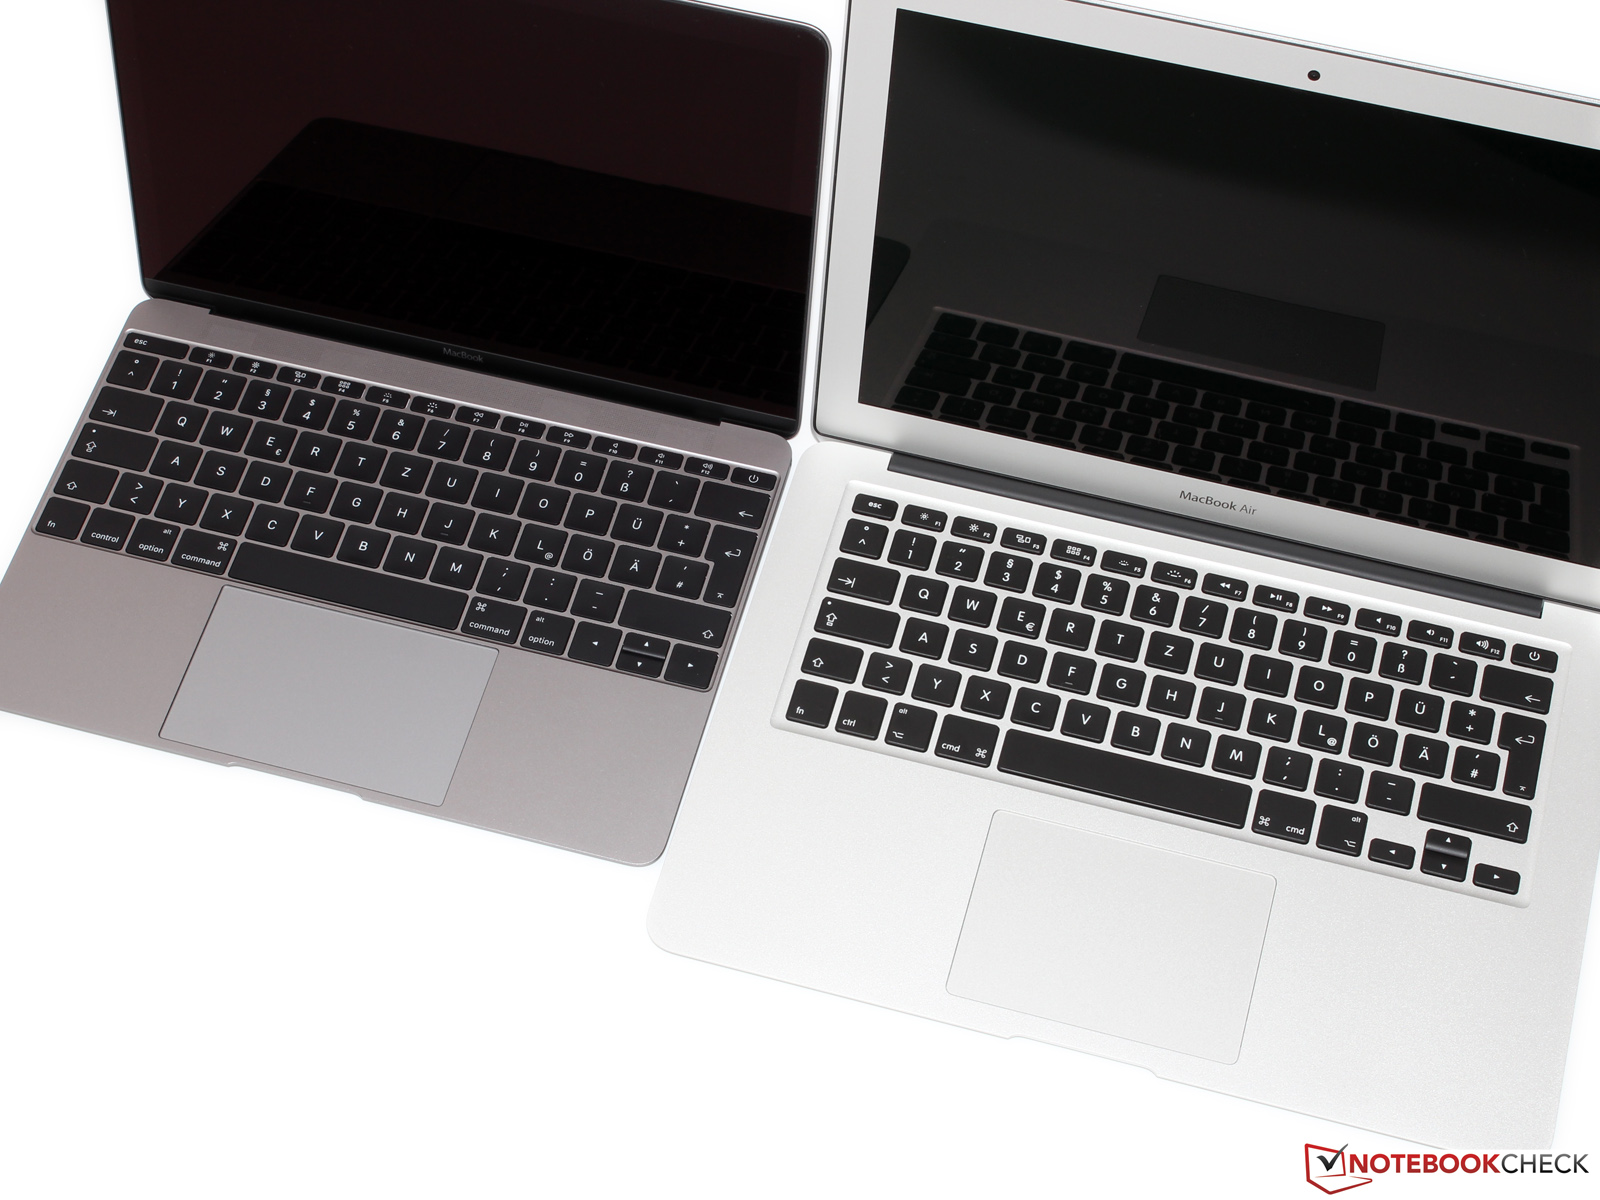
Apple对这次的产品线扩展有明确的目标,它在尺寸上甚至小于MacBook Air系列:
这款亚笔记本并不是为替代你家里的PC或者iMac而存在的,而是为帮助你在随时随地都可以使用熟悉的OS X环境而设计的——不管是在街角的咖啡厅或者是你下次的商务旅行中。
除了图片/视频播放和网络浏览(一款实惠的平板电脑就足够了),你也可以运行所有其他的应用程序。除了3D程序之外,这台被动散热的MacBook都足够强劲,应对段时间的高强度运算也毫无问题。
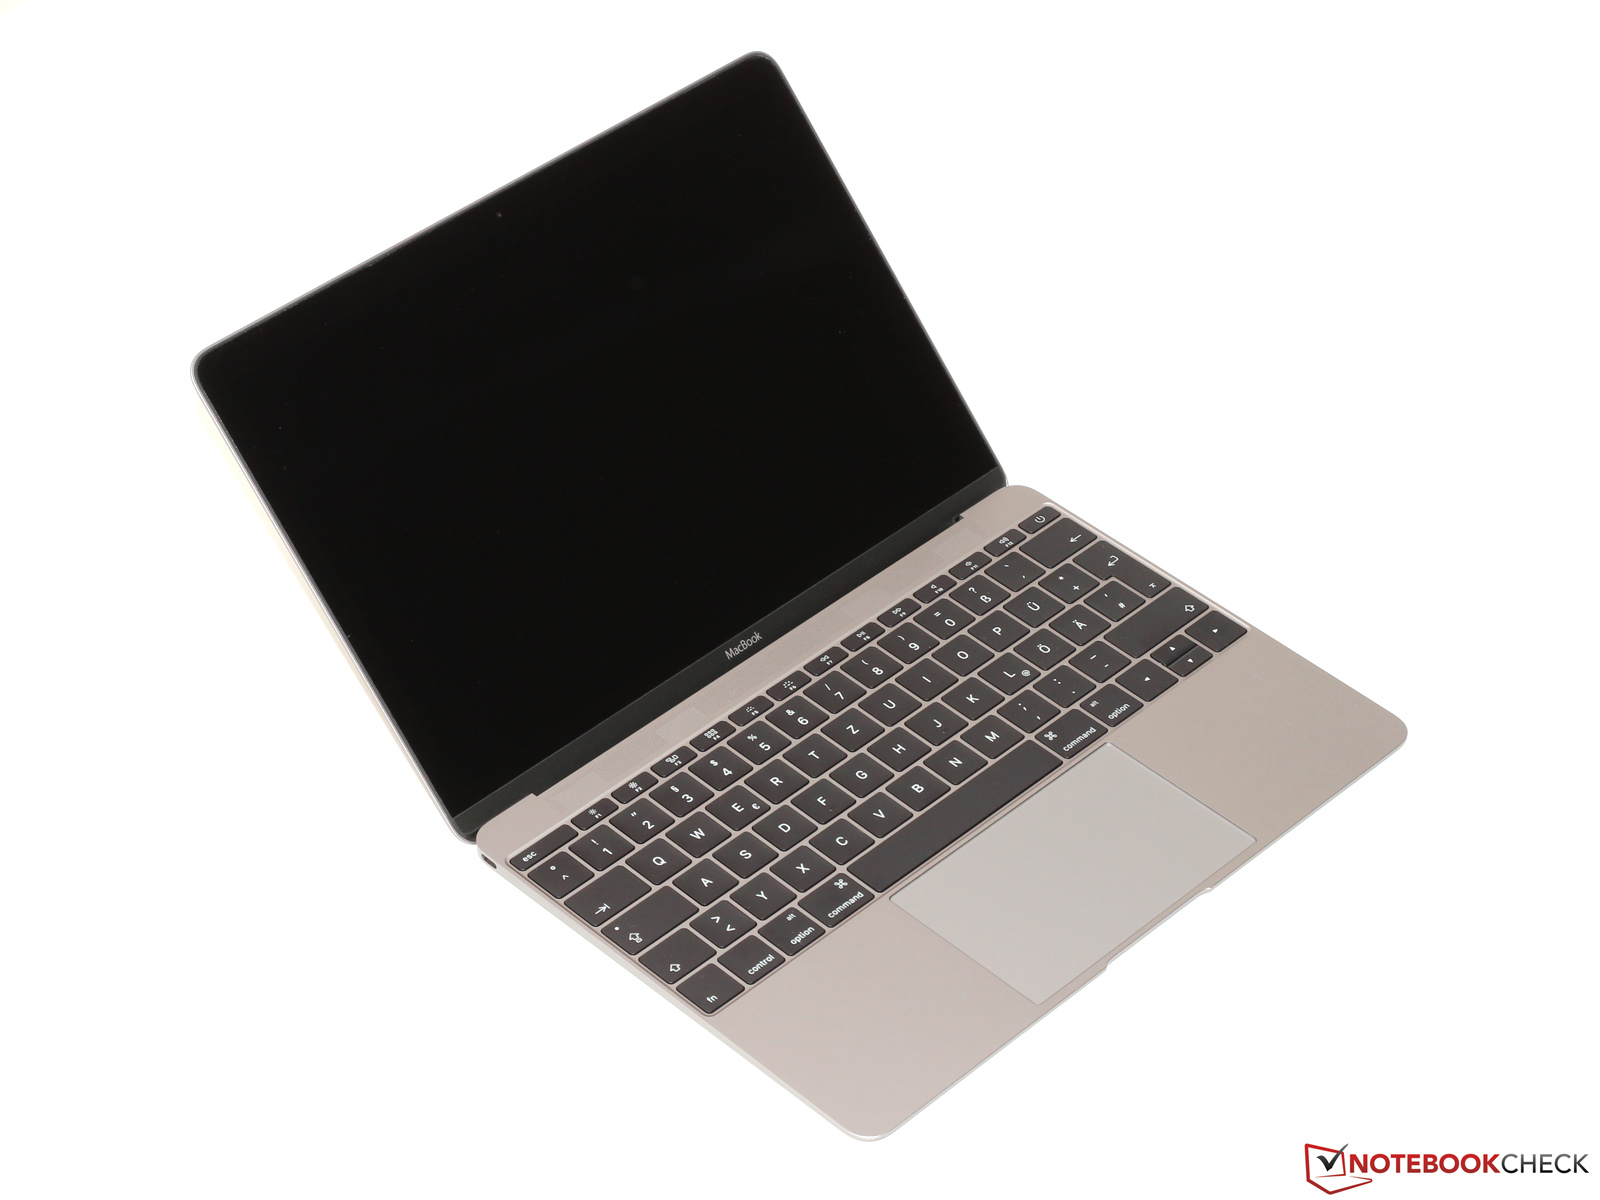
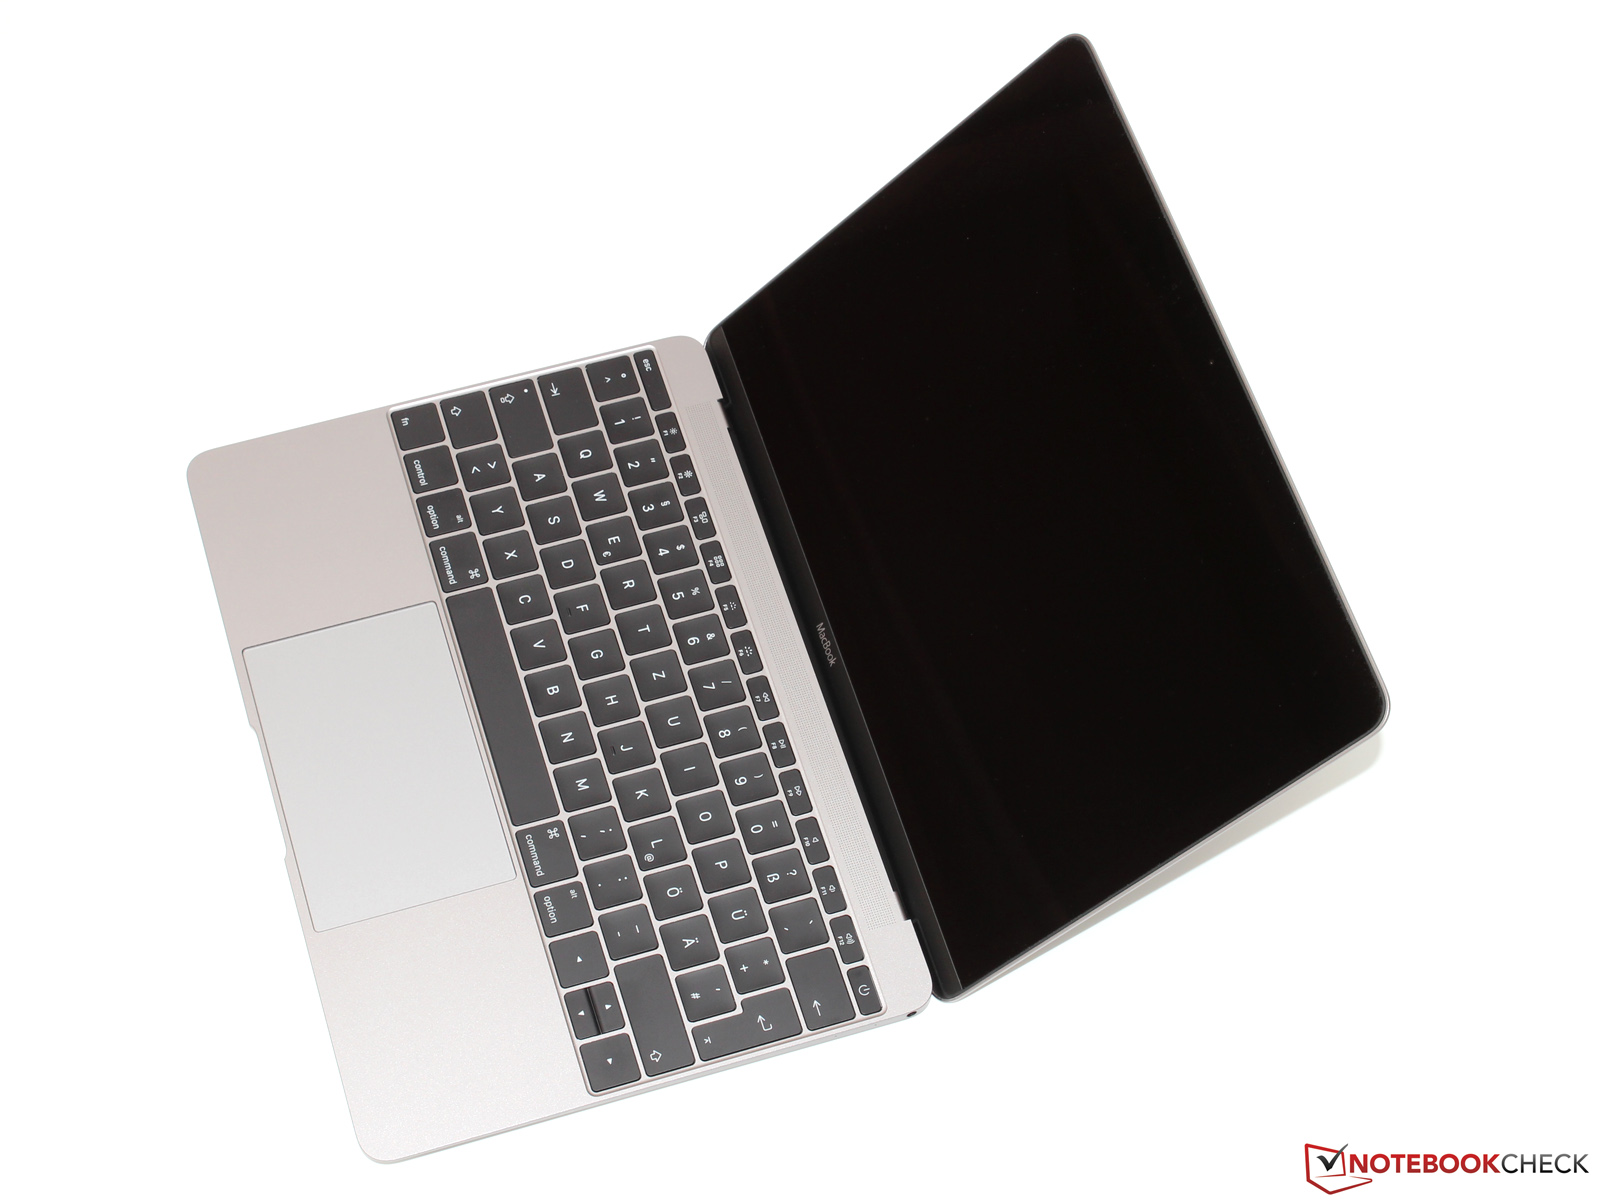
Apple再次为我们带来了一款在质量上几乎无瑕的产品。除了严谨的工艺质量我们也为它仅重920克的高强度机身感到惊叹。它的屏幕和触控板也属于一流,只有键盘的极短键程可能需要些时间适应。如果可能的话,最好是在投资1449欧元之前到Apple商店去实际感受一下它。售价可能是这台MacBook的最大问题:配置稍弱的华硕Zenbook UX305起售价仅900欧元;如果你能接受多出来的300克重量和Windows操作系统的话,它显然性价比更高。不过当然Apple的产品从来都不是以实惠闻名的。
注:本文是基于完整评测的缩减版本,阅读完整的英文评测,请点击这里。
Apple MacBook 12 (Early 2015) 1.1 GHz
- 04/27/2016 v5.1 (old)
Till Schönborn
Subnotebook - Weighted Average
Price comparison
