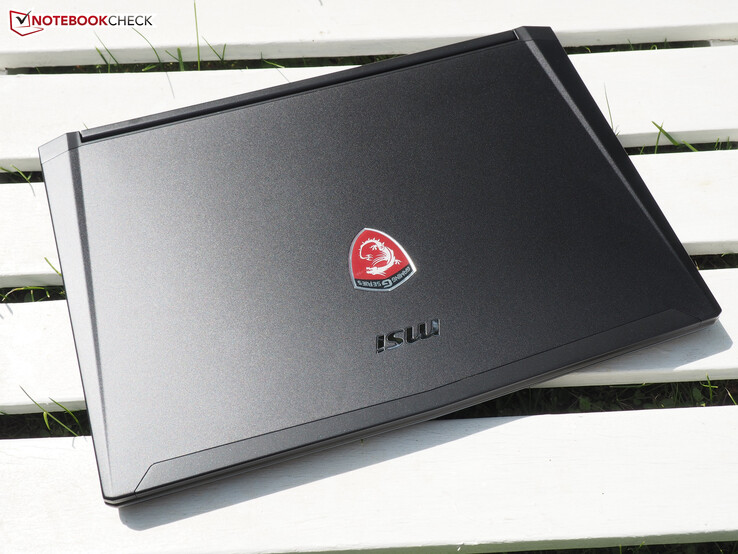
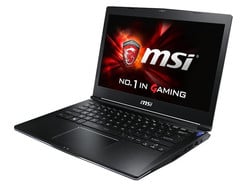
微星 GS30 笔记本电脑简短评测
» Notebookcheck多媒体笔记本电脑Top 10排名
» Notebookcheck游戏笔记本电脑Top 10排名
» Notebookcheck低价办公/商务笔记本电脑Top 10排名
» Notebookcheck高端办公/商务笔记本电脑Top 10排名
» Notebookcheck工作站笔记本电脑Top 10排名
» Notebookcheck亚笔记本电脑Top 10排名
» Notebookcheck超级本产品Top 10排名
» Notebookcheck变形本产品Top 10排名
» Notebookcheck平板电脑Top 10排名
» Notebookcheck智能手机Top 10排名
» Notebookcheck评测过最出色的笔记本电脑屏幕
» Notebookcheck售价500欧元以下笔记本电脑Top 10排名
» Notebookcheck售价300欧元以下笔记本电脑Top 10排名
| |||||||||||||||||||||||||
Brightness Distribution: 88 %
Center on Battery: 273 cd/m²
Contrast: 718:1 (Black: 0.38 cd/m²)
ΔE Color 4.86 | 0.5-29.43 Ø4.87
ΔE Greyscale 4.56 | 0.5-98 Ø5.1
56% AdobeRGB 1998 (Argyll 1.6.3 3D)
62.5% AdobeRGB 1998 (Argyll 2.2.0 3D)
85.5% sRGB (Argyll 2.2.0 3D)
65.9% Display P3 (Argyll 2.2.0 3D)
Gamma: 2.23
| MSI GS30 Shadow BOEhydis HN133WU3-102 (BOE05E3) | SCHENKER S413 AUO B140HAN01 | Alienware 13 9T7WM_133HL (SDC4C48) | SCHENKER XMG A305 CMN N133HSE-EA1 (CMN1343) | SCHENKER XMG C405 AU Optronics B140HAN01.1 (AUO113ED) | Razer Blade 14 2015 | |
|---|---|---|---|---|---|---|
| Display | 2% | -1% | 4% | 12% | ||
| Display P3 Coverage | 65.9 | 64.7 -2% | 61.8 -6% | 66.8 1% | 70.3 7% | |
| sRGB Coverage | 85.5 | 88.5 4% | 88.3 3% | 89.6 5% | 97.1 14% | |
| AdobeRGB 1998 Coverage | 62.5 | 64.6 3% | 63.4 1% | 65.6 5% | 71.1 14% | |
| Response Times | ||||||
| Response Time Grey 50% / Grey 80% * | 38 ? | |||||
| Response Time Black / White * | 28 ? | |||||
| PWM Frequency | ||||||
| Screen | -1% | -1% | 1% | 2% | 6% | |
| Brightness middle | 273 | 262 -4% | 319 17% | 315 15% | 280 3% | 318.4 17% |
| Brightness | 258 | 268 4% | 295 14% | 310 20% | 267 3% | 311 21% |
| Brightness Distribution | 88 | 88 0% | 83 -6% | 86 -2% | 85 -3% | 78 -11% |
| Black Level * | 0.38 | 0.59 -55% | 0.32 16% | 0.35 8% | 0.32 16% | 0.416 -9% |
| Contrast | 718 | 444 -38% | 997 39% | 900 25% | 875 22% | 765 7% |
| Colorchecker dE 2000 * | 4.86 | 3.4 30% | 5.83 -20% | 5.63 -16% | 4.75 2% | 3.67 24% |
| Greyscale dE 2000 * | 4.56 | 2.5 45% | 7.63 -67% | 6.71 -47% | 5.91 -30% | 5.41 -19% |
| Gamma | 2.23 99% | 2.62 84% | 2.57 86% | 2.53 87% | 2.52 87% | 2.26 97% |
| CCT | 7292 89% | 6723 97% | 7195 90% | 5920 110% | 5742 113% | 7118 91% |
| Color Space (Percent of AdobeRGB 1998) | 56 | 60 7% | 57 2% | 57 2% | 59 5% | 64.64 15% |
| Total Average (Program / Settings) | 1% /
-1% | -1% /
-1% | 1% /
1% | 3% /
3% | 9% /
7% |
* ... smaller is better
| Cinebench R11.5 | |
| CPU Single 64Bit (sort by value) | |
| MSI GS30 Shadow | |
| SCHENKER S413 | |
| Alienware 13 | |
| SCHENKER XMG A305 | |
| SCHENKER XMG C405 | |
| Razer Blade 14 2015 | |
| MSI GamingDock | |
| CPU Multi 64Bit (sort by value) | |
| MSI GS30 Shadow | |
| SCHENKER S413 | |
| Alienware 13 | |
| SCHENKER XMG A305 | |
| SCHENKER XMG C405 | |
| Razer Blade 14 2015 | |
| MSI GamingDock | |
| Cinebench R15 | |
| CPU Single 64Bit (sort by value) | |
| MSI GS30 Shadow | |
| SCHENKER S413 | |
| Alienware 13 | |
| SCHENKER XMG A305 | |
| SCHENKER XMG C405 | |
| Razer Blade 14 2015 | |
| MSI GamingDock | |
| CPU Multi 64Bit (sort by value) | |
| MSI GS30 Shadow | |
| SCHENKER S413 | |
| Alienware 13 | |
| SCHENKER XMG A305 | |
| SCHENKER XMG C405 | |
| Razer Blade 14 2015 | |
| MSI GamingDock | |
| PCMark 7 Score | 6510 points | |
| PCMark 8 Home Score Accelerated v2 | 4087 points | |
| PCMark 8 Creative Score Accelerated v2 | 5165 points | |
| PCMark 8 Work Score Accelerated v2 | 4916 points | |
Help | ||
| PCMark 7 - Score (sort by value) | |
| MSI GS30 Shadow | |
| SCHENKER S413 | |
| Alienware 13 | |
| SCHENKER XMG A305 | |
| Razer Blade 14 2015 | |
| PCMark 8 | |
| Work Score Accelerated v2 (sort by value) | |
| MSI GS30 Shadow | |
| Alienware 13 | |
| SCHENKER XMG C405 | |
| Razer Blade 14 2015 | |
| Creative Score Accelerated v2 (sort by value) | |
| MSI GS30 Shadow | |
| Alienware 13 | |
| SCHENKER XMG C405 | |
| Razer Blade 14 2015 | |
| Home Score Accelerated v2 (sort by value) | |
| MSI GS30 Shadow | |
| Alienware 13 | |
| SCHENKER XMG C405 | |
| Razer Blade 14 2015 | |
| 3DMark 11 Performance | 2156 points | |
| 3DMark Ice Storm Standard Score | 84120 points | |
| 3DMark Cloud Gate Standard Score | 9626 points | |
| 3DMark Fire Strike Score | 1281 points | |
Help | ||
| 3DMark 11 - 1280x720 Performance GPU (sort by value) | |
| MSI GS30 Shadow | |
| SCHENKER S413 | |
| Alienware 13 | |
| SCHENKER XMG A305 | |
| SCHENKER XMG C405 | |
| Razer Blade 14 2015 | |
| MSI GamingDock | |
| 3DMark | |
| 1920x1080 Fire Strike Graphics (sort by value) | |
| MSI GS30 Shadow | |
| SCHENKER S413 | |
| Alienware 13 | |
| SCHENKER XMG A305 | |
| SCHENKER XMG C405 | |
| Razer Blade 14 2015 | |
| MSI GamingDock | |
| 1280x720 Sky Diver Graphics (sort by value) | |
| MSI GS30 Shadow | |
| Alienware 13 | |
| SCHENKER XMG A305 | |
| SCHENKER XMG C405 | |
| MSI GamingDock | |
| 1280x720 Cloud Gate Standard Graphics (sort by value) | |
| MSI GS30 Shadow | |
| SCHENKER S413 | |
| Alienware 13 | |
| SCHENKER XMG A305 | |
| SCHENKER XMG C405 | |
| Razer Blade 14 2015 | |
| MSI GamingDock | |
| 1280x720 Ice Storm Standard Graphics (sort by value) | |
| MSI GS30 Shadow | |
| SCHENKER S413 | |
| Alienware 13 | |
| SCHENKER XMG A305 | |
| SCHENKER XMG C405 | |
| Razer Blade 14 2015 | |
| MSI GamingDock | |
| Unigine Heaven 4.0 - Extreme Preset DX11 (sort by value) | |
| MSI GS30 Shadow | |
| MSI GamingDock | |
| low | med. | high | ultra | |
|---|---|---|---|---|
| Crysis 3 (2013) | 45.9 | 27.9 | 18.4 | 6.9 |
| Watch Dogs (2014) | 33.8 | 21.4 | 5.7 | 0 () |
| Sims 4 (2014) | 194.9 | 68.4 | 32.7 | 22.1 |
| Fifa 15 (2014) | 87.9 | 59.9 | 37 | |
| Far Cry 4 (2014) | 26.5 | 19.8 | 9.4 | 7 |
| Dragon Age: Inquisition (2014) | 39.3 | 26.3 | 9.7 | 5.5 |
| Battlefield Hardline (2015) | 47.8 | 34.1 | 15 | 8.6 |
| GTA V (2015) | 48.7 | 38.4 | 7.8 | 2.9 |
| GTA V | |
| 3840x2160 High/On (Advanced Graphics Off) AA:FX AF:8x (sort by value) | |
| MSI GamingDock | |
| 1920x1080 Highest Settings possible AA:4xMSAA + FX AF:16x (sort by value) | |
| MSI GS30 Shadow | |
| MSI GamingDock | |
| 1920x1080 High/On (Advanced Graphics Off) AA:2xMSAA + FX AF:8x (sort by value) | |
| MSI GS30 Shadow | |
| MSI GamingDock | |
| 1366x768 Normal/Off AF:4x (sort by value) | |
| MSI GS30 Shadow | |
| MSI GamingDock | |
| 1024x768 Lowest Settings possible (sort by value) | |
| MSI GS30 Shadow | |
| MSI GamingDock | |
| Battlefield Hardline | |
| 1920x1080 Ultra Graphics Quality (DX11) AA:4x MS (sort by value) | |
| MSI GS30 Shadow | |
| SCHENKER XMG A305 | |
| SCHENKER XMG C405 | |
| MSI GamingDock | |
| 1920x1080 High Graphics Quality (DX11) (sort by value) | |
| MSI GS30 Shadow | |
| SCHENKER XMG A305 | |
| SCHENKER XMG C405 | |
| MSI GamingDock | |
| 1366x768 Medium Graphics Quality (DX11) (sort by value) | |
| MSI GS30 Shadow | |
| SCHENKER XMG A305 | |
| SCHENKER XMG C405 | |
| MSI GamingDock | |
| 1024x768 Low Graphics Quality (DX11) (sort by value) | |
| MSI GS30 Shadow | |
| SCHENKER XMG A305 | |
| SCHENKER XMG C405 | |
| MSI GamingDock | |
| Dragon Age: Inquisition | |
| 1920x1080 Ultra Graphics Quality AA:2x MS (sort by value) | |
| MSI GS30 Shadow | |
| Alienware 13 | |
| MSI GamingDock | |
| 1920x1080 High Graphics Quality (sort by value) | |
| MSI GS30 Shadow | |
| Alienware 13 | |
| MSI GamingDock | |
| 1366x768 Medium Graphics Quality (sort by value) | |
| MSI GS30 Shadow | |
| Alienware 13 | |
| MSI GamingDock | |
| 1024x768 Low Graphics Quality (sort by value) | |
| MSI GS30 Shadow | |
| Alienware 13 | |
| MSI GamingDock | |
| Far Cry 4 | |
| 1920x1080 Ultra Graphics Quality AA:SM (sort by value) | |
| MSI GS30 Shadow | |
| Alienware 13 | |
| SCHENKER XMG A305 | |
| MSI GamingDock | |
| 1920x1080 High Graphics Quality AA:SM (sort by value) | |
| MSI GS30 Shadow | |
| Alienware 13 | |
| SCHENKER XMG A305 | |
| MSI GamingDock | |
| 1366x768 Medium Graphics Quality (sort by value) | |
| MSI GS30 Shadow | |
| Alienware 13 | |
| SCHENKER XMG A305 | |
| MSI GamingDock | |
| 1024x768 Low Graphics Quality (sort by value) | |
| MSI GS30 Shadow | |
| Alienware 13 | |
| SCHENKER XMG A305 | |
| MSI GamingDock | |
| Fifa 15 | |
| 3840x2160 High Preset (sort by value) | |
| MSI GamingDock | |
| 1920x1080 High Preset AA:4x MS (sort by value) | |
| MSI GS30 Shadow | |
| Alienware 13 | |
| SCHENKER XMG A305 | |
| MSI GamingDock | |
| 1366x768 High Preset AA:2x MS (sort by value) | |
| MSI GS30 Shadow | |
| Alienware 13 | |
| SCHENKER XMG A305 | |
| MSI GamingDock | |
| 1280x720 Low Preset (sort by value) | |
| MSI GS30 Shadow | |
| Alienware 13 | |
| SCHENKER XMG A305 | |
| MSI GamingDock | |
| Sims 4 | |
| 1920x1080 Ultra Preset (sort by value) | |
| MSI GS30 Shadow | |
| Alienware 13 | |
| SCHENKER XMG A305 | |
| MSI GamingDock | |
| 1920x1080 High Preset (sort by value) | |
| MSI GS30 Shadow | |
| Alienware 13 | |
| SCHENKER XMG A305 | |
| MSI GamingDock | |
| 1366x768 Medium Preset (sort by value) | |
| MSI GS30 Shadow | |
| Alienware 13 | |
| SCHENKER XMG A305 | |
| MSI GamingDock | |
| 1024x768 Low Preset (sort by value) | |
| MSI GS30 Shadow | |
| Alienware 13 | |
| SCHENKER XMG A305 | |
| MSI GamingDock | |
| Watch Dogs | |
| 1920x1080 Ultra Overall Quality, Ultra Textures AA:4x MS (sort by value) | |
| MSI GS30 Shadow | |
| SCHENKER XMG A305 | |
| MSI GamingDock | |
| 1920x1080 High Overall Quality, High Textures AA:2x MS (sort by value) | |
| MSI GS30 Shadow | |
| SCHENKER XMG A305 | |
| MSI GamingDock | |
| 1366x768 Medium Overall Quality, Medium Textures (sort by value) | |
| MSI GS30 Shadow | |
| SCHENKER XMG A305 | |
| MSI GamingDock | |
| 1024x768 Low Overall Quality, Medium Textures (sort by value) | |
| MSI GS30 Shadow | |
| SCHENKER XMG A305 | |
| MSI GamingDock | |
| Crysis 3 | |
| 1920x1080 Very High Preset AA:2xSM AF:16x (sort by value) | |
| MSI GS30 Shadow | |
| SCHENKER S413 | |
| MSI GamingDock | |
| 1366x768 High Preset AA:FX AF:16x (sort by value) | |
| MSI GS30 Shadow | |
| SCHENKER S413 | |
| MSI GamingDock | |
| 1366x768 Medium Preset AF:16x (sort by value) | |
| MSI GS30 Shadow | |
| SCHENKER S413 | |
| MSI GamingDock | |
| 1024x768 Low Preset (sort by value) | |
| MSI GS30 Shadow | |
| SCHENKER S413 | |
| MSI GamingDock | |
Noise Level
| Idle |
| 29.4 / 36.2 / 42 dB(A) |
| Load |
| 52.8 / 53.6 dB(A) |
 | ||
30 dB silent 40 dB(A) audible 50 dB(A) loud |
||
min: | ||
| MSI GS30 Shadow Iris Pro Graphics 5200, 4870HQ | SCHENKER S413 Iris Pro Graphics 5200, 4750HQ | Alienware 13 GeForce GTX 860M, 4210U | SCHENKER XMG A305 GeForce GTX 960M, 4710MQ | SCHENKER XMG C405 GeForce GTX 965M, 4720HQ | Razer Blade 14 2015 GeForce GTX 970M, 4720HQ | |
|---|---|---|---|---|---|---|
| Noise | 12% | 17% | 10% | 2% | 11% | |
| Idle Minimum * | 29.4 | 30.1 -2% | 29.2 1% | 29.4 -0% | 29.2 1% | 29.7 -1% |
| Idle Average * | 36.2 | 30.7 15% | 29.4 19% | 30.1 17% | 34.6 4% | 29.9 17% |
| Idle Maximum * | 42 | 33.3 21% | 29.8 29% | 30.8 27% | 38.8 8% | 30 29% |
| Load Average * | 52.8 | 46.4 12% | 37.6 29% | 49.2 7% | 54 -2% | 42.1 20% |
| Load Maximum * | 53.6 | 46.7 13% | 50.8 5% | 53.8 -0% | 54.4 -1% | 59 -10% |
* ... smaller is better
(-) The maximum temperature on the upper side is 49.8 °C / 122 F, compared to the average of 40.4 °C / 105 F, ranging from 21.2 to 68.8 °C for the class Gaming.
(-) The bottom heats up to a maximum of 52.5 °C / 127 F, compared to the average of 43.2 °C / 110 F
(±) In idle usage, the average temperature for the upper side is 33 °C / 91 F, compared to the device average of 33.9 °C / 93 F.
(+) The palmrests and touchpad are reaching skin temperature as a maximum (32.6 °C / 90.7 F) and are therefore not hot.
(-) The average temperature of the palmrest area of similar devices was 28.9 °C / 84 F (-3.7 °C / -6.7 F).
| MSI GS30 Shadow Iris Pro Graphics 5200, 4870HQ | SCHENKER S413 Iris Pro Graphics 5200, 4750HQ | Alienware 13 GeForce GTX 860M, 4210U | SCHENKER XMG A305 GeForce GTX 960M, 4710MQ | SCHENKER XMG C405 GeForce GTX 965M, 4720HQ | Razer Blade 14 2015 GeForce GTX 970M, 4720HQ | |
|---|---|---|---|---|---|---|
| Heat | 4% | 8% | 3% | -10% | 9% | |
| Maximum Upper Side * | 49.8 | 41.9 16% | 44.5 11% | 46.2 7% | 47.8 4% | 51.6 -4% |
| Maximum Bottom * | 52.5 | 54.6 -4% | 60.2 -15% | 47.7 9% | 60.4 -15% | 51.2 2% |
| Idle Upper Side * | 35.2 | 34.2 3% | 29.4 16% | 35 1% | 37.7 -7% | 29.2 17% |
| Idle Bottom * | 36.8 | 36.7 -0% | 29.6 20% | 38.2 -4% | 44.8 -22% | 28.8 22% |
* ... smaller is better
| Off / Standby | |
| Idle | |
| Load |
|
Key:
min: | |
| MSI GS30 Shadow Iris Pro Graphics 5200, 4870HQ | SCHENKER S413 Iris Pro Graphics 5200, 4750HQ | Alienware 13 GeForce GTX 860M, 4210U | SCHENKER XMG A305 GeForce GTX 960M, 4710MQ | SCHENKER XMG C405 GeForce GTX 965M, 4720HQ | Razer Blade 14 2015 GeForce GTX 970M, 4720HQ | |
|---|---|---|---|---|---|---|
| Power Consumption | -13% | 19% | -49% | -86% | ||
| Idle Minimum * | 7.5 | 10.1 -35% | 5.1 32% | 11.4 -52% | 15.8 -111% | |
| Idle Average * | 11.6 | 14.9 -28% | 7.3 37% | 16.3 -41% | 22.8 -97% | |
| Idle Maximum * | 21.2 | 15.4 27% | 11.2 47% | 22.6 -7% | 27.3 -29% | |
| Load Average * | 65.4 | 73 -12% | 51.5 21% | 92.4 -41% | 106.8 -63% | |
| Load Maximum * | 66.4 | 78.3 -18% | 92.9 -40% | 136 -105% | 152 -129% |
* ... smaller is better
| MSI GS30 Shadow Iris Pro Graphics 5200, 4870HQ | SCHENKER S413 Iris Pro Graphics 5200, 4750HQ | Alienware 13 GeForce GTX 860M, 4210U | SCHENKER XMG A305 GeForce GTX 960M, 4710MQ | SCHENKER XMG C405 GeForce GTX 965M, 4720HQ | Razer Blade 14 2015 GeForce GTX 970M, 4720HQ | |
|---|---|---|---|---|---|---|
| Battery Runtime | 47% | 98% | 65% | 16% | ||
| Reader / Idle | 403 | 357 -11% | 723 79% | 420 4% | 380 -6% | |
| H.264 | 166 | 324 95% | 266 60% | |||
| WiFi | 210 | 257 22% | 292 39% | |||
| Load | 48 | 110 129% | 134 179% | 111 131% | 66 38% | |
| WiFi v1.3 | 236 | 222 |
Pros
Cons
除Alienware之外,微星也是有勇气推出搭配可选外置图形加速器的游戏设备厂商之一。不过,这个冒险的概念得到了很好的实施。由于高功率的Core i7-4870HQ在待机状态下就已经让风扇工作得十分辛苦,这可能会让用户望而却步。更不用说它的Turbo加速在负载下几乎无法得到利用。除此之外,机身的稳定性,电池续航,点击触控板和连接性都不尽理想。
除此之外,微星在很多方面都做得不错。不论是在设计,屏幕或者拓展坞:GS30在大多数部分都得到了很好的分数。搭配台式版显卡,这款13寸设备变身为一个强劲的游戏平台,可以在高设置下流畅运行几乎所有最新游戏。
如何为这样一台设备归类成为了一个难题。实际上G30应该属于一台亚笔记本,因为它集成了Iris Pro 5200显卡,不过这与它的概念并不符合。最后,我们决定将这台测试机放入“游戏本”的分类中,因为你并不需要单独购买它拓展坞中的显卡。
考虑到这块GeForce GTX 970在测试的性能表现,它的游戏性能得分应该可以达到100%而非84%(Iris Pro 5200),而他的总分也会提高3%。我们在总分中为它增加了这3个百分点。如果没有GamingDock拓展坞,它的总分回事79%而飞82%。
请留言告诉我们你是否认同这种处理方式,或者我们应该用什么其他方式对这类系统进行评分。
注:本文是基于完整评测的缩减版本,阅读完整的英文评测,请点击这里。
MSI GS30 Shadow
- 05/17/2015 v4 (old)
Florian Glaser


