

戴尔 Inspiron 15 7559 笔记本电脑简短评测


| |||||||||||||||||||||||||
Brightness Distribution: 85 %
Center on Battery: 276 cd/m²
Contrast: 354:1 (Black: 0.78 cd/m²)
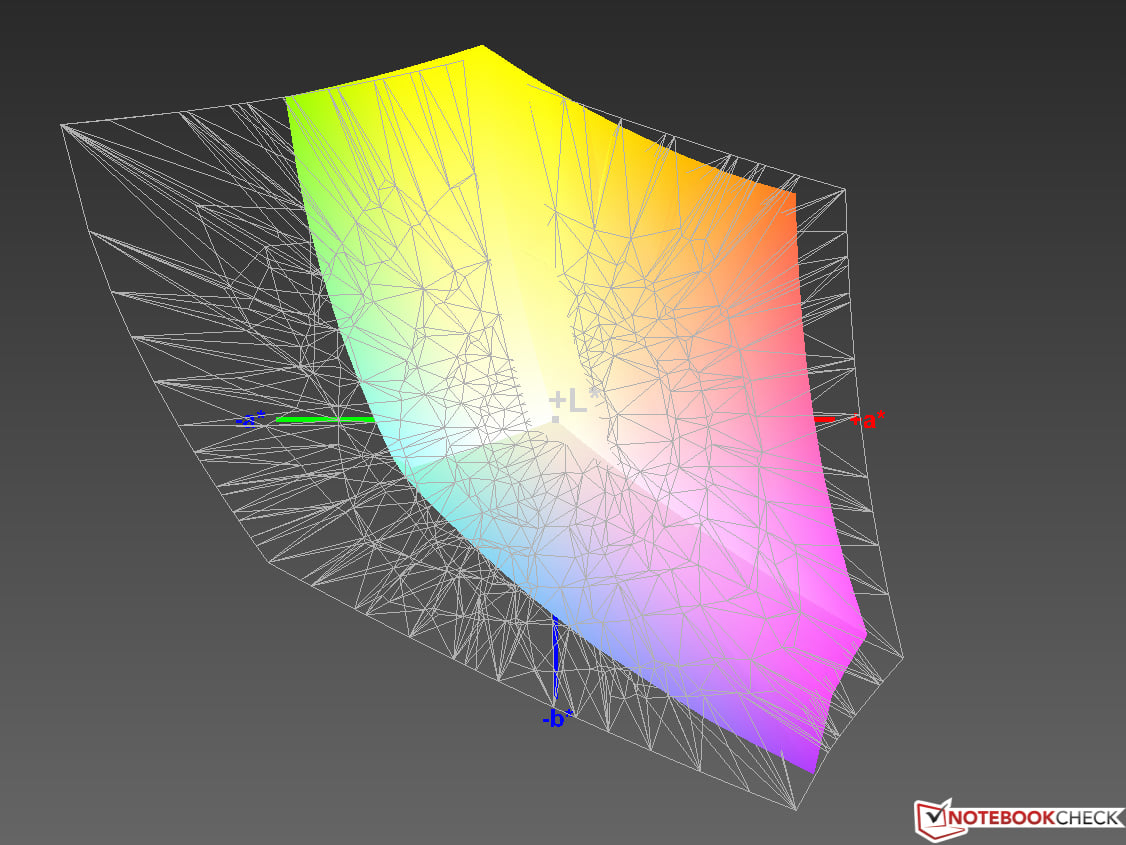
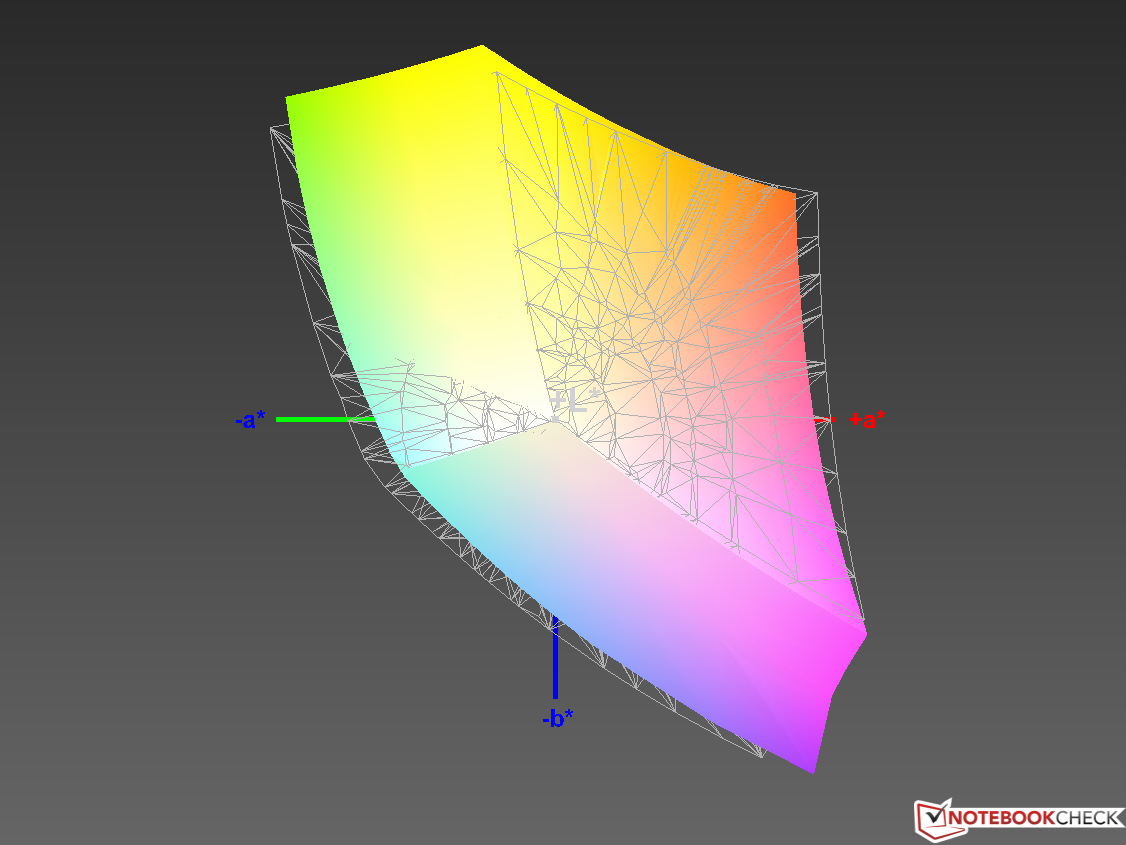
ΔE Color 4.05 | 0.5-29.43 Ø4.87
ΔE Greyscale 4.68 | 0.5-98 Ø5.1
90% sRGB (Argyll 1.6.3 3D)
58% AdobeRGB 1998 (Argyll 1.6.3 3D)
64.6% AdobeRGB 1998 (Argyll 2.2.0 3D)
90% sRGB (Argyll 2.2.0 3D)
63.4% Display P3 (Argyll 2.2.0 3D)
Gamma: 2.55
| Dell Inspiron 15 7559 | Acer Aspire VN7-572G-72L0 | Asus Zenbook Pro UX501JW-FI218H | MSI PE60-2QEi581 | |
|---|---|---|---|---|
| Display | -5% | -23% | 8% | |
| Display P3 Coverage | 63.4 | 63.6 0% | 47.47 -25% | 67.6 7% |
| sRGB Coverage | 90 | 82 -9% | 71.5 -21% | 97 8% |
| AdobeRGB 1998 Coverage | 64.6 | 59.9 -7% | 49.05 -24% | 69.8 8% |
| Response Times | -11% | -20% | ||
| Response Time Grey 50% / Grey 80% * | 32 ? | 50 ? -56% | 43.2 ? -35% | |
| Response Time Black / White * | 26 ? | 17 ? 35% | 27.2 ? -5% | |
| PWM Frequency | ||||
| Screen | 30% | -8% | 38% | |
| Brightness middle | 276 | 328 19% | 302 9% | 300 9% |
| Brightness | 273 | 310 14% | 307 12% | 282 3% |
| Brightness Distribution | 85 | 86 1% | 87 2% | 90 6% |
| Black Level * | 0.78 | 0.33 58% | 0.79 -1% | 0.35 55% |
| Contrast | 354 | 994 181% | 382 8% | 857 142% |
| Colorchecker dE 2000 * | 4.05 | 4.74 -17% | 5.4 -33% | 1.8 56% |
| Greyscale dE 2000 * | 4.68 | 3.15 33% | 5.99 -28% | 2.18 53% |
| Gamma | 2.55 86% | 2.51 88% | 2.32 95% | 2.37 93% |
| CCT | 6871 95% | 6336 103% | 6670 97% | 6837 95% |
| Color Space (Percent of AdobeRGB 1998) | 58 | 54 -7% | 45 -22% | 64 10% |
| Color Space (Percent of sRGB) | 90 | 82 -9% | 71 -21% | 97 8% |
| Total Average (Program / Settings) | 5% /
17% | -17% /
-13% | 23% /
30% |
* ... smaller is better
Display Response Times
| ↔ Response Time Black to White | ||
|---|---|---|
| 26 ms ... rise ↗ and fall ↘ combined | ↗ 9 ms rise | 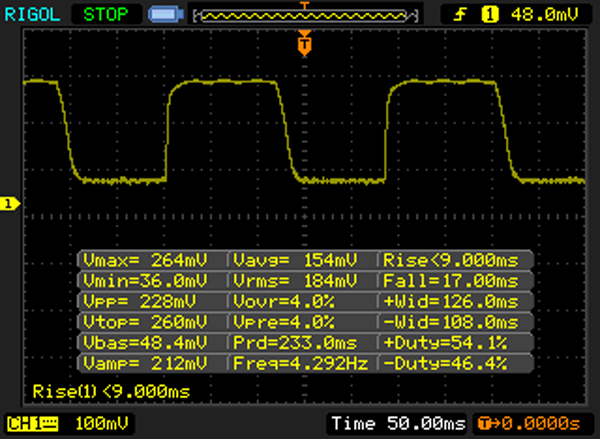 |
| ↘ 17 ms fall | ||
| The screen shows relatively slow response rates in our tests and may be too slow for gamers. In comparison, all tested devices range from 0.1 (minimum) to 240 (maximum) ms. » 60 % of all devices are better. This means that the measured response time is worse than the average of all tested devices (20.8 ms). | ||
| ↔ Response Time 50% Grey to 80% Grey | ||
| 32 ms ... rise ↗ and fall ↘ combined | ↗ 13 ms rise | 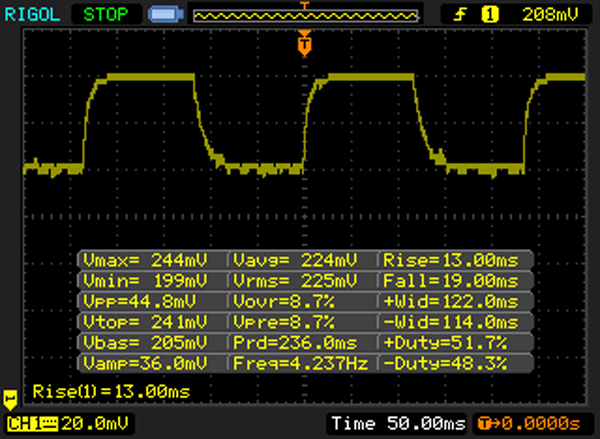 |
| ↘ 19 ms fall | ||
| The screen shows slow response rates in our tests and will be unsatisfactory for gamers. In comparison, all tested devices range from 0.165 (minimum) to 636 (maximum) ms. » 40 % of all devices are better. This means that the measured response time is similar to the average of all tested devices (32.5 ms). | ||
Screen Flickering / PWM (Pulse-Width Modulation)
| Screen flickering / PWM not detected | ||
In comparison: 53 % of all tested devices do not use PWM to dim the display. If PWM was detected, an average of 8516 (minimum: 5 - maximum: 343500) Hz was measured. | ||

| Cinebench R11.5 | |
| CPU Multi 64Bit (sort by value) | |
| Dell Inspiron 15 7559 | |
| Acer Aspire VN7-572G-72L0 | |
| Asus Zenbook Pro UX501JW-FI218H | |
| MSI PE60-2QEi581 | |
| CPU Single 64Bit (sort by value) | |
| Dell Inspiron 15 7559 | |
| Acer Aspire VN7-572G-72L0 | |
| Asus Zenbook Pro UX501JW-FI218H | |
| MSI PE60-2QEi581 | |
| Cinebench R15 | |
| CPU Multi 64Bit (sort by value) | |
| Dell Inspiron 15 7559 | |
| Acer Aspire VN7-572G-72L0 | |
| Asus Zenbook Pro UX501JW-FI218H | |
| MSI PE60-2QEi581 | |
| CPU Single 64Bit (sort by value) | |
| Dell Inspiron 15 7559 | |
| Acer Aspire VN7-572G-72L0 | |
| Asus Zenbook Pro UX501JW-FI218H | |
| MSI PE60-2QEi581 | |
| Cinebench R10 | |
| Rendering Multiple CPUs 32Bit (sort by value) | |
| Dell Inspiron 15 7559 | |
| Acer Aspire VN7-572G-72L0 | |
| Asus Zenbook Pro UX501JW-FI218H | |
| Rendering Single 32Bit (sort by value) | |
| Dell Inspiron 15 7559 | |
| Acer Aspire VN7-572G-72L0 | |
| Asus Zenbook Pro UX501JW-FI218H | |
| MSI PE60-2QEi581 | |
| PCMark 7 | |
| Score (sort by value) | |
| Dell Inspiron 15 7559 | |
| Acer Aspire VN7-572G-72L0 | |
| Asus Zenbook Pro UX501JW-FI218H | |
| MSI PE60-2QEi581 | |
| Productivity (sort by value) | |
| Dell Inspiron 15 7559 | |
| Acer Aspire VN7-572G-72L0 | |
| Asus Zenbook Pro UX501JW-FI218H | |
| MSI PE60-2QEi581 | |
| PCMark 8 | |
| Home Score Accelerated v2 (sort by value) | |
| Dell Inspiron 15 7559 | |
| Acer Aspire VN7-572G-72L0 | |
| MSI PE60-2QEi581 | |
| Work Score Accelerated v2 (sort by value) | |
| Dell Inspiron 15 7559 | |
| Acer Aspire VN7-572G-72L0 | |
| MSI PE60-2QEi581 | |
| PCMark 7 Score | 5636 points | |
| PCMark 8 Home Score Accelerated v2 | 2907 points | |
| PCMark 8 Work Score Accelerated v2 | 3840 points | |
Help | ||
| AS SSD | |
| Seq Read (sort by value) | |
| Dell Inspiron 15 7559 | |
| Acer Aspire VN7-572G-72L0 | |
| Asus Zenbook Pro UX501JW-FI218H | |
| 4K Read (sort by value) | |
| Dell Inspiron 15 7559 | |
| Acer Aspire VN7-572G-72L0 | |
| Asus Zenbook Pro UX501JW-FI218H | |
| 4K-64 Read (sort by value) | |
| Dell Inspiron 15 7559 | |
| Acer Aspire VN7-572G-72L0 | |
| Asus Zenbook Pro UX501JW-FI218H | |
| CrystalDiskMark 3.0 | |
| Read Seq (sort by value) | |
| Dell Inspiron 15 7559 | |
| Acer Aspire VN7-572G-72L0 | |
| Asus Zenbook Pro UX501JW-FI218H | |
| MSI PE60-2QEi581 | |
| Read 4k (sort by value) | |
| Dell Inspiron 15 7559 | |
| Acer Aspire VN7-572G-72L0 | |
| Asus Zenbook Pro UX501JW-FI218H | |
| MSI PE60-2QEi581 | |
| Read 4k QD32 (sort by value) | |
| Dell Inspiron 15 7559 | |
| Acer Aspire VN7-572G-72L0 | |
| Asus Zenbook Pro UX501JW-FI218H | |
| MSI PE60-2QEi581 | |

| 3DMark 11 - 1280x720 Performance GPU (sort by value) | |
| Dell Inspiron 15 7559 | |
| Acer Aspire VN7-572G-72L0 | |
| Asus Zenbook Pro UX501JW-FI218H | |
| MSI PE60-2QEi581 | |
| 3DMark | |
| 1920x1080 Fire Strike Graphics (sort by value) | |
| Dell Inspiron 15 7559 | |
| Acer Aspire VN7-572G-72L0 | |
| Asus Zenbook Pro UX501JW-FI218H | |
| MSI PE60-2QEi581 | |
| 1280x720 Cloud Gate Standard Graphics (sort by value) | |
| Dell Inspiron 15 7559 | |
| Acer Aspire VN7-572G-72L0 | |
| Asus Zenbook Pro UX501JW-FI218H | |
| MSI PE60-2QEi581 | |
| 3DMark 11 Performance | 5572 points | |
| 3DMark Cloud Gate Standard Score | 16805 points | |
| 3DMark Fire Strike Score | 4026 points | |
Help | ||
| low | med. | high | ultra | 4K | |
|---|---|---|---|---|---|
| BioShock Infinite (2013) | 119.7 | 43.6 | |||
| GRID: Autosport (2014) | 52.7 | ||||
| Batman: Arkham Knight (2015) | 63 | 34 | 24 | ||
| Anno 2205 (2015) | 117.1 | 24.6 | 10.2 | 9.9 | |
| Call of Duty: Black Ops 3 (2015) | 72.1 | 36.2 | 31.5 | 10.4 | |
| Fallout 4 (2015) | 96 | 55.6 | 31.9 | 24.7 | 10 |
| Star Wars Battlefront (2015) | 88.4 | 41.1 | 34.4 | 11.8 | |
| Assassin's Creed Syndicate (2015) | 59 severe graphical problems | 47 severe graphical problems | 30 |
Noise Level
| Idle |
| 32.6 / 32.6 / 32.6 dB(A) |
| HDD |
| 32.8 dB(A) |
| Load |
| 40.5 / 49.1 dB(A) |
 | ||
30 dB silent 40 dB(A) audible 50 dB(A) loud |
||
min: | ||
(-) The maximum temperature on the upper side is 54 °C / 129 F, compared to the average of 36.9 °C / 98 F, ranging from 21.1 to 71 °C for the class Multimedia.
(-) The bottom heats up to a maximum of 53.4 °C / 128 F, compared to the average of 39.2 °C / 103 F
(+) In idle usage, the average temperature for the upper side is 28.5 °C / 83 F, compared to the device average of 31.3 °C / 88 F.
(+) The palmrests and touchpad are cooler than skin temperature with a maximum of 27.7 °C / 81.9 F and are therefore cool to the touch.
(±) The average temperature of the palmrest area of similar devices was 28.8 °C / 83.8 F (+1.1 °C / 1.9 F).
| Dell Inspiron 15 7559 GeForce GTX 960M, 6700HQ, SK hynix SC300 M.2 | Acer Aspire VN7-572G-72L0 GeForce GTX 950M, 6500U, Lite-On CV1-8B128 | Asus Zenbook Pro UX501JW-FI218H GeForce GTX 960M, 4720HQ, SanDisk SD7SN3Q128G1002 | MSI PE60-2QEi581 GeForce GTX 960M, 4210H, HGST Travelstar 7K1000 HTS721010A9E630 | |
|---|---|---|---|---|
| Power Consumption | 36% | -17% | -55% | |
| Idle Minimum * | 9.4 | 5.2 45% | 15.6 -66% | 21.8 -132% |
| Idle Average * | 14.4 | 9.4 35% | 20.5 -42% | 26.1 -81% |
| Idle Maximum * | 15 | 10.8 28% | 21.2 -41% | 26.6 -77% |
| Load Average * | 102 | 60 41% | 75.8 26% | 88.5 13% |
| Load Maximum * | 120 | 80.9 33% | 72.9 39% | 119.7 -0% |
* ... smaller is better
| Off / Standby | |
| Idle | |
| Load |
|
Key:
min: | |
| Battery Runtime - WiFi v1.3 (sort by value) | |
| Dell Inspiron 15 7559 | |
| Acer Aspire VN7-572G-72L0 | |
| Asus Zenbook Pro UX501JW-FI218H | |
| MSI PE60-2QEi581 | |
Pros
Cons
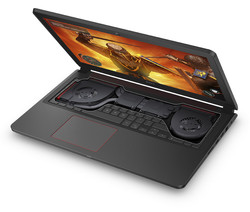
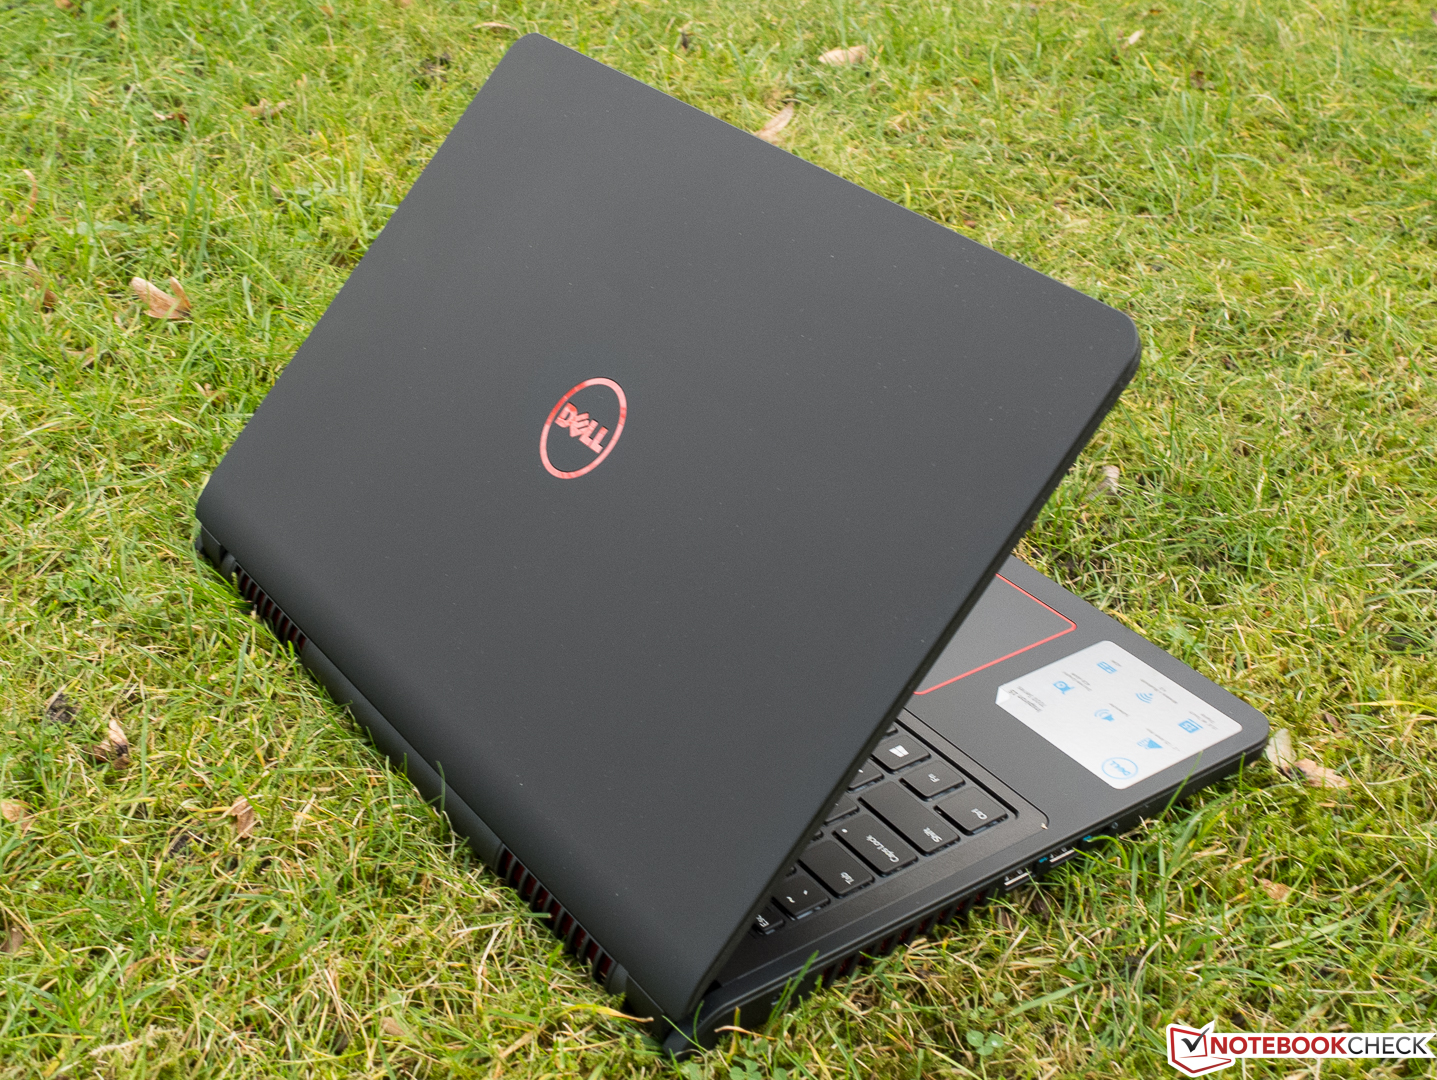
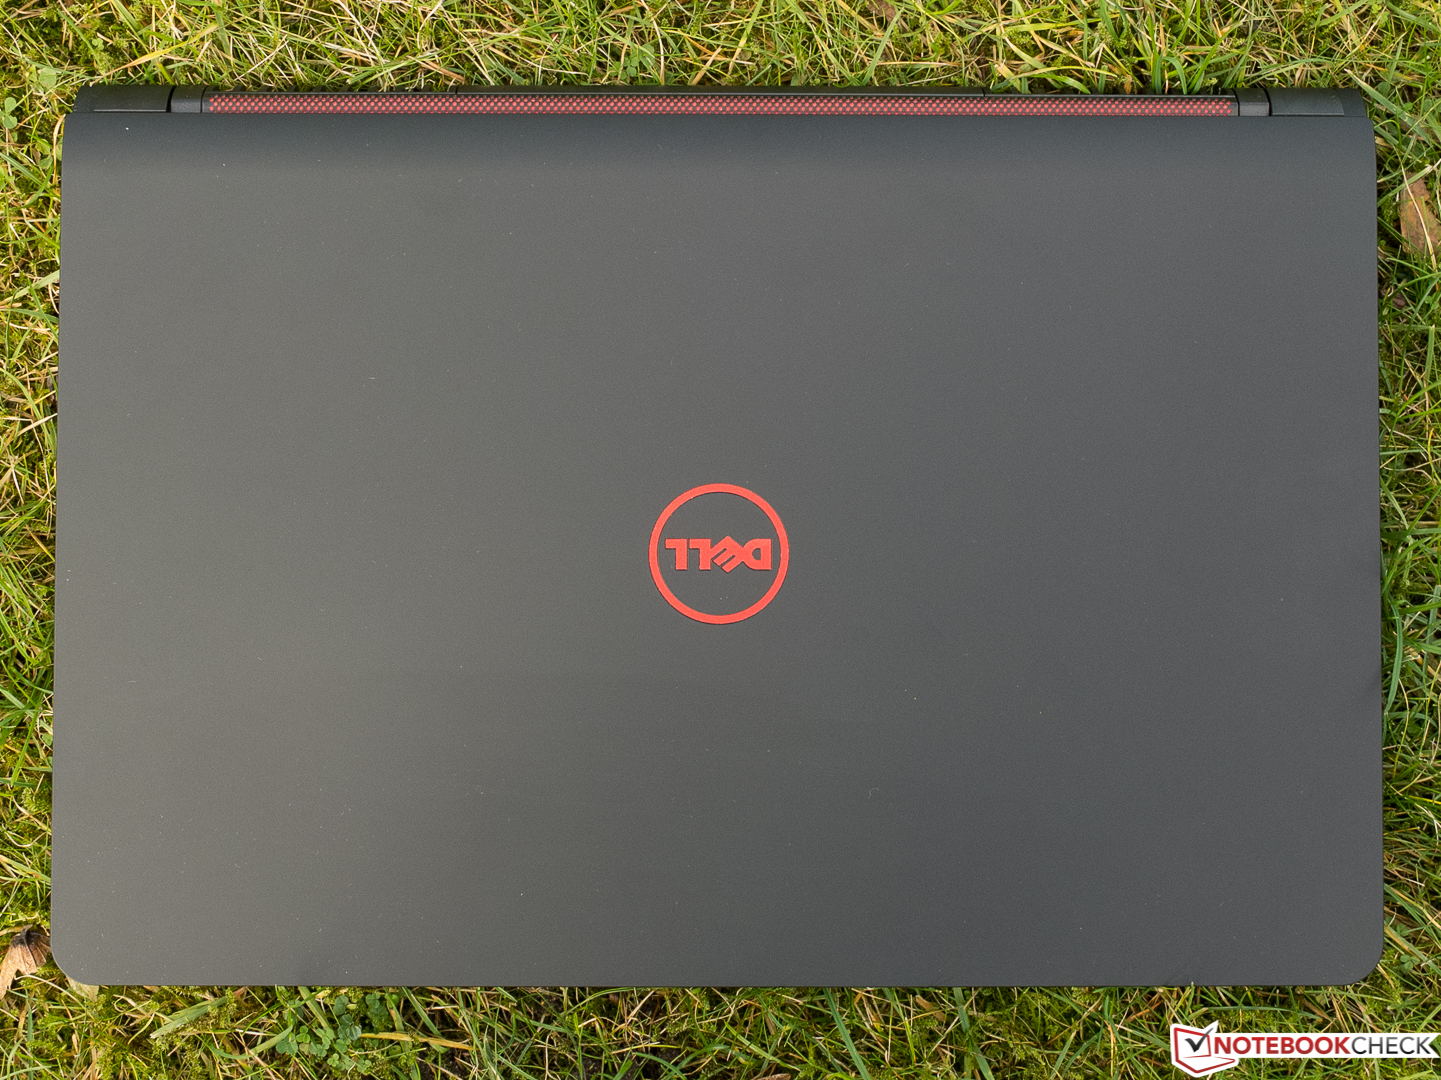
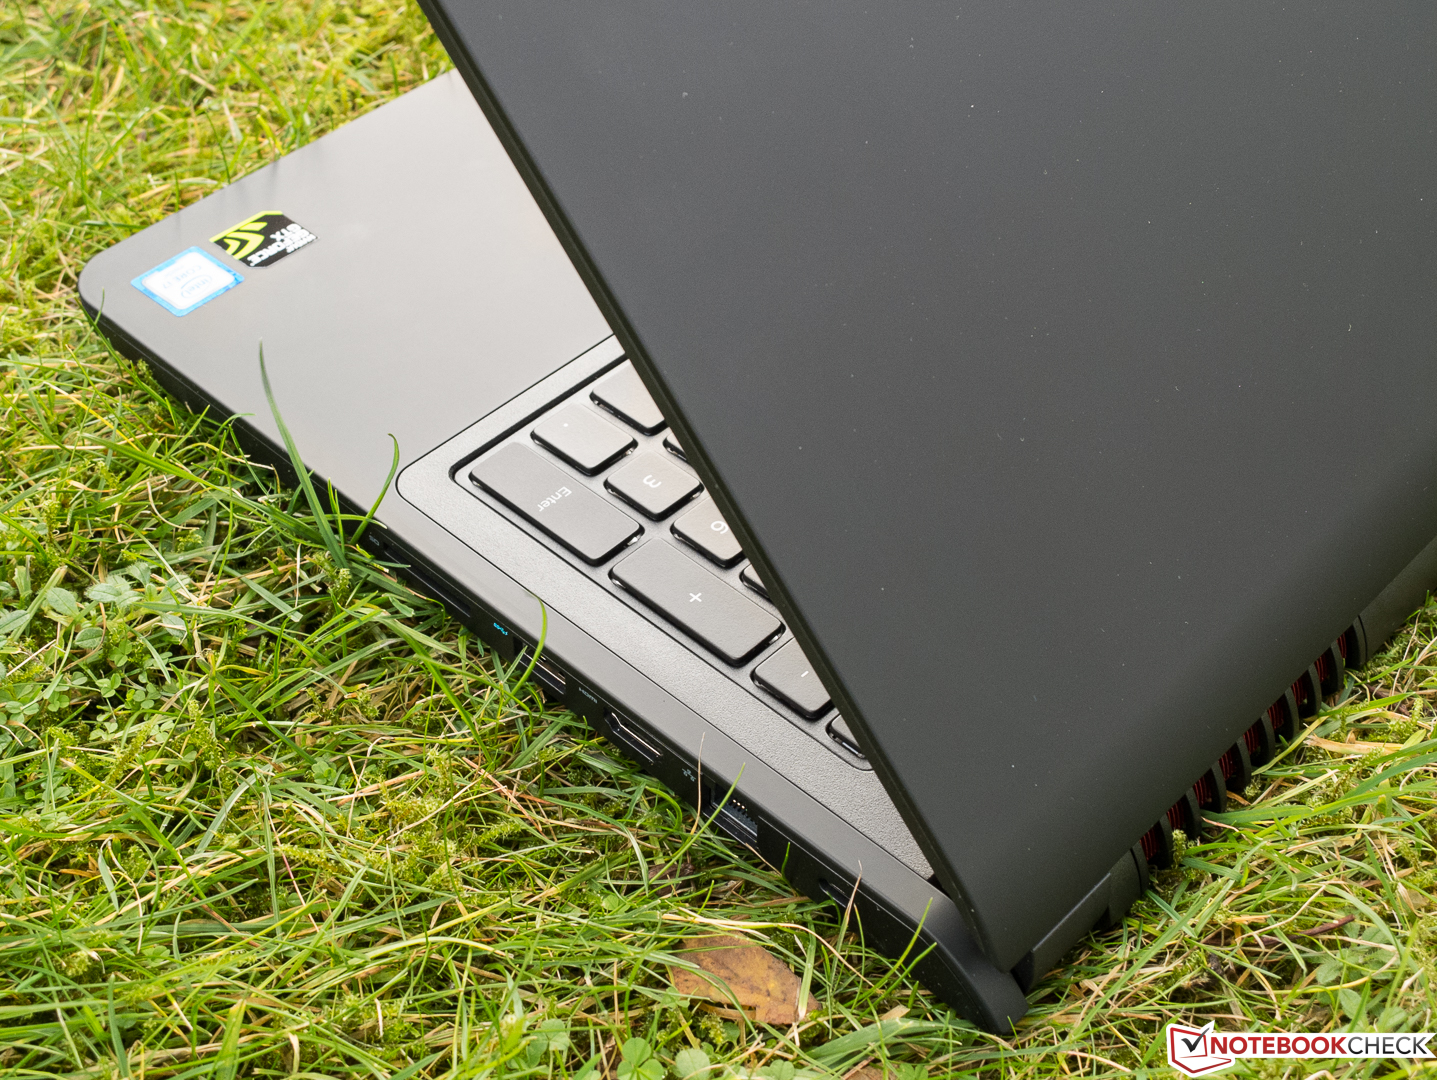
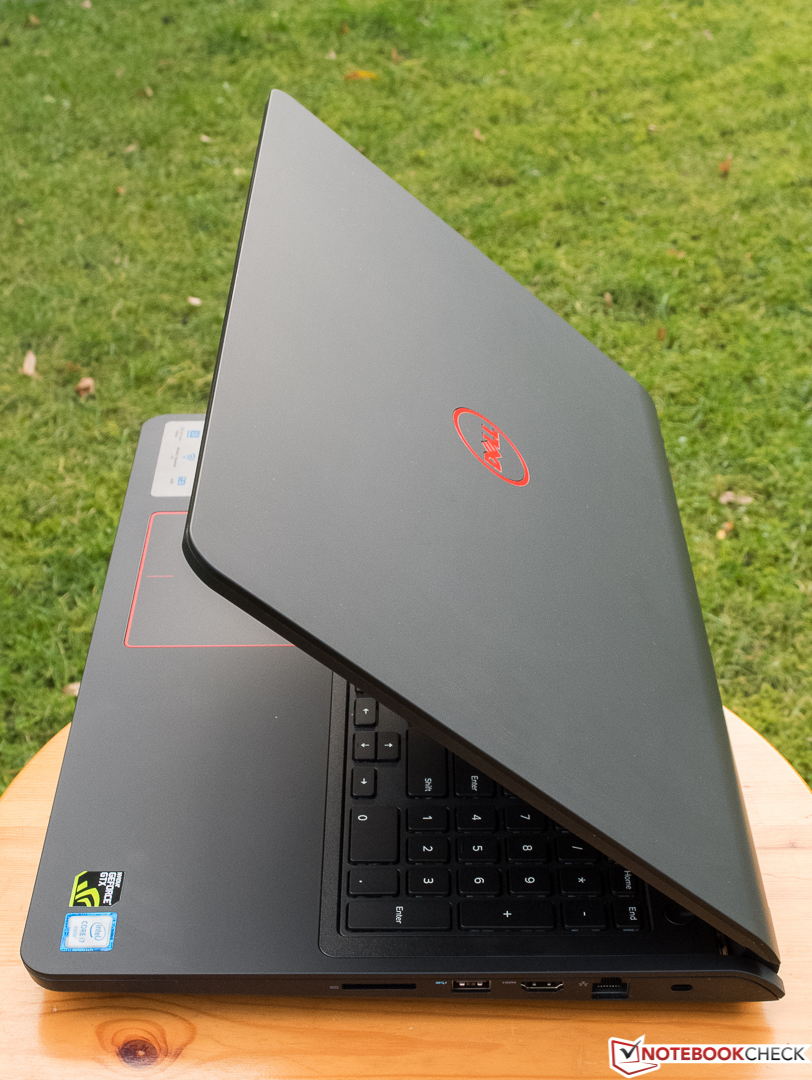
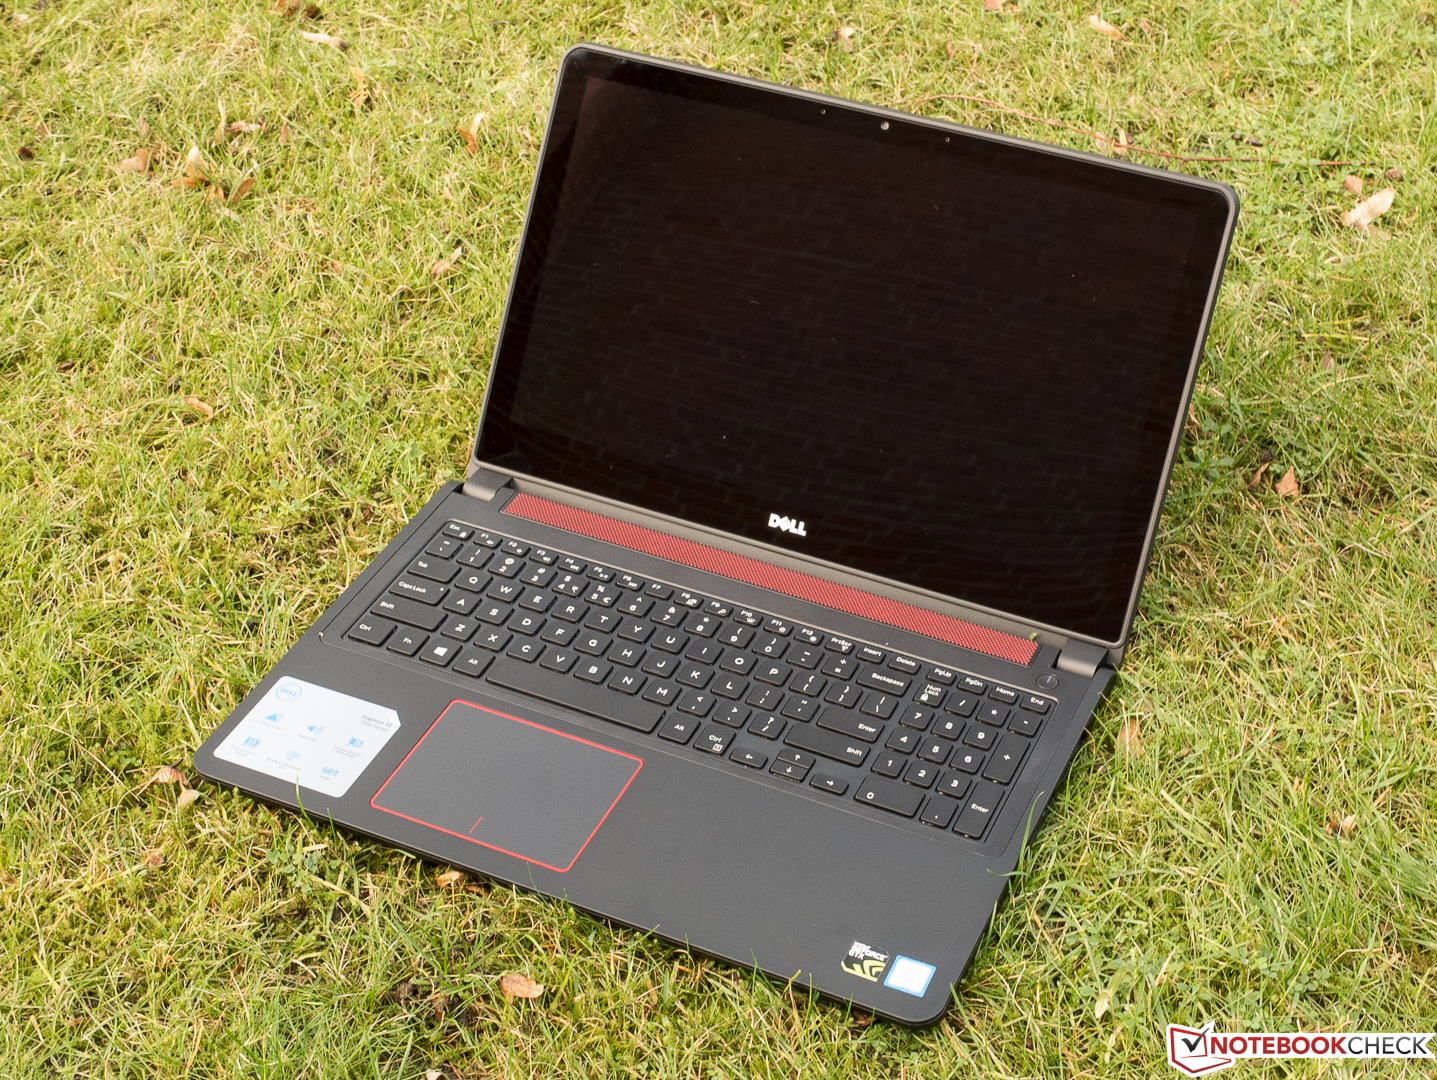
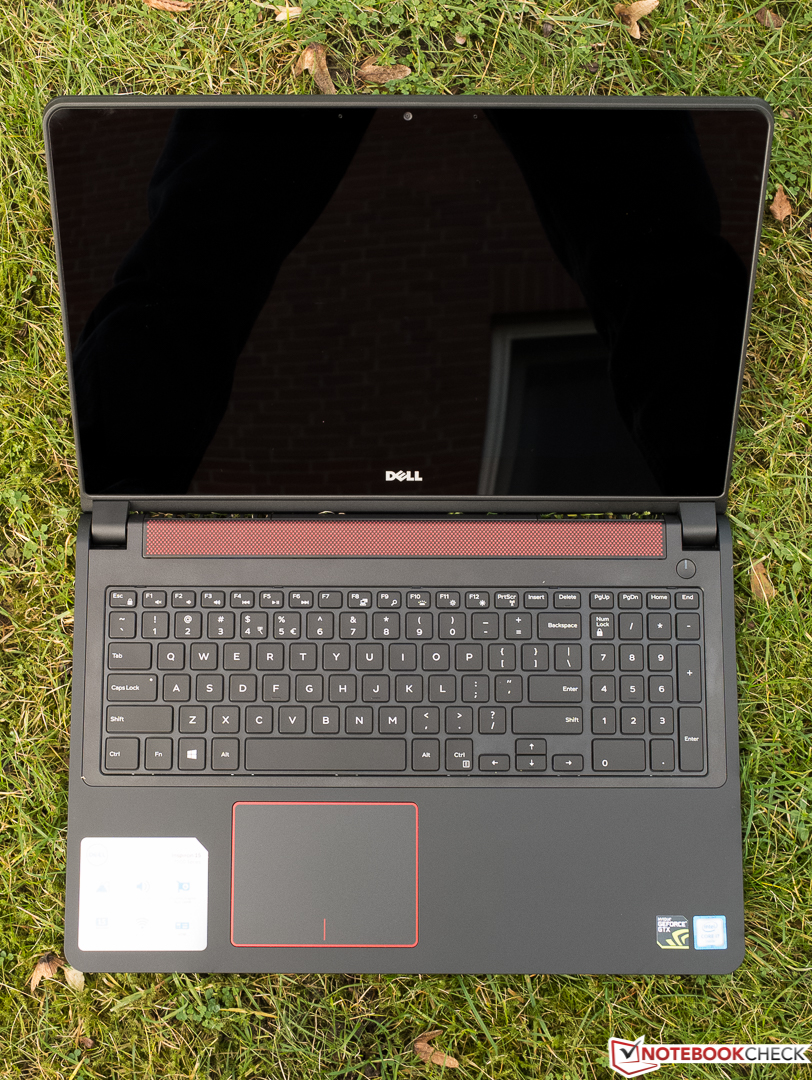
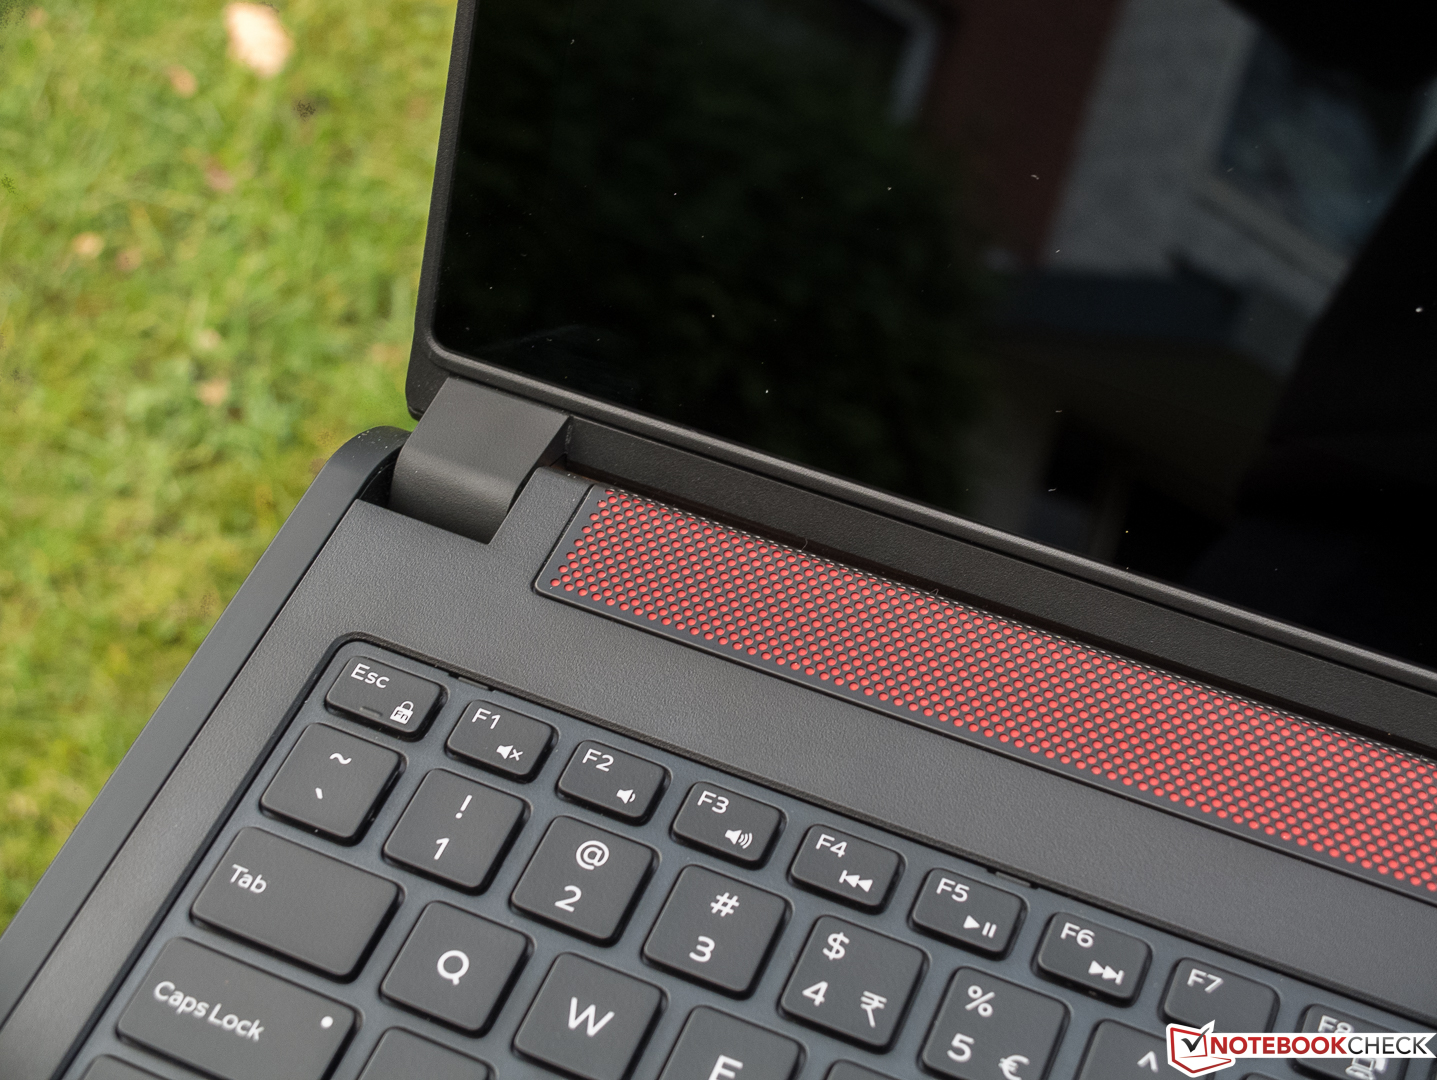
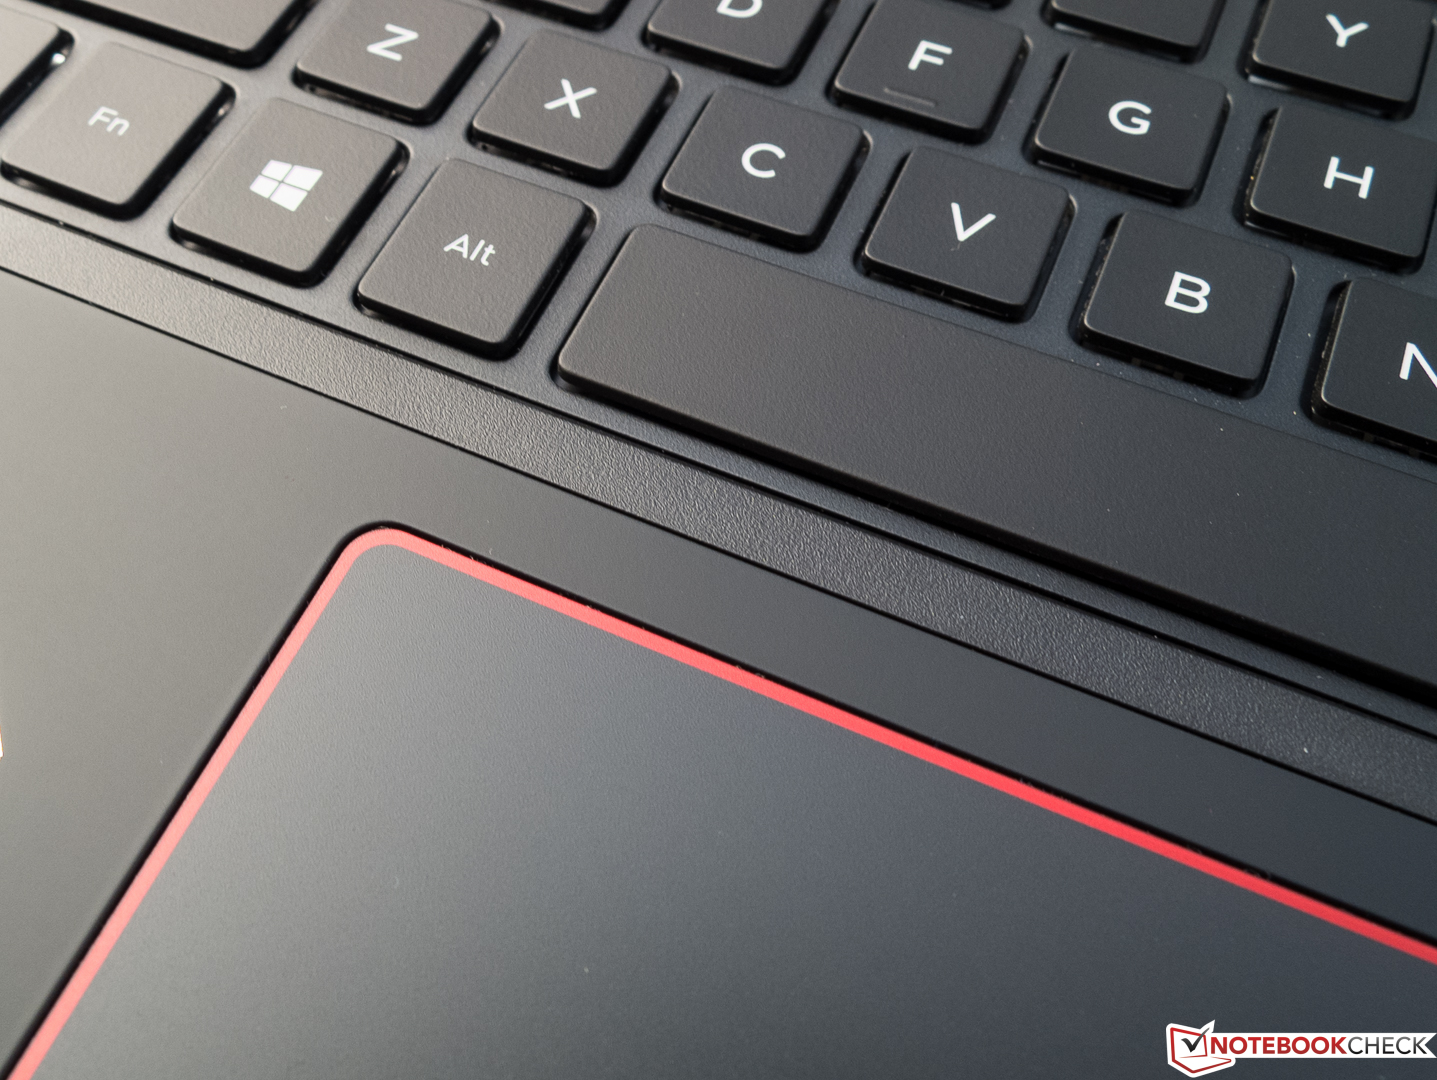
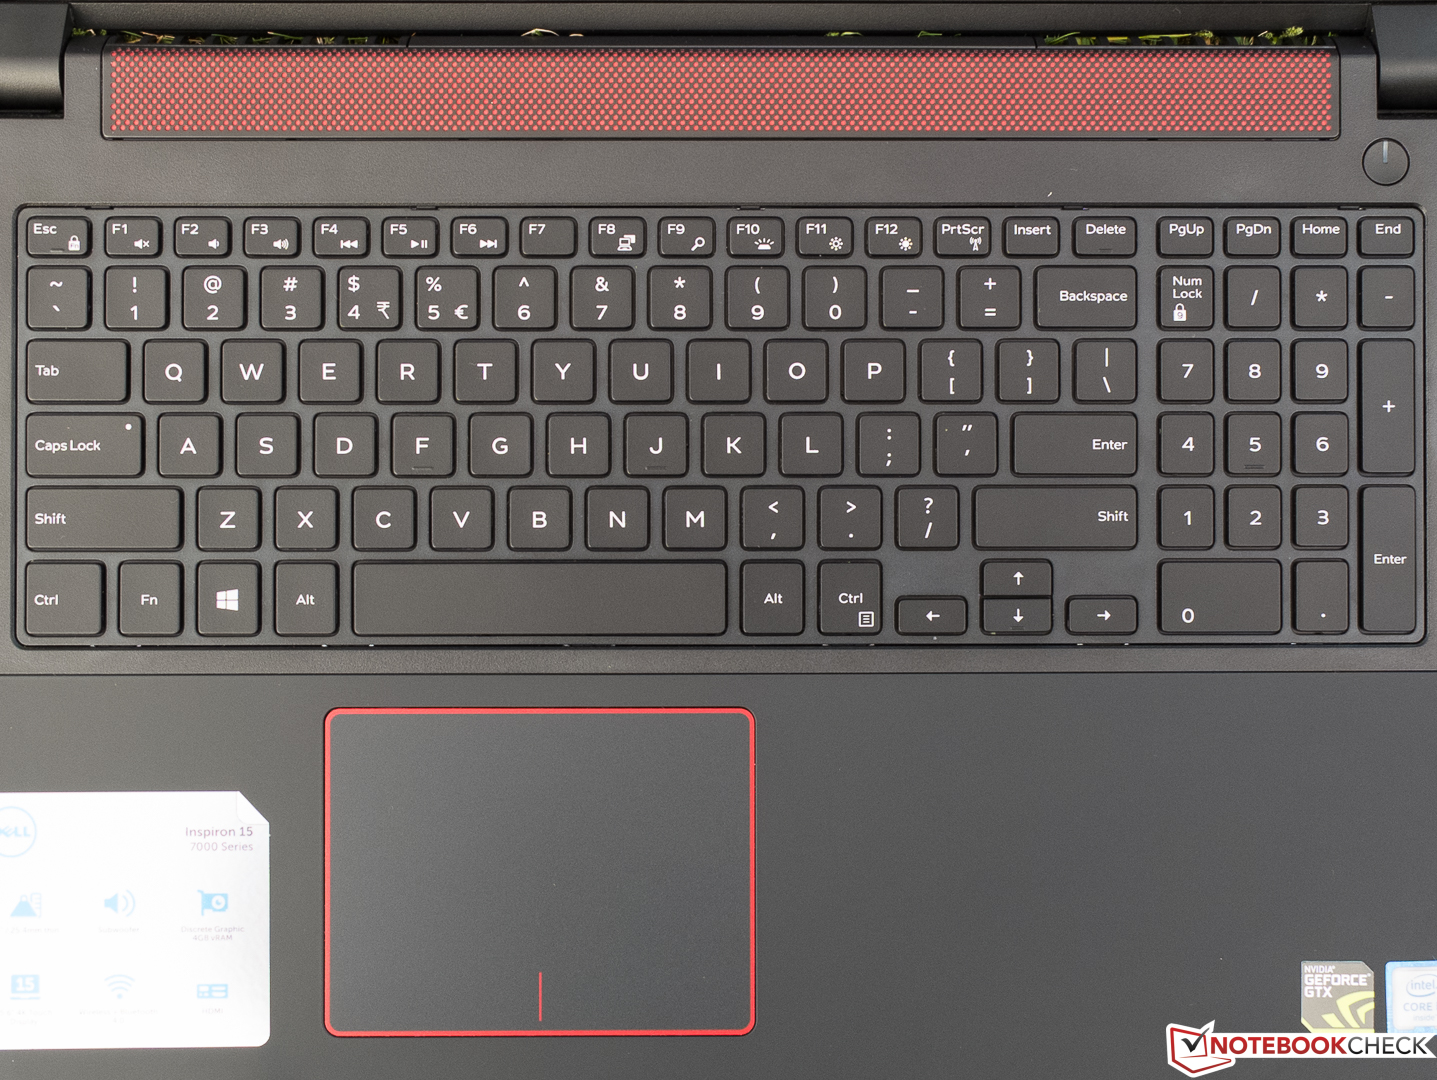
我们已经提到了售价较高的戴尔Inspiron 15 7559(建议零售价1299欧元,约9140人民币)给我们的很好第一印象,但在测试中它的表现让我们略为失望。它的触控版虽然十分优秀,但仍然有一些工艺上的缺陷,而较软的键盘也让测试编辑略为失望。它的机身外观设计十分出色(当然这是个人喜好的问题),不过坚固度较差。虽然光驱现在已经十分少见,但是我们认为对于这个尺寸的多媒体设备来说还是有所必要的。它的触控版驱动存在不少问题,而风扇的噪音也只能通过限制性能来降低。笔者认为它对触控屏幕的选择,特别是镜面的材质,对于非变形本的设备来说十分值得商榷。另外一个问题是你是否真的能够从这款15寸设备的高分辨率屏幕中获益,显然它的售价较高,同时也存在着缩放比例的问题。
它的优势在于优秀的屏幕和宽广的可视角度范围,高性能和非常易用的机身设计,只需打开底盖的维护窗口,你就可以方便地升级维护它的大部分组件。
许多笔记本电脑机型,包括一些游戏本,都应该以它为榜样。它最后得分“仅”82%,所以我们无法真正向读者推荐这款设备;因为我们认为Acer Aspire VN7-572G-72L0 (85%)是一款更有魅力的机型,它选择了搭配传统磨砂全高清屏幕和仅2 GB的显存。
注:本文是基于完整评测的缩减版本,阅读完整的英文评测,请点击这里。
Dell Inspiron 15 7559
- 03/10/2016 v5 (old)
Sven Kloevekorn
Price comparison
