Notebookcheck Logo

Intel Arc Graphics 140V

Intel Arc 140V

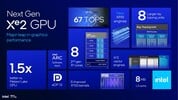
根据 2024 年 6 月泄露的大量信息,Arc Graphics 140V是英特尔 Lunar Lake 处理器采用的一款速度相当快的集成图形适配器。140V 有 8 个 Xe² 架构内核,运行频率高达 2,050 MHz,并有 8 个光线追踪单元;支持 DirectX 12 Ultimate,还支持一长串视频编解码器,包括 h.266 VVC、h.265 HEVC、h.264 AVC、AV1 和 VP9。该 iGPU 可同时使用至少三台(最有可能是四台)SUHD 4320p 显示器。

就像流星湖芯片一样,英特尔利用 Foveros 技术来制造 Lunar Lake 芯片,这意味着 iGPU 和 CPU 内核被堆叠在不同的芯片上。

性能

如果最近泄露的基准测试成绩表明,它的游戏性能将略高于 GeForce MX570使几乎所有 2023 和 2024 游戏都能在 1080p / Low 下运行。

功耗

Lunar Lake 处理器的设计目的是与 AMD Ryzen U 芯片竞争,这意味着前者的功耗数据将相当适中,约为 20 W,其中多达一半由 GPU 消耗。

Gen13 / Xe² Series

Arc 140V 8 @ 2.05 GHz
Arc 130V 7 @ 1.85 GHz
CodenameLunar Lake iGPU
ArchitectureXe²
Pipelines8 - unified
Raytracing Cores8
Core Speed2050 (Boost) MHz
Memory TypeLPDDR5x
Max. Amount of Memory16 GB
Shared Memoryyes
APIDirectX 12_2, OpenGL 4.6, OpenCL 3.0
technology3 nm
Displays3 Displays (max.), HDMI 2.1, DisplayPort 2.1
FeaturesSUHD 4320p60 resolution support, AVC/HEVC/VVC/VP9/AV1 decoding
Date of Announcement24.09.2024
PredecessorArc 8-Core
CPU in Arc 140VGPU Base SpeedGPU Boost / Turbo
Intel Core Ultra 9 288V8 x 3300 MHz, 30 W? MHz2050 MHz
Intel Core Ultra 7 268V8 x 2200 MHz, 17 W? MHz2000 MHz
Intel Core Ultra 7 266V8 x 2200 MHz, 17 W? MHz2000 MHz
min. - max.? - 1950 MHz1950 - 2050 MHz

Benchmarks

3DMark - 3DMark Time Spy Score
min: 3336     avg: 4122     median: 4342 (13%)     max: 4502 Points
3DMark - 3DMark Time Spy Graphics
min: 2955     avg: 3837     median: 4078 (11%)     max: 4227 Points
Intel UHD Graphics 605
113 -97%
...
3430 -11%
3492 -9%
AMD Radeon RX 580 (Laptop)
3505 -9%
3525 -8%
AMD Radeon RX 5300M
3567 -7%
3601 -6%
3610 -6%
3650 -5%
3689 -4%
Intel Arc Graphics 140V
3837
3883 1%
NVIDIA Quadro P4000
3960 3%
NVIDIA Quadro P3200
4155 8%
4209 10%
4256 11%
4372 14%
4448 16%
4546 18%
4661 21%
...
19434 406%
max:
36259 845%
0%
100%
3DMark - 3DMark Cloud Gate Score
min: 29174     avg: 32035     median: 32442 (31%)     max: 34056 Points
3DMark - 3DMark Cloud Gate Graphics
min: 42294     avg: 51841     median: 53072 (13%)     max: 56072 Points
3DMark - 3DMark Fire Strike Standard Score
min: 5930     avg: 8118     median: 8577 (14%)     max: 8911 Points
3DMark - 3DMark Fire Strike Standard Graphics
min: 6790     avg: 9010     median: 9414 (11%)     max: 9831 Points
3DMark - 3DMark Wild Life Extreme Unlimited
6982 Points (8%)
3DMark 11 - 3DM11 Performance Score
min: 10811     avg: 11158     median: 11171 (14%)     max: 11498 Points
3DMark 11 - 3DM11 Performance GPU
min: 10599     avg: 10774     median: 10705 (9%)     max: 11102 Points
171.8 -98%
...
9910 -8%
9950 -8%
10005 -7%
AMD Radeon 680M
10018 -7%
AMD Radeon Pro WX Vega M GL
10020 -7%
NVIDIA Quadro M4000M
10259 -5%
10498 -3%
AMD Radeon Pro Vega 16
10569 -2%
10730 0%
Intel Arc Graphics 140V
10774
10818 0%
10952 2%
11119 3%
11171 4%
11305 5%
11314 5%
NVIDIA Quadro T2000 Max-Q
11461 6%
11796 9%
NVIDIA Quadro M5000M
11893 10%
...
59943 456%
max:
104201 867%
0%
100%
3DMark Vantage
3DM Vant. Perf. total +
3DMark Vantage - 3DM Vant. Perf. total
39055 Points (11%)
3DM Vant. Perf. GPU no PhysX +
3DMark Vantage - 3DM Vant. Perf. GPU no PhysX
38502 Points (21%)
ATI Radeon HD 3200
62 -100%
...
35209 -9%
35269 -8%
35807 -7%
36137 -6%
36214 -6%
AMD Radeon RX 5300M
36391 -5%
36405 -5%
NVIDIA Quadro T2000 Max-Q
36812 -4%
37644 -2%
Intel Arc Graphics 140V
38502
38910 1%
AMD Radeon HD 8970M Crossfire
39191 2%
39213 2%
39319 2%
40134 4%
40146 4%
40643 6%
41091 7%
NVIDIA Quadro P4000
42370 10%
...
132443 244%
max:
170928 344%
0%
100%
3DMark 06 3DMark 06 - Standard 1280x1024 +
3DMark 06
min: 36668     avg: 39025     median: 39024.5 (51%)     max: 41381 Points
Unigine Valley 1.0 - Unigine Valley 1.0 DX
31.5 fps (10%)
Cinebench R10 Cinebench R10 Shading (32bit) +
Cinebench R10 - Cinebench R10 Shading (32bit)
min: 18243     avg: 19179     median: 19178.5 (14%)     max: 20114 points
Cinebench R11.5 Cinebench R11.5 OpenGL 64 Bit +
Cinebench R11.5 - Cinebench R11.5 OpenGL 64 Bit
min: 121.6     avg: 125.6     median: 125.6 (41%)     max: 129.67 fps
Cinebench R15
Cinebench R15 OpenGL 64 Bit +
Cinebench R15 - Cinebench R15 OpenGL 64 Bit
min: 135.2     avg: 146.6     median: 140.3 (8%)     max: 170.5 fps
Cinebench R15 OpenGL Ref. Match 64 Bit +
Cinebench R15 - Cinebench R15 OpenGL Ref. Match 64 Bit
97.8 % (98%)
GFXBench - GFXBench 5.0 4K Aztec Ruins High Tier Offscreen
min: 26.6     avg: 27.8     median: 28.4 (12%)     max: 28.5 fps
GFXBench - GFXBench 5.0 Aztec Ruins High Tier Offscreen
min: 60.6     avg: 62.5     median: 60.9 (11%)     max: 66.1 fps
3.3 -95%
...
45 -28%
NVIDIA GeForce GTX 1050 Max-Q
48.1 -23%
48.6 -22%
NVIDIA GeForce GTX 1050 Ti Max-Q
49.5 -21%
AMD Radeon 680M
52 -17%
AMD Radeon RX 560X (Laptop)
52.4 -16%
53.4 -15%
59.4 -5%
61.4 -2%
Intel Arc Graphics 140V
62.5
62.7 0%
62.7 0%
62.8 0%
63.8 2%
64.7 4%
NVIDIA Quadro T2000 Max-Q
64.8 4%
65.5 5%
Apple M1 7-Core GPU
72.4 16%
Apple M1 8-Core GPU
74.3 19%
...
536 758%
0%
100%
GFXBench - GFXBench 5.0 Aztec Ruins Normal Tier Offscreen
min: 145.4     avg: 156.4     median: 161.8 (12%)     max: 161.9 fps
GFXBench - GFXBench Car Chase Offscreen
min: 94.9     avg: 120.2     median: 131.8 (15%)     max: 133.9 fps
GFXBench 3.1 - GFXBench Manhattan ES 3.1 Offscreen
194.3 fps (4%)
GFXBench 3.0 - GFXBench 3.0 Manhattan Offscreen
257 fps (15%)
GFXBench (DX / GLBenchmark) 2.7
GFXBench T-Rex HD Offscreen C24Z16 +
GFXBench (DX / GLBenchmark) 2.7 - GFXBench T-Rex HD Offscreen C24Z16
503 fps (4%)
Basemark GPU 1.2 - Basemark GPU 1.2 Vulkan Official Medium Offscreen 1080
min: 104.6     avg: 243.3     median: 209.8 (1%)     max: 449 fps
Basemark GPU 1.2 - Basemark GPU 1.2 Vulkan Official High Offscreen 2160
3.6 fps (1%)
Geekbench 6.3 - Geekbench 6.3 GPU OpenCL
min: 21831     avg: 28389     median: 29337 (8%)     max: 30092 points
Geekbench 6.3 - Geekbench 6.3 GPU Vulkan
min: 19700     avg: 30834     median: 32805.5 (9%)     max: 36196 points
LuxMark v2.0 64Bit - LuxMark v2.0 Room GPU
min: 842     avg: 860     median: 859.5 (3%)     max: 877 Samples/s
LuxMark v2.0 64Bit - LuxMark v2.0 Sala GPU
min: 1934     avg: 1979     median: 1979 (3%)     max: 2024 Samples/s
ComputeMark v2.1 - ComputeMark v2.1 Result
min: 6554     avg: 6646     median: 6645.5 (7%)     max: 6737 points
Power Consumption - Furmark Stress Test Power Consumption - external Monitor *
min: 33.6     avg: 37     median: 35.2 (5%)     max: 44 Watt
05101520253035404550Tooltip
Power Consumption - The Witcher 3 Power Consumption - external Monitor *
30.6 Watt (4%)
05101520253035Tooltip
Power Consumption - Cyberpunk 2077 Power Consumption 150cd *
min: 33.1     avg: 44.5     median: 46.1 (15%)     max: 51.1 Watt
0510152025303540455055Tooltip
Power Consumption - Cyberpunk 2077 Power Consumption - external Monitor *
min: 28.6     avg: 41.6     median: 43.1 (5%)     max: 49.9 Watt
0510152025303540455055Tooltip
Power Consumption - Cyberpunk 2077 ultra Power Efficiency
min: 0.3549     avg: 0.5     median: 0.6 (80%)     max: 0.696 fps per Watt
- Range of benchmark values for this graphics card
- Average benchmark values for this graphics card
* Smaller numbers mean a higher performance

Game Benchmarks

The following benchmarks stem from our benchmarks of review laptops. The performance depends on the used graphics memory, clock rate, processor, system settings, drivers, and operating systems. So the results don't have to be representative for all laptops with this GPU. For detailed information on the benchmark results, click on the fps number.

Call of Duty Black Ops 6

Call of Duty Black Ops 6

2024
low 1920x1080
37  fps    + Compare
med. 1920x1080
36  fps    + Compare
high 1920x1080
26  fps    + Compare
ultra 1920x1080
24  fps    + Compare
» With all tested laptops playable in detail settings med..
Additional Benchmarks
Minimum Preset 1280x720
57
low 1920x1080
33.5  fps    + Compare + 📈 Graph
med. 1920x1080
23.1  fps    + Compare + 📈 Graph
high 1920x1080
16.7  fps    + Compare + 📈 Graph
ultra 1920x1080
12.8  fps    + Compare + 📈 Graph
» The benchmarks indicate that the game is not playable in the tested settings.
low 1920x1080
25.8  fps    + Compare + 📈 Graph
med. 1920x1080
25.7  fps    + Compare + 📈 Graph
high 1920x1080
21.9  fps    + Compare + 📈 Graph
ultra 1920x1080
20.6  fps    + Compare + 📈 Graph
» The benchmarks indicate that the game is not playable in the tested settings.
low 1920x1080
20.5  fps    + Compare + 📈 Graph
med. 1920x1080
20  fps    + Compare + 📈 Graph
high 1920x1080
16.5  fps    + Compare + 📈 Graph
ultra 1920x1080
14.8  fps    + Compare + 📈 Graph
» The benchmarks indicate that the game is not playable in the tested settings.
low 1920x1080
22.2  fps    + Compare + 📈 Graph
med. 1920x1080
20.7  fps    + Compare + 📈 Graph
high 1920x1080
19.5  fps    + Compare + 📈 Graph
ultra 1920x1080
18.4  fps    + Compare + 📈 Graph
» The benchmarks indicate that the game is not playable in the tested settings.
low 1920x1080
20  fps    + Compare
» The benchmarks indicate that the game is not playable in the tested settings.
low 1920x1080
49.5  fps    + Compare + 📈 Graph
med. 1920x1080
29.8  fps    + Compare + 📈 Graph
high 1920x1080
27.1  fps    + Compare + 📈 Graph
ultra 1920x1080
26.1  fps    + Compare + 📈 Graph
» With all tested laptops playable in detail settings low.
low 1920x1080
51.3  fps    + Compare + 📈 Graph
med. 1920x1080
37.4  fps    + Compare + 📈 Graph
high 1920x1080
27.5  fps    + Compare + 📈 Graph
ultra 1920x1080
23.8  fps    + Compare + 📈 Graph
» With all tested laptops playable in detail settings med..
F1 24

F1 24

2024
low 1920x1080
54 68.6 85.2 85.7 90 92.1 99 ~ 82 fps    + Compare
med. 1920x1080
49.2 68.9 75.9 80 81.5 83.8 87 ~ 75 fps    + Compare
high 1920x1080
34.4 51.9 56.8 60.1 60.4 61.2 65 ~ 56 fps    + Compare
ultra 1920x1080
15.8 17.7 19.1 19.1 19.2 20 ~ 18 fps    + Compare
QHD 2560x1440
10.9  fps    + Compare
» With most tested laptops playable in detail settings high.
low 1920x1080
18.6  fps    + Compare + 📈 Graph
med. 1920x1080
15.7  fps    + Compare + 📈 Graph
high 1920x1080
12.1  fps    + Compare + 📈 Graph
» The benchmarks indicate that the game is not playable in the tested settings.
low 1920x1080
33.5 34.8 ~ 34 fps    + Compare
med. 1920x1080
28.7 29.7 ~ 29 fps    + Compare
high 1920x1080
25.2 25.4 ~ 25 fps    + Compare
ultra 1920x1080
19.4 19.7 ~ 20 fps    + Compare
» The benchmarks indicate that the game is not playable in the tested settings.
low 1920x1080
20  fps    + Compare + 📈 Graph
high 1920x1080
17.9  fps    + Compare + 📈 Graph
» The benchmarks indicate that the game is not playable in the tested settings.
low 1920x1080
29.6  fps    + Compare + 📈 Graph
med. 1920x1080
28.8  fps    + Compare + 📈 Graph
high 1920x1080
22.1  fps    + Compare + 📈 Graph
ultra 1920x1080
22  fps    + Compare + 📈 Graph
» The benchmarks indicate that the game is not playable in the tested settings.
low 1920x1080
75.6  fps    + Compare + 📈 Graph
med. 1920x1080
55.5  fps    + Compare + 📈 Graph
high 1920x1080
43.3  fps    + Compare + 📈 Graph
ultra 1920x1080
36  fps    + Compare + 📈 Graph
» With all tested laptops playable in detail settings ultra.
low 1920x1080
46  fps    + Compare
med. 1920x1080
37  fps    + Compare
high 1920x1080
30  fps    + Compare
ultra 1920x1080
27  fps    + Compare
» With all tested laptops playable in detail settings med..
low 1920x1080
45.2  fps    + Compare + 📈 Graph
med. 1920x1080
35  fps    + Compare + 📈 Graph
high 1920x1080
31.2  fps    + Compare + 📈 Graph
ultra 1920x1080
29.7  fps    + Compare + 📈 Graph
» With all tested laptops playable in detail settings low.
low 1920x1080
8.2  fps    + Compare + 📈 Graph
med. 1920x1080
7.8  fps    + Compare + 📈 Graph
high 1920x1080
6.7  fps    + Compare + 📈 Graph
ultra 1920x1080
5.3  fps    + Compare + 📈 Graph
» The benchmarks indicate that the game is not playable in the tested settings.
Palworld

Palworld

2024
low 1920x1080
65.3  fps    + Compare + 📈 Graph
med. 1920x1080
48.7  fps    + Compare + 📈 Graph
high 1920x1080
28.4  fps    + Compare + 📈 Graph
ultra 1920x1080
26.5  fps    + Compare + 📈 Graph
» With all tested laptops playable in detail settings med..
med. 1920x1080
254  fps    + Compare + 📈 Graph
high 1920x1080
154.5  fps    + Compare + 📈 Graph
ultra 1920x1080
146.6  fps    + Compare + 📈 Graph
» With all tested laptops playable in detail settings ultra.
low 1920x1080
74.3  fps    + Compare + 📈 Graph
med. 1920x1080
56.5  fps    + Compare + 📈 Graph
high 1920x1080
37.6  fps    + Compare + 📈 Graph
ultra 1920x1080
24.3  fps    + Compare + 📈 Graph
» With all tested laptops playable in detail settings high.
low 1920x1080
88.3  fps    + Compare + 📈 Graph
med. 1920x1080
62.6  fps    + Compare + 📈 Graph
high 1920x1080
55.5  fps    + Compare + 📈 Graph
ultra 1920x1080
44.5  fps    + Compare + 📈 Graph
» With all tested laptops playable in detail settings ultra.
low 1920x1080
19  fps    + Compare
med. 1920x1080
18  fps    + Compare
high 1920x1080
15  fps    + Compare
ultra 1920x1080
11  fps    + Compare
» The benchmarks indicate that the game is not playable in the tested settings.
low 1920x1080
43 44 ~ 44 fps    + Compare
med. 1920x1080
40 42 ~ 41 fps    + Compare
high 1920x1080
30 31 ~ 31 fps    + Compare
ultra 1920x1080
27 29 ~ 28 fps    + Compare
» With all tested laptops playable in detail settings med..
Additional Benchmarks
Minimum Preset 1280x720
43
low 1920x1080
17.5  fps    + Compare + 📈 Graph
med. 1920x1080
17.1  fps    + Compare + 📈 Graph
high 1920x1080
14.5  fps    + Compare + 📈 Graph
» The benchmarks indicate that the game is not playable in the tested settings.
low 1920x1080
24.3  fps    + Compare + 📈 Graph
med. 1920x1080
23  fps    + Compare + 📈 Graph
high 1920x1080
20.5  fps    + Compare + 📈 Graph
ultra 1920x1080
16.9  fps    + Compare + 📈 Graph
» The benchmarks indicate that the game is not playable in the tested settings.
low 1920x1080
95 114 ~ 105 fps    + Compare
med. 1920x1080
68 82 ~ 75 fps    + Compare
high 1920x1080
59 59 ~ 59 fps    + Compare
ultra 1920x1080
50  fps    + Compare
» With all tested laptops playable in detail settings ultra.
Additional Benchmarks
Low Preset 1280x720
129
low 1920x1080
40  fps    + Compare
med. 1920x1080
37  fps    + Compare
high 1920x1080
34  fps    + Compare
ultra 1920x1080
27  fps    + Compare
» With all tested laptops playable in detail settings med..
low 1920x1080
87.4  fps    + Compare + 📈 Graph
med. 1920x1080
85.2  fps    + Compare + 📈 Graph
high 1920x1080
53.2  fps    + Compare + 📈 Graph
ultra 1920x1080
31.7  fps    + Compare + 📈 Graph
» With all tested laptops playable in detail settings high.
low 1920x1080
30.5 39.1 39.6 40.3 40.5 43.8 45.4 45.7 46.3 47.3 ~ 42 fps    + Compare
med. 1920x1080
24.3 31.7 32.6 32.6 36.5 36.5 37 37.2 37.7 39.3 ~ 35 fps    + Compare
high 1920x1080
20 27.2 27.7 28.3 28.4 30.7 31.8 32 33.3 34.4 ~ 29 fps    + Compare
ultra 1920x1080
17.5 18.3 19.1 24.3 24.5 25 25.9 26.4 28.9 30.1 ~ 24 fps    + Compare
QHD 2560x1440
10.4  fps    + Compare
» With most tested laptops playable in detail settings low.
Additional Benchmarks
Low Preset (FSR off) 1280x720
67.7
58.8
66.6
68.5
Ray Tracing Ultra Preset (DLSS off) 1920x1080
10.2
30min Start Ultra Preset (FSR off) 1920x1080
19.9
24.8
15.9
22.2
28
low 1920x1080
23.7 33.8 34.2 35.2 36.6 37.6 40.2 40.3 40.8 43 ~ 37 fps    + Compare + 📈 Graph
med. 1920x1080
19.6 26.3 26.5 28.6 30.5 30.9 31.4 32.5 33.6 33.7 ~ 29 fps    + Compare + 📈 Graph
high 1920x1080
17 23.6 24.5 25.2 25.8 27.8 28.2 29.9 29.9 30 ~ 26 fps    + Compare + 📈 Graph
ultra 1920x1080
16.6 23 23.2 24.1 25.7 27 27.3 27.8 28.9 29.5 ~ 25 fps    + Compare + 📈 Graph
QHD 2560x1440
20.3  fps    + Compare + 📈 Graph
» With most tested laptops playable in detail settings low.
Additional Benchmarks
Low Preset 1280x720
66.4
49.3
51.7
58.5
Lies of P

Lies of P

2023
low 1920x1080
53  fps    + Compare + 📈 Graph
med. 1920x1080
46.8  fps    + Compare + 📈 Graph
high 1920x1080
40.4  fps    + Compare + 📈 Graph
ultra 1920x1080
36.3  fps    + Compare + 📈 Graph
» With all tested laptops playable in detail settings ultra.
low 1920x1080
40  fps    + Compare
med. 1920x1080
35  fps    + Compare
high 1920x1080
29  fps    + Compare
ultra 1920x1080
25  fps    + Compare
» With all tested laptops playable in detail settings low.
low 1920x1080
42.4  fps    + Compare + 📈 Graph
med. 1920x1080
39.6  fps    + Compare + 📈 Graph
high 1920x1080
36  fps    + Compare + 📈 Graph
ultra 1920x1080
32.6  fps    + Compare + 📈 Graph
» With all tested laptops playable in detail settings high.
low 1920x1080
49.7  fps    + Compare + 📈 Graph
med. 1920x1080
46.3  fps    + Compare + 📈 Graph
high 1920x1080
41.8  fps    + Compare + 📈 Graph
ultra 1920x1080
33  fps    + Compare + 📈 Graph
» With all tested laptops playable in detail settings high.
low 1920x1080
35.5  fps    + Compare + 📈 Graph
med. 1920x1080
30.6  fps    + Compare + 📈 Graph
high 1920x1080
25.1  fps    + Compare + 📈 Graph
ultra 1920x1080
19  fps    + Compare + 📈 Graph
» With all tested laptops playable in detail settings low.
F1 23

F1 23

2023
low 1920x1080
61.7 79.2 94.1 96 99.2 101 ~ 89 fps    + Compare
med. 1920x1080
56.4 78 86 89.9 91.3 93.9 ~ 83 fps    + Compare
high 1920x1080
41.1 55.9 60.9 63.1 64.8 66.4 ~ 59 fps    + Compare
ultra 1920x1080
16.5 18.6 18.7 18.8 19.2 ~ 18 fps    + Compare
» With all tested laptops playable in detail settings high.
low 1920x1080
24.3 26.5 ~ 25 fps    + Compare
med. 1920x1080
21.7 23.6 ~ 23 fps    + Compare
high 1920x1080
20.5 22.4 ~ 21 fps    + Compare
ultra 1920x1080
17.7 20.9 ~ 19 fps    + Compare
» The benchmarks indicate that the game is not playable in the tested settings.
low 1920x1080
46.5  fps    + Compare + 📈 Graph
med. 1920x1080
34.5  fps    + Compare + 📈 Graph
high 1920x1080
30.9  fps    + Compare + 📈 Graph
ultra 1920x1080
22  fps    + Compare + 📈 Graph
» With all tested laptops playable in detail settings low.
low 1920x1080
62.1  fps    + Compare
med. 1920x1080
45.7  fps    + Compare
high 1920x1080
35  fps    + Compare
ultra 1920x1080
34.4  fps    + Compare
» With all tested laptops playable in detail settings med..
low 1920x1080
63.2  fps    + Compare + 📈 Graph
med. 1920x1080
44.2  fps    + Compare + 📈 Graph
high 1920x1080
30.3  fps    + Compare + 📈 Graph
ultra 1920x1080
21.1  fps    + Compare + 📈 Graph
» With all tested laptops playable in detail settings med..
Returnal

Returnal

2023
low 1920x1080
40  fps    + Compare
med. 1920x1080
39  fps    + Compare
high 1920x1080
35  fps    + Compare
ultra 1920x1080
30  fps    + Compare
» With all tested laptops playable in detail settings med..
low 1920x1080
41.2  fps    + Compare + 📈 Graph
med. 1920x1080
35  fps    + Compare + 📈 Graph
high 1920x1080
23.3  fps    + Compare + 📈 Graph
ultra 1920x1080
18.5  fps    + Compare + 📈 Graph
» With all tested laptops playable in detail settings low.
F1 22

F1 22

2022
low 1920x1080
79.1 85.3 101 ~ 88 fps    + Compare
med. 1920x1080
75.7 78.8 90 ~ 82 fps    + Compare
high 1920x1080
54.8 64.5 66.5 ~ 62 fps    + Compare
ultra 1920x1080
19.6  fps    + Compare
» With all tested laptops playable in detail settings high.
Additional Benchmarks
Ultra Low Preset 16xAF TAA 1280x720
132.5
132.4
154.8
low 1920x1080
56.5 61.5 ~ 59 fps    + Compare
med. 1920x1080
42.1 50.1 ~ 46 fps    + Compare
high 1920x1080
28.2 31.8 ~ 30 fps    + Compare
ultra 1920x1080
23.6 26.8 ~ 25 fps    + Compare
» With all tested laptops playable in detail settings med..
Additional Benchmarks
Lowest Preset (DX12) 1280x720
100.3
96.9
101.2
Strange Brigade

Strange Brigade

2018
low 1280x720
138.1 186.4 196.8 201 215 225 228 229 236 ~ 206 fps    + Compare
med. 1920x1080
55.5 69.8 77.1 77.4 77.8 78.5 80.2 80.2 84.4 ~ 76 fps    + Compare
high 1920x1080
45.3 59.5 62.1 65.1 65.2 65.7 67.2 68.8 70.1 ~ 63 fps    + Compare
ultra 1920x1080
39 51.1 54 56.2 56.9 57.4 58 60.6 62.5 ~ 55 fps    + Compare
» With all tested laptops playable in detail settings ultra.
Far Cry 5

Far Cry 5

2018
low 1280x720
47 76 77 78 80 82 89 94 96 99 ~ 82 fps    + Compare + 📈 Graph
med. 1920x1080
31 44 46 46 47 51 52 52 57 59 ~ 49 fps    + Compare + 📈 Graph
high 1920x1080
28 39 42 42 45 45 45 48 52 54 ~ 44 fps    + Compare + 📈 Graph
ultra 1920x1080
26 36 38 39 39 42 42 44 48 49 ~ 40 fps    + Compare + 📈 Graph
QHD 2560x1440
35  fps    + Compare + 📈 Graph
» With most tested laptops playable in detail settings ultra.
low 1280x720
38.9 42.5 43.3 44.8 47.1 51.9 53.8 56.4 57 57 ~ 49 fps    + Compare
med. 1920x1080
34.4 35.1 35.8 36.1 39.6 40.1 42.4 43.5 43.7 43.8 ~ 39 fps    + Compare
high 1920x1080
28.5 29.8 30.1 33.3 34.6 35.2 35.8 37.6 37.7 37.7 ~ 34 fps    + Compare
» With most tested laptops playable in detail settings med..
low 1280x720
54.1 68.2 75.6 79.4 80.8 84.4 84.6 86.1 88.6 91 ~ 79 fps    + Compare
med. 1920x1080
31.6 37.9 40.9 41.7 46.1 46.7 46.7 46.8 47.2 47.2 49.3 ~ 44 fps    + Compare
high 1920x1080
23 29.1 30 31.5 32 32.1 32.4 32.8 33.2 34.2 ~ 31 fps    + Compare
QHD 2560x1440
22.2  fps    + Compare
» With most tested laptops playable in detail settings med..
low 1280x720
89.8 93.1 95.8 98.1 98.4 101.6 102.8 104.3 105.4 116.9 ~ 101 fps    + Compare
med. 1366x768
59.7 66.3 83.4 87 88.8 89 96 96.2 98.9 99.9 ~ 87 fps    + Compare
high 1920x1080
48.4 67.2 74.2 78.2 82.6 83 84 84.9 87.9 88.2 ~ 78 fps    + Compare
ultra 1920x1080
54.8 62.9 75.2 79.7 80.3 80.4 80.4 80.5 80.7 81.1 ~ 76 fps    + Compare
» With all tested laptops playable in detail settings ultra.
low 1024x768
83 119 158 161 167 168 ~ 143 fps    + Compare
med. 1366x768
70 90 107 109 115 ~ 98 fps    + Compare
high 1920x1080
36 51 61 62 62 64 ~ 56 fps    + Compare
ultra 1920x1080
19 27 28 28 28 29 ~ 27 fps    + Compare
» With all tested laptops playable in detail settings high.
GTA V

GTA V

2015
low 1024x768
110.5 114.4 139.5 141.6 141.9 149.9 149.9 154.9 156.7 158.7 158.8 ~ 143 fps    + Compare
med. 1366x768
91.1 108 111.3 131.6 136 140.4 140.5 143.2 149.4 152.4 ~ 130 fps    + Compare
high 1920x1080
32 47.1 58.3 59.4 60.5 60.8 62.3 62.8 66.1 66.3 ~ 58 fps    + Compare
ultra 1920x1080
15.4 22.9 23.4 25.2 25.6 26.3 26.7 27 27.3 28.4 ~ 25 fps    + Compare
QHD 2560x1440
18.2  fps    + Compare
» With most tested laptops playable in detail settings high.
Additional Benchmarks
Normal/Off 4xAF 1920x1080
120.6
132.7
134.2
129.8
Lowest Settings possible 1920x1080
135.2
142.8
146.7
136.3
lowmed.highultraQHD4K
Call of Duty Black Ops 637362624
Until Dawn33.523.116.712.8
God of War Ragnarök25.825.721.920.6
Final Fantasy XVI20.52016.514.8
Space Marine 222.220.719.518.4
Black Myth: Wukong20
Once Human49.529.827.126.1
The First Descendant51.337.427.523.8
F1 248275561810.9
Senua's Saga Hellblade 218.615.712.1
Ghost of Tsushima34292520
Dragon's Dogma 22017.9
Horizon Forbidden West29.628.822.122
Last Epoch75.655.543.336
Skull & Bones46373027
Helldivers 245.23531.229.7
Enshrouded8.177.756.745.33
Palworld65.348.728.426.5
Prince of Persia The Lost Crown254154.5146.6
Ready or Not74.356.537.624.3
The Finals88.362.655.544.5
Avatar Frontiers of Pandora19181511
Call of Duty Modern Warfare 3 202344413128
Alan Wake 217.517.114.5
Lords of the Fallen24.32320.516.9
Total War Pharaoh105755950
Assassin's Creed Mirage40373427
Counter-Strike 287.485.253.231.7
Cyberpunk 2077 2.1 Phantom Liberty4235292410.4
Baldur's Gate 33729262520.3
Lies of P5346.840.436.3
The Crew Motorfest40352925
Armored Core 642.439.63632.6
Atlas Fallen49.746.341.833
Ratchet & Clank Rift Apart35.530.625.119
F1 2389835918
Star Wars Jedi Survivor25232119
Resident Evil 4 Remake46.534.530.922
Company of Heroes 362.145.73534.4
Atomic Heart63.244.230.321.1
Returnal40393530
Hogwarts Legacy41.23523.318.5
F1 2288826219.6
Tiny Tina's Wonderlands59463025
Strange Brigade206766355
Far Cry 58249444035
X-Plane 11.11493934
Final Fantasy XV Benchmark79443122.2
Dota 2 Reborn101877876
The Witcher 3143985627
GTA V143130582518.2
< 30 fps
< 60 fps
< 120 fps
≥ 120 fps
12
21
14
3
14
24
9
2
22
24
3
1
32
11
1
1
5
1


For more games that might be playable and a list of all games and graphics cards visit our Gaming List

v1.28
log 19. 04:06:17

#0 ran 0s before starting gpusingle class +0s ... 0s

#1 no ids found in url (should be separated by "_") +0s ... 0s

#2 not redirecting to Ajax server +0s ... 0s

#3 did not recreate cache, as it is less than 5 days old! Created at Sat, 16 Nov 2024 05:32:18 +0100 +0.001s ... 0.001s

#4 no comparison url found in template nbc.compare_page_1 needed +0.026s ... 0.027s

#5 composed specs +0.001s ... 0.028s

#6 did output specs +0s ... 0.028s

#7 start showIntegratedCPUs +0s ... 0.028s

#8 getting avg benchmarks for device 12693 +0.013s ... 0.042s

#9 got single benchmarks 12693 +0.03s ... 0.072s

#10 got avg benchmarks for devices +0s ... 0.072s

#11 min, max, avg, median took s +0.634s ... 0.706s

#12 before gaming benchmark output +0s ... 0.706s

#13 Got 672 rows for game benchmarks. +0.098s ... 0.804s

#14 composed SQL query for gamebenchmarks +0s ... 0.804s

#15 got data and put it in $dataArray +0.035s ... 0.839s

#16 benchmarks composed for output. +1.805s ... 2.643s

#17 no comparison url found in template nbc.compare_page_1 needed +0.005s ... 2.649s

#18 return log +0s ... 2.649s

Notebook reviews with Intel Arc Graphics 140V graphics card

惠普 OmniBook Ultra Flip 14 可折叠电脑评测:比预期更轻

惠普 OmniBook Ultra Flip 14 可折叠电脑评测:比预期更轻

OmniBook Ultra Flip 14 可能是惠普最轻的 14 英寸可折叠笔记本之一,但它的速度远非最慢。英特尔公司新推出的 Lunar Lake CPU 在便携性和性能之间取得了很好的平衡。...
Intel Core Ultra 7 258V | Intel Arc Graphics 140V | 14.00" | 1.3 kg
戴尔 XPS 13 9350 笔记本电脑评测:英特尔 "月亮湖 "完美契合

戴尔 XPS 13 9350 笔记本电脑评测:英特尔 "月亮湖 "完美契合

与 XPS 13 9340 相比,新的英特尔 CPU 提供了更稳定的处理器性能,同时电池续航时间和图形处理能力也有了大幅提升。这些变化有助于使 XPS 13 成为 MacBook Air 13 系列更好的竞争者。...
Intel Core Ultra 7 256V | Intel Arc Graphics 140V | 13.40" | 1.2 kg
华硕 ExpertBook P5 P5405 笔记本电脑评测:商务笔记本电脑中的英特尔 M1 时刻

华硕 ExpertBook P5 P5405 笔记本电脑评测:商务笔记本电脑中的英特尔 M1 时刻

英特尔 Lunar Lake 承诺将 x86 笔记本电脑的效率提升到与高通公司和Apple 的 ARM CPU 相近的水平。这在很大程度上是成功的,即使最大多核性能有限。不过,对于像华硕 ExpertBook P5 P5405 这样小巧轻便的办公笔记本电脑来说,我们认为其他方面更重要--比如超长的电池续航时间和安静的散...
Intel Core Ultra 7 258V | Intel Arc Graphics 140V | 14.00" | 1.3 kg
英特尔酷睿 Ultra 7 256V 性能首次亮相:联想 Yoga Slim 7 15 Aura 笔记本电脑评测

英特尔酷睿 Ultra 7 256V 性能首次亮相:联想 Yoga Slim 7 15 Aura 笔记本电脑评测

既然 Lunar Lake 可以提供与之相当的电池续航时间,骁龙精英系列的吸引力就大打折扣了。不过,要想获得最佳的游戏性能,我们仍然推荐使用 Zen 5。...
Intel Core Ultra 7 256V | Intel Arc Graphics 140V | 15.30" | 1.5 kg
英特尔 Lunar Lake iGPU 分析 - Arc Graphics 140V 比 Radeon 890M 更快更高效

英特尔 Lunar Lake iGPU 分析 - Arc Graphics 140V 比 Radeon 890M 更快更高效

英特尔 Lunar Lake 处理器配备了采用第二代 Xe 核心的新型集成图形适配器。我们评估了配备 8 个 Xe 内核的新型 Arc Graphics 140V 的性能和效率。 ...
Intel Core Ultra 7 258V | Intel Arc Graphics 140V | 14.00" | 1.2 kg

Asus Zenbook S 14 UX5406: Intel Core Ultra 7 258V
  Review » 英特尔 Lunar Lake iGPU 分析 - Arc Graphics 140V 比 Radeon 890M 更快更高效

  Review » 华硕 Zenbook S 14 UX5406 笔记本电脑评测--配备英特尔 Lunar Lake 处理器的优秀日常笔记本电脑

  Review » 英特尔月亮湖处理器分析--酷睿至尊 7 258V 的多核性能令人失望,但日常效率不错

  Review » 英特尔月亮湖处理器分析--酷睿至尊 7 258V 的多核性能令人失望,但日常效率不错

HP OmniBook Ultra Flip 14: Intel Core Ultra 7 258V, 14.00", 1.3 kg
  External Review » HP OmniBook Ultra Flip 14

HP OmniBook Ultra Flip 14-fh0000: Intel Core Ultra 7 258V, 14.00", 1.3 kg
  External Review » HP OmniBook Ultra Flip 14-fh0000

Asus ExpertBook P5 P5405-NZ0102X: Intel Core Ultra 7 258V, 14.00", 1.3 kg
  External Review » Asus ExpertBook P5 P5405-NZ0102X

Asus Zenbook S 14 UX5406: Intel Core Ultra 7 258V, 14.00", 1.2 kg
  External Review » Asus Zenbook S 14 UX5406

Samsung Galaxy Book5 Pro 360: Intel Core Ultra 7 256V, 16.00", 1.7 kg
  External Review » Samsung Galaxy Book5 Pro 360

Lenovo ThinkPad X1 Carbon G13: Intel Core Ultra 7 258V, 14.00", 1 kg
  External Review » Lenovo ThinkPad X1 Carbon G13

Asus Zenbook S 14 UX5406 Core Ultra 9: Intel Core Ultra 9 288V
  External Review » Asus Zenbook S 14 UX5406 Core Ultra 9

Lenovo Yoga Slim 7 15ILL9 Aura: Intel Core Ultra 7 256V, 15.30", 1.5 kg
  External Review » Lenovo Yoga Slim 7 15ILL9 Aura

Asus ExpertBook P5 P5405-NZ0102X: Intel Core Ultra 7 258V, 14.00", 1.3 kg
   » 英特尔再次实现高效:华硕 ExpertBook P5 采用 Lunar Lake 技术,电池续航时间长达 16 小时

Asus Zenbook S 14 UX5406: Intel Core Ultra 7 258V, 14.00", 1.2 kg
   » Linux 在英特尔 Lunar Lake 处理器上击败 Windows 11,性能提升高达 20%,但也存在一些严重的问题

Please share our article, every link counts!
Mail Logo

» Comparison of GPUs
Detailed list of all laptop GPUs sorted by class and performance.

» Benchmark List
Sort and restrict laptop GPUs based on performance in synthetic benchmarks.

» Notebook Gaming List
Playable games for each graphics card and their average FPS results.

Class 1

M4 40-core GPU *
GeForce RTX 2080 Super Mobile

Class 2

M4 32-core GPU *
M1 Max 32-Core GPU *
GeForce RTX 2070 Super Mobile
M1 Max 24-Core GPU *
Quadro RTX 5000 Max-Q
Radeon RX 5700M *
GeForce GTX 1080 Mobile
Quadro RTX 4000 (Laptop)
M1 Pro 16-Core GPU *
Radeon PRO W6600M *
GeForce RTX 2070 Super Max-Q
Quadro RTX 4000 Max-Q *
M1 Pro 14-Core GPU *
Quadro P5200
Quadro RTX 3000 Max-Q *
Quadro P4200
Quadro P5000 Max-Q *
GeForce GTX 980 (Laptop)
Quadro P4000
Quadro P4000 Max-Q
Quadro P3200
Radeon RX 580X (Laptop) *
Radeon RX 580 (Laptop)
Radeon Pro 5300M
Radeon RX 5300M
Quadro P3000 Max-Q *
Quadro T2000 Max-Q *
Radeon Pro WX 7100 *
Radeon RX 570X (Laptop) *

Class 3

Radeon RX 570 (Laptop) *
Radeon RX 470 (Laptop) *
Quadro T1000 Max-Q *
Vega M GH
Quadro M5000M
GeForce GTX 1050 Ti Mobile
Radeon 680M
Quadro P2000
Quadro P2000 Max-Q
Quadro M4000M
T500 Laptop GPU *
Radeon R9 M395X
GeForce GTX 1050 Ti Max-Q *
Radeon Pro Vega 16
WX Vega M GL
Radeon R9 M485X
Quadro M3000M
FirePro W7170M
Radeon R9 M395
GeForce GTX 1050 Max-Q *
Radeon 660M
Radeon Pro WX 4150 *
Radeon RX 560X (Laptop)
Radeon RX 560 (Laptop)
Radeon RX 460 (Laptop)
Quadro P1000
Radeon R9 M390
Xe MAX
Radeon Pro 560X
Radeon Pro 560
Radeon Pro 460
Radeon Pro WX 4130 *
GeForce GTX 960M
Quadro P620 *
Radeon RX 550X (Laptop)
Radeon Pro WX 3200 *
Radeon Pro 555X
Radeon Pro 555
Radeon Pro 455
Quadro P600
Quadro M2000M
Radeon RX 540X *
Radeon Pro WX 2100 *
Radeon Pro WX 3100 *
GeForce GTX 950M
Radeon Pro 450
Radeon 630
Radeon 540X *
Radeon R9 M385X
Quadro P520
Quadro M1000M
GeForce 945M
Quadro P500 *
Iris Plus Graphics G7 (Ice Lake 64 EU) *
Vega 10 *
Iris Pro Graphics 580
FirePro W5170M *
Radeon R9 M370X
Vega 9
FirePro W5130M
UHD Graphics Xe G4 48EUs *
UHD Graphics 32EUs
UHD Graphics Xe 32EUs (Tiger Lake-H) *
UHD Graphics 750
UHD Graphics 730
Vega 7
Radeon R7 M465
Iris Pro Graphics 6200
Vega 8
GeForce 940M
Iris Plus Graphics G4 (Ice Lake 48 EU)
Quadro M600M
FirePro W4190M
Radeon R9 M375
Radeon R7 M445
Iris Plus Graphics 650
Iris Graphics 550
Radeon 625
Vega 6 *
Iris Plus Graphics 640
Iris Graphics 540
UHD Graphics 24EUs (Alder Lake-N) *
Radeon R7 M360
GeForce 920M
Radeon 620
Radeon R7 M340
Radeon 610
Radeon 610M *
Vega 6 *
UHD Graphics G1 (Ice Lake 32 EU)
UHD Graphics Xe 16EUs (Tiger Lake-H) *
HD Graphics 530
Radeon R5 (Bristol Ridge)
Adreno 690 *
Adreno 685 *
Adreno 680 *
Radeon R5 M330
GeForce 910M
HD Graphics 520

Class 4

Radeon R5 M320 *
Radeon R5 M315 *
Radeon R5 M420 *
Vega 2 *
UHD Graphics 617
UHD Graphics 615
HD Graphics 515
UHD Graphics 610
HD Graphics 510
UHD Graphics 605
Radeon R4 (Stoney Ridge)
Radeon R2 (Stoney Ridge)
VideoCore VII *
UHD Graphics 600
HD Graphics (Braswell)

* Approximate position of the graphics adapter