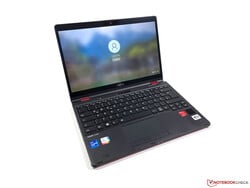
富士通LifeBook U9311X评测--带LTE的1公斤商务敞篷车
Possible competitors in comparison
Rating | Date | Model | Weight | Height | Size | Resolution | Price |
|---|---|---|---|---|---|---|---|
| 85.6 % v7 (old) | 09 / 2021 | Fujitsu LifeBook U9311X i7 LTE i7-1185G7, Iris Xe G7 96EUs | 1 kg | 17 mm | 13.30" | 1920x1080 | |
| 91.1 % v7 (old) | Lenovo ThinkPad X13 Yoga G2 i7-1165G7, Iris Xe G7 96EUs | 1.2 kg | 15.39 mm | 13.30" | 2560x1600 | ||
| 90.8 % v7 (old) | 06 / 2021 | HP Elite Dragonfly Max i7-1185G7, Iris Xe G7 96EUs | 1.2 kg | 16 mm | 13.30" | 1920x1080 | |
| 86.3 % v7 (old) | 01 / 2020 | Dell XPS 13 7390 2-in-1 Core i7 i7-1065G7, Iris Plus Graphics G7 (Ice Lake 64 EU) | 1.3 kg | 13 mm | 13.40" | 1920x1200 |
外壳、设备和输入装置
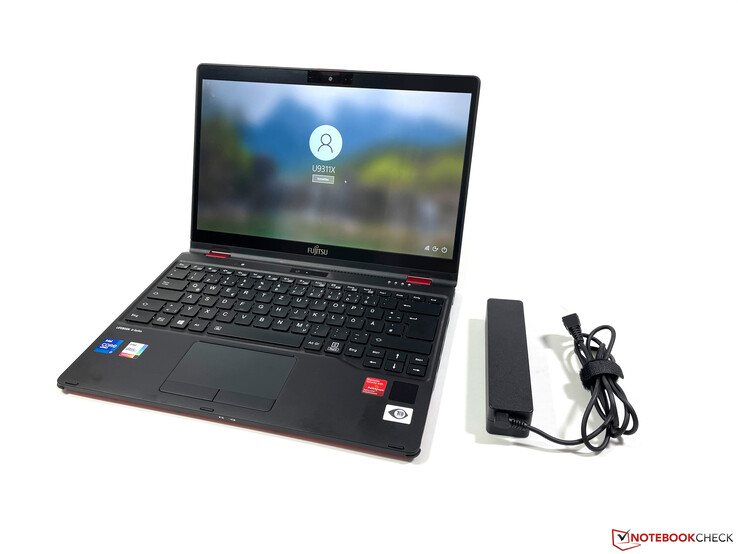
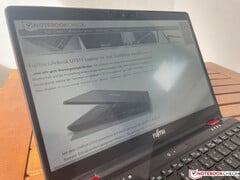
我们已经知道两个前辈机型的镁合金外壳,即U9310X和U939X.它仍然是一款移动性极强的商务便携机,包括手写笔在内的重量刚刚超过1公斤(约2.2磅),但你可以看到外壳的老化,特别是在宽大的屏幕边缘和(以今天的标准)微小的触摸板。如果我们的测试设备的红色外壳太显眼,U9311X也有黑色版本。
一个优势是广泛的连接,包括一个完整的SD读卡器,甚至一个千兆以太网端口。Thunderbolt 4现在也支持Tiger Lake 更新。还支持高传输率的Wi-Fi 6,还安装了一个LTE模块,但更现代的选择(Wi-Fi 6E和5G)在这里也已经有了,这对于2300欧元(约2716美元)的价格来说是可以期待的。
键盘是有照明的,但它仍然是一个小的弱点。键盘相当小,压力点也相当松软。惠普或联想的其他商务转换机在这里只是提供更好的输入。
» Notebookcheck多媒体笔记本电脑Top 10排名
» Notebookcheck游戏笔记本电脑Top 10排名
» Notebookcheck低价办公/商务笔记本电脑Top 10排名
» Notebookcheck高端办公/商务笔记本电脑Top 10排名
» Notebookcheck工作站笔记本电脑Top 10排名
» Notebookcheck亚笔记本电脑Top 10排名
» Notebookcheck超级本产品Top 10排名
» Notebookcheck变形本产品Top 10排名
» Notebookcheck平板电脑Top 10排名
» Notebookcheck智能手机Top 10排名
» Notebookcheck评测过最出色的笔记本电脑屏幕
» Notebookcheck售价500欧元以下笔记本电脑Top 10排名
» Notebookcheck售价300欧元以下笔记本电脑Top 10排名
| SD Card Reader | |
| average JPG Copy Test (av. of 3 runs) | |
| Fujitsu LifeBook U9311X i7 LTE (AV Pro V60) | |
| Dell XPS 13 7390 2-in-1 Core i7 (Toshiba Exceria Pro M501 64 GB UHS-II) | |
| Fujitsu LifeBook U9310X (Toshiba Exceria Pro SDXC 64 GB UHS-II) | |
| Average of class Convertible (22.4 - 209, n=28, last 2 years) | |
| maximum AS SSD Seq Read Test (1GB) | |
| Dell XPS 13 7390 2-in-1 Core i7 (Toshiba Exceria Pro M501 64 GB UHS-II) | |
| Fujitsu LifeBook U9311X i7 LTE (AV Pro V60) | |
| Average of class Convertible (25.2 - 263, n=27, last 2 years) | |
| Fujitsu LifeBook U9310X (Toshiba Exceria Pro SDXC 64 GB UHS-II) | |
| Networking | |
| iperf3 transmit AX12 | |
| Lenovo ThinkPad X13 Yoga G2 | |
| Fujitsu LifeBook U9311X i7 LTE | |
| HP Elite Dragonfly Max | |
| Average Intel Wi-Fi 6 AX201 (49.8 - 1775, n=324) | |
| Fujitsu LifeBook U9310X | |
| Dell XPS 13 7390 2-in-1 Core i7 | |
| iperf3 receive AX12 | |
| Fujitsu LifeBook U9311X i7 LTE | |
| Lenovo ThinkPad X13 Yoga G2 | |
| HP Elite Dragonfly Max | |
| Average Intel Wi-Fi 6 AX201 (136 - 1743, n=324) | |
| Fujitsu LifeBook U9310X | |
| Dell XPS 13 7390 2-in-1 Core i7 | |

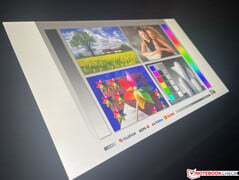
显示屏 - Lifebook配备16:9的IPS触摸屏
| |||||||||||||||||||||||||
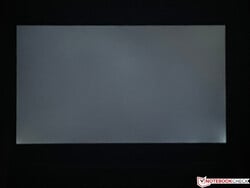
Brightness Distribution: 92 %
Center on Battery: 355 cd/m²
Contrast: 1123:1 (Black: 0.31 cd/m²)
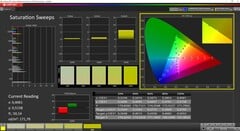
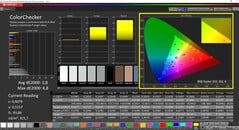
ΔE Color 2.8 | 0.5-29.43 Ø4.87, calibrated: 0.8
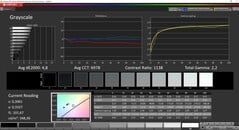
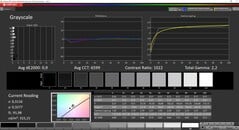
ΔE Greyscale 4.8 | 0.5-98 Ø5.1
68.8% AdobeRGB 1998 (Argyll 2.2.0 3D)
98.4% sRGB (Argyll 2.2.0 3D)
67.3% Display P3 (Argyll 2.2.0 3D)
Gamma: 2.2
| Fujitsu LifeBook U9311X i7 LTE LQ133M1JW48, IPS, 1920x1080, 13.3" | HP Elite Dragonfly Max InfoVision X133NVFL R0, IPS, 1920x1080, 13.3" | Lenovo ThinkPad X13 Yoga G2 LP133WQ1-SPF2, IPS LED, 2560x1600, 13.3" | Dell XPS 13 7390 2-in-1 Core i7 Sharp LQ134N1, IPS, 1920x1200, 13.4" | Fujitsu LifeBook U9310X LQ133M1JW48, IPS, 1920x1080, 13.3" | |
|---|---|---|---|---|---|
| Display | 1% | 3% | -2% | ||
| Display P3 Coverage | 67.3 | 68.3 1% | 69.9 4% | 66.4 -1% | |
| sRGB Coverage | 98.4 | 99.1 1% | 99.2 1% | 96.9 -2% | |
| AdobeRGB 1998 Coverage | 68.8 | 70.3 2% | 71.5 4% | 67.4 -2% | |
| Response Times | 21% | 15% | 375% | 2% | |
| Response Time Grey 50% / Grey 80% * | 61.2 ? | 44.8 ? 27% | 52 ? 15% | 47.6 ? 22% | 62.4 ? -2% |
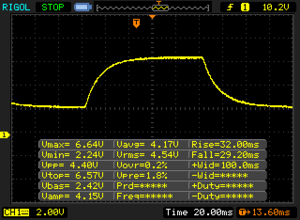
| Response Time Black / White * | 37.6 ? | 32 ? 15% | 32 ? 15% | 29.2 ? 22% | 34.4 ? 9% |
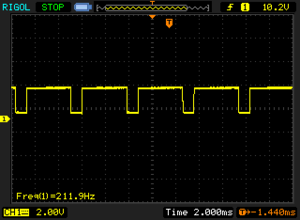
| PWM Frequency | 211.9 ? | 2500 ? 1080% | 211.9 ? 0% | ||
| Screen | 33% | 31% | 16% | 9% | |
| Brightness middle | 348 | 777.5 123% | 460 32% | 549.8 58% | 345 -1% |
| Brightness | 350 | 727 108% | 423 21% | 520 49% | 317 -9% |
| Brightness Distribution | 92 | 75 -18% | 85 -8% | 86 -7% | 86 -7% |
| Black Level * | 0.31 | 0.44 -42% | 0.33 -6% | 0.39 -26% | 0.24 23% |
| Contrast | 1123 | 1767 57% | 1394 24% | 1410 26% | 1438 28% |
| Colorchecker dE 2000 * | 2.8 | 1.62 42% | 1 64% | 2.12 24% | 2.7 4% |
| Colorchecker dE 2000 max. * | 6.8 | 5.26 23% | 1.5 78% | 3.66 46% | 4.2 38% |
| Colorchecker dE 2000 calibrated * | 0.8 | 1.32 -65% | 0.8 -0% | 1.37 -71% | 1 -25% |
| Greyscale dE 2000 * | 4.8 | 1.6 67% | 1.2 75% | 2.6 46% | 3.3 31% |
| Gamma | 2.2 100% | 2.2 100% | 2.26 97% | 2.3 96% | 2.31 95% |
| CCT | 6978 93% | 6538 99% | 6652 98% | 6884 94% | 7188 90% |
| Color Space (Percent of AdobeRGB 1998) | 72.3 | 64.4 | 65.4 | 62.4 | |
| Color Space (Percent of sRGB) | 94.8 | 99.12 | 99.7 | 96.9 | |
| Total Average (Program / Settings) | 27% /
31% | 16% /
22% | 131% /
85% | 3% /
6% |
* ... smaller is better
Display Response Times
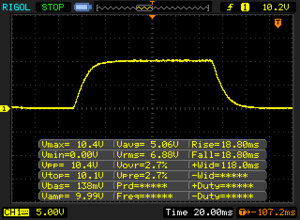
| ↔ Response Time Black to White | ||
|---|---|---|
| 37.6 ms ... rise ↗ and fall ↘ combined | ↗ 18.8 ms rise | |
| ↘ 18.8 ms fall | ||
| The screen shows slow response rates in our tests and will be unsatisfactory for gamers. In comparison, all tested devices range from 0.1 (minimum) to 240 (maximum) ms. » 95 % of all devices are better. This means that the measured response time is worse than the average of all tested devices (20.8 ms). | ||
| ↔ Response Time 50% Grey to 80% Grey | ||
| 61.2 ms ... rise ↗ and fall ↘ combined | ↗ 32 ms rise | |
| ↘ 29.2 ms fall | ||
| The screen shows slow response rates in our tests and will be unsatisfactory for gamers. In comparison, all tested devices range from 0.165 (minimum) to 636 (maximum) ms. » 96 % of all devices are better. This means that the measured response time is worse than the average of all tested devices (32.5 ms). | ||
Screen Flickering / PWM (Pulse-Width Modulation)
| Screen flickering / PWM detected | 211.9 Hz | ≤ 30 % brightness setting | |
The display backlight flickers at 211.9 Hz (worst case, e.g., utilizing PWM) Flickering detected at a brightness setting of 30 % and below. There should be no flickering or PWM above this brightness setting. The frequency of 211.9 Hz is relatively low, so sensitive users will likely notice flickering and experience eyestrain at the stated brightness setting and below. In comparison: 53 % of all tested devices do not use PWM to dim the display. If PWM was detected, an average of 8516 (minimum: 5 - maximum: 343500) Hz was measured. | |||
性能、排放和电池寿命
富士通使用快速的 酷睿i7-1185G7(Tiger Lake),它也支持vPro。理论上,这个处理器可以管理非常高的时钟频率(高达4.8 GHz),但这种潜力几乎没有得到利用。该处理器允许在短时间内消耗40瓦,但几秒钟后就只有22瓦了。因此,与以前的处理器相比,这里没有真正的优势。最大的优势是改进的集成显卡,现在可以用来做一下游戏。然而,与前代产品相比,在电池模式下性能仍然稳定。
总的来说,系统性能非常好,这也要归功于快速的PCIe-SSD(3.0 x4),设备实现输入没有明显的延迟。在我们的标准化延迟测试中,该测试设备也没有显示出任何限制。
在温度方面没有任何限制,但是风扇在负载期间启动得相当快,而且还能清楚地听到,特别是在CPU高负载期间,但在日常办公中通常保持停用状态。没有恼人的电子噪音,如线圈啸叫。扬声器相当弱,现在许多商务设备提供的功能要多得多。
在实际的WLAN测试中,电池寿命为7-8小时,这取决于亮度,比前代产品略差。其原因可能是电池模式下的性能,在U9311X中不再降低。
Cinebench R15 Multi Endurance test
Cinebench R20: CPU (Multi Core) | CPU (Single Core)
Cinebench R15: CPU Multi 64Bit | CPU Single 64Bit
Blender: v2.79 BMW27 CPU
7-Zip 18.03: 7z b 4 | 7z b 4 -mmt1
Geekbench 5.5: Multi-Core | Single-Core
HWBOT x265 Benchmark v2.2: 4k Preset
LibreOffice : 20 Documents To PDF
R Benchmark 2.5: Overall mean
| Cinebench R23 / Multi Core | |
| Average of class Convertible (2949 - 29063, n=64, last 2 years) | |
| Average Intel Core i7-1185G7 (3610 - 6383, n=24) | |
| Lenovo ThinkPad X13 Yoga G2 | |
| HP Elite Dragonfly Max | |
| Fujitsu LifeBook U9311X i7 LTE | |
| Cinebench R23 / Single Core | |
| Average of class Convertible (914 - 2163, n=64, last 2 years) | |
| Average Intel Core i7-1185G7 (1251 - 1532, n=24) | |
| HP Elite Dragonfly Max | |
| Lenovo ThinkPad X13 Yoga G2 | |
| Fujitsu LifeBook U9311X i7 LTE | |
| Cinebench R20 / CPU (Multi Core) | |
| Average of class Convertible (1124 - 11357, n=63, last 2 years) | |
| Average Intel Core i7-1185G7 (1425 - 2493, n=28) | |
| Dell XPS 13 7390 2-in-1 Core i7 | |
| Lenovo ThinkPad X13 Yoga G2 | |
| HP Elite Dragonfly Max | |
| Fujitsu LifeBook U9311X i7 LTE | |
| Fujitsu LifeBook U9310X | |
| Cinebench R20 / CPU (Single Core) | |
| Average of class Convertible (348 - 827, n=63, last 2 years) | |
| Average Intel Core i7-1185G7 (489 - 593, n=28) | |
| Lenovo ThinkPad X13 Yoga G2 | |
| HP Elite Dragonfly Max | |
| Fujitsu LifeBook U9311X i7 LTE | |
| Dell XPS 13 7390 2-in-1 Core i7 | |
| Fujitsu LifeBook U9310X | |
| Cinebench R15 / CPU Multi 64Bit | |
| Average of class Convertible (478 - 4830, n=66, last 2 years) | |
| Average Intel Core i7-1185G7 (617 - 1066, n=32) | |
| Lenovo ThinkPad X13 Yoga G2 | |
| Dell XPS 13 7390 2-in-1 Core i7 | |
| Fujitsu LifeBook U9311X i7 LTE | |
| HP Elite Dragonfly Max | |
| Fujitsu LifeBook U9310X | |
| Cinebench R15 / CPU Single 64Bit | |
| Average of class Convertible (149.8 - 317, n=63, last 2 years) | |
| Average Intel Core i7-1185G7 (168 - 230, n=27) | |
| Fujitsu LifeBook U9311X i7 LTE | |
| Lenovo ThinkPad X13 Yoga G2 | |
| Dell XPS 13 7390 2-in-1 Core i7 | |
| HP Elite Dragonfly Max | |
| Fujitsu LifeBook U9310X | |
| Blender / v2.79 BMW27 CPU | |
| Fujitsu LifeBook U9310X | |
| Lenovo ThinkPad X13 Yoga G2 | |
| HP Elite Dragonfly Max | |
| Fujitsu LifeBook U9311X i7 LTE | |
| Dell XPS 13 7390 2-in-1 Core i7 | |
| Average Intel Core i7-1185G7 (478 - 745, n=28) | |
| Average of class Convertible (107 - 1051, n=61, last 2 years) | |
| 7-Zip 18.03 / 7z b 4 | |
| Average of class Convertible (12977 - 121368, n=63, last 2 years) | |
| Average Intel Core i7-1185G7 (18812 - 27693, n=27) | |
| Dell XPS 13 7390 2-in-1 Core i7 | |
| Fujitsu LifeBook U9311X i7 LTE | |
| HP Elite Dragonfly Max | |
| Lenovo ThinkPad X13 Yoga G2 | |
| Fujitsu LifeBook U9310X | |
| 7-Zip 18.03 / 7z b 4 -mmt1 | |
| Average of class Convertible (3672 - 6540, n=63, last 2 years) | |
| Average Intel Core i7-1185G7 (3678 - 5507, n=27) | |
| HP Elite Dragonfly Max | |
| Lenovo ThinkPad X13 Yoga G2 | |
| Fujitsu LifeBook U9311X i7 LTE | |
| Dell XPS 13 7390 2-in-1 Core i7 | |
| Fujitsu LifeBook U9310X | |
| Geekbench 5.5 / Multi-Core | |
| Average of class Convertible (2188 - 22023, n=63, last 2 years) | |
| Average Intel Core i7-1185G7 (4620 - 5944, n=21) | |
| HP Elite Dragonfly Max | |
| Fujitsu LifeBook U9311X i7 LTE | |
| Lenovo ThinkPad X13 Yoga G2 | |
| Fujitsu LifeBook U9310X | |
| Geekbench 5.5 / Single-Core | |
| Average of class Convertible (806 - 2275, n=63, last 2 years) | |
| HP Elite Dragonfly Max | |
| Average Intel Core i7-1185G7 (1398 - 1626, n=21) | |
| Lenovo ThinkPad X13 Yoga G2 | |
| Fujitsu LifeBook U9311X i7 LTE | |
| Fujitsu LifeBook U9310X | |
| HWBOT x265 Benchmark v2.2 / 4k Preset | |
| Average of class Convertible (3.43 - 36.2, n=63, last 2 years) | |
| Average Intel Core i7-1185G7 (5.02 - 8.13, n=27) | |
| Dell XPS 13 7390 2-in-1 Core i7 | |
| Fujitsu LifeBook U9311X i7 LTE | |
| HP Elite Dragonfly Max | |
| Lenovo ThinkPad X13 Yoga G2 | |
| Fujitsu LifeBook U9310X | |
| LibreOffice / 20 Documents To PDF | |
| Fujitsu LifeBook U9310X | |
| Average of class Convertible (42.7 - 84.3, n=62, last 2 years) | |
| Fujitsu LifeBook U9311X i7 LTE | |
| Average Intel Core i7-1185G7 (41.3 - 61.7, n=26) | |
| HP Elite Dragonfly Max | |
| Lenovo ThinkPad X13 Yoga G2 | |
| R Benchmark 2.5 / Overall mean | |
| Fujitsu LifeBook U9310X | |
| Lenovo ThinkPad X13 Yoga G2 | |
| Fujitsu LifeBook U9311X i7 LTE | |
| HP Elite Dragonfly Max | |
| Average Intel Core i7-1185G7 (0.55 - 0.615, n=27) | |
| Average of class Convertible (0.3985 - 0.84, n=62, last 2 years) | |
* ... smaller is better
| PCMark 10 / Score | |
| Average of class Convertible (3229 - 9125, n=61, last 2 years) | |
| Lenovo ThinkPad X13 Yoga G2 | |
| Average Intel Core i7-1185G7, Intel Iris Xe Graphics G7 96EUs (4746 - 5561, n=20) | |
| HP Elite Dragonfly Max | |
| Fujitsu LifeBook U9311X i7 LTE | |
| Dell XPS 13 7390 2-in-1 Core i7 | |
| Fujitsu LifeBook U9310X | |
| DPC Latencies / LatencyMon - interrupt to process latency (max), Web, Youtube, Prime95 | |
| HP Elite Dragonfly Max | |
| Fujitsu LifeBook U9310X | |
| Fujitsu LifeBook U9311X i7 LTE | |
| Lenovo ThinkPad X13 Yoga G2 | |
* ... smaller is better
| Fujitsu LifeBook U9311X i7 LTE Toshiba XG6 KXG6AZNV1T02 | HP Elite Dragonfly Max Toshiba XG6 KXG60ZNV512G | Lenovo ThinkPad X13 Yoga G2 WDC PC SN730 SDBQNTY-1T00 | Dell XPS 13 7390 2-in-1 Core i7 Toshiba BG4 KBG40ZPZ512G | Fujitsu LifeBook U9310X Toshiba KBG40ZNS512G NVMe | Average Toshiba XG6 KXG6AZNV1T02 | Average of class Convertible | |
|---|---|---|---|---|---|---|---|
| CrystalDiskMark 5.2 / 6 | -7% | 18% | -11% | -9% | 17% | 33% | |
| Write 4K | 114.8 | 99 -14% | 170.1 48% | 106.7 -7% | 134.2 17% | 162.2 ? 41% | 139.7 ? 22% |
| Read 4K | 49.53 | 52.3 6% | 53.4 8% | 49.94 1% | 53.4 8% | 54.8 ? 11% | 63.9 ? 29% |
| Write Seq | 1833 | 1765 -4% | 1866 2% | 1223 -33% | 1216 -34% | 1745 ? -5% | 2711 ? 48% |
| Read Seq | 2260 | 2065 -9% | 2077 -8% | 1801 -20% | 1291 -43% | 1941 ? -14% | 2883 ? 28% |
| Write 4K Q32T1 | 323.5 | 291.7 -10% | 495.5 53% | 325.3 1% | 401.5 24% | 493 ? 52% | 385 ? 19% |
| Read 4K Q32T1 | 340.5 | 314 -8% | 460.7 35% | 551 62% | 491.4 44% | 542 ? 59% | 486 ? 43% |
| Write Seq Q32T1 | 3048 | 2549 -16% | 3015 -1% | 1224 -60% | 1224 -60% | 2961 ? -3% | 3729 ? 22% |
| Read Seq Q32T1 | 3282 | 3282 0% | 3407 4% | 2350 -28% | 2314 -29% | 3190 ? -3% | 5089 ? 55% |
| 3DMark - 1920x1080 Fire Strike Graphics | |
| Average of class Convertible (1185 - 29684, n=63, last 2 years) | |
| Fujitsu LifeBook U9311X i7 LTE | |
| Average Intel Iris Xe Graphics G7 96EUs (2286 - 6624, n=218) | |
| Lenovo ThinkPad X13 Yoga G2 | |
| HP Elite Dragonfly Max | |
| Dell XPS 13 7390 2-in-1 Core i7 | |
| Fujitsu LifeBook U9310X | |
| low | med. | high | ultra | |
|---|---|---|---|---|
| GTA V (2015) | 82.9 | 68.7 | 24.5 | 11.2 |
| The Witcher 3 (2015) | 86 | 56 | 30 | 13.1 |
| Dota 2 Reborn (2015) | 81.2 | 61.8 | 47.3 | 44.4 |
| Final Fantasy XV Benchmark (2018) | 43.6 | 24.2 | 16.5 | |
| X-Plane 11.11 (2018) | 33.7 | 29.8 | ||
| Strange Brigade (2018) | 87 | 39 | 32 | 26 |
| F1 2020 (2020) | 87 | 46 | 32 | 22 |
噪声排放
Noise Level
| Idle |
| 23.5 / 23.5 / 28 dB(A) |
| Load |
| 35 / 38.5 dB(A) |
 | ||
30 dB silent 40 dB(A) audible 50 dB(A) loud |
||
min: | ||
温度
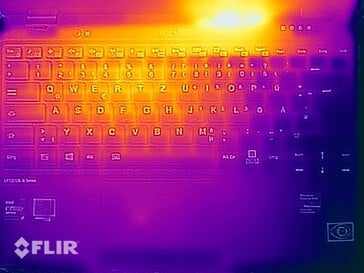
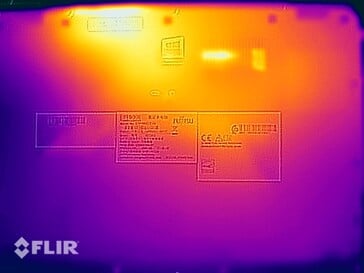
(±) The maximum temperature on the upper side is 42.1 °C / 108 F, compared to the average of 35.3 °C / 96 F, ranging from 19.6 to 60 °C for the class Convertible.
(-) The bottom heats up to a maximum of 46.7 °C / 116 F, compared to the average of 36.8 °C / 98 F
(+) In idle usage, the average temperature for the upper side is 24.4 °C / 76 F, compared to the device average of 30.2 °C / 86 F.
(±) Playing The Witcher 3, the average temperature for the upper side is 33.2 °C / 92 F, compared to the device average of 30.2 °C / 86 F.
(+) The palmrests and touchpad are cooler than skin temperature with a maximum of 26.9 °C / 80.4 F and are therefore cool to the touch.
(±) The average temperature of the palmrest area of similar devices was 28 °C / 82.4 F (+1.1 °C / 2 F).
演讲者
Fujitsu LifeBook U9311X i7 LTE audio analysis
(±) | speaker loudness is average but good (78.1 dB)
Bass 100 - 315 Hz
(-) | nearly no bass - on average 23.4% lower than median
(±) | linearity of bass is average (10.6% delta to prev. frequency)
Mids 400 - 2000 Hz
(±) | higher mids - on average 6.8% higher than median
(±) | linearity of mids is average (7.7% delta to prev. frequency)
Highs 2 - 16 kHz
(±) | higher highs - on average 5.6% higher than median
(+) | highs are linear (6.4% delta to prev. frequency)
Overall 100 - 16.000 Hz
(±) | linearity of overall sound is average (24.4% difference to median)
Compared to same class
» 73% of all tested devices in this class were better, 6% similar, 20% worse
» The best had a delta of 6%, average was 20%, worst was 57%
Compared to all devices tested
» 72% of all tested devices were better, 6% similar, 22% worse
» The best had a delta of 4%, average was 24%, worst was 134%
HP Elite Dragonfly Max audio analysis
(+) | speakers can play relatively loud (87.1 dB)
Bass 100 - 315 Hz
(±) | reduced bass - on average 11.4% lower than median
(±) | linearity of bass is average (11.8% delta to prev. frequency)
Mids 400 - 2000 Hz
(+) | balanced mids - only 2.7% away from median
(+) | mids are linear (3.1% delta to prev. frequency)
Highs 2 - 16 kHz
(+) | balanced highs - only 4.4% away from median
(+) | highs are linear (5.4% delta to prev. frequency)
Overall 100 - 16.000 Hz
(+) | overall sound is linear (10.2% difference to median)
Compared to same class
» 6% of all tested devices in this class were better, 2% similar, 93% worse
» The best had a delta of 6%, average was 20%, worst was 57%
Compared to all devices tested
» 4% of all tested devices were better, 1% similar, 95% worse
» The best had a delta of 4%, average was 24%, worst was 134%
能源消耗
| Off / Standby | |
| Idle | |
| Load |
|
Key:
min: | |
Power consumption Witcher 3 / Stress test
电池寿命
| Battery Runtime | |
| WiFi Websurfing | |
| Fujitsu LifeBook U9310X | |
| HP Elite Dragonfly Max | |
| Average of class Convertible (305 - 1102, n=65, last 2 years) | |
| Lenovo ThinkPad X13 Yoga G2 | |
| Dell XPS 13 7390 2-in-1 Core i7 | |
| Fujitsu LifeBook U9311X i7 LTE | |
| WiFi Websurfing max. Brightness | |
| Fujitsu LifeBook U9310X | |
| Average of class Convertible (244 - 568, n=24, last 2 years) | |
| Fujitsu LifeBook U9311X i7 LTE | |
| Lenovo ThinkPad X13 Yoga G2 | |
Pros
Cons
结论--富士通的敞篷车需要重新设计
从去年的飞跃 的飞跃,从去年的Lifebook U9310X(或更早的 U939X)到现在的Lifebook U9311X的飞跃是相当小的。富士通确实使用了英特尔当前的Tiger Lake 处理器,两个USB-C端口现在支持Thunderbolt 4,但其他一切都保持不变。
镁合金外壳仍然很轻,并提供广泛的端口,但16:9的屏幕包括宽大的屏幕边框以及小的触摸板显示了外壳的年龄。键盘也不得不向其他商务设备认输。
Lifebook U9311X仍然是一个紧凑的移动伴侣,包括LTE,但你会慢慢注意到设计的年龄。我们希望看到下一代的16:10屏幕和更好的输入设备。
总而言之,U9311X自然仍然是一个具有良好连接性的极致移动伴侣。特别是在显示和输入设备方面,竞争对手如 联想ThinkPad X13 Yoga G2或 惠普的EliteBook Dragonfly Max往往能提供更多。此外,性能产量有点令人失望,i7-1185G7的全部潜力根本无法发挥出来;采用酷睿i5的廉价版本在实践中应该没有什么大的缺点。
价格和可用性
我们的测试配置可在数码港购买,价格为2330欧元(~2,735美元)或,黑色型号为2,280欧元(~2,675美元).一个更便宜的配置是Core i5处理器和512GB SSD,售价为1780欧元(约合人民币2090元)。.
Fujitsu LifeBook U9311X i7 LTE
- 09/22/2021 v7 (old)
Andreas Osthoff


