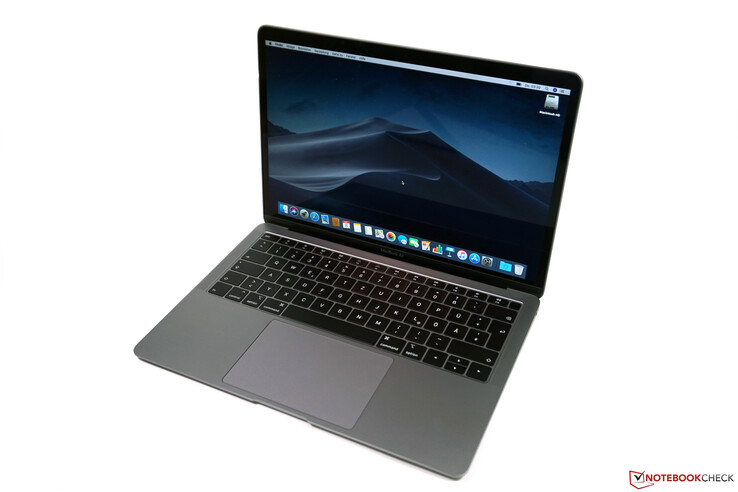
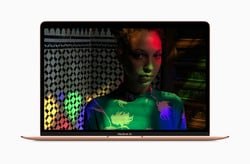
苹果MacBook Air 2018(i5,256 GB版)笔记本电脑评测
» Notebookcheck多媒体笔记本电脑Top 10排名
» Notebookcheck游戏笔记本电脑Top 10排名
» Notebookcheck低价办公/商务笔记本电脑Top 10排名
» Notebookcheck高端办公/商务笔记本电脑Top 10排名
» Notebookcheck工作站笔记本电脑Top 10排名
» Notebookcheck亚笔记本电脑Top 10排名
» Notebookcheck超级本产品Top 10排名
» Notebookcheck变形本产品Top 10排名
» Notebookcheck平板电脑Top 10排名
» Notebookcheck智能手机Top 10排名
» Notebookcheck评测过最出色的笔记本电脑屏幕
» Notebookcheck售价500欧元以下笔记本电脑Top 10排名
» Notebookcheck售价300欧元以下笔记本电脑Top 10排名
| |||||||||||||||||||||||||
Brightness Distribution: 95 %
Center on Battery: 321 cd/m²
Contrast: 1103:1 (Black: 0.29 cd/m²)
ΔE Color 1.2 | 0.5-29.43 Ø4.87, calibrated: 0.5
ΔE Greyscale 0.8 | 0.5-98 Ø5.1
96% sRGB (Argyll 1.6.3 3D)
62.1% AdobeRGB 1998 (Argyll 1.6.3 3D)
69.8% AdobeRGB 1998 (Argyll 2.2.0 3D)
96.1% sRGB (Argyll 2.2.0 3D)
67.8% Display P3 (Argyll 2.2.0 3D)
Gamma: 2.2
| Apple MacBook Air 2018 APPA039, , 2560x1600, 13.3" | Apple MacBook Pro 13 2017 APPA033, , 2560x1600, 13.3" | Dell XPS 13 9370 i5 UHD ID: Sharp SHP148B, Name: LQ133D1, Dell P/N: 8XDHY, , 3840x2160, 13.3" | Asus ZenBook S UX391U AUO B133HAN04.9, , 1920x1080, 13.3" | HP Envy 13-ah0003ng M133NVF3 R0, , 1920x1080, 13.3" | Huawei Matebook X Pro i5 Tianma XM, , 3000x2000, 13.9" | Microsoft Surface Laptop 2-LQN-00004 VVX14T092N00, , 2256x1504, 13.5" | Apple MacBook 12 2017 APPA027, , 2304x1440, 12" | |
|---|---|---|---|---|---|---|---|---|
| Display | 25% | 1% | -6% | -17% | -2% | -1% | ||
| Display P3 Coverage | 67.8 | 99.2 46% | 68.9 2% | 64.4 -5% | 54.8 -19% | 65.9 -3% | 68 0% | |
| sRGB Coverage | 96.1 | 99.9 4% | 98.4 2% | 90.5 -6% | 82.5 -14% | 95.2 -1% | 94.7 -1% | |
| AdobeRGB 1998 Coverage | 69.8 | 87.1 25% | 69.5 0% | 65.2 -7% | 56.6 -19% | 67.6 -3% | 69.2 -1% | |
| Response Times | -6% | -72% | -9% | -21% | 4% | -71% | -2% | |
| Response Time Grey 50% / Grey 80% * | 39.6 ? | 42.8 ? -8% | 67.2 ? -70% | 44.8 ? -13% | 31 ? 22% | 40.4 ? -2% | 69.2 ? -75% | 40.8 ? -3% |
| Response Time Black / White * | 28 ? | 28.8 ? -3% | 41.6 ? -49% | 29.2 ? -4% | 24 ? 14% | 25.6 ? 9% | 46.4 ? -66% | 29.2 ? -4% |
| PWM Frequency | 113600 ? | 2500 ? -98% | 1000 ? -99% | 116000 2% | ||||
| Screen | -4% | -58% | -143% | -25% | -124% | -73% | ||
| Brightness middle | 320 | 588 84% | 496.4 55% | 299 -7% | 289 -10% | 442.7 38% | 392 23% | |
| Brightness | 315 | 561 78% | 469 49% | 300 -5% | 310 -2% | 428 36% | 390 24% | |
| Brightness Distribution | 95 | 92 -3% | 84 -12% | 92 -3% | 85 -11% | 84 -12% | 89 -6% | |
| Black Level * | 0.29 | 0.45 -55% | 0.5 -72% | 0.26 10% | 0.23 21% | 0.31 -7% | 0.24 17% | |
| Contrast | 1103 | 1307 18% | 993 -10% | 1150 4% | 1257 14% | 1428 29% | 1633 48% | |
| Colorchecker dE 2000 * | 1.2 | 1.7 -42% | 2.9 -142% | 5.6 -367% | 1.64 -37% | 2.24 -87% | 3.2 -167% | |
| Colorchecker dE 2000 max. * | 3.2 | 3.5 -9% | 5.26 -64% | 9.1 -184% | 3.31 -3% | 7.19 -125% | 6.3 -97% | |
| Colorchecker dE 2000 calibrated * | 0.5 | 2.6 -420% | 0.99 -98% | 1.11 -122% | 1.4 -180% | |||
| Greyscale dE 2000 * | 0.8 | 1.9 -138% | 3.9 -388% | 5.5 -588% | 1.71 -114% | 9.7 -1113% | 4.5 -463% | |
| Gamma | 2.2 100% | 2.33 94% | 2.066 106% | 2.47 89% | 2.32 95% | 1.42 155% | 2.2 100% | |
| CCT | 6548 99% | 6738 96% | 7169 91% | 7533 86% | 6291 103% | 6227 104% | 7556 86% | |
| Color Space (Percent of AdobeRGB 1998) | 62.1 | 77.92 25% | 63.9 3% | 58.9 -5% | 52 -16% | 61.6 -1% | 63.9 3% | |
| Color Space (Percent of sRGB) | 96 | 99.94 4% | 98.2 2% | 90.3 -6% | 82 -15% | 95 -1% | 95 -1% | |
| Total Average (Program / Settings) | 5% /
2% | -43% /
-50% | -53% /
-100% | -21% /
-23% | -41% /
-85% | -48% /
-59% | -2% /
-2% |
* ... smaller is better
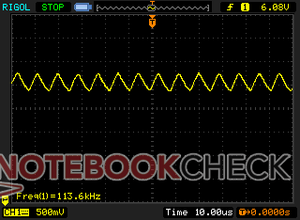
Screen Flickering / PWM (Pulse-Width Modulation)
| Screen flickering / PWM detected | 113600 Hz | ≤ 75 % brightness setting | |
The display backlight flickers at 113600 Hz (worst case, e.g., utilizing PWM) Flickering detected at a brightness setting of 75 % and below. There should be no flickering or PWM above this brightness setting. The frequency of 113600 Hz is quite high, so most users sensitive to PWM should not notice any flickering. In comparison: 53 % of all tested devices do not use PWM to dim the display. If PWM was detected, an average of 8512 (minimum: 5 - maximum: 343500) Hz was measured. | |||
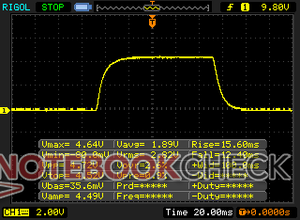
Display Response Times
| ↔ Response Time Black to White | ||
|---|---|---|
| 28 ms ... rise ↗ and fall ↘ combined | ↗ 15.6 ms rise | |
| ↘ 12.4 ms fall | ||
| The screen shows relatively slow response rates in our tests and may be too slow for gamers. In comparison, all tested devices range from 0.1 (minimum) to 240 (maximum) ms. » 69 % of all devices are better. This means that the measured response time is worse than the average of all tested devices (20.8 ms). | ||
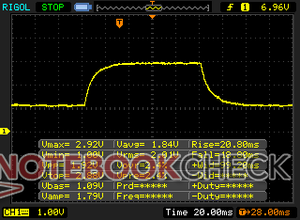
| ↔ Response Time 50% Grey to 80% Grey | ||
| 39.6 ms ... rise ↗ and fall ↘ combined | ↗ 20.8 ms rise | |
| ↘ 18.8 ms fall | ||
| The screen shows slow response rates in our tests and will be unsatisfactory for gamers. In comparison, all tested devices range from 0.165 (minimum) to 636 (maximum) ms. » 58 % of all devices are better. This means that the measured response time is worse than the average of all tested devices (32.5 ms). | ||
Noise Level
| Idle |
| 28.5 / 28.5 / 28.5 dB(A) |
| Load |
| 30 / 41.8 dB(A) |
 | ||
30 dB silent 40 dB(A) audible 50 dB(A) loud |
||
min: | ||
Apple MacBook Air 2018 audio analysis
(±) | speaker loudness is average but good (75 dB)
Bass 100 - 315 Hz
(±) | reduced bass - on average 8.1% lower than median
(±) | linearity of bass is average (10% delta to prev. frequency)
Mids 400 - 2000 Hz
(+) | balanced mids - only 2.9% away from median
(+) | mids are linear (5.6% delta to prev. frequency)
Highs 2 - 16 kHz
(+) | balanced highs - only 2.2% away from median
(+) | highs are linear (4.5% delta to prev. frequency)
Overall 100 - 16.000 Hz
(+) | overall sound is linear (12.3% difference to median)
Compared to same class
» 15% of all tested devices in this class were better, 4% similar, 81% worse
» The best had a delta of 5%, average was 19%, worst was 53%
Compared to all devices tested
» 9% of all tested devices were better, 2% similar, 89% worse
» The best had a delta of 4%, average was 24%, worst was 134%
| Apple MacBook Air 2018 i5-8210Y, UHD Graphics 617, 50.3 Wh | Apple MacBook Pro 13 2017 i5-7360U, Iris Plus Graphics 640, 54.5 Wh | Apple MacBook Air 13.3" 1.8 GHz (2017) 5350U, HD Graphics 6000, 54 Wh | Apple MacBook 12 2017 m3-7Y32, HD Graphics 615, 41.4 Wh | Dell XPS 13 9370 i5 UHD i5-8250U, UHD Graphics 620, 52 Wh | Asus ZenBook S UX391U i5-8550U, UHD Graphics 620, 50 Wh | Microsoft Surface Laptop 2-LQN-00004 i5-8250U, UHD Graphics 620, 45 Wh | HP Envy 13-ah0003ng i5-8550U, GeForce MX150, 53.2 Wh | Huawei Matebook X Pro i5 i5-8250U, GeForce MX150, 57.4 Wh | Average of class Subnotebook | |
|---|---|---|---|---|---|---|---|---|---|---|
| Battery Runtime | ||||||||||
| WiFi v1.3 | 668 | 681 2% | 638 -4% | 540 -19% | 408 -39% | 491 -26% | 543 -19% | 481 -28% | 557 -17% | 757 ? 13% |
相信很多买家已经等了这款全新MacBook Air许多年。重新设计最大的亮点就是屏幕,相比老款MacBook Air,新款的屏幕在分辨率上得到了很大的提升,然而在亮度、色域和质量上仍然比不过更贵的MacBook Pro,苹果的原厂校色值得称赞,所有的测量值基本上都在标准范围内。新MacBook Air采用了亮面屏,这并不新奇,但与上一代相比,新款更加引人注目。
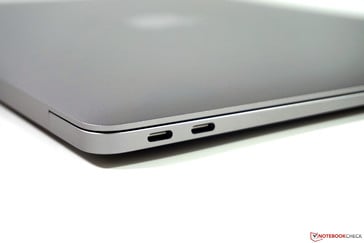
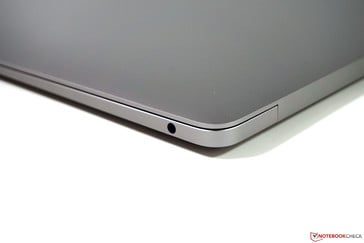
新设计的外壳给我们留下了很好的印象,但是与MacBook Pro 13相比,Air并没有便携性上的明显优势。它们的占用面积相同,而Air的后部甚至更后;重量差异也只有100克,很难成为购买的理由。如果你想要最小巧的苹果笔记本,MacBook 12仍然是最佳选择。
我们最初的Wi-Fi续航测试得出了11-12小时的优秀结果,但是再次充电花费的时间较长。
处理器在一开始的跑分中没有给我们留下好的印象,因为与MacBook 12和老款Air相比,性能几乎没有提升。不过即使在长时间使用下,新Air仍然能保持同样的性能水平,只是风扇会比较响。我们不禁发问,对于日常使用来说,性能是否足够?是的,目前来说的确如此,但是,Air的竞品们均采用了性能更强的处理器,甚至有着战未来的能力。
这就回到了我们当初的问题,那就是,新款Air在苹果众多MacBook产品阵容中是否显得多余?稍加思考我们就能理解为什么今年苹果没有更新MacBook Pro 13(改进的键盘,Touch-ID,TrueTone和更快的处理器)。因为如果更新了,买家就没有什么理由去购买新的Air。但即使没有更新Pro 13,较低的价格基本上还是新Air的唯一优势。
下一次更新将包括噪音测试,我们还会看看苹果是否真的改善了扬声器性能。


