

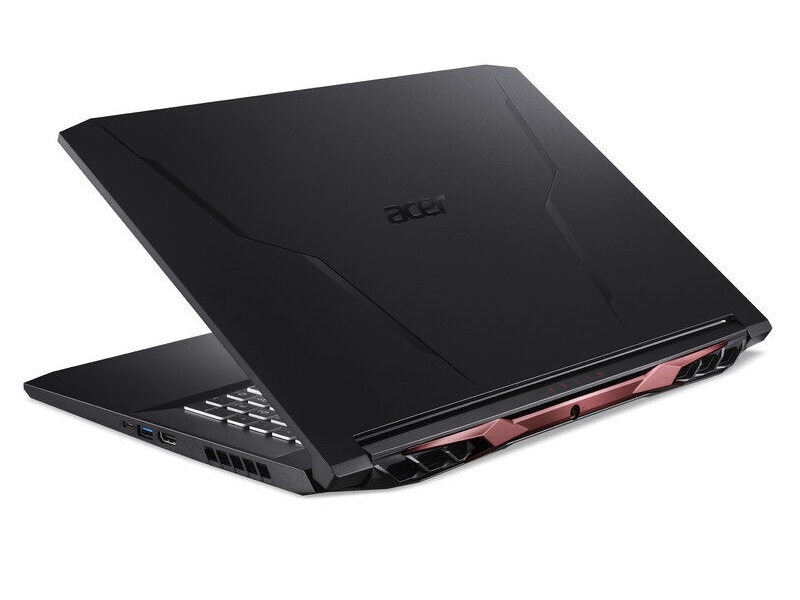
Acer Nitro 5 AN517-53 review: Affordable gaming laptop with RTX 3050 ↺

宏碁Nitro 5由于其通常良好的性价比而非常受欢迎,存在各种CPU和GPU的配置。我们采取了其中一个最便宜的型号,AN517-53-54DQ,并通过它的步伐。这款17英寸的机型,在(虚拟)柜台前徘徊,价格略低于1000欧元(约1180美元),可以依靠英特尔目前虎湖一代的四核处理器,更确切地说,是 酷睿i5-11300H.
苛刻的图形计算(该笔记本支持Nvidia的Optimus技术)是由 GeForce RTX 3050笔记本GPU,这是一个基于Nvidia安培架构的全新中端芯片。操作系统(Windows 10 Home 64位)安装在一个M.2格式的512GB NVMe SSD上。显示屏是哑光IPS面板,像素为1,920 x 1,080,频率为144 Hz。
当涉及到工作内存时,购买者将不得不做出一些让步。安装的8GB DDR4内存只有单级,而且只能在单通道模式下运行,这有时会花费更多,有时会导致性能降低,这取决于(3D)应用。
Nitro 5 AN517-53-54DQ的竞争对手包括其他经济实惠的17英寸游戏机,配备四核CPU和中档GPU,如 联想Legion 5 17IMH05,以及 微星GF75 Thin 10SCXR和 华硕TUF FX705DT-AU068T,它们都仍然配备了旧的 GeForce GTX 1650,即RTX 3050的前身。我们还比较了惠普Omen 15-ek0456ng配备的 GeForce GTX 1660 Ti进行了测试。
Possible competitors in comparison
Rating | Date | Model | Weight | Height | Size | Resolution | Price |
|---|---|---|---|---|---|---|---|
| 81.1 % v7 (old) | 08 / 2021 | Acer Nitro 5 AN517-53-54DQ i5-11300H, GeForce RTX 3050 4GB Laptop GPU | 2.6 kg | 25 mm | 17.30" | 1920x1080 | |
| 82.1 % v7 (old) | 10 / 2020 | HP Omen 15-ek0456ng i5-10300H, GeForce GTX 1660 Ti Mobile | 2.1 kg | 32 mm | 15.60" | 1920x1080 | |
| 81.9 % v7 (old) | 12 / 2020 | Lenovo Legion 5 17IMH05 i5-10300H, GeForce GTX 1650 Mobile | 2.9 kg | 26.2 mm | 17.30" | 1920x1080 | |
| 78.5 % v7 (old) | 12 / 2021 | MSI GF75 Thin 10SCXR i5-10300H, GeForce GTX 1650 Mobile | 2.2 kg | 23.1 mm | 17.30" | 1920x1080 | |
| 77.8 % v7 (old) | Asus TUF FX705DT-AU068T R5 3550H, GeForce GTX 1650 Mobile | 2.7 kg | 26.6 mm | 17.30" | 1920x1080 |
由于该机箱与最近评测的宏碁Nitro 5 AN517-41-R5Z7基本相同,我们将不在本文中更详细地介绍机箱、设备(接口等)和输入设备。你可以在以下文章中找到相应的信息 链接的评论.唯一引人注目的变化是关于键盘的。Nitro 5 AN517-53-54DQ提供的不是白色字体和RGB照明的键盘,而是一个红色的模型(包括字体和照明)。

沟通
| Networking | |
| iperf3 transmit AX12 | |
| Acer Nitro 5 AN517-53-54DQ | |
| Average Killer Wi-Fi 6 AX1650i 160MHz Wireless Network Adapter (201NGW) (758 - 1514, n=10) | |
| Lenovo Legion 5 17IMH05 | |
| MSI GF75 Thin 10SCXR | |
| HP Omen 15-ek0456ng | |
| Asus TUF FX705DT-AU068T | |
| iperf3 receive AX12 | |
| Lenovo Legion 5 17IMH05 | |
| Acer Nitro 5 AN517-53-54DQ | |
| Average Killer Wi-Fi 6 AX1650i 160MHz Wireless Network Adapter (201NGW) (887 - 1670, n=10) | |
| MSI GF75 Thin 10SCXR | |
| HP Omen 15-ek0456ng | |
| Asus TUF FX705DT-AU068T | |
网络摄像头


显示 - 144赫兹,但黑暗和无色。
尽管144赫兹的面板与Nitro 5 AN517-41-R5Z7相匹配,但确定的数值在某些地方略有偏差。这是一个典型的现象,因为在系列生产中总是存在一定的波动。
| |||||||||||||||||||||||||
Brightness Distribution: 83 %
Center on Battery: 286 cd/m²
Contrast: 1243:1 (Black: 0.23 cd/m²)
ΔE Color 4.92 | 0.5-29.43 Ø4.87, calibrated: 4.73
ΔE Greyscale 1.9 | 0.5-98 Ø5.1
37.9% AdobeRGB 1998 (Argyll 2.2.0 3D)
55% sRGB (Argyll 2.2.0 3D)
36.7% Display P3 (Argyll 2.2.0 3D)
Gamma: 2.175
| Acer Nitro 5 AN517-53-54DQ BOE NV173FHM-NX4 (BOE09B4), IPS, 1920x1080, 17.3" | HP Omen 15-ek0456ng LGD05FE, IPS, 1920x1080, 15.6" | Lenovo Legion 5 17IMH05 AU Optronics B173HAN04.3, IPS, 1920x1080, 17.3" | MSI GF75 Thin 10SCXR AU Optronics B173HAN04.7, IPS, 1920x1080, 17.3" | Asus TUF FX705DT-AU068T AU Optronics B173HAN04.2, IPS, 1920x1080, 17.3" | |
|---|---|---|---|---|---|
| Display | 85% | 7% | 67% | ||
| Display P3 Coverage | 36.7 | 69.4 89% | 39.46 8% | 62.3 70% | |
| sRGB Coverage | 55 | 97.1 77% | 58.4 6% | 89.1 62% | |
| AdobeRGB 1998 Coverage | 37.9 | 71.2 88% | 40.77 8% | 63.7 68% | |
| Response Times | 36% | -52% | -39% | -63% | |
| Response Time Grey 50% / Grey 80% * | 24.8 ? | 17 ? 31% | 38.4 ? -55% | 34 ? -37% | 41 ? -65% |
| Response Time Black / White * | 18.8 ? | 11 ? 41% | 28 ? -49% | 26.4 ? -40% | 30 ? -60% |
| PWM Frequency | |||||
| Screen | 18% | -5% | -21% | 6% | |
| Brightness middle | 286 | 314 10% | 326 14% | 251.2 -12% | 316 10% |
| Brightness | 261 | 293 12% | 304 16% | 242 -7% | 294 13% |
| Brightness Distribution | 83 | 87 5% | 89 7% | 92 11% | 84 1% |
| Black Level * | 0.23 | 0.22 4% | 0.25 -9% | 0.34 -48% | 0.32 -39% |
| Contrast | 1243 | 1427 15% | 1304 5% | 739 -41% | 988 -21% |
| Colorchecker dE 2000 * | 4.92 | 2.51 49% | 4.42 10% | 4.5 9% | 3.39 31% |
| Colorchecker dE 2000 max. * | 19.29 | 4.42 77% | 9.44 51% | 20 -4% | 5.56 71% |
| Colorchecker dE 2000 calibrated * | 4.73 | 1.71 64% | 1.53 68% | 3.91 17% | 2.14 55% |
| Greyscale dE 2000 * | 1.9 | 3.26 -72% | 5.8 -205% | 4 -111% | 3.17 -67% |
| Gamma | 2.175 101% | 2.42 91% | 2.261 97% | 2.25 98% | 2.39 92% |
| CCT | 6782 96% | 6150 106% | 6822 95% | 5882 111% | 7098 92% |
| Color Space (Percent of AdobeRGB 1998) | 71 | 37.3 | 51 | ||
| Color Space (Percent of sRGB) | 93 | 58.1 | 89 | ||
| Total Average (Program / Settings) | 27% /
21% | 9% /
8% | -18% /
-17% | 3% /
9% |
* ... smaller is better
虽然我们的测试设备的黑值(0.23cd/m²)和对比度(1,243:1)令人信服,但亮度并不惊人。平均261cd/m²的亮度对于大多数室内区域来说是足够的,但是17英寸的设备在更明亮的地方(温室、露台等)明显缺乏亮度。我们期望至少有300cd/m²的平均亮度,即使是对于一个经济型的游戏者。


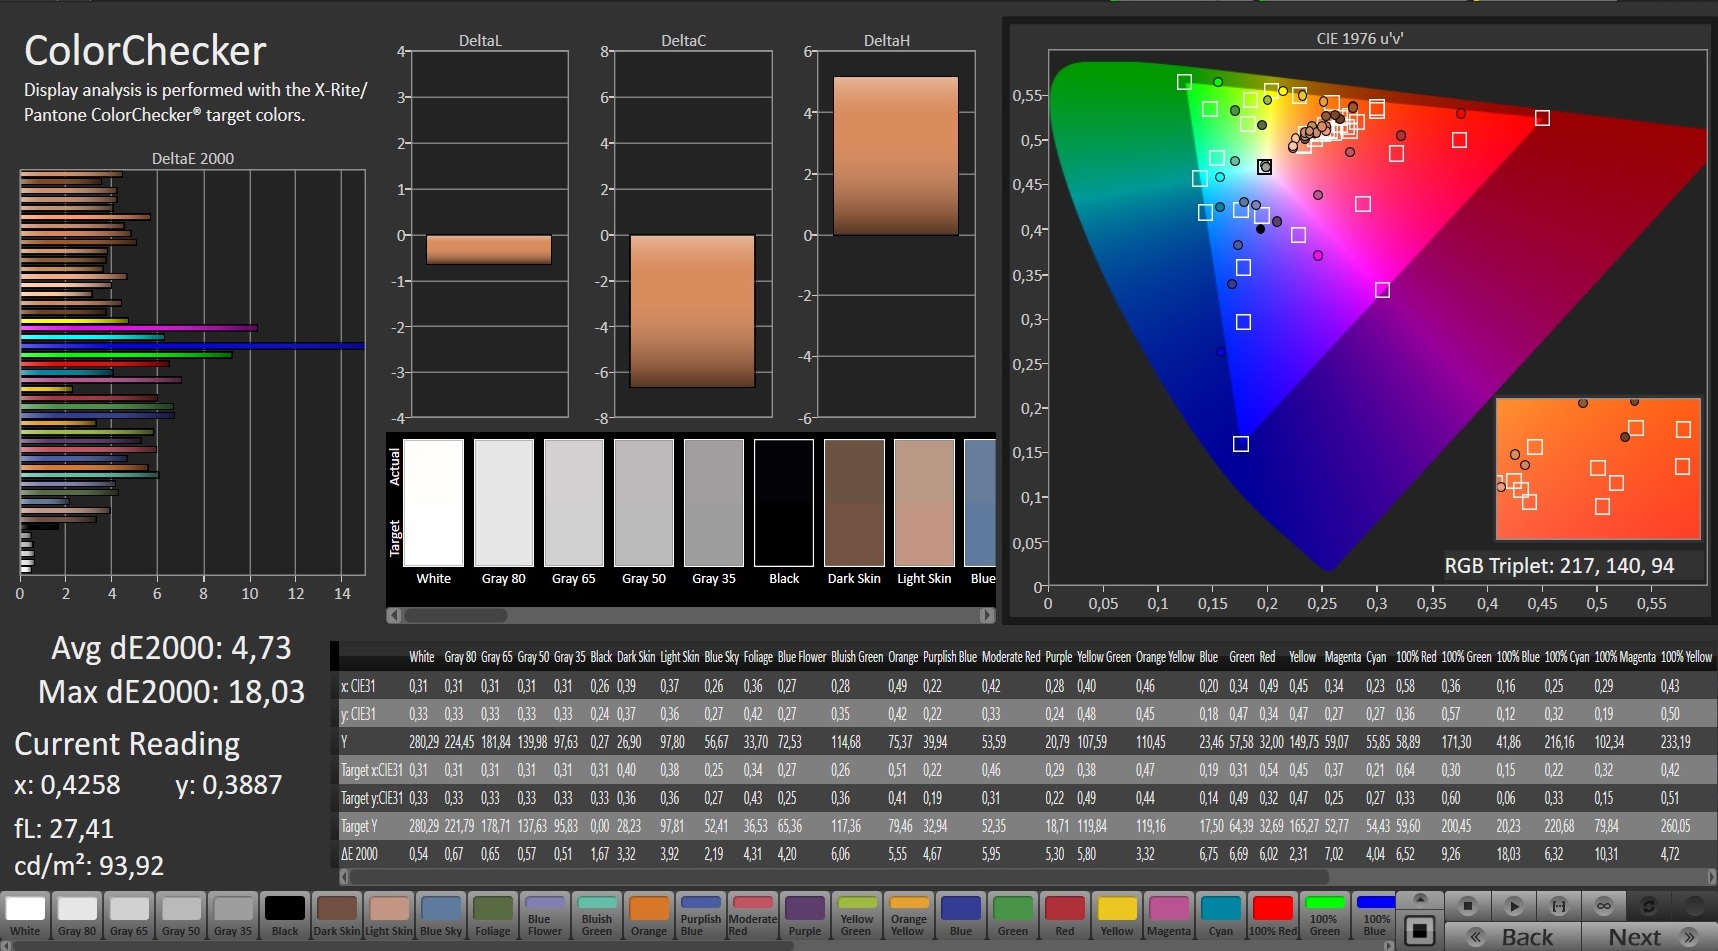
然而,色彩空间被证明是最大的弱点。55%的sRGB覆盖率和大约38%的Adobe RGB覆盖率是非常令人失望的,使画面相当苍白。在对比设备中,只有微星GF75的表现同样糟糕。这同样适用于色彩准确性,尽管联想Legion 5在这方面也有不足之处。

其他的速率则相当不令人瞩目。例如,从黑到白的响应时间不到19毫秒,从灰到灰的响应时间为25毫秒,既不坏也不特别好。我们无法确定在降低亮度时的闪烁。视角处于通常的IPS水平。
Display Response Times
| ↔ Response Time Black to White | ||
|---|---|---|
| 18.8 ms ... rise ↗ and fall ↘ combined | ↗ 10.8 ms rise |  |
| ↘ 8 ms fall | ||
| The screen shows good response rates in our tests, but may be too slow for competitive gamers. In comparison, all tested devices range from 0.1 (minimum) to 240 (maximum) ms. » 38 % of all devices are better. This means that the measured response time is similar to the average of all tested devices (20.8 ms). | ||
| ↔ Response Time 50% Grey to 80% Grey | ||
| 24.8 ms ... rise ↗ and fall ↘ combined | ↗ 12.4 ms rise |  |
| ↘ 12.4 ms fall | ||
| The screen shows good response rates in our tests, but may be too slow for competitive gamers. In comparison, all tested devices range from 0.165 (minimum) to 636 (maximum) ms. » 32 % of all devices are better. This means that the measured response time is better than the average of all tested devices (32.5 ms). | ||
Screen Flickering / PWM (Pulse-Width Modulation)
| Screen flickering / PWM not detected |  | ||
In comparison: 53 % of all tested devices do not use PWM to dim the display. If PWM was detected, an average of 8516 (minimum: 5 - maximum: 343500) Hz was measured. | |||
测试条件--Nitro Sense几乎没有提供任何选项
与宏碁的其他游戏笔记本相比,预装的Nitro Sense工具的功能和选项非常少。除了风扇控制,你只能改变节能计划。我们的测量是在交付状态下进行的(见屏幕截图)。

性能 - 现代的中档组件
四核CPU表示中端硬件,以及8GB内存和4GB VRAM的GPU。如果你投资多一点,你也可以得到具有高端功能的Nitro 5(8核CPU,16GB内存,6-8GB GPU)。


处理器
如前所述,酷睿i5-11300H是来自Tiger Lake 系列的四核型号,它终于不再采用英特尔使用多年的过时的14纳米工艺制造。这款10纳米的CPU提供8MB L3缓存,并可通过超线程技术并行处理多达8个线程。与经典的6核和8核芯片相比,TDP只有35瓦而不是45瓦。根据WiNFO工具,Nitro 5的处理器被设定为40瓦PL1和64瓦PL2。时钟--取决于应用和负载--在负载下在3.1和4.4GHz之间。
我们使用Cinebench R15检查了CPU在很长一段时间内的表现。酷睿i5-11300H的性能在循环中保持相当稳定,并如预期的那样,将自己置于旧的 酷睿i5-10300H在循环中。
Cinebench R15 Multi long-term test
| Cinebench R15 | |
| CPU Single 64Bit | |
| Average of class Gaming (191.9 - 343, n=151, last 2 years) | |
| Acer Nitro 5 AN517-53-54DQ | |
| HP Omen 15-ek0456ng | |
| MSI GF75 Thin 10SCXR | |
| Average Intel Core i5-11300H (123 - 211, n=8) | |
| Asus TUF FX705DT-AU068T | |
| Lenovo Legion 5 17IMH05 | |
| CPU Multi 64Bit | |
| Average of class Gaming (905 - 6074, n=154, last 2 years) | |
| Acer Nitro 5 AN517-53-54DQ | |
| HP Omen 15-ek0456ng | |
| Average Intel Core i5-11300H (632 - 990, n=11) | |
| MSI GF75 Thin 10SCXR | |
| Asus TUF FX705DT-AU068T | |
| Lenovo Legion 5 17IMH05 | |
| Cinebench R20 | |
| CPU (Single Core) | |
| Average of class Gaming (439 - 866, n=151, last 2 years) | |
| Acer Nitro 5 AN517-53-54DQ | |
| Average Intel Core i5-11300H (431 - 548, n=11) | |
| HP Omen 15-ek0456ng | |
| MSI GF75 Thin 10SCXR | |
| Asus TUF FX705DT-AU068T | |
| Lenovo Legion 5 17IMH05 | |
| CPU (Multi Core) | |
| Average of class Gaming (2179 - 15517, n=151, last 2 years) | |
| Acer Nitro 5 AN517-53-54DQ | |
| HP Omen 15-ek0456ng | |
| Average Intel Core i5-11300H (1300 - 2533, n=10) | |
| MSI GF75 Thin 10SCXR | |
| Asus TUF FX705DT-AU068T | |
| Lenovo Legion 5 17IMH05 | |
* ... smaller is better
系统性能
尽管内存配置不高,但在系统基准测试中,它足以获得测试领域的第一名。PCMark 10认为Nitro 5领先竞争对手8%至40%,据此,在启动时间和加载时间等方面,所有设备上的日常Windows体验应该感觉非常相似。
| PCMark 10 / Score | |
| Average of class Gaming (5776 - 9852, n=133, last 2 years) | |
| Acer Nitro 5 AN517-53-54DQ | |
| Average Intel Core i5-11300H, NVIDIA GeForce RTX 3050 4GB Laptop GPU (n=1) | |
| MSI GF75 Thin 10SCXR | |
| HP Omen 15-ek0456ng | |
| Asus TUF FX705DT-AU068T | |
| Lenovo Legion 5 17IMH05 | |
| PCMark 10 Score | 5705 points | |
Help | ||
DPC延迟
尽管与竞争对手相比,17英寸机以最低的延迟率大放异彩,但LatencyMon工具表明在实时处理音频和视频内容方面可能存在问题。


| DPC Latencies / LatencyMon - interrupt to process latency (max), Web, Youtube, Prime95 | |
| HP Omen 15-ek0456ng | |
| MSI GF75 Thin 10SCXR | |
| Lenovo Legion 5 17IMH05 | |
| Acer Nitro 5 AN517-53-54DQ | |
* ... smaller is better
大容量存储
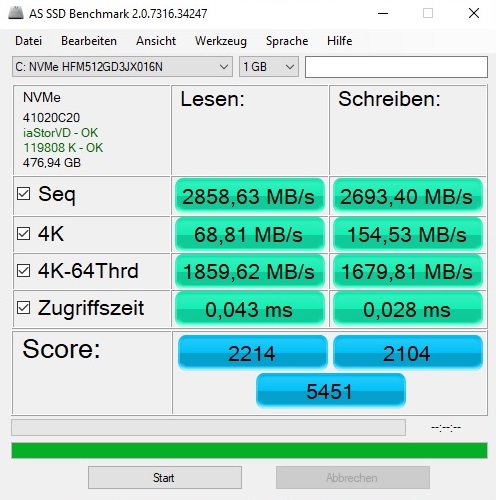
人们对快速的大容量存储赞不绝口。过去,最高速度为500-600MB/s的SATA III固态硬盘在预算领域很常见,而快速的PCIe/NVMe固态硬盘正在缓慢但肯定地成为标准剧目的一部分。Nitro 5提供了一个特别强大的代表,它采用了SK海力士BC711的512GB版本,将竞争对手的NVMe型号甩在了后面,有时还很明显。
不错:如果你想扩大存储空间,你会发现机箱内有一个免费的M.2插槽和一个2.5英寸的插槽(包括合适的电缆)。
| Acer Nitro 5 AN517-53-54DQ SK Hynix BC711 HFM512GD3HX015N | HP Omen 15-ek0456ng Toshiba XG6 KXG60ZNV512G | Lenovo Legion 5 17IMH05 SK hynix BC511 HFM512GDHTNI-87A0B | MSI GF75 Thin 10SCXR WDC PC SN530 SDBPNPZ-512G | Asus TUF FX705DT-AU068T WDC PC SN520 SDAPNUW-256G | |
|---|---|---|---|---|---|
| CrystalDiskMark 5.2 / 6 | -31% | -41% | -38% | -48% | |
| Write 4K | 206.1 | 120 -42% | 134.7 -35% | 140.7 -32% | 145 -30% |
| Read 4K | 77.8 | 36.09 -54% | 44.84 -42% | 43.18 -44% | 45.28 -42% |
| Write Seq | 2842 | 1778 -37% | 1053 -63% | 1829 -36% | 1301 -54% |
| Read Seq | 2552 | 1362 -47% | 1241 -51% | 1095 -57% | 1362 -47% |
| Write 4K Q32T1 | 583 | 429.1 -26% | 499.8 -14% | 431.7 -26% | 249.1 -57% |
| Read 4K Q32T1 | 663 | 493.2 -26% | 518 -22% | 527 -21% | 342.1 -48% |
| Write Seq Q32T1 | 3014 | 2936 -3% | 1022 -66% | 1831 -39% | 1301 -57% |
| Read Seq Q32T1 | 3556 | 3227 -9% | 2263 -36% | 1708 -52% | 1732 -51% |
| AS SSD | -30% | -46% | -94% | -64% | |
| Seq Read | 2859 | 2053 -28% | 1635 -43% | 1007 -65% | 1546 -46% |
| Seq Write | 2693 | 2562 -5% | 913 -66% | 1755 -35% | 1182 -56% |
| 4K Read | 68.8 | 42.46 -38% | 46.18 -33% | 39.88 -42% | 36.54 -47% |
| 4K Write | 154.5 | 97.2 -37% | 101.7 -34% | 111.6 -28% | 109.2 -29% |
| 4K-64 Read | 1860 | 1414 -24% | 773 -58% | 751 -60% | 612 -67% |
| 4K-64 Write | 1680 | 1471 -12% | 745 -56% | 402.6 -76% | 436.6 -74% |
| Access Time Read * | 0.043 | 0.079 -84% | 0.05 -16% | 0.084 -95% | 0.113 -163% |
| Access Time Write * | 0.028 | 0.039 -39% | 0.037 -32% | 0.151 -439% | 0.034 -21% |
| Score Read | 2214 | 1662 -25% | 983 -56% | 892 -60% | 803 -64% |
| Score Write | 2104 | 1825 -13% | 938 -55% | 690 -67% | 664 -68% |
| Score Total | 5451 | 4364 -20% | 2399 -56% | 2085 -62% | 1869 -66% |
| Total Average (Program / Settings) | -31% /
-30% | -44% /
-44% | -66% /
-70% | -56% /
-57% |
* ... smaller is better

Continuous load read: DiskSpd Read Loop, Queue Depth 8
图形卡
对许多用户来说,最有趣的方面可能是GPU。虽然我们过去能够对移动GeForce RTX 3050 Ti进行一次或两次检查,但到目前为止,几乎没有RTX 3050的基准测试结果。与RTX 3050 Ti相比,DirectX 12模型必须用2048个而不是2560个着色器来做。
然而,性能主要取决于冷却系统(关键词时钟余量)和设定的TGP。后者对于RTX 3050(无动态提升)来说,在35至80瓦之间变化。在Nitro 5的情况下,它是75瓦,包括动态提升,所以它是一个相当好的价值,处于上三分之一。
我们认为有限的显存是其弱点。RTX 3050和RTX 3050 Ti都只有4GB的GDDR6 VRAM(128位接口),在2021年,特别是考虑到当前许多游戏的VRAM要求,这已经不是最新的了,对笔记本电脑的未来发展有负面影响。即使在中端市场,到现在至少6GB也是合适的。
然而,安培GPU在与旧版GTX 1650的比赛中很轻松,因为它仍然没有光线追踪支持。在3DMark测试中,领先优势通常为30%至40%。然而,它并没有完全达到GTX 1660 Ti的水平--这在之前是可以预期的。
| 3DMark | |
| 1920x1080 Fire Strike Graphics | |
| Average of class Gaming (2913 - 56116, n=155, last 2 years) | |
| HP Omen 15-ek0456ng | |
| Acer Nitro 5 AN517-53-54DQ | |
| Average NVIDIA GeForce RTX 3050 4GB Laptop GPU (9138 - 14157, n=22) | |
| MSI GF75 Thin 10SCXR | |
| Lenovo Legion 5 17IMH05 | |
| Asus TUF FX705DT-AU068T | |
| 2560x1440 Time Spy Graphics | |
| Average of class Gaming (2295 - 24599, n=151, last 2 years) | |
| HP Omen 15-ek0456ng | |
| Acer Nitro 5 AN517-53-54DQ | |
| Average NVIDIA GeForce RTX 3050 4GB Laptop GPU (3281 - 5295, n=23) | |
| Asus TUF FX705DT-AU068T | |
| MSI GF75 Thin 10SCXR | |
| Lenovo Legion 5 17IMH05 | |
| 3DMark 11 - 1280x720 Performance GPU | |
| Average of class Gaming (10741 - 72178, n=143, last 2 years) | |
| HP Omen 15-ek0456ng | |
| Acer Nitro 5 AN517-53-54DQ | |
| Average NVIDIA GeForce RTX 3050 4GB Laptop GPU (11980 - 18557, n=23) | |
| Asus TUF FX705DT-AU068T | |
| MSI GF75 Thin 10SCXR | |
| Lenovo Legion 5 17IMH05 | |
| 3DMark 06 Standard Score | 36425 points | |
| 3DMark Vantage P Result | 43216 points | |
| 3DMark 11 Performance | 14587 points | |
| 3DMark Ice Storm Standard Score | 61606 points | |
| 3DMark Cloud Gate Standard Score | 24215 points | |
| 3DMark Fire Strike Score | 11041 points | |
| 3DMark Time Spy Score | 4877 points | |
Help | ||
游戏性能
与合成基准类似,移动GeForce RTX 3050在游戏过程中也排在GTX 1650(Ti)和GeForce GTX 1660 Ti之间,据此,帧率有时更倾向于一个方向,有时更倾向于另一个方向,这取决于游戏和VRAM消耗。
总的来说,GeForce RTX 3050笔记本GPU的速度足以在1,920 x 1,080的原生分辨率下运行大多数游戏,并具有高至最大的细节。只有在启用光线追踪或非常密集的计算和/或适度优化的游戏,如《刺客信条瓦尔哈拉》 和 《赛博朋克2077》 ,它才会变得紧张,甚至中等设置也成为一种挑战。RTX 3050很难适用于QHD和4K游戏。为此,我们建议使用高端设备,配备 GeForce RTX 3060向上。
| Performance Rating - Percent | |
| Average of class Gaming -237! | |
| MSI GP65 Leopard 9SD -84! | |
| Acer Nitro 5 AN517-53-54DQ -247! | |
| MSI GP75 -257! | |
| MSI GL75 -267! | |
| Vampire Bloodhunt | |
| 3840x2160 Ultra Preset | |
| MSI GP65 Leopard 9SD | |
| 2560x1440 Ultra Preset | |
| MSI GP65 Leopard 9SD | |
| 1920x1080 Ultra Preset | |
| MSI GP65 Leopard 9SD | |
| MSI GP75 | |
| Average of class Gaming (n=1last 2 years) | |
| 1920x1080 High Preset | |
| MSI GP65 Leopard 9SD | |
| MSI GP75 | |
| Average of class Gaming (n=1last 2 years) | |
| 1920x1080 Medium Preset | |
| MSI GP65 Leopard 9SD | |
| MSI GP75 | |
| Average of class Gaming (n=1last 2 years) | |
| 1920x1080 Low Preset | |
| MSI GP75 | |
| Average of class Gaming (n=1last 2 years) | |
| 1280x720 Low Preset | |
| MSI GP75 | |
| Average of class Gaming (n=1last 2 years) | |
| Tiny Tina's Wonderlands | |
| 2560x1440 Badass Preset (DX12) | |
| Average of class Gaming (45.3 - 137.8, n=31, last 2 years) | |
| MSI GP65 Leopard 9SD | |
| 1920x1080 Badass Preset (DX12) | |
| Average of class Gaming (22.3 - 187.5, n=38, last 2 years) | |
| MSI GP65 Leopard 9SD | |
| MSI GP75 | |
| 1920x1080 High Preset (DX12) | |
| Average of class Gaming (12.3 - 227, n=35, last 2 years) | |
| MSI GP65 Leopard 9SD | |
| MSI GP75 | |
| 1920x1080 Medium Preset (DX12) | |
| Average of class Gaming (19.1 - 297, n=33, last 2 years) | |
| MSI GP65 Leopard 9SD | |
| MSI GP75 | |
| 1920x1080 Low Preset (DX12) | |
| Average of class Gaming (25.2 - 378, n=33, last 2 years) | |
| MSI GP65 Leopard 9SD | |
| MSI GP75 | |
| 1280x720 Lowest Preset (DX12) | |
| Average of class Gaming (48.5 - 319, n=10, last 2 years) | |
| MSI GP75 | |
| Ghostwire Tokyo | |
| 3840x2160 Highest Settings | |
| MSI GP65 Leopard 9SD | |
| 2560x1440 Highest Settings | |
| MSI GP65 Leopard 9SD | |
| MSI GP75 | |
| 1920x1080 Highest Settings | |
| MSI GP65 Leopard 9SD | |
| MSI GP75 | |
| 1920x1080 High Settings | |
| MSI GP65 Leopard 9SD | |
| MSI GP75 | |
| 1920x1080 Medium Settings | |
| MSI GP65 Leopard 9SD | |
| MSI GP75 | |
| 1920x1080 Low Settings | |
| MSI GP65 Leopard 9SD | |
| MSI GP75 | |
| 1280x720 Lowest Settings | |
| MSI GP75 | |
| Elden Ring | |
| 3840x2160 Maximum Preset | |
| MSI GP65 Leopard 9SD | |
| MSI GP75 | |
| MSI GL75 | |
| 2560x1440 Maximum Preset | |
| MSI GP65 Leopard 9SD | |
| MSI GP75 | |
| MSI GL75 | |
| 1920x1080 Maximum Preset | |
| MSI GP65 Leopard 9SD | |
| MSI GP75 | |
| MSI GL75 | |
| Average of class Gaming (n=1last 2 years) | |
| 1920x1080 High Preset | |
| MSI GP65 Leopard 9SD | |
| MSI GP75 | |
| MSI GL75 | |
| Average of class Gaming (n=1last 2 years) | |
| 1920x1080 Medium Preset | |
| MSI GP75 | |
| MSI GP65 Leopard 9SD | |
| MSI GL75 | |
| Average of class Gaming (n=1last 2 years) | |
| 1920x1080 Low Preset | |
| MSI GP75 | |
| MSI GL75 | |
| Average of class Gaming (n=1last 2 years) | |
| Elex 2 | |
| 3840x2160 Ultra / On AA:SM AF:16x | |
| MSI GP65 Leopard 9SD | |
| 2560x1440 Ultra / On AA:SM AF:16x | |
| MSI GP65 Leopard 9SD | |
| 1920x1080 Ultra / On AA:SM AF:16x | |
| Average of class Gaming (30.1 - 81.4, n=2, last 2 years) | |
| MSI GP65 Leopard 9SD | |
| MSI GP75 | |
| MSI GL75 | |
| 1920x1080 High / On AA:FX AF:16x | |
| Average of class Gaming (36.9 - 103.4, n=2, last 2 years) | |
| MSI GP65 Leopard 9SD | |
| MSI GP75 | |
| MSI GL75 | |
| 1920x1080 Medium / On AA:FX AF:16x | |
| Average of class Gaming (65.6 - 115.7, n=2, last 2 years) | |
| MSI GP65 Leopard 9SD | |
| MSI GP75 | |
| MSI GL75 | |
| 1920x1080 Low / Off | |
| Average of class Gaming (75.3 - 116.3, n=2, last 2 years) | |
| MSI GP75 | |
| MSI GL75 | |
| 1280x720 Low / Off | |
| Average of class Gaming (82.8 - 118, n=2, last 2 years) | |
| MSI GP75 | |
| MSI GL75 | |
| Cyberpunk 2077 1.6 | |
| 3840x2160 Ultra Preset | |
| Average of class Gaming (17.4 - 51, n=18, last 2 years) | |
| MSI GP65 Leopard 9SD | |
| MSI GP75 | |
| MSI GL75 | |
| 2560x1440 Ultra Preset | |
| Average of class Gaming (37.7 - 116, n=33, last 2 years) | |
| MSI GP65 Leopard 9SD | |
| MSI GP75 | |
| MSI GL75 | |
| 1920x1080 Ultra Preset | |
| Average of class Gaming (16.7 - 157, n=41, last 2 years) | |
| MSI GP65 Leopard 9SD | |
| MSI GP75 | |
| MSI GL75 | |
| 1920x1080 High Preset | |
| Average of class Gaming (12.2 - 205, n=37, last 2 years) | |
| MSI GP65 Leopard 9SD | |
| MSI GP75 | |
| MSI GL75 | |
| 1920x1080 Medium Preset | |
| Average of class Gaming (15 - 157.6, n=30, last 2 years) | |
| MSI GP65 Leopard 9SD | |
| MSI GP75 | |
| MSI GL75 | |
| 1920x1080 Low Preset | |
| Average of class Gaming (20.3 - 185.8, n=29, last 2 years) | |
| MSI GP65 Leopard 9SD | |
| MSI GP75 | |
| MSI GL75 | |
| 1280x720 Low Preset | |
| Average of class Gaming (37.1 - 175.1, n=12, last 2 years) | |
| MSI GP65 Leopard 9SD | |
| MSI GP75 | |
| MSI GL75 | |
| GRID Legends | |
| 3840x2160 Ultra Preset | |
| MSI GP65 Leopard 9SD | |
| 2560x1440 Ultra Preset | |
| Average of class Gaming (91 - 112.1, n=3, last 2 years) | |
| MSI GP65 Leopard 9SD | |
| 1920x1080 Ultra Preset | |
| Average of class Gaming (109.8 - 131.7, n=5, last 2 years) | |
| MSI GP65 Leopard 9SD | |
| MSI GP75 | |
| MSI GL75 | |
| 1920x1080 High Preset | |
| Average of class Gaming (130.1 - 156.5, n=5, last 2 years) | |
| MSI GP65 Leopard 9SD | |
| MSI GP75 | |
| MSI GL75 | |
| 1920x1080 Medium Preset | |
| Average of class Gaming (141.1 - 182.8, n=5, last 2 years) | |
| MSI GP65 Leopard 9SD | |
| MSI GP75 | |
| MSI GL75 | |
| 1920x1080 Low Preset | |
| Average of class Gaming (152.8 - 215, n=5, last 2 years) | |
| MSI GP75 | |
| MSI GL75 | |
| 1280x720 Low Preset | |
| Average of class Gaming (153.9 - 232, n=5, last 2 years) | |
| MSI GP75 | |
| MSI GL75 | |
| Dying Light 2 | |
| 3840x2160 High Quality | |
| Average of class Gaming (n=1last 2 years) | |
| MSI GP65 Leopard 9SD | |
| 2560x1440 High Quality | |
| Average of class Gaming (n=1last 2 years) | |
| MSI GP65 Leopard 9SD | |
| 1920x1080 High Quality | |
| Average of class Gaming (n=1last 2 years) | |
| MSI GP65 Leopard 9SD | |
| MSI GP75 | |
| MSI GL75 | |
| 1920x1080 Medium Quality | |
| Average of class Gaming (n=1last 2 years) | |
| MSI GP65 Leopard 9SD | |
| MSI GP75 | |
| MSI GL75 | |
| 1920x1080 Low Quality | |
| Average of class Gaming (n=1last 2 years) | |
| MSI GP65 Leopard 9SD | |
| MSI GP75 | |
| MSI GL75 | |
| 1280x720 Low Quality | |
| Average of class Gaming (n=1last 2 years) | |
| MSI GP75 | |
| MSI GL75 | |
| Rainbow Six Extraction | |
| 3840x2160 Ultra Preset (with Fixed Resolution Quality) | |
| MSI GP65 Leopard 9SD | |
| 2560x1440 Ultra Preset (with Fixed Resolution Quality) | |
| MSI GP65 Leopard 9SD | |
| 1920x1080 Ultra Preset (with Fixed Resolution Quality) | |
| MSI GP65 Leopard 9SD | |
| Average of class Gaming (33 - 125, n=2, last 2 years) | |
| MSI GP75 | |
| MSI GL75 | |
| 1920x1080 High Preset (with Fixed Resolution Quality) | |
| MSI GP65 Leopard 9SD | |
| Average of class Gaming (45 - 159, n=2, last 2 years) | |
| MSI GP75 | |
| MSI GL75 | |
| 1920x1080 Medium Preset (with Fixed Resolution Quality) | |
| MSI GP65 Leopard 9SD | |
| Average of class Gaming (48 - 166, n=2, last 2 years) | |
| MSI GP75 | |
| MSI GL75 | |
| 1920x1080 Very Low Preset (with Fixed Resolution Quality) | |
| Average of class Gaming (65 - 208, n=2, last 2 years) | |
| MSI GP75 | |
| MSI GL75 | |
| 1280x720 Ultra Low Preset (with Fixed Resolution Quality) | |
| Average of class Gaming (n=1last 2 years) | |
| MSI GP75 | |
| MSI GL75 | |
| God of War | |
| 3840x2160 Ultra Preset | |
| MSI GP65 Leopard 9SD | |
| 2560x1440 Ultra Preset | |
| Average of class Gaming (42.3 - 60, n=4, last 2 years) | |
| MSI GP65 Leopard 9SD | |
| 1920x1080 Ultra Preset | |
| Average of class Gaming (50.1 - 74, n=5, last 2 years) | |
| MSI GP65 Leopard 9SD | |
| MSI GP75 | |
| MSI GL75 | |
| 1920x1080 High Preset | |
| Average of class Gaming (71.1 - 105, n=5, last 2 years) | |
| MSI GP65 Leopard 9SD | |
| MSI GP75 | |
| MSI GL75 | |
| 1920x1080 Original Preset | |
| Average of class Gaming (86.8 - 129, n=5, last 2 years) | |
| MSI GP65 Leopard 9SD | |
| MSI GP75 | |
| MSI GL75 | |
| 1920x1080 Low Preset | |
| Average of class Gaming (113.7 - 149, n=4, last 2 years) | |
| MSI GP75 | |
| MSI GL75 | |
| 1280x720 Low Preset | |
| Average of class Gaming (155 - 182.7, n=2, last 2 years) | |
| MSI GP75 | |
| MSI GL75 | |
| Halo Infinite | |
| 3840x2160 Ultra Preset | |
| MSI GP65 Leopard 9SD | |
| 2560x1440 Ultra Preset | |
| MSI GP65 Leopard 9SD | |
| 1920x1080 Ultra Preset | |
| Average of class Gaming (n=1last 2 years) | |
| MSI GP65 Leopard 9SD | |
| MSI GP75 | |
| MSI GL75 | |
| 1920x1080 High Preset | |
| Average of class Gaming (n=1last 2 years) | |
| MSI GP65 Leopard 9SD | |
| MSI GP75 | |
| MSI GL75 | |
| 1920x1080 Medium Preset | |
| Average of class Gaming (n=1last 2 years) | |
| MSI GP65 Leopard 9SD | |
| MSI GP75 | |
| MSI GL75 | |
| 1920x1080 Low Preset | |
| Average of class Gaming (n=1last 2 years) | |
| MSI GP75 | |
| MSI GL75 | |
| 1280x720 Low Preset | |
| MSI GP75 | |
| MSI GL75 | |
| Farming Simulator 22 | |
| 3840x2160 Very High Preset | |
| MSI GP65 Leopard 9SD | |
| MSI GP75 | |
| MSI GL75 | |
| 2560x1440 Very High Preset | |
| MSI GP65 Leopard 9SD | |
| MSI GP75 | |
| MSI GL75 | |
| 1920x1080 Very High Preset | |
| MSI GP65 Leopard 9SD | |
| MSI GP75 | |
| MSI GL75 | |
| Average of class Gaming (n=1last 2 years) | |
| 1920x1080 High Preset | |
| MSI GP65 Leopard 9SD | |
| MSI GP75 | |
| MSI GL75 | |
| Average of class Gaming (n=1last 2 years) | |
| 1920x1080 Medium Preset | |
| MSI GP65 Leopard 9SD | |
| MSI GP75 | |
| MSI GL75 | |
| Average of class Gaming (n=1last 2 years) | |
| 1280x720 Low Preset | |
| MSI GP75 | |
| MSI GL75 | |
| Average of class Gaming (n=1last 2 years) | |
| Battlefield 2042 | |
| 3840x2160 Ultra Preset | |
| MSI GP65 Leopard 9SD | |
| 2560x1440 Ultra Preset | |
| MSI GP65 Leopard 9SD | |
| MSI GL75 | |
| 1920x1080 Ultra Preset | |
| MSI GP65 Leopard 9SD | |
| MSI GL75 | |
| 1920x1080 High Preset | |
| MSI GP65 Leopard 9SD | |
| MSI GL75 | |
| 1920x1080 Medium Preset | |
| MSI GP65 Leopard 9SD | |
| MSI GL75 | |
| 1920x1080 Low Preset | |
| MSI GP65 Leopard 9SD | |
| MSI GL75 | |
| 1280x720 Low Preset | |
| MSI GL75 | |
| Forza Horizon 5 | |
| 3840x2160 Extreme Preset | |
| MSI GP65 Leopard 9SD | |
| MSI GP75 | |
| MSI GL75 | |
| 2560x1440 Extreme Preset | |
| Average of class Gaming (n=1last 2 years) | |
| MSI GP65 Leopard 9SD | |
| MSI GP75 | |
| MSI GL75 | |
| 1920x1080 Extreme Preset | |
| Average of class Gaming (55 - 74, n=2, last 2 years) | |
| MSI GP65 Leopard 9SD | |
| MSI GP75 | |
| MSI GL75 | |
| 1920x1080 High Preset | |
| Average of class Gaming (135 - 146, n=2, last 2 years) | |
| MSI GP65 Leopard 9SD | |
| MSI GP75 | |
| MSI GL75 | |
| 1920x1080 Medium Preset | |
| Average of class Gaming (144 - 162, n=2, last 2 years) | |
| MSI GP65 Leopard 9SD | |
| MSI GP75 | |
| MSI GL75 | |
| 1920x1080 Low Preset | |
| Average of class Gaming (167 - 186, n=2, last 2 years) | |
| MSI GP65 Leopard 9SD | |
| MSI GP75 | |
| MSI GL75 | |
| Call of Duty Vanguard | |
| 3840x2160 Ultra Preset | |
| MSI GP65 Leopard 9SD | |
| MSI GP75 | |
| MSI GL75 | |
| 2560x1440 Ultra Preset | |
| MSI GP65 Leopard 9SD | |
| MSI GP75 | |
| MSI GL75 | |
| 1920x1080 Ultra Preset | |
| MSI GP65 Leopard 9SD | |
| MSI GP75 | |
| MSI GL75 | |
| 1920x1080 High Preset | |
| MSI GP65 Leopard 9SD | |
| MSI GP75 | |
| MSI GL75 | |
| 1920x1080 Medium Preset | |
| MSI GP65 Leopard 9SD | |
| MSI GP75 | |
| MSI GL75 | |
| 1920x1080 Low Preset | |
| MSI GP65 Leopard 9SD | |
| MSI GP75 | |
| MSI GL75 | |
| Riders Republic | |
| 3840x2160 Ultra Preset | |
| MSI GP65 Leopard 9SD | |
| MSI GP75 | |
| MSI GL75 | |
| 2560x1440 Ultra Preset | |
| MSI GP65 Leopard 9SD | |
| MSI GP75 | |
| MSI GL75 | |
| 1920x1080 Ultra Preset | |
| Average of class Gaming (n=1last 2 years) | |
| MSI GP65 Leopard 9SD | |
| MSI GP75 | |
| MSI GL75 | |
| 1920x1080 High Preset | |
| Average of class Gaming (n=1last 2 years) | |
| MSI GP65 Leopard 9SD | |
| MSI GP75 | |
| MSI GL75 | |
| 1920x1080 Medium Preset | |
| Average of class Gaming (n=1last 2 years) | |
| MSI GP65 Leopard 9SD | |
| MSI GP75 | |
| MSI GL75 | |
| 1920x1080 Low Preset | |
| Average of class Gaming (n=1last 2 years) | |
| MSI GP65 Leopard 9SD | |
| MSI GP75 | |
| MSI GL75 | |
| Guardians of the Galaxy | |
| 3840x2160 Ultra Preset | |
| MSI GP65 Leopard 9SD | |
| MSI GP75 | |
| MSI GL75 | |
| 2560x1440 Ultra Preset | |
| MSI GP65 Leopard 9SD | |
| Average of class Gaming (n=1last 2 years) | |
| MSI GP75 | |
| MSI GL75 | |
| 1920x1080 Ultra Preset | |
| MSI GP65 Leopard 9SD | |
| Average of class Gaming (42 - 113, n=3, last 2 years) | |
| MSI GP75 | |
| MSI GL75 | |
| 1920x1080 High Preset | |
| Average of class Gaming (44 - 122, n=3, last 2 years) | |
| MSI GP65 Leopard 9SD | |
| MSI GP75 | |
| MSI GL75 | |
| 1920x1080 Medium Preset | |
| Average of class Gaming (49 - 120, n=2, last 2 years) | |
| MSI GP65 Leopard 9SD | |
| MSI GP75 | |
| MSI GL75 | |
| 1920x1080 Low Preset | |
| MSI GP65 Leopard 9SD | |
| Average of class Gaming (50 - 123, n=2, last 2 years) | |
| MSI GP75 | |
| MSI GL75 | |
| Alan Wake Remastered | |
| 3840x2160 High Preset | |
| MSI GP65 Leopard 9SD | |
| 2560x1440 High Preset | |
| Average of class Gaming (n=1last 2 years) | |
| MSI GP65 Leopard 9SD | |
| MSI GP75 | |
| MSI GL75 | |
| 1920x1080 High Preset | |
| Average of class Gaming (n=1last 2 years) | |
| MSI GP65 Leopard 9SD | |
| MSI GP75 | |
| MSI GL75 | |
| 1920x1080 Medium Preset | |
| Average of class Gaming (n=1last 2 years) | |
| MSI GP65 Leopard 9SD | |
| MSI GP75 | |
| MSI GL75 | |
| 1920x1080 Low Preset | |
| Average of class Gaming (n=1last 2 years) | |
| MSI GP75 | |
| MSI GP65 Leopard 9SD | |
| MSI GL75 | |
| Back 4 Blood | |
| 3840x2160 Epic Preset (DX12) AA:T | |
| MSI GP65 Leopard 9SD | |
| MSI GP75 | |
| MSI GL75 | |
| 2560x1440 Epic Preset (DX12) AA:T | |
| MSI GP65 Leopard 9SD | |
| MSI GP75 | |
| MSI GL75 | |
| 1920x1080 Epic Preset (DX12) AA:T | |
| MSI GP65 Leopard 9SD | |
| Average of class Gaming (72.3 - 155.3, n=2, last 2 years) | |
| MSI GP75 | |
| MSI GL75 | |
| 1920x1080 High Preset (DX12) AA:T | |
| MSI GP65 Leopard 9SD | |
| Average of class Gaming (77.4 - 166.1, n=2, last 2 years) | |
| MSI GP75 | |
| MSI GL75 | |
| 1920x1080 Medium Preset (DX12) AA:FX | |
| Average of class Gaming (92.5 - 221, n=2, last 2 years) | |
| MSI GP65 Leopard 9SD | |
| MSI GP75 | |
| MSI GL75 | |
| 1920x1080 Low Preset (DX12) | |
| MSI GP65 Leopard 9SD | |
| Average of class Gaming (119.2 - 266, n=2, last 2 years) | |
| MSI GP75 | |
| MSI GL75 | |
| Far Cry 6 | |
| 2560x1440 Ultra Graphics Quality + HD Textures AA:T | |
| Average of class Gaming (74.5 - 146, n=10, last 2 years) | |
| MSI GP65 Leopard 9SD | |
| MSI GP75 | |
| MSI GL75 | |
| 1920x1080 Ultra Graphics Quality + HD Textures AA:T | |
| Average of class Gaming (35 - 167, n=15, last 2 years) | |
| MSI GP65 Leopard 9SD | |
| MSI GP75 | |
| MSI GL75 | |
| 1920x1080 High Graphics Quality AA:T | |
| Average of class Gaming (13.6 - 182, n=9, last 2 years) | |
| MSI GP65 Leopard 9SD | |
| MSI GP75 | |
| MSI GL75 | |
| 1920x1080 Medium Graphics Quality AA:SM | |
| Average of class Gaming (16.9 - 143, n=6, last 2 years) | |
| MSI GP65 Leopard 9SD | |
| MSI GP75 | |
| MSI GL75 | |
| 1920x1080 Low Graphics Quality | |
| Average of class Gaming (19.6 - 158.5, n=7, last 2 years) | |
| MSI GP65 Leopard 9SD | |
| MSI GP75 | |
| MSI GL75 | |
| FIFA 22 | |
| 3840x2160 Ultra Rendering Quality AA:4x MS | |
| MSI GP65 Leopard 9SD | |
| MSI GP75 | |
| MSI GL75 | |
| 2560x1440 Ultra Rendering Quality AA:4x MS | |
| MSI GP65 Leopard 9SD | |
| MSI GP75 | |
| MSI GL75 | |
| 1920x1080 Ultra Rendering Quality AA:4x MS | |
| MSI GP65 Leopard 9SD | |
| MSI GP75 | |
| MSI GL75 | |
| 1920x1080 High Rendering Quality AA:2x MS | |
| MSI GP65 Leopard 9SD | |
| MSI GP75 | |
| MSI GL75 | |
| 1920x1080 Medium Rendering Quality | |
| MSI GP65 Leopard 9SD | |
| MSI GP75 | |
| MSI GL75 | |
| 1920x1080 Low Rendering Quality | |
| MSI GP65 Leopard 9SD | |
| MSI GP75 | |
| MSI GL75 | |
| New World | |
| 3840x2160 Very High Video Quality | |
| MSI GP65 Leopard 9SD | |
| MSI GP75 | |
| MSI GL75 | |
| 2560x1440 Very High Video Quality | |
| MSI GP65 Leopard 9SD | |
| MSI GP75 | |
| MSI GL75 | |
| 1920x1080 Very High Video Quality | |
| MSI GP65 Leopard 9SD | |
| MSI GP75 | |
| MSI GL75 | |
| 1920x1080 High Video Quality | |
| MSI GP65 Leopard 9SD | |
| MSI GP75 | |
| MSI GL75 | |
| 1920x1080 Medium Video Quality | |
| MSI GP65 Leopard 9SD | |
| MSI GP75 | |
| MSI GL75 | |
| 1920x1080 Low Video Quality | |
| MSI GP65 Leopard 9SD | |
| MSI GP75 | |
| MSI GL75 | |
| Deathloop | |
| 3840x2160 Ultra Preset | |
| MSI GP65 Leopard 9SD | |
| MSI GP75 | |
| MSI GL75 | |
| 2560x1440 Ultra Preset | |
| MSI GP65 Leopard 9SD | |
| MSI GP75 | |
| MSI GL75 | |
| 1920x1080 Ultra Preset | |
| MSI GP65 Leopard 9SD | |
| MSI GP75 | |
| MSI GL75 | |
| 1920x1080 High Preset | |
| MSI GP65 Leopard 9SD | |
| MSI GP75 | |
| MSI GL75 | |
| 1920x1080 Medium Preset | |
| MSI GP65 Leopard 9SD | |
| MSI GP75 | |
| MSI GL75 | |
| 1920x1080 Low Preset | |
| MSI GP65 Leopard 9SD | |
| MSI GP75 | |
| MSI GL75 | |
| Monster Hunter Stories 2 | |
| 3840x2160 High Preset | |
| MSI GP65 Leopard 9SD | |
| Acer Nitro 5 AN517-53-54DQ | |
| MSI GP75 | |
| MSI GL75 | |
| 2560x1440 High Preset | |
| MSI GP65 Leopard 9SD | |
| MSI GP75 | |
| MSI GL75 | |
| Acer Nitro 5 AN517-53-54DQ | |
| 1920x1080 High Preset | |
| MSI GP65 Leopard 9SD | |
| MSI GP75 | |
| MSI GL75 | |
| Acer Nitro 5 AN517-53-54DQ | |
| 1920x1080 Medium Preset | |
| MSI GP65 Leopard 9SD | |
| MSI GP75 | |
| MSI GL75 | |
| Acer Nitro 5 AN517-53-54DQ | |
| 1920x1080 Low Preset | |
| MSI GP75 | |
| MSI GP65 Leopard 9SD | |
| MSI GL75 | |
| F1 2021 | |
| 3840x2160 Ultra High Preset + Raytracing AA:T AF:16x | |
| Average of class Gaming (89.9 - 115.1, n=2, last 2 years) | |
| Acer Nitro 5 AN517-53-54DQ | |
| 2560x1440 Ultra High Preset + Raytracing AA:T AF:16x | |
| Average of class Gaming (74.3 - 204, n=7, last 2 years) | |
| Acer Nitro 5 AN517-53-54DQ | |
| 1920x1080 Ultra High Preset + Raytracing AA:T AF:16x | |
| Average of class Gaming (27.6 - 271, n=10, last 2 years) | |
| Acer Nitro 5 AN517-53-54DQ | |
| 1920x1080 High Preset AA:T AF:16x | |
| Average of class Gaming (65.1 - 470, n=10, last 2 years) | |
| MSI GP65 Leopard 9SD | |
| Acer Nitro 5 AN517-53-54DQ | |
| MSI GP75 | |
| MSI GL75 | |
| 1920x1080 Medium Preset AA:T AF:16x | |
| Average of class Gaming (84.8 - 616, n=9, last 2 years) | |
| MSI GP65 Leopard 9SD | |
| Acer Nitro 5 AN517-53-54DQ | |
| MSI GP75 | |
| MSI GL75 | |
| 1920x1080 Ultra Low Preset | |
| MSI GP65 Leopard 9SD | |
| MSI GP75 | |
| MSI GL75 | |
| Days Gone | |
| 3840x2160 Very High Preset | |
| MSI GP65 Leopard 9SD | |
| Acer Nitro 5 AN517-53-54DQ | |
| MSI GP75 | |
| MSI GL75 | |
| 2560x1440 Very High Preset | |
| MSI GP65 Leopard 9SD | |
| Acer Nitro 5 AN517-53-54DQ | |
| MSI GP75 | |
| MSI GL75 | |
| 1920x1080 Very High Preset | |
| MSI GP65 Leopard 9SD | |
| Acer Nitro 5 AN517-53-54DQ | |
| MSI GP75 | |
| MSI GL75 | |
| 1920x1080 High Preset | |
| MSI GP65 Leopard 9SD | |
| Acer Nitro 5 AN517-53-54DQ | |
| MSI GP75 | |
| MSI GL75 | |
| 1920x1080 Medium Preset | |
| MSI GP65 Leopard 9SD | |
| Acer Nitro 5 AN517-53-54DQ | |
| MSI GP75 | |
| MSI GL75 | |
| 1920x1080 Low Preset | |
| MSI GP65 Leopard 9SD | |
| MSI GP75 | |
| MSI GL75 | |
| Mass Effect Legendary Edition | |
| 3840x2160 On | |
| MSI GP65 Leopard 9SD | |
| Acer Nitro 5 AN517-53-54DQ | |
| MSI GP75 | |
| MSI GL75 | |
| 2560x1440 On | |
| MSI GP65 Leopard 9SD | |
| Acer Nitro 5 AN517-53-54DQ | |
| MSI GP75 | |
| MSI GL75 | |
| 1920x1080 On | |
| Average of class Gaming (n=1last 2 years) | |
| MSI GP65 Leopard 9SD | |
| MSI GP75 | |
| Acer Nitro 5 AN517-53-54DQ | |
| MSI GL75 | |
| 1280x720 Off | |
| Average of class Gaming (n=1last 2 years) | |
| MSI GP75 | |
| MSI GP65 Leopard 9SD | |
| MSI GL75 | |
| Resident Evil Village | |
| 3840x2160 Max Preset | |
| MSI GP65 Leopard 9SD | |
| Acer Nitro 5 AN517-53-54DQ | |
| MSI GP75 | |
| MSI GL75 | |
| 2560x1440 Max Preset | |
| MSI GP65 Leopard 9SD | |
| Acer Nitro 5 AN517-53-54DQ | |
| MSI GP75 | |
| MSI GL75 | |
| 1920x1080 Max Preset | |
| MSI GP65 Leopard 9SD | |
| MSI GP75 | |
| Acer Nitro 5 AN517-53-54DQ | |
| MSI GL75 | |
| 1920x1080 Prioritize Graphics Preset | |
| MSI GP65 Leopard 9SD | |
| MSI GP75 | |
| Acer Nitro 5 AN517-53-54DQ | |
| MSI GL75 | |
| 1920x1080 Balanced Preset | |
| MSI GP65 Leopard 9SD | |
| MSI GP75 | |
| Acer Nitro 5 AN517-53-54DQ | |
| MSI GL75 | |
| 1920x1080 Prioritize Performance Preset | |
| MSI GP65 Leopard 9SD | |
| MSI GP75 | |
| MSI GL75 | |
| Outriders | |
| 3840x2160 Ultra Preset | |
| MSI GP65 Leopard 9SD | |
| MSI GP75 | |
| MSI GL75 | |
| Acer Nitro 5 AN517-53-54DQ | |
| 2560x1440 Ultra Preset | |
| MSI GP65 Leopard 9SD | |
| MSI GP75 | |
| MSI GL75 | |
| Acer Nitro 5 AN517-53-54DQ | |
| 1920x1080 Ultra Preset | |
| MSI GP65 Leopard 9SD | |
| MSI GP75 | |
| Acer Nitro 5 AN517-53-54DQ | |
| MSI GL75 | |
| 1920x1080 High Preset | |
| MSI GP65 Leopard 9SD | |
| MSI GP75 | |
| MSI GL75 | |
| Acer Nitro 5 AN517-53-54DQ | |
| 1920x1080 Medium Preset | |
| MSI GP65 Leopard 9SD | |
| MSI GP75 | |
| MSI GL75 | |
| Acer Nitro 5 AN517-53-54DQ | |
| 1920x1080 Low Preset | |
| MSI GP65 Leopard 9SD | |
| MSI GP75 | |
| MSI GL75 | |
| Hitman 3 | |
| 3840x2160 Maximum Settings AF:16x | |
| MSI GP65 Leopard 9SD | |
| Acer Nitro 5 AN517-53-54DQ | |
| MSI GP75 | |
| MSI GL75 | |
| 2560x1440 Maximum Settings AF:16x | |
| MSI GP65 Leopard 9SD | |
| Acer Nitro 5 AN517-53-54DQ | |
| MSI GP75 | |
| MSI GL75 | |
| 1920x1080 Maximum Settings AF:16x | |
| Average of class Gaming (n=1last 2 years) | |
| MSI GP65 Leopard 9SD | |
| MSI GP75 | |
| MSI GL75 | |
| Acer Nitro 5 AN517-53-54DQ | |
| 1920x1080 High Settings AF:16x | |
| Average of class Gaming (n=1last 2 years) | |
| MSI GP65 Leopard 9SD | |
| MSI GP75 | |
| MSI GL75 | |
| Acer Nitro 5 AN517-53-54DQ | |
| 1920x1080 Medium Settings AF:16x | |
| Average of class Gaming (n=1last 2 years) | |
| MSI GP65 Leopard 9SD | |
| Acer Nitro 5 AN517-53-54DQ | |
| MSI GP75 | |
| MSI GL75 | |
| 1920x1080 Minimum Settings | |
| Average of class Gaming (n=1last 2 years) | |
| MSI GP65 Leopard 9SD | |
| MSI GP75 | |
| MSI GL75 | |
| Cyberpunk 2077 1.0 | |
| 1920x1080 Ray Tracing Ultra Preset (DLSS off) | |
| MSI GP65 Leopard 9SD | |
| 3840x2160 Ultra Preset | |
| MSI GP65 Leopard 9SD | |
| MSI GP75 | |
| MSI GL75 | |
| Acer Nitro 5 AN517-53-54DQ | |
| 2560x1440 Ultra Preset | |
| MSI GP65 Leopard 9SD | |
| Acer Nitro 5 AN517-53-54DQ | |
| MSI GP75 | |
| MSI GL75 | |
| 1920x1080 Ultra Preset | |
| MSI GP65 Leopard 9SD | |
| Acer Nitro 5 AN517-53-54DQ | |
| MSI GP75 | |
| MSI GL75 | |
| 1920x1080 High Preset | |
| MSI GP65 Leopard 9SD | |
| Acer Nitro 5 AN517-53-54DQ | |
| MSI GP75 | |
| MSI GL75 | |
| 1920x1080 Medium Preset | |
| MSI GP65 Leopard 9SD | |
| Acer Nitro 5 AN517-53-54DQ | |
| MSI GP75 | |
| MSI GL75 | |
| 1920x1080 Low Preset | |
| MSI GP65 Leopard 9SD | |
| MSI GP75 | |
| MSI GL75 | |
| Immortals Fenyx Rising | |
| 3840x2160 Very High Preset | |
| MSI GP65 Leopard 9SD | |
| MSI GP75 | |
| Acer Nitro 5 AN517-53-54DQ | |
| MSI GL75 | |
| 2560x1440 Very High Preset | |
| MSI GP65 Leopard 9SD | |
| Acer Nitro 5 AN517-53-54DQ | |
| MSI GP75 | |
| MSI GL75 | |
| 1920x1080 Very High Preset | |
| Average of class Gaming (n=1last 2 years) | |
| MSI GP65 Leopard 9SD | |
| MSI GP75 | |
| Acer Nitro 5 AN517-53-54DQ | |
| MSI GL75 | |
| 1920x1080 High Preset | |
| Average of class Gaming (n=1last 2 years) | |
| MSI GP65 Leopard 9SD | |
| Acer Nitro 5 AN517-53-54DQ | |
| MSI GP75 | |
| MSI GL75 | |
| 1920x1080 Medium Preset | |
| Average of class Gaming (n=1last 2 years) | |
| MSI GP65 Leopard 9SD | |
| Acer Nitro 5 AN517-53-54DQ | |
| MSI GP75 | |
| MSI GL75 | |
| Crysis Remastered | |
| 3840x2160 Very High Preset AA:SM | |
| Acer Nitro 5 AN517-53-54DQ | |
| MSI GP65 Leopard 9SD | |
| MSI GL75 | |
| MSI GP75 | |
| 2560x1440 Very High Preset AA:SM | |
| Average of class Gaming (n=1last 2 years) | |
| Acer Nitro 5 AN517-53-54DQ | |
| MSI GP65 Leopard 9SD | |
| MSI GL75 | |
| MSI GP75 | |
| 1920x1080 Very High Preset AA:SM | |
| Average of class Gaming (38.6 - 62, n=2, last 2 years) | |
| MSI GP65 Leopard 9SD | |
| Acer Nitro 5 AN517-53-54DQ | |
| MSI GL75 | |
| MSI GP75 | |
| 1920x1080 High Preset AA:SM | |
| Average of class Gaming (75.1 - 90.6, n=2, last 2 years) | |
| MSI GP65 Leopard 9SD | |
| Acer Nitro 5 AN517-53-54DQ | |
| MSI GP75 | |
| MSI GL75 | |
| 1920x1080 Medium Preset | |
| Average of class Gaming (182.7 - 190.9, n=2, last 2 years) | |
| MSI GP65 Leopard 9SD | |
| Acer Nitro 5 AN517-53-54DQ | |
| MSI GP75 | |
| MSI GL75 | |
| Yakuza Like a Dragon | |
| 3840x2160 Ultra Preset | |
| MSI GP65 Leopard 9SD | |
| Acer Nitro 5 AN517-53-54DQ | |
| MSI GP75 | |
| MSI GL75 | |
| 2560x1440 Ultra Preset | |
| MSI GP65 Leopard 9SD | |
| Acer Nitro 5 AN517-53-54DQ | |
| MSI GP75 | |
| MSI GL75 | |
| 1920x1080 Ultra Preset | |
| MSI GP65 Leopard 9SD | |
| Acer Nitro 5 AN517-53-54DQ | |
| MSI GP75 | |
| MSI GL75 | |
| 1920x1080 High Preset | |
| MSI GP65 Leopard 9SD | |
| Acer Nitro 5 AN517-53-54DQ | |
| MSI GP75 | |
| MSI GL75 | |
| 1920x1080 Medium Preset | |
| MSI GP65 Leopard 9SD | |
| Acer Nitro 5 AN517-53-54DQ | |
| MSI GP75 | |
| MSI GL75 | |
| Call of Duty Black Ops Cold War | |
| 1920x1080 Highest Settings + Ultra Ray Tracing | |
| MSI GP65 Leopard 9SD | |
| 3840x2160 Highest Settings | |
| MSI GP65 Leopard 9SD | |
| 2560x1440 Highest Settings | |
| MSI GP65 Leopard 9SD | |
| 1920x1080 Highest Settings | |
| MSI GP65 Leopard 9SD | |
| 1920x1080 High Settings | |
| MSI GP65 Leopard 9SD | |
| 1920x1080 Medium Settings | |
| MSI GP65 Leopard 9SD | |
| Assassin´s Creed Valhalla | |
| 3840x2160 Ultra High Preset | |
| Average of class Gaming (43 - 80, n=3, last 2 years) | |
| MSI GP65 Leopard 9SD | |
| 2560x1440 Ultra High Preset | |
| Average of class Gaming (72 - 138, n=4, last 2 years) | |
| MSI GP65 Leopard 9SD | |
| Acer Nitro 5 AN517-53-54DQ | |
| 1920x1080 Ultra High Preset | |
| Average of class Gaming (70 - 178, n=6, last 2 years) | |
| MSI GP65 Leopard 9SD | |
| Acer Nitro 5 AN517-53-54DQ | |
| 1920x1080 High Preset | |
| Average of class Gaming (92 - 195, n=5, last 2 years) | |
| MSI GP65 Leopard 9SD | |
| Acer Nitro 5 AN517-53-54DQ | |
| 1920x1080 Medium Preset | |
| Average of class Gaming (117 - 124, n=2, last 2 years) | |
| MSI GP65 Leopard 9SD | |
| Acer Nitro 5 AN517-53-54DQ | |
| Dirt 5 | |
| 3840x2160 Ultra High Preset | |
| MSI GP65 Leopard 9SD | |
| Acer Nitro 5 AN517-53-54DQ | |
| 2560x1440 Ultra High Preset | |
| Acer Nitro 5 AN517-53-54DQ | |
| MSI GP65 Leopard 9SD | |
| 1920x1080 Ultra High Preset | |
| Acer Nitro 5 AN517-53-54DQ | |
| MSI GP65 Leopard 9SD | |
| 1920x1080 High Preset | |
| MSI GP65 Leopard 9SD | |
| Acer Nitro 5 AN517-53-54DQ | |
| 1920x1080 Medium Preset | |
| MSI GP65 Leopard 9SD | |
| Acer Nitro 5 AN517-53-54DQ | |
| Watch Dogs Legion | |
| 1920x1080 Ultra Preset + Ultra Ray Tracing (DX12) | |
| Average of class Gaming (n=1last 2 years) | |
| MSI GP65 Leopard 9SD | |
| 3840x2160 Ultra Preset (DX12) | |
| MSI GP65 Leopard 9SD | |
| 2560x1440 Ultra Preset (DX12) | |
| Average of class Gaming (n=1last 2 years) | |
| MSI GP65 Leopard 9SD | |
| 1920x1080 Ultra Preset (DX12) | |
| Average of class Gaming (18 - 69.5, n=3, last 2 years) | |
| MSI GP65 Leopard 9SD | |
| 1920x1080 High Preset (DX12) | |
| Average of class Gaming (33 - 107, n=3, last 2 years) | |
| MSI GP65 Leopard 9SD | |
| Acer Nitro 5 AN517-53-54DQ | |
| 1920x1080 Medium Preset (DX12) | |
| Average of class Gaming (41 - 118.5, n=3, last 2 years) | |
| MSI GP65 Leopard 9SD | |
| Acer Nitro 5 AN517-53-54DQ | |
| FIFA 21 | |
| 3840x2160 Ultra Preset AA:4xMS | |
| MSI GP65 Leopard 9SD | |
| Acer Nitro 5 AN517-53-54DQ | |
| 2560x1440 Ultra Preset AA:4xMS | |
| MSI GP65 Leopard 9SD | |
| Acer Nitro 5 AN517-53-54DQ | |
| 1920x1080 Ultra Preset AA:4xMS | |
| MSI GP65 Leopard 9SD | |
| Acer Nitro 5 AN517-53-54DQ | |
| 1920x1080 High Preset AA:2xMS | |
| MSI GP65 Leopard 9SD | |
| Acer Nitro 5 AN517-53-54DQ | |
| 1920x1080 Medium Preset | |
| MSI GP65 Leopard 9SD | |
| Acer Nitro 5 AN517-53-54DQ | |
| 1280x720 Low Preset | |
| MSI GP65 Leopard 9SD | |
| Star Wars Squadrons | |
| 3840x2160 Ultra Preset | |
| MSI GP65 Leopard 9SD | |
| Acer Nitro 5 AN517-53-54DQ | |
| 2560x1440 Ultra Preset | |
| MSI GP65 Leopard 9SD | |
| Acer Nitro 5 AN517-53-54DQ | |
| 1920x1080 Ultra Preset | |
| MSI GP65 Leopard 9SD | |
| Acer Nitro 5 AN517-53-54DQ | |
| 1920x1080 High Preset | |
| MSI GP65 Leopard 9SD | |
| Acer Nitro 5 AN517-53-54DQ | |
| 1920x1080 Medium Preset | |
| MSI GP65 Leopard 9SD | |
| Acer Nitro 5 AN517-53-54DQ | |
| 1280x720 Low Preset | |
| MSI GP65 Leopard 9SD | |
| Mafia Definitive Edition | |
| 3840x2160 High Preset | |
| MSI GP65 Leopard 9SD | |
| Acer Nitro 5 AN517-53-54DQ | |
| 2560x1440 High Preset | |
| MSI GP65 Leopard 9SD | |
| Acer Nitro 5 AN517-53-54DQ | |
| 1920x1080 High Preset | |
| MSI GP65 Leopard 9SD | |
| Acer Nitro 5 AN517-53-54DQ | |
| 1920x1080 Medium Preset | |
| MSI GP65 Leopard 9SD | |
| Acer Nitro 5 AN517-53-54DQ | |
| 1280x720 Low Preset | |
| MSI GP65 Leopard 9SD | |
| Serious Sam 4 | |
| 2560x1440 Ultra (DX12) AA:2xMS | |
| MSI GP65 Leopard 9SD | |
| Acer Nitro 5 AN517-53-54DQ | |
| 1920x1080 Ultra (DX12) AA:2xMS | |
| MSI GP65 Leopard 9SD | |
| Acer Nitro 5 AN517-53-54DQ | |
| 1920x1080 High (DX12) | |
| MSI GP65 Leopard 9SD | |
| Acer Nitro 5 AN517-53-54DQ | |
| 1920x1080 Medium (DX12) | |
| MSI GP65 Leopard 9SD | |
| Acer Nitro 5 AN517-53-54DQ | |
| 1280x720 Lowest (DX12) | |
| MSI GP65 Leopard 9SD | |
| Flight Simulator 2020 | |
| 3840x2160 Ultra AA:TAA AF:16x | |
| MSI GP65 Leopard 9SD | |
| 2560x1440 Ultra AA:TAA AF:16x | |
| Average of class Gaming (n=1last 2 years) | |
| MSI GP65 Leopard 9SD | |
| 1920x1080 Ultra AA:TAA AF:16x | |
| Average of class Gaming (24.7 - 47.2, n=3, last 2 years) | |
| MSI GP65 Leopard 9SD | |
| 1920x1080 High-End AA:TAA AF:8x | |
| Average of class Gaming (10.4 - 65.1, n=4, last 2 years) | |
| MSI GP65 Leopard 9SD | |
| 1920x1080 Medium AA:TAA AF:4x | |
| Average of class Gaming (14.2 - 85.9, n=4, last 2 years) | |
| MSI GP65 Leopard 9SD | |
| 1280x720 Low-End AA:TAA | |
| Average of class Gaming (41.6 - 134.9, n=4, last 2 years) | |
| MSI GP65 Leopard 9SD | |
| Valorant | |
| 3840x2160 High / On AA:FX AF:16x | |
| Average of class Gaming (n=1last 2 years) | |
| MSI GP65 Leopard 9SD | |
| 2560x1440 High / On AA:FX AF:16x | |
| Average of class Gaming (n=1last 2 years) | |
| MSI GP65 Leopard 9SD | |
| 1920x1080 High / On AA:FX AF:16x | |
| MSI GP65 Leopard 9SD | |
| 1920x1080 Medium / On AF:8x | |
| MSI GP65 Leopard 9SD | |
| 1280x720 Low / Off AF:1x | |
| MSI GP65 Leopard 9SD | |
| Horizon Zero Dawn | |
| 3840x2160 Ultimate Quality | |
| MSI GP65 Leopard 9SD | |
| 2560x1440 Ultimate Quality | |
| Average of class Gaming (n=1last 2 years) | |
| MSI GP65 Leopard 9SD | |
| 1920x1080 Ultimate Quality | |
| Average of class Gaming (n=1last 2 years) | |
| MSI GP65 Leopard 9SD | |
| 1920x1080 Favor Quality | |
| Average of class Gaming (n=1last 2 years) | |
| MSI GP65 Leopard 9SD | |
| 1920x1080 Original | |
| MSI GP65 Leopard 9SD | |
| 1280x720 Favor Performance | |
| MSI GP65 Leopard 9SD | |
| Strange Brigade | |
| 3840x2160 ultra AA:ultra AF:16 | |
| Average of class Gaming (54.5 - 298, n=34, last 2 years) | |
| Acer Nitro 5 AN517-53-54DQ | |
| 2560x1440 ultra AA:ultra AF:16 | |
| Average of class Gaming (52.8 - 330, n=93, last 2 years) | |
| Acer Nitro 5 AN517-53-54DQ | |
| 1920x1080 ultra AA:ultra AF:16 | |
| Average of class Gaming (38.9 - 420, n=140, last 2 years) | |
| Acer Nitro 5 AN517-53-54DQ | |
| 1920x1080 high AA:high AF:8 | |
| Average of class Gaming (49.4 - 460, n=120, last 2 years) | |
| Acer Nitro 5 AN517-53-54DQ | |
| 1920x1080 medium AA:medium AF:4 | |
| Average of class Gaming (58.5 - 495, n=109, last 2 years) | |
| Acer Nitro 5 AN517-53-54DQ | |
| Death Stranding | |
| 3840x2160 Very High Preset | |
| MSI GP65 Leopard 9SD | |
| Acer Nitro 5 AN517-53-54DQ | |
| 2560x1440 Very High Preset | |
| Average of class Gaming (n=1last 2 years) | |
| MSI GP65 Leopard 9SD | |
| Acer Nitro 5 AN517-53-54DQ | |
| 1920x1080 Very High Preset | |
| Average of class Gaming (128.8 - 129.6, n=3, last 2 years) | |
| MSI GP65 Leopard 9SD | |
| Acer Nitro 5 AN517-53-54DQ | |
| 1920x1080 Default Preset | |
| Average of class Gaming (132 - 134.1, n=3, last 2 years) | |
| MSI GP65 Leopard 9SD | |
| Acer Nitro 5 AN517-53-54DQ | |
| 1920x1080 Medium Preset | |
| Average of class Gaming (140.5 - 145.2, n=3, last 2 years) | |
| MSI GP65 Leopard 9SD | |
| Acer Nitro 5 AN517-53-54DQ | |
| 1280x720 Low Preset | |
| Average of class Gaming (174.8 - 195.9, n=3, last 2 years) | |
| MSI GP65 Leopard 9SD | |
| F1 2020 | |
| 3840x2160 Ultra High Preset AA:T AF:16x | |
| MSI GP65 Leopard 9SD | |
| 2560x1440 Ultra High Preset AA:T AF:16x | |
| Average of class Gaming (n=1last 2 years) | |
| MSI GP65 Leopard 9SD | |
| 1920x1080 Ultra High Preset AA:T AF:16x | |
| Average of class Gaming (n=1last 2 years) | |
| MSI GP65 Leopard 9SD | |
| 1920x1080 High Preset AA:T AF:16x | |
| Average of class Gaming (n=1last 2 years) | |
| MSI GP65 Leopard 9SD | |
| 1920x1080 Medium Preset AF:16x | |
| Average of class Gaming (n=1last 2 years) | |
| MSI GP65 Leopard 9SD | |
| 1280x720 Ultra Low Preset | |
| Average of class Gaming (n=1last 2 years) | |
| MSI GP65 Leopard 9SD | |
| Gears Tactics | |
| 3840x2160 Ultra Preset | |
| MSI GP65 Leopard 9SD | |
| Acer Nitro 5 AN517-53-54DQ | |
| 2560x1440 Ultra Preset | |
| Average of class Gaming (n=1last 2 years) | |
| MSI GP65 Leopard 9SD | |
| Acer Nitro 5 AN517-53-54DQ | |
| 1920x1080 Ultra Preset | |
| Average of class Gaming (95.4 - 125.9, n=4, last 2 years) | |
| MSI GP65 Leopard 9SD | |
| Acer Nitro 5 AN517-53-54DQ | |
| 1920x1080 High Preset | |
| Average of class Gaming (133.9 - 180.5, n=4, last 2 years) | |
| MSI GP65 Leopard 9SD | |
| Acer Nitro 5 AN517-53-54DQ | |
| 1920x1080 Medium Preset | |
| Average of class Gaming (204 - 255, n=4, last 2 years) | |
| MSI GP65 Leopard 9SD | |
| Acer Nitro 5 AN517-53-54DQ | |
| 1280x720 Low Preset | |
| Average of class Gaming (304 - 381, n=4, last 2 years) | |
| MSI GP65 Leopard 9SD | |
| Doom Eternal | |
| 3840x2160 Ultra Preset | |
| MSI GP65 Leopard 9SD | |
| 2560x1440 Ultra Preset | |
| Average of class Gaming (n=1last 2 years) | |
| MSI GP65 Leopard 9SD | |
| 1920x1080 Ultra Preset | |
| Average of class Gaming (160.9 - 179, n=2, last 2 years) | |
| MSI GP65 Leopard 9SD | |
| 1920x1080 High Preset | |
| Average of class Gaming (184.3 - 208, n=2, last 2 years) | |
| MSI GP65 Leopard 9SD | |
| Acer Nitro 5 AN517-53-54DQ | |
| 1920x1080 Medium Preset | |
| Average of class Gaming (209 - 234, n=2, last 2 years) | |
| MSI GP65 Leopard 9SD | |
| Acer Nitro 5 AN517-53-54DQ | |
| 1280x720 Low Preset | |
| Average of class Gaming (376 - 391, n=2, last 2 years) | |
| MSI GP65 Leopard 9SD | |
| Hunt Showdown | |
| 3840x2160 High Preset | |
| MSI GP65 Leopard 9SD | |
| Acer Nitro 5 AN517-53-54DQ | |
| 2560x1440 High Preset | |
| MSI GP65 Leopard 9SD | |
| Acer Nitro 5 AN517-53-54DQ | |
| 1920x1080 High Preset | |
| MSI GP65 Leopard 9SD | |
| Acer Nitro 5 AN517-53-54DQ | |
| 1920x1080 Medium Preset | |
| MSI GP65 Leopard 9SD | |
| Acer Nitro 5 AN517-53-54DQ | |
| 1280x720 Low Preset | |
| MSI GP65 Leopard 9SD | |
| Escape from Tarkov | |
| 3840x2160 Ultra Preset | |
| MSI GP65 Leopard 9SD | |
| 2560x1440 Ultra Preset | |
| MSI GP65 Leopard 9SD | |
| 1920x1080 Ultra Preset | |
| MSI GP65 Leopard 9SD | |
| 1920x1080 High Preset | |
| MSI GP65 Leopard 9SD | |
| 1920x1080 Medium Preset | |
| MSI GP65 Leopard 9SD | |
| 1280x720 Low Preset | |
| MSI GP65 Leopard 9SD | |
| Red Dead Redemption 2 | |
| 3840x2160 Maximum Settings | |
| MSI GP65 Leopard 9SD | |
| 2560x1440 Maximum Settings | |
| MSI GP65 Leopard 9SD | |
| 1920x1080 Maximum Settings | |
| MSI GP65 Leopard 9SD | |
| 1920x1080 High Settings | |
| MSI GP65 Leopard 9SD | |
| 1920x1080 Medium Settings | |
| MSI GP65 Leopard 9SD | |
| 1280x720 Minimum Settings | |
| MSI GP65 Leopard 9SD | |
| Star Wars Jedi Fallen Order | |
| 3840x2160 Epic Preset | |
| MSI GP65 Leopard 9SD | |
| Acer Nitro 5 AN517-53-54DQ | |
| 2560x1440 Epic Preset | |
| MSI GP65 Leopard 9SD | |
| Acer Nitro 5 AN517-53-54DQ | |
| 1920x1080 Epic Preset | |
| MSI GP65 Leopard 9SD | |
| Acer Nitro 5 AN517-53-54DQ | |
| 1920x1080 High Preset | |
| MSI GP65 Leopard 9SD | |
| Acer Nitro 5 AN517-53-54DQ | |
| 1920x1080 Medium Preset | |
| MSI GP65 Leopard 9SD | |
| Acer Nitro 5 AN517-53-54DQ | |
| Need for Speed Heat | |
| 3840x2160 Ultra Preset | |
| MSI GP65 Leopard 9SD | |
| Acer Nitro 5 AN517-53-54DQ | |
| 2560x1440 Ultra Preset | |
| MSI GP65 Leopard 9SD | |
| Acer Nitro 5 AN517-53-54DQ | |
| 1920x1080 Ultra Preset | |
| MSI GP65 Leopard 9SD | |
| Acer Nitro 5 AN517-53-54DQ | |
| 1920x1080 High Preset | |
| MSI GP65 Leopard 9SD | |
| Acer Nitro 5 AN517-53-54DQ | |
| 1920x1080 Medium Preset | |
| MSI GP65 Leopard 9SD | |
| Acer Nitro 5 AN517-53-54DQ | |
| 1280x720 Low Preset | |
| MSI GP65 Leopard 9SD | |
| Call of Duty Modern Warfare 2019 | |
| 1920x1080 Maximum Settings with Raytracing AA:T2X Filmic SM | |
| MSI GP65 Leopard 9SD | |
| 3840x2160 Maximum Settings AA:T2X Filmic SM | |
| MSI GP65 Leopard 9SD | |
| 2560x1440 Maximum Settings AA:T2X Filmic SM | |
| MSI GP65 Leopard 9SD | |
| 1920x1080 Maximum Settings AA:T2X Filmic SM | |
| MSI GP65 Leopard 9SD | |
| 1920x1080 High Settings AA:1X SM | |
| MSI GP65 Leopard 9SD | |
| 1920x1080 Medium Settings | |
| MSI GP65 Leopard 9SD | |
| 1280x720 Minimum Settings | |
| MSI GP65 Leopard 9SD | |
| GRID 2019 | |
| 3840x2160 Ultra High Preset | |
| MSI GP65 Leopard 9SD | |
| Acer Nitro 5 AN517-53-54DQ | |
| 2560x1440 Ultra High Preset | |
| MSI GP65 Leopard 9SD | |
| Acer Nitro 5 AN517-53-54DQ | |
| 1920x1080 Ultra High Preset | |
| MSI GP65 Leopard 9SD | |
| Acer Nitro 5 AN517-53-54DQ | |
| 1920x1080 High Preset | |
| MSI GP65 Leopard 9SD | |
| Acer Nitro 5 AN517-53-54DQ | |
| 1920x1080 Medium Preset | |
| MSI GP65 Leopard 9SD | |
| Acer Nitro 5 AN517-53-54DQ | |
| 1280x720 Ultra Low Preset | |
| MSI GP65 Leopard 9SD | |
| Ghost Recon Breakpoint | |
| 3840x2160 Ultra Preset AA:T | |
| MSI GP65 Leopard 9SD | |
| 2560x1440 Ultra Preset AA:T | |
| MSI GP65 Leopard 9SD | |
| 1920x1080 Ultra Preset AA:T | |
| MSI GP65 Leopard 9SD | |
| 1920x1080 High Preset AA:T | |
| MSI GP65 Leopard 9SD | |
| 1920x1080 Medium Preset | |
| MSI GP65 Leopard 9SD | |
| 1280x720 Low Preset | |
| MSI GP65 Leopard 9SD | |
| FIFA 20 | |
| 3840x2160 Ultra Preset AA:4xMS | |
| MSI GP65 Leopard 9SD | |
| 2560x1440 Ultra Preset AA:4xMS | |
| MSI GP65 Leopard 9SD | |
| 1920x1080 Ultra Preset AA:4xMS | |
| MSI GP65 Leopard 9SD | |
| 1920x1080 High Preset AA:2xMS | |
| MSI GP65 Leopard 9SD | |
| 1920x1080 Medium Preset | |
| MSI GP65 Leopard 9SD | |
| 1280x720 Low Preset | |
| MSI GP65 Leopard 9SD | |
| Borderlands 3 | |
| 3840x2160 Badass Overall Quality (DX11) | |
| Acer Nitro 5 AN517-53-54DQ | |
| MSI GP65 Leopard 9SD | |
| 2560x1440 Badass Overall Quality (DX11) | |
| Average of class Gaming (n=1last 2 years) | |
| MSI GP65 Leopard 9SD | |
| Acer Nitro 5 AN517-53-54DQ | |
| 1920x1080 Badass Overall Quality (DX11) | |
| Average of class Gaming (n=1last 2 years) | |
| MSI GP65 Leopard 9SD | |
| Acer Nitro 5 AN517-53-54DQ | |
| 1920x1080 High Overall Quality (DX11) | |
| Average of class Gaming (n=1last 2 years) | |
| MSI GP65 Leopard 9SD | |
| Acer Nitro 5 AN517-53-54DQ | |
| 1920x1080 Medium Overall Quality (DX11) | |
| Average of class Gaming (n=1last 2 years) | |
| MSI GP65 Leopard 9SD | |
| Acer Nitro 5 AN517-53-54DQ | |
| 1280x720 Very Low Overall Quality (DX11) | |
| Average of class Gaming (n=1last 2 years) | |
| MSI GP65 Leopard 9SD | |
| Control | |
| 1920x1080 High Quality Preset & High Ray Tracing Preset (DX12) | |
| Average of class Gaming (n=1last 2 years) | |
| MSI GP65 Leopard 9SD | |
| 3840x2160 High Quality Preset (DX11) | |
| MSI GP65 Leopard 9SD | |
| Acer Nitro 5 AN517-53-54DQ | |
| 2560x1440 High Quality Preset (DX11) | |
| MSI GP65 Leopard 9SD | |
| Acer Nitro 5 AN517-53-54DQ | |
| 1920x1080 High Quality Preset (DX11) | |
| Average of class Gaming (n=1last 2 years) | |
| MSI GP65 Leopard 9SD | |
| Acer Nitro 5 AN517-53-54DQ | |
| 1920x1080 Medium Quality Preset (DX11) | |
| Average of class Gaming (n=1last 2 years) | |
| MSI GP65 Leopard 9SD | |
| Acer Nitro 5 AN517-53-54DQ | |
| 1280x720 Low Quality Preset (DX11) | |
| Average of class Gaming (n=1last 2 years) | |
| MSI GP65 Leopard 9SD | |
| F1 2019 | |
| 3840x2160 Ultra High Preset AA:T AF:16x | |
| MSI GP65 Leopard 9SD | |
| 2560x1440 Ultra High Preset AA:T AF:16x | |
| MSI GP65 Leopard 9SD | |
| 1920x1080 Ultra High Preset AA:T AF:16x | |
| MSI GP65 Leopard 9SD | |
| 1920x1080 High Preset AA:T AF:16x | |
| MSI GP65 Leopard 9SD | |
| 1920x1080 Medium Preset AA:T AF:16x | |
| MSI GP65 Leopard 9SD | |
| 1280x720 Ultra Low Preset | |
| MSI GP65 Leopard 9SD | |
| Rage 2 | |
| 3840x2160 Ultra Preset (Resolution Scale Off) | |
| Acer Nitro 5 AN517-53-54DQ | |
| 2560x1440 Ultra Preset (Resolution Scale Off) | |
| Acer Nitro 5 AN517-53-54DQ | |
| 1920x1080 Ultra Preset (Resolution Scale Off) | |
| Acer Nitro 5 AN517-53-54DQ | |
| 1920x1080 High Preset (Resolution Scale Off) | |
| Acer Nitro 5 AN517-53-54DQ | |
| 1920x1080 Medium Preset (Resolution Scale Off) | |
| Acer Nitro 5 AN517-53-54DQ | |
| Anno 1800 | |
| 3840x2160 Ultra Graphics Quality (DX11) | |
| Acer Nitro 5 AN517-53-54DQ | |
| 2560x1440 Ultra Graphics Quality (DX11) | |
| Acer Nitro 5 AN517-53-54DQ | |
| 1920x1080 Ultra Graphics Quality (DX11) | |
| Acer Nitro 5 AN517-53-54DQ | |
| 1920x1080 High Graphics Quality (DX11) | |
| Acer Nitro 5 AN517-53-54DQ | |
| 1920x1080 Medium Graphics Quality (DX11) | |
| Acer Nitro 5 AN517-53-54DQ | |
| The Division 2 | |
| 3840x2160 Ultra Preset | |
| Acer Nitro 5 AN517-53-54DQ | |
| 2560x1440 Ultra Preset | |
| Acer Nitro 5 AN517-53-54DQ | |
| 1920x1080 Ultra Preset | |
| Average of class Gaming (n=1last 2 years) | |
| Acer Nitro 5 AN517-53-54DQ | |
| 1920x1080 High Preset | |
| Average of class Gaming (n=1last 2 years) | |
| Acer Nitro 5 AN517-53-54DQ | |
| 1920x1080 Medium Preset | |
| Average of class Gaming (n=1last 2 years) | |
| Acer Nitro 5 AN517-53-54DQ | |
| Apex Legends | |
| 3840x2160 Maximum Settings AA:TS AF:16x | |
| Acer Nitro 5 AN517-53-54DQ | |
| 2560x1440 Maximum Settings AA:TS AF:16x | |
| Acer Nitro 5 AN517-53-54DQ | |
| 1920x1080 Maximum Settings AA:TS AF:16x | |
| Acer Nitro 5 AN517-53-54DQ | |
| 1920x1080 High Settings AA:TS AF:8x | |
| Acer Nitro 5 AN517-53-54DQ | |
| 1920x1080 Medium Settings AA:TS AF:4x | |
| Acer Nitro 5 AN517-53-54DQ | |
| Metro Exodus | |
| 3840x2160 Ultra Quality AF:16x | |
| Acer Nitro 5 AN517-53-54DQ | |
| 2560x1440 Ultra Quality AF:16x | |
| Average of class Gaming (n=1last 2 years) | |
| Acer Nitro 5 AN517-53-54DQ | |
| 1920x1080 Ultra Quality AF:16x | |
| Average of class Gaming (n=1last 2 years) | |
| Acer Nitro 5 AN517-53-54DQ | |
| 1920x1080 High Quality AF:16x | |
| Average of class Gaming (n=1last 2 years) | |
| Acer Nitro 5 AN517-53-54DQ | |
| 1920x1080 Medium Quality AF:4x | |
| Average of class Gaming (116.5 - 141.3, n=2, last 2 years) | |
| Acer Nitro 5 AN517-53-54DQ | |
| Battlefield V | |
| 3840x2160 Ultra Preset | |
| Acer Nitro 5 AN517-53-54DQ | |
| 2560x1440 Ultra Preset | |
| Acer Nitro 5 AN517-53-54DQ | |
| 1920x1080 Ultra Preset | |
| Acer Nitro 5 AN517-53-54DQ | |
| 1920x1080 High Preset | |
| Acer Nitro 5 AN517-53-54DQ | |
| 1920x1080 Medium Preset | |
| Acer Nitro 5 AN517-53-54DQ | |
| Shadow of the Tomb Raider | |
| 3840x2160 Highest Preset AA:T | |
| Average of class Gaming (50 - 120, n=9, last 2 years) | |
| Acer Nitro 5 AN517-53-54DQ | |
| 2560x1440 Highest Preset AA:T | |
| Average of class Gaming (60 - 199, n=16, last 2 years) | |
| Acer Nitro 5 AN517-53-54DQ | |
| 1920x1080 Highest Preset AA:T | |
| Average of class Gaming (27 - 271, n=16, last 2 years) | |
| Acer Nitro 5 AN517-53-54DQ | |
| 1920x1080 High Preset AA:SM | |
| Average of class Gaming (32 - 293, n=8, last 2 years) | |
| Acer Nitro 5 AN517-53-54DQ | |
| 1920x1080 Medium Preset | |
| Average of class Gaming (36 - 163.4, n=3, last 2 years) | |
| Acer Nitro 5 AN517-53-54DQ | |
| Far Cry 5 | |
| 3840x2160 Ultra Preset AA:T | |
| Average of class Gaming (39 - 113, n=20, last 2 years) | |
| Acer Nitro 5 AN517-53-54DQ | |
| 2560x1440 Ultra Preset AA:T | |
| Average of class Gaming (79 - 194, n=58, last 2 years) | |
| Acer Nitro 5 AN517-53-54DQ | |
| 1920x1080 Ultra Preset AA:T | |
| Average of class Gaming (34 - 218, n=76, last 2 years) | |
| Acer Nitro 5 AN517-53-54DQ | |
| 1920x1080 High Preset AA:T | |
| Average of class Gaming (35 - 232, n=74, last 2 years) | |
| Acer Nitro 5 AN517-53-54DQ | |
| 1920x1080 Medium Preset AA:T | |
| Average of class Gaming (38 - 248, n=66, last 2 years) | |
| Acer Nitro 5 AN517-53-54DQ | |
| X-Plane 11.11 | |
| 1920x1080 high (fps_test=3) | |
| Average of class Gaming (32.8 - 166.2, n=151, last 2 years) | |
| Acer Nitro 5 AN517-53-54DQ | |
| 1920x1080 med (fps_test=2) | |
| Average of class Gaming (38.9 - 193.1, n=147, last 2 years) | |
| Acer Nitro 5 AN517-53-54DQ | |
| 1280x720 low (fps_test=1) | |
| Average of class Gaming (39 - 221, n=147, last 2 years) | |
| Acer Nitro 5 AN517-53-54DQ | |
| Final Fantasy XV Benchmark | |
| 3840x2160 High Quality | |
| Average of class Gaming (32.6 - 101.3, n=36, last 2 years) | |
| Acer Nitro 5 AN517-53-54DQ | |
| 2560x1440 High Quality | |
| Average of class Gaming (32.5 - 169.2, n=100, last 2 years) | |
| Acer Nitro 5 AN517-53-54DQ | |
| 1920x1080 High Quality | |
| Average of class Gaming (19.2 - 201, n=144, last 2 years) | |
| Acer Nitro 5 AN517-53-54DQ | |
| 1920x1080 Standard Quality | |
| Average of class Gaming (33.5 - 232, n=119, last 2 years) | |
| Acer Nitro 5 AN517-53-54DQ | |
| Fortnite | |
| 2560x1440 Epic Preset | |
| MSI GP65 Leopard 9SD | |
| 1920x1080 Epic Preset | |
| MSI GP65 Leopard 9SD | |
| Playerunknown's Battlegrounds (PUBG) - 1920x1080 Ultra Preset | |
| MSI GP65 Leopard 9SD | |
| Dota 2 Reborn | |
| 1920x1080 ultra (3/3) best looking | |
| Average of class Gaming (65.1 - 220, n=148, last 2 years) | |
| Acer Nitro 5 AN517-53-54DQ | |
| 1920x1080 high (2/3) | |
| Average of class Gaming (69.3 - 244, n=147, last 2 years) | |
| Acer Nitro 5 AN517-53-54DQ | |
| 1366x768 med (1/3) | |
| Average of class Gaming (68.8 - 255, n=143, last 2 years) | |
| Acer Nitro 5 AN517-53-54DQ | |
| 1280x720 min (0/3) fastest | |
| Average of class Gaming (80.1 - 288, n=143, last 2 years) | |
| Acer Nitro 5 AN517-53-54DQ | |
| Overwatch - 2560x1440 Epic (Render Scale 100 %) AA:SM AF:16x | |
| MSI GP65 Leopard 9SD | |
| The Witcher 3 | |
| 3840x2160 High Graphics & Postprocessing (Nvidia HairWorks Off) | |
| Average of class Gaming (50.6 - 163.8, n=29, last 2 years) | |
| Acer Nitro 5 AN517-53-54DQ | |
| 1920x1080 Ultra Graphics & Postprocessing (HBAO+) | |
| Average of class Gaming (18.4 - 214, n=119, last 2 years) | |
| Acer Nitro 5 AN517-53-54DQ | |
| 1920x1080 High Graphics & Postprocessing (Nvidia HairWorks Off) | |
| Average of class Gaming (40.1 - 424, n=86, last 2 years) | |
| Acer Nitro 5 AN517-53-54DQ | |
| 1366x768 Medium Graphics & Postprocessing | |
| Average of class Gaming (168.5 - 592, n=70, last 2 years) | |
| Acer Nitro 5 AN517-53-54DQ | |
顶点:在60分钟的测试中 的时候Witcher 3(FHD/Ultra)没有出现任何异常。时钟速率和性能都相当稳定。
Witcher 3 FPS-Diagram
| low | med. | high | ultra | QHD | 4K | |
|---|---|---|---|---|---|---|
| GTA V (2015) | 157 | 120 | 63.9 | 48 | 46.3 | |
| The Witcher 3 (2015) | 142 | 84.5 | 48.7 | 33.2 | ||
| Dota 2 Reborn (2015) | 115 | 104 | 92.1 | 88.1 | ||
| Final Fantasy XV Benchmark (2018) | 71.8 | 48.6 | 33 | 17.4 | ||
| X-Plane 11.11 (2018) | 85.2 | 65.9 | 57.7 | |||
| Far Cry 5 (2018) | 86 | 80 | 74 | 52 | 19 | |
| Strange Brigade (2018) | 93.4 | 75.7 | 67.9 | 48.7 | 34 | |
| Shadow of the Tomb Raider (2018) | 66 | 63 | 57 | 44 | 23 | |
| Battlefield V (2018) | 92.8 | 89.4 | 83.2 | 65.7 | 35 | |
| Apex Legends (2019) | 126 | 100 | 89.8 | 68.4 | 37.1 | |
| Metro Exodus (2019) | 63.4 | 46.9 | 37.1 | 29 | 17.2 | |
| The Division 2 (2019) | 87 | 69 | 52 | 35 | 16 | |
| Anno 1800 (2019) | 88 | 60.3 | 31.2 | 22.9 | 12.4 | |
| Rage 2 (2019) | 81.3 | 69.8 | 68.8 | 43 | 14.2 | |
| Control (2019) | 62.1 | 45.1 | 29.1 | 13.3 | ||
| Borderlands 3 (2019) | 81.3 | 57.1 | 43.4 | 30.3 | 15.6 | |
| GRID 2019 (2019) | 93.3 | 71.1 | 36.4 | 22.8 | 11.4 | |
| Need for Speed Heat (2019) | 64.7 | 62.5 | 61.1 | 47.1 | 23.3 | |
| Star Wars Jedi Fallen Order (2019) | 86.6 | 80 | 71.6 | 52.6 | 25.3 | |
| Hunt Showdown (2020) | 73.5 | 67.7 | 42 | 19.5 | ||
| Doom Eternal (2020) | 133 | 107 | ||||
| Gears Tactics (2020) | 129 | 84.6 | 62.4 | 42.1 | 21.6 | |
| Death Stranding (2020) | 79.2 | 73.6 | 71 | 38.8 | 19 | |
| Crysis Remastered (2020) | 99.3 | 52.2 | 35.9 | 24.4 | 13.8 | |
| Serious Sam 4 (2020) | 63.5 | 48.9 | 39.1 | 29.9 | ||
| Mafia Definitive Edition (2020) | 64 | 58.9 | 40.1 | 20.4 | ||
| Star Wars Squadrons (2020) | 164 | 145 | 143 | 93.8 | 50.6 | |
| FIFA 21 (2020) | 186 | 180 | 175 | 166 | 112 | |
| Watch Dogs Legion (2020) | 61 | 54 | ||||
| Dirt 5 (2020) | 73.4 | 54.6 | 44.2 | 33 | 16.9 | |
| Assassin´s Creed Valhalla (2020) | 60 | 27 | 20 | 19 | ||
| Yakuza Like a Dragon (2020) | 57.1 | 55.3 | 50.7 | 37.1 | 19.1 | |
| Immortals Fenyx Rising (2020) | 69 | 50 | 45 | 29 | 15 | |
| Cyberpunk 2077 1.0 (2020) | 41.2 | 36 | 29.5 | 16.4 | 4.68 | |
| Hitman 3 (2021) | 103 | 60.5 | 55.7 | 39.7 | 21.4 | |
| Outriders (2021) | 53.2 | 51 | 47.2 | 30.6 | 22.9 | |
| Resident Evil Village (2021) | 73.5 | 66.6 | 57.2 | 41.6 | 17.4 | |
| Mass Effect Legendary Edition (2021) | 96.8 | 78.2 | 43.5 | |||
| Days Gone (2021) | 78.4 | 69.9 | 51.6 | 37.3 | 20.8 | |
| Monster Hunter Stories 2 (2021) | 95.6 | 91.4 | 78.4 | 60.5 | ||
| F1 2021 (2021) | 144 | 115 | 55 | 30 | 12 |
排放--相当不引人注目
噪声排放
噪音水平与竞争对手一致。虽然我们在空闲模式下可以从17英寸的设备中获得25至33分贝(A)(该设备在理想条件下是无声的),但在负载下是43至47分贝(A)(在使用一小时后平均44分贝(A)Witcher 3 )。简而言之:Nitro 5在3D模式下既不安静,也没有令人不快的声音。
Noise Level
| Idle |
| 25 / 31 / 33 dB(A) |
| Load |
| 43 / 47 dB(A) |
 | ||
30 dB silent 40 dB(A) audible 50 dB(A) loud |
||
min: | ||
| Acer Nitro 5 AN517-53-54DQ i5-11300H, GeForce RTX 3050 4GB Laptop GPU | HP Omen 15-ek0456ng i5-10300H, GeForce GTX 1660 Ti Mobile | Lenovo Legion 5 17IMH05 i5-10300H, GeForce GTX 1650 Mobile | MSI GF75 Thin 10SCXR i5-10300H, GeForce GTX 1650 Mobile | Asus TUF FX705DT-AU068T R5 3550H, GeForce GTX 1650 Mobile | Average of class Gaming | |
|---|---|---|---|---|---|---|
| Noise | -5% | 4% | -4% | -5% | 2% | |
| off / environment * | 25 | 27 -8% | 24 4% | 28.4 -14% | 30.8 -23% | 24 ? 4% |
| Idle Minimum * | 25 | 32.4 -30% | 24 4% | 33 -32% | 30.8 -23% | 25.6 ? -2% |
| Idle Average * | 31 | 32.4 -5% | 25 19% | 33 -6% | 30.8 1% | 27.2 ? 12% |
| Idle Maximum * | 33 | 32.4 2% | 29 12% | 33.1 -0% | 32.2 2% | 30.1 ? 9% |
| Load Average * | 43 | 32.5 24% | 43 -0% | 37.7 12% | 38.6 10% | 41.7 ? 3% |
| Witcher 3 ultra * | 44 | 47.2 -7% | 46 -5% | 39.2 11% | ||
| Load Maximum * | 47 | 51.9 -10% | 51 -9% | 46 2% | 44.8 5% | 53.3 ? -13% |
* ... smaller is better
温度
这台17英寸的笔记本电脑在温度发展方面也相当不显眼。考虑到所提供的性能,确定的机箱率是可以接受的 - 至少在上侧。在压力测试和60分钟的《 Witcher 3 》之后,底面的温度高达54℃(129.2°F),这就是为什么你在游戏时不一定要把笔记本放在腿上。当Nitro 5无事可做时,其表面保持令人愉悦的凉爽(低于30 °C/86 °F)。你可以在截图中看到组件(CPU、GPU等)的温度。


(-) The maximum temperature on the upper side is 47 °C / 117 F, compared to the average of 40.4 °C / 105 F, ranging from 21.2 to 68.8 °C for the class Gaming.
(-) The bottom heats up to a maximum of 54 °C / 129 F, compared to the average of 43.2 °C / 110 F
(+) In idle usage, the average temperature for the upper side is 24.6 °C / 76 F, compared to the device average of 33.9 °C / 93 F.
(-) Playing The Witcher 3, the average temperature for the upper side is 38.7 °C / 102 F, compared to the device average of 33.9 °C / 93 F.
(+) The palmrests and touchpad are reaching skin temperature as a maximum (32 °C / 89.6 F) and are therefore not hot.
(-) The average temperature of the palmrest area of similar devices was 28.9 °C / 84 F (-3.1 °C / -5.6 F).
| Acer Nitro 5 AN517-53-54DQ i5-11300H, GeForce RTX 3050 4GB Laptop GPU | HP Omen 15-ek0456ng i5-10300H, GeForce GTX 1660 Ti Mobile | Lenovo Legion 5 17IMH05 i5-10300H, GeForce GTX 1650 Mobile | MSI GF75 Thin 10SCXR i5-10300H, GeForce GTX 1650 Mobile | Asus TUF FX705DT-AU068T R5 3550H, GeForce GTX 1650 Mobile | Average of class Gaming | |
|---|---|---|---|---|---|---|
| Heat | 4% | -10% | -19% | -1% | -12% | |
| Maximum Upper Side * | 47 | 40.2 14% | 47 -0% | 42 11% | 41.6 11% | 46.2 ? 2% |
| Maximum Bottom * | 54 | 48.4 10% | 44 19% | 53.4 1% | 38 30% | 49.5 ? 8% |
| Idle Upper Side * | 25 | 25.6 -2% | 35 -40% | 34.2 -37% | 31.7 -27% | 31.4 ? -26% |
| Idle Bottom * | 25 | 26.7 -7% | 30 -20% | 37.4 -50% | 29.5 -18% | 32.6 ? -30% |
* ... smaller is better
演讲者
Acer Nitro 5 AN517-53-54DQ audio analysis
(±) | speaker loudness is average but good (79 dB)
Bass 100 - 315 Hz
(-) | nearly no bass - on average 19.2% lower than median
(±) | linearity of bass is average (10.7% delta to prev. frequency)
Mids 400 - 2000 Hz
(±) | higher mids - on average 5.5% higher than median
(+) | mids are linear (5.6% delta to prev. frequency)
Highs 2 - 16 kHz
(+) | balanced highs - only 2% away from median
(+) | highs are linear (3.6% delta to prev. frequency)
Overall 100 - 16.000 Hz
(±) | linearity of overall sound is average (17.9% difference to median)
Compared to same class
» 53% of all tested devices in this class were better, 9% similar, 38% worse
» The best had a delta of 6%, average was 18%, worst was 132%
Compared to all devices tested
» 34% of all tested devices were better, 8% similar, 58% worse
» The best had a delta of 4%, average was 24%, worst was 134%
HP Omen 15-ek0456ng audio analysis
(-) | not very loud speakers (58.1 dB)
Bass 100 - 315 Hz
(-) | nearly no bass - on average 17.3% lower than median
(±) | linearity of bass is average (13% delta to prev. frequency)
Mids 400 - 2000 Hz
(+) | balanced mids - only 3.4% away from median
(±) | linearity of mids is average (9.7% delta to prev. frequency)
Highs 2 - 16 kHz
(+) | balanced highs - only 3.2% away from median
(+) | highs are linear (5.4% delta to prev. frequency)
Overall 100 - 16.000 Hz
(±) | linearity of overall sound is average (22% difference to median)
Compared to same class
» 77% of all tested devices in this class were better, 6% similar, 17% worse
» The best had a delta of 6%, average was 18%, worst was 132%
Compared to all devices tested
» 61% of all tested devices were better, 7% similar, 32% worse
» The best had a delta of 4%, average was 24%, worst was 134%
电源管理 - 高运行时间
消耗功率
由于笔记本提供了图形切换功能,而且宏碁在目前的配置中没有使用高端硬件,因此能耗被控制在4到15瓦(空闲)和85到135瓦(负载)的范围内。135瓦的电源似乎是足够大的尺寸。
| Off / Standby | |
| Idle | |
| Load |
|
Key:
min: | |
| Acer Nitro 5 AN517-53-54DQ i5-11300H, GeForce RTX 3050 4GB Laptop GPU | HP Omen 15-ek0456ng i5-10300H, GeForce GTX 1660 Ti Mobile | Lenovo Legion 5 17IMH05 i5-10300H, GeForce GTX 1650 Mobile | MSI GF75 Thin 10SCXR i5-10300H, GeForce GTX 1650 Mobile | Asus TUF FX705DT-AU068T R5 3550H, GeForce GTX 1650 Mobile | Average of class Gaming | |
|---|---|---|---|---|---|---|
| Power Consumption | -49% | 13% | -57% | 17% | -104% | |
| Idle Minimum * | 4 | 9.2 -130% | 2 50% | 13 -225% | 3.9 2% | 13.4 ? -235% |
| Idle Average * | 9 | 14.6 -62% | 8 11% | 15.7 -74% | 9.6 -7% | 18.9 ? -110% |
| Idle Maximum * | 15 | 18.1 -21% | 16 -7% | 21 -40% | 12.2 19% | 26.3 ? -75% |
| Load Average * | 85 | 84 1% | 58 32% | 87 -2% | 59 31% | 102.7 ? -21% |
| Witcher 3 ultra * | 104 | 142 -37% | 89 14% | 96.4 7% | ||
| Load Maximum * | 135 | 194 -44% | 169 -25% | 145.8 -8% | 80 41% | 244 ? -81% |
* ... smaller is better
Power consumption Witcher 3 / Stresstest
电池寿命
经测试,Nitro 5的最大亮点之一是充足的电池寿命。尽管电池容量只有57瓦特(竞争对手有51-80瓦特),但在完美的条件下,即最低的显示亮度和没有负载的情况下,这台17英寸的笔记本可以持续17小时以上。对于一台游戏笔记本电脑来说,这一数值与在中等显示亮度下通过WLAN上网约7小时一样值得尊敬。
| Acer Nitro 5 AN517-53-54DQ i5-11300H, GeForce RTX 3050 4GB Laptop GPU, 57 Wh | HP Omen 15-ek0456ng i5-10300H, GeForce GTX 1660 Ti Mobile, 70.91 Wh | Lenovo Legion 5 17IMH05 i5-10300H, GeForce GTX 1650 Mobile, 80 Wh | MSI GF75 Thin 10SCXR i5-10300H, GeForce GTX 1650 Mobile, 51 Wh | Asus TUF FX705DT-AU068T R5 3550H, GeForce GTX 1650 Mobile, 64 Wh | Average of class Gaming | |
|---|---|---|---|---|---|---|
| Battery Runtime | -6% | 40% | -38% | 13% | -17% | |
| Reader / Idle | 1041 | 703 -32% | 1399 34% | 463 -56% | 815 -22% | 585 ? -44% |
| WiFi v1.3 | 432 | 391 -9% | 683 58% | 283 -34% | 469 9% | 387 ? -10% |
| Load | 82 | 101 23% | 104 27% | 63 -23% | 124 51% | 84.5 ? 3% |
| H.264 | 383 | 860 | 485 | 447 ? |
Pros
Cons
评语 - 总体表现良好


宏碁Nitro 5 AN517-53-54DQ对于那些希望在游戏笔记本上最多花费1000欧元(约1180美元)的价格敏感型游戏玩家来说是一个不错的选择。
这款17英寸的设备提供了--除了有点不幸的内存配置(单通道,单级)--平衡的硬件组合,只要你使用1,920 x 1,080的原生分辨率,就可以在高到最大的细节中流畅地渲染大多数当前游戏。
Core i5-11300H 和GeForce RTX 3050笔记本GPU 组成了一个成功的、具有价格吸引力的团队。
显示屏给人的感觉相当复杂。一方面,对比度和黑值令人满意,另一方面,色彩空间和亮度可以做得更好。其他方面(端口、外壳质量、输入设备等)几乎没有在人群中脱颖而出,大多处于中场。为数不多的独特卖点之一是慷慨的电池寿命,在互联网冲浪期间约为7小时。
目前基于RTX-3050或3050-Ti的对应产品相当罕见或几乎没有,这主要是因为仍然普遍存在的芯片短缺,但在未来几周和几个月内,它们应该变得越来越普遍。
价格和可用性
Acer Nitro 5 AN517-53-54DQ目前在notebooksbilliger.de上以999欧元(约1179美元)的价格出售。.
Acer Nitro 5 AN517-53-54DQ
- 08/11/2021 v7 (old)
Florian Glaser
Price comparison

