OCZ Vector 256 GB (VTR1-25SAT3-256G)测评
For the original German review, see here.
Indilinx was bought by OCZ in March 2011 to better control the quality of the SSDs that it was manufacturing. OCZ used to source the controller of its older Vertex SSDs (excluding the Vertex 4) from Sandforce. OCZ had very limited control over the quality of the firmware. Barefoot 2 was the first controller iteration that was introduced in the Vertex 4s. But the firmware was used on a Marvell chip and the SSDs did not find much traction with the consumer. ‘Barefoot 3’ has a lot of improvements that were needed to make the OCZ SSDs competitive.
Historically, OCZ has been selling a large number of SSDs by undercutting the prices of the competition. Now, they aim at the premium SSD market which requires the SSDs to offer excellent performance, quality and reliability. The Samsung SSD 840 Pro is currently one of the best performing SSDs and contains the tried and tested 25 nm MLC NAND flash chips. OCZ tries to follow suit by including similar innards but with its own controller, the ‘Barefoot 3’.
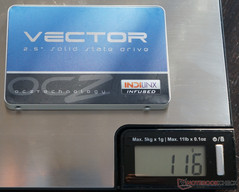
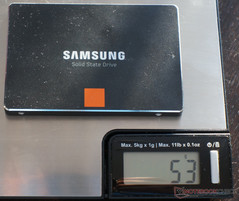
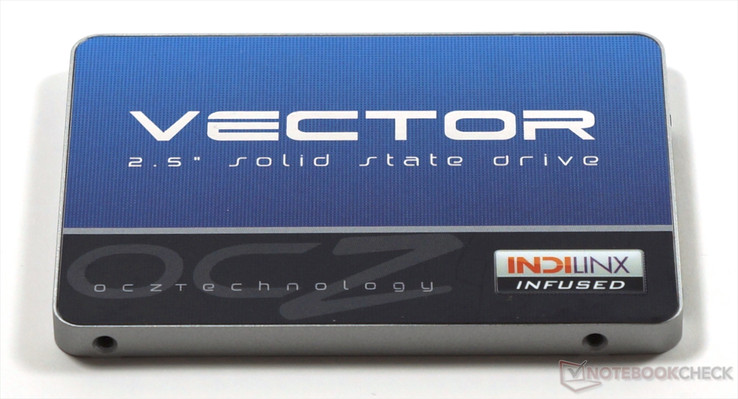
The Vector's design is simple. It comes in a heavy but stable metal case, with a label that has been well designed but haphazardly stuck on. On the scales, there is a pretty big weight disparity (116 g vs. 53 g, 4 oz vs. 1.9 oz), which is important above all for possible use in lightweight notebooks. The Samsung SSD is definitely the better looking and the much lighter device.
The OCZ Vector came with a 3.5-inch adapter with the necessary screws, a small information booklet and a sticker. The product also included the license for a copy of Acronis True Image Cloning software that is useful when trying to transfer data from the old HDD/SSD to the SSD.
对于的德国原装审查,在这里看到。
Indilinx的是2011年3月购买了OCZ的固态硬盘更好地控制质量,它是制造。 OCZ源使用其顶点的固态硬盘(不包括顶点4)从SandForce的控制器。 OCZ质量的固件非常有限的控制权。赤脚2是第一个控制器中引入的顶点4S的迭代。但在固件上使用Marvell的芯片和固态硬盘并没有太大的牵引与消费者。 “赤脚3'有很大的改进,需要OCZ固态硬盘竞争力的。
从历史上看,OCZ已经销售了大量的固态硬盘,削弱了价格竞争。现在,他们的目标是在高档的SSD市场需要提供优良的性能,质量和可靠性的固态硬盘。三星SSD840 Pro是目前表现最好的固态硬盘,并包含久经考验的25纳米MLC NAND闪存芯片。 OCZ尝试类似的内脏,但其自己的控制器,“赤脚3',跟风者。
Vector的设计很简单。它有一个沉重的,但稳定的金属外壳,得到了很好的设计,但随意停留在一个标签。放在秤上,是一个相当大的体重差距(116克为53克,4盎司 - 1.9盎司的),重要的是以上所有可能使用重量轻的笔记本电脑。三星SSD显然是更好的前瞻性和轻得多的设备。
OCZ矢量是必要的螺丝,一个小的信息小册子及贴纸,一块3.5英寸的适配器。该产品还包括许可证副本的Acronis True Image克隆软件是有用的,当试图将数据从旧的HDD / SSD的固态硬盘。
» Notebookcheck多媒体笔记本电脑Top 10排名
» Notebookcheck游戏笔记本电脑Top 10排名
» Notebookcheck低价办公/商务笔记本电脑Top 10排名
» Notebookcheck高端办公/商务笔记本电脑Top 10排名
» Notebookcheck工作站笔记本电脑Top 10排名
» Notebookcheck亚笔记本电脑Top 10排名
» Notebookcheck超级本产品Top 10排名
» Notebookcheck变形本产品Top 10排名
» Notebookcheck平板电脑Top 10排名
» Notebookcheck智能手机Top 10排名
» Notebookcheck评测过最出色的笔记本电脑屏幕
» Notebookcheck售价500欧元以下笔记本电脑Top 10排名
» Notebookcheck售价300欧元以下笔记本电脑Top 10排名
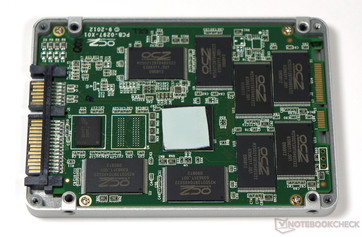
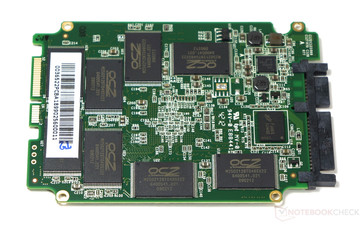
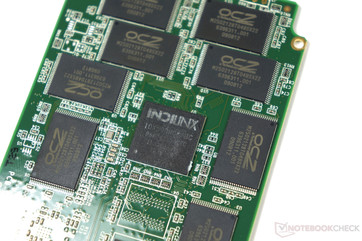
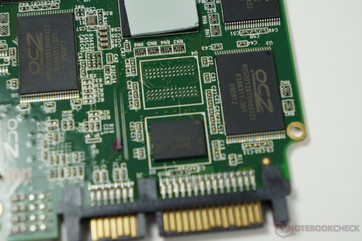
The new SATA 3.0 6 Gbit/s Indilinx 'Barefoot 3' Controller IDX50M00-BC is able to interact with the flash memory through 8 parallel data channels. Two 256 MB DDR3 DRAM chips by Micron act as cache for the controller. There is an open slot available on the PCB for a third chip. The Vector does not support automatic hardware encryption (AES). The 25 nm synchronous MLC NAND flash memory chips used in the SSD come from Intel Micron IMFT, but are cut and packed by OCZ themselves (hence the OCZ label).
新的SATA 3.0 Gbit / s的Indilinx的“赤脚”控制器IDX50M00-BC是通过8位并行数据通道,可以进行互动与快闪记忆体。两个256 MB DDR3 DRAM芯片,美光科技公司的行为作为控制器的高速缓存。有三分之一芯片是一个开放的PCB上的可用时隙。向量不支持自动硬件加密(AES)。同步的25纳米MLC NAND闪存芯片的SSD中使用来自英特尔,美光IMFT,但被切断,包装,OCZ本身(因此OCZ标签)。
Test System
Our test bed for the SSD was a desktop PC with an Intel Core i7-2600K (without overclocking), an Intel DP67BG mainboard, 8 GB DDR3 memory and an Nvidia GeForce GTX 470 graphics card. The SSD was placed in the SATA 3.0 6G Port 0 and was used with the Intel Rapid Storage driver 11.2.0.1006 under Windows 7 (64 bit).
我们的测试床的SSD是一个台式电脑,英特尔酷睿i7-2600K(不超频),英特尔DP67BG主板,8 GB DDR3内存和Nvidia的GeForce®(精视™)GTX 470显卡。固态硬盘被放置在SATA 3.06G端口0和使用英特尔快速存储驱动11.2.0.1006在Windows7(64位)。
Synthetic Benchmarks
Sequential transfer rates
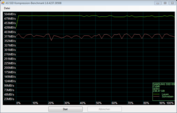
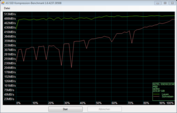
When it comes to sequential data transfer rates, the new Vector is one of the fastest SSDs out there. In the AS SSD benchmark (uses compressed data only) it is just faster than the Samsung 840 Pro. In the Crystal Disk Mark test, the ‘reads’ of the Vector fall behind that of the Samsung but the ‘writes’ are similar. Only in the HD Tune test does the Vector fall conspicuously behind the competition. It has to be noted that the Vertex 4 with the ‘Barefoot 2’ controller had similar problems in the same test.
Overall, the Vector is one of the fastest performing SSDs in the benchmarks and barely trails the Samsung 840 Pro.
当涉及到连续的数据传输速率,新的载体是有最快的固态硬盘之一。在AS SSD Benchmark的(仅使用压缩数据),它只是比三星的840临快。在水晶盘Mark测试中,'读'的矢量落后的三星,但“写”是类似的。只有在HD Tune的测试矢量下降明显落后于竞争对手。它的要注意的是顶点4与“赤脚2'控制器也有类似的问题,在同样的测试。
总体而言,Vector是在基准测试的执行速度最快的固态硬盘之一,仅仅落后于三星840 Pro的。
| AS SSD | |
| Seq Read (sort by value) | |
| OCZ Vector 256 GB Desktop | |
| Samsung SSD 840 Pro 256 GB Desktop | |
| Samsung SSD 840 250 GB Desktop | |
| Samsung SSD 830 256 GB Desktop | |
| Intel SSD 520 Series 240GB Desktop | |
| OCZ Vertex 4 256 GB Desktop | |
| Seq Write (sort by value) | |
| OCZ Vector 256 GB Desktop | |
| Samsung SSD 840 Pro 256 GB Desktop | |
| Samsung SSD 840 250 GB Desktop | |
| Samsung SSD 830 256 GB Desktop | |
| Intel SSD 520 Series 240GB Desktop | |
| OCZ Vertex 4 256 GB Desktop | |
| CrystalDiskMark 3.0 | |
| Read Seq (sort by value) | |
| OCZ Vector 256 GB Desktop | |
| Samsung SSD 840 Pro 256 GB Desktop | |
| Samsung SSD 840 250 GB Desktop | |
| Samsung SSD 830 256 GB Desktop | |
| Intel SSD 520 Series 240GB Desktop | |
| OCZ Vertex 4 256 GB Desktop | |
| Read 512 (sort by value) | |
| OCZ Vector 256 GB Desktop | |
| Samsung SSD 840 Pro 256 GB Desktop | |
| Samsung SSD 840 250 GB Desktop | |
| Samsung SSD 830 256 GB Desktop | |
| Intel SSD 520 Series 240GB Desktop | |
| OCZ Vertex 4 256 GB Desktop | |
| Write Seq (sort by value) | |
| OCZ Vector 256 GB Desktop | |
| Samsung SSD 840 Pro 256 GB Desktop | |
| Samsung SSD 840 250 GB Desktop | |
| Samsung SSD 830 256 GB Desktop | |
| Intel SSD 520 Series 240GB Desktop | |
| OCZ Vertex 4 256 GB Desktop | |
| Write 512 (sort by value) | |
| OCZ Vector 256 GB Desktop | |
| Samsung SSD 840 Pro 256 GB Desktop | |
| Samsung SSD 840 250 GB Desktop | |
| Samsung SSD 830 256 GB Desktop | |
| Intel SSD 520 Series 240GB Desktop | |
| OCZ Vertex 4 256 GB Desktop | |
When you compare SSDs running the Sandforce SF-2xxx controllers with the Vector and the 840 Pro, the results are dependent on the type of data (compressed or uncompressed) that has been used in the tests. The results of the Intel SSD 520 clearly show how dependent the Sandforce controller is on compressible data in order to obtain maximum write speeds (dependency on type of data for read speeds is lower).
当你运行的SandForce SF-2系列控制器的矢量和840 Pro的比较固态硬盘,其结果是依赖于(压缩或非压缩)已在测试中使用的数据类型。的英特尔SSD520的结果清楚地表明如何依赖的SandForce控制器是可压缩的数据,以获得最大写入速度(依赖于类型的数据读取速度较低)。
ATTO data rates
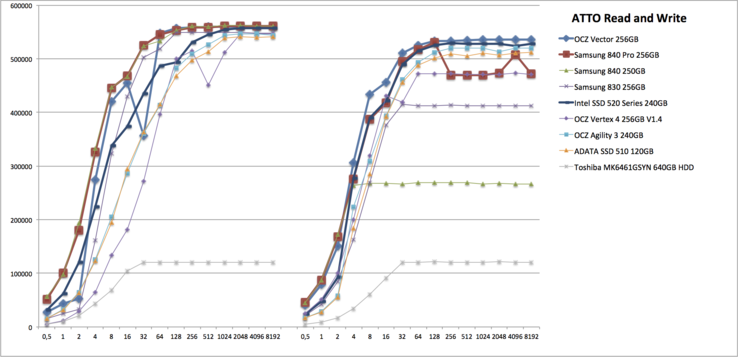
In the ATTO test, you can easily see the maximum transfer speeds for different block sizes. In the ’Read’ test, the Vector achieves the same outstanding results as the Samsung 840 Pro. There is a minor variance in the test results for the 32 KB block size.
In the ‘Write’ test, the Vector matches the performance of the Samsung 840 Pro and does overtake at certain points after the 4 KB run. Other than the hiccup in the test for read speeds, the Vector results are spectacular.
在ATTO测试中,你可以很容易地看到不同的块大小的最大传输速度。在“读取”测试,矢量达到三星的840 PRO同样出色的结果。有一个小的块大小为32 KB的测试结果差异。
在“写入”测试中,矢量,三星840 PRO的性能相匹配的,不超过4 KB运行在某些点后。除在测试读取速度的打嗝,矢量结果壮观。
4K data rates
As far as the 4K data rates go, the Samsung SSD 840 Pro has about a 6% lead over the OCZ Vector. The Vertex 4 comes in behind the Vector with a similar gap in performance between them. The Samsung 840 Basic, Intel 520 and Samsung 830 make up the list in that order.
至于4K的数据传输速率,三星SSD840 Pro拥有约6%的铅在OCZ载体。顶点4在后面的载体,它们之间具有相似的性能差距。三星,英特尔520和三星830840基本弥补的列表中的顺序。
| AS SSD | |
| 4K Read (sort by value) | |
| OCZ Vector 256 GB Desktop | |
| Samsung SSD 840 Pro 256 GB Desktop | |
| Samsung SSD 840 250 GB Desktop | |
| Samsung SSD 830 256 GB Desktop | |
| Intel SSD 520 Series 240GB Desktop | |
| OCZ Vertex 4 256 GB Desktop | |
| 4K Write (sort by value) | |
| OCZ Vector 256 GB Desktop | |
| Samsung SSD 840 Pro 256 GB Desktop | |
| Samsung SSD 840 250 GB Desktop | |
| Samsung SSD 830 256 GB Desktop | |
| Intel SSD 520 Series 240GB Desktop | |
| OCZ Vertex 4 256 GB Desktop | |
| 4K-64 Read (sort by value) | |
| OCZ Vector 256 GB Desktop | |
| Samsung SSD 840 Pro 256 GB Desktop | |
| Samsung SSD 840 250 GB Desktop | |
| Samsung SSD 830 256 GB Desktop | |
| Intel SSD 520 Series 240GB Desktop | |
| OCZ Vertex 4 256 GB Desktop | |
| 4K-64 Write (sort by value) | |
| OCZ Vector 256 GB Desktop | |
| Samsung SSD 840 Pro 256 GB Desktop | |
| Samsung SSD 840 250 GB Desktop | |
| Samsung SSD 830 256 GB Desktop | |
| Intel SSD 520 Series 240GB Desktop | |
| OCZ Vertex 4 256 GB Desktop | |
| CrystalDiskMark 3.0 | |
| Read 4k (sort by value) | |
| OCZ Vector 256 GB Desktop | |
| Samsung SSD 840 Pro 256 GB Desktop | |
| Samsung SSD 840 250 GB Desktop | |
| Samsung SSD 830 256 GB Desktop | |
| Intel SSD 520 Series 240GB Desktop | |
| OCZ Vertex 4 256 GB Desktop | |
| Write 4k (sort by value) | |
| OCZ Vector 256 GB Desktop | |
| Samsung SSD 840 Pro 256 GB Desktop | |
| Samsung SSD 840 250 GB Desktop | |
| Samsung SSD 830 256 GB Desktop | |
| Intel SSD 520 Series 240GB Desktop | |
| OCZ Vertex 4 256 GB Desktop | |
| Read 4k QD32 (sort by value) | |
| OCZ Vector 256 GB Desktop | |
| Samsung SSD 840 Pro 256 GB Desktop | |
| Samsung SSD 840 250 GB Desktop | |
| Samsung SSD 830 256 GB Desktop | |
| Intel SSD 520 Series 240GB Desktop | |
| OCZ Vertex 4 256 GB Desktop | |
| Write 4k QD32 (sort by value) | |
| OCZ Vector 256 GB Desktop | |
| Samsung SSD 840 Pro 256 GB Desktop | |
| Samsung SSD 840 250 GB Desktop | |
| Samsung SSD 830 256 GB Desktop | |
| Intel SSD 520 Series 240GB Desktop | |
| OCZ Vertex 4 256 GB Desktop | |
Access times
The new OCZ Vector achieves extraordinary results for access time in the AS SSD benchmark. The Vector shows slower access times for writes than the Vertex 4 only. The Vertex 4, however, had clear weaknesses when it came to read access times. Once again, the Vector is one of the top performers in this test overall.
新的OCZ矢量取得了不平凡的业绩,在AS SSD Benchmark的访问时间。矢量显示只比顶点4的写访问速度较慢的时间。顶点4,然而,有明确的弱点,当它来读取时间。再次,Vector是在这个测试中整体表现最好的之一。
| AS SSD | |
| Access Time Read (sort by value) | |
| OCZ Vector 256 GB Desktop | |
| Samsung SSD 840 Pro 256 GB Desktop | |
| Samsung SSD 840 250 GB Desktop | |
| Samsung SSD 830 256 GB Desktop | |
| Intel SSD 520 Series 240GB Desktop | |
| OCZ Vertex 4 256 GB Desktop | |
| Access Time Write (sort by value) | |
| OCZ Vector 256 GB Desktop | |
| Samsung SSD 840 Pro 256 GB Desktop | |
| Samsung SSD 840 250 GB Desktop | |
| Samsung SSD 830 256 GB Desktop | |
| Intel SSD 520 Series 240GB Desktop | |
| OCZ Vertex 4 256 GB Desktop | |
* ... smaller is better
PCMark System Performance
We measure the SSD application performance with help of PCMark Vantage and the newer PCMark 7 benchmarks.
In the newer PCMark 7, the Vector has the highest result of all the SSDs tested in the system. The Samsung 840 Pro is behind by only 2%. The 840 Pro clambers over the Vector in the System Storage subtest by 3%. The fastest tested storage unit is incidentally found in the Asus UX51VZ with two ADATA XM11 SSDs (in RAID). But the three percent lead isn't terribly large.
In the older PCMark Vantage benchmark, the Vector falls behind the older Samsung SSD 830 and the Intel 520 SSD in terms of overall scores. The difference in scores between the Vector and the Samsung 840 Pro are miniscule at best. The ’premium’ SSDs all huddle together in a 7 percent variance window with hardly any noticeable differences. In the HDD sub-score, the Vector is positioned right behind the 840 Pro once again, which is faster by 9%.
我们衡量SSD的应用性能,PCMark Vantage的帮助下和新的PCMark 7基准。
Vector中在较新的PCMark 7,具有最高的系统中的测试结果,所有的固态硬盘。三星840 Pro是落后,只有2%。 840 PRO,它又爬上在系统存储载体的分测验3%。在华硕UX51VZ两个ADATA XM11固态硬盘(RAID),测试速度最快的存储单元时偶然发现。但3%的铅是不是非常大。
在PCMark Vantage的基准,矢量落后于旧的三星SSD830和Intel520 SSD的整体成绩。在最好的载体和三星840的分数之间的差异是微乎其微。 '高级'的固态硬盘全部挤在了7%,方差窗口几乎没有任何明显的差异。在HDD子分数,矢量定位背后的840 PRO再次,这是快了9%。
| PCMark Vantage | |
| 1024x768 HDD Score (sort by value) | |
| OCZ Vector 256 GB Desktop | |
| Samsung SSD 840 Pro 256 GB Desktop | |
| Samsung SSD 840 250 GB Desktop | |
| Samsung SSD 830 256 GB Desktop | |
| Intel SSD 520 Series 240GB Desktop | |
| OCZ Vertex 4 256 GB Desktop | |
| 1024x768 Productivity Score (sort by value) | |
| OCZ Vector 256 GB Desktop | |
| Samsung SSD 840 Pro 256 GB Desktop | |
| Samsung SSD 840 250 GB Desktop | |
| Samsung SSD 830 256 GB Desktop | |
| Intel SSD 520 Series 240GB Desktop | |
| OCZ Vertex 4 256 GB Desktop | |
| 1024x768 Communications Score (sort by value) | |
| OCZ Vector 256 GB Desktop | |
| Samsung SSD 840 Pro 256 GB Desktop | |
| Samsung SSD 840 250 GB Desktop | |
| Samsung SSD 830 256 GB Desktop | |
| Intel SSD 520 Series 240GB Desktop | |
| OCZ Vertex 4 256 GB Desktop | |
| 1024x768 Music Score (sort by value) | |
| OCZ Vector 256 GB Desktop | |
| Samsung SSD 840 Pro 256 GB Desktop | |
| Samsung SSD 840 250 GB Desktop | |
| Samsung SSD 830 256 GB Desktop | |
| Intel SSD 520 Series 240GB Desktop | |
| OCZ Vertex 4 256 GB Desktop | |
| 1024x768 Gaming Score (sort by value) | |
| OCZ Vector 256 GB Desktop | |
| Samsung SSD 840 Pro 256 GB Desktop | |
| Samsung SSD 840 250 GB Desktop | |
| Samsung SSD 830 256 GB Desktop | |
| Intel SSD 520 Series 240GB Desktop | |
| OCZ Vertex 4 256 GB Desktop | |
| 1024x768 TV and Movies Score (sort by value) | |
| OCZ Vector 256 GB Desktop | |
| Samsung SSD 840 Pro 256 GB Desktop | |
| Samsung SSD 840 250 GB Desktop | |
| Samsung SSD 830 256 GB Desktop | |
| Intel SSD 520 Series 240GB Desktop | |
| OCZ Vertex 4 256 GB Desktop | |
| 1024x768 Memories Score (sort by value) | |
| OCZ Vector 256 GB Desktop | |
| Samsung SSD 840 Pro 256 GB Desktop | |
| Samsung SSD 840 250 GB Desktop | |
| Samsung SSD 830 256 GB Desktop | |
| Intel SSD 520 Series 240GB Desktop | |
| OCZ Vertex 4 256 GB Desktop | |
| 1024x768 Result (sort by value) | |
| OCZ Vector 256 GB Desktop | |
| Samsung SSD 840 Pro 256 GB Desktop | |
| Samsung SSD 840 250 GB Desktop | |
| Samsung SSD 830 256 GB Desktop | |
| Intel SSD 520 Series 240GB Desktop | |
| OCZ Vertex 4 256 GB Desktop | |
| PCMark 7 | |
| System Storage (sort by value) | |
| OCZ Vector 256 GB Desktop | |
| Samsung SSD 840 Pro 256 GB Desktop | |
| Samsung SSD 840 250 GB Desktop | |
| Samsung SSD 830 256 GB Desktop | |
| Intel SSD 520 Series 240GB Desktop | |
| OCZ Vertex 4 256 GB Desktop | |
| Computation (sort by value) | |
| OCZ Vector 256 GB Desktop | |
| Samsung SSD 840 Pro 256 GB Desktop | |
| Samsung SSD 840 250 GB Desktop | |
| Samsung SSD 830 256 GB Desktop | |
| Intel SSD 520 Series 240GB Desktop | |
| OCZ Vertex 4 256 GB Desktop | |
| Creativity (sort by value) | |
| OCZ Vector 256 GB Desktop | |
| Samsung SSD 840 Pro 256 GB Desktop | |
| Samsung SSD 840 250 GB Desktop | |
| Samsung SSD 830 256 GB Desktop | |
| Intel SSD 520 Series 240GB Desktop | |
| OCZ Vertex 4 256 GB Desktop | |
| Entertainment (sort by value) | |
| OCZ Vector 256 GB Desktop | |
| Samsung SSD 840 Pro 256 GB Desktop | |
| Samsung SSD 840 250 GB Desktop | |
| Samsung SSD 830 256 GB Desktop | |
| Intel SSD 520 Series 240GB Desktop | |
| OCZ Vertex 4 256 GB Desktop | |
| Productivity (sort by value) | |
| OCZ Vector 256 GB Desktop | |
| Samsung SSD 840 Pro 256 GB Desktop | |
| Samsung SSD 840 250 GB Desktop | |
| Samsung SSD 830 256 GB Desktop | |
| Intel SSD 520 Series 240GB Desktop | |
| OCZ Vertex 4 256 GB Desktop | |
| Lightweight (sort by value) | |
| OCZ Vector 256 GB Desktop | |
| Samsung SSD 840 Pro 256 GB Desktop | |
| Samsung SSD 840 250 GB Desktop | |
| Samsung SSD 830 256 GB Desktop | |
| Intel SSD 520 Series 240GB Desktop | |
| OCZ Vertex 4 256 GB Desktop | |
| Score (sort by value) | |
| OCZ Vector 256 GB Desktop | |
| Samsung SSD 840 Pro 256 GB Desktop | |
| Samsung SSD 840 250 GB Desktop | |
| Samsung SSD 830 256 GB Desktop | |
| Intel SSD 520 Series 240GB Desktop | |
| OCZ Vertex 4 256 GB Desktop | |
Application Profiles with IOMeter
You can also test the practical performance of an SSD with the "IOMix" - c`t Application profile and "Workstation" for the IOMeter software. Both are access profiles that try and simulate realistic usage of the SSD by regular users (IOMix) and/or a workstation. In both tests, the Vector comes away with another win in this test. Even the fast Intel SSD 520 and the Vertex 4 are clearly trumped by the Vector.
您还可以测试SSD与“IOMix” - C`T应用的配置文件和“工作站”的IOMeter测试软件的实际性能。两者都尝试和模拟普通用户实际使用的SSD(IOMix)和/或工作站的访问配置文件。在这两项测试中,向量在本次测试的另一次胜利。即使是快速的英特尔SSD520和Vertex4清楚地战胜了由Vector。
| IOMeter | |
| Workstation, 3min, 10GB Partition (sort by value) | |
| OCZ Vector 256 GB Desktop | |
| Samsung SSD 840 Pro 256 GB Desktop | |
| Samsung SSD 840 250 GB Desktop | |
| Samsung SSD 830 256 GB Desktop | |
| Intel SSD 520 Series 240GB Desktop | |
| OCZ Vertex 4 256 GB Desktop | |
| IOMix, 5min, 10GB Partition (sort by value) | |
| OCZ Vector 256 GB Desktop | |
| Samsung SSD 840 Pro 256 GB Desktop | |
| Samsung SSD 840 250 GB Desktop | |
| Samsung SSD 830 256 GB Desktop | |
| Intel SSD 520 Series 240GB Desktop | |
| OCZ Vertex 4 256 GB Desktop | |
Resistance to Performance Drops
OCZ advertises the Vector as being especially resistant to drops in performance (lags/latency) when heavily loaded. In order to test this, we put SSDs through a stress test with the IOMix profile. In this test, data is written to the SSD and read repeatedly for 60 minutes. At 68 MB/s, the Vector's results are distinctly ahead of those of the Samsung SSDs (830, 840 Pro and 840). But thanks to over-provisioning, the Intel 520 Series with a Sandforce controller and larger memory reserves is clearly ahead with a result 200 MB/s taking the top spot.
Over-provisioning is a method employed by SSD manufacturers to extend the life of the SSD flash modules. It is not represented in the total available space for use. It helps in the distribution of writes and erases throughout the NAND chips and also provides a buffer for the controller to manage the writes and erase cycles. During garbage collection, over-provisioning reduces write amplification when the controller writes to the memory. The Samsung 840 Basic also has more free memory space available, which explains its minor lead over the 840 Pro.
OCZ发布的载体,特别是耐滴性能(延迟/延迟)时重仓。为了测试这一点,我们把固态硬盘的通过压力测试的IOMix配置文件。在该试验中,数据被写入到SSD,60分钟,重复读取。在68 MB/秒,Vector的结果有明显提前的三星固态硬盘(830,840 Pro和840)。但是,由于过度配置,英特尔520系列与SandForce控制器和更大的内存储量明显领先与200 MB/ s的第一把交椅。
以上配置是采用SSD制造商的方法,以延长寿命的SSD闪存模块。中未表示的总的可用空间的使用。它有助于分配的写入和擦除整个NAND芯片还提供了一个缓冲的控制器管理的写入和擦除周期。垃圾收集过程中,过度供应,降低写入放大时,控制器写入内存。三星840基本也有更多的可用内存,可用空间超过840 Pro的,这说明它含有少量的铅。
Practical Tests
For our practical tests, we use the good ol' stopwatch to examine the performance of the SSD as a system disk. Looking at the booting of Windows 7, you can hardly tell the difference between all the SSDs. The boot times for the Samsung 830, Intel 520 and the Vector are all between 33 and 34 seconds. According to our tests, the older Samsung 470 needed one second longer to boot to the desktop.
In the copying of gaming files from the folder containing Supreme Commander - Forged Alliance, the Vector doesn't really do well when you compare it to other SSDs. The folder is 7.29 GB in size and contains 2101 files. In duplicating data on the SSD, the Vector "only" achieves the results of the Intel 520 and OCZ Vertex 4 (though the Vertex gave us varying results). Still the undisputed winner is the older Samsung 830 with an average of 42 seconds (followed by the 840 Pro in about 43-45 seconds). Older SATA 2 SSDs like the Samsung 470 need one to two minutes to complete this test.
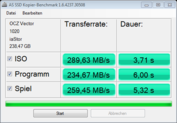
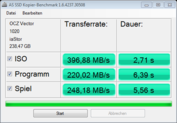
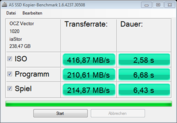
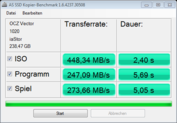
In the AS SSD copying benchmark, the Vector, like the Samsung 840 Pro, doesn't give a consistent result. At its best, the Vector does slightly better than the Samsung 840 Pro in all the subtests, but its weakest results lie distinctly lower than the weakest results of the 840 Pro.
In starting the single-player mode of Battlefield 3, all the modern SSDs need about 19-20 seconds. Even the old Samsung 470 needs a maximum of one second longer. In comparison, a traditional Toshiba MK6461GSYN 640 GB 7200rpm notebook hard drive needs 72 seconds for the same task.
对于我们的实际测试中,我们使用好醇'秒表检查SSD作为系统盘的性能。在Windows 7的启动,你很难告诉所有的固态硬盘之间的区别。三星830,英特尔520和Vector的启动时间是33秒和34秒之间。根据我们的测试,三星470需要,一秒启动到桌面。
在复制的游戏文件的文件夹中最高指挥官 - 锻造联盟,矢量并没有真正做的很好,当你把它比作其它固态硬盘。该文件夹的大小是7.29 GB,包含2101文件。在复制的SSD上的数据,矢量“只”实现的Intel520和OCZ的顶点(顶点虽然给了我们不同的结果)的结果。仍然是无可争议的赢家是三星830,平均42秒(840 Pro在约43-45秒)。较旧的SATA固态硬盘,如三星470需要一到两分钟来完成这个测试。
在AS SSD复制基准,矢量,如三星840 Pro的,不给予一致的结果。在其最好的,矢量,略好于三星840 Pro在所有的子测试,但其最薄弱的结果躺在明显低于最弱的结果的840 PRO。
在开始的“战地3”的单人游戏模式中,所有的现代固态硬盘需要约19-20秒。即使是老三星470需要一秒钟的时间最多。相比较而言,传统的东芝MK6461GSYN640 GB7200转笔记本电脑硬盘驱动器需要7
| AS SSD | |
| Copy Game MB/s (sort by value) | |
| OCZ Vector 256 GB Desktop | |
| Samsung SSD 840 Pro 256 GB Desktop | |
| Samsung SSD 840 250 GB Desktop | |
| Samsung SSD 830 256 GB Desktop | |
| Intel SSD 520 Series 240GB Desktop | |
| OCZ Vertex 4 256 GB Desktop | |
| Copy Program MB/s (sort by value) | |
| OCZ Vector 256 GB Desktop | |
| Samsung SSD 840 Pro 256 GB Desktop | |
| Samsung SSD 840 250 GB Desktop | |
| Samsung SSD 830 256 GB Desktop | |
| Intel SSD 520 Series 240GB Desktop | |
| OCZ Vertex 4 256 GB Desktop | |
| Copy ISO MB/s (sort by value) | |
| OCZ Vector 256 GB Desktop | |
| Samsung SSD 840 Pro 256 GB Desktop | |
| Samsung SSD 840 250 GB Desktop | |
| Samsung SSD 830 256 GB Desktop | |
| Intel SSD 520 Series 240GB Desktop | |
| OCZ Vertex 4 256 GB Desktop | |
Power Consumption
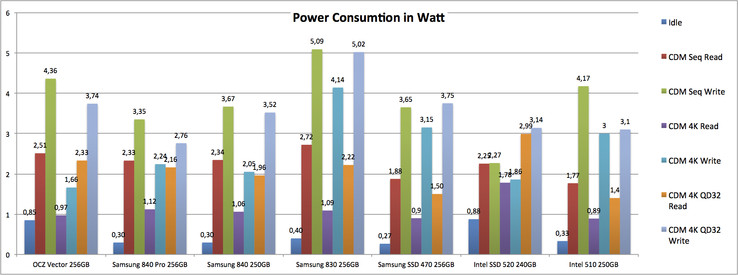
We test the SSD power consumption with two multi-meters on the same desktop used to conduct our benchmark tests. Unfortunately the system doesn't offer any DMPI support, though all notebooks do, which means the power consumption in idle mode doesn't fall like it can in mobile systems (so far we only know of the Samsung SSD 840 Series that takes full advantage of this and drops to 0.04 Watts).
On average, taking all measured values into account, the OCZ Vector does extraordinarily well - coming in in second place, right behind the Samsung SSD 840 Pro. Unfortunately for notebook users, there's a slight drawback. Without load, the power consumption level is considerably higher than that of the competition. Since this load state is the most common in mobile use, this is clearly reflected in the results.
在同一桌面上进行我们的基准测试,我们测试的SSD功耗两个多米。不幸的是,系统不提供任何DMPI的支持,虽然所有的笔记本电脑在空闲模式下的功耗,这意味着如不属于它可以在移动通信系统(到目前为止,我们只知道的三星SSD840系列,以充分利用这一点,下降到0.04瓦)。
平均而言,考虑到所有的测量值,OCZ矢量确实非常好 - 在第二位,仅次于三星的SSD840 Pro的未来。不幸的是,对于笔记本用户来说,有一个轻微的缺点。无负载时,功率消耗电平比的竞争是相当高的。由于这种负载在移动使用中的状态是最常见的,这清楚地反映在结果中。
Verdict
The OCZ Vector is OCZ's first ’premium’ SSD with its own controller (software and hardware). The performance measurements in our test system speak for themselves and are, on average, at the same level as the Samsung SSD 840 Pro. The Vector makes an excellent impression, especially when using the application profiles IOMix and Workstation in the IOMeter and the PCMark 7 test. The relatively small performance drop in the stress test is also a clear plus factor.
The relatively high weight and the high idle power consumption unfortunately disqualify the Vector for use in lightweight subnotebooks.
Price-wise, the Vector currently sells at around the same price as the Samsung 840 Pro, making it cheaper than the Intel 520.
As is always the case, when new controllers are introduced, reliability is unknown. The Vector has to prove its reliability. But with a 5-year warranty, OCZ strongly expresses their confidence in the Vector.
In conclusion, the Vector is a very good product from OCZ that sets bar high in many areas and is especially suited for use in desktop machines.
OCZ Vector是OCZ的第一个'高级'的SSD其自己的控制器(软件和硬件)。在我们的测试系统的性能测量为自己说话,是,平均而言,在同级别的三星SSD840 Pro的。向量极好的印象,尤其是在使用应用程序时的配置文件IOMix和工作站的IOMeter测试的PCMark7测试。在压力测试是比较小的性能下降也有明显的有利因素。
不幸的是,权重比较高的高的闲置功耗载体的使用重量轻的次笔记型电脑,经过资格。
的矢量从价格上看,目前的售价大约在同一价格,三星840 PRO,它比Intel便宜的520。
的情况下,当引入新的控制器,可靠性是未知的。载体,以证明其可靠性。但是,随着5年的保修期,OCZ中的矢量强烈地表达了他们的信心。
总之,Vector是一个非常好的产品,OCZ设置酒吧在许多领域,特别适合于使用在台式机。
Appendix
In the following table, we present all the test values in comparison to the Samsung SSD 840 Pro, the Intel SSD 520 and the Vertex 4. On average, the 840 Pro just barely supersedes the Vector 256 GB. You can clearly see the improvement in performance in comparison to the old OCZ Vertex 4.
| OCZ Vector 256 GB Desktop GeForce GTX 470, 2600K, OCZ Vector 256 GB | Samsung SSD 840 Pro 256 GB Desktop GeForce GTX 470, 2600K, Samsung SSD 840 Pro 256GB MZ7PD256HAFV-0Z000 | Intel SSD 520 Series 240GB Desktop GeForce GTX 470, 2600K, Intel SSD 520 Series SSDSC2CW240A | OCZ Vertex 4 256 GB Desktop GeForce GTX 470, 2600K, OCZ Vertex 4 256 GB VTX4-25SAT3-256G | |
|---|---|---|---|---|
| PCMark 7 | 0% | -0% | -4% | |
| System Storage | 5371 | 5519 3% | 5216 -3% | 5085 -5% |
| Computation | 4658 | 4589 -1% | 4962 7% | 4573 -2% |
| Creativity | 5401 | 5405 0% | 5310 -2% | 5176 -4% |
| Entertainment | 4823 | 4700 -3% | 4739 -2% | 4662 -3% |
| Productivity | 4782 | 4905 3% | 4808 1% | 4611 -4% |
| Lightweight | 5172 | 5236 1% | 5068 -2% | 4900 -5% |
| Score | 5028 | 4945 -2% | 4941 -2% | 4835 -4% |
| IOMeter | -43% | -27% | -20% | |
| Workstation, 3min, 10GB Partition | 269 | 135.8 -50% | 165.7 -38% | 225.2 -16% |
| IOMix, 5min, 10GB Partition | 275 | 177.5 -35% | 230.2 -16% | 211.9 -23% |
| ATTO Disk Benchmark | 17% | -1% | -26% | |
| 8192KB write | 535680 | 468882 -12% | 527637 -2% | 470939 -12% |
| 4096KB write | 535532 | 474058 -11% | 523776 -2% | 473014 -12% |
| 2048KB write | 535532 | 468882 -12% | 527637 -1% | 470939 -12% |
| 1024KB write | 535532 | 470939 -12% | 527637 -1% | 470939 -12% |
| 512KB write | 534199 | 467424 -13% | 527637 -1% | 470939 -12% |
| 256KB write | 532634 | 468532 -12% | 528689 -1% | 471628 -11% |
| 128KB write | 532634 | 528689 -1% | 524802 -1% | 471859 -11% |
| 64KB write | 524802 | 518914 -1% | 512507 -2% | 471986 -10% |
| 32KB write | 510722 | 493887 -3% | 489443 -4% | 419037 -18% |
| 16KB write | 455901 | 419037 -8% | 421028 -8% | 431325 -5% |
| 8KB write | 433373 | 389865 -10% | 389865 -10% | 319635 -26% |
| 4KB write | 306323 | 275937 -10% | 276959 -10% | 199753 -35% |
| 2KB write | 150601 | 170655 13% | 92477 -39% | 100388 -33% |
| 1KB write | 78884 | 90690 15% | 46986 -40% | 50944 -35% |
| 0.5KB write | 40832 | 45454 11% | 23757 -42% | 25216 -38% |
| 8192KB read | 559240 | 560538 0% | 556663 0% | 546588 -2% |
| 4096KB read | 559240 | 560538 0% | 556663 0% | 546588 -2% |
| 2048KB read | 559240 | 560538 0% | 556663 0% | 546588 -2% |
| 1024KB read | 559240 | 560538 0% | 554109 -1% | 512525 -8% |
| 512KB read | 559240 | 556663 0% | 545354 -2% | 481498 -14% |
| 256KB read | 557784 | 557784 0% | 529998 -5% | 514709 -8% |
| 128KB read | 557104 | 553047 -1% | 492676 -12% | 500029 -10% |
| 64KB read | 547777 | 545078 0% | 486146 -11% | 397109 -28% |
| 32KB read | 356554 | 527106 48% | 434335 22% | 271203 -24% |
| 16KB read | 454764 | 467021 3% | 373701 -18% | 181554 -60% |
| 8KB read | 420035 | 446592 6% | 337950 -20% | 133549 -68% |
| 4KB read | 274916 | 326803 19% | 223854 -19% | 64191 -77% |
| 2KB read | 52213 | 178761 242% | 120356 131% | 28682 -45% |
| 1KB read | 43264 | 105508 144% | 62208 44% | 11883 -73% |
| 0.5KB read | 27136 | 56448 108% | 30976 14% | 5476 -80% |
| AS SSD | 1% | -61% | -16% | |
| Copy Game MB/s | 274 | 269 -2% | 214 -22% | 229 -16% |
| Copy Program MB/s | 247 | 222 -10% | 143.9 -42% | 196 -21% |
| Copy ISO MB/s | 448 | 429 -4% | 368 -18% | 347 -23% |
| Score Total | 1100 | 1165 6% | 802 -27% | 1052 -4% |
| Score Write | 432 | 453 5% | 339 -22% | 429 -1% |
| Score Read | 438 | 465 6% | 309 -29% | 408 -7% |
| Access Time Write * | 0.04 | 0.046 -15% | 0.212 -430% | 0.03 25% |
| Access Time Read * | 0.049 | 0.056 -14% | 0.126 -157% | 0.13 -165% |
| 4K-64 Write | 302 | 329 9% | 231.8 -23% | 306 1% |
| 4K-64 Read | 362 | 381 5% | 236.2 -35% | 332 -8% |
| 4K Write | 79.3 | 73.5 -7% | 72 -9% | 76.7 -3% |
| 4K Read | 24.38 | 32.3 32% | 24.41 0% | 26.3 8% |
| Seq Write | 500 | 498 0% | 288.4 -42% | 459 -8% |
| Seq Read | 516 | 513 -1% | 496.1 -4% | 503 -3% |
| CrystalDiskMark 3.0 | 4% | -19% | -10% | |
| Write 4k QD32 | 372 | 370 -1% | 266.3 -28% | 342 -8% |
| Read 4k QD32 | 383 | 402 5% | 239.9 -37% | 349 -9% |
| Write 4k | 103 | 88.9 -14% | 91.2 -11% | 85 -17% |
| Read 4k | 27.8 | 35.7 28% | 29.74 7% | 29.6 6% |
| Write 512 | 506 | 501 -1% | 299.5 -41% | 470 -7% |
| Read 512 | 438 | 471 8% | 441.2 1% | 308 -30% |
| Write Seq | 514 | 513 0% | 307.8 -40% | 470 -9% |
| Read Seq | 513 | 531 4% | 497.7 -3% | 486 -5% |
| HD Tune Transfer Rate Minimum | ||||
| Transfer Rate Minimum | 288 | 400 39% | 356.8 24% | 238 -17% |
| HD Tune Transfer Rate Maximum | ||||
| Transfer Rate Maximum | 305 | 417 37% | 405.8 33% | 283 -7% |
| HD Tune Transfer Rate Average | ||||
| Transfer Rate Average | 295 | 414 40% | 376.2 28% | 271 -8% |
| HD Tune Access Time | ||||
| Access Time * | 0.1 | 0.14 | ||
| HD Tune Burst Rate | ||||
| Burst Rate | 345 | 199 -42% | 300.6 -13% | 123.6 -64% |
| PCMark Vantage | 0% | -2% | -12% | |
| 1024x768 HDD Score | 50320 | 54763 9% | 45907 -9% | 36056 -28% |
| 1024x768 Productivity Score | 28295 | 27046 -4% | 25406 -10% | 23055 -19% |
| 1024x768 Communications Score | 18284 | 16400 -10% | 19022 4% | 16316 -11% |
| 1024x768 Music Score | 20564 | 21711 6% | 21465 4% | 18004 -12% |
| 1024x768 Gaming Score | 22689 | 23183 2% | 22422 -1% | 20746 -9% |
| 1024x768 TV and Movies Score | 7377 | 7544 2% | 7038 -5% | 7294 -1% |
| 1024x768 Memories Score | 13754 | 13721 0% | 13283 -3% | 11982 -13% |
| 1024x768 Result | 19638 | 19147 -3% | 20391 4% | 18602 -5% |
| Total Average (Program / Settings) | 5% /
7% | -4% /
-14% | -18% /
-18% |
* ... smaller is better


