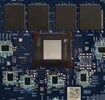
Qualcomm Snapdragon X Plus X1P-42-100
Snapdragon X Plus X1P-42-100是一款价格相对低廉的ARM架构处理器(SoC),用于Windows笔记本电脑,将于2024年5月20日亮相。据认为,X1P-42-100 有 8 个 Oryon CPU 内核(8 个 P 核,0 个 E 核),运行时钟频率至少为 3.0 GHz,目前尚不清楚。至于其他主要功能,X Plus 可能配备了与其更大、更智能的兄弟 X1P-64-100 相同的 3.8 TFLOPS Adreno GPU、45 TOPS Hexagon NPU 和 LPDDR5x-8448 内存控制器。 X1P-64-100所拥有的。
架构和功能
据称,高通 Oryon 内核基于 ARM v8.7 微体系结构。与现代 AMD 和英特尔处理器一样,骁龙芯片兼容 USB 4,因此也兼容 Thunderbolt 4;X Plus 是否兼容GeForce 或 Radeon 独立显卡还有待观察。
据说高通 SoC 有 8 个 PCIe 4 和 4 个 PCIe 3 通道,可连接各种设备。支持 NVMe SSD,吞吐量高达 7.9 GB/s;RAM 控制器可能兼容快至 8448 MT/s 的 RAM,也可能不兼容。很可能包含一个用于加速人工智能工作负载的 45 TOPS NPU。
这款 X Plus 芯片与 X1P-64-100 和 X1P-64-100 所使用的芯片不同。 X1P-64-100, X1E-78-100, X1E-80-100, X1E-84-100基于。
性能
如果从官方性能数据来看,X Plus 应该比 9 核Apple M4在多线程工作负载中要慢得多,同时功耗也要高得多。一旦获得内部测试结果,我们将确保及时更新本节内容。
与其他基于 ARM 的 Windows 平台一样,骁龙 X 芯片在使用专为 ARM 处理器编译的应用程序和游戏时效果最佳,但目前这样的应用程序和游戏还不多。
图形
集成的 Adreno GPU应该与 DirectX 12 兼容(不是与 DirectX 12 Ultimate 兼容;正如传言所说,这里没有任何光线追踪功能)。预计它还能提供高达 3.8 TFLOPS 的性能。作为参考,最慢的 Nvidia Ada 代笔记本电脑专业显卡为 RTX 500 Ada可提供高达 9.2 TFLOPS 的性能。
高通 iGPU 可让您同时使用多达 3 台 UHD 2160p 显示器。支持 2160p120 集成显示器,以及流行的 AV1、HEVC 和 AVC 视频编解码器(包括解码和编码)。
功耗
X1P-42-100 的功耗很可能低于其功能更强大的 X Elite 兄弟。在长期工作负载下,预计功耗在 10 W 到 35 W 之间,因为这就是 Ryzen U 芯片的正常功耗。
该 SoC 采用 4 纳米台积电工艺制造,节能效果不错(截至 2024 年上半年)。
Series | Qualcomm Snapdragon X |
Codename | Oryon |
Series: Snapdragon X Oryon |
Clock Rate | <=3400 MHz |
Number of Cores / Threads | 8 / 8 8 x 3.4 GHz Qualcomm Oryon |
Power Consumption (TDP = Thermal Design Power) | 30 Watt |
Manufacturing Technology | 4 nm |
GPU | Qualcomm SD X Adreno X1-45 1.7 TFLOPS |
64 Bit | 64 Bit support |
Architecture | ARM |
Announcement Date | 08/28/2024 |
Product Link (external) | www.qualcomm.com |
Benchmarks
Performance Rating - CB R15 + R20 + 7-Zip + X265 + Blender + 3DM11 CPU
29.9 pt (50%)
...
Intel Core i7-8850H
Intel Core i7-9750H
Qualcomm Snapdragon X Plus X1P-42-100
Intel Core i7-8559U
...
max:
Cinebench 2024 - Cinebench 2024 CPU Single Core
min: 108 avg: 108.5 median: 108.5 (61%) max: 109 Points
CPU TDP ? | TDP 25 W |
---|
99% | 100% |
...
Qualcomm Snapdragon X Plus X1P-42-100
Apple M1
...
Cinebench 2024 - Cinebench 2024 CPU Multi Core
min: 556 avg: 659 median: 661 (12%) max: 759 Points
CPU TDP ? | TDP 25 W |
---|
99% | 100% |
...
AMD Ryzen 7 7735H
Qualcomm Snapdragon X Plus X1P-42-100
...
max:
Cinebench R23 - Cinebench R23 Multi Core
min: 6442 avg: 6793 median: 6793 (6%) max: 7144 Points
CPU TDP ? | TDP 25 W |
---|
90% | 100% |
...
Intel Core i7-11390H
Intel Core i7-8850H
Qualcomm Snapdragon X Plus X1P-42-100
Intel Xeon W-10885M
Intel Core i7-1265U
...
max:
Cinebench R23 - Cinebench R23 Single Core
min: 1109 avg: 1119 median: 1118.5 (48%) max: 1128 Points
CPU TDP ? | TDP 25 W |
---|
98% | 100% |
...
Intel Core i5-10310U
Intel Core i7-8850H
Qualcomm Snapdragon X Plus X1P-42-100
Intel Core i5-8400H
Intel Core i7-1065G7
...
max:
Intel Core Ultra 9 285K
Cinebench R20 - Cinebench R20 CPU (Single Core)
min: 406 avg: 415.5 median: 415.5 (46%) max: 425 Points
CPU TDP ? | TDP 25 W |
---|
96% | 100% |
...
Apple M1
Intel Core i7-8809G
Intel Core i5-1035G4
Intel Core i7-8705G
Intel Core i5-1035G7
Qualcomm Snapdragon X Plus X1P-42-100
Intel Core i5-1035G1
Intel Core i5-8279U
Intel Core i5-8365U
...
max:
Cinebench R20 - Cinebench R20 CPU (Multi Core)
min: 2361 avg: 2521 median: 2521 (6%) max: 2681 Points
CPU TDP ? | TDP 25 W |
---|
88% | 100% |
...
Apple M2
Intel Core i7-8850H
Qualcomm Snapdragon X Plus X1P-42-100
Intel Core i7-9750H
Intel Core i9-8950HK
...
max:
Cinebench R15 - Cinebench R15 CPU Multi 64 Bit
min: 1383 avg: 1401 median: 1401 (9%) max: 1419 Points
CPU TDP ? | TDP 25 W |
---|
100% | 97% |
...
Intel Core i5-11500B
AMD Ryzen 5 PRO 5675U
Qualcomm Snapdragon X Plus X1P-42-100
...
max:
Asus VivoBook S 15 Snapdragon 8-Core: Ø1283 (1261.43-1382.84)
Asus ProArt PZ13 HT5306: Ø1045 (979.5-1418.74)
Cinebench R15 - Cinebench R15 CPU Single 64 Bit
207 Points (58%)
CPU TDP ? | TDP 25 W |
---|
100% | 100% |
...
AMD Ryzen 5 5560U
Qualcomm Snapdragon X Plus X1P-42-100
Apple M1
Intel Xeon W-10885M
...
max:
Intel Core Ultra 9 285K
7-Zip 18.03 - 7-Zip 18.03 Multi Thread 4 runs
min: 30689 avg: 30850 median: 30849.5 (18%) max: 31010 MIPS
CPU TDP ? | TDP 25 W |
---|
100% | 99% |
...
Intel Core i7-8559U
Qualcomm Snapdragon X Plus X1P-42-100
Intel Core i5-1240U
Intel Core i7-8850H
Intel Core i7-1265U
Intel Core i7-9750H
...
max:
7-Zip 18.03 - 7-Zip 18.03 Single Thread 4 runs
min: 4498 avg: 4530 median: 4529.5 (53%) max: 4561 MIPS
CPU TDP ? | TDP 25 W |
---|
99% | 100% |
...
Intel Core i7-8500Y
Intel Core i7-7700HQ
Intel Core i5-1240U
Qualcomm Snapdragon X Plus X1P-42-100
Intel Core i5-8400H
Intel Core i3-1115G4
...
max:
AMD Ryzen 7 9800X3D
HWBOT x265 Benchmark v2.2 - HWBOT x265 4k Preset
min: 4.6 avg: 4.9 median: 4.9 (9%) max: 5.26 fps
CPU TDP ? | TDP 25 W |
---|
87% | 100% |
...
Intel Core i7-1065G7
Intel Core i5-1035G7
Qualcomm Snapdragon X Plus X1P-42-100
Intel Core i5-8259U
Intel Core i7-8559U
...
max:
Asus ProArt PZ13 HT5306: Ø4.82 (0.14-6.41)
Asus VivoBook S 15 Snapdragon 8-Core: Ø5.28 (0.14-6.45)
Blender - Blender 3.3 Classroom CPU *
min: 807 avg: 931 median: 931 (12%) max: 1055 Seconds
CPU TDP ? | TDP 25 W |
---|
100% | 104% |
...
Intel Core i7-1265U
Qualcomm Snapdragon X Plus X1P-42-100
Apple M1
Intel Core i7-11390H
...
Intel Celeron J4125
Blender - Blender 2.79 BMW27 CPU *
min: 466 avg: 519 median: 518.5 (4%) max: 571 Seconds
CPU TDP ? | TDP 25 W |
---|
100% | 101% |
...
Intel Xeon E-2176M
Qualcomm Snapdragon X Plus X1P-42-100
Intel Core i7-8809G
Intel Core i7-11390H
Apple M1
...
AMD E1-2100
R Benchmark 2.5 - R Benchmark 2.5 *
min: 0.728 avg: 0.7 median: 0.7 (16%) max: 0.741 sec
CPU TDP ? | TDP 25 W |
---|
100% | 100% |
...
Intel Core i7-1065G7
Intel Core i5-10310U
Apple M1
Qualcomm Snapdragon X Plus X1P-42-100
Intel Core i5-8265U
Intel Core i7-7700HQ
Intel Core i5-1035G1
...
AMD E1-2100
3DMark 11 - 3DM11 Performance Physics
min: 12561 avg: 12571 median: 12570.5 (32%) max: 12580 Points
CPU TDP ? | TDP 25 W |
---|
100% | 100% |
...
Intel Xeon E-2276M
Qualcomm Snapdragon X Plus X1P-42-100
Intel Core i5-1240U
Intel Core i7-9750H
Intel Core i9-8950HK
...
max:
AMD Ryzen 7 9800X3D
3DMark - 3DMark Cloud Gate Physics
8996 Points (23%)
...
Intel Core i7-11390H
unknown
Qualcomm Snapdragon X Plus X1P-42-100
Intel Core i7-1265U
Intel Core i7-8850H
...
max:
Intel Core Ultra 9 285K
3DMark - 3DMark Fire Strike Standard Physics
min: 13764 avg: 13772 median: 13772 (25%) max: 13780 Points
CPU TDP ? | TDP 25 W |
---|
100% | 100% |
...
Intel Core i5-1230U
Intel Core i7-8809G
Intel Xeon E-2176M
Qualcomm Snapdragon X Plus X1P-42-100
Intel Core i7-1265U
...
max:
Intel Core Ultra 9 285K
3DMark - 3DMark Time Spy CPU
min: 3282 avg: 3285 median: 3285 (14%) max: 3288 Points
CPU TDP ? | TDP 25 W |
---|
100% | 100% |
...
Intel Core i5-1035G4
Intel Core i7-8650U
AMD Ryzen Embedded V1605B
Intel Core i5-8259U
Intel Core i5-8260U
Intel Core i7-4800MQ
Qualcomm Snapdragon X Plus X1P-42-100
Intel Core i5-1035G1
Intel Core i7-1065G7
Intel Core i5-8279U
...
max:
Intel Core i9-14900
Geekbench 6.3 - Geekbench 6.3 Single-Core
min: 2353 avg: 2395 median: 2395 (61%) max: 2437 points
CPU TDP ? | TDP 25 W |
---|
97% | 100% |
...
Apple M1
Qualcomm Snapdragon X Plus X1P-42-100
...
Geekbench 6.3 - Geekbench 6.3 Multi-Core
min: 10833 avg: 11206 median: 11384 (45%) max: 11400 points
CPU TDP ? | TDP 25 W |
---|
98% | 100% |
...
Qualcomm Snapdragon X Plus X1P-42-100
...
max:
Mozilla Kraken 1.1 - Kraken 1.1 Total Score *
min: 467.8 avg: 474.4 median: 474.4 (1%) max: 481 ms
CPU TDP ? | TDP 25 W |
---|
100% | 100% |
...
Apple M1
Qualcomm Snapdragon X Plus X1P-42-100
...
AMD A4-1250
max:
Apple S7
Octane V2 - Octane V2 Total Score
min: 79431 avg: 79536 median: 79536 (66%) max: 79641 Points
CPU TDP ? | TDP 25 W |
---|
100% | 100% |
...
Intel Core i7-1265U
Qualcomm Snapdragon X Plus X1P-42-100
...
WebXPRT 4 - WebXPRT 4 Score
min: 280 avg: 281.5 median: 281.5 (79%) max: 283 Points
CPU TDP ? | TDP 25 W |
---|
100% | 99% |
...
Qualcomm Snapdragon X Plus X1P-42-100
...
max:
WebXPRT 3 - WebXPRT 3 Score
min: 405 avg: 406 median: 406 (74%) max: 407 Points
CPU TDP ? | TDP 25 W |
---|
100% | 100% |
...
Apple M2
Qualcomm Snapdragon X Plus X1P-42-100
...
CrossMark - CrossMark Overall
min: 1168 avg: 1172 median: 1171.5 (45%) max: 1175 Points
CPU TDP ? | TDP 25 W |
---|
100% | 99% |
...
Intel Core i5-8265U
Intel Core i7-1065G7
Intel Core i3-1115G4
Intel Core i5-8400H
Qualcomm Snapdragon X Plus X1P-42-100
AMD Ryzen 5 PRO 5675U
AMD Ryzen 5 5560U
...
max:
Intel Core Ultra 9 285K
Power Consumption - Cinebench R15 Multi Power Consumption - external Monitor *
min: 50.3 avg: 51.6 median: 51.6 (9%) max: 52.8 Watt
CPU TDP ? | TDP 25 W |
---|
100% | 101% |
...
Intel Core i7-11390H
AMD Ryzen 7 7735H
Qualcomm Snapdragon X Plus X1P-42-100
...
max:
Asus VivoBook S 15 Snapdragon 8-Core: Ø50.3 (38.3-57.8)
Asus ProArt PZ13 HT5306: Ø52.8 (22-62.6)
Power Consumption - Idle Power Consumption - external Monitor *
min: 5.48 avg: 5.6 median: 5.6 (4%) max: 5.79 Watt
CPU TDP ? | TDP 25 W |
---|
100% | 100% |
...
Intel Core i5-1230U
Qualcomm Snapdragon X Plus X1P-42-100
Intel Core i5-8260U
...
max:
Asus VivoBook S 15 Snapdragon 8-Core: Ø5.48 (5.25-6.22)
Asus ProArt PZ13 HT5306: Ø5.79 (5.42-6.69)
Power Consumption - Idle Power Consumption 150cd 1min *
min: 4.9 avg: 5.2 median: 5.2 (6%) max: 5.49 Watt
CPU TDP ? | TDP 25 W |
---|
101% | 100% |
...
Intel Core i7-1265U
Qualcomm Snapdragon X Plus X1P-42-100
Intel Core i7-1065G7
...
max:
Asus ProArt PZ13 HT5306: Ø4.9 (4.55-6.58)
Asus VivoBook S 15 Snapdragon 8-Core: Ø5.49 (5.34-6.81)
Power Consumption - Cinebench R15 Multi Power Efficiency - external Monitor
min: 26.9 avg: 27.2 median: 27.2 (20%) max: 27.5 Points per Watt
CPU TDP ? | TDP 25 W |
---|
98% | 100% |
...
Intel Core i7-1265U
Intel Core i5-1240U
AMD Ryzen 9 5900HS
Qualcomm Snapdragon X Plus X1P-42-100
...
- Range of benchmark values for this graphics card
- Average benchmark values for this graphics card
* Smaller numbers mean a higher performance
v1.28
log 19. 08:59:58
#0 ran 0s before starting gpusingle class +0s ... 0s
#1 no ids found in url (should be separated by "_") +0s ... 0s
#2 not redirecting to Ajax server +0s ... 0s
#3 did not recreate cache, as it is less than 5 days old! Created at Tue, 19 Nov 2024 05:31:10 +0100 +0.001s ... 0.001s
#4 no comparison url found in template nbc.compare_page_2 needed +0.017s ... 0.018s
#5 no comparison url found in template nbc.compare_page_2 needed +0s ... 0.018s
#6 no comparison url found in template nbc.compare_page_2 needed +0s ... 0.018s
#7 no comparison url found in template nbc.compare_page_2 needed +0s ... 0.018s
#8 no comparison url found in template nbc.compare_page_2 needed +0s ... 0.019s
#9 no comparison url found in template nbc.compare_page_2 needed +0s ... 0.019s
#10 composed specs +0.001s ... 0.019s
#11 did output specs +0s ... 0.019s
#12 getting avg benchmarks for device 17591 +0.016s ... 0.035s
#13 got single benchmarks 17591 +0.01s ... 0.044s
#14 got avg benchmarks for devices +0s ... 0.044s
#15 min, max, avg, median took s +0.488s ... 0.533s
#16 no comparison url found in template nbc.compare_page_2 needed +0s ... 0.533s
#17 return log +0s ... 0.533s
Other CPUs of the series Snapdragon X
Surrounding CPUs
+ AMD Ryzen 7 5800HS
8x 2.8 GHz - 4.4 GHz
+ Intel Core i7-11600H
6x 2.9 GHz - 4.6 GHz
- Intel Xeon W-10885M
8x 2.4 GHz - 5.3 GHz
- Intel Core i7-1265U
10x 1.3 GHz - 4.8 GHz
Klaus Hinum (Update: 2024-08-30)