

东芝 Satellite Z30-B 笔记本电脑简短评测
Toshiba Satellite Z30-B-100 (Satellite Z30 Series)
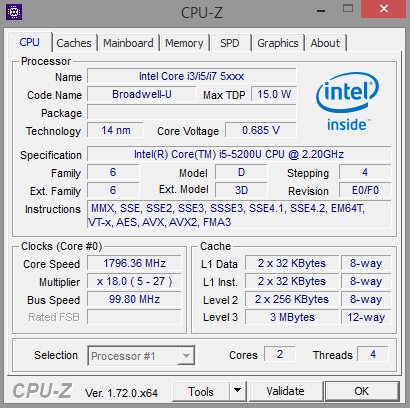
Processor
Intel Core i5-5200U 2 x 2.2 - 2.7 GHz, Broadwell
Graphics adapter
Intel HD Graphics 5500, Core: 900 MHz
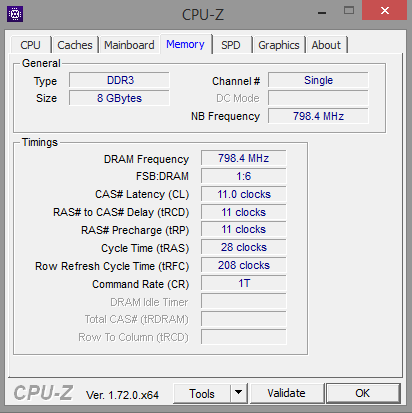
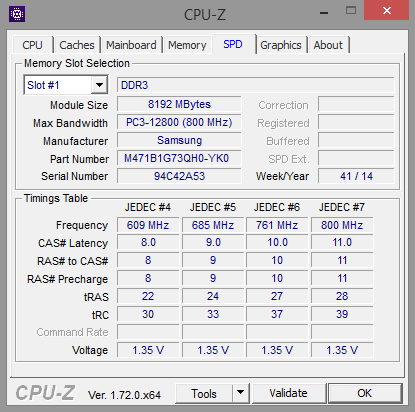
Memory
8 GB
, DDR3L-1600,单通道, 两个内存槽一个已占用, 最大支持16GB
Display
13.30 inch 16:9, 1366 x 768 pixel, TOS5091, TN, glossy: no
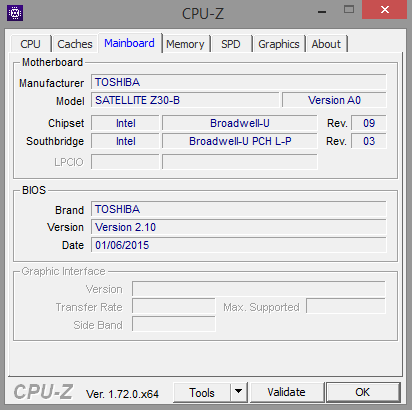
Mainboard
Intel Broadwell-U PCH-LP (Premium)
Storage
Toshiba THNSNJ256GMCU, 256 GB
, 185 GB free
Weight
1.2 kg, Power Supply: 150 g
Price
1099 Euro
Note: The manufacturer may use components from different suppliers including display panels, drives or memory sticks with similar specifications.
| |||||||||||||||||||||||||
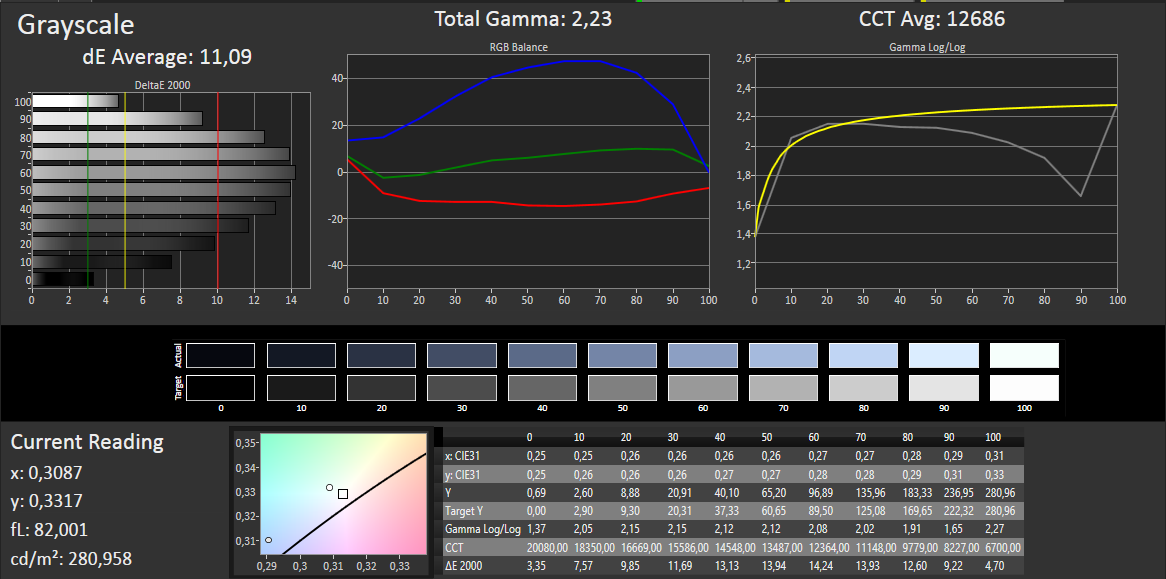
TOS5091 tested with X-Rite i1Pro 2
Maximum: 300 cd/m² (Nits) Average: 286.2 cd/m²Brightness Distribution: 91 %
Center on Battery: 232 cd/m²
Contrast: 422:1 (Black: 0.69 cd/m²)
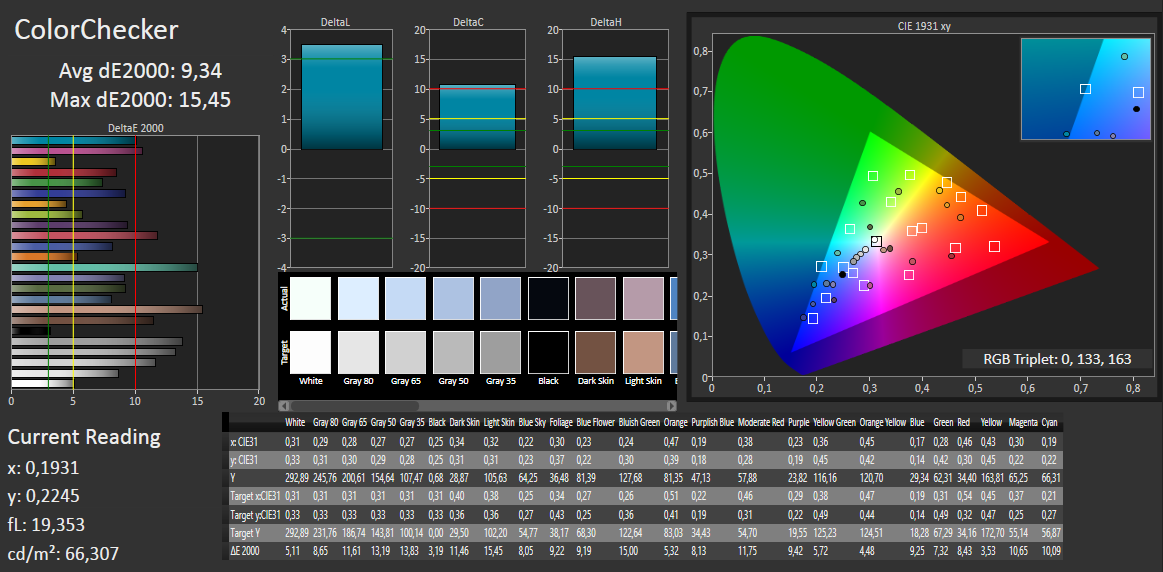
ΔE Color 9.34 | 0.5-29.43 Ø4.87
ΔE Greyscale 11.09 | 0.5-98 Ø5.1
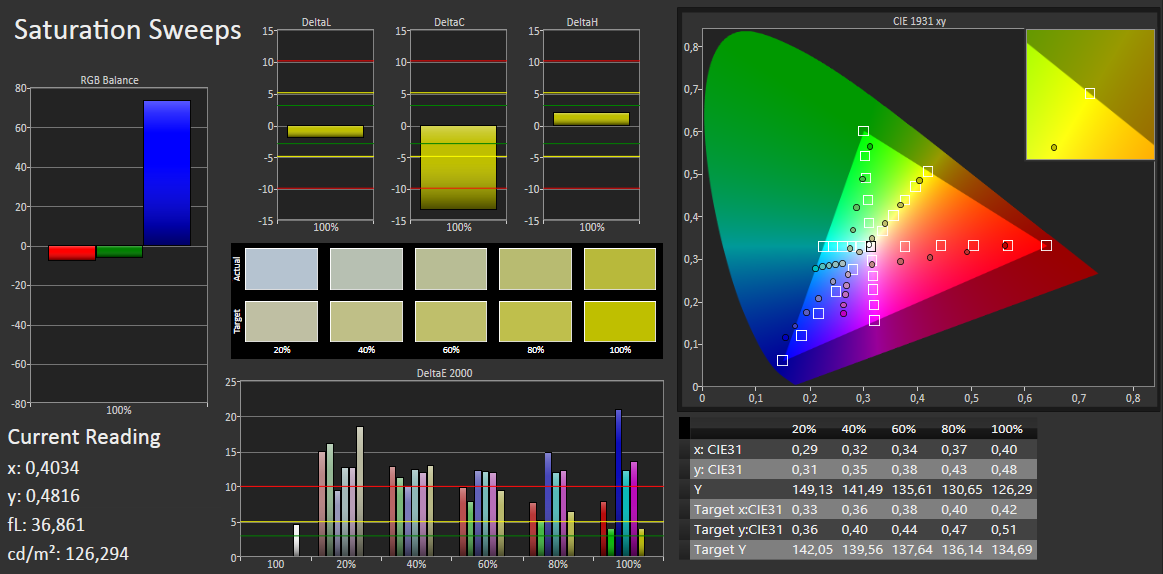
65% sRGB (Argyll 1.6.3 3D)
42% AdobeRGB 1998 (Argyll 1.6.3 3D)
45.31% AdobeRGB 1998 (Argyll 2.2.0 3D)
65.3% sRGB (Argyll 2.2.0 3D)
43.79% Display P3 (Argyll 2.2.0 3D)
Gamma: 2.23
| Toshiba Satellite Z30-B-100 HD Graphics 5500, 5200U, Toshiba THNSNJ256GMCU | Asus ZenBook UX305FA-FB003H HD Graphics 5300, 5Y10, SanDisk SD7SN3Q256G1002 | Dell XPS 13-9343 Non-Touch HD Graphics 5500, 5200U, Samsung SSD PM851 M.2 2280 128GB | Apple MacBook Air 13 inch 2015-03 HD Graphics 6000, 5650U, Apple SSD SD0256F | |
|---|---|---|---|---|
| Display | 31% | 44% | -8% | |
| Display P3 Coverage | 43.79 | 58.2 33% | 65.9 50% | 40.1 -8% |
| sRGB Coverage | 65.3 | 83.3 28% | 89.6 37% | 59.8 -8% |
| AdobeRGB 1998 Coverage | 45.31 | 60.1 33% | 66.2 46% | 41.51 -8% |
| Screen | 24% | 52% | 28% | |
| Brightness middle | 291 | 310 7% | 409.7 41% | 329 13% |
| Brightness | 286 | 309 8% | 405 42% | 310 8% |
| Brightness Distribution | 91 | 90 -1% | 93 2% | 82 -10% |
| Black Level * | 0.69 | 0.75 -9% | 0.366 47% | 0.405 41% |
| Contrast | 422 | 413 -2% | 1119 165% | 812 92% |
| Colorchecker dE 2000 * | 9.34 | 2.49 73% | 7.67 18% | 3.96 58% |
| Greyscale dE 2000 * | 11.09 | 1.89 83% | 4.66 58% | 3.51 68% |
| Gamma | 2.23 99% | 2.36 93% | 1.65 133% | 3.83 57% |
| CCT | 12686 51% | 6573 99% | 6502 100% | 6711 97% |
| Color Space (Percent of AdobeRGB 1998) | 42 | 54 29% | 59.65 42% | 38.4 -9% |
| Color Space (Percent of sRGB) | 65 | 83.1 28% | 59.8 -8% | |
| Colorchecker dE 2000 max. * | 7.51 | |||
| Total Average (Program / Settings) | 28% /
26% | 48% /
50% | 10% /
19% |
* ... smaller is better
| Cinebench R15 | |
| CPU Multi 64Bit (sort by value) | |
| Toshiba Satellite Z30-B-100 | |
| Asus ZenBook UX305FA-FB003H | |
| Dell XPS 13-9343 Non-Touch | |
| Apple MacBook Air 13 inch 2015-03 | |
| CPU Single 64Bit (sort by value) | |
| Toshiba Satellite Z30-B-100 | |
| Asus ZenBook UX305FA-FB003H | |
| Dell XPS 13-9343 Non-Touch | |
| Apple MacBook Air 13 inch 2015-03 | |
| PCMark 7 - Score (sort by value) | |
| Toshiba Satellite Z30-B-100 | |
| Asus ZenBook UX305FA-FB003H | |
| Dell XPS 13-9343 Non-Touch | |
| Apple MacBook Air 13 inch 2015-03 | |
| PCMark 8 - Home Score Accelerated v2 (sort by value) | |
| Toshiba Satellite Z30-B-100 | |
| Asus ZenBook UX305FA-FB003H | |
| Dell XPS 13-9343 Non-Touch | |
| Apple MacBook Air 13 inch 2015-03 | |
| PCMark 7 Score | 4531 points | |
| PCMark 8 Home Score Accelerated v2 | 3095 points | |
| PCMark 8 Work Score Accelerated v2 | 4169 points | |
Help | ||

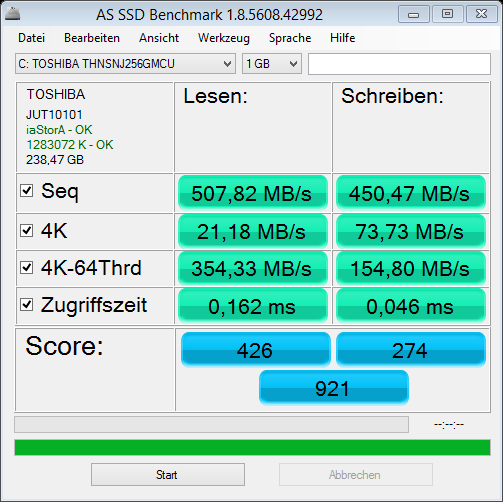
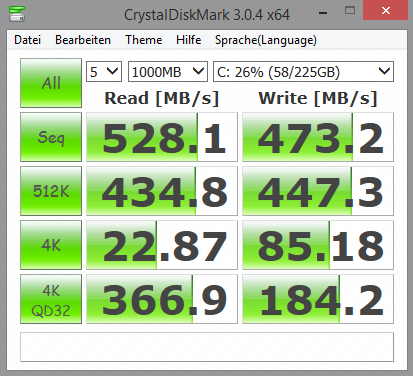
Toshiba THNSNJ256GMCU
Sequential Read:
528 MB/s
Sequential Write:
473.2 MB/s
512K Read:
434.8 MB/s
512K Write:
447.3 MB/s
4K Read:
22.87 MB/s
4K Write:
85.2 MB/s
4K QD32 Read:
366.9 MB/s
4K QD32 Write:
184.2 MB/s
| 3DMark 11 - 1280x720 Performance (sort by value) | |
| Toshiba Satellite Z30-B-100 | |
| Asus ZenBook UX305FA-FB003H | |
| Dell XPS 13-9343 Non-Touch | |
| Apple MacBook Air 13 inch 2015-03 | |
| 3DMark 11 Performance | 982 points | |
| 3DMark Ice Storm Standard Score | 40360 points | |
| 3DMark Cloud Gate Standard Score | 4499 points | |
| 3DMark Fire Strike Score | 592 points | |
Help | ||
| low | med. | high | ultra | |
|---|---|---|---|---|
| Tomb Raider (2013) | 43.3 | 22.2 | 14.1 | |
| BioShock Infinite (2013) | 28.07 | 16.93 | 13.85 | |
| GRID: Autosport (2014) | 64.6 | 24.05 |
Noise Level
| Idle |
| 29.6 / 29.6 / 31.9 dB(A) |
| Load |
| 41.2 / 44.1 dB(A) |
 | ||
30 dB silent 40 dB(A) audible 50 dB(A) loud |
||
min: | ||
(+) The average temperature for the upper side under maximal load is 30.3 °C / 87 F, compared to the average of 30.8 °C / 87 F for the devices in the class Subnotebook.
(±) The maximum temperature on the upper side is 40.6 °C / 105 F, compared to the average of 35.9 °C / 97 F, ranging from 21.4 to 59 °C for the class Subnotebook.
(+) The bottom heats up to a maximum of 34 °C / 93 F, compared to the average of 39.3 °C / 103 F
(+) In idle usage, the average temperature for the upper side is 24.6 °C / 76 F, compared to the device average of 30.8 °C / 87 F.
(+) The palmrests and touchpad are cooler than skin temperature with a maximum of 25.7 °C / 78.3 F and are therefore cool to the touch.
(+) The average temperature of the palmrest area of similar devices was 28.2 °C / 82.8 F (+2.5 °C / 4.5 F).
Power Consumption
| Off / Standby | |
| Idle | |
| Load |
|
Key:
min: | |
| Toshiba Satellite Z30-B-100 HD Graphics 5500, 5200U, Toshiba THNSNJ256GMCU | Asus ZenBook UX305FA-FB003H HD Graphics 5300, 5Y10, SanDisk SD7SN3Q256G1002 | Dell XPS 13-9343 Non-Touch HD Graphics 5500, 5200U, Samsung SSD PM851 M.2 2280 128GB | Apple MacBook Air 13 inch 2015-03 HD Graphics 6000, 5650U, Apple SSD SD0256F | |
|---|---|---|---|---|
| Battery Runtime | -20% | -15% | -16% | |
| Reader / Idle | 1413 | 781 -45% | 1295 -8% | 1572 11% |
| WiFi v1.3 | 722 | 598 -17% | 620 -14% | |
| Load | 178 | 189 6% | 145 -19% | 97 -46% |
| WiFi | 408 |
Pros
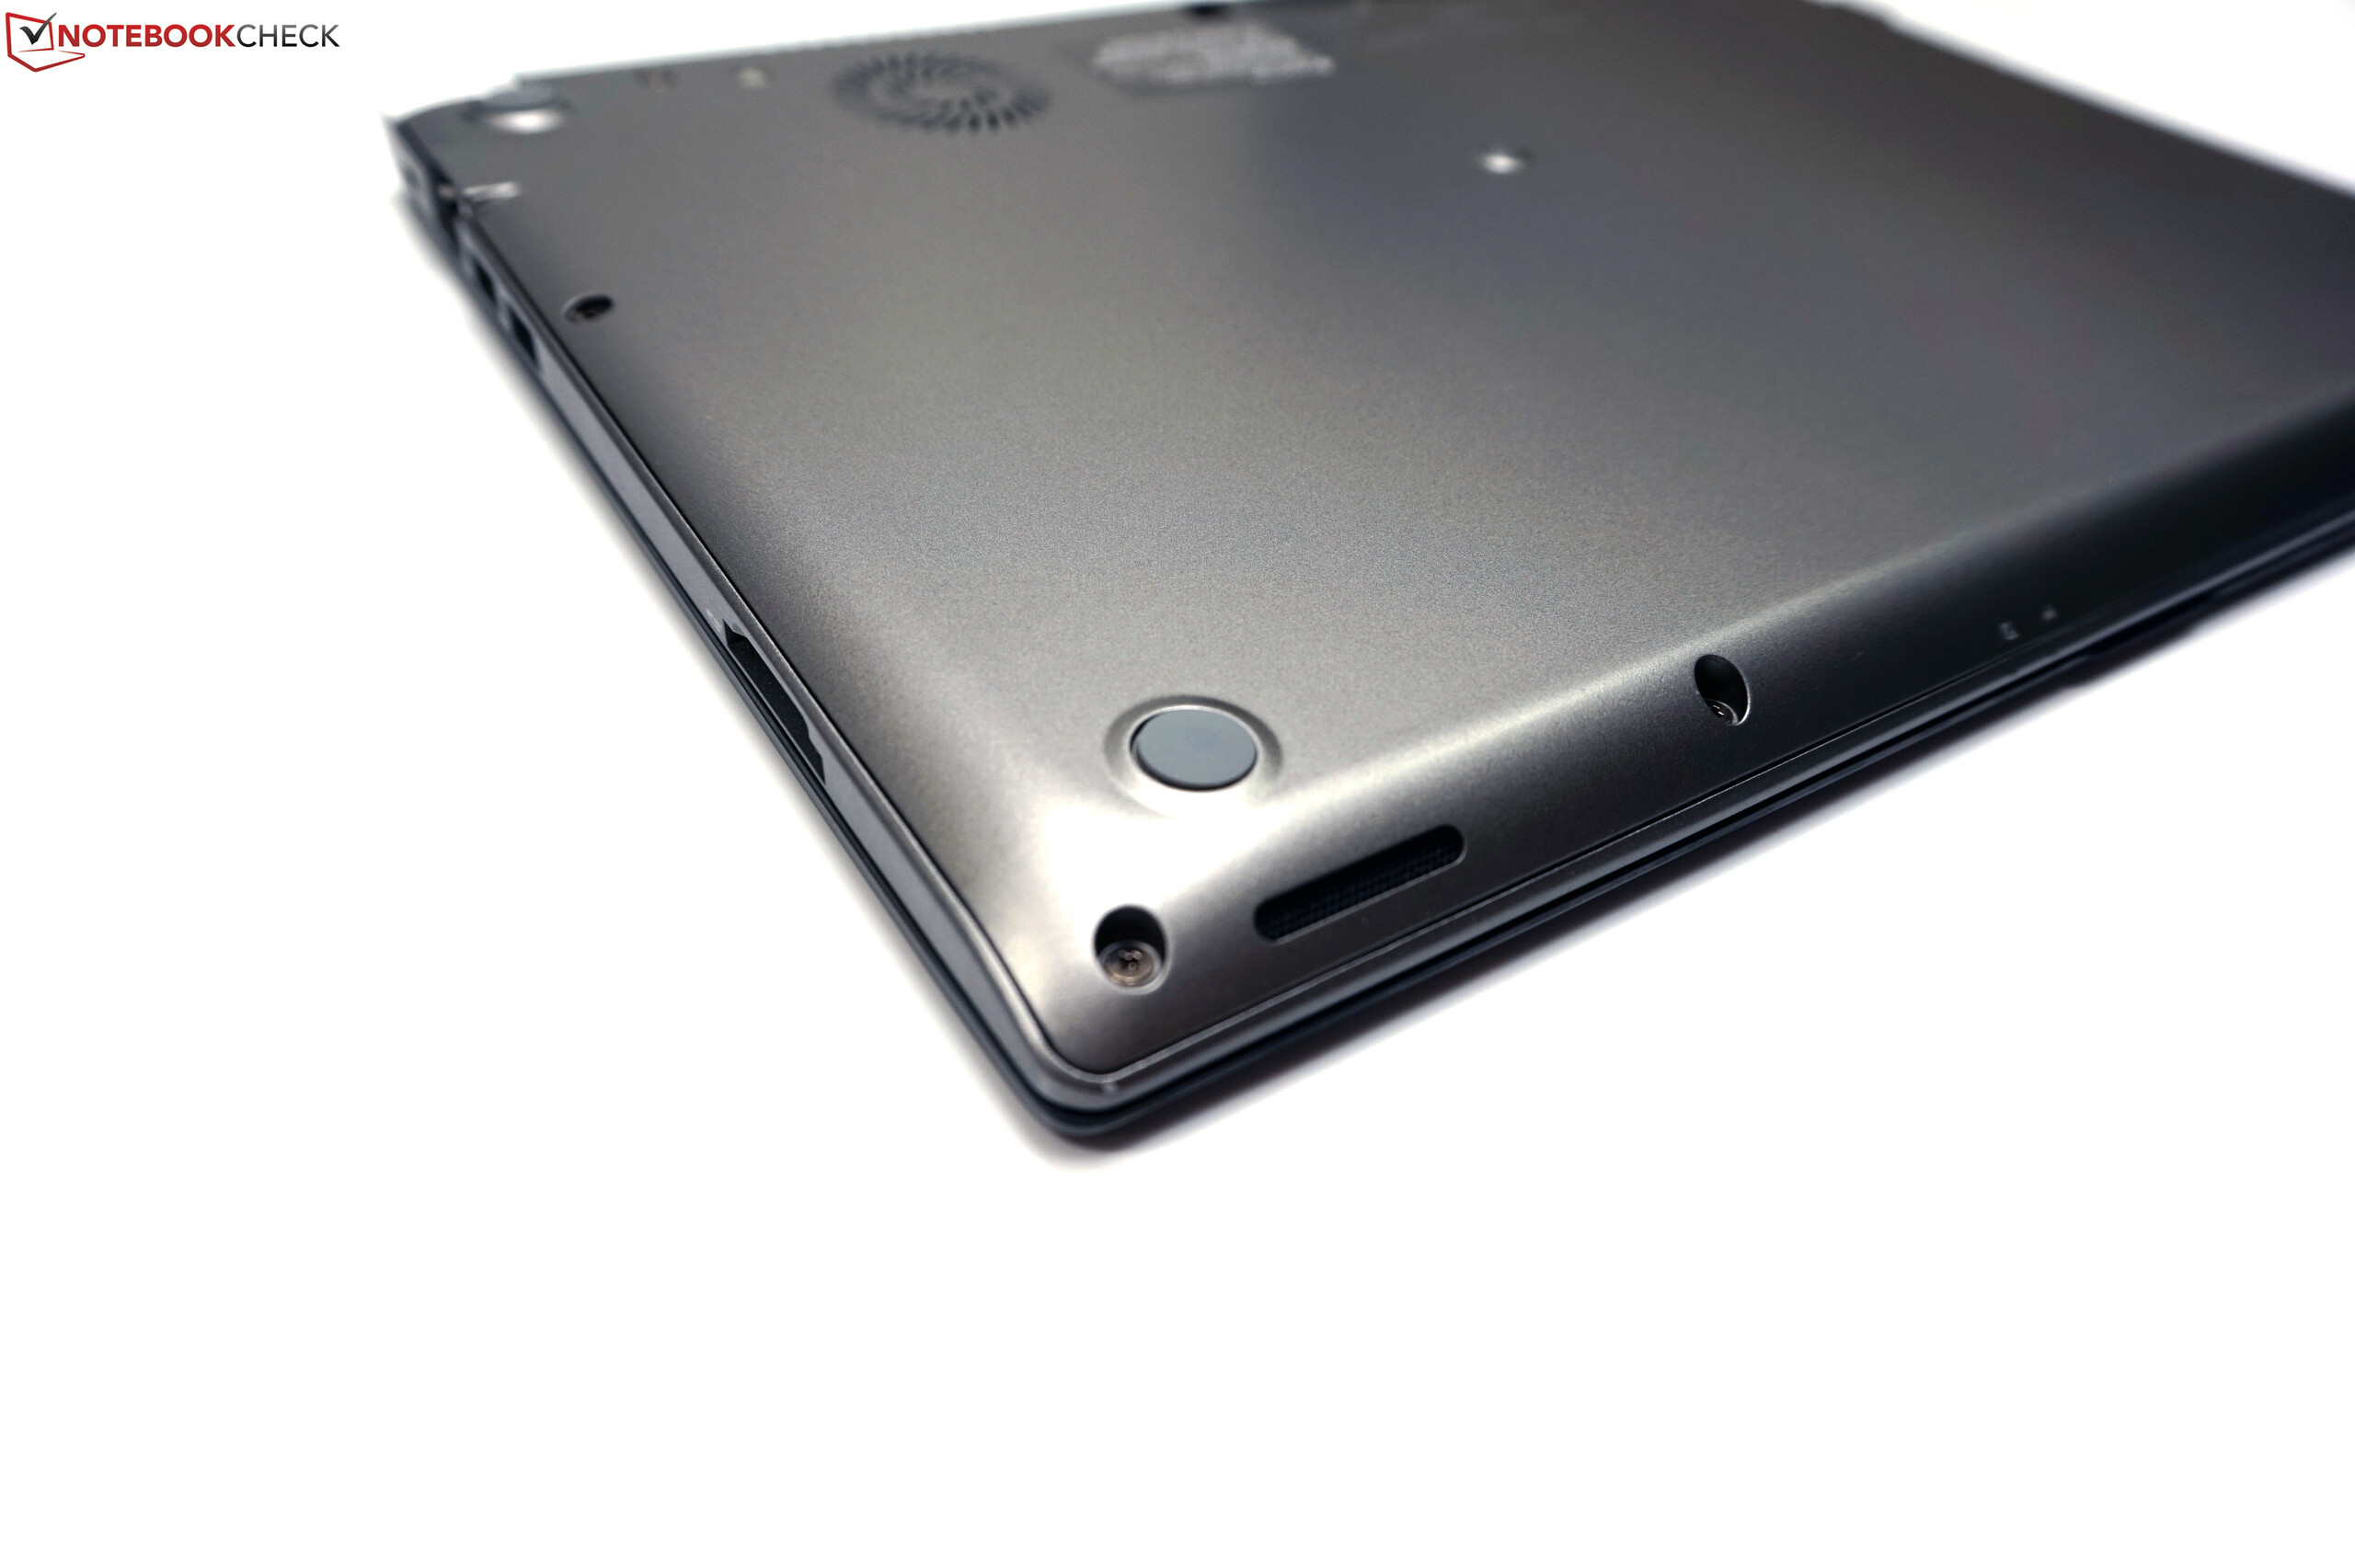
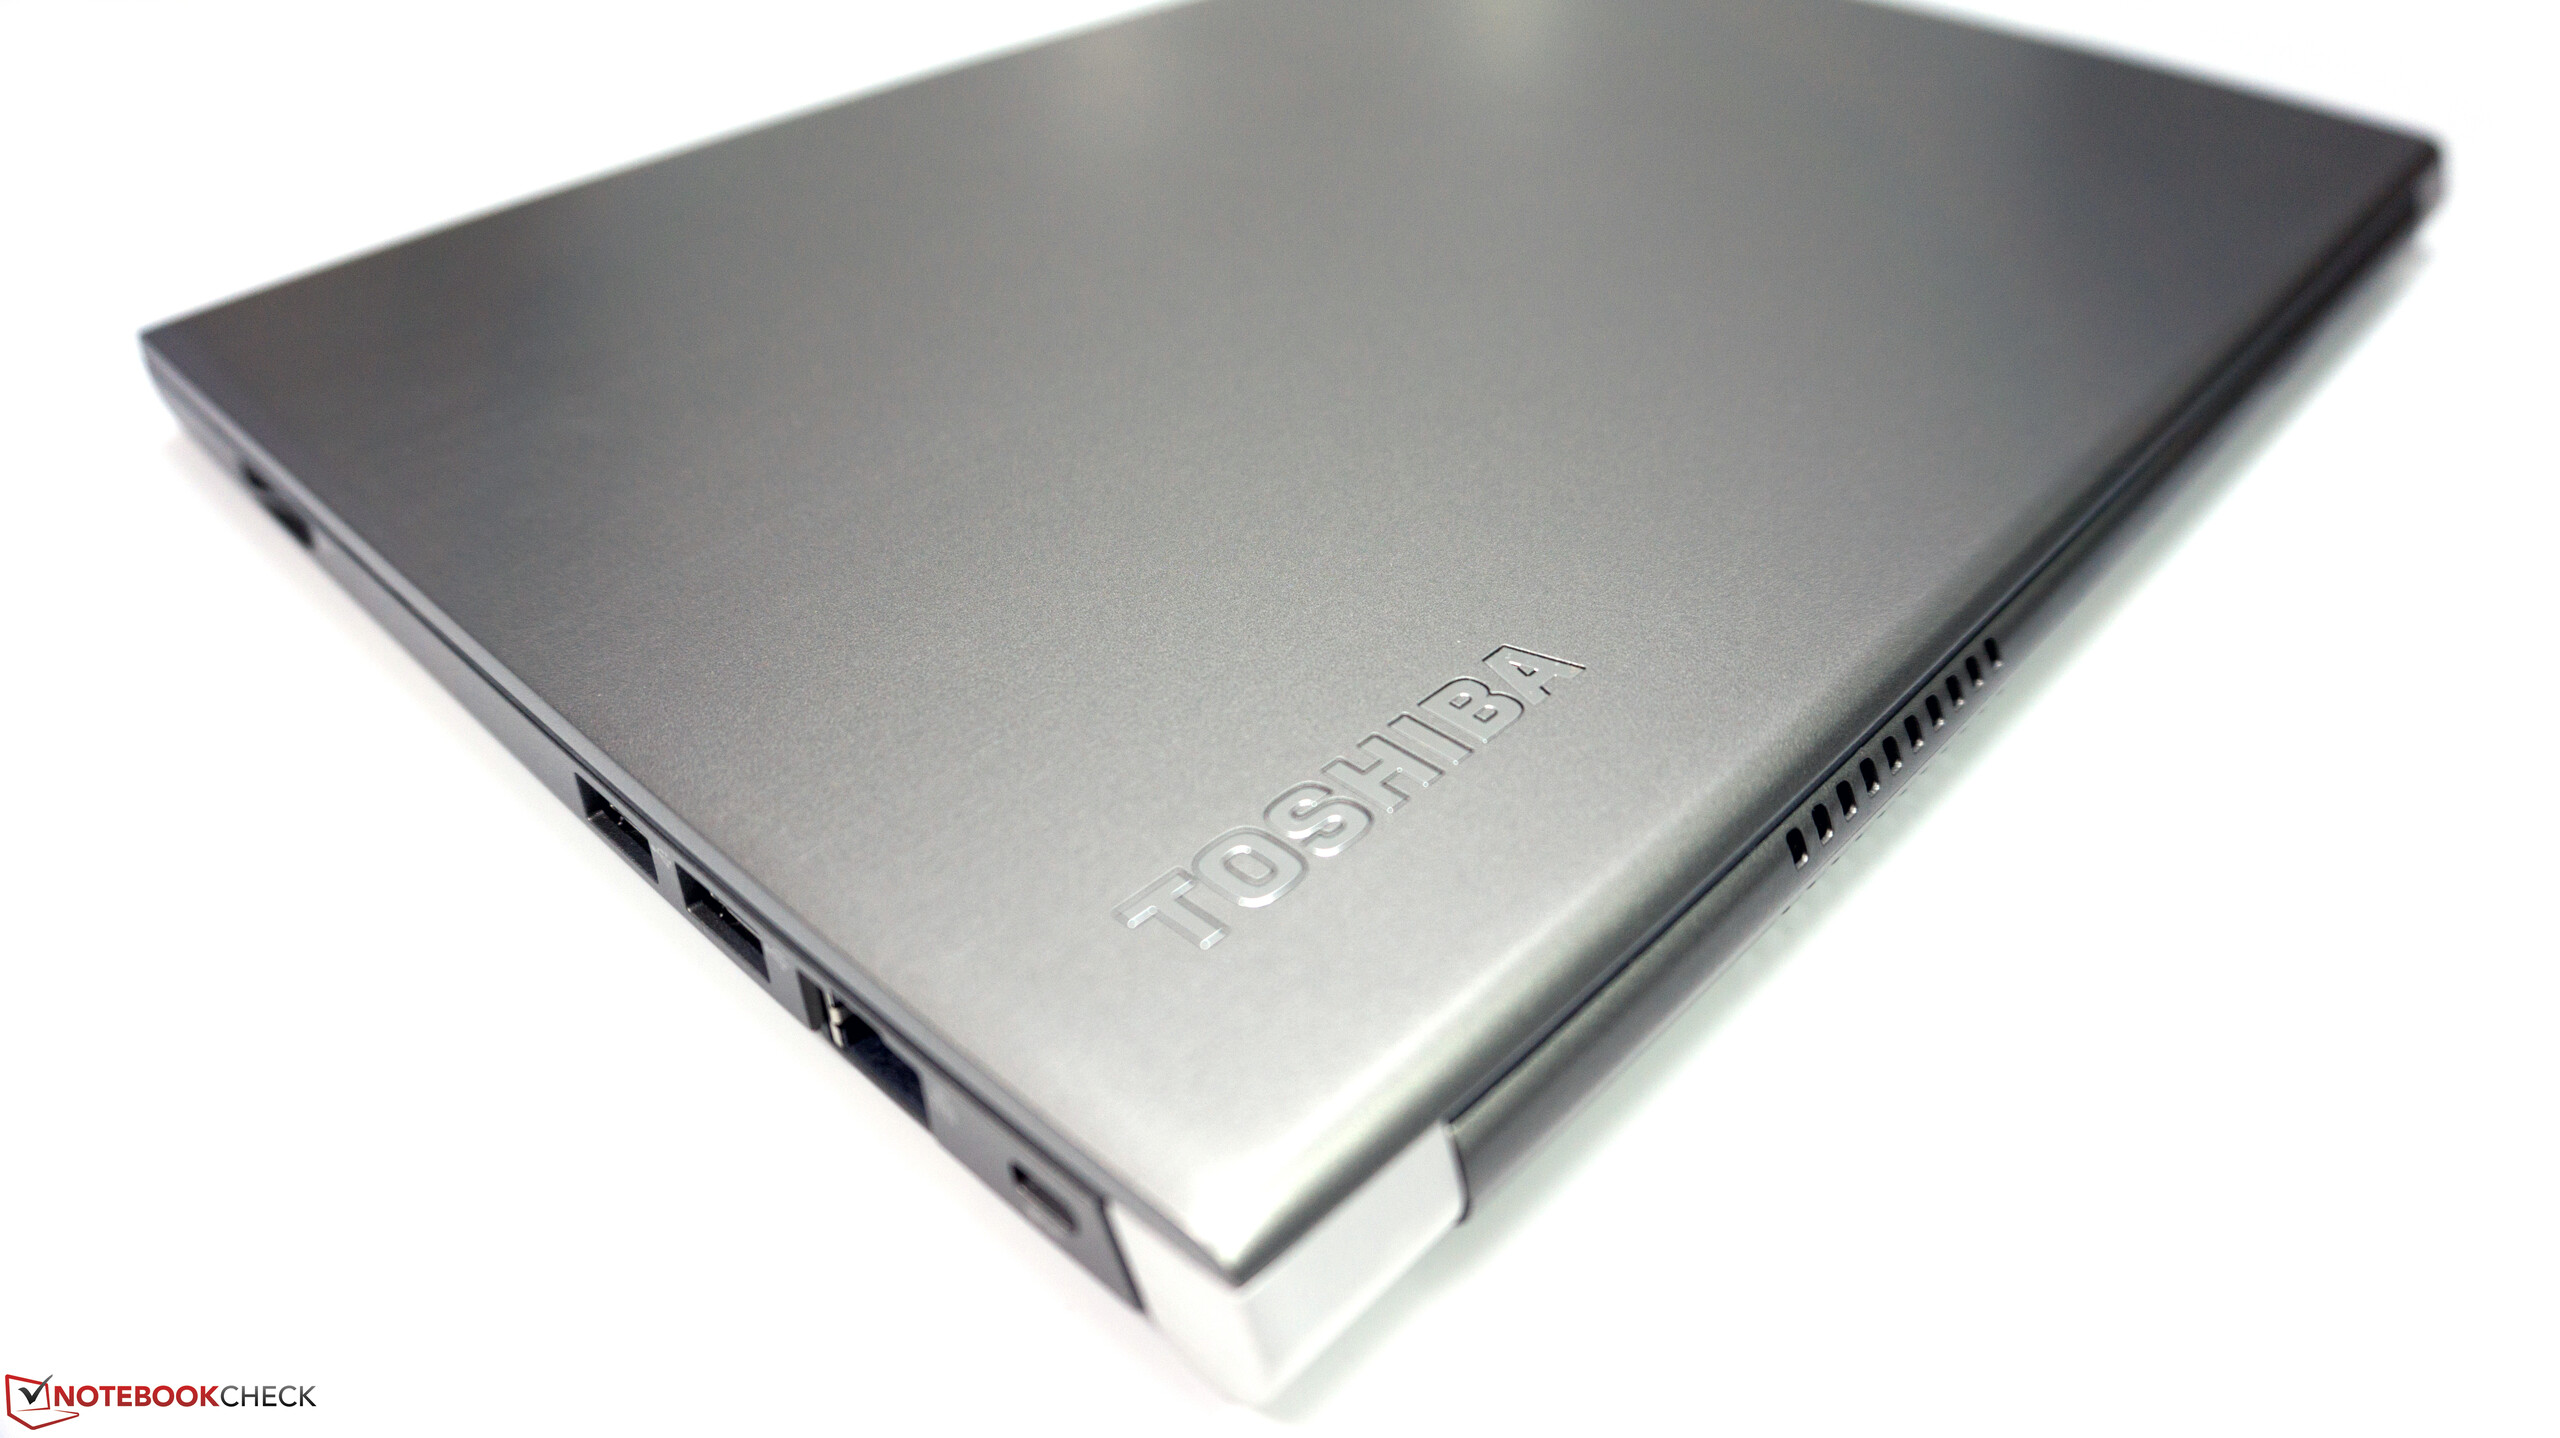
+ 轻薄镁合金机身
+ 优秀工艺
+ 很优秀的电池续航时间
+ 不错的系统性能
+ 快速的固态硬盘
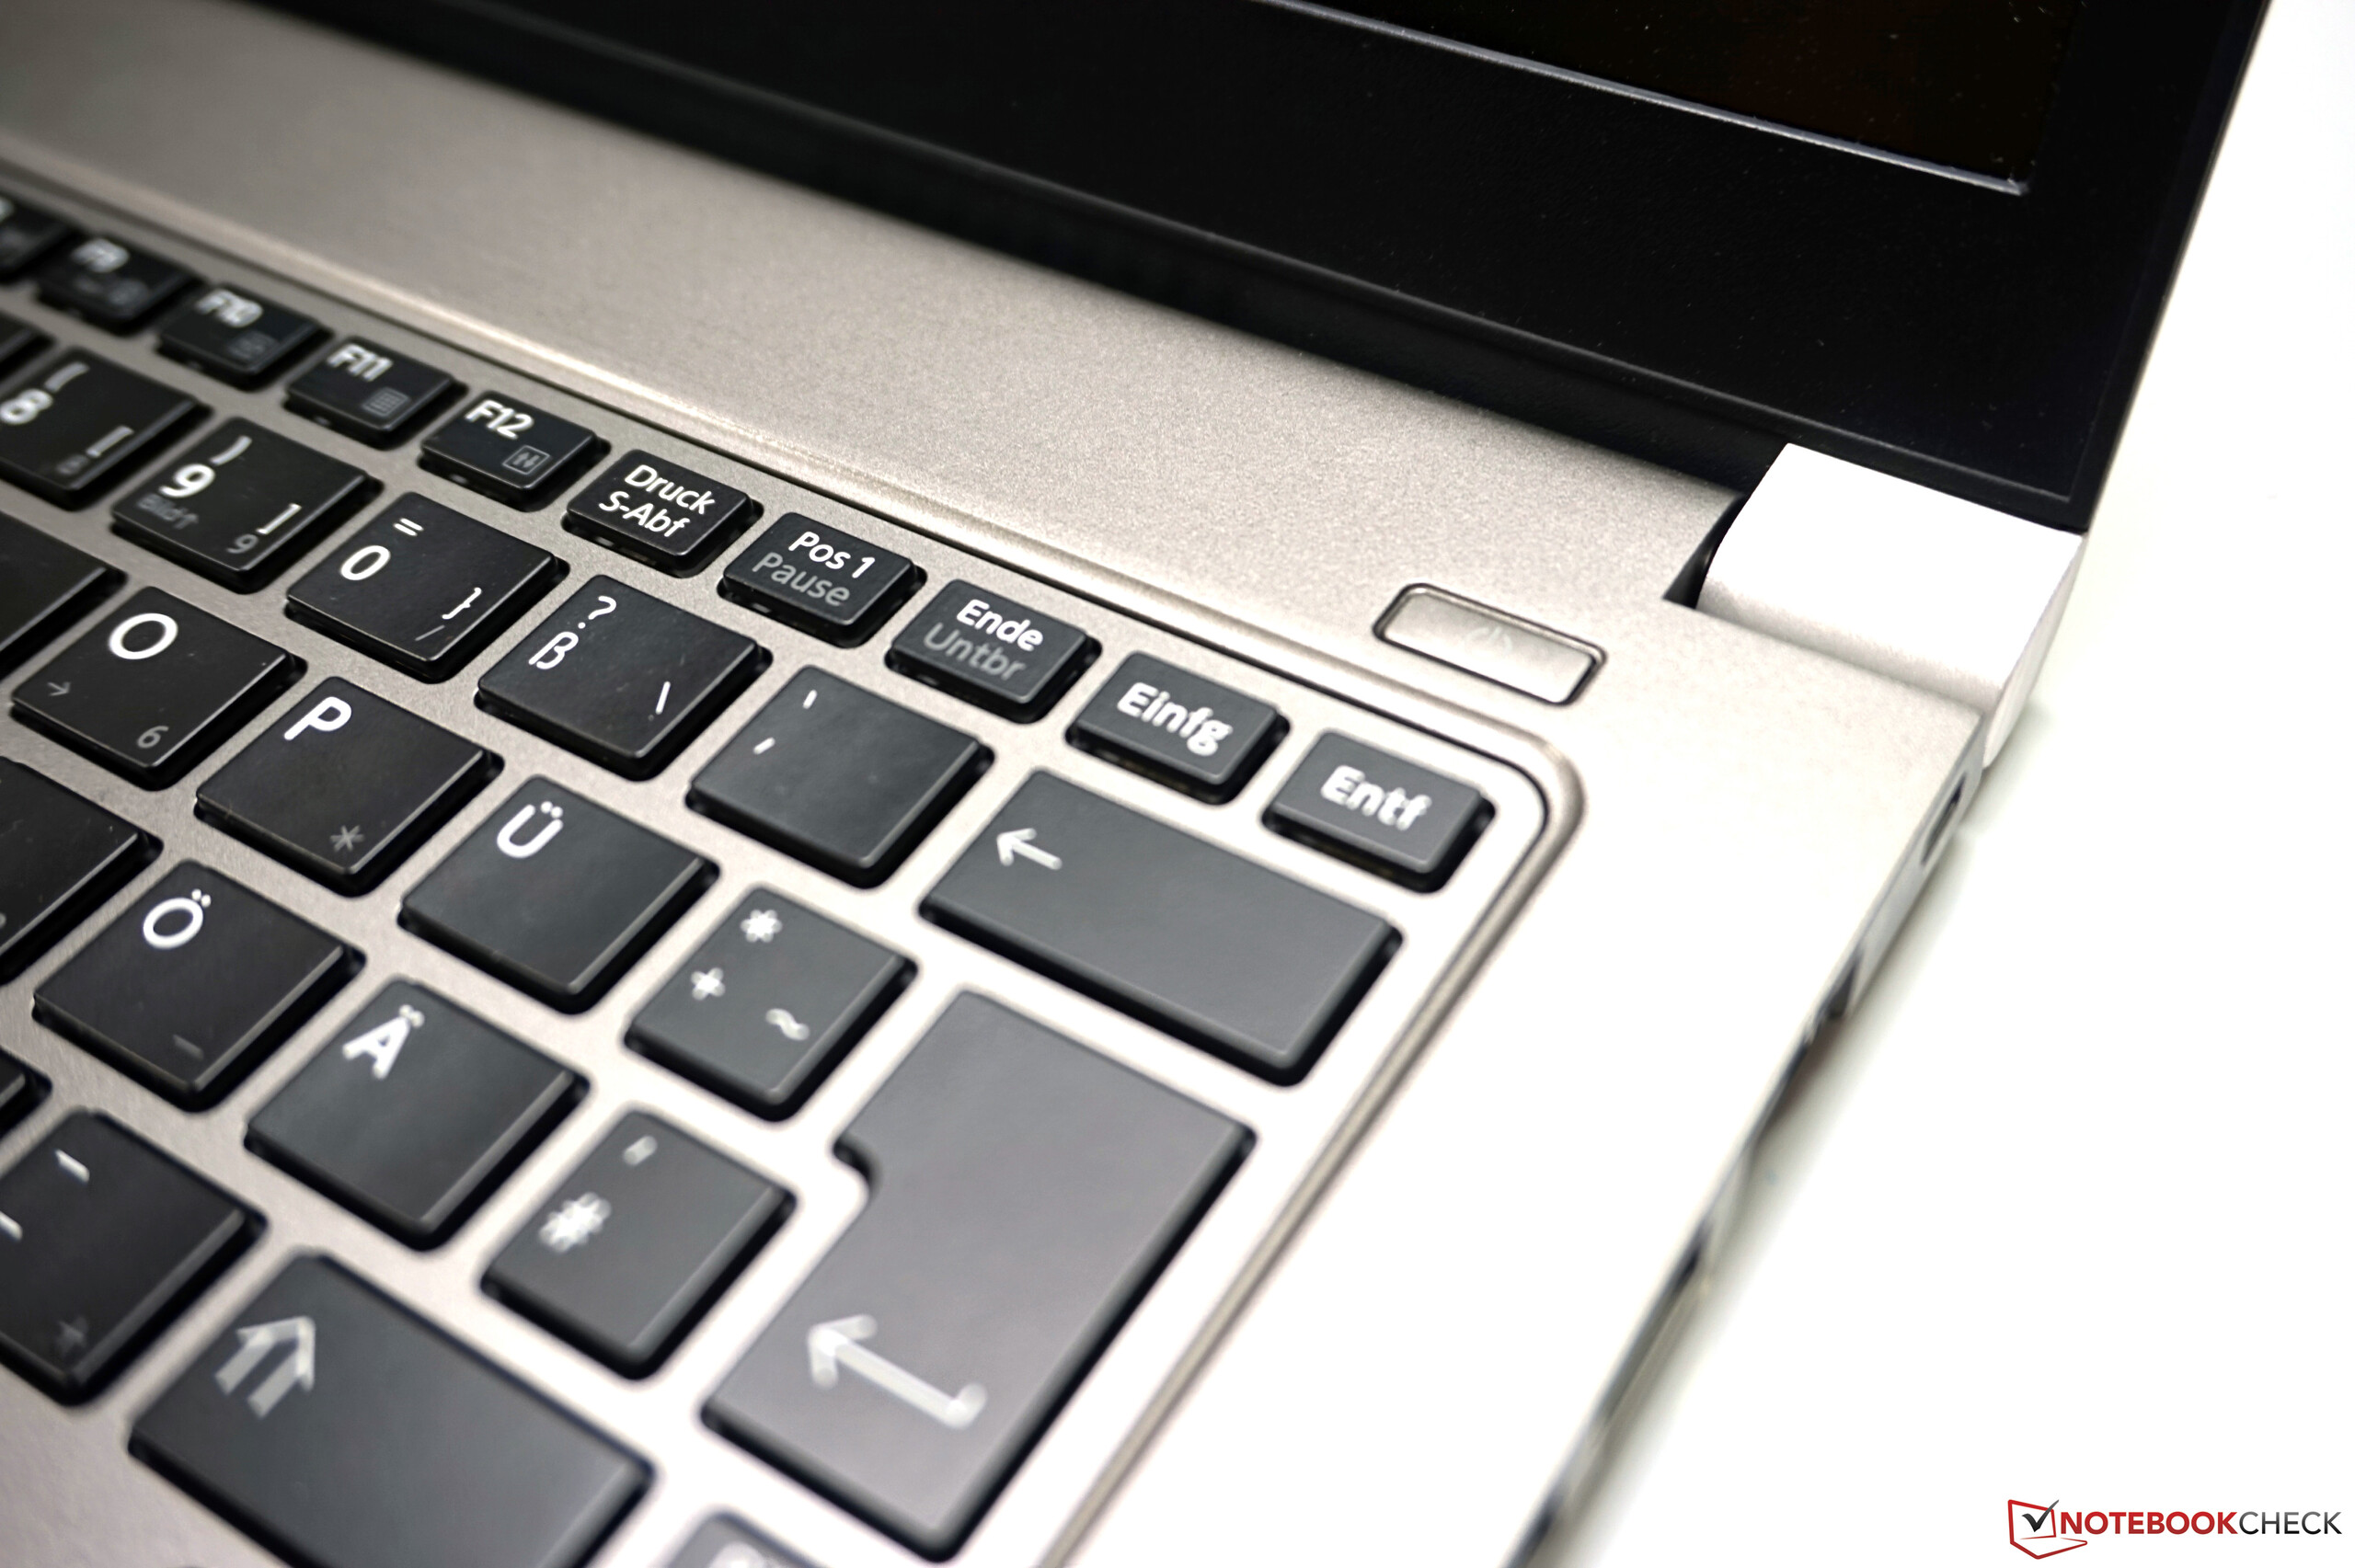
+ 磨砂屏幕
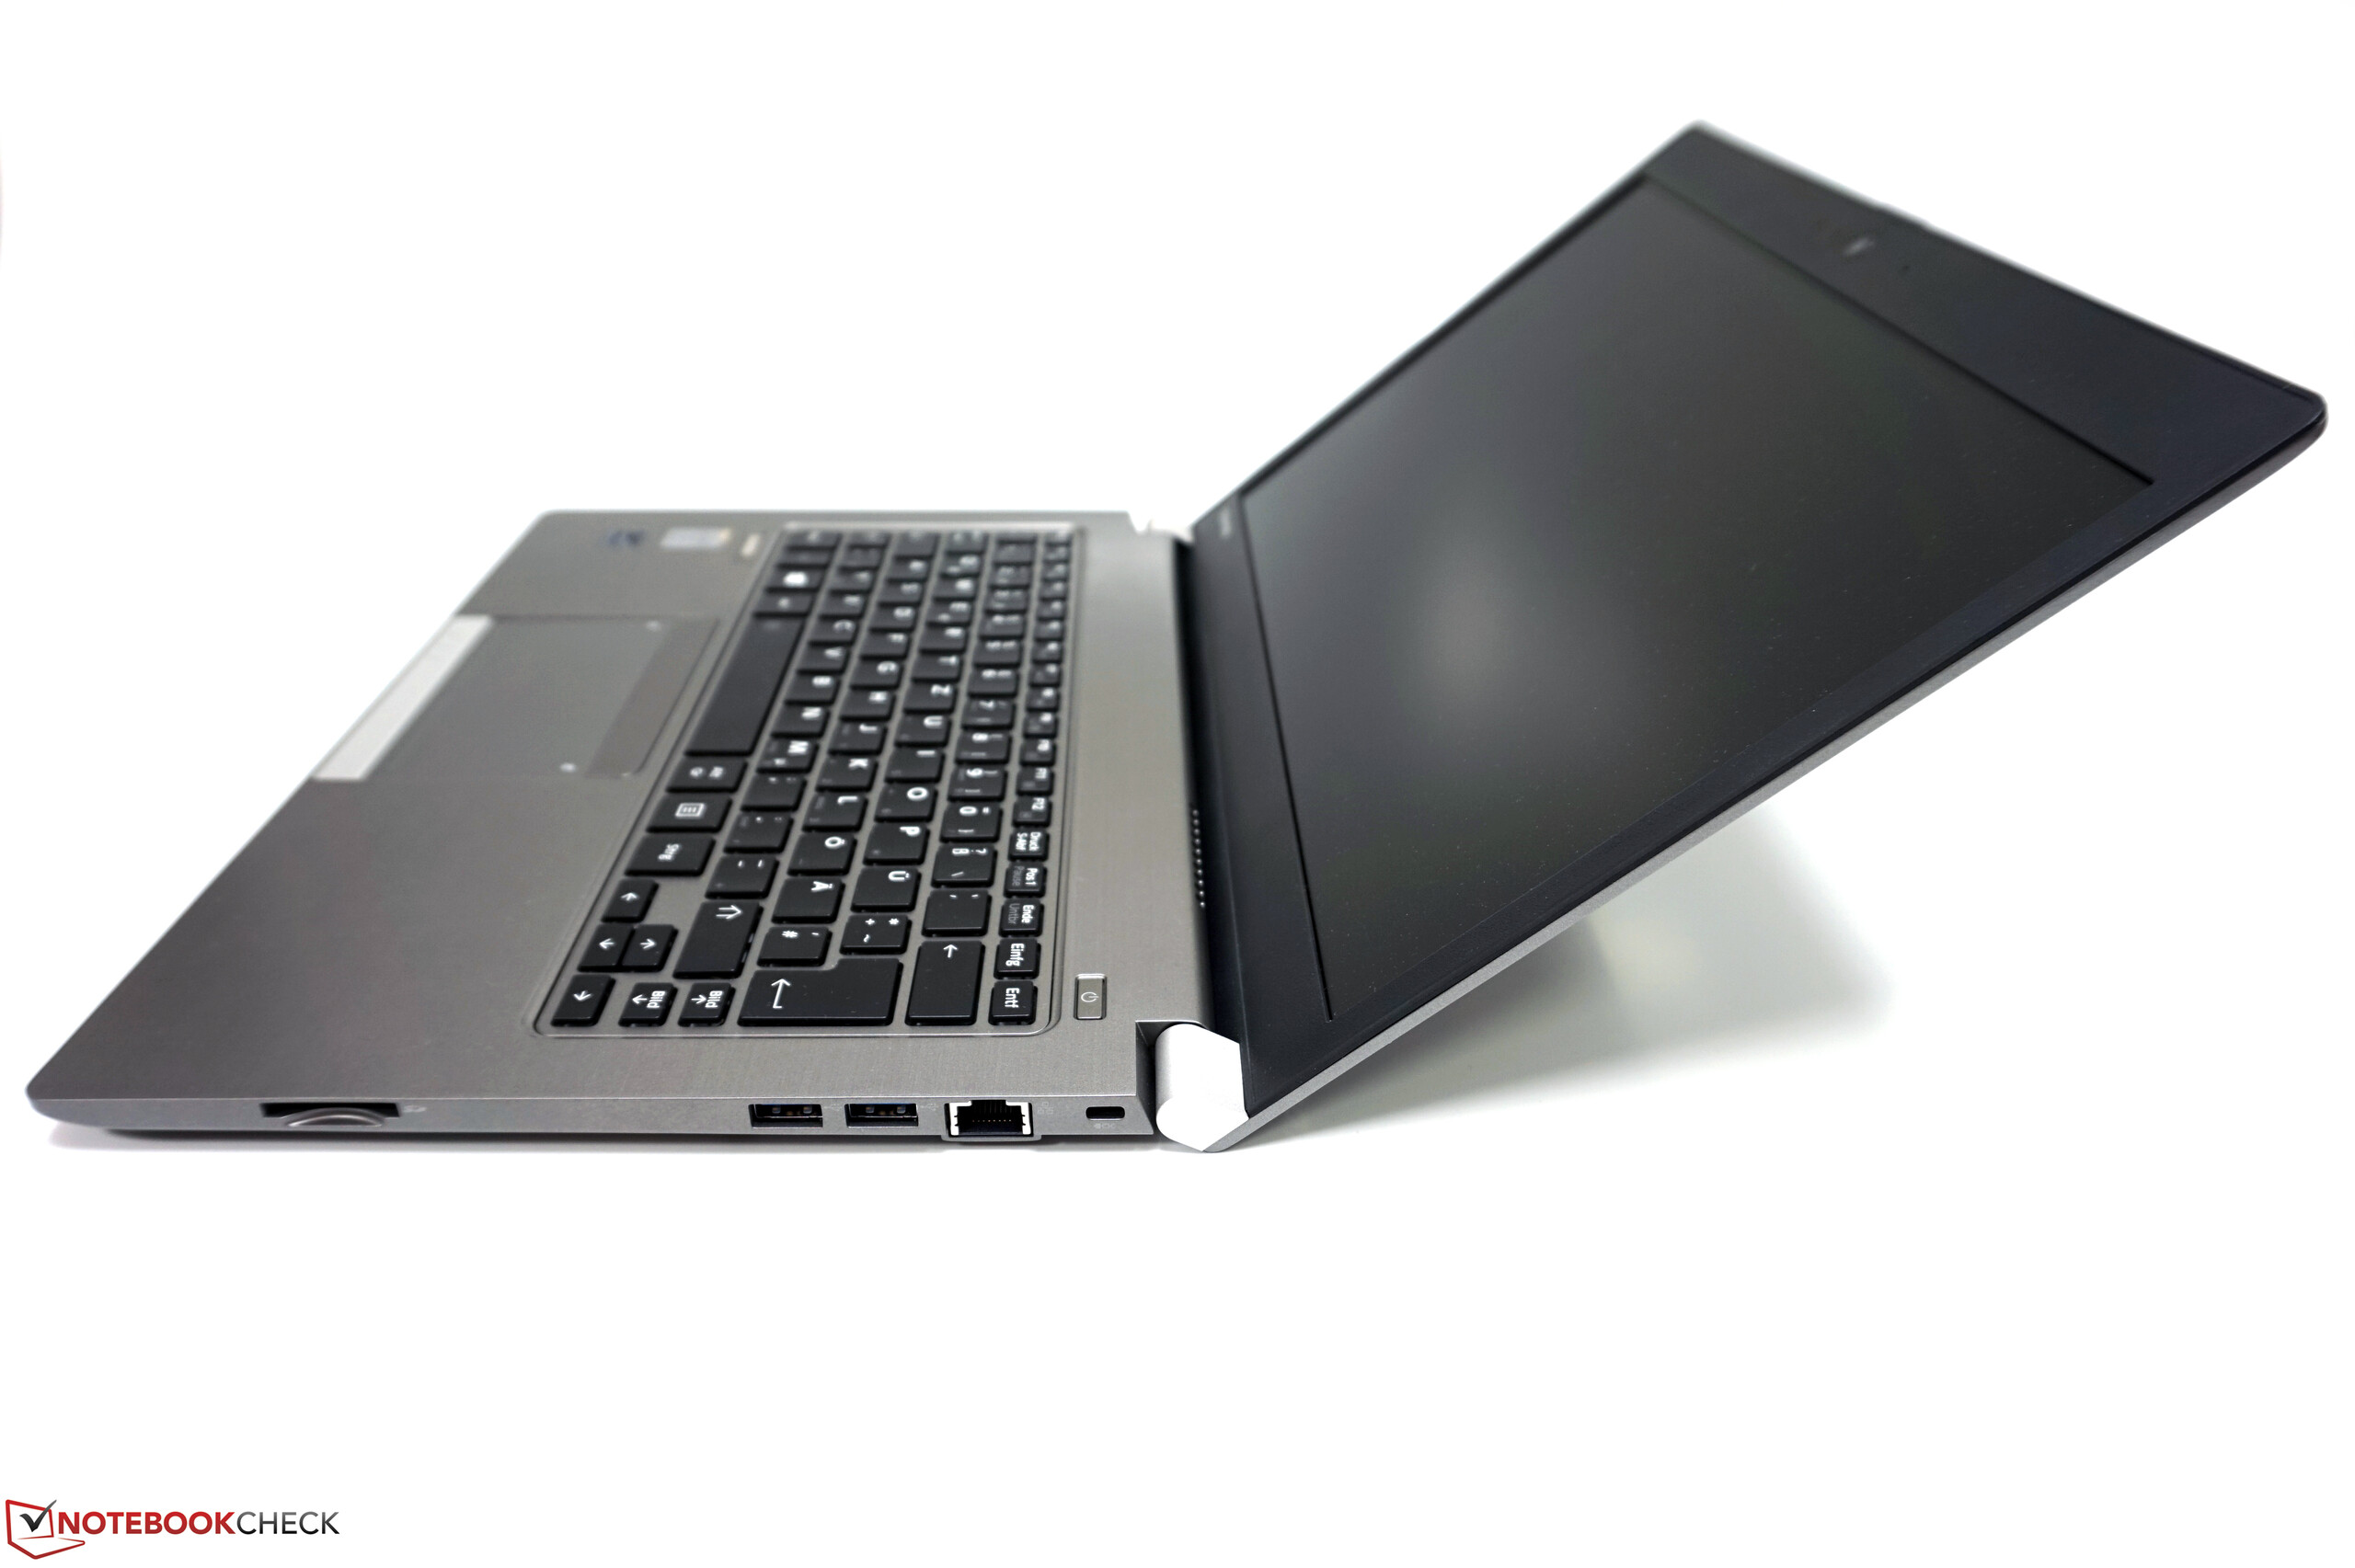
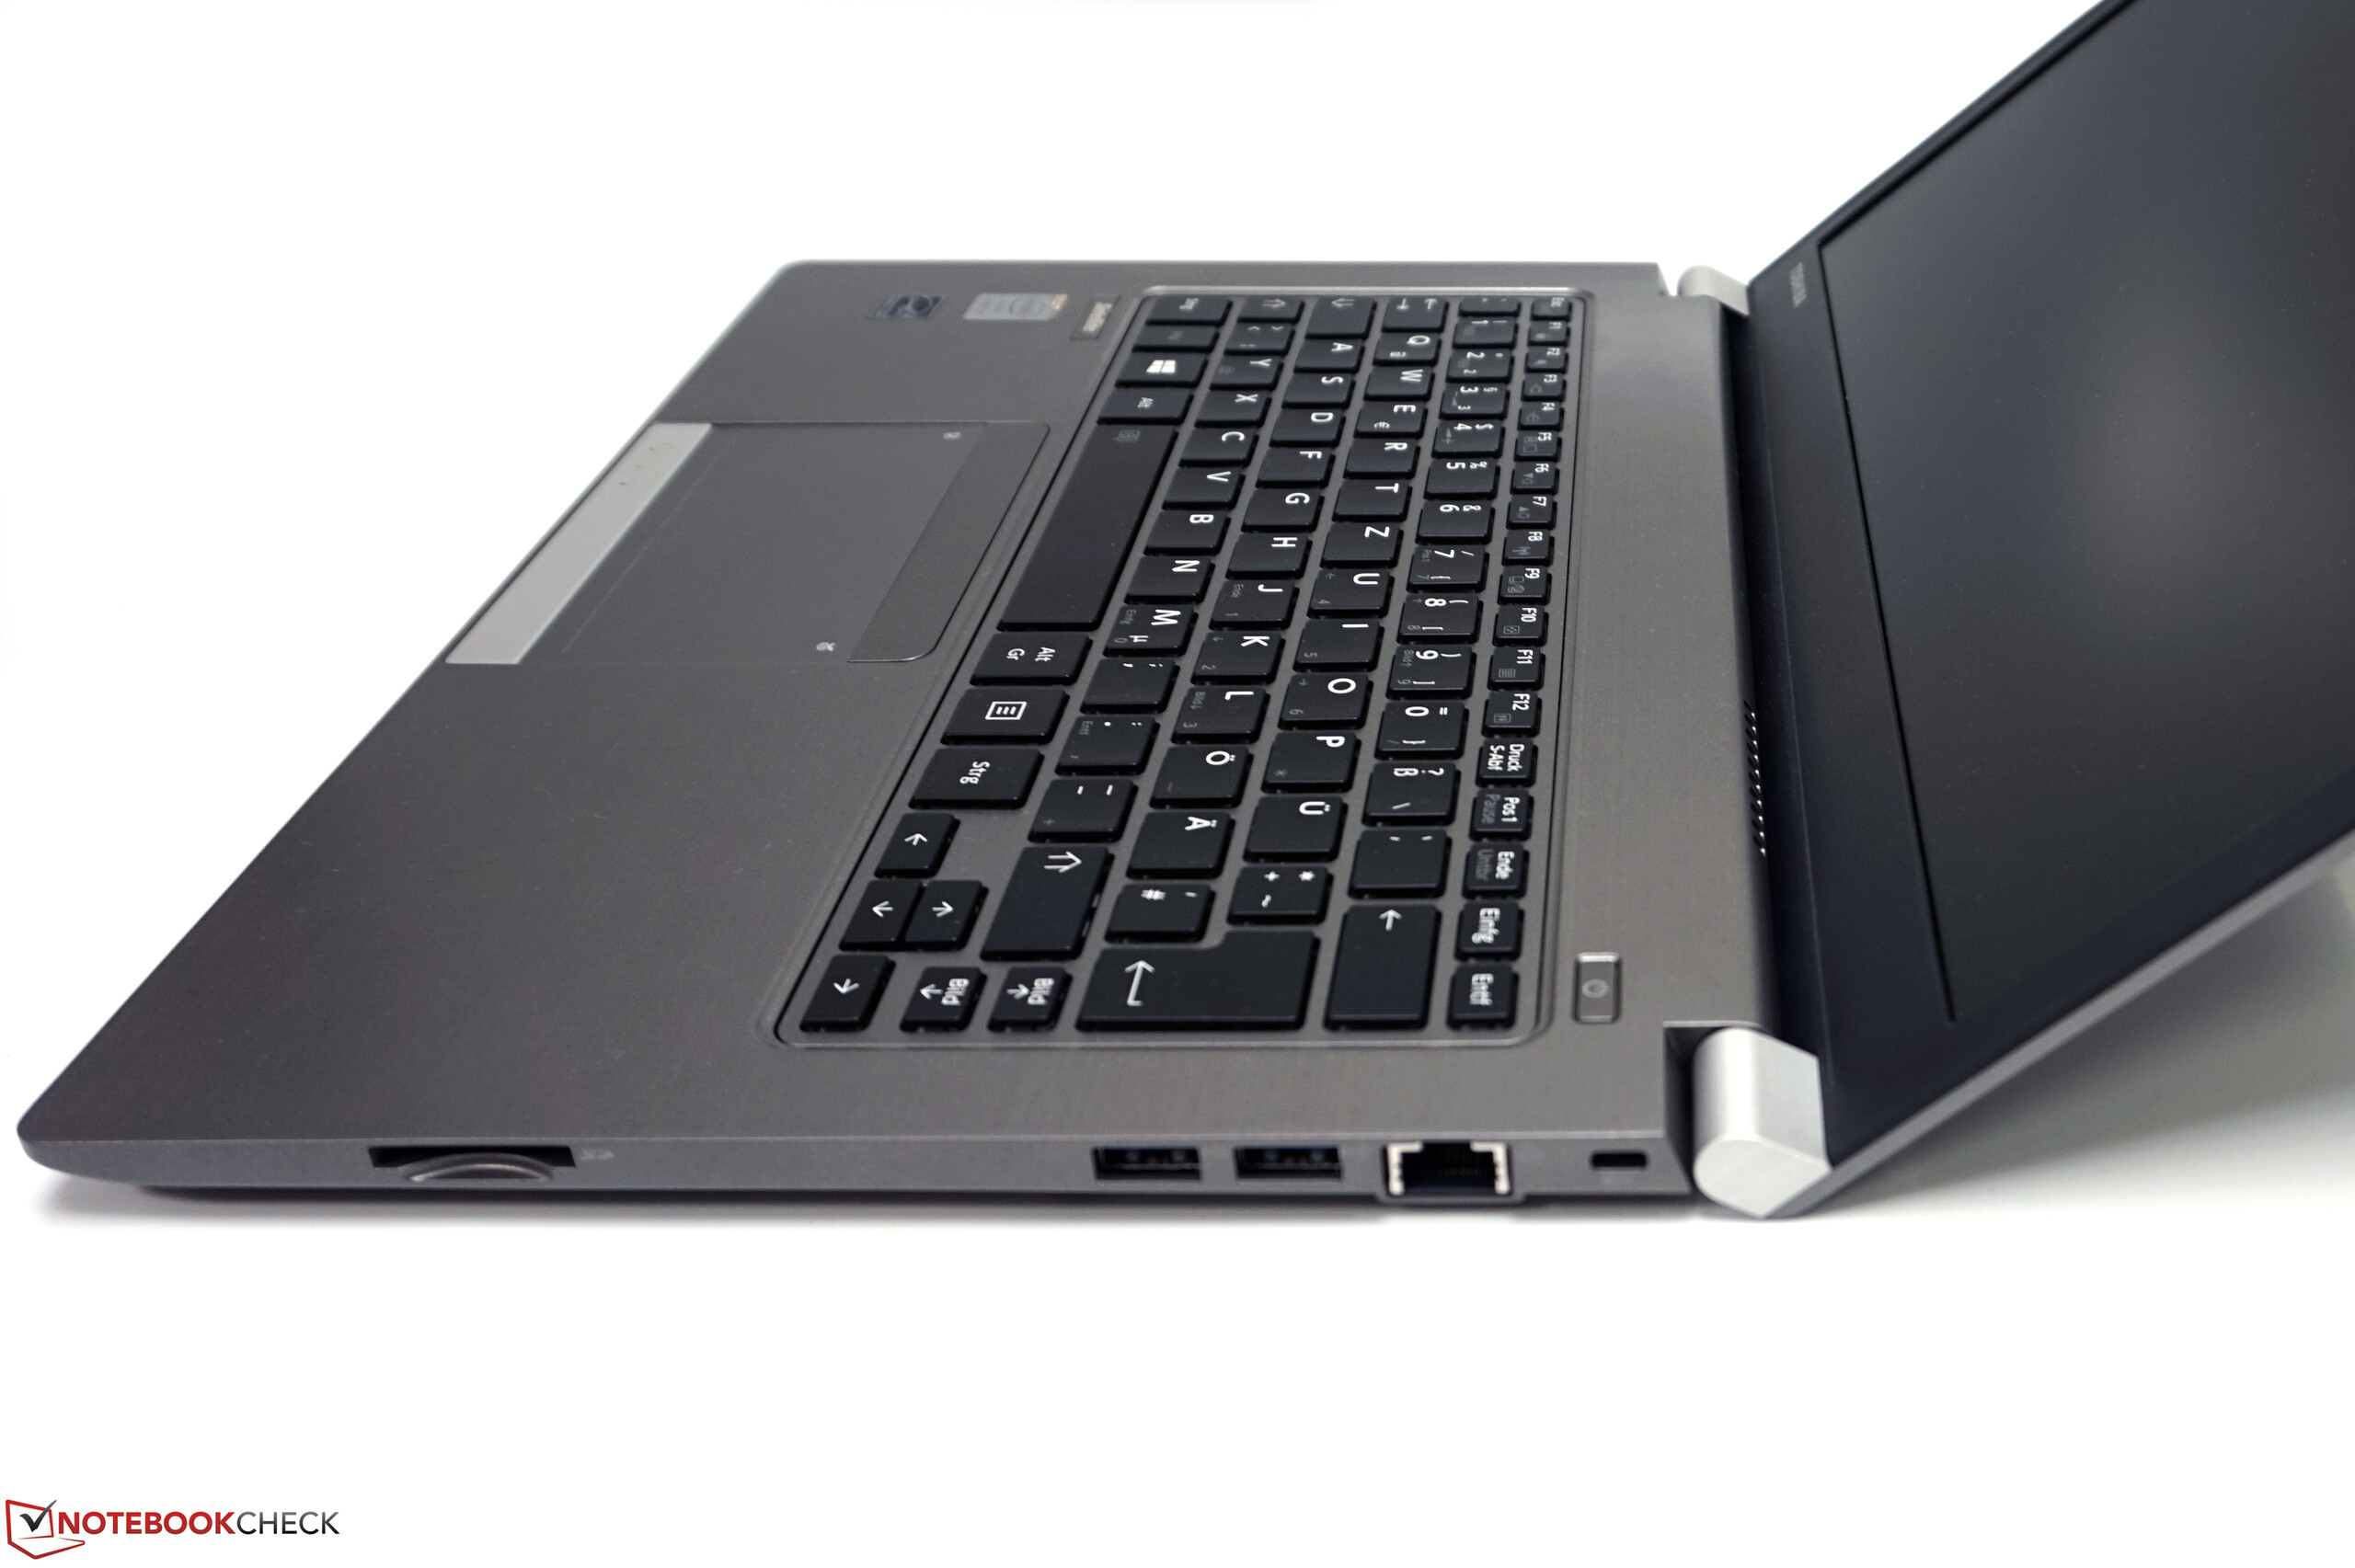
+ 优秀的接口配备
Cons
- TN屏幕
- 仅高清分辨率
- 较窄的可视角度范围
- 较差的扬声器
- 在负载下噪音较大
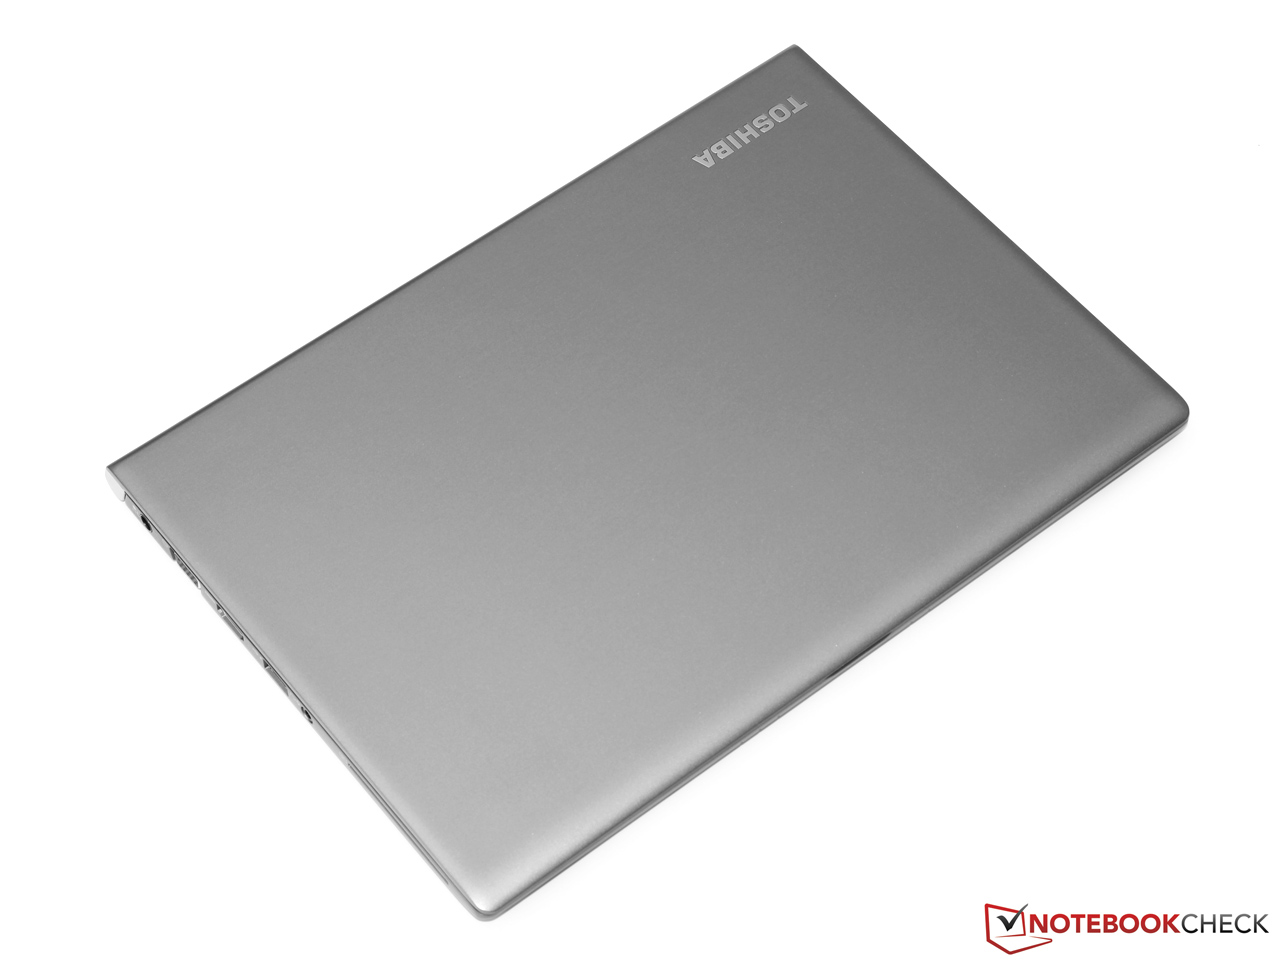
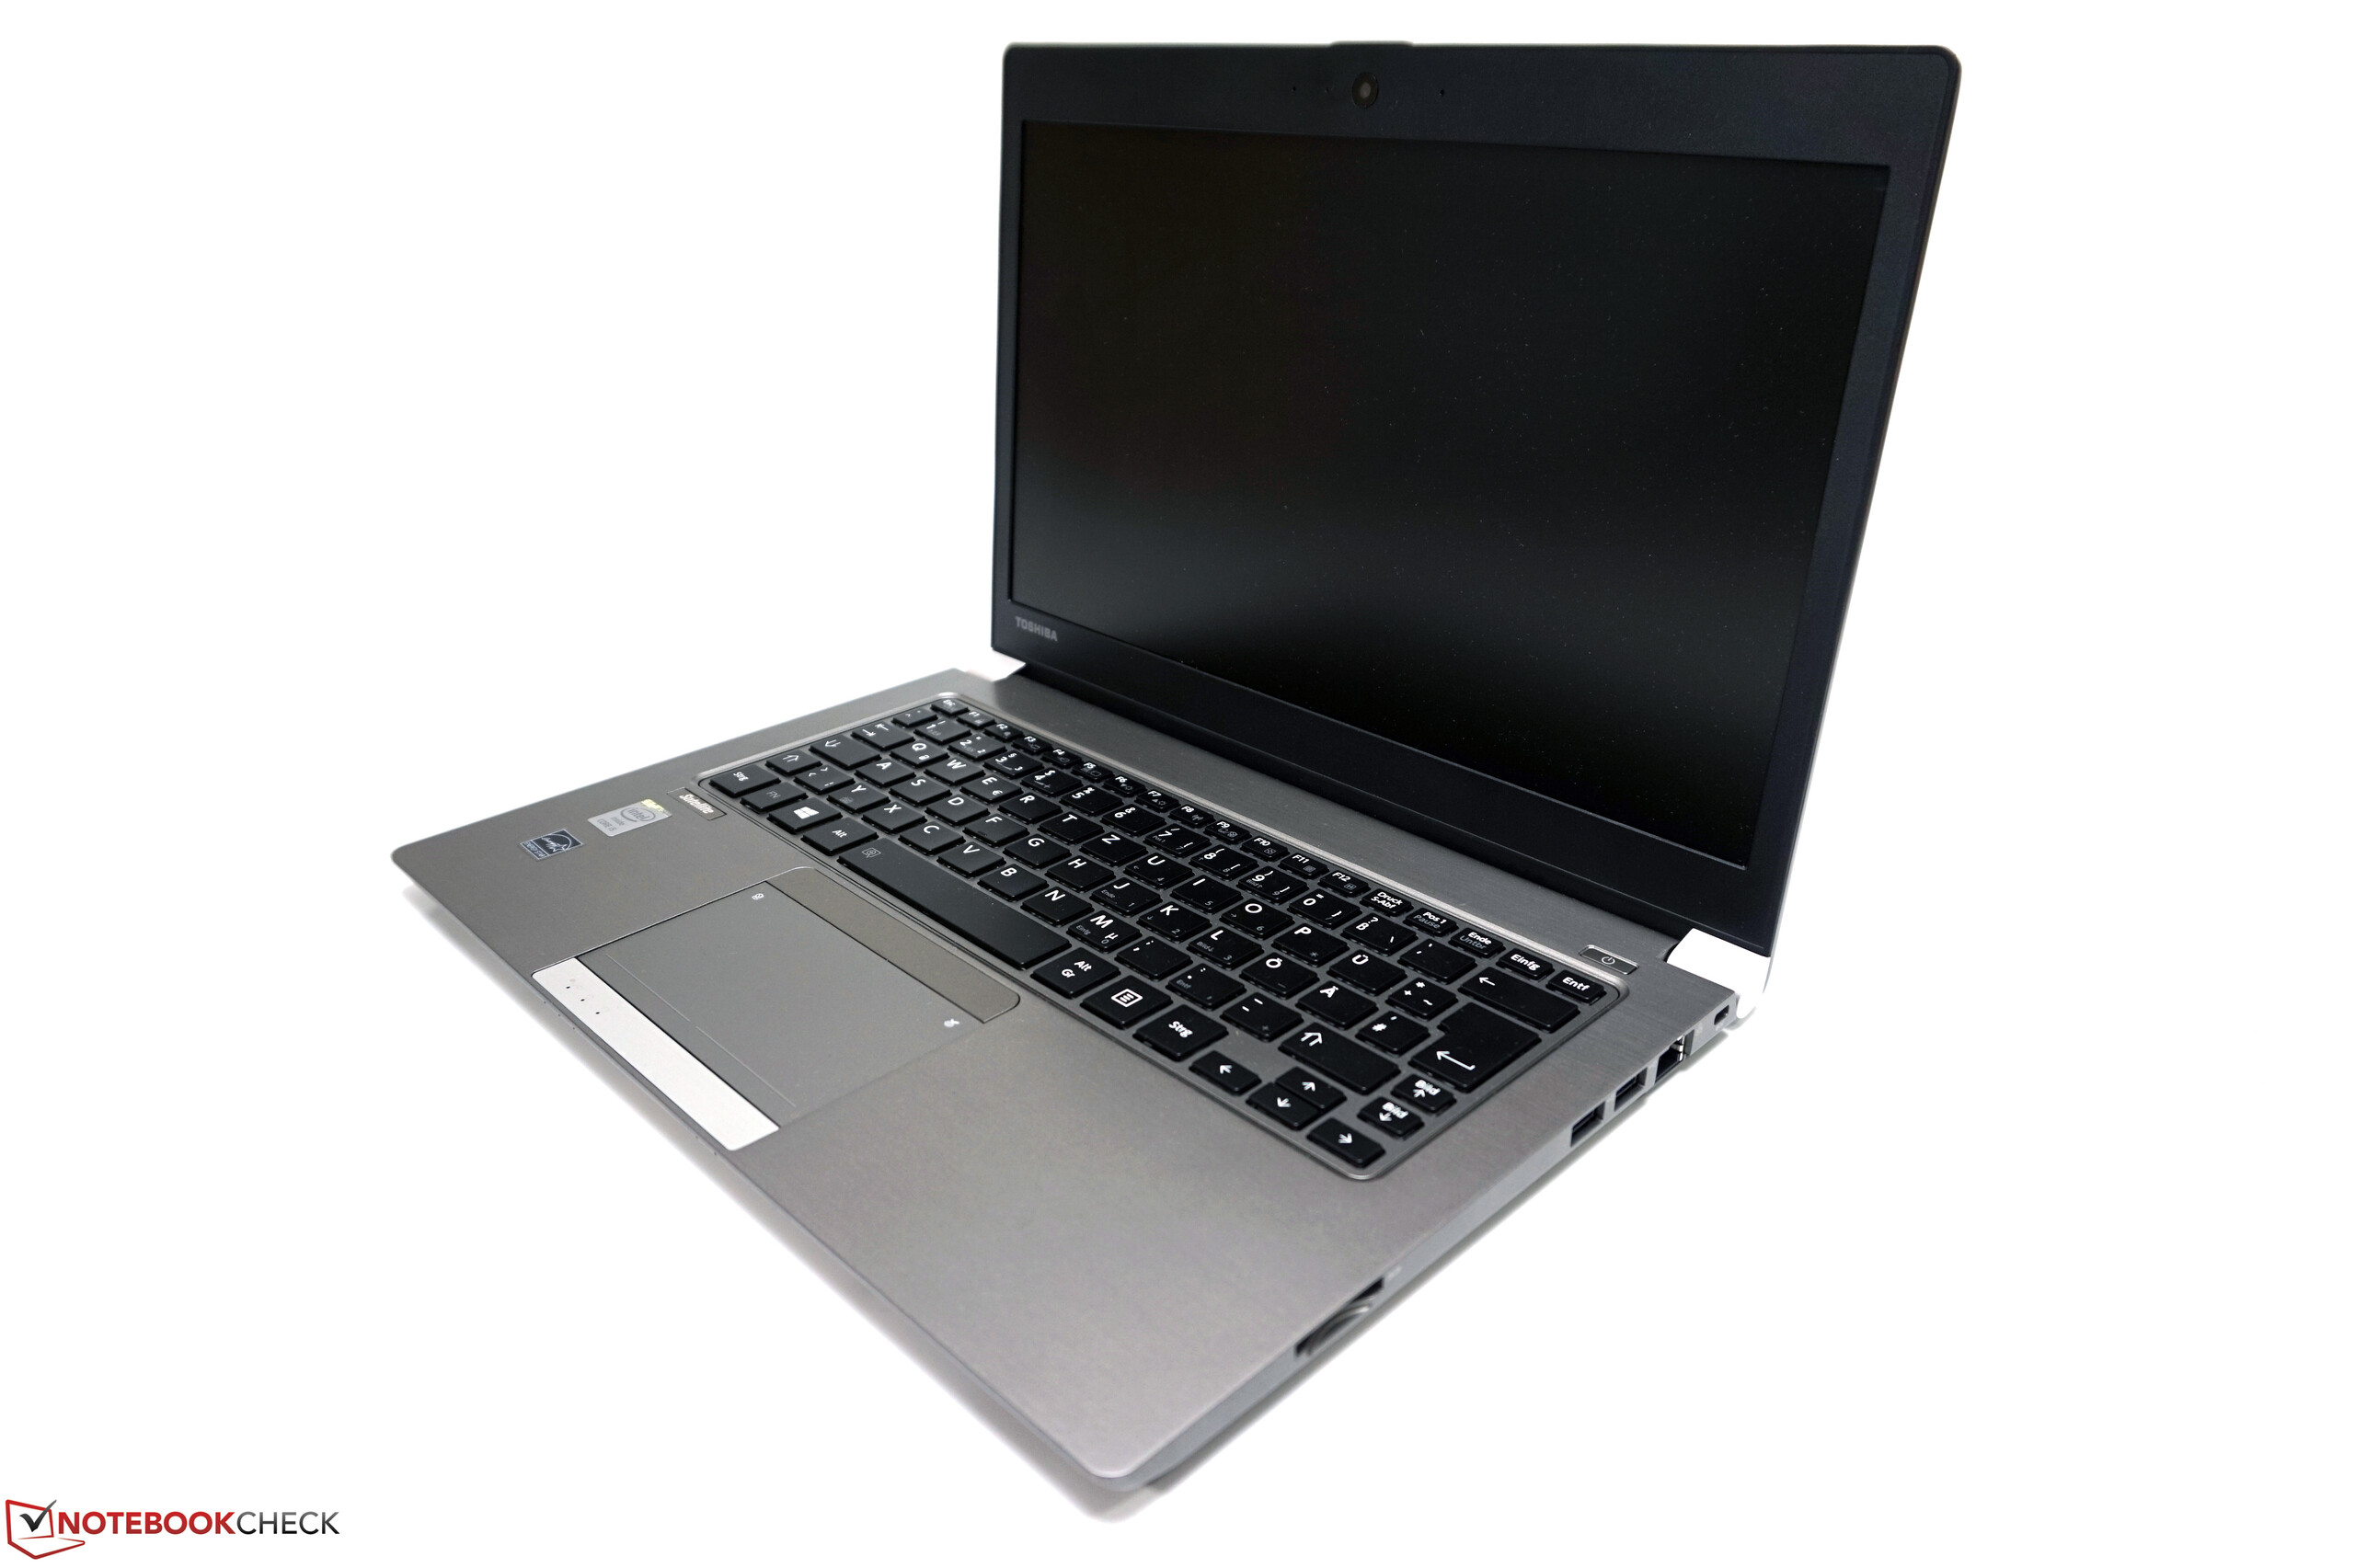
东芝的Satellite Z30-B-100很多方面的设计都十分优秀。尽管它的机身显得有些老气,我们仍然很欣赏它的超低重量和紧凑尺寸,完全可以达到它所宣称的高便携性水准。另外,它搭配了最新的硬件,不错的输入设备,和出色的电池续航。那么它会是个人用户的完美选择吗?
我们认为这恐怕有些困难,因为这台测试机在最重要的方面之一让我们很难满意:它的TN高清屏幕整体上让人很失望。它唯一的优势是磨砂表面。我们十分希望笔记本电脑低质量屏幕的时代可以尽早结束,至少是售价超过1000欧元(约6788人民币)的产品应该做到这一点。
希望购买东芝Satellite Z30的用户有必要选择搭配全高清屏幕的机型。
它在市场上的竞争来自于戴尔XPS 13-9343和华硕ZenBook UX305FA,很明显它们都有一个重要优势,这也直接导致了总分上的差距。这台测试机的市场价略低于1000欧元(约6788人民币),尽管它在其他方面的表现优秀,因而得到了85%的总分,由于屏幕的质量过低我们并不推荐这款产品。
注:本文是基于完整评测的缩减版本,阅读完整的英文评测,请点击这里。
Toshiba Satellite Z30-B-100
- 06/18/2015 v4 (old)
Andreas Osthoff
Subnotebook - Weighted Average