联想 Yoga 700 14ISK 变形本简短评测
» Notebookcheck多媒体笔记本电脑Top 10排名
» Notebookcheck游戏笔记本电脑Top 10排名
» Notebookcheck低价办公/商务笔记本电脑Top 10排名
» Notebookcheck高端办公/商务笔记本电脑Top 10排名
» Notebookcheck工作站笔记本电脑Top 10排名
» Notebookcheck亚笔记本电脑Top 10排名
» Notebookcheck超级本产品Top 10排名
» Notebookcheck变形本产品Top 10排名
» Notebookcheck平板电脑Top 10排名
» Notebookcheck智能手机Top 10排名
» Notebookcheck评测过最出色的笔记本电脑屏幕
» Notebookcheck售价500欧元以下笔记本电脑Top 10排名
» Notebookcheck售价300欧元以下笔记本电脑Top 10排名
| |||||||||||||||||||||||||
Brightness Distribution: 88 %
Center on Battery: 224.5 cd/m²
Contrast: 980:1 (Black: 0.229 cd/m²)
ΔE Color 6.06 | 0.5-29.43 Ø4.87
ΔE Greyscale 5 | 0.5-98 Ø5.1
61% sRGB (Argyll 1.6.3 3D)
39% AdobeRGB 1998 (Argyll 1.6.3 3D)
43.03% AdobeRGB 1998 (Argyll 2.2.0 3D)
61.8% sRGB (Argyll 2.2.0 3D)
41.58% Display P3 (Argyll 2.2.0 3D)
Gamma: 2.25
| Lenovo Yoga 700-14ISK 80QD 1920x1080 | HP Pavilion 14t-ab000 K9E07AV 1366x768 | Acer Aspire E5-473G-59QT 1920x1080 | Lenovo ThinkPad T450s-20BWS1UT00 1920x1080 | Lenovo Yoga 3 14 1920x1080 | Dell Latitude E7450 1920x1080 | |
|---|---|---|---|---|---|---|
| Display | -10% | -9% | 45% | 56% | ||
| Display P3 Coverage | 41.58 | 37.38 -10% | 37.82 -9% | 64.8 56% | 66.6 60% | |
| sRGB Coverage | 61.8 | 56.3 -9% | 56.9 -8% | 83.8 36% | 92.4 50% | |
| AdobeRGB 1998 Coverage | 43.03 | 38.62 -10% | 39.07 -9% | 61.2 42% | 67.7 57% | |
| Response Times | ||||||
| Response Time Grey 50% / Grey 80% * | 52.8 ? | |||||
| Response Time Black / White * | 42 ? | |||||
| PWM Frequency | 198 ? | |||||
| Screen | -77% | -45% | 18% | -8% | 20% | |
| Brightness middle | 224.5 | 238.4 6% | 238 6% | 288 28% | 234.6 4% | 280 25% |
| Brightness | 211 | 218 3% | 228 8% | 281 33% | 225 7% | 257 22% |
| Brightness Distribution | 88 | 86 -2% | 90 2% | 94 7% | 82 -7% | 75 -15% |
| Black Level * | 0.229 | 1.029 -349% | 0.54 -136% | 0.286 -25% | 0.394 -72% | 0.3 -31% |
| Contrast | 980 | 232 -76% | 441 -55% | 1007 3% | 595 -39% | 933 -5% |
| Colorchecker dE 2000 * | 6.06 | 12.21 -101% | 10.64 -76% | 4.35 28% | 5.22 14% | 3.45 43% |
| Greyscale dE 2000 * | 5 | 13.44 -169% | 11.74 -135% | 3.7 26% | 3.35 33% | 3.35 33% |
| Gamma | 2.25 98% | 2.11 104% | 2.42 91% | 2.68 82% | 2.27 97% | 2.37 93% |
| CCT | 7030 92% | 20097 32% | 13043 50% | 6076 107% | 6184 105% | 6940 94% |
| Color Space (Percent of AdobeRGB 1998) | 39 | 38.62 -1% | 36 -8% | 54.7 40% | 36.92 -5% | 60 54% |
| Color Space (Percent of sRGB) | 61 | 56.26 -8% | 57 -7% | 92 51% | ||
| Total Average (Program / Settings) | -44% /
-61% | -27% /
-36% | 32% /
25% | -8% /
-8% | 38% /
29% |
* ... smaller is better
Display Response Times
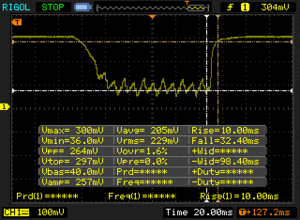
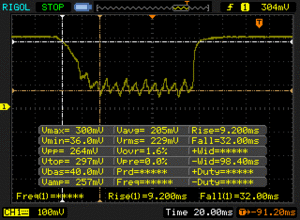
| ↔ Response Time Black to White | ||
|---|---|---|
| 42 ms ... rise ↗ and fall ↘ combined | ↗ 10 ms rise | |
| ↘ 32 ms fall | ||
| The screen shows slow response rates in our tests and will be unsatisfactory for gamers. In comparison, all tested devices range from 0.1 (minimum) to 240 (maximum) ms. » 98 % of all devices are better. This means that the measured response time is worse than the average of all tested devices (20.8 ms). | ||
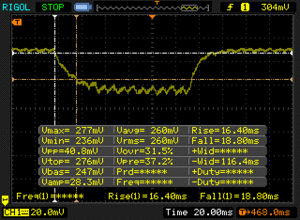
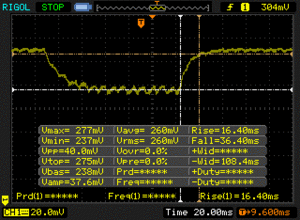
| ↔ Response Time 50% Grey to 80% Grey | ||
| 52.8 ms ... rise ↗ and fall ↘ combined | ↗ 16.4 ms rise | |
| ↘ 36.4 ms fall | ||
| The screen shows slow response rates in our tests and will be unsatisfactory for gamers. In comparison, all tested devices range from 0.165 (minimum) to 636 (maximum) ms. » 89 % of all devices are better. This means that the measured response time is worse than the average of all tested devices (32.5 ms). | ||
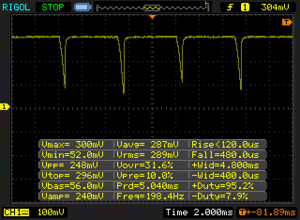
Screen Flickering / PWM (Pulse-Width Modulation)
| Screen flickering / PWM detected | 198 Hz | ≤ 90 % brightness setting | |
The display backlight flickers at 198 Hz (worst case, e.g., utilizing PWM) Flickering detected at a brightness setting of 90 % and below. There should be no flickering or PWM above this brightness setting. The frequency of 198 Hz is relatively low, so sensitive users will likely notice flickering and experience eyestrain at the stated brightness setting and below. In comparison: 53 % of all tested devices do not use PWM to dim the display. If PWM was detected, an average of 8516 (minimum: 5 - maximum: 343500) Hz was measured. | |||
| Cinebench R15 | |
| CPU Single 64Bit (sort by value) | |
| Lenovo Yoga 700-14ISK 80QD | |
| Acer Aspire VN7-791G-79GT | |
| Microsoft Surface Book Core i5 | |
| HP EliteBook Folio 1040 G2 H7W22EA | |
| Acer TravelMate P257-M-56AX | |
| Toshiba Tecra Z40 A-147 | |
| CPU Multi 64Bit (sort by value) | |
| Lenovo Yoga 700-14ISK 80QD | |
| Acer Aspire VN7-791G-79GT | |
| Microsoft Surface Book Core i5 | |
| HP EliteBook Folio 1040 G2 H7W22EA | |
| Acer TravelMate P257-M-56AX | |
| Toshiba Tecra Z40 A-147 | |
| Cinebench R10 | |
| Rendering Single CPUs 64Bit (sort by value) | |
| Lenovo Yoga 700-14ISK 80QD | |
| Acer Aspire VN7-791G-79GT | |
| Microsoft Surface Book Core i5 | |
| HP EliteBook Folio 1040 G2 H7W22EA | |
| Toshiba Tecra Z40 A-147 | |
| Rendering Multiple CPUs 64Bit (sort by value) | |
| Lenovo Yoga 700-14ISK 80QD | |
| Acer Aspire VN7-791G-79GT | |
| Microsoft Surface Book Core i5 | |
| HP EliteBook Folio 1040 G2 H7W22EA | |
| Toshiba Tecra Z40 A-147 | |
| Cinebench R11.5 | |
| CPU Single 64Bit (sort by value) | |
| Lenovo Yoga 700-14ISK 80QD | |
| Acer Aspire VN7-791G-79GT | |
| Microsoft Surface Book Core i5 | |
| HP EliteBook Folio 1040 G2 H7W22EA | |
| Acer TravelMate P257-M-56AX | |
| Toshiba Tecra Z40 A-147 | |
| CPU Multi 64Bit (sort by value) | |
| Lenovo Yoga 700-14ISK 80QD | |
| Acer Aspire VN7-791G-79GT | |
| Microsoft Surface Book Core i5 | |
| HP EliteBook Folio 1040 G2 H7W22EA | |
| Acer TravelMate P257-M-56AX | |
| Toshiba Tecra Z40 A-147 | |
| PCMark 7 - Score (sort by value) | |
| Lenovo Yoga 700-14ISK 80QD | |
| Microsoft Surface Book Core i5 | |
| Dell XPS 13-9350 | |
| Lenovo ThinkPad T450s-20BWS03F00 | |
| Lenovo Yoga 3 14 | |
| PCMark 7 Score | 4848 points | |
| PCMark 8 Home Score Accelerated v2 | 3057 points | |
| PCMark 8 Creative Score Accelerated v2 | 3758 points | |
| PCMark 8 Work Score Accelerated v2 | 4289 points | |
Help | ||
| 3DMark 11 | |
| 1280x720 Performance (sort by value) | |
| Lenovo Yoga 700-14ISK 80QD | |
| MSI GS30 Shadow | |
| Toshiba Satellite P50-C-10G | |
| Fujitsu LifeBook E554 | |
| Vizio CT14-A0 | |
| 1280x720 Performance GPU (sort by value) | |
| Lenovo Yoga 700-14ISK 80QD | |
| MSI GS30 Shadow | |
| Toshiba Satellite P50-C-10G | |
| Fujitsu LifeBook E554 | |
| Vizio CT14-A0 | |
| 3DMark | |
| 1920x1080 Fire Strike Score (sort by value) | |
| Lenovo Yoga 700-14ISK 80QD | |
| MSI GS30 Shadow | |
| Toshiba Satellite P50-C-10G | |
| Fujitsu LifeBook E554 | |
| Vizio CT14-A0 | |
| 1280x720 Cloud Gate Standard Score (sort by value) | |
| Lenovo Yoga 700-14ISK 80QD | |
| MSI GS30 Shadow | |
| Toshiba Satellite P50-C-10G | |
| Fujitsu LifeBook E554 | |
| Vizio CT14-A0 | |
| 1280x720 Ice Storm Standard Score (sort by value) | |
| Lenovo Yoga 700-14ISK 80QD | |
| MSI GS30 Shadow | |
| Toshiba Satellite P50-C-10G | |
| Fujitsu LifeBook E554 | |
| Vizio CT14-A0 | |
| 3DMark 11 Performance | 1313 points | |
| 3DMark Ice Storm Standard Score | 37935 points | |
| 3DMark Cloud Gate Standard Score | 4708 points | |
| 3DMark Fire Strike Score | 621 points | |
| 3DMark Fire Strike Extreme Score | 305 points | |
Help | ||
| low | med. | high | ultra | |
|---|---|---|---|---|
| Guild Wars 2 (2012) | 45.8 | 15.3 | 6.5 | |
| StarCraft II: Heart of the Swarm (2013) | 121.2 | 42.9 | 23.8 | 13 |
| Lenovo Yoga 700-14ISK 80QD | HP Pavilion 14t-ab000 K9E07AV | Acer Aspire E5-473G-59QT | Lenovo ThinkPad T450s-20BWS1UT00 | Lenovo Yoga 3 14 | Dell Latitude E7450 | |
|---|---|---|---|---|---|---|
| Noise | -6% | -15% | -1% | -9% | -5% | |
| Idle Minimum * | 28.8 | 31.6 -10% | 32.2 -12% | 29.1 -1% | 32.2 -12% | 29.1 -1% |
| Idle Average * | 30.5 | 31.4 -3% | 32.4 -6% | 29.1 5% | 32.5 -7% | 29.1 5% |
| Idle Maximum * | 30.6 | 31.8 -4% | 33.4 -9% | 29.1 5% | 32.6 -7% | 30 2% |
| Load Average * | 31 | 33.3 -7% | 37.7 -22% | 33.1 -7% | 33.6 -8% | 36.4 -17% |
| Load Maximum * | 32.8 | 34.6 -5% | 41 -25% | 34.3 -5% | 37.2 -13% | 37.8 -15% |
* ... smaller is better
Noise Level
| Idle |
| 28.8 / 30.5 / 30.6 dB(A) |
| Load |
| 31 / 32.8 dB(A) |
 | ||
30 dB silent 40 dB(A) audible 50 dB(A) loud |
||
min: | ||
(+) The maximum temperature on the upper side is 31.8 °C / 89 F, compared to the average of 36.9 °C / 98 F, ranging from 21.1 to 71 °C for the class Multimedia.
(-) The bottom heats up to a maximum of 45.8 °C / 114 F, compared to the average of 39.2 °C / 103 F
(+) In idle usage, the average temperature for the upper side is 24.6 °C / 76 F, compared to the device average of 31.3 °C / 88 F.
(+) The palmrests and touchpad are cooler than skin temperature with a maximum of 24.2 °C / 75.6 F and are therefore cool to the touch.
(+) The average temperature of the palmrest area of similar devices was 28.8 °C / 83.8 F (+4.6 °C / 8.2 F).
| Lenovo Yoga 700-14ISK 80QD 45 Wh | HP Pavilion 14t-ab000 K9E07AV 41 Wh | Acer Aspire E5-473G-59QT 37 Wh | Lenovo ThinkPad T450s-20BWS03F00 48 Wh | Lenovo Yoga 3 14 45 Wh | Dell Latitude E7450 54 Wh | |
|---|---|---|---|---|---|---|
| Battery Runtime | -13% | -27% | -13% | 42% | 6% | |
| Reader / Idle | 748 | 649 -13% | 565 -24% | 774 3% | 1183 58% | 714 -5% |
| WiFi v1.3 | 363 | 233 -36% | 280 -23% | 276 -24% | 422 16% | |
| Load | 108 | 119 10% | 70 -35% | 88 -19% | 135 25% | 115 6% |
| WiFi | 336 | 467 | 459 |
Pros
Cons
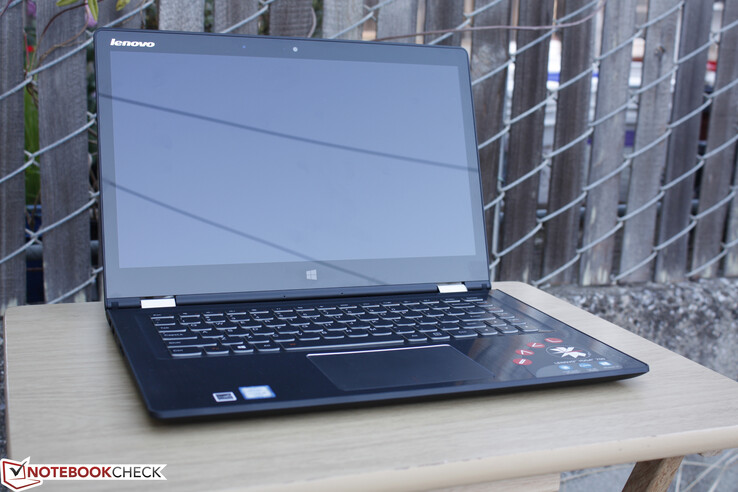
和去年的Yoga 3 14相比Yoga 3 Pro一样,Yoga 700也像是Yoga 900的一款缩水版本,主要面向预算较紧的用户。不过这也不是坏事,因为Yoga的核心功能并不会因此有所减弱。不过,Yoga 700相比看起来更大更重,也没有那么奢华,平板电脑模式用起来也不是那么舒适。
Yoga 700相比高端的Yoga 900还有一个优势,那就是更大的腰围让它能够装下一块Nvidia显卡。如果游戏比较重要的话,相比Yoga 900我们建议选择这款机型搭配Nvidia独立显卡的版本。除此之外,即使是低端的Yoga 900机型也更加适合作为平板使用。如果预算有限的话,尽管在联想的新命名之后显得有些过时,但去年的Yoga 3 14或者Yoga 3 Pro依然是很好的选择。
Yoga 700是1000美元以下价位上最优秀的变形本产品之一,而且有搭配Nvidia显卡的机型。不过它的屏幕亮度、尺寸和重量或多或少的限制了在平板模式还有在户外的实用性。相比之下Yoga 900更加适合户外或者移动使用。
注:本文是基于完整评测的缩减版本,阅读完整的英文评测,请点击这里。
Lenovo Yoga 700-14ISK 80QD
- 11/29/2015 v4 (old)
Allen Ngo


