Notebookcheck Logo

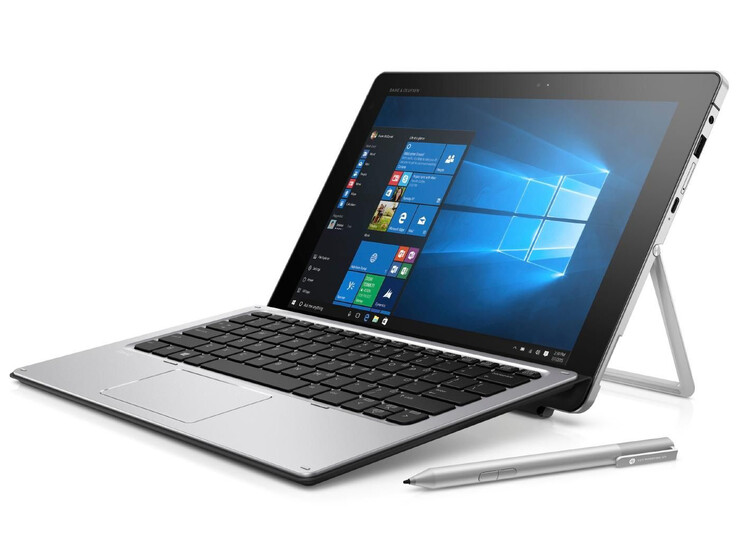
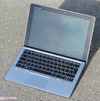
惠普 Elite x2 1012 G1 变形本简短评测

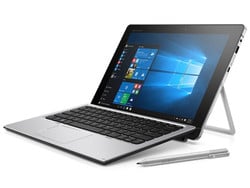
商务精英。 惠普Elite x2 1012 G1将与微软Surface Pro 4直接对抗。这款变形本提供了键盘底座,主动式手写笔和LTE模组。不过近1500欧元(约11116人民币)的售价当然不算便宜。
Business Convertible / 2-in-1 Skylake Touchscreen Tablet Windows
HP Elite x2 1012 G1 (Elite x2 Series)
Processor
Intel Core m5-6Y54 2 x 1.1 - 2.7 GHz, Skylake
Graphics adapter
Intel HD Graphics 515, Core: 900 MHz, 双通道, 20.19.15.4331
Memory
8 GB 
, LPDDR3-1866, 双通道, 板载
Display
12.10 inch 3:2, 1920 x 1280 pixel 191 PPI, 电容式, native pen support, LG Philips, IPS, Gorilla Glass 4, glossy: yes, detachable screen
Mainboard
Intel Skylake-Y Premium PCH
Storage
Liteon L8H-256V2G, 256 GB 
, 200 GB free
Soundcard
Conexant @ Intel Skylake PCH - High Definition Audio Controller
Connections
1 USB 3.0 / 3.1 Gen1, 1 USB 3.1 Gen2, 1 Thunderbolt, 1 DisplayPort, 1 Kensington Lock, Audio Connections: 整合音频接口, Card Reader: microSD, 1 Fingerprint Reader, Brightness Sensor, Sensors: 加速传感器,磁感仪,陀螺仪,环境光传感器, TPM 2.0
Networking
Intel Dual Band Wireless-AC 8260 (a/b/g/n = Wi-Fi 4/ac = Wi-Fi 5/), Bluetooth 4.2, 惠普 lt4120 Qualcomm Snapdragon X5, LTE
Size
height x width x depth (in mm): 8.05 x 300 x 213.5
Battery
37 Wh Lithium-Ion
Operating System
Microsoft Windows 10 Pro 64 Bit
Camera
Primary Camera: 5 MPix
Secondary Camera: 2 MPix
Additional features
Speakers: 立体声, Keyboard: 孤岛式, Keyboard Light: yes, USB 3.0千兆以太网转接器, Cyberlink PowerDVD 12, Foxit PhantomPDF, McAfee LiveSafe-Internet Security (试用版), MS Office (试用版), 36 Months Warranty, fanless
Weight
1.205 kg
Price
1500 Euro
Note: The manufacturer may use components from different suppliers including display panels, drives or memory sticks with similar specifications.


322
cd/m²
314
cd/m²
317
cd/m²
314
cd/m²
322
cd/m²
317
cd/m²
323
cd/m²
322
cd/m²
318
cd/m²
Distribution of brightness
LG Philips tested with X-Rite i1Pro 2
Maximum: 323 cd/m² (Nits) Average: 318.8 cd/m² Minimum: 8 cd/m²
Brightness Distribution: 97 %
Center on Battery: 322 cd/m²
Contrast: 767:1 (Black: 0.42 cd/m²)
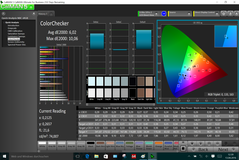
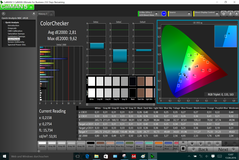
ΔE Color 6.02 | 0.5-29.43 Ø4.92
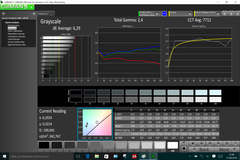
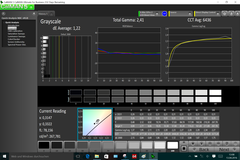
ΔE Greyscale 6.29 | 0.5-98 Ø5.2
73.2% sRGB (Argyll 1.6.3 3D)
47.8% AdobeRGB 1998 (Argyll 1.6.3 3D)
53.8% AdobeRGB 1998 (Argyll 2.2.0 3D)
73.7% sRGB (Argyll 2.2.0 3D)
53.8% Display P3 (Argyll 2.2.0 3D)
Gamma: 2.4

Screen Flickering / PWM (Pulse-Width Modulation)

To dim the screen, some notebooks will simply cycle the backlight on and off in rapid succession - a method called Pulse Width Modulation (PWM) . This cycling frequency should ideally be undetectable to the human eye. If said frequency is too low, users with sensitive eyes may experience strain or headaches or even notice the flickering altogether.
Screen flickering / PWM not detected

In comparison: 53 % of all tested devices do not use PWM to dim the display. If PWM was detected, an average of 8743 (minimum: 5 - maximum: 343500) Hz was measured.

CalMAN - ColorChecker
CalMAN - Graylevels
CalMAN - Graylevels
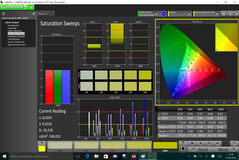
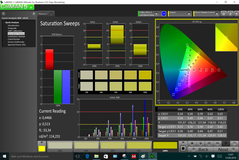
CalMAN - Saturation
CalMAN - Saturation
CalMAN - ColorChecker (calibrated)
CalMAN - Graylevels (calibrated)
CalMAN - Saturation (calibrated)

Display Response Times

Display response times show how fast the screen is able to change from one color to the next. Slow response times can lead to afterimages and can cause moving objects to appear blurry (ghosting). Gamers of fast-paced 3D titles should pay special attention to fast response times.
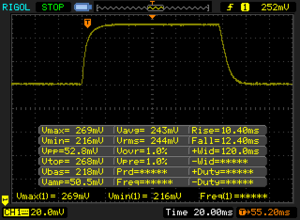
       Response Time Black to White
22.8 ms ... rise ↗ and fall ↘ combined↗ 10.4 ms rise
↘ 12.4 ms fall
The screen shows good response rates in our tests, but may be too slow for competitive gamers.
In comparison, all tested devices range from 0.1 (minimum) to 240 (maximum) ms. » 47 % of all devices are better.
This means that the measured response time is similar to the average of all tested devices (21 ms).
       Response Time 50% Grey to 80% Grey
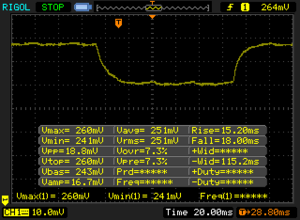
33.2 ms ... rise ↗ and fall ↘ combined↗ 15.2 ms rise
↘ 18 ms fall
The screen shows slow response rates in our tests and will be unsatisfactory for gamers.
In comparison, all tested devices range from 0.165 (minimum) to 636 (maximum) ms. » 41 % of all devices are better.
This means that the measured response time is similar to the average of all tested devices (32.9 ms).
HP Elite x2 1012 G1
IPS, 1920x1280
Microsoft Surface Pro 4, Core m3
IPS, 2736x1824
Lenovo IdeaPad Miix 700
IPS, 2160x1440
Microsoft Surface Pro 4, Core i5, 128GB
IPS, 2736x1824
Apple iPad Pro 12.9
IPS, 2732x2048
Dell XPS 12 9250 4K
IPS, 3840x2160
HP Elite x2 1011 G1
IPS-Panel, 1920x1080
Display
28%
30%
26%
50%
58%
-14%
Display P3 Coverage
53.8
67.5
25%
68.1
27%
65
21%
91.2
70%
83.9
56%
44.4
-17%
sRGB Coverage
73.7
96.6
31%
97.4
32%
96.5
31%
98.1
33%
99.8
35%
66.4
-10%
AdobeRGB 1998 Coverage
53.8
69
28%
70.2
30%
67
25%
79.3
47%
98.1
82%
45.91
-15%
Response Times
-38%
20%
-38%
-31%
Response Time Grey 50% / Grey 80% *
33.2 ?(15.2, 18)
46 ?(17.2, 28.8)
-39%
30 ?(11, 19)
10%
46 ?(17.2, 28.8, plateau, spikes in between)
-39%
36 ?(19, 17)
-8%
Response Time Black / White *
22.8 ?(10.4, 12.4)
31 ?(6, 25.2)
-36%
16 ?(4.4, 11.6)
30%
31.2 ?(6, 25.2, Spikes in between)
-37%
35 ?(8, 27)
-54%
PWM Frequency
50 ?(50)
200 ?(18)
50 ?(50)
1000 ?(20)
Screen
34%
8%
28%
46%
35%
-6%
Brightness middle
322
389.2
21%
341
6%
413
28%
399
24%
437
36%
364
13%
Brightness
319
392
23%
318
0%
396
24%
393
23%
399
25%
331
4%
Brightness Distribution
97
92
-5%
87
-10%
87
-10%
92
-5%
81
-16%
84
-13%
Black Level *
0.42
0.27
36%
0.36
14%
0.36
14%
0.22
48%
0.35
17%
0.44
-5%
Contrast
767
1441
88%
947
23%
1147
50%
1814
137%
1249
63%
827
8%
Colorchecker dE 2000 *
6.02
3.61
40%
6
-0%
3.09
49%
2.96
51%
3.56
41%
7.32
-22%
Colorchecker dE 2000 max. *
10.06
9.3
8%
Greyscale dE 2000 *
6.29
3.8
40%
8.12
-29%
3.92
38%
3
52%
2.67
58%
7.37
-17%
Gamma
2.4 92%
2.16 102%
2.23 99%
2.3 96%
2.21 100%
2.17 101%
2.03 108%
CCT
7712 84%
5969 109%
7011 93%
7333 89%
7049 92%
6681 97%
6479 100%
Color Space (Percent of AdobeRGB 1998)
47.8
63
32%
63.4
33%
61
28%
71.15
49%
86
80%
42.2
-12%
Color Space (Percent of sRGB)
73.2
97
33%
97.4
33%
97
33%
97.87
34%
100
37%
66.1
-10%
Total Average (Program / Settings)
8% / 23%
19% / 14%
5% / 18%
48% / 47%
21% / 31%
-10% / -8%

* ... smaller is better

CPU-Z
CPU-Z
CPU-Z
CPU-Z
GPU-Z
HWInfo
LatencyMon
Cinebench R10 Shading 32Bit
7003
Cinebench R10 Rendering Multiple CPUs 32Bit
8731
Cinebench R10 Rendering Single 32Bit
4235
Cinebench R11.5 OpenGL 64Bit
31.86 fps
Cinebench R11.5 CPU Multi 64Bit
2.7 Points
Cinebench R11.5 CPU Single 64Bit
1.26 Points
Cinebench R15 Ref. Match 64Bit
97.8 %
Cinebench R15 OpenGL 64Bit
35.63 fps
Cinebench R15 CPU Multi 64Bit
255 Points
Cinebench R15 CPU Single 64Bit
111 Points
Help
Cinebench R15
CPU Multi 64Bit (sort by value)
HP Elite x2 1012 G1
HD Graphics 515, 6Y54, Liteon L8H-256V2G
255 Points
Microsoft Surface Pro 4, Core m3
HD Graphics 515, 6Y30, Samsung MZFLV128 NVMe
206 Points -19%
Lenovo IdeaPad Miix 700
HD Graphics 515, 6Y54, Samsung MZNLN128HCGR-000L2
200 Points -22%
Microsoft Surface Pro 4, Core i5, 128GB
HD Graphics 520, 6300U, Samsung MZFLV128 NVMe
306 Points +20%
Microsoft Surface Pro 4 Core i7
Iris Graphics 540, 6650U, Samsung MZFLV256 NVMe
342 Points +34%
HP Elite x2 1011 G1
HD Graphics 5300, 5Y51, Samsung SSD PM851 256 GB MZNTE256HMHP
153 Points -40%
CPU Single 64Bit (sort by value)
HP Elite x2 1012 G1
HD Graphics 515, 6Y54, Liteon L8H-256V2G
111 Points
Microsoft Surface Pro 4, Core m3
HD Graphics 515, 6Y30, Samsung MZFLV128 NVMe
88 Points -21%
Lenovo IdeaPad Miix 700
HD Graphics 515, 6Y54, Samsung MZNLN128HCGR-000L2
99 Points -11%
Microsoft Surface Pro 4, Core i5, 128GB
HD Graphics 520, 6300U, Samsung MZFLV128 NVMe
122 Points +10%
Microsoft Surface Pro 4 Core i7
Iris Graphics 540, 6650U, Samsung MZFLV256 NVMe
132 Points +19%
HP Elite x2 1011 G1
HD Graphics 5300, 5Y51, Samsung SSD PM851 256 GB MZNTE256HMHP
84 Points -24%
Cinebench R11.5
CPU Multi 64Bit (sort by value)
HP Elite x2 1012 G1
HD Graphics 515, 6Y54, Liteon L8H-256V2G
2.7 Points
Microsoft Surface Pro 4, Core m3
HD Graphics 515, 6Y30, Samsung MZFLV128 NVMe
2.27 Points -16%
Lenovo IdeaPad Miix 700
HD Graphics 515, 6Y54, Samsung MZNLN128HCGR-000L2
2.08 Points -23%
Microsoft Surface Pro 4, Core i5, 128GB
HD Graphics 520, 6300U, Samsung MZFLV128 NVMe
3.4 Points +26%
Microsoft Surface Pro 4 Core i7
Iris Graphics 540, 6650U, Samsung MZFLV256 NVMe
3.8 Points +41%
HP Elite x2 1011 G1
HD Graphics 5300, 5Y51, Samsung SSD PM851 256 GB MZNTE256HMHP
1.72 Points -36%
CPU Single 64Bit (sort by value)
HP Elite x2 1012 G1
HD Graphics 515, 6Y54, Liteon L8H-256V2G
1.26 Points
Microsoft Surface Pro 4, Core m3
HD Graphics 515, 6Y30, Samsung MZFLV128 NVMe
0.98 Points -22%
Lenovo IdeaPad Miix 700
HD Graphics 515, 6Y54, Samsung MZNLN128HCGR-000L2
1.06 Points -16%
Microsoft Surface Pro 4, Core i5, 128GB
HD Graphics 520, 6300U, Samsung MZFLV128 NVMe
1.4 Points +11%
Microsoft Surface Pro 4 Core i7
Iris Graphics 540, 6650U, Samsung MZFLV256 NVMe
1.51 Points +20%
HP Elite x2 1011 G1
HD Graphics 5300, 5Y51, Samsung SSD PM851 256 GB MZNTE256HMHP
0.99 Points -21%
Cinebench R10
Rendering Multiple CPUs 32Bit (sort by value)
HP Elite x2 1012 G1
HD Graphics 515, 6Y54, Liteon L8H-256V2G
8731 Points
Microsoft Surface Pro 4, Core m3
HD Graphics 515, 6Y30, Samsung MZFLV128 NVMe
6994 Points -20%
Lenovo IdeaPad Miix 700
HD Graphics 515, 6Y54, Samsung MZNLN128HCGR-000L2
6340 Points -27%
Microsoft Surface Pro 4, Core i5, 128GB
HD Graphics 520, 6300U, Samsung MZFLV128 NVMe
10558 Points +21%
Microsoft Surface Pro 4 Core i7
Iris Graphics 540, 6650U, Samsung MZFLV256 NVMe
11564 Points +32%
HP Elite x2 1011 G1
HD Graphics 5300, 5Y51, Samsung SSD PM851 256 GB MZNTE256HMHP
5370 Points -38%
Rendering Single 32Bit (sort by value)
HP Elite x2 1012 G1
HD Graphics 515, 6Y54, Liteon L8H-256V2G
4235 Points
Microsoft Surface Pro 4, Core m3
HD Graphics 515, 6Y30, Samsung MZFLV128 NVMe
3286 Points -22%
Lenovo IdeaPad Miix 700
HD Graphics 515, 6Y54, Samsung MZNLN128HCGR-000L2
3690 Points -13%
Microsoft Surface Pro 4, Core i5, 128GB
HD Graphics 520, 6300U, Samsung MZFLV128 NVMe
4656 Points +10%
Microsoft Surface Pro 4 Core i7
Iris Graphics 540, 6650U, Samsung MZFLV256 NVMe
5223 Points +23%
HP Elite x2 1011 G1
HD Graphics 5300, 5Y51, Samsung SSD PM851 256 GB MZNTE256HMHP
3276 Points -23%
Geekbench 3
32 Bit Single-Core Score (sort by value)
HP Elite x2 1012 G1
HD Graphics 515, 6Y54, Liteon L8H-256V2G
2837 Points
Lenovo IdeaPad Miix 700
HD Graphics 515, 6Y54, Samsung MZNLN128HCGR-000L2
2588 Points -9%
Microsoft Surface Pro 4, Core i5, 128GB
HD Graphics 520, 6300U, Samsung MZFLV128 NVMe
3085 Points +9%
32 Bit Multi-Core Score (sort by value)
HP Elite x2 1012 G1
HD Graphics 515, 6Y54, Liteon L8H-256V2G
5522 Points
Lenovo IdeaPad Miix 700
HD Graphics 515, 6Y54, Samsung MZNLN128HCGR-000L2
5189 Points -6%
Microsoft Surface Pro 4, Core i5, 128GB
HD Graphics 520, 6300U, Samsung MZFLV128 NVMe
6419 Points +16%
Sunspider - 1.0 Total Score (sort by value)
HP Elite x2 1012 G1
HD Graphics 515, 6Y54, Liteon L8H-256V2G
95.4 ms *
Microsoft Surface Pro 4, Core m3
HD Graphics 515, 6Y30, Samsung MZFLV128 NVMe
122.4 ms * -28%
Lenovo IdeaPad Miix 700
HD Graphics 515, 6Y54, Samsung MZNLN128HCGR-000L2
97.8 ms * -3%
Microsoft Surface Pro 4, Core i5, 128GB
HD Graphics 520, 6300U, Samsung MZFLV128 NVMe
104.5 ms * -10%
Apple iPad Pro 12.9
A9X / PowerVR GT7xxx, A9X, Apple 128 GB (iPad Pro 12.9 NVMe)
181 ms * -90%
HP Elite x2 1011 G1
HD Graphics 5300, 5Y51, Samsung SSD PM851 256 GB MZNTE256HMHP
133.4 ms * -40%
JetStream 1.1 - Total Score (sort by value)
HP Elite x2 1012 G1
HD Graphics 515, 6Y54, Liteon L8H-256V2G
184.4 Points
Lenovo IdeaPad Miix 700
HD Graphics 515, 6Y54, Samsung MZNLN128HCGR-000L2
169.9 Points -8%
Apple iPad Pro 12.9
A9X / PowerVR GT7xxx, A9X, Apple 128 GB (iPad Pro 12.9 NVMe)
142 Points -23%
Mozilla Kraken 1.1 - Total (sort by value)
HP Elite x2 1012 G1
HD Graphics 515, 6Y54, Liteon L8H-256V2G
1306 ms *
Microsoft Surface Pro 4, Core m3
HD Graphics 515, 6Y30, Samsung MZFLV128 NVMe
1556 ms * -19%
Lenovo IdeaPad Miix 700
HD Graphics 515, 6Y54, Samsung MZNLN128HCGR-000L2
1312 ms * -0%
Microsoft Surface Pro 4, Core i5, 128GB
HD Graphics 520, 6300U, Samsung MZFLV128 NVMe
1178 ms * +10%
Apple iPad Pro 12.9
A9X / PowerVR GT7xxx, A9X, Apple 128 GB (iPad Pro 12.9 NVMe)
1499 ms * -15%
HP Elite x2 1011 G1
HD Graphics 5300, 5Y51, Samsung SSD PM851 256 GB MZNTE256HMHP
2898 ms * -122%
Octane V2 - Total Score (sort by value)
HP Elite x2 1012 G1
HD Graphics 515, 6Y54, Liteon L8H-256V2G
26727 Points
Lenovo IdeaPad Miix 700
HD Graphics 515, 6Y54, Samsung MZNLN128HCGR-000L2
26885 Points +1%
Microsoft Surface Pro 4, Core i5, 128GB
HD Graphics 520, 6300U, Samsung MZFLV128 NVMe
29991 Points +12%
Apple iPad Pro 12.9
A9X / PowerVR GT7xxx, A9X, Apple 128 GB (iPad Pro 12.9 NVMe)
19852 Points -26%
HP Elite x2 1011 G1
HD Graphics 5300, 5Y51, Samsung SSD PM851 256 GB MZNTE256HMHP
10467 Points -61%
Peacekeeper - --- (sort by value)
HP Elite x2 1012 G1
HD Graphics 515, 6Y54, Liteon L8H-256V2G
2555 Points
Microsoft Surface Pro 4, Core m3
HD Graphics 515, 6Y30, Samsung MZFLV128 NVMe
2216 Points -13%
Lenovo IdeaPad Miix 700
HD Graphics 515, 6Y54, Samsung MZNLN128HCGR-000L2
2295 Points -10%
Microsoft Surface Pro 4, Core i5, 128GB
HD Graphics 520, 6300U, Samsung MZFLV128 NVMe
2998 Points +17%
Apple iPad Pro 12.9
A9X / PowerVR GT7xxx, A9X, Apple 128 GB (iPad Pro 12.9 NVMe)
5417 Points +112%
HP Elite x2 1011 G1
HD Graphics 5300, 5Y51, Samsung SSD PM851 256 GB MZNTE256HMHP
2222 Points -13%

* ... smaller is better

PCMark 7 Score
4808 points
PCMark 8 Home Score Accelerated v2
2983 points
PCMark 8 Creative Score Accelerated v2
3423 points
PCMark 8 Work Score Accelerated v2
3932 points
Help
PCMark 8 - Work Score Accelerated v2 (sort by value)
HP Elite x2 1012 G1
HD Graphics 515, 6Y54, Liteon L8H-256V2G
3932 Points
Microsoft Surface Pro 4, Core m3
HD Graphics 515, 6Y30, Samsung MZFLV128 NVMe
3186 Points -19%
Lenovo IdeaPad Miix 700
HD Graphics 515, 6Y54, Samsung MZNLN128HCGR-000L2
3837 Points -2%
Microsoft Surface Pro 4, Core i5, 128GB
HD Graphics 520, 6300U, Samsung MZFLV128 NVMe
3697 Points -6%
Microsoft Surface Pro 4 Core i7
Iris Graphics 540, 6650U, Samsung MZFLV256 NVMe
4052 Points +3%
HP Elite x2 1011 G1
HD Graphics 5300, 5Y51, Samsung SSD PM851 256 GB MZNTE256HMHP
3480 Points -11%
PCMark 7 - Score (sort by value)
HP Elite x2 1012 G1
HD Graphics 515, 6Y54, Liteon L8H-256V2G
4808 Points
Microsoft Surface Pro 4, Core m3
HD Graphics 515, 6Y30, Samsung MZFLV128 NVMe
4274 Points -11%
Lenovo IdeaPad Miix 700
HD Graphics 515, 6Y54, Samsung MZNLN128HCGR-000L2
4518 Points -6%
Microsoft Surface Pro 4, Core i5, 128GB
HD Graphics 520, 6300U, Samsung MZFLV128 NVMe
5229 Points +9%
Microsoft Surface Pro 4 Core i7
Iris Graphics 540, 6650U, Samsung MZFLV256 NVMe
5799 Points +21%
HP Elite x2 1011 G1
HD Graphics 5300, 5Y51, Samsung SSD PM851 256 GB MZNTE256HMHP
4087 Points -15%
Liteon L8H-256V2G
Sequential Read: 501 MB/s
Sequential Write: 297.2 MB/s
512K Read: 351.7 MB/s
512K Write: 295.7 MB/s
4K Read: 28.31 MB/s
4K Write: 90.3 MB/s
4K QD32 Read: 285 MB/s
4K QD32 Write: 268.4 MB/s
3DMark 06 Standard Score
7912 points
3DMark 11 Performance
1334 points
3DMark Ice Storm Standard Score
47242 points
3DMark Cloud Gate Standard Score
4943 points
3DMark Fire Strike Score
739 points
Help
3DMark 11 - 1280x720 Performance (sort by value)
HP Elite x2 1012 G1
HD Graphics 515, 6Y54, Liteon L8H-256V2G
1334 Points
Microsoft Surface Pro 4, Core m3
HD Graphics 515, 6Y30, Samsung MZFLV128 NVMe
1344 Points +1%
Lenovo IdeaPad Miix 700
HD Graphics 515, 6Y54, Samsung MZNLN128HCGR-000L2
1109 Points -17%
Microsoft Surface Pro 4, Core i5, 128GB
HD Graphics 520, 6300U, Samsung MZFLV128 NVMe
1565 Points +17%
Microsoft Surface Pro 4 Core i7
Iris Graphics 540, 6650U, Samsung MZFLV256 NVMe
2624 Points +97%
HP Elite x2 1011 G1
HD Graphics 5300, 5Y51, Samsung SSD PM851 256 GB MZNTE256HMHP
625 Points -53%
3DMark
1280x720 Ice Storm Standard Score (sort by value)
HP Elite x2 1012 G1
HD Graphics 515, 6Y54, Liteon L8H-256V2G
47242 Points
Microsoft Surface Pro 4, Core m3
HD Graphics 515, 6Y30, Samsung MZFLV128 NVMe
42046 Points -11%
Lenovo IdeaPad Miix 700
HD Graphics 515, 6Y54, Samsung MZNLN128HCGR-000L2
38523 Points -18%
Microsoft Surface Pro 4, Core i5, 128GB
HD Graphics 520, 6300U, Samsung MZFLV128 NVMe
51010 Points +8%
Microsoft Surface Pro 4 Core i7
Iris Graphics 540, 6650U, Samsung MZFLV256 NVMe
73990 Points +57%
HP Elite x2 1011 G1
HD Graphics 5300, 5Y51, Samsung SSD PM851 256 GB MZNTE256HMHP
29336 Points -38%
1280x720 Cloud Gate Standard Score (sort by value)
HP Elite x2 1012 G1
HD Graphics 515, 6Y54, Liteon L8H-256V2G
4943 Points
Microsoft Surface Pro 4, Core m3
HD Graphics 515, 6Y30, Samsung MZFLV128 NVMe
4604 Points -7%
Lenovo IdeaPad Miix 700
HD Graphics 515, 6Y54, Samsung MZNLN128HCGR-000L2
3936 Points -20%
Microsoft Surface Pro 4, Core i5, 128GB
HD Graphics 520, 6300U, Samsung MZFLV128 NVMe
5853 Points +18%
Microsoft Surface Pro 4 Core i7
Iris Graphics 540, 6650U, Samsung MZFLV256 NVMe
7822 Points +58%
HP Elite x2 1011 G1
HD Graphics 5300, 5Y51, Samsung SSD PM851 256 GB MZNTE256HMHP
2946 Points -40%
1280x720 Sky Diver Score (sort by value)
HP Elite x2 1012 G1
HD Graphics 515, 6Y54, Liteon L8H-256V2G
3046 Points
Lenovo IdeaPad Miix 700
HD Graphics 515, 6Y54, Samsung MZNLN128HCGR-000L2
2316 Points -24%
Microsoft Surface Pro 4 Core i7
Iris Graphics 540, 6650U, Samsung MZFLV256 NVMe
4699 Points +54%
1920x1080 Fire Strike Score (sort by value)
HP Elite x2 1012 G1
HD Graphics 515, 6Y54, Liteon L8H-256V2G
739 Points
Microsoft Surface Pro 4, Core m3
HD Graphics 515, 6Y30, Samsung MZFLV128 NVMe
740 Points 0%
Lenovo IdeaPad Miix 700
HD Graphics 515, 6Y54, Samsung MZNLN128HCGR-000L2
630 Points -15%
Microsoft Surface Pro 4, Core i5, 128GB
HD Graphics 520, 6300U, Samsung MZFLV128 NVMe
844 Points +14%
Microsoft Surface Pro 4 Core i7
Iris Graphics 540, 6650U, Samsung MZFLV256 NVMe
1395 Points +89%
HP Elite x2 1011 G1
HD Graphics 5300, 5Y51, Samsung SSD PM851 256 GB MZNTE256HMHP
371 Points -50%
3DMark 06 - 1280x1024 Standard Score AA:0x AF:0x (sort by value)
HP Elite x2 1012 G1
HD Graphics 515, 6Y54, Liteon L8H-256V2G
7912 Points
Microsoft Surface Pro 4, Core m3
HD Graphics 515, 6Y30, Samsung MZFLV128 NVMe
7733 Points -2%
Lenovo IdeaPad Miix 700
HD Graphics 515, 6Y54, Samsung MZNLN128HCGR-000L2
5842 Points -26%
HP Elite x2 1011 G1
HD Graphics 5300, 5Y51, Samsung SSD PM851 256 GB MZNTE256HMHP
4144 Points -48%
lowmed.highultra
Tomb Raider (2013) 59.9 31.2 21.6 9.5
BioShock Infinite (2013) 44.1 24.6 20.7 5.9
Battlefield 4 (2013) 35.5 23.5 15 4.3
The Witcher 3 (2015) 11.2 7.1
The Division (2016) 12 8.4
Hitman 2016 (2016) 10.1 9.2
BioShock Infinite - 1280x720 Very Low Preset (sort by value)
HP Elite x2 1012 G1
HD Graphics 515, 6Y54, Liteon L8H-256V2G
44.1 fps
Microsoft Surface Pro 4, Core m3
HD Graphics 515, 6Y30, Samsung MZFLV128 NVMe
52.4 fps +19%
Lenovo IdeaPad Miix 700
HD Graphics 515, 6Y54, Samsung MZNLN128HCGR-000L2
33.1 fps -25%
Microsoft Surface Pro 4, Core i5, 128GB
HD Graphics 520, 6300U, Samsung MZFLV128 NVMe
58.1 fps +32%
Microsoft Surface Pro 4 Core i7
Iris Graphics 540, 6650U, Samsung MZFLV256 NVMe
86.8 fps +97%
Max. Load
 32.1 °C39 °C36.3 °C 
 31.2 °C35 °C33.1 °C 
 31.5 °C32 °C34.9 °C 
Maximum: 39 °C
Average: 33.9 °C
36.9 °C40.1 °C34.5 °C
38 °C41.2 °C34.6 °C
33.9 °C35.1 °C32.5 °C
Maximum: 41.2 °C
Average: 36.3 °C
Power Supply (max.)  35.1 °C | Room Temperature 21.3 °C | Fluke 62 Max
(±) The average temperature for the upper side under maximal load is 33.9 °C / 93 F, compared to the average of 30.3 °C / 87 F for the devices in the class Convertible.
(+) The maximum temperature on the upper side is 39 °C / 102 F, compared to the average of 35.3 °C / 96 F, ranging from 19.6 to 60 °C for the class Convertible.
(±) The bottom heats up to a maximum of 41.2 °C / 106 F, compared to the average of 36.8 °C / 98 F
(+) In idle usage, the average temperature for the upper side is 28.7 °C / 84 F, compared to the device average of 30.3 °C / 87 F.
(+) The palmrests and touchpad are reaching skin temperature as a maximum (34.9 °C / 94.8 F) and are therefore not hot.
(-) The average temperature of the palmrest area of similar devices was 28.1 °C / 82.6 F (-6.8 °C / -12.2 F).
HP Elite x2 1012 G1
6Y54, HD Graphics 515
Microsoft Surface Pro 4, Core m3
6Y30, HD Graphics 515
Lenovo IdeaPad Miix 700
6Y54, HD Graphics 515
Microsoft Surface Pro 4, Core i5, 128GB
6300U, HD Graphics 520
Apple iPad Pro 12.9
A9X, A9X / PowerVR GT7xxx
Dell XPS 12 9250 4K
6Y75, HD Graphics 515
HP Elite x2 1011 G1
5Y51, HD Graphics 5300
Heat
-8%
1%
-32%
-6%
-8%
3%
Maximum Upper Side *
39
43.6
-12%
38.6
1%
52.3
-34%
40.1
-3%
41.4
-6%
36.6
6%
Maximum Bottom *
41.2
45.2
-10%
40.8
1%
51.4
-25%
39.3
5%
43.9
-7%
37.3
9%
Idle Upper Side *
29.5
32.4
-10%
30.4
-3%
43.2
-46%
33.8
-15%
34.7
-18%
30.5
-3%
Idle Bottom *
29.8
29.6
1%
28
6%
36
-21%
32.9
-10%
29.4
1%
29.9
-0%

* ... smaller is better

Power Consumption
Off / Standbydarklight 0.4 / 0.45 Watt
Idledarkmidlight 3.7 / 6.8 / 7.6 Watt
Load midlight 22.5 / 34.5 Watt
 color bar
Key: min: dark, med: mid, max: light        Metrahit Energy
HP Elite x2 1012 G1
6Y54, HD Graphics 515
Lenovo IdeaPad Miix 700
6Y54, HD Graphics 515
Microsoft Surface Pro 4, Core i5, 128GB
6300U, HD Graphics 520
Apple iPad Pro 12.9
A9X, A9X / PowerVR GT7xxx
Dell XPS 12 9250 4K
6Y75, HD Graphics 515
HP Elite x2 1011 G1
5Y51, HD Graphics 5300
Power Consumption
-9%
-7%
6%
-25%
45%
Idle Minimum *
3.7
4
-8%
4.4
-19%
2.69
27%
5.4
-46%
1.5
59%
Idle Average *
6.8
8.6
-26%
9
-32%
10.95
-61%
10.2
-50%
4
41%
Idle Maximum *
7.6
9.3
-22%
10.7
-41%
11.14
-47%
12.5
-64%
5
34%
Load Average *
22.5
18.6
17%
19.6
13%
11.54
49%
21.4
5%
13.9
38%
Load Maximum *
34.5
36.3
-5%
19.9
42%
12.8
63%
24.4
29%
16.9
51%

* ... smaller is better

Battery Runtime
Idle (without WLAN, min brightness)
12h 12min
WiFi Websurfing (Edge 25.10586.0.0)
7h 23min
Big Buck Bunny H.264 1080p
7h 12min
Load (maximum brightness)
2h 10min
HP Elite x2 1012 G1
37 Wh
Microsoft Surface Pro 4, Core m3
38 Wh
Lenovo IdeaPad Miix 700
41 Wh
Microsoft Surface Pro 4, Core i5, 128GB
38 Wh
Apple iPad Pro 12.9
39 Wh
Dell XPS 12 9250 4K
28 Wh
HP Elite x2 1011 G1
54 Wh
Battery Runtime
8%
11%
1%
79%
-41%
68%
Reader / Idle
732
791
8%
861
18%
899
23%
1933
164%
370
-49%
1063
45%
H.264
432
450
4%
630
46%
658
52%
WiFi v1.3
443
488
10%
440
-1%
427
-4%
695
57%
243
-45%
675
52%
Load
130
138
6%
157
21%
111
-15%
195
50%
93
-28%
288
122%

Pros

+ IPS屏幕
+ 安静
+ M.2固态硬盘
+ 键盘底座
+ 主动式手写笔
+ 非常优秀的电池续航
+ LTE模组
+ 3年质保

Cons

- 昂贵
- 机身不够坚固
In review: HP Elite x2 1012 G1. Test model courtesy of HP Germany.

和竞争生产商一样,惠普为Elite x2搭配了英特尔最新Skylake架构的酷睿m处理器。它的性能可以适应大部分用途。长时间负载也不会降低性能。不过,它的显卡会损失一些性能,在一小段时间的降温之后,它就可以回到正常的性能水平。我们认为,惠普在芯片散热设计上相比如联想IdeaPad Miix 700等设备明显更胜一筹。

固态硬盘为它带来了非常迅速的系统响应。如果需要的话,用户可以更换升级这块固态硬盘——不过我们建议寻求专业人士的帮助。我们很喜欢它的键盘底座,它与竞争对手都不相上下。这块键盘的一个优势是支持背光,IdeaPad Miix 700则缺少这一功能。它的电池续航也十分不错。不过它的屏幕还有待改进。并不是这块屏幕面板很差,但是在这个价位上,我们期待能够有更好的亮度和对比度。

Elite x2 1012 G1的明明意味着这台可分离式设备面对的是商务用户。对家庭用户来说当然它也有不小的吸引力。

那么哪款二合一产品更好呢——微软Surface 4 Pro,联想IdeaPad Miix 700,惠普Elite x2 1012 G1还是戴尔XPS 12 9250?戴尔的设备由于续航时间一般应该会是第一位出局者。在剩下的三台设备之间,决定因素则是用户的个人喜好,需求和预算了。它们在测试中表现都可圈可点,我们认为它们都值得推荐。售价最实惠的选择是更亲近家庭用户的IdeaPad Miix 700。搭配键盘和手写笔的Miix 700起售价约950欧元(约7040人民币)。Surface Pro 4有最明亮的屏幕,超高对比度和分辨率。惠普Elite x2 1012 G1则在处理器性能上更胜一筹。需要内置LTE模组的用户需要在联想或者惠普的产品间做出选择。另外一台值得参考的设备是三星Galaxy Tab PRO S。它正在测试中,我们将在近日发布它的评测。


注:本文是基于完整评测的缩减版本,阅读完整的英文评测,请点击这里。 

HP Elite x2 1012 G1 - 04/19/2016 v5.1 (old)
Sascha Mölck

Chassis
85 / 98 → 87%
Keyboard
85%
Pointing Device
89%
Connectivity
68 / 80 → 85%
Weight
73 / 35-78 → 88%
Battery
89%
Display
82%
Games Performance
54 / 68 → 79%
Application Performance
82 / 87 → 94%
Temperature
91%
Noise
100%
Audio
56 / 91 → 62%
Camera
65 / 85 → 77%
Average
79%
87%
Convertible - Weighted Average

Price comparison

Please share our article, every link counts!
Mail Logo
> Notebookcheck中文版(NBC中国) > 评测 > 惠普 Elite x2 1012 G1 变形本简短评测
Sascha Mölck, 2016-05- 7 (Update: 2024-11- 4)