

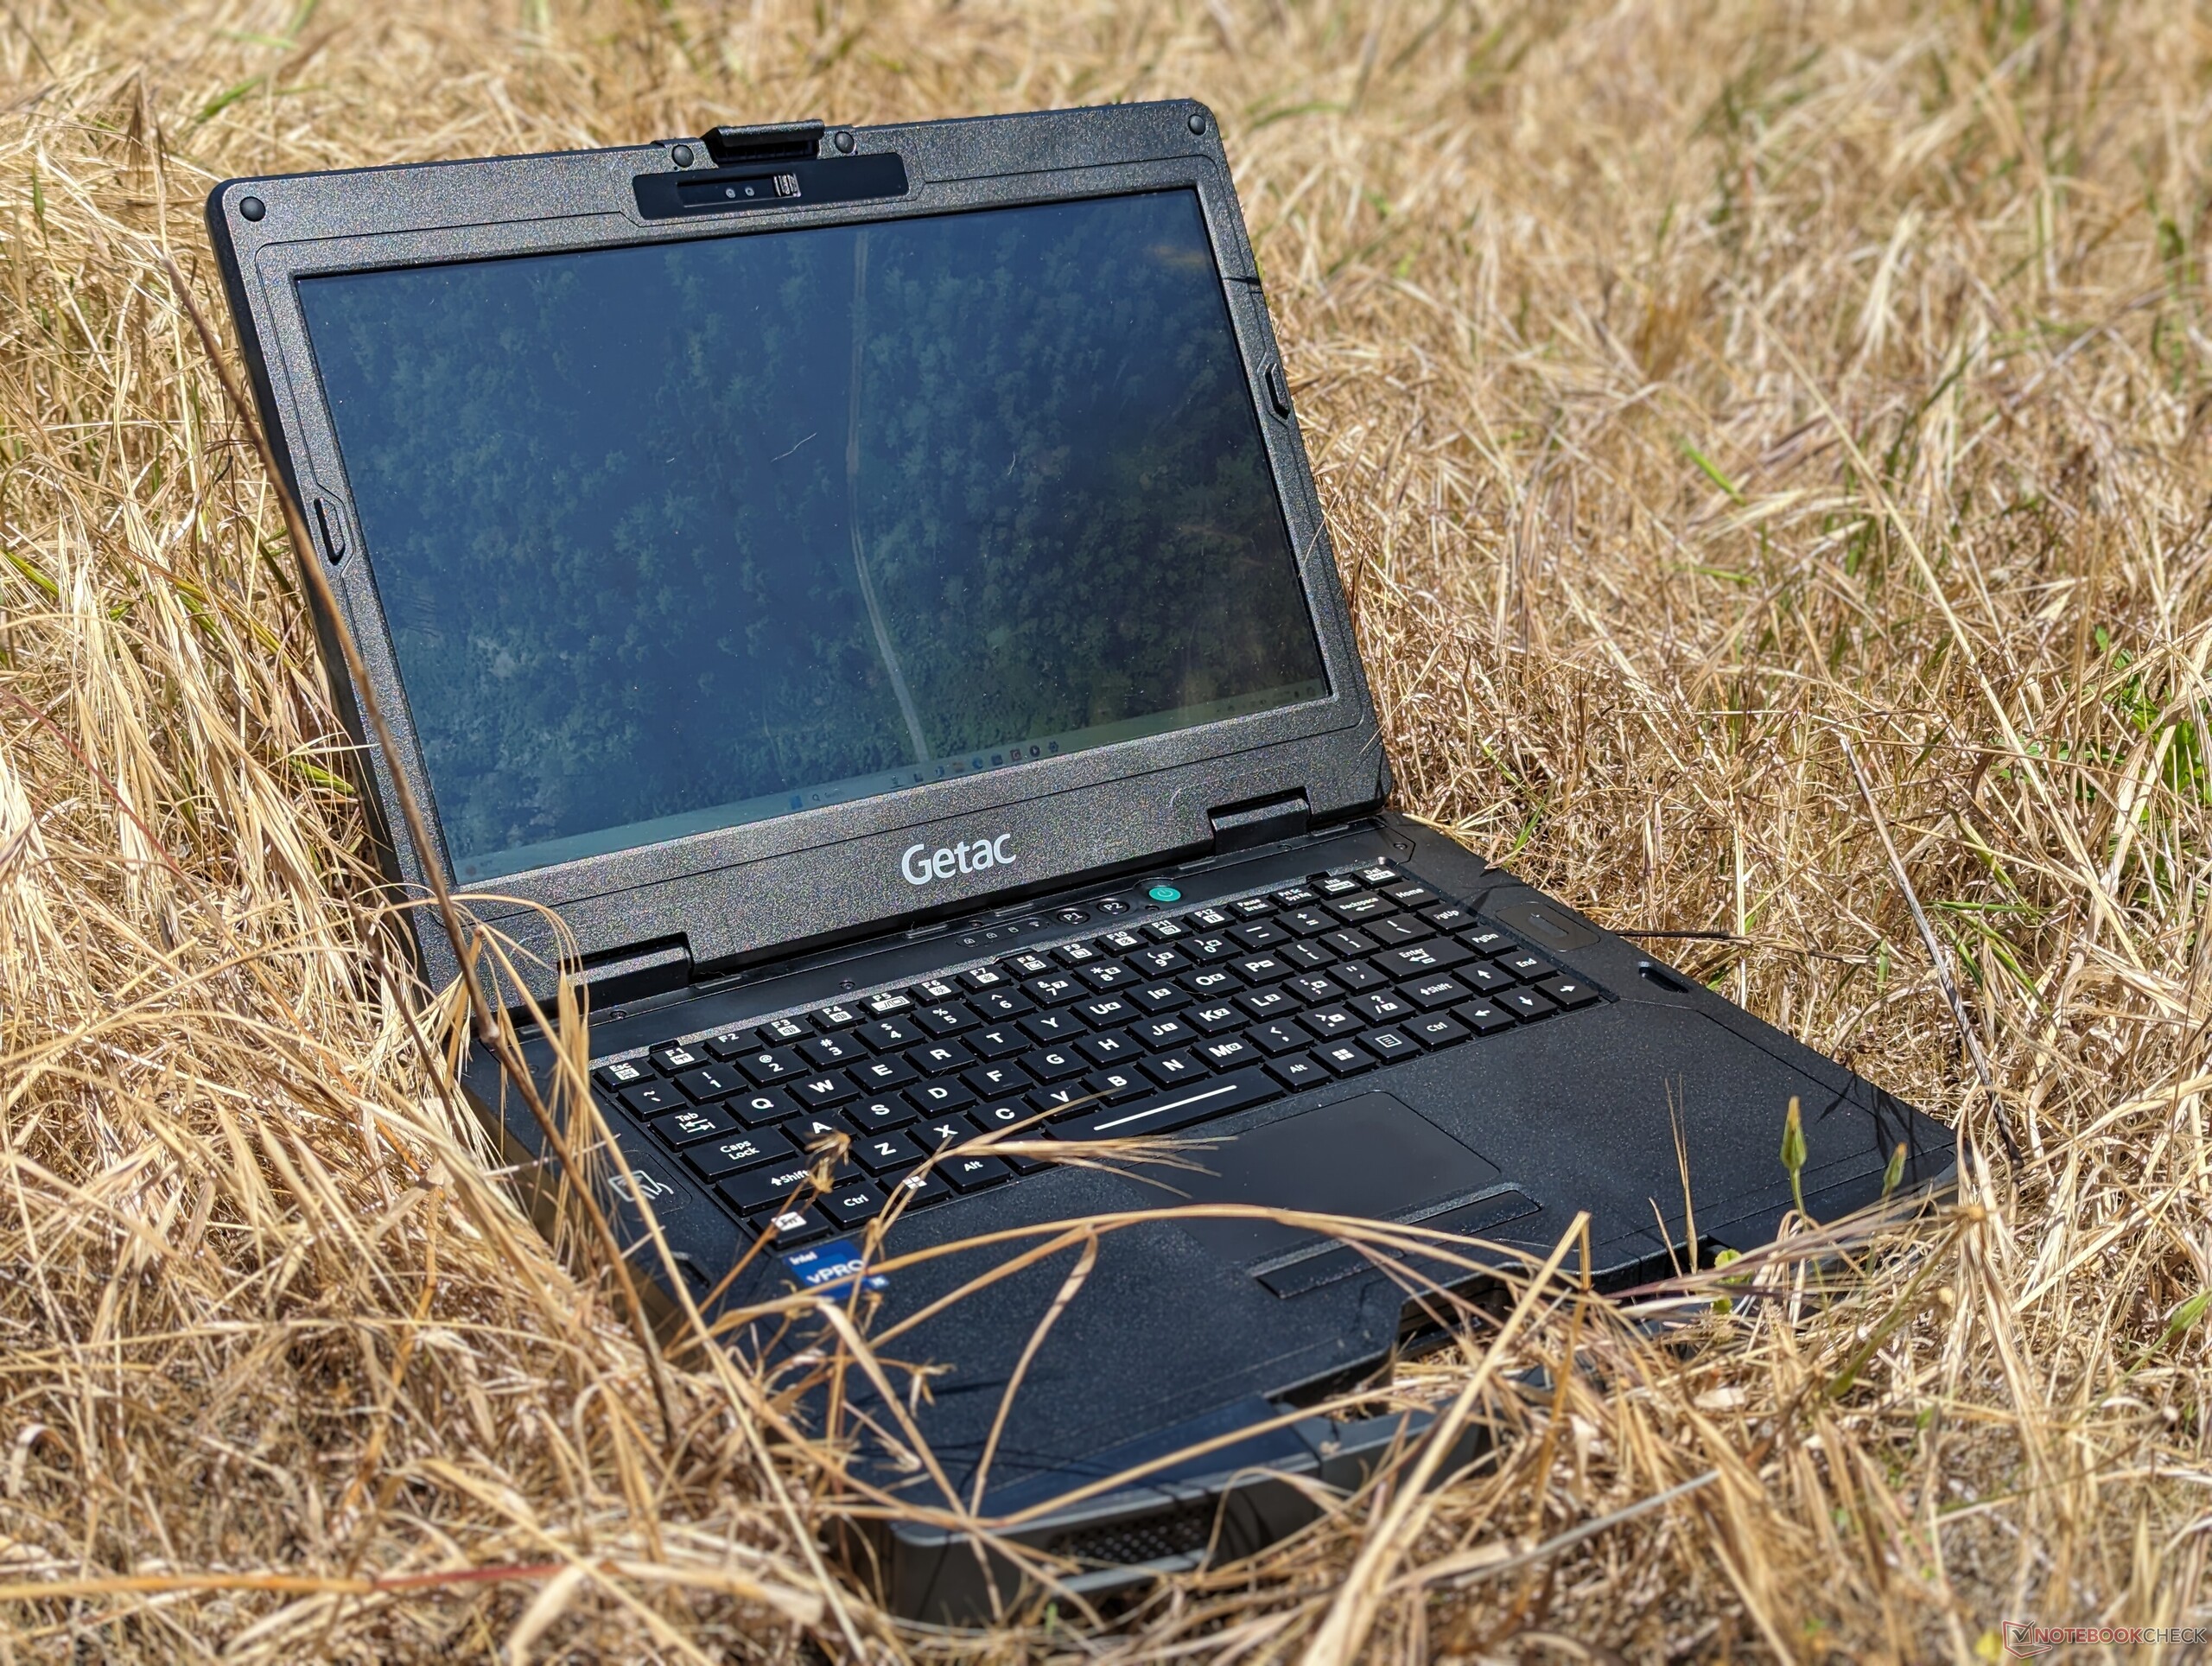
Getac S410 Gen 5 强固型笔记本电脑评测:提供额外性能的 Raptor Lake-P

潜在的竞争对手比较
Rating | Date | Model | Weight | Height | Size | Resolution | Price |
|---|---|---|---|---|---|---|---|
| 82.9 % v7 (old) | 06 / 2024 | Getac S410 G5 i5-1350P, Iris Xe G7 80EUs | 2.9 kg | 34.9 mm | 14.00" | 1920x1080 | |
| 81.7 % v7 (old) | 05 / 2022 | Getac S410 Gen 4 i7-1185G7, Iris Xe G7 96EUs | 3.2 kg | 34.9 mm | 14.00" | 1920x1080 | from EUR 0 |
v (old) | 09 / 2021 | Durabook S14I i7-1165G7, Iris Xe G7 96EUs | 3 kg | 38.1 mm | 14.00" | 1920x1080 | Alternative specs
USD 1 580.90
|
| 84.8 % v7 (old) | 01 / 2022 | Dell Latitude 14 5420-D2G5W i5-1135G7, Iris Xe G7 80EUs | 1.5 kg | 20.9 mm | 14.00" | 1920x1080 | Alternative specs
USD 749.99
|
v (old) | 05 / 2022 | Dell Latitude 7330 Rugged Extreme i7-1185G7, Iris Xe G7 96EUs | 2.7 kg | 36.5 mm | 13.30" | 1920x1080 | from EUR 5300 |
v (old) | 07 / 2022 | Panasonic Toughbook 40 i7-1185G7, Iris Xe G7 96EUs | 3.9 kg | 53.4 mm | 14.00" | 1920x1080 | Alternative specs
USD 4,500.00
|
外壳 - 坚固耐用,通过 MIL-STD-810H 和 IP53 认证
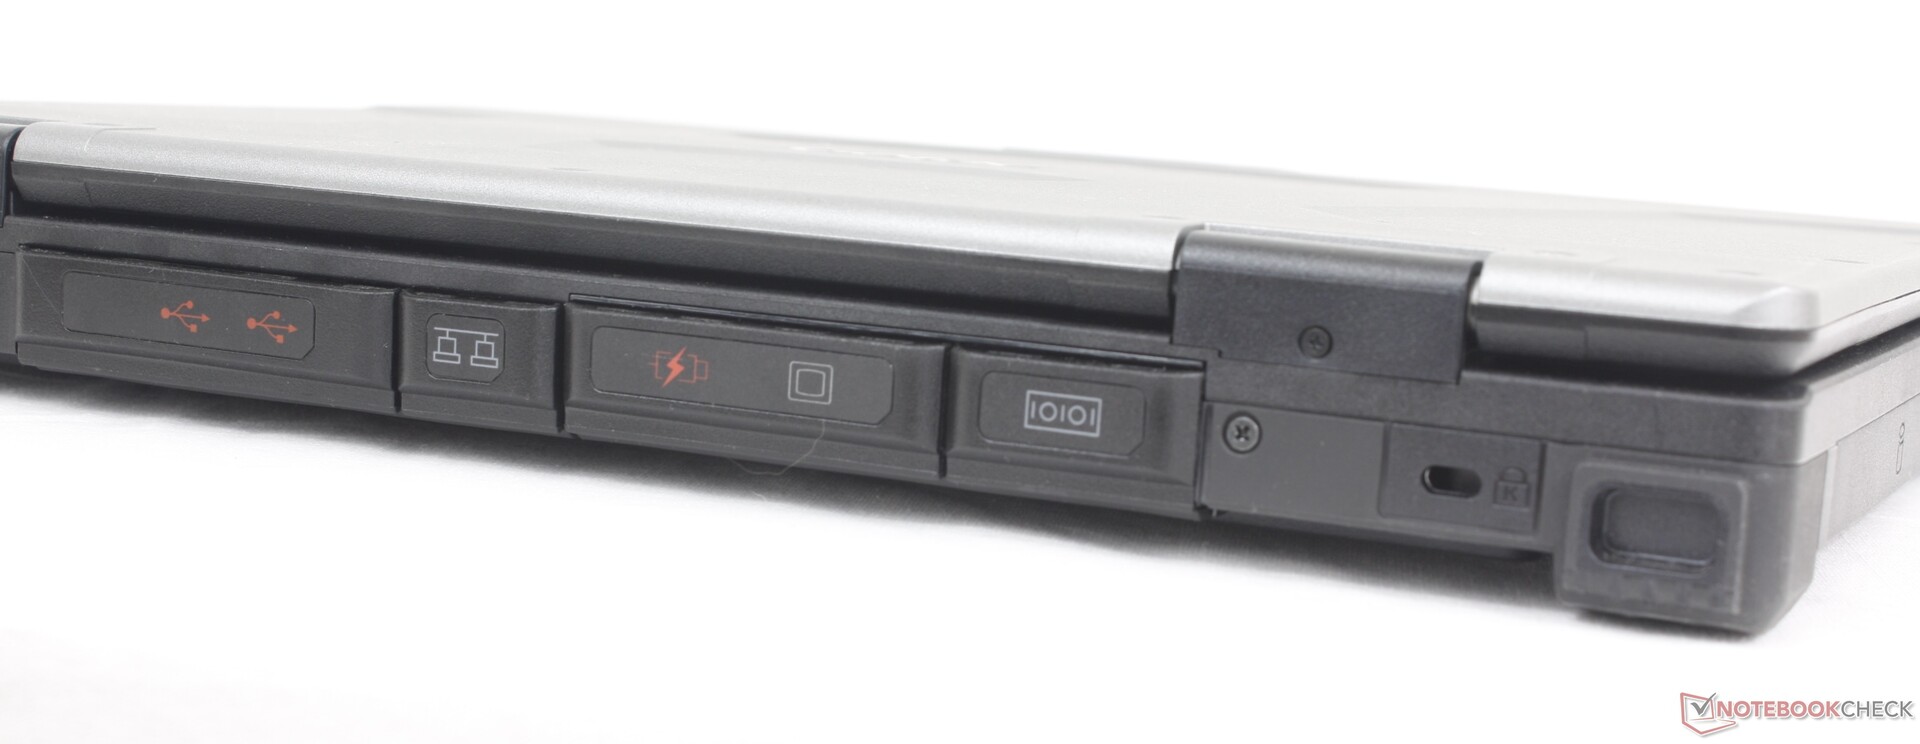
连接性
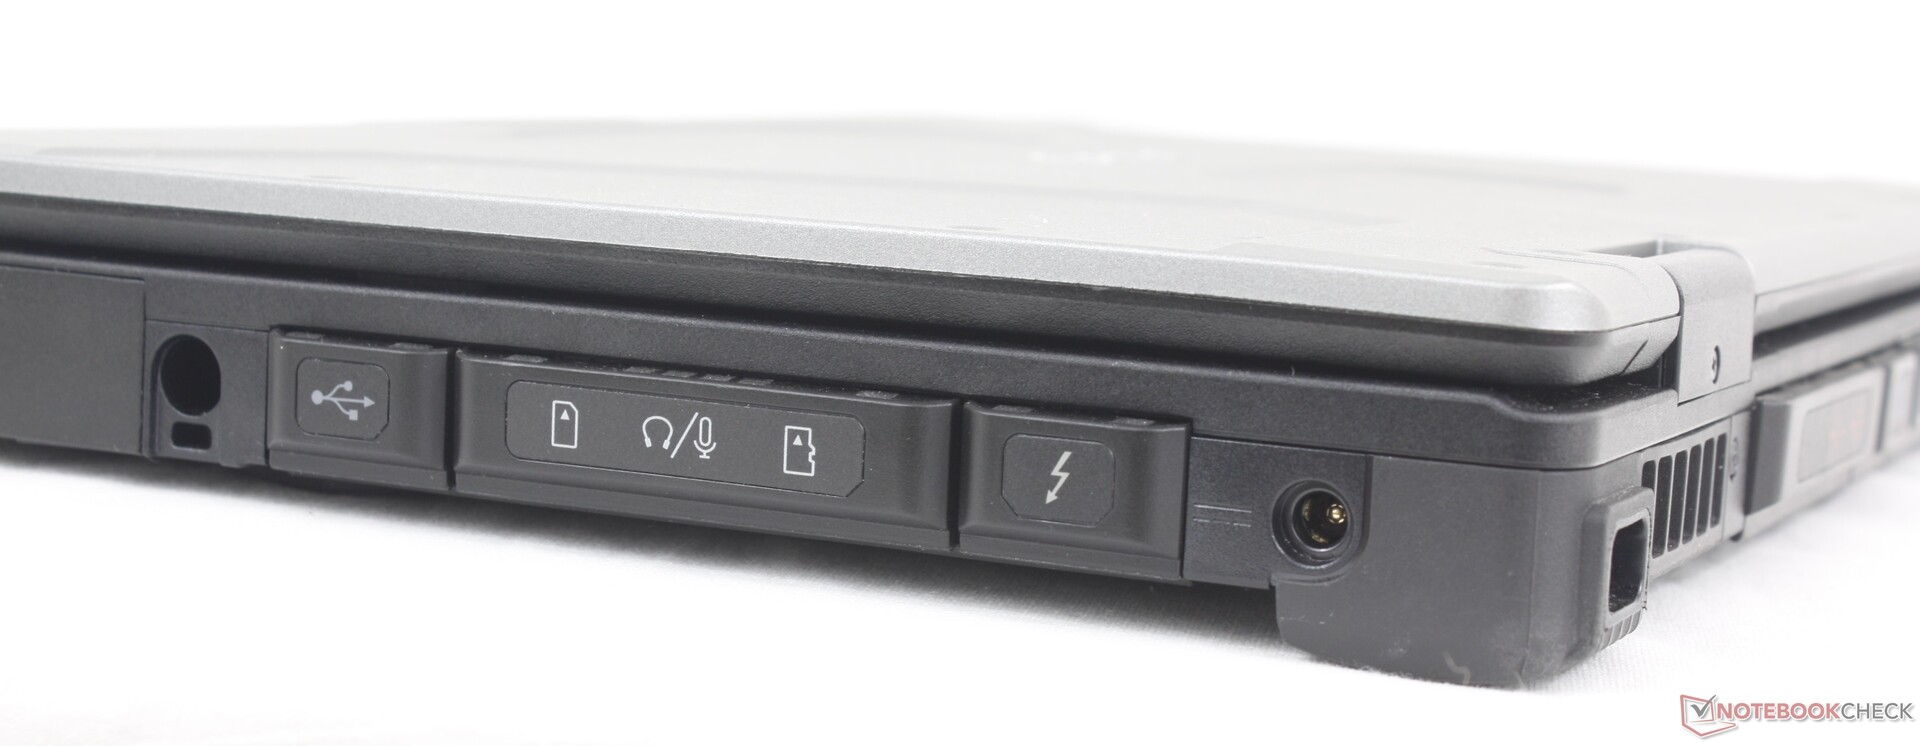

SD 读卡器
| SD Card Reader | |
| average JPG Copy Test (av. of 3 runs) | |
| Dell Latitude 14 5420-D2G5W (AV Pro SD microSD 128 GB V60) | |
| Dell Latitude 7330 Rugged Extreme (AV Pro V60) | |
| Getac S410 G5 (AV Pro V60) | |
| Panasonic Toughbook 40 (AV Pro V60) | |
| Durabook S14I (Angelbird 128GB AV Pro UHS-II) | |
| maximum AS SSD Seq Read Test (1GB) | |
| Dell Latitude 7330 Rugged Extreme (AV Pro V60) | |
| Dell Latitude 14 5420-D2G5W (AV Pro SD microSD 128 GB V60) | |
| Getac S410 G5 (AV Pro V60) | |
| Panasonic Toughbook 40 (AV Pro V60) | |
| Durabook S14I (Angelbird 128GB AV Pro UHS-II) | |
交流
无线局域网已从英特尔 AX201 升级到 AX211,以支持 Wi-Fi 6E 速度。
| Networking | |
| iperf3 transmit AX12 | |
| Durabook S14I | |
| Dell Latitude 7330 Rugged Extreme | |
| Getac S410 Gen 4 | |
| Dell Latitude 14 5420-D2G5W | |
| iperf3 receive AX12 | |
| Durabook S14I | |
| Getac S410 Gen 4 | |
| Dell Latitude 7330 Rugged Extreme | |
| Dell Latitude 14 5420-D2G5W | |
| iperf3 transmit AXE11000 | |
| Panasonic Toughbook 40 | |
| Getac S410 G5 | |
| iperf3 receive AXE11000 | |
| Panasonic Toughbook 40 | |
| Getac S410 G5 | |
| iperf3 transmit AXE11000 6GHz | |
| Getac S410 G5 | |
| iperf3 receive AXE11000 6GHz | |
| Getac S410 G5 | |
网络摄像头
我们的测试机配置了 500 万像素网络摄像头,比 S410 G4 上的 100 万像素网络摄像头有了很大提升。支持 Windows Hello 面部识别功能。


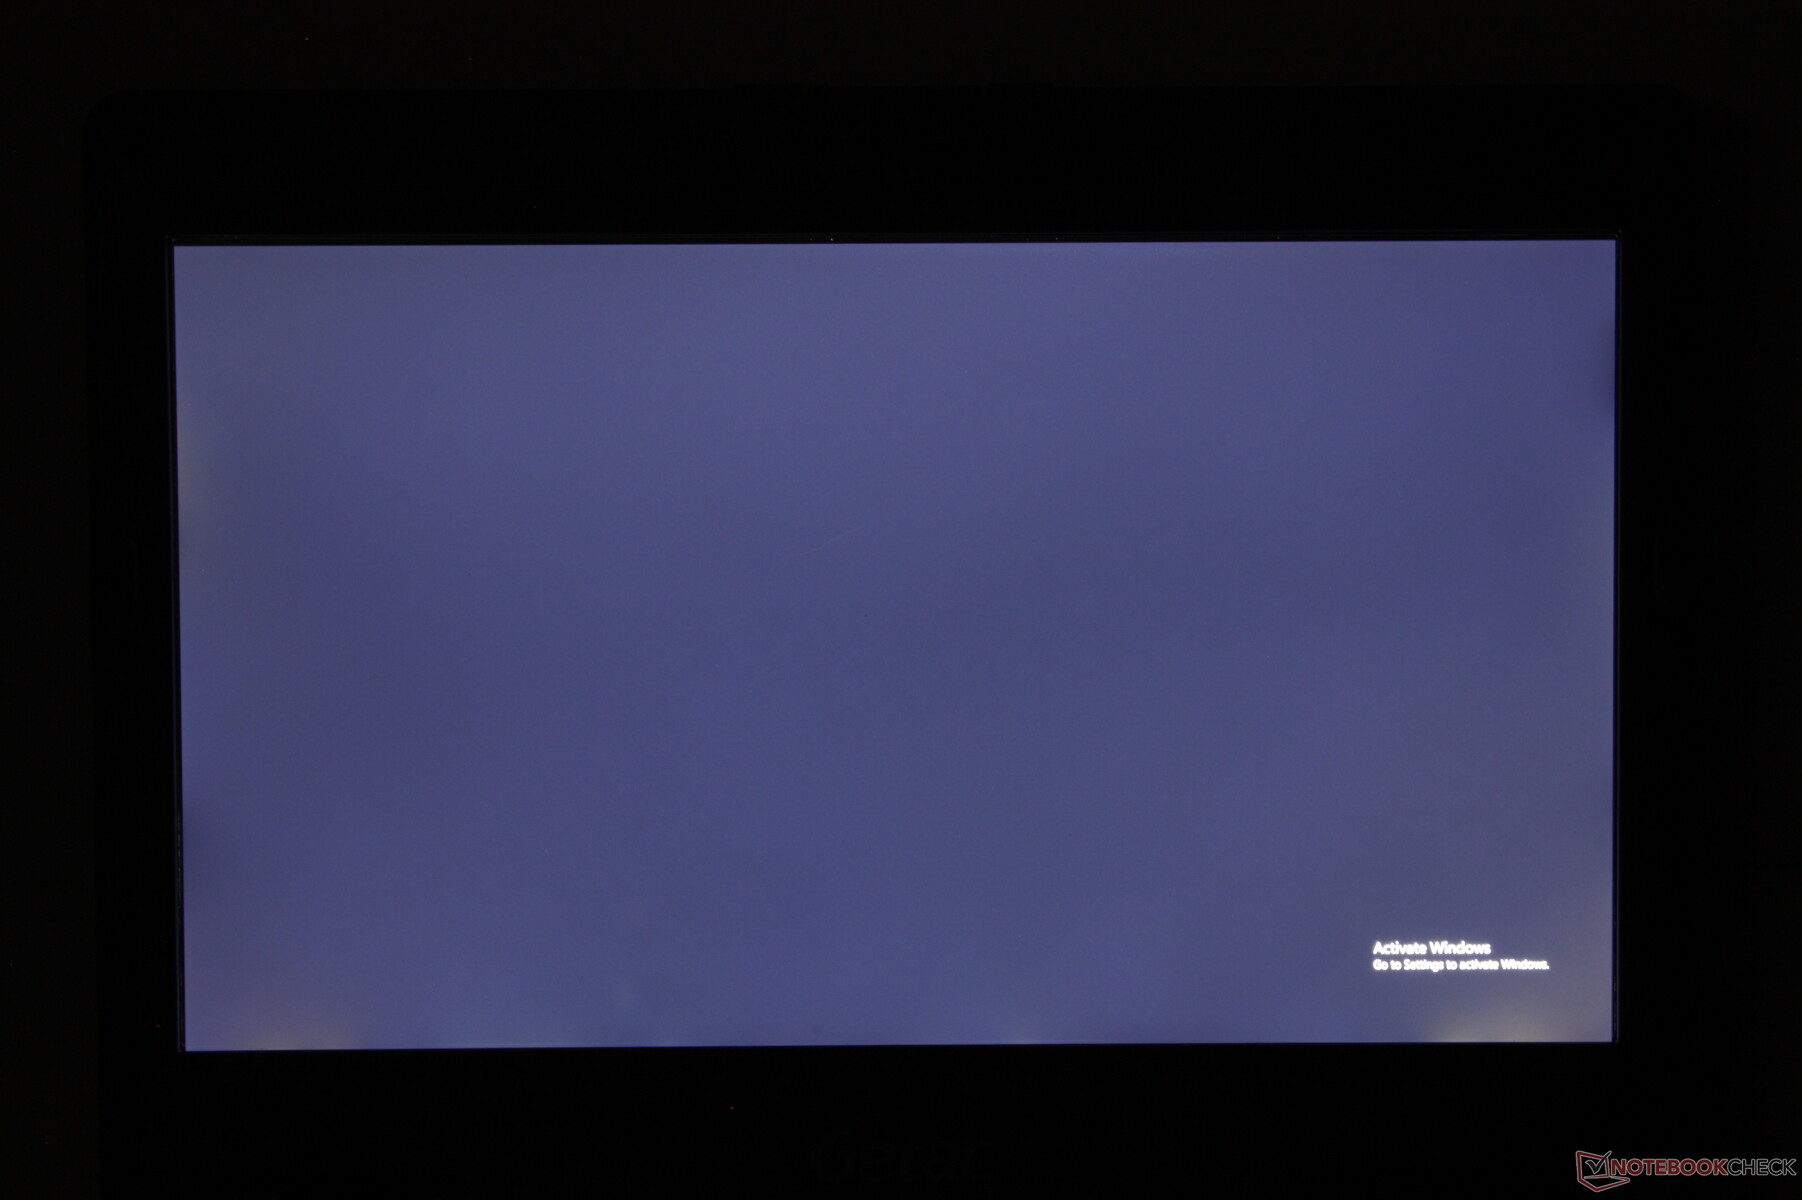
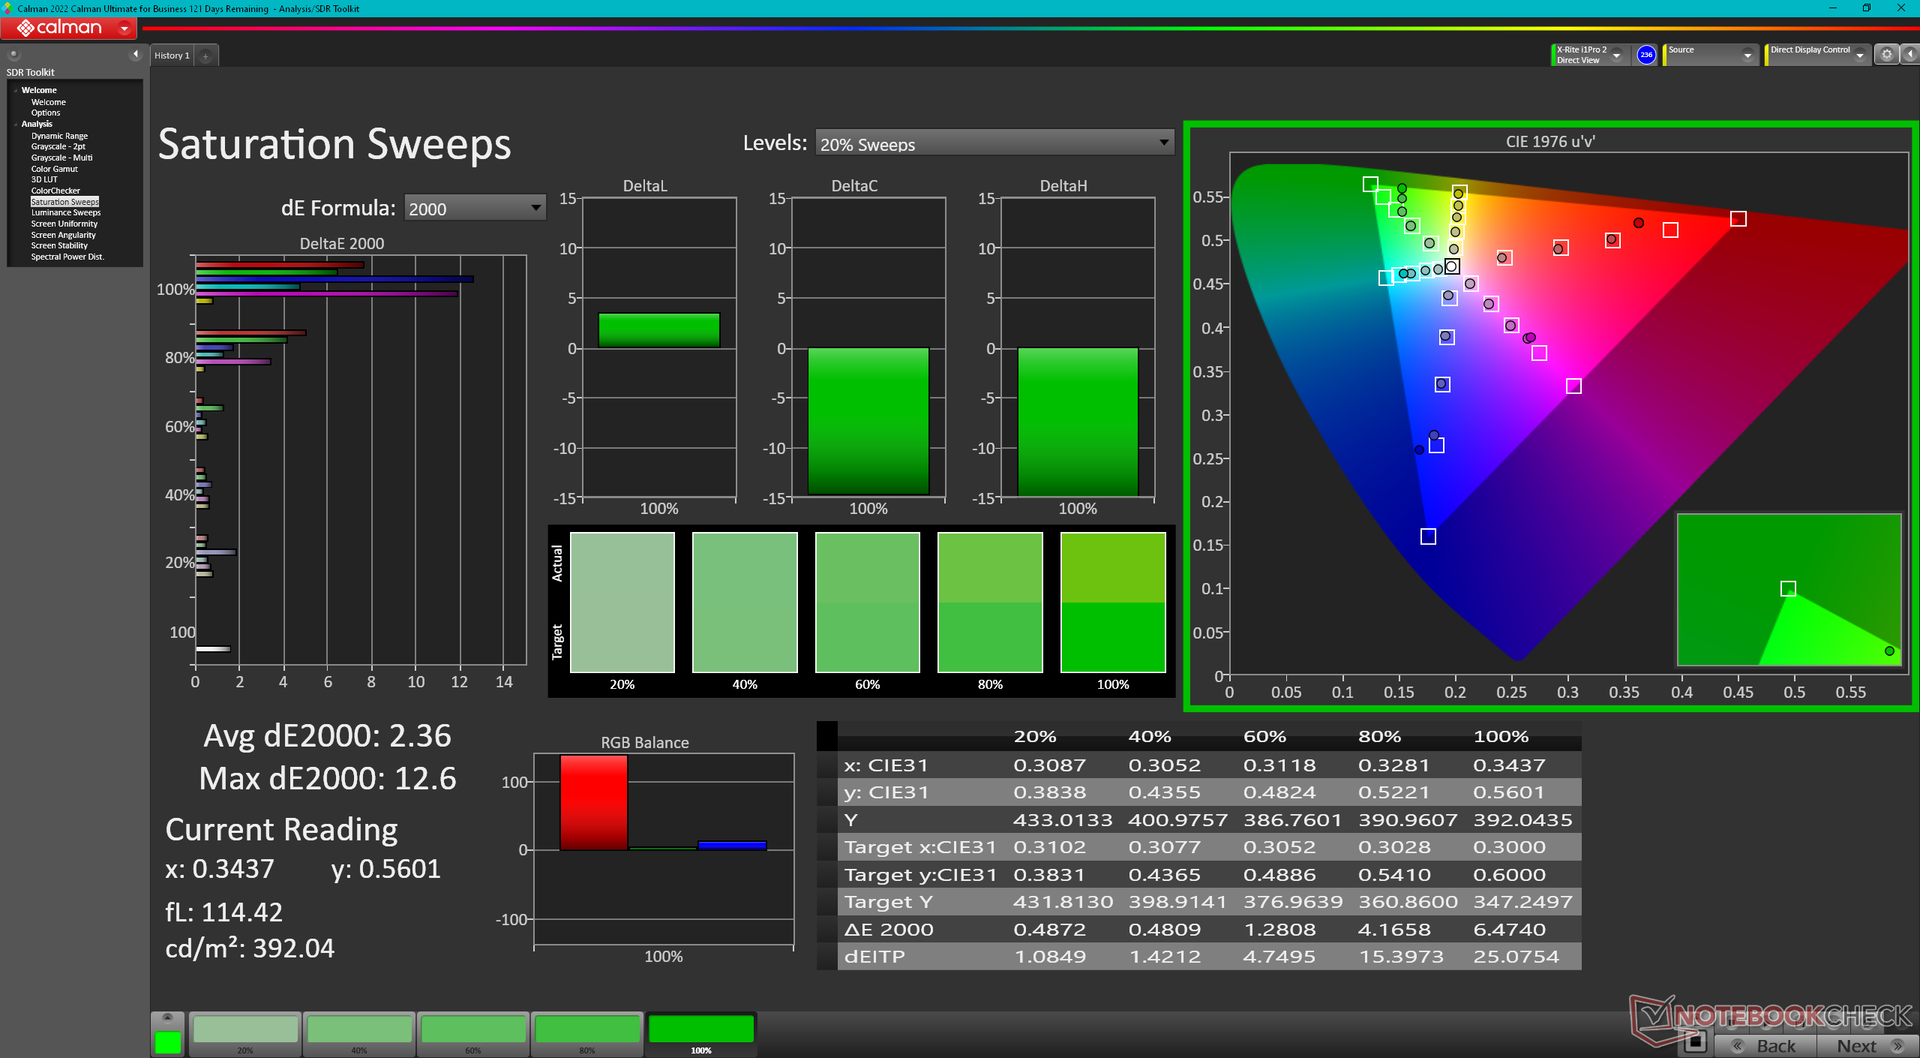
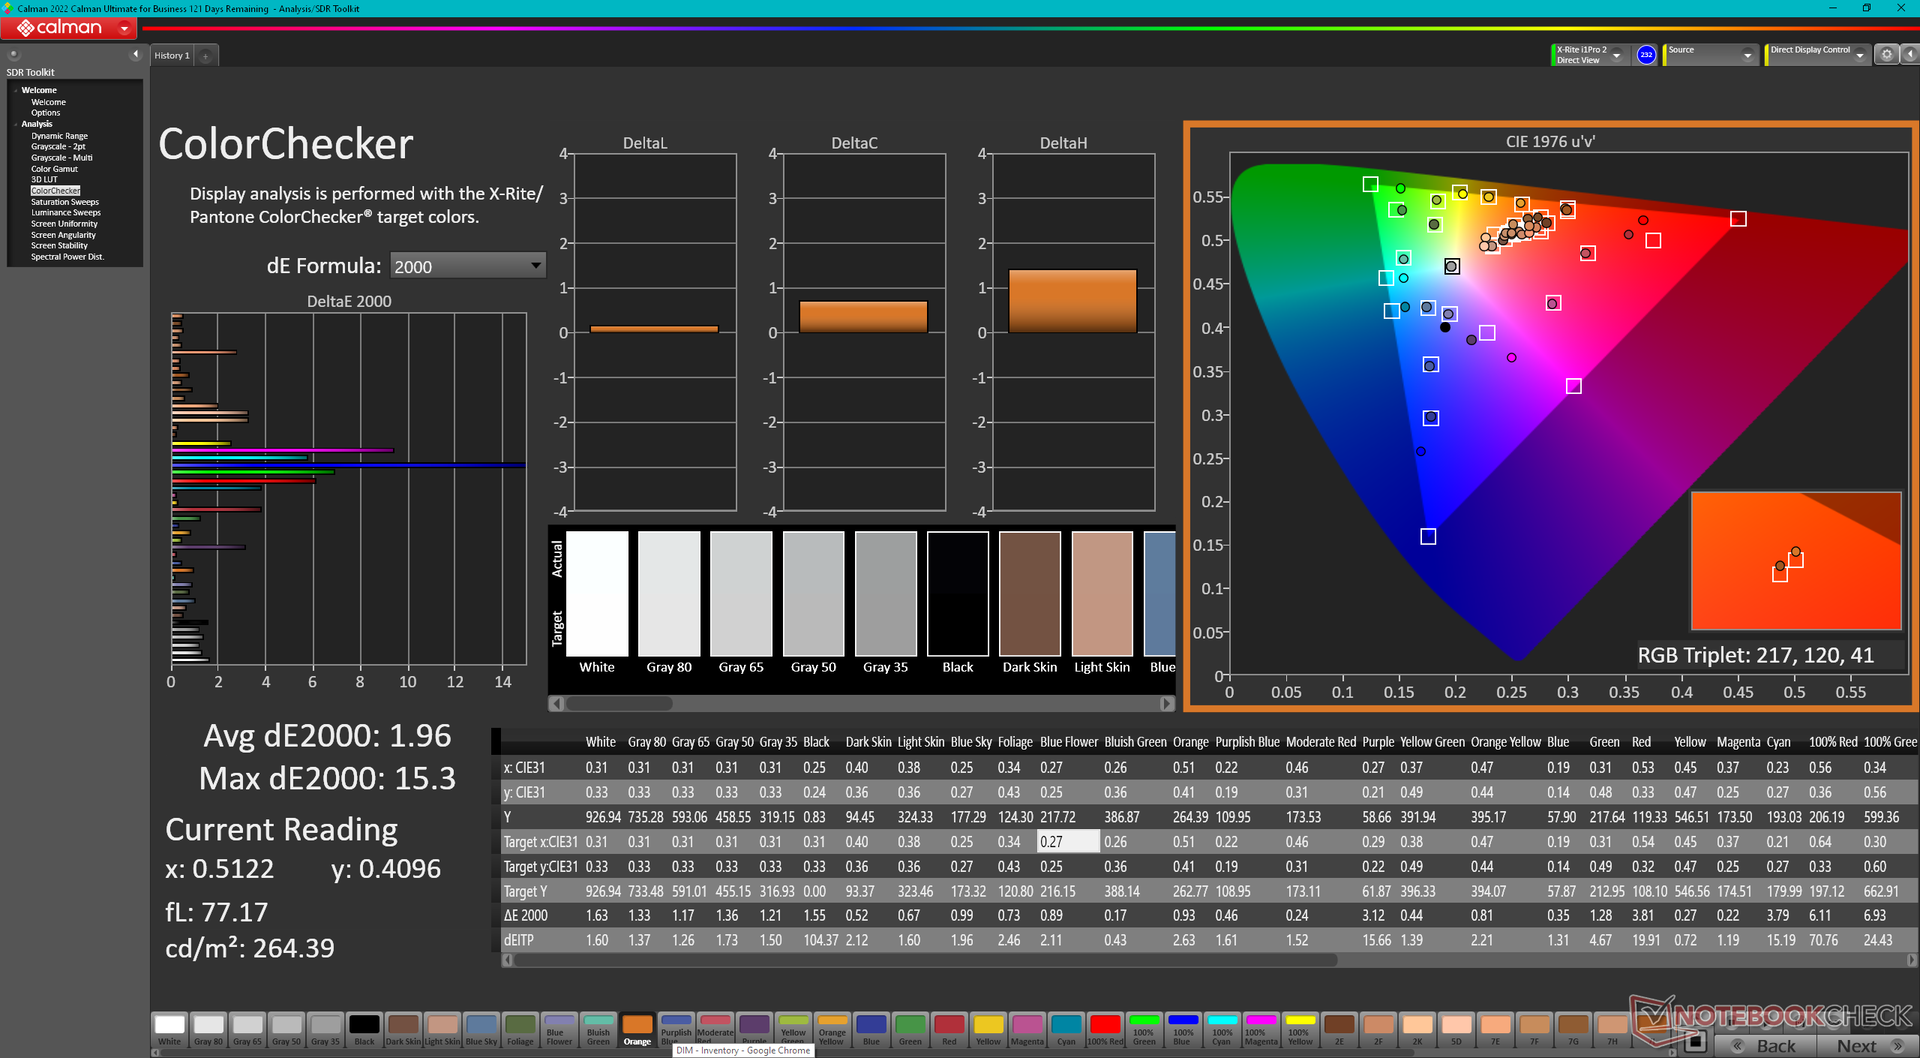
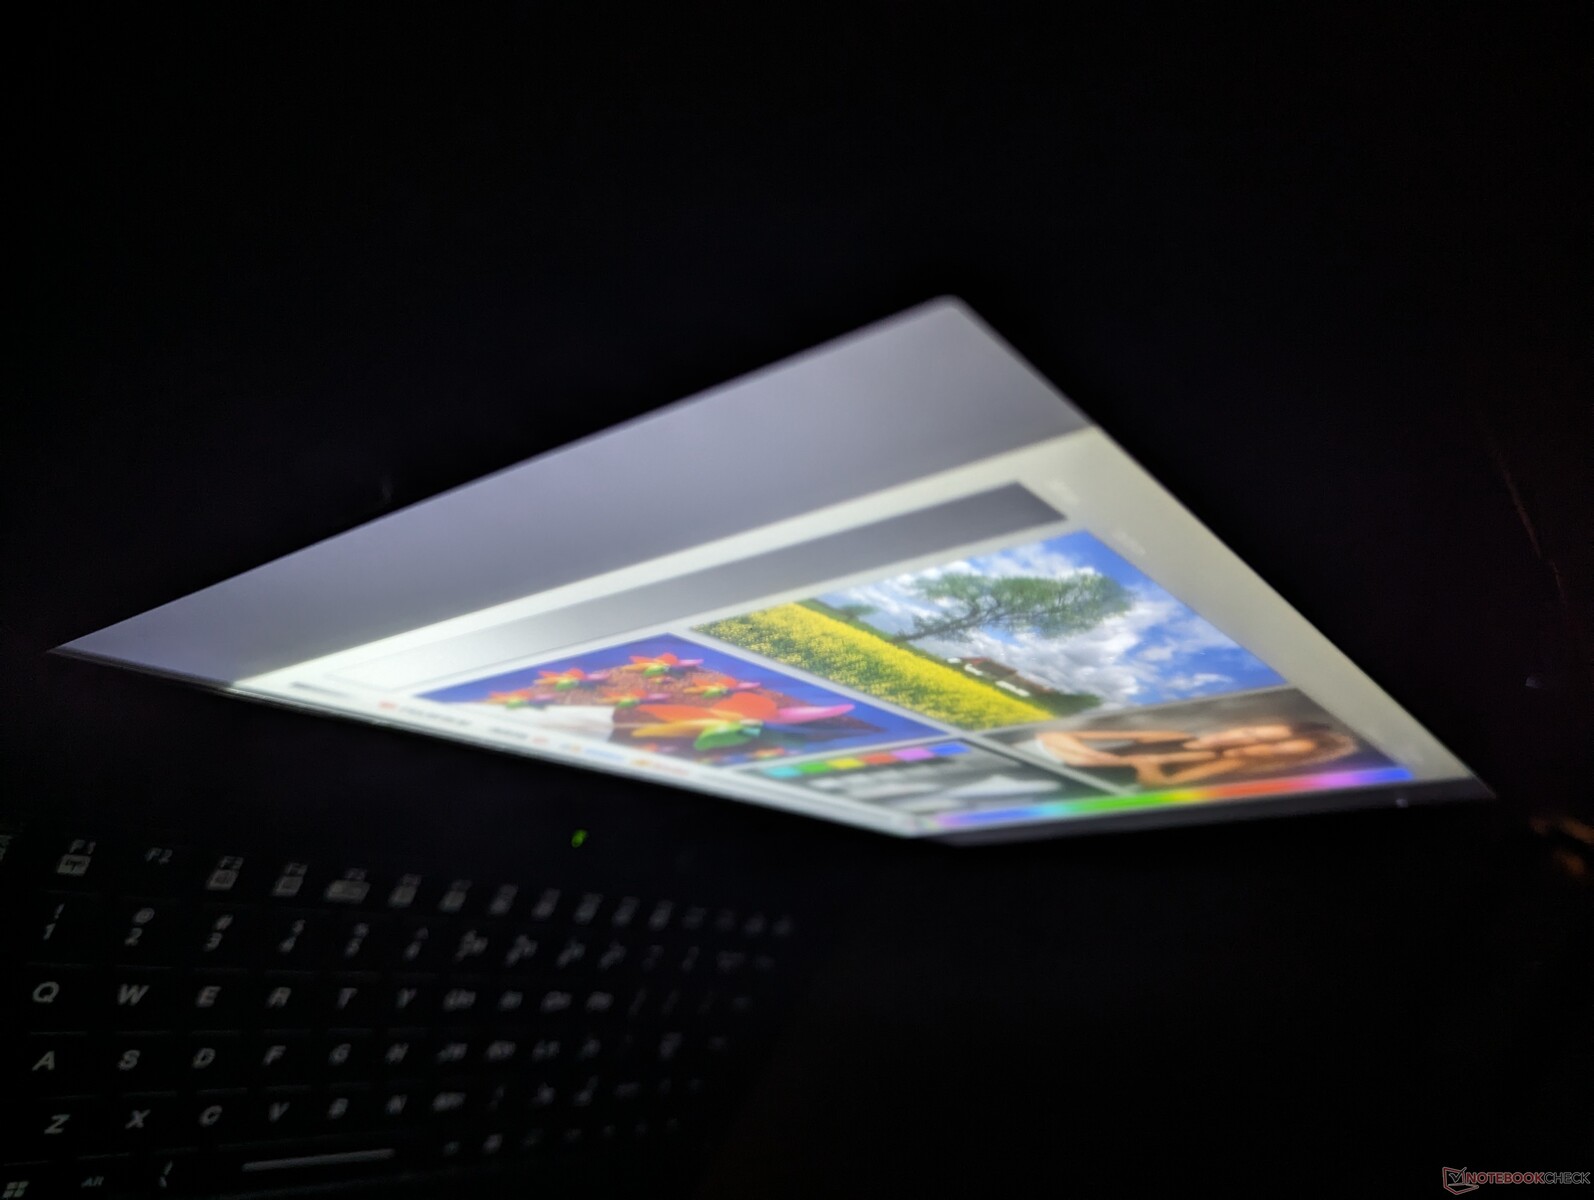
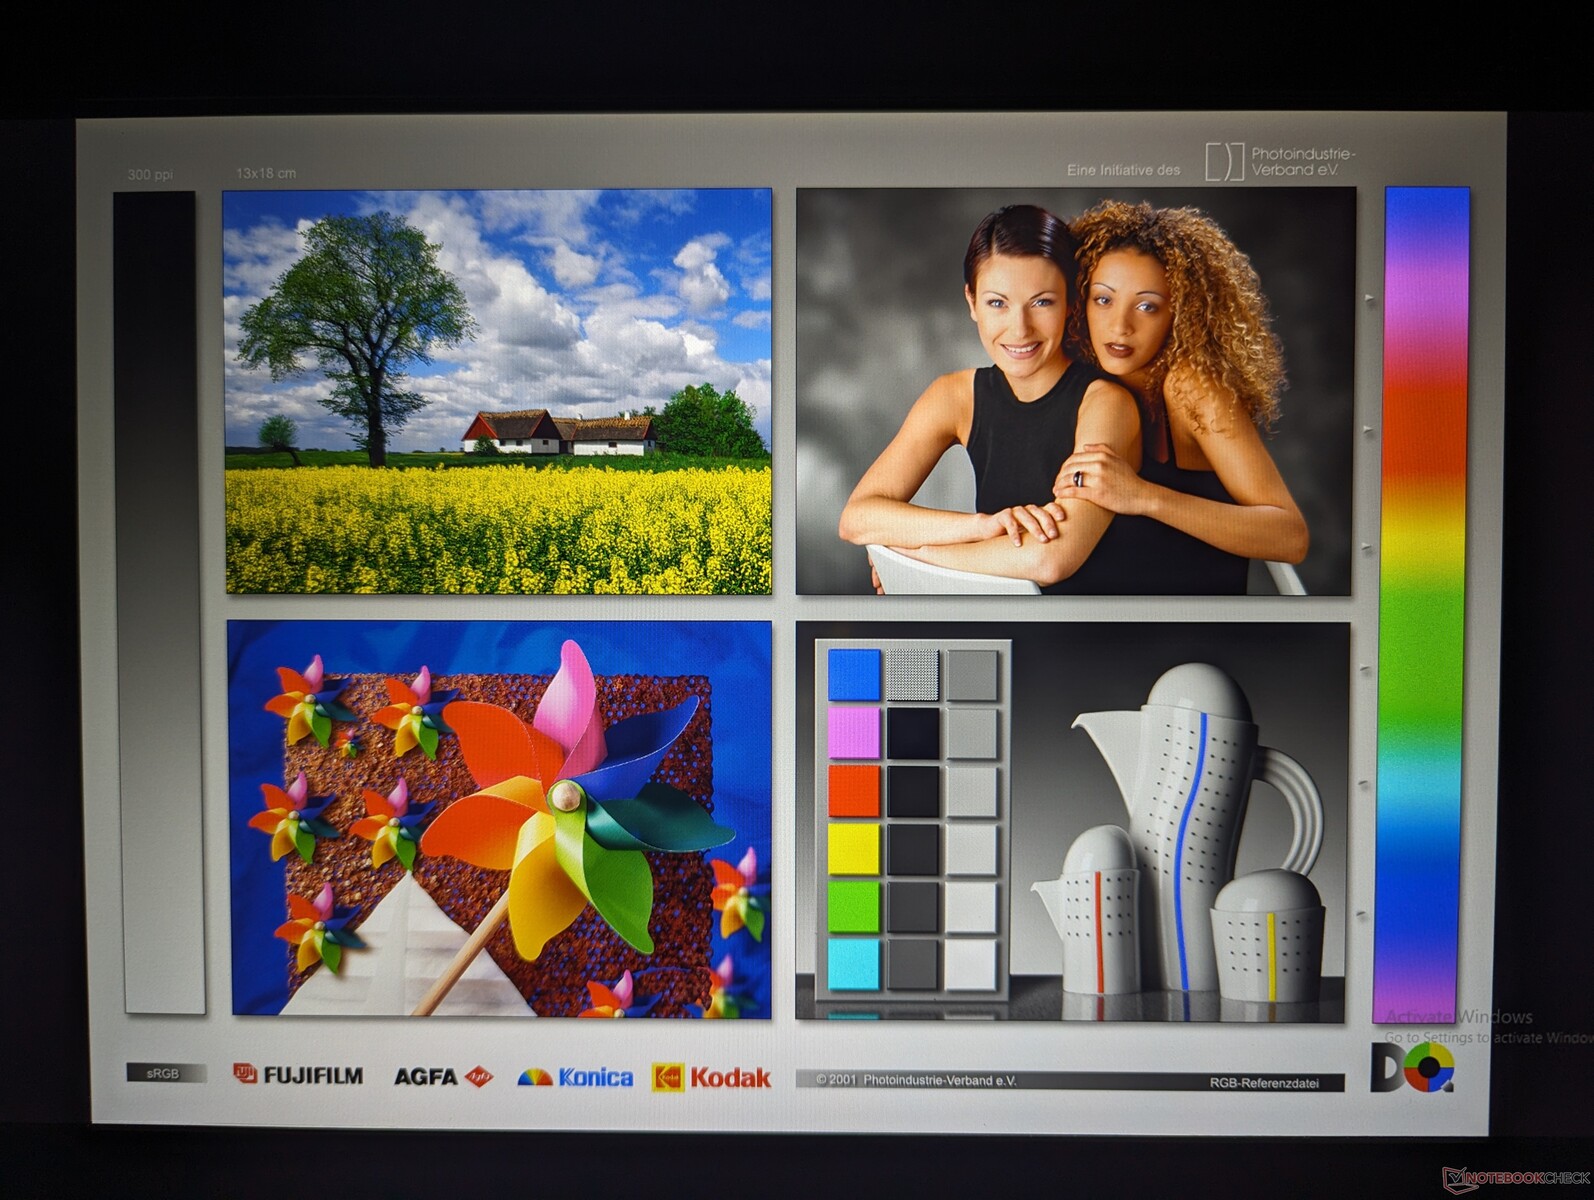
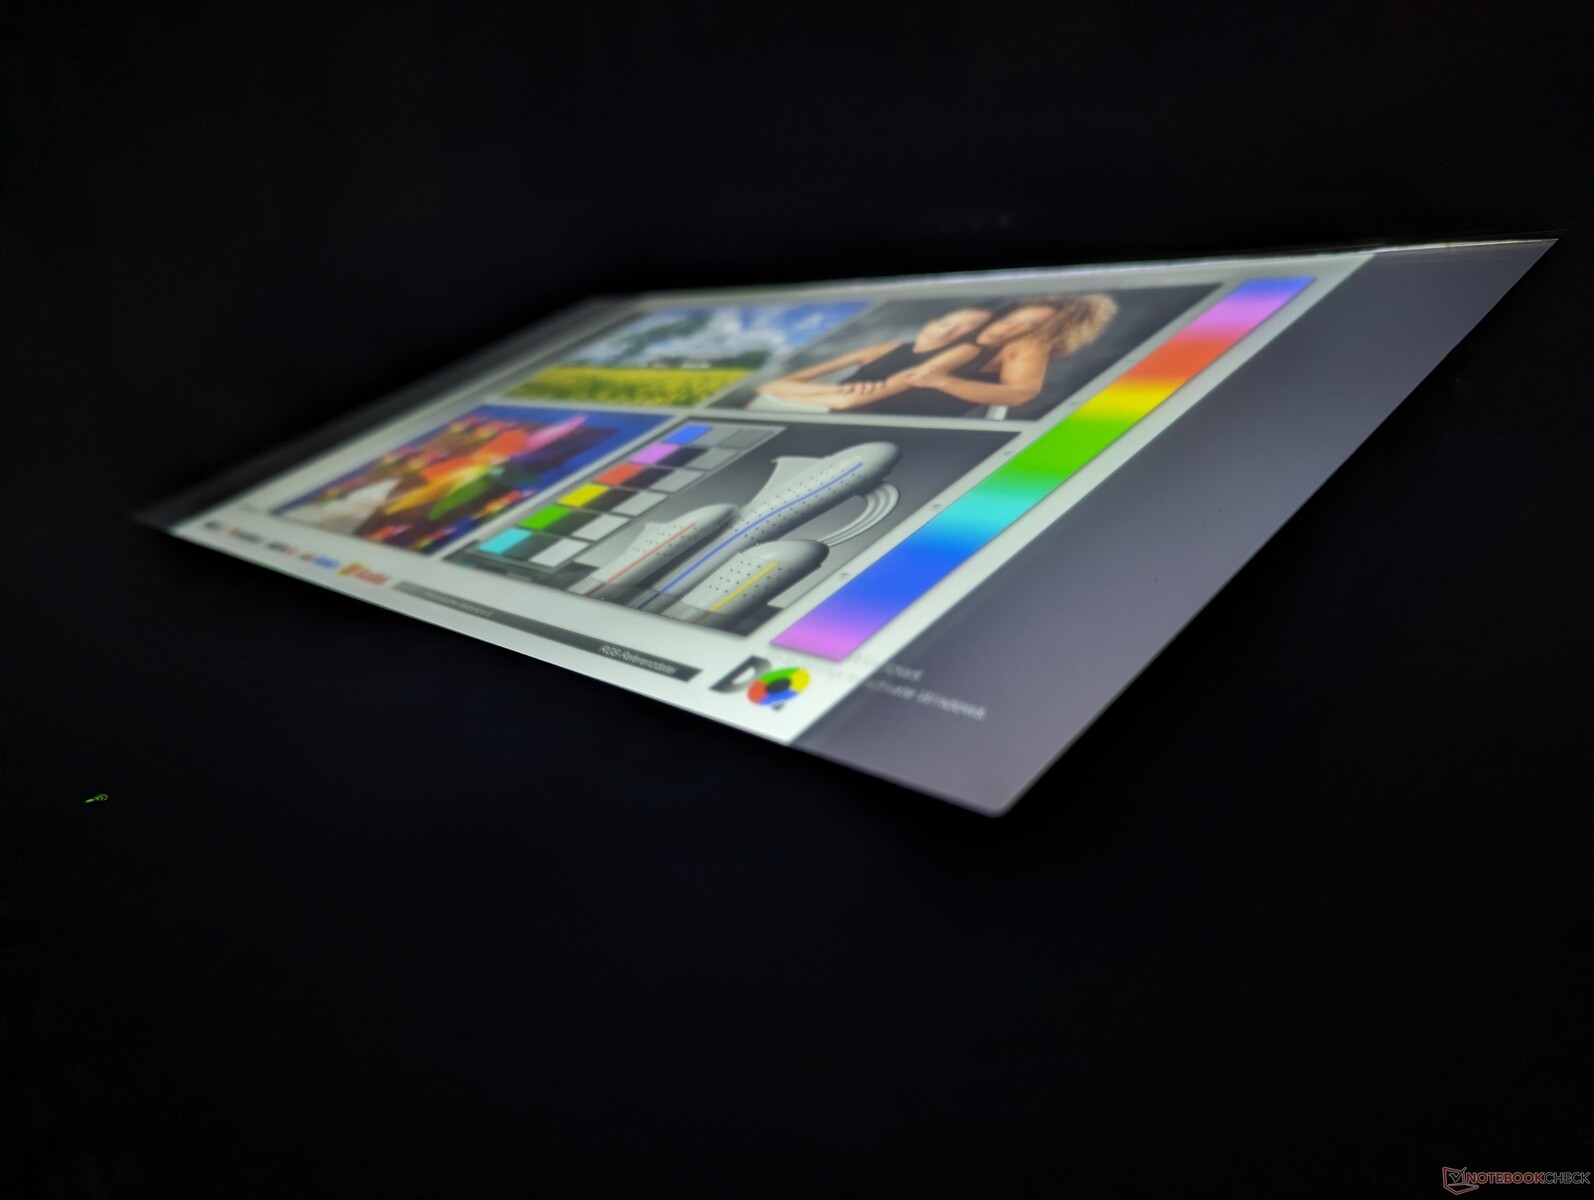
显示屏 - 更快的黑白响应时间
我们的 S410 G5 配备的是 TCL CSOT 的面板(SNE001BS1-1),而 S410 G4 配备的是友达光电的面板。TCL 面板具有更快的黑白和灰白响应时间,可减少重影现象,而重影现象在 S410 G4 上是一个明显的问题。除此之外,所有其他特性几乎保持不变,包括 1000 尼特的亮度、1000:1 的对比度和有限的 <60% sRGB 色彩。
| |||||||||||||||||||||||||
Brightness Distribution: 86 %
Center on Battery: 958.4 cd/m²
Contrast: 998:1 (Black: 0.96 cd/m²)
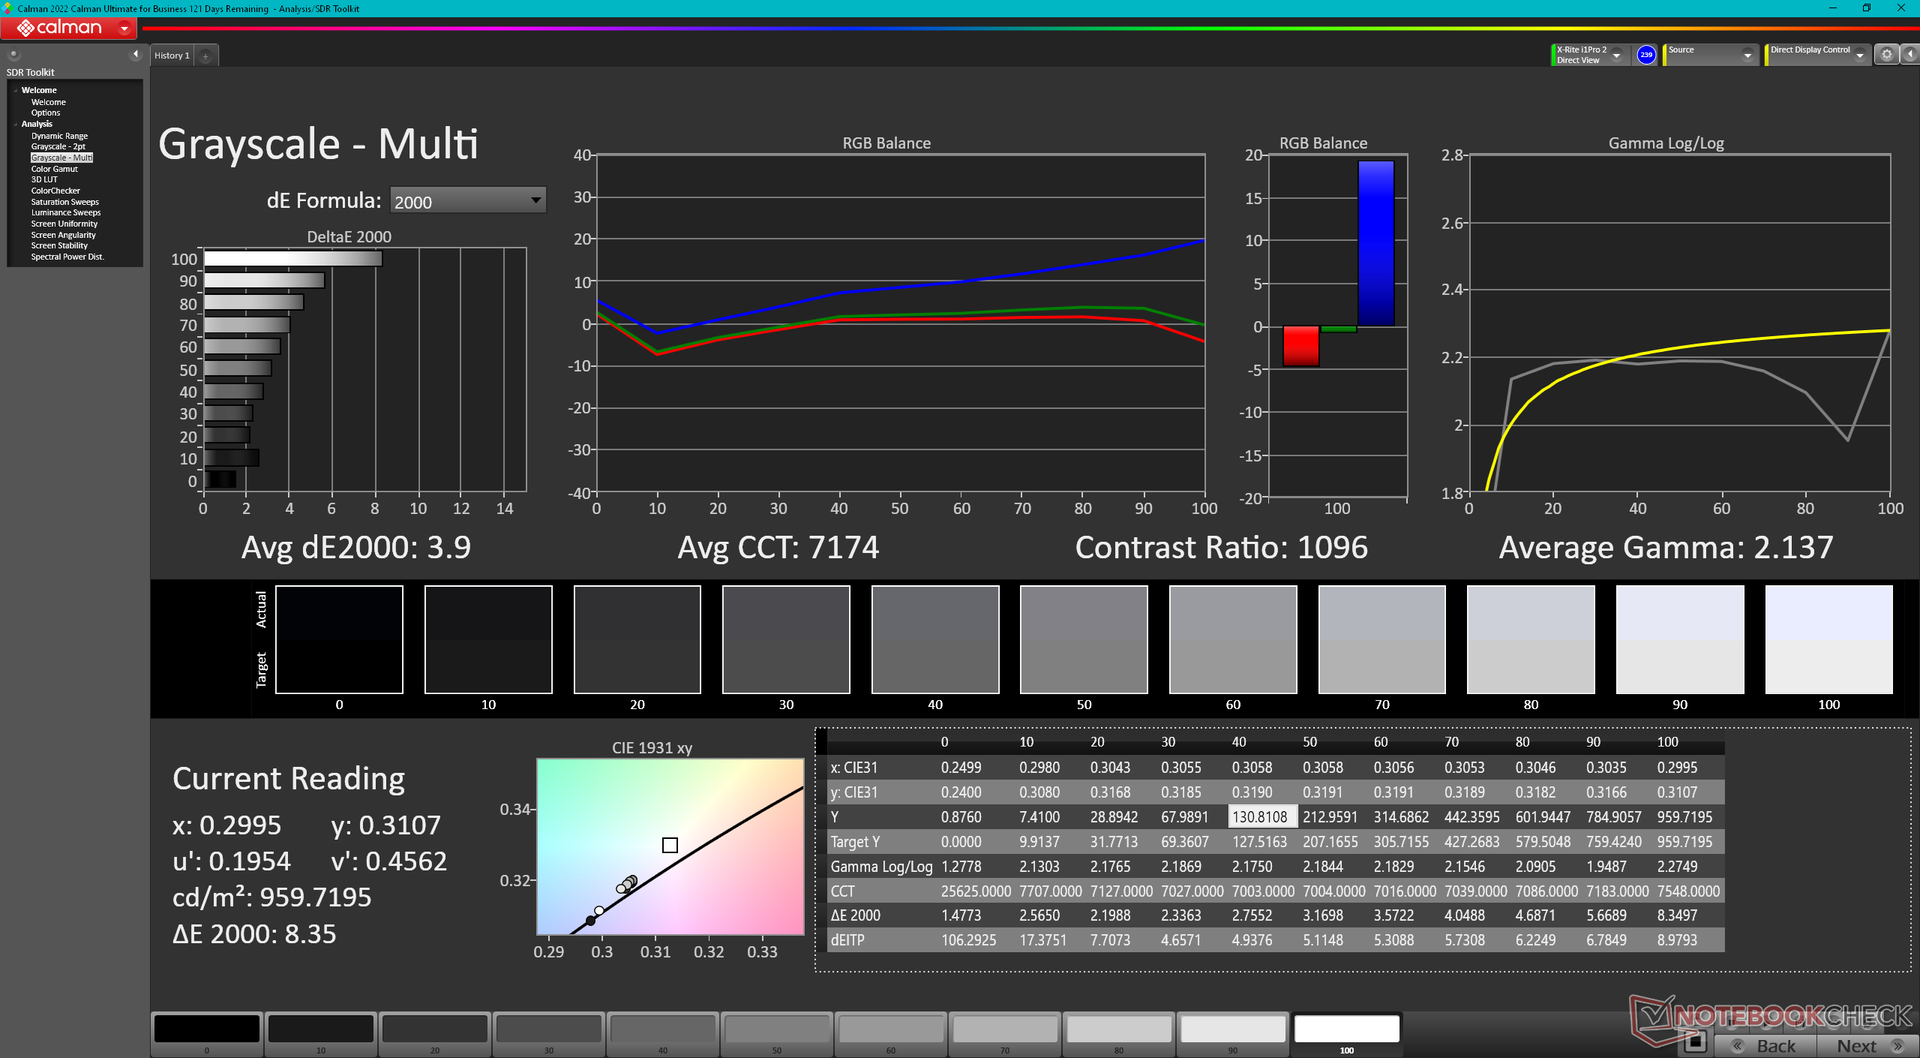
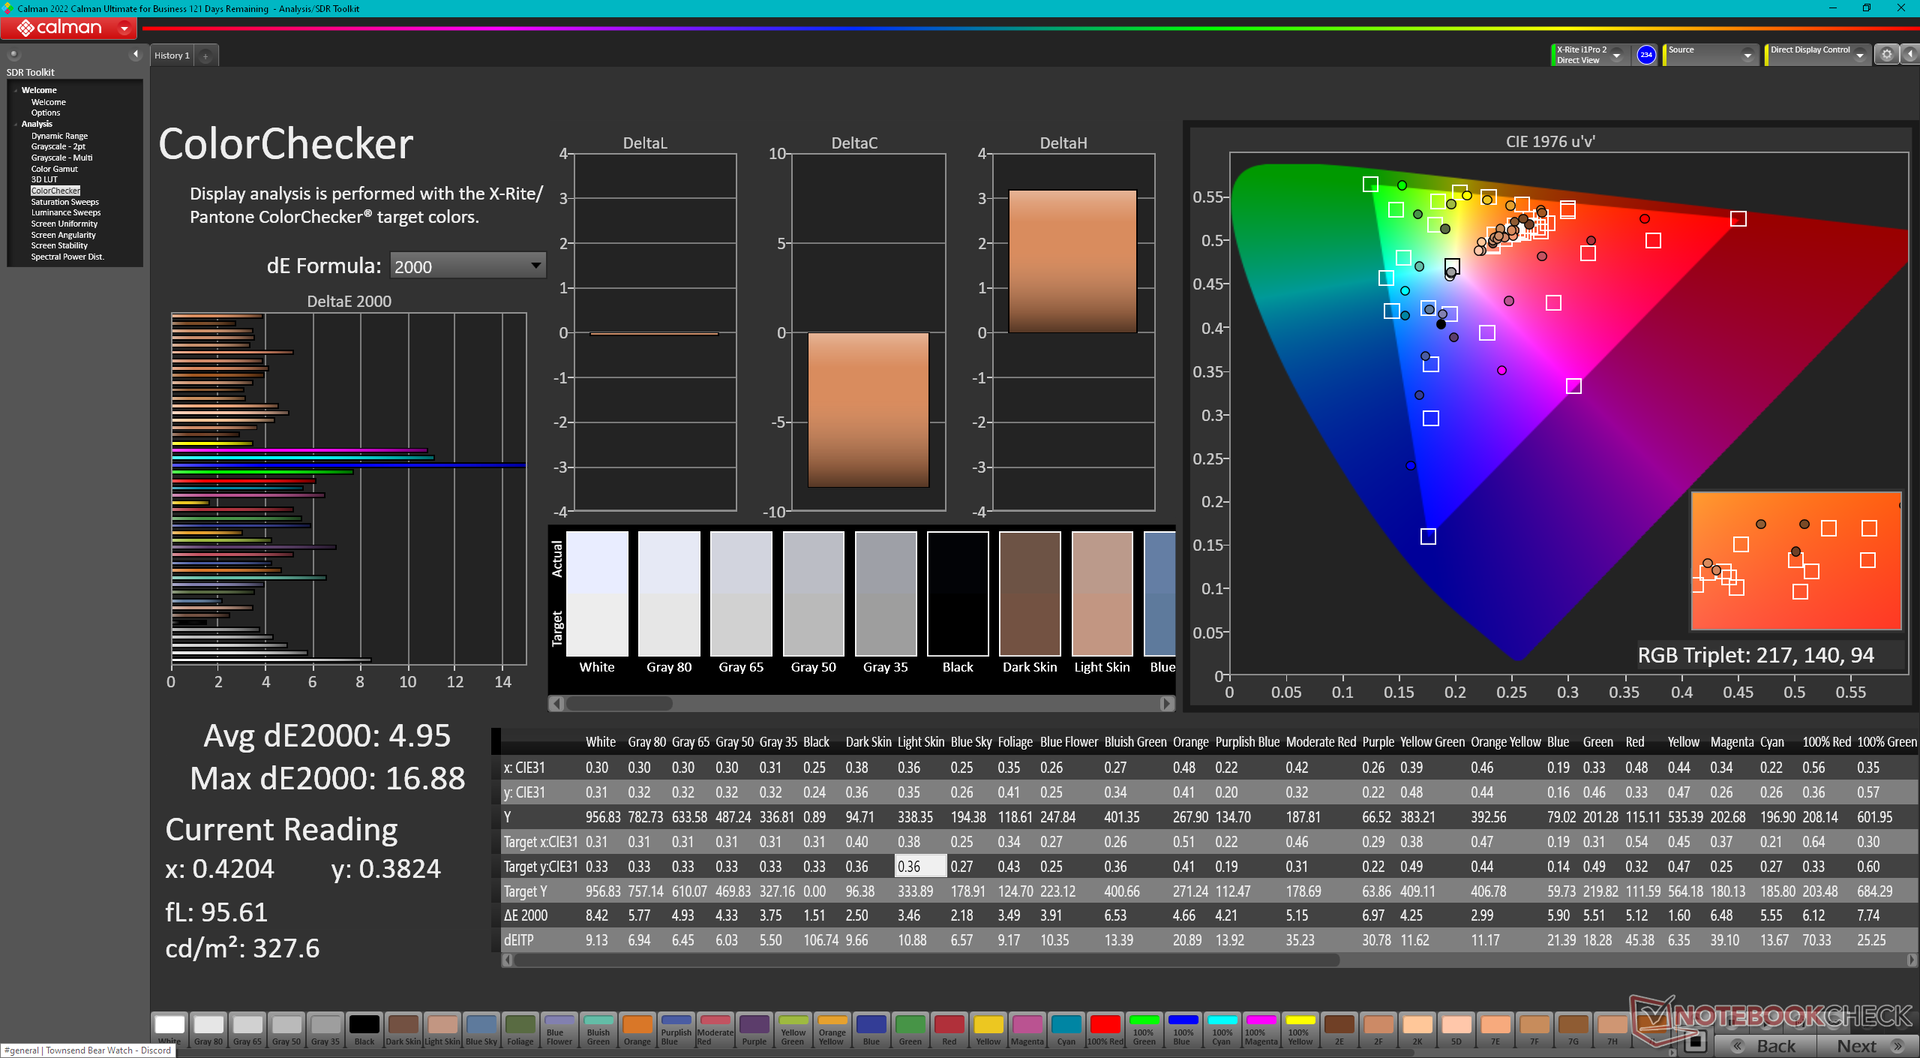
ΔE Color 4.95 | 0.5-29.43 Ø4.87, calibrated: 1.96
ΔE Greyscale 3.9 | 0.5-98 Ø5.1
39.8% AdobeRGB 1998 (Argyll 2.2.0 3D)
57.9% sRGB (Argyll 2.2.0 3D)
38.5% Display P3 (Argyll 2.2.0 3D)
Gamma: 2.14
| Getac S410 G5 CSOT T9 SNE001BS1-1, IPS, 1920x1080, 14" | Getac S410 Gen 4 AU Optronics AUO413D, IPS, 1920x1080, 14" | Durabook S14I KD140N0730A01, TN, 1920x1080, 14" | Dell Latitude 14 5420-D2G5W AUO5491 / B140HAN, IPS, 1920x1080, 14" | Dell Latitude 7330 Rugged Extreme Sharp LQ133M1, IPS, 1920x1080, 13.3" | Panasonic Toughbook 40 InfoVision M140NWF5 R3, IPS, 1920x1080, 14" | |
|---|---|---|---|---|---|---|
| Display | -1% | 13% | -7% | 72% | -7% | |
| Display P3 Coverage | 38.5 | 38.3 -1% | 43.55 13% | 36 -6% | 67.1 74% | 35.8 -7% |
| sRGB Coverage | 57.9 | 57.2 -1% | 65.4 13% | 54 -7% | 98.2 70% | 53.8 -7% |
| AdobeRGB 1998 Coverage | 39.8 | 39.5 -1% | 45 13% | 37 -7% | 69 73% | 37 -7% |
| Response Times | -30% | -11% | -41% | -143% | -48% | |
| Response Time Grey 50% / Grey 80% * | 29 ? | 35.2 ? -21% | 30.4 ? -5% | 41 ? -41% | 74.4 ? -157% | 50.4 ? -74% |
| Response Time Black / White * | 18.6 ? | 31.2 ? -68% | 11.8 ? 37% | 26 ? -40% | 42.4 ? -128% | 27.6 ? -48% |
| PWM Frequency | 876 ? | 870 ? -1% | 304.9 ? -65% | 694.4 ? -21% | ||
| Screen | -22% | -73% | -10% | 43% | 13% | |
| Brightness middle | 958.4 | 956.9 0% | 1180.7 23% | 290 -70% | 1414.1 48% | 1284.3 34% |
| Brightness | 978 | 984 1% | 1102 13% | 282 -71% | 1282 31% | 1289 32% |
| Brightness Distribution | 86 | 84 -2% | 89 3% | 81 -6% | 84 -2% | 82 -5% |
| Black Level * | 0.96 | 0.81 16% | 1.91 -99% | 0.26 73% | 0.83 14% | 0.89 7% |
| Contrast | 998 | 1181 18% | 618 -38% | 1115 12% | 1704 71% | 1443 45% |
| Colorchecker dE 2000 * | 4.95 | 6.6 -33% | 13.45 -172% | 4.65 6% | 1.99 60% | 4.67 6% |
| Colorchecker dE 2000 max. * | 16.88 | 22.94 -36% | 22.52 -33% | 7.5 56% | 3.75 78% | 19.85 -18% |
| Colorchecker dE 2000 calibrated * | 1.96 | 4.05 -107% | 3.19 -63% | 3.98 -103% | 0.72 63% | 2.21 -13% |
| Greyscale dE 2000 * | 3.9 | 6 -54% | 15.4 -295% | 3.22 17% | 2.8 28% | 2.7 31% |
| Gamma | 2.14 103% | 2.19 100% | 1.97 112% | 2.54 87% | 2.06 107% | 1.97 112% |
| CCT | 7174 91% | 7276 89% | 21134 31% | 6169 105% | 6775 96% | 6222 104% |
| Color Space (Percent of AdobeRGB 1998) | 41.6 | |||||
| Color Space (Percent of sRGB) | 65.5 | |||||
| Total Average (Program / Settings) | -18% /
-19% | -24% /
-44% | -19% /
-13% | -9% /
23% | -14% /
-3% |
* ... smaller is better
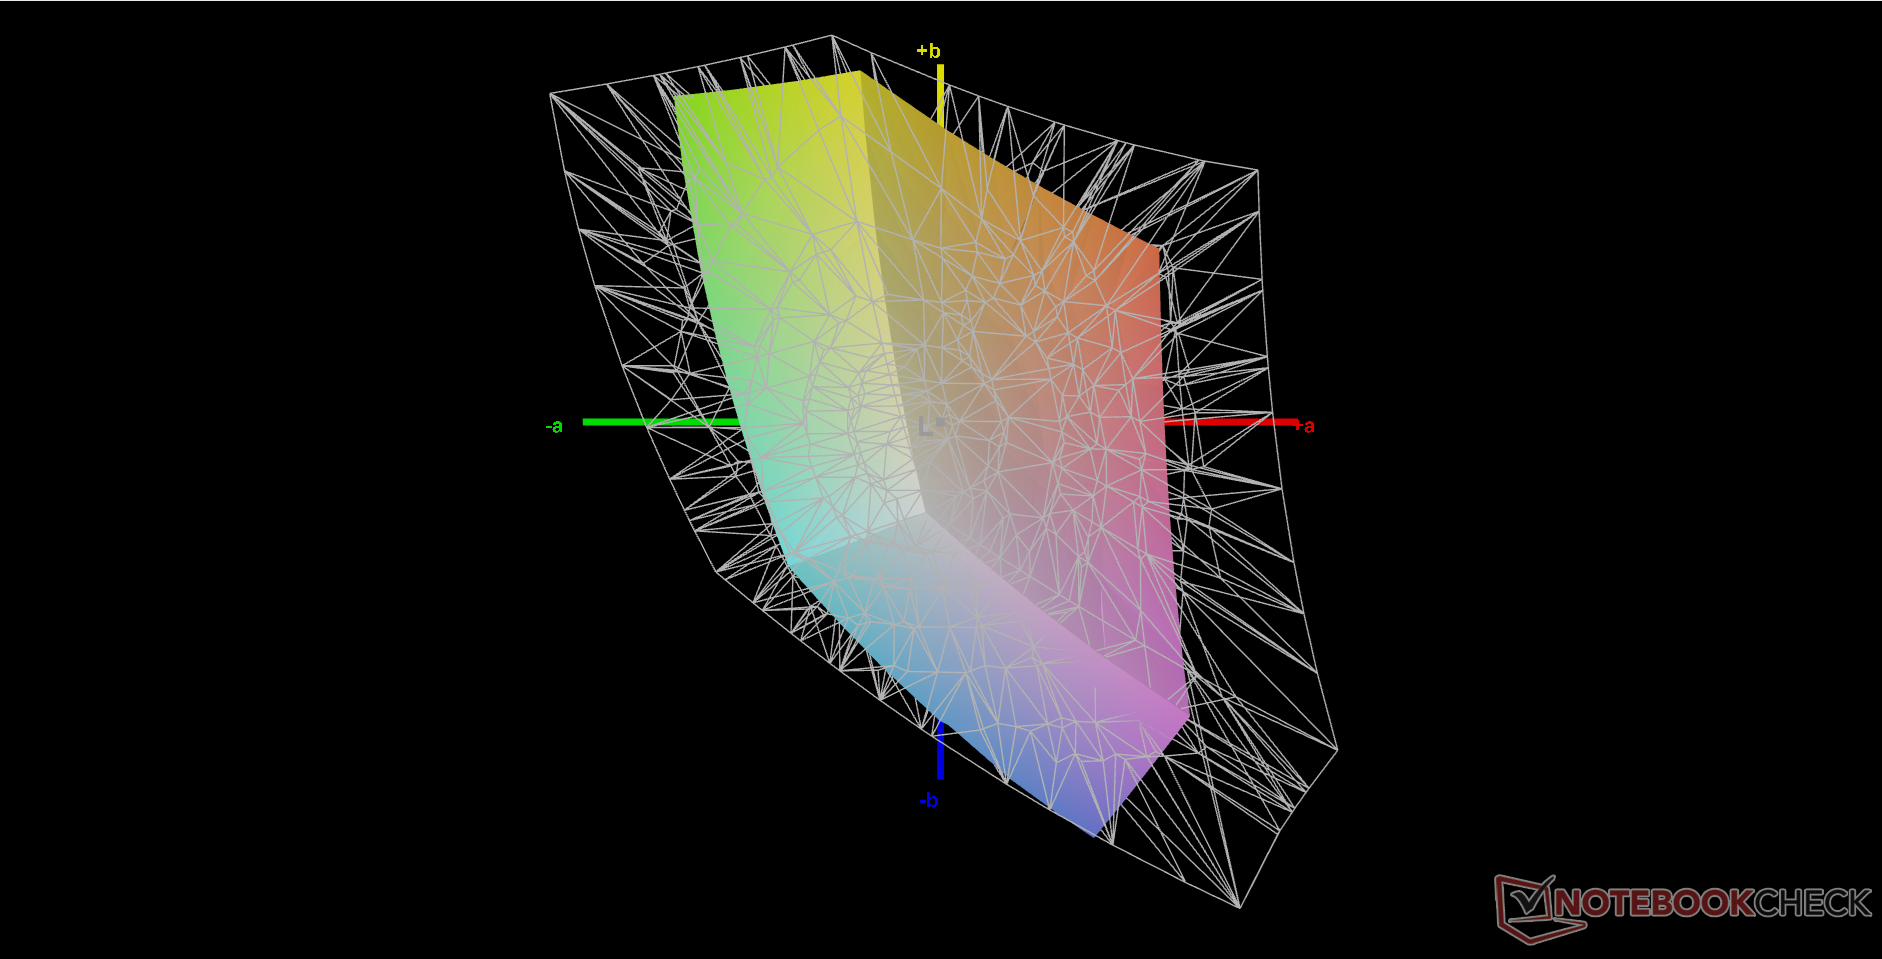
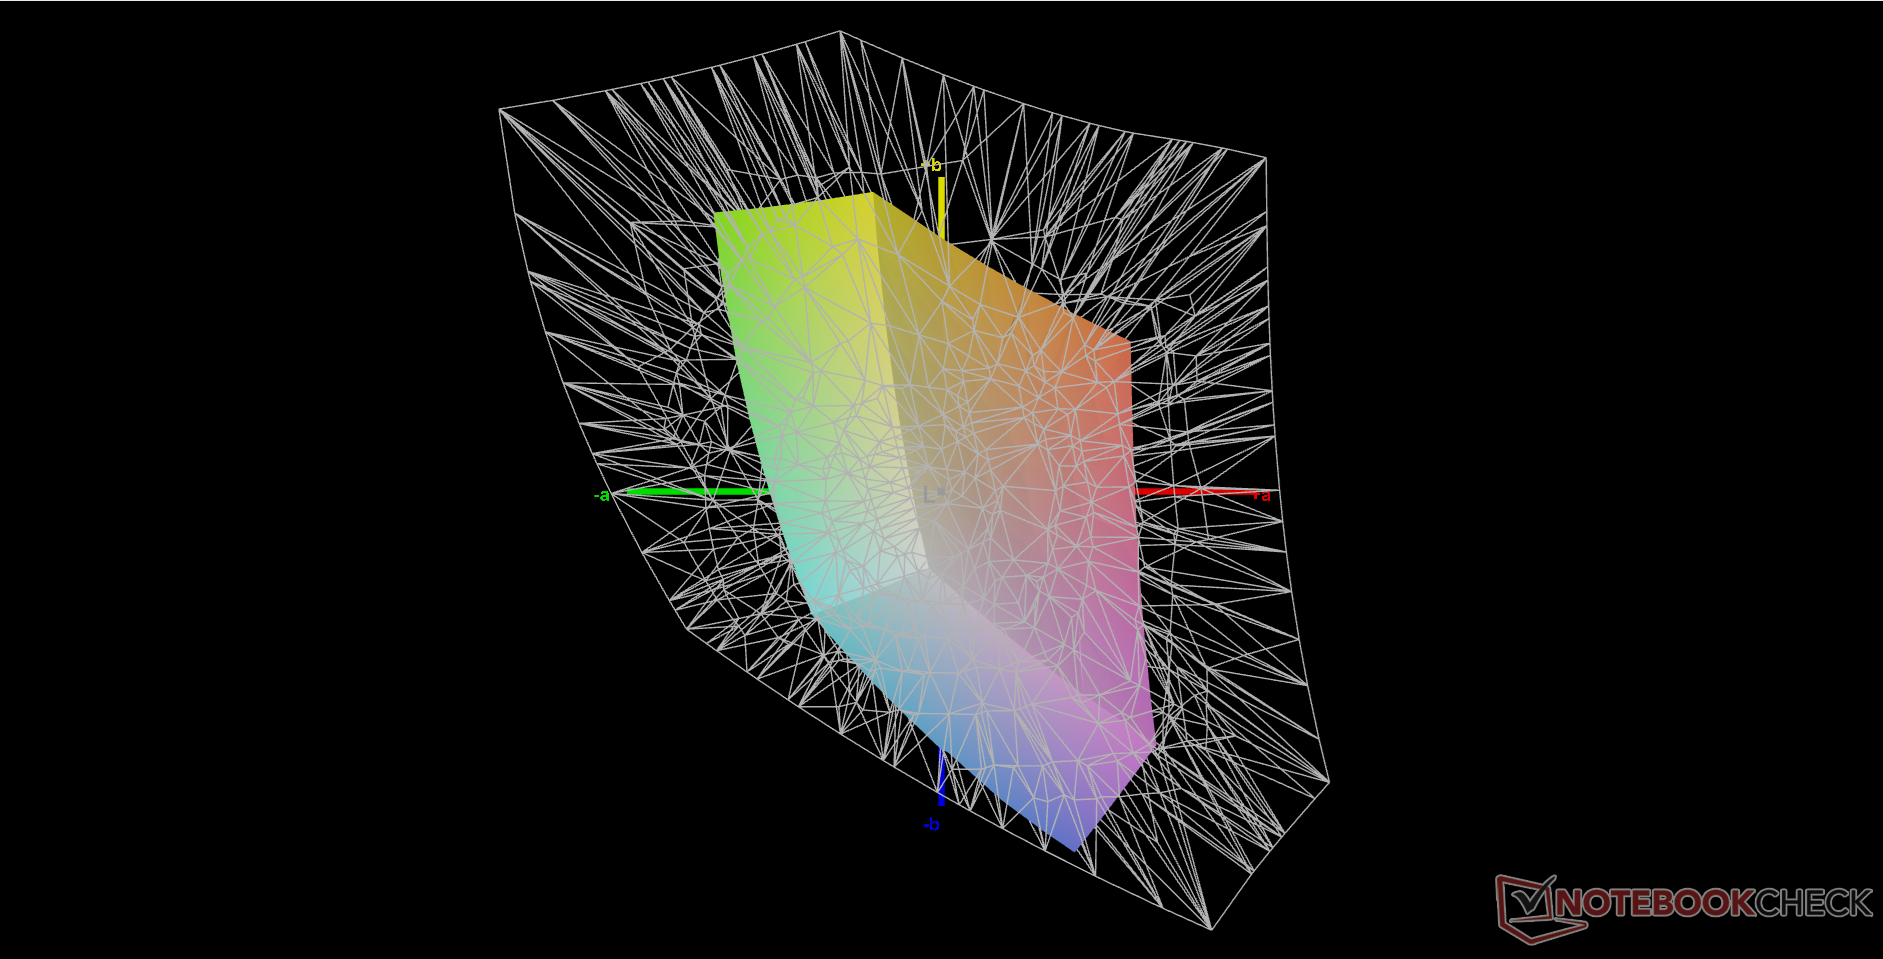
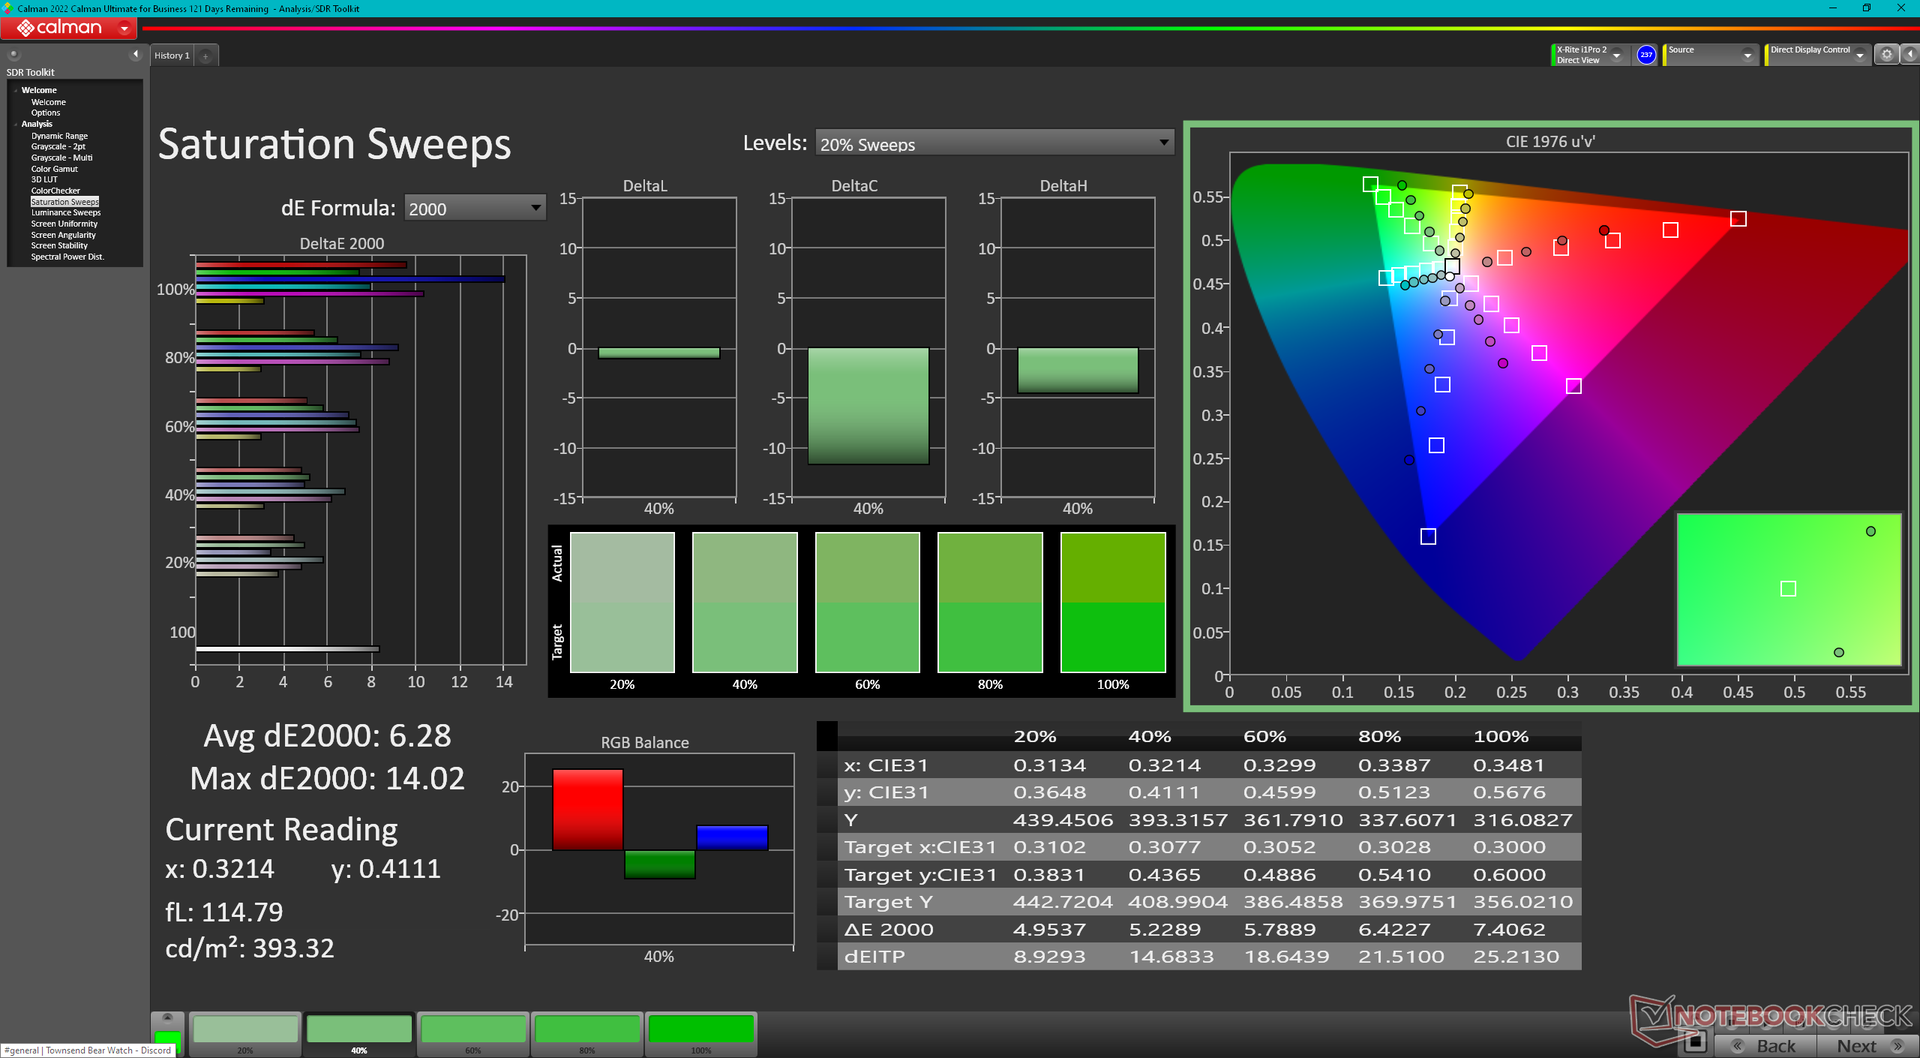
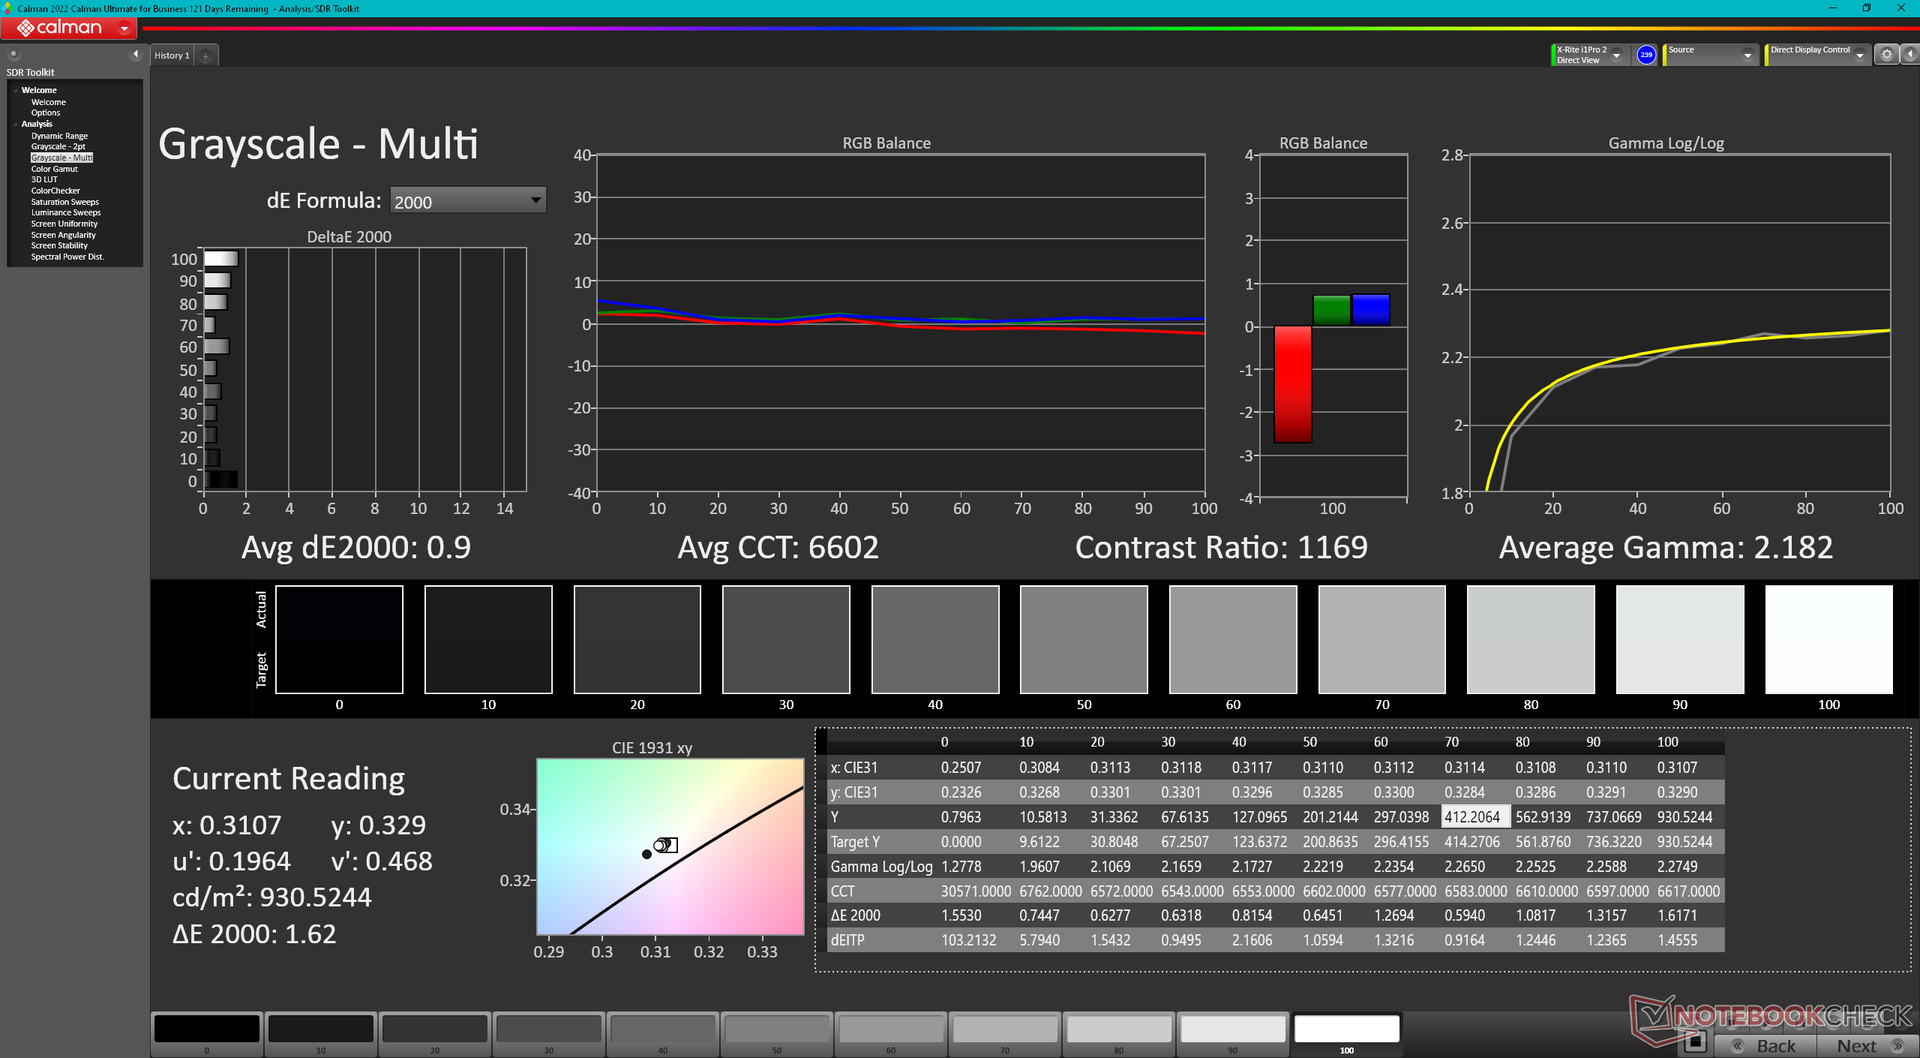
显示器的校准效果不佳,平均 deltaE 值大于 4,色温过低。使用我们的 X-Rite 色差计进行适当的校准可以解决这些问题,但由于上述有限的色彩空间,无论如何,色彩在饱和度较高时仍会变得更加不准确。我们建议使用我们校准过的 ICM 配置文件,以充分发挥显示器的性能。
Display Response Times
| ↔ Response Time Black to White | ||
|---|---|---|
| 18.6 ms ... rise ↗ and fall ↘ combined | ↗ 9.4 ms rise | 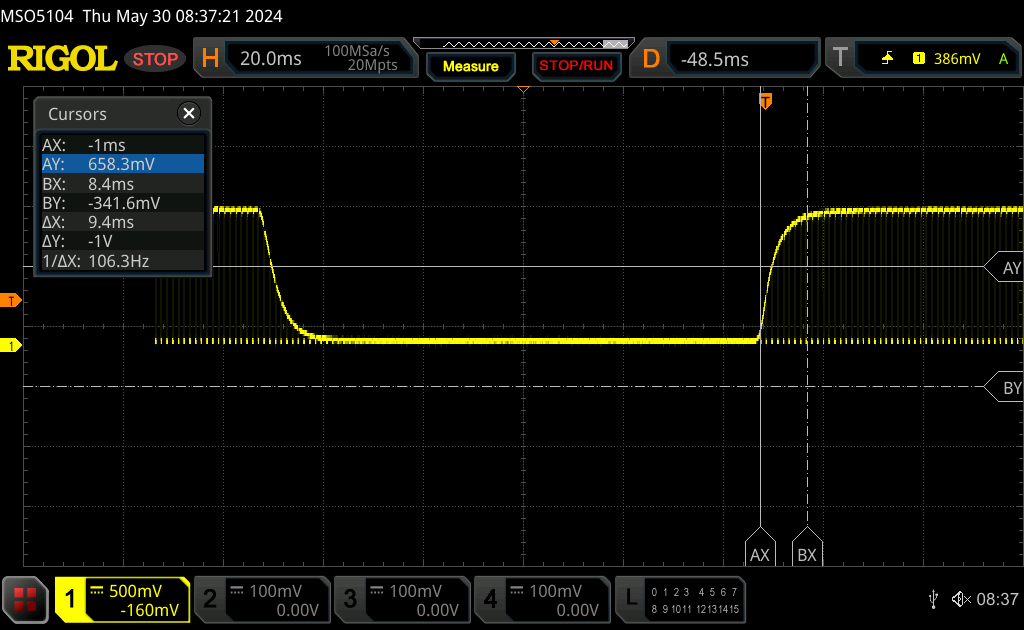 |
| ↘ 9.2 ms fall | ||
| The screen shows good response rates in our tests, but may be too slow for competitive gamers. In comparison, all tested devices range from 0.1 (minimum) to 240 (maximum) ms. » 38 % of all devices are better. This means that the measured response time is better than the average of all tested devices (20.7 ms). | ||
| ↔ Response Time 50% Grey to 80% Grey | ||
| 29 ms ... rise ↗ and fall ↘ combined | ↗ 14.6 ms rise | 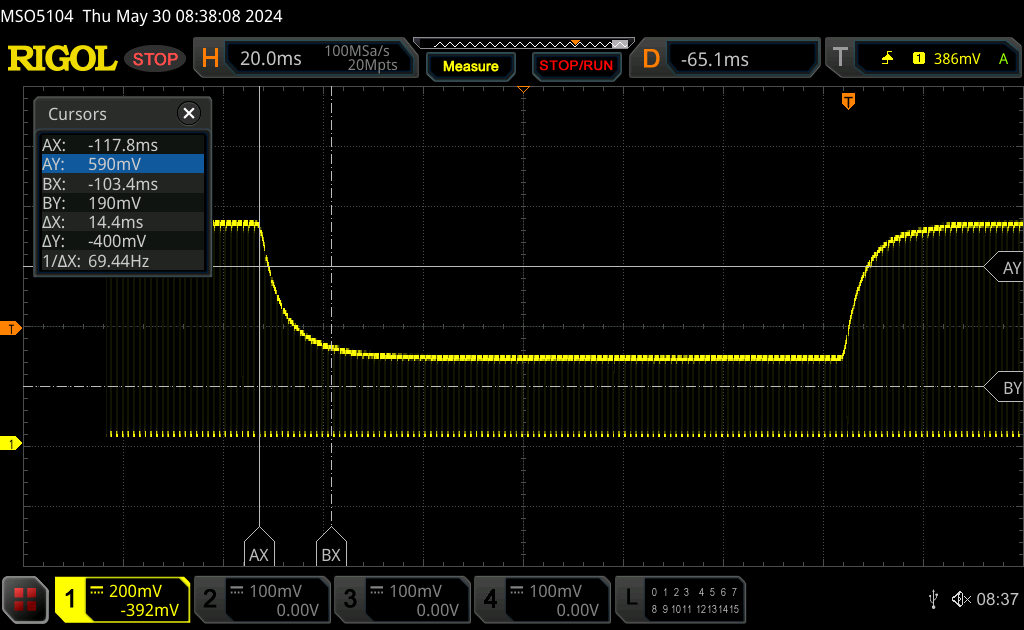 |
| ↘ 14.4 ms fall | ||
| The screen shows relatively slow response rates in our tests and may be too slow for gamers. In comparison, all tested devices range from 0.165 (minimum) to 636 (maximum) ms. » 36 % of all devices are better. This means that the measured response time is better than the average of all tested devices (32.5 ms). | ||
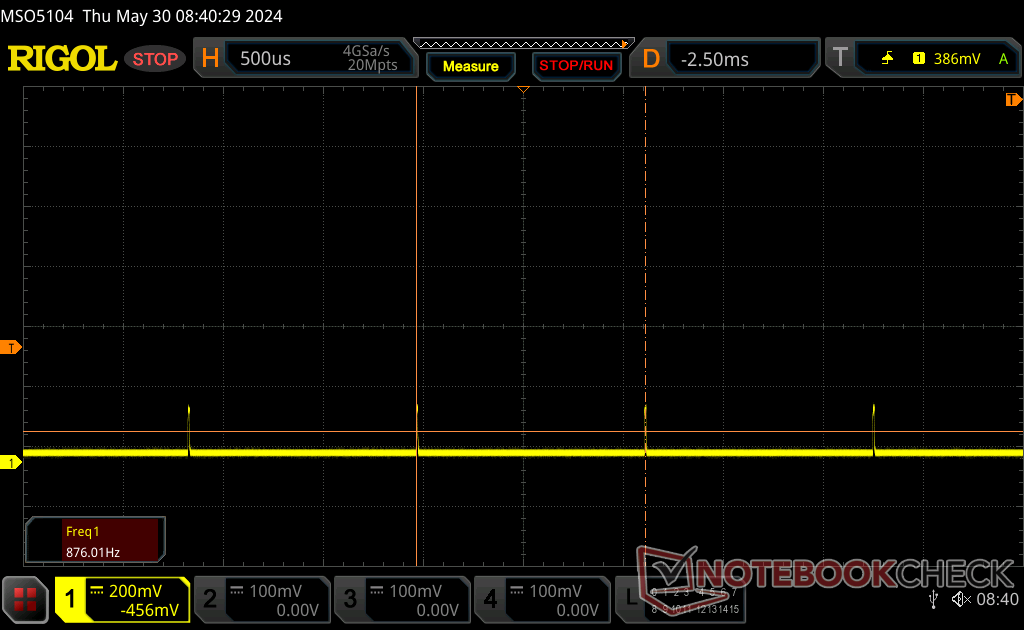
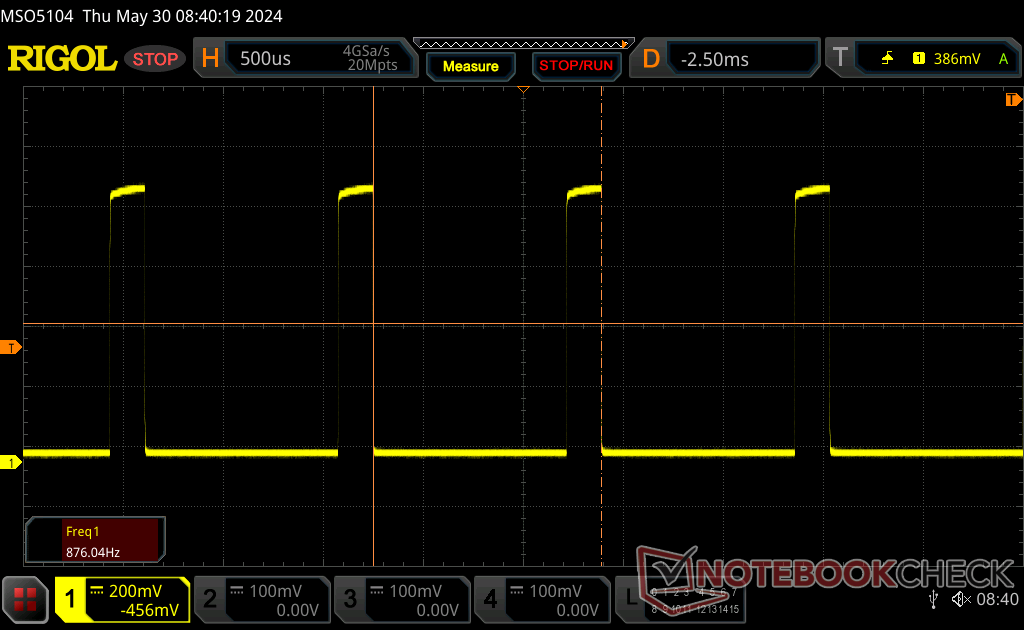
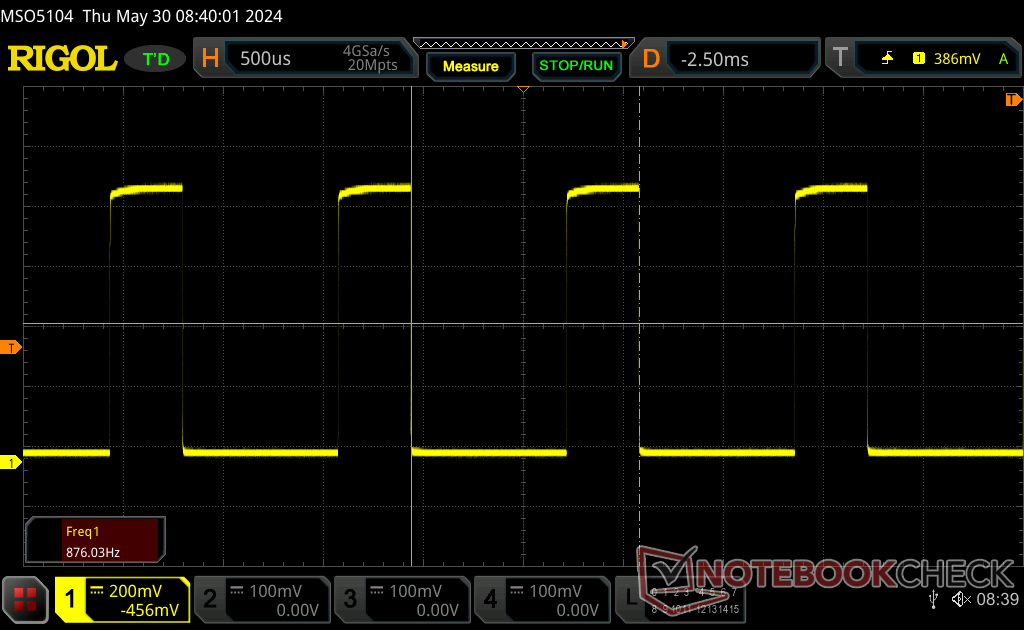
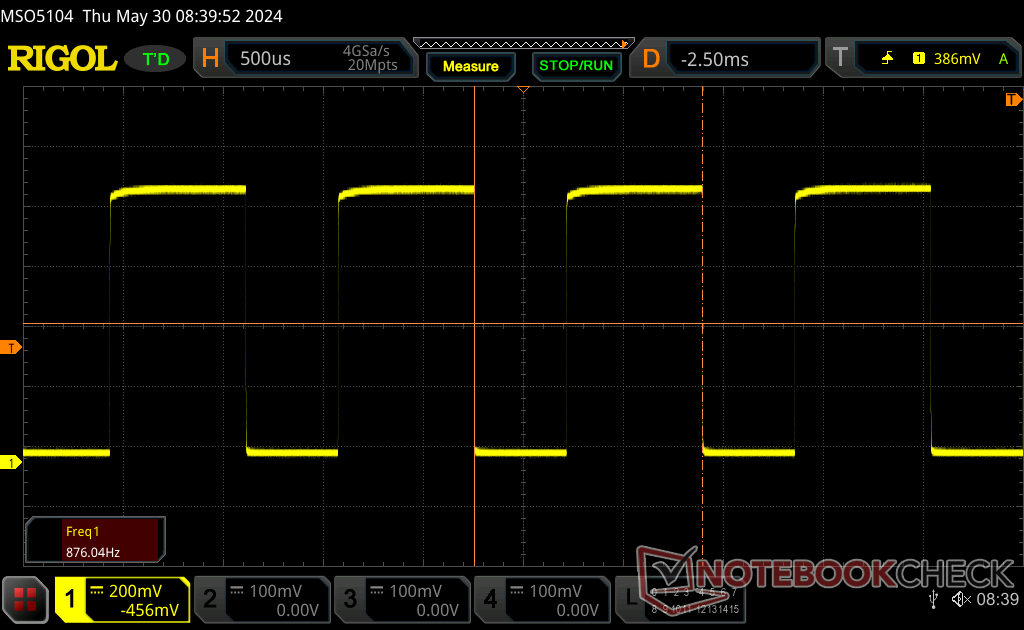
Screen Flickering / PWM (Pulse-Width Modulation)
| Screen flickering / PWM detected | 876 Hz | ≤ 100 % brightness setting | 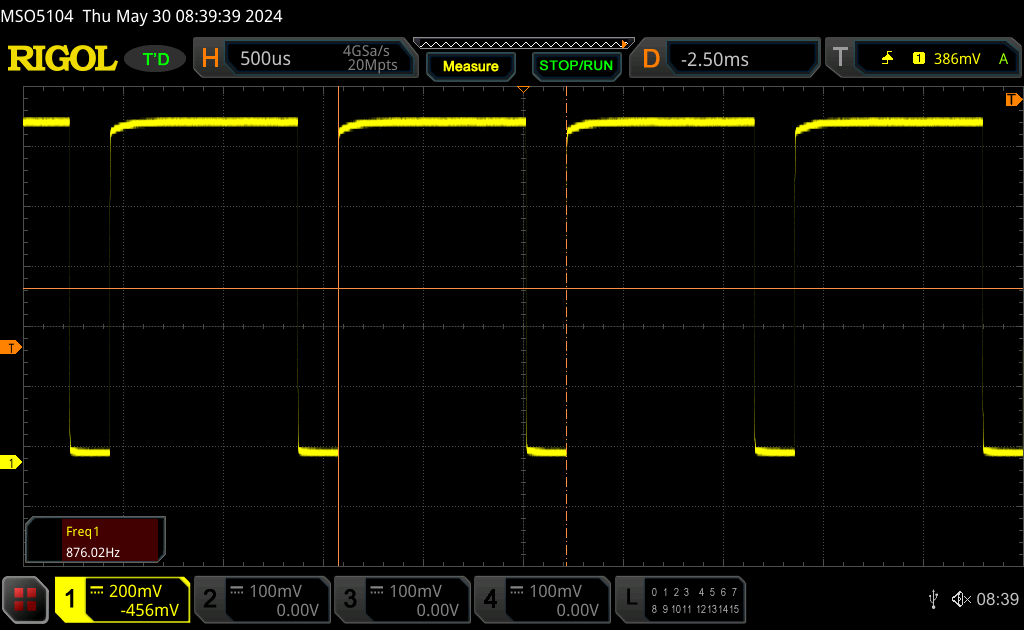 |
The display backlight flickers at 876 Hz (worst case, e.g., utilizing PWM) Flickering detected at a brightness setting of 100 % and below. There should be no flickering or PWM above this brightness setting. The frequency of 876 Hz is quite high, so most users sensitive to PWM should not notice any flickering. In comparison: 53 % of all tested devices do not use PWM to dim the display. If PWM was detected, an average of 8492 (minimum: 5 - maximum: 343500) Hz was measured. | |||
在所有亮度级别上都会出现频率为 876 Hz 的脉宽调制或闪烁。对闪烁敏感的用户可能需要避免长时间使用屏幕,或至少降低亮度。
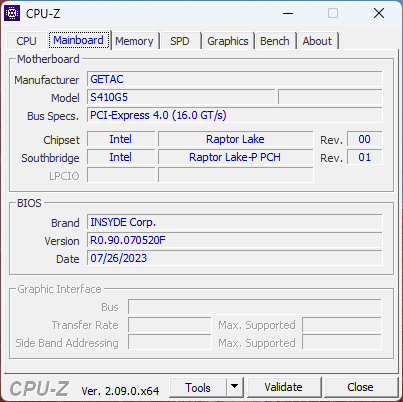
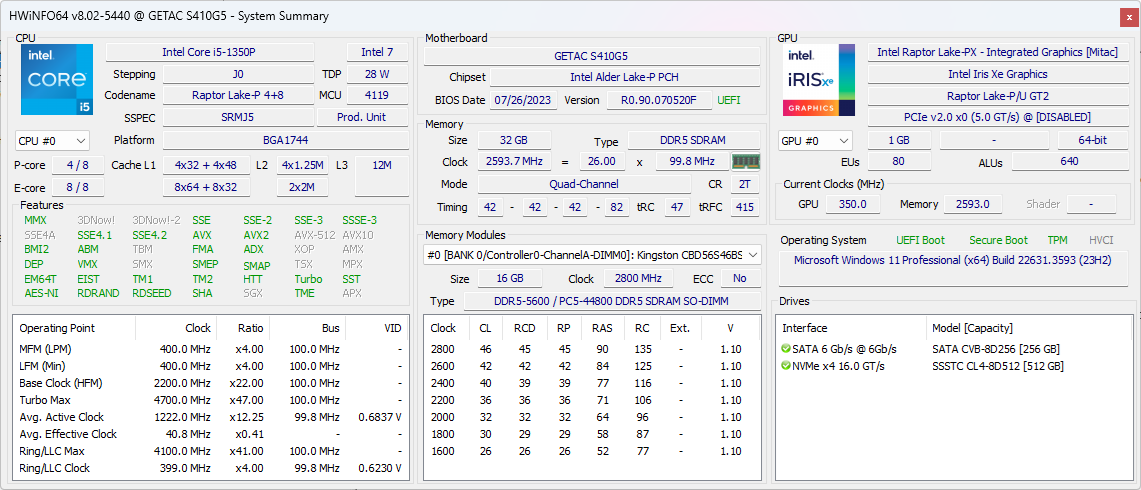
性能 - Raptor Lake-P 升级
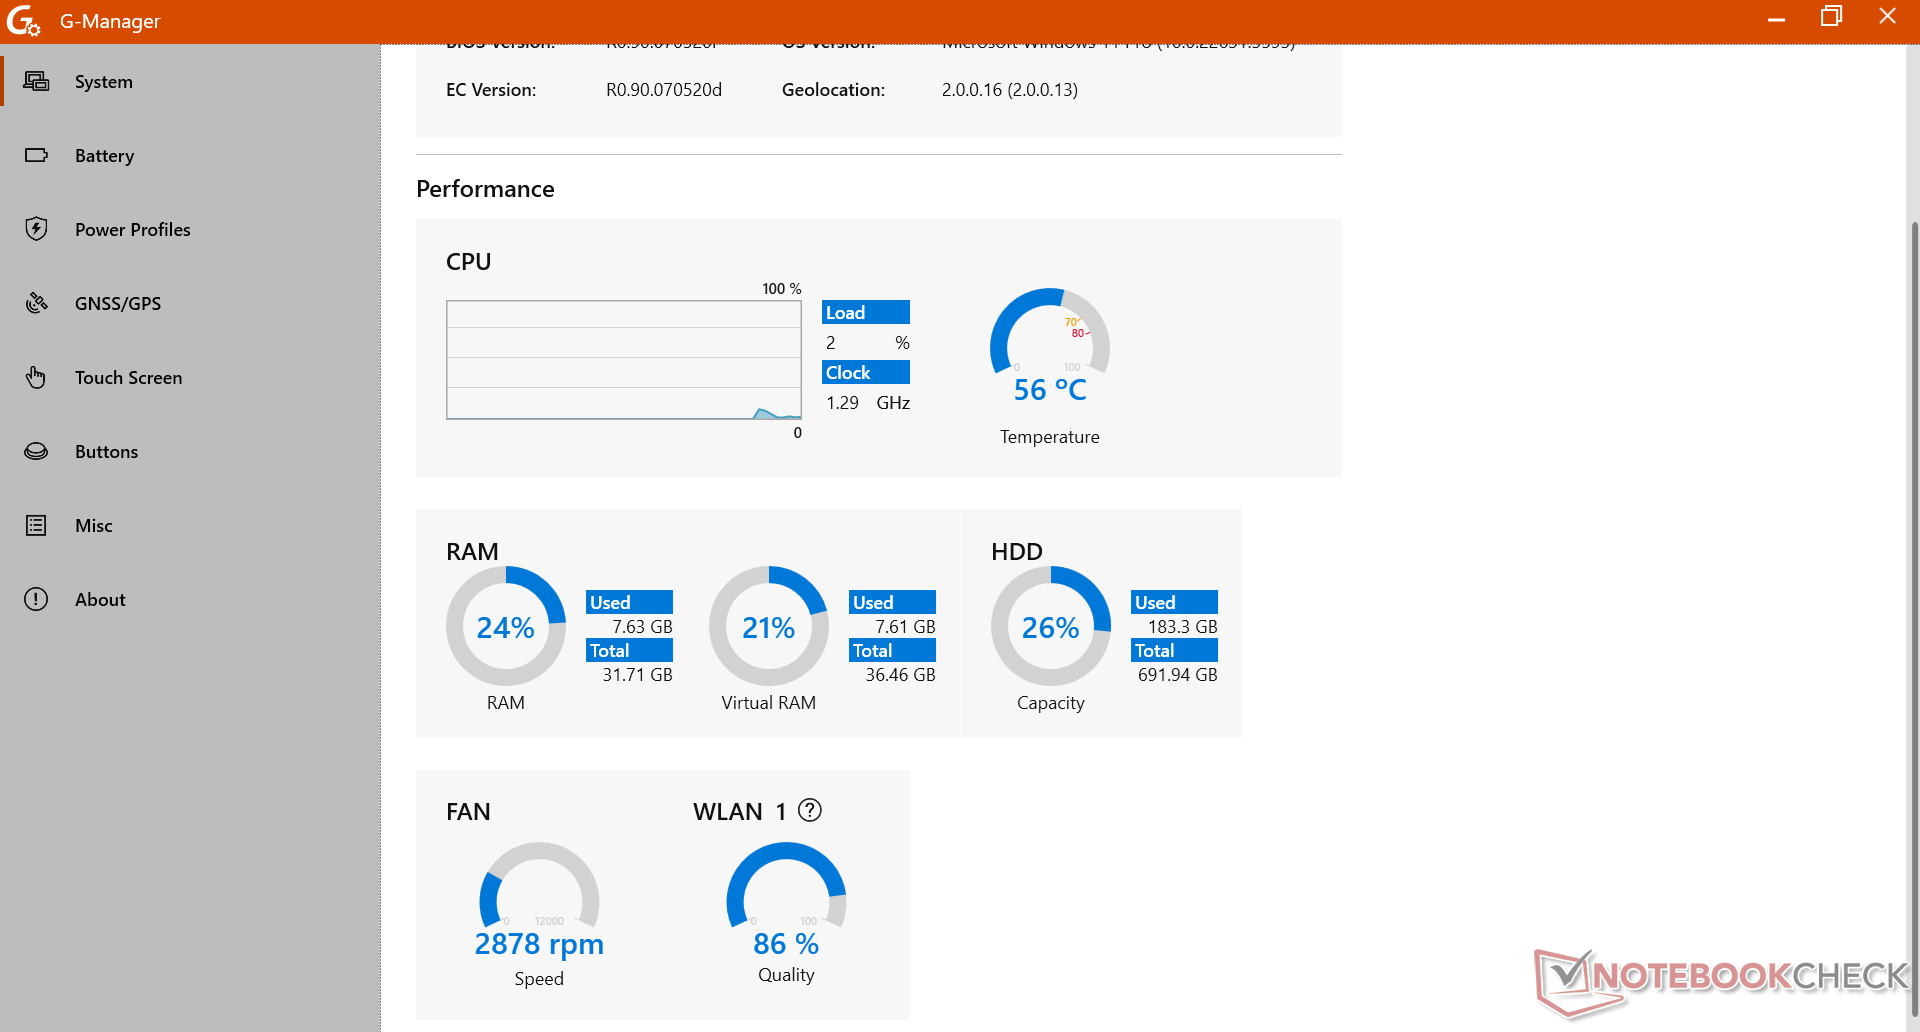
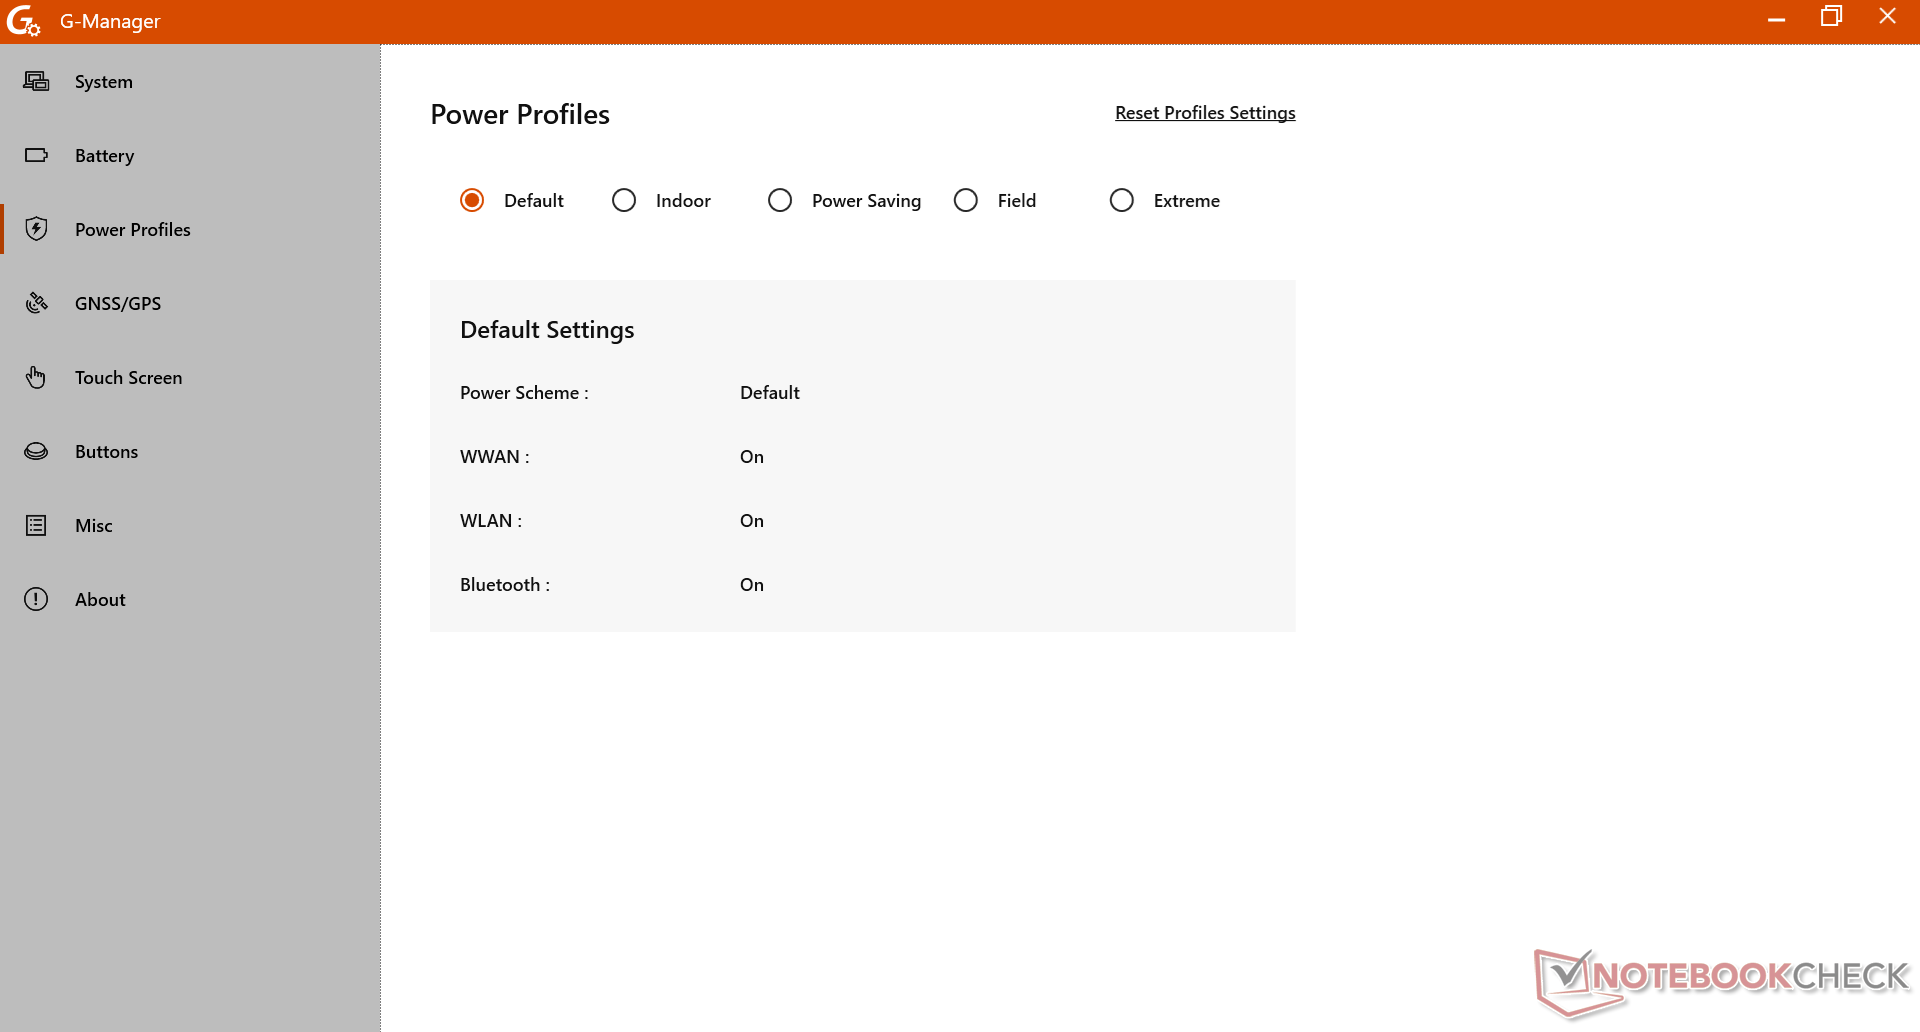
测试条件
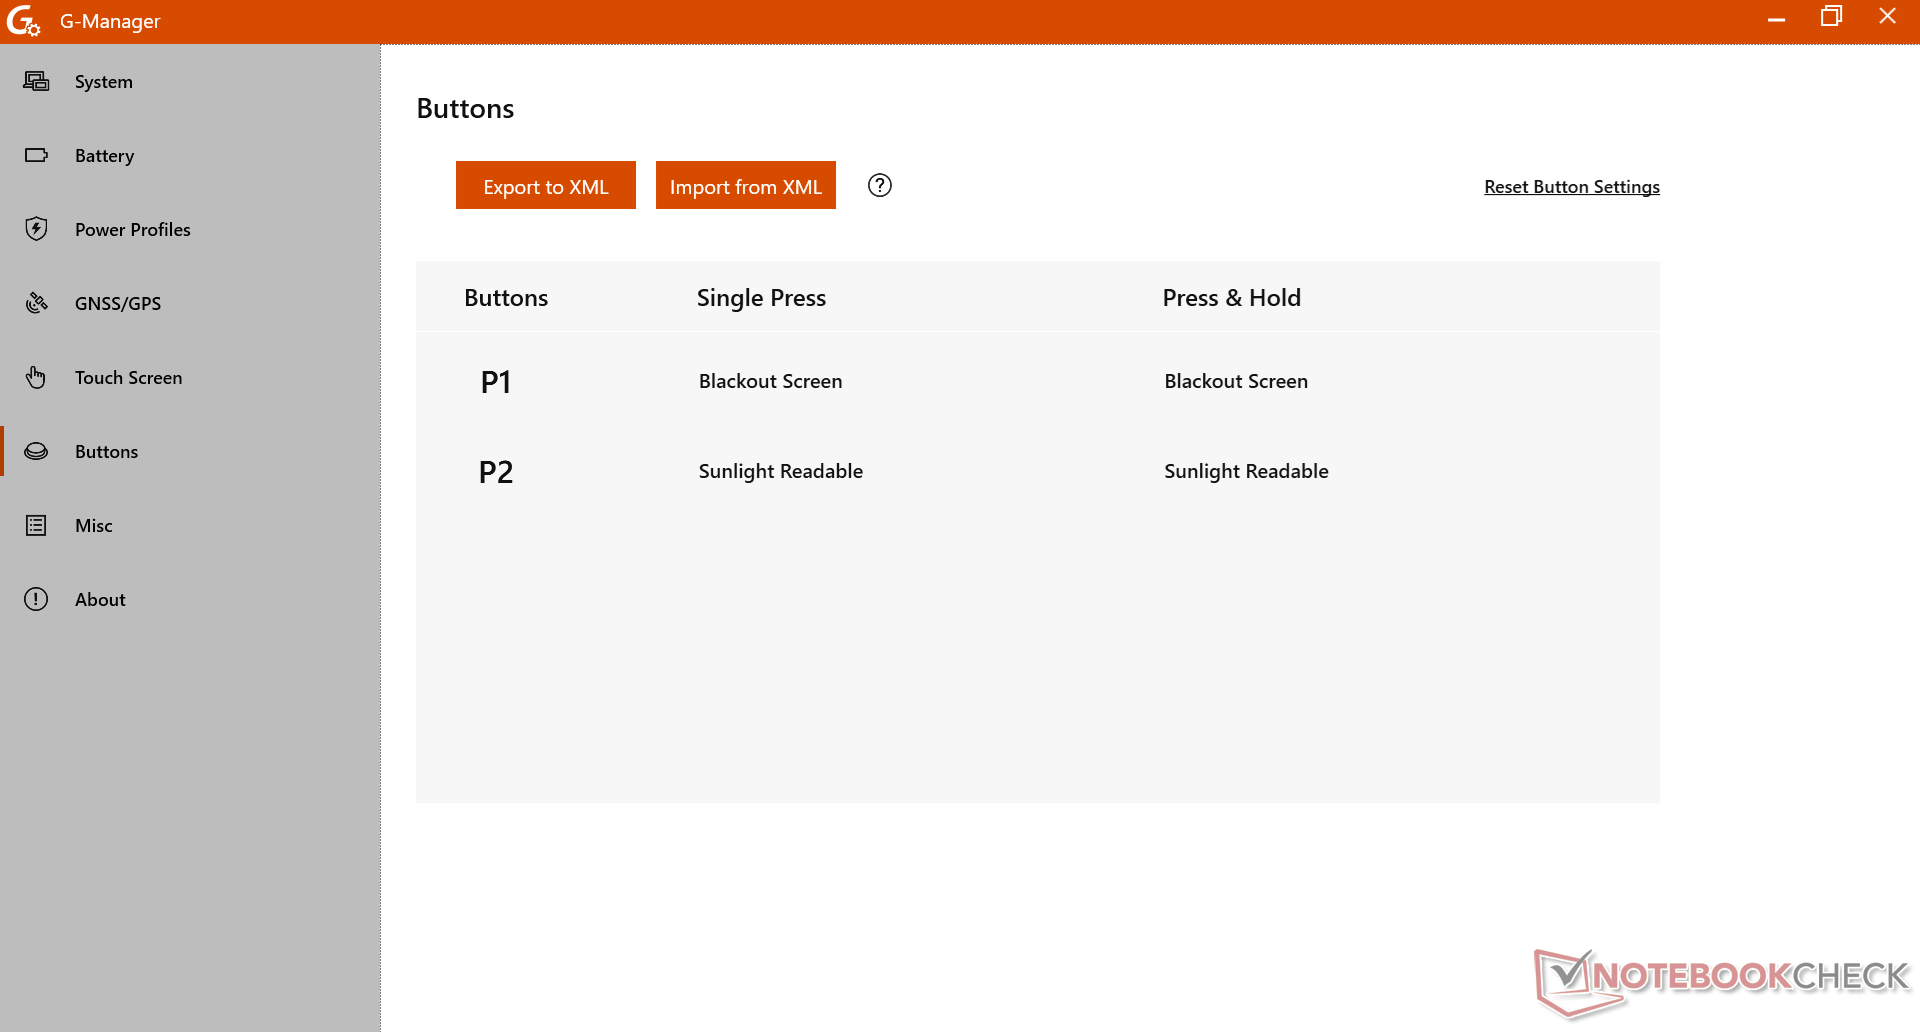
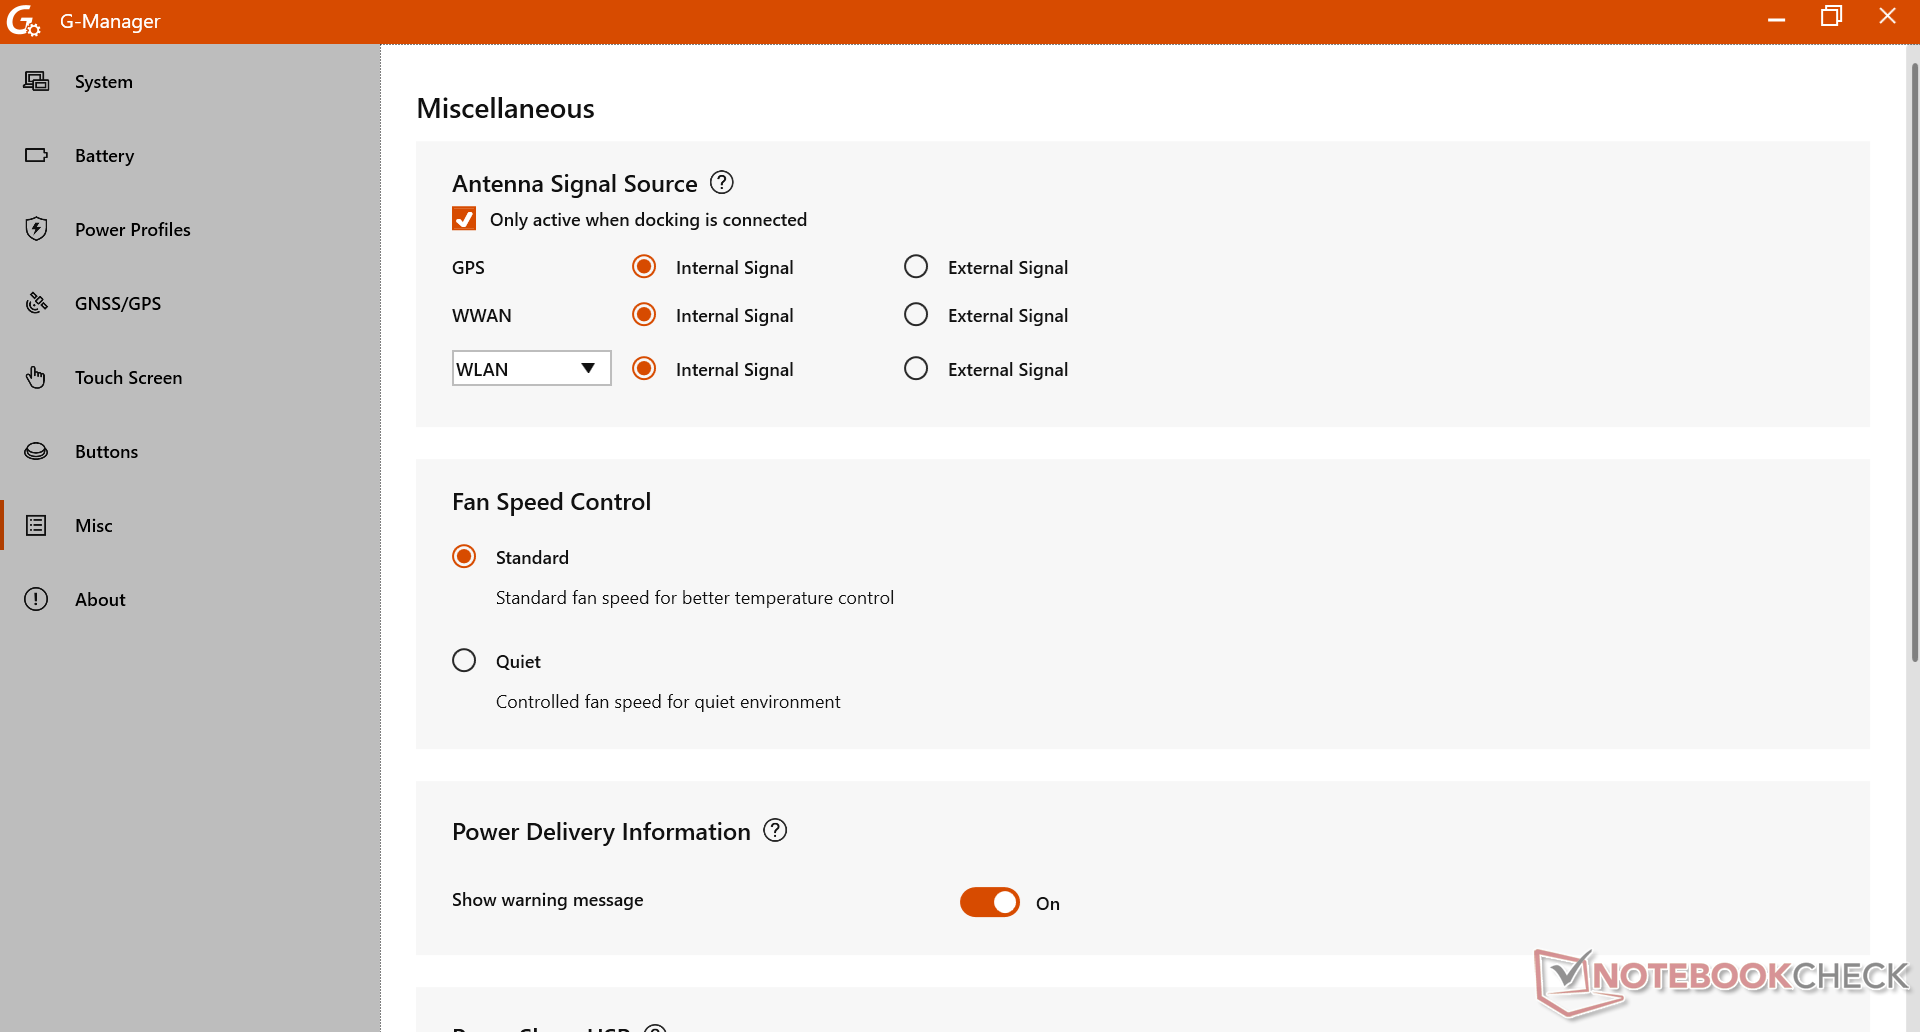
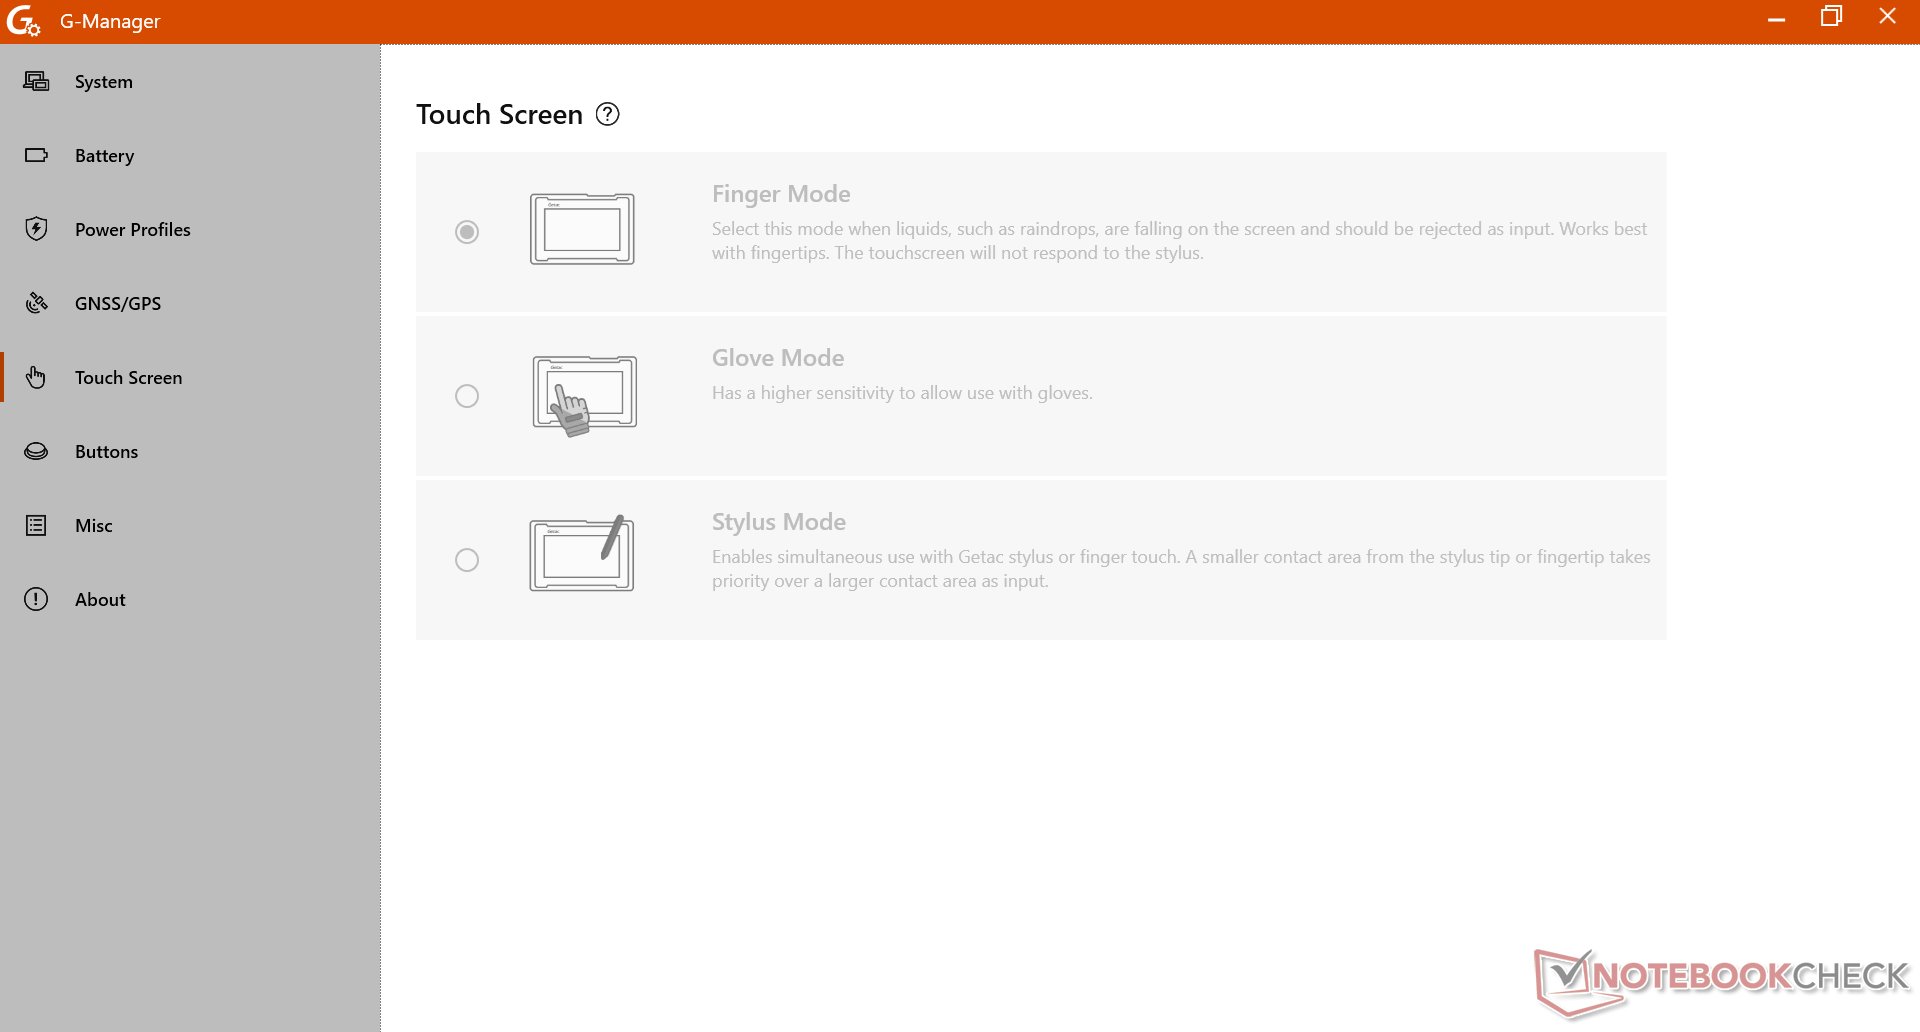
在运行下面的基准测试之前,我们将 Windows 设置为高性能模式,将 G-Manager 设置为极致性能模式。我们建议用户熟悉 G-Manager 功能,因为它是调整 S410 若干独特功能的中心,包括集成 GPS/GNSS、自定义按钮和触摸屏灵敏度。
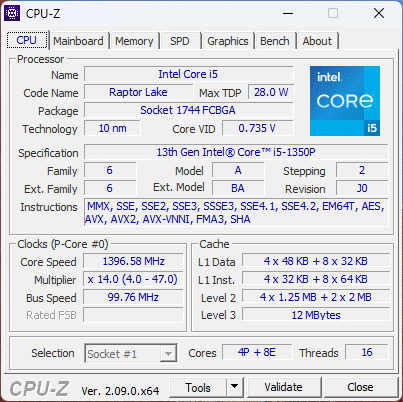
处理器
性能从 酷睿 i7-1185G7到我们较新的 酷睿 i5-1350P在多线程工作负载方面,Raptor Lake-P CPU 可比Tiger Lake-U 快 2 倍以上,因此性能提升非常明显。不过,正如下面的 CineBench R15 xT 循环测试图所示,Turbo Boost 的性能有限。尽管如此,即使考虑到陡峭的节流,系统仍然比以前快得多。
Cinebench R15 Multi Loop
Cinebench R23: Multi Core | Single Core
Cinebench R20: CPU (Multi Core) | CPU (Single Core)
Cinebench R15: CPU Multi 64Bit | CPU Single 64Bit
Blender: v2.79 BMW27 CPU
7-Zip 18.03: 7z b 4 | 7z b 4 -mmt1
Geekbench 6.4: Multi-Core | Single-Core
Geekbench 5.5: Multi-Core | Single-Core
HWBOT x265 Benchmark v2.2: 4k Preset
LibreOffice : 20 Documents To PDF
R Benchmark 2.5: Overall mean
| CPU Performance Rating | |
| Getac S410 G5 | |
| Average Intel Core i5-1350P | |
| Dell Latitude 7330 Rugged Extreme -2! | |
| Panasonic Toughbook FZ-55 MK2 -4! | |
| Getac S410 Gen 4 -2! | |
| Dell Latitude 14 5420-D2G5W -2! | |
| Panasonic Toughbook 40 -2! | |
| Durabook S14I -2! | |
| Panasonic Toughbook FZ-55 -14! | |
| Getac B360 -3! | |
| Getac S410 -14! | |
* ... smaller is better
AIDA64: FP32 Ray-Trace | FPU Julia | CPU SHA3 | CPU Queen | FPU SinJulia | FPU Mandel | CPU AES | CPU ZLib | FP64 Ray-Trace | CPU PhotoWorxx
| Performance Rating | |
| Getac S410 G5 | |
| Average Intel Core i5-1350P | |
| Dell Latitude 7330 Rugged Extreme | |
| Dell Latitude 14 5420-D2G5W | |
| Getac S410 Gen 4 | |
| Panasonic Toughbook 40 | |
| Durabook S14I | |
系统性能
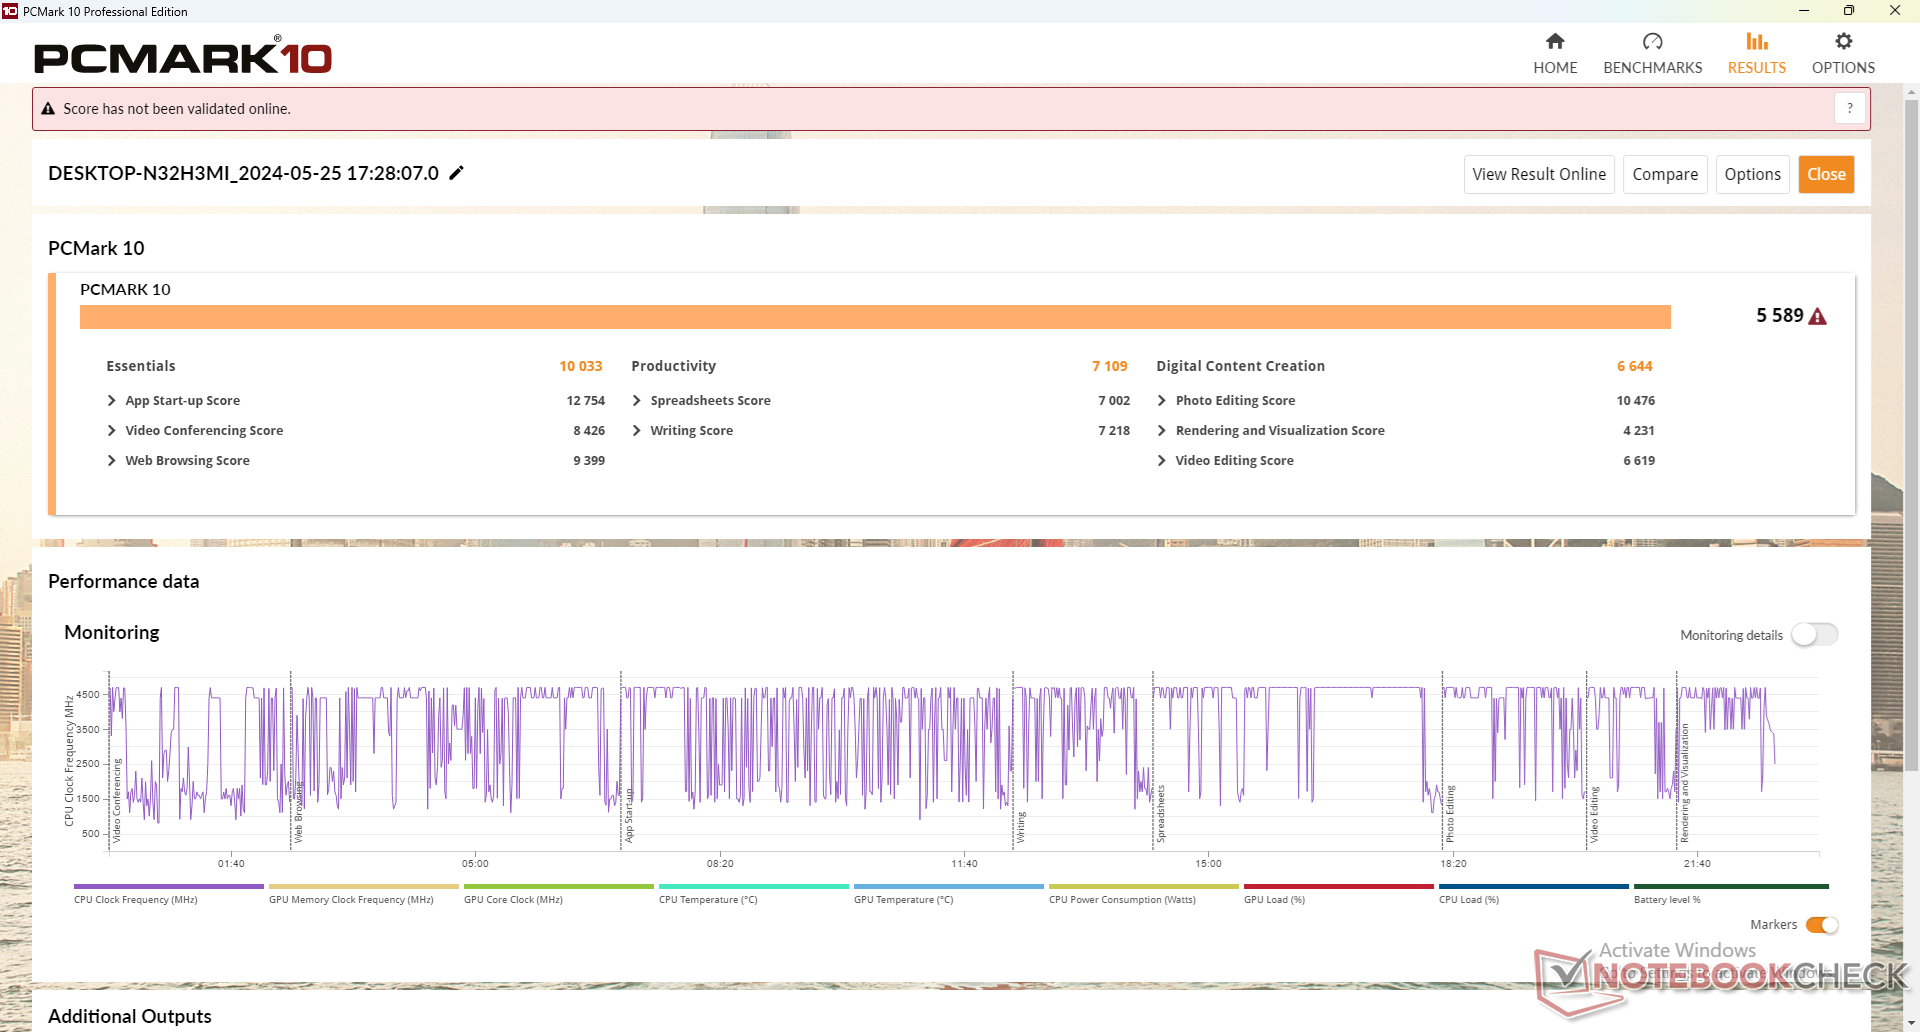
PCMark 结果始终高于去年的机型,反映了更新处理器带来的更快的整体性能。
CrossMark: Overall | Productivity | Creativity | Responsiveness
WebXPRT 3: Overall
WebXPRT 4: Overall
Mozilla Kraken 1.1: Total
| PCMark 10 / Score | |
| Getac S410 G5 | |
| Average Intel Core i5-1350P, Intel Iris Xe Graphics G7 80EUs (n=1) | |
| Dell Latitude 7330 Rugged Extreme | |
| Panasonic Toughbook 40 | |
| Durabook S14I | |
| Getac S410 Gen 4 | |
| Dell Latitude 14 5420-D2G5W | |
* ... smaller is better
| PCMark 10 Score | 5589 points | |
Help | ||
| AIDA64 / Memory Copy | |
| Dell Latitude 7330 Rugged Extreme | |
| Getac S410 G5 | |
| Average Intel Core i5-1350P (n=1) | |
| Getac S410 Gen 4 | |
| Panasonic Toughbook 40 | |
| Durabook S14I | |
| Dell Latitude 14 5420-D2G5W | |
* ... smaller is better
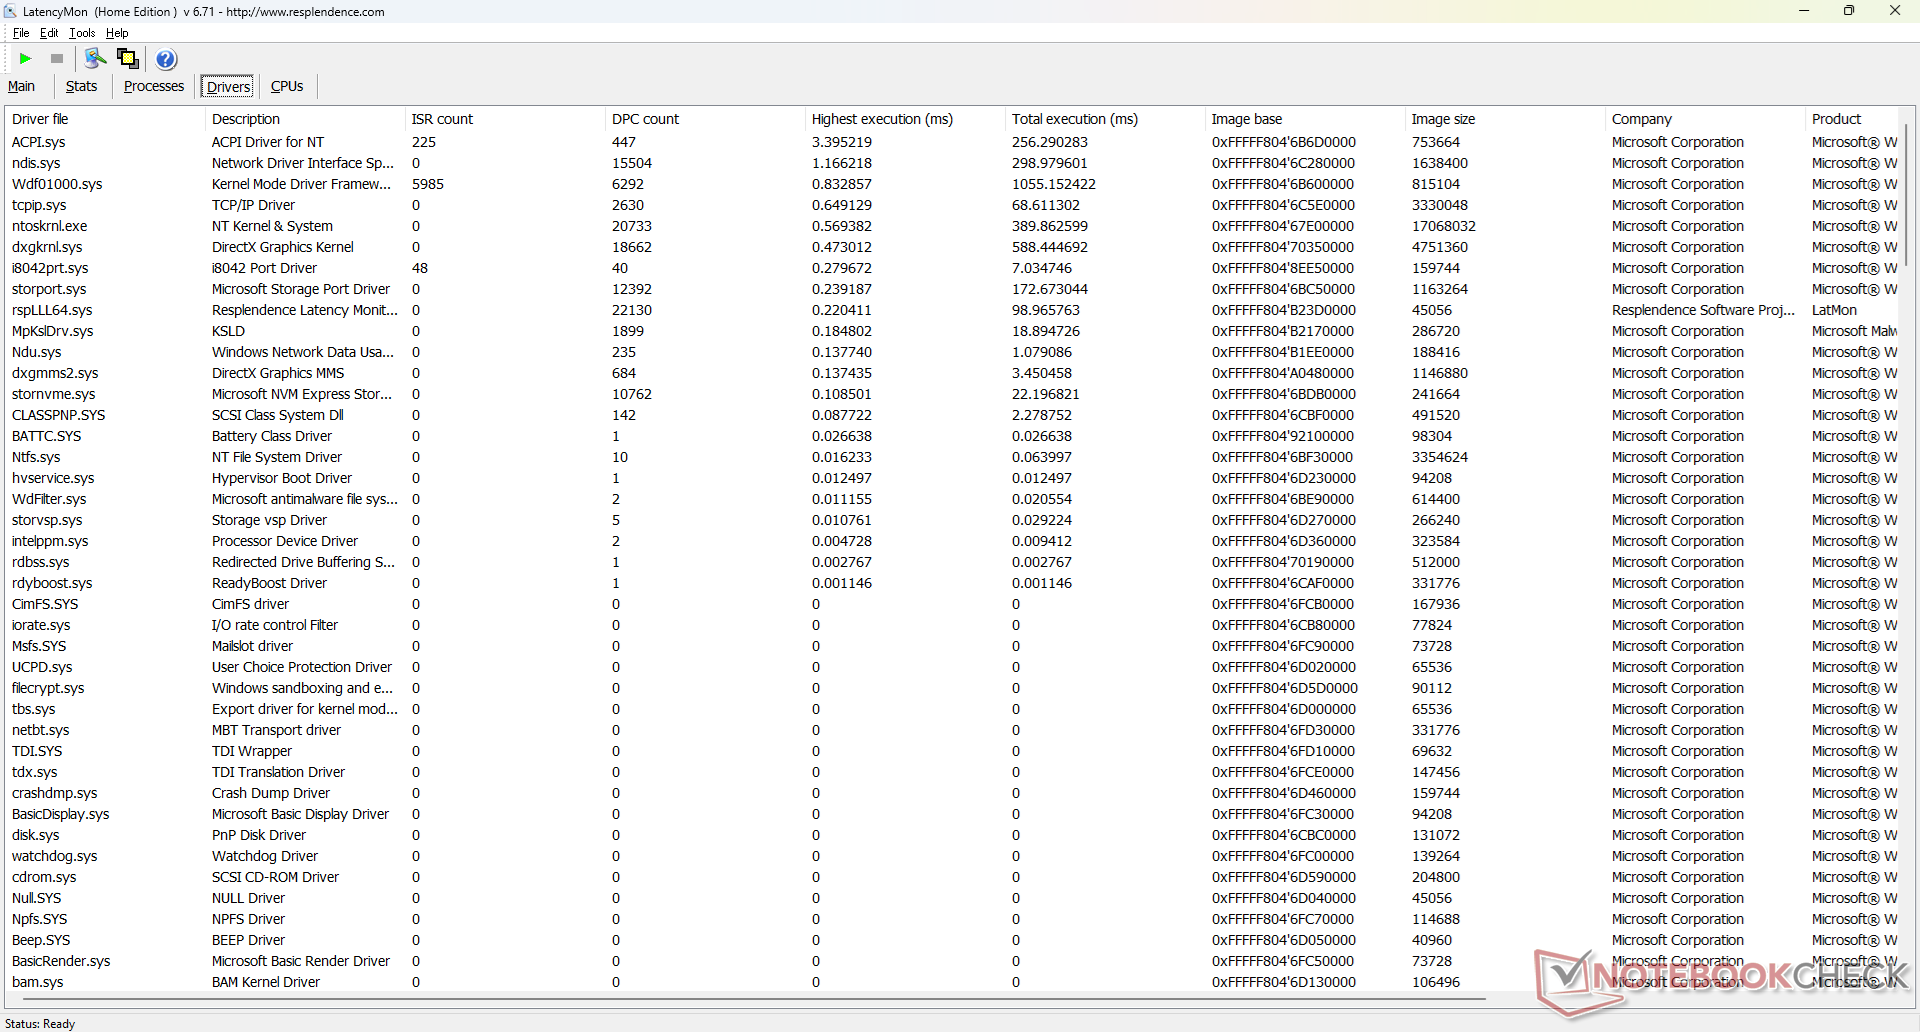
DPC 延迟
在打开我们主页的多个浏览器标签页时,会出现轻微的 DPC 问题。在其他方面,以 60 FPS 播放 4K 视频也非常完美,没有跳帧记录。
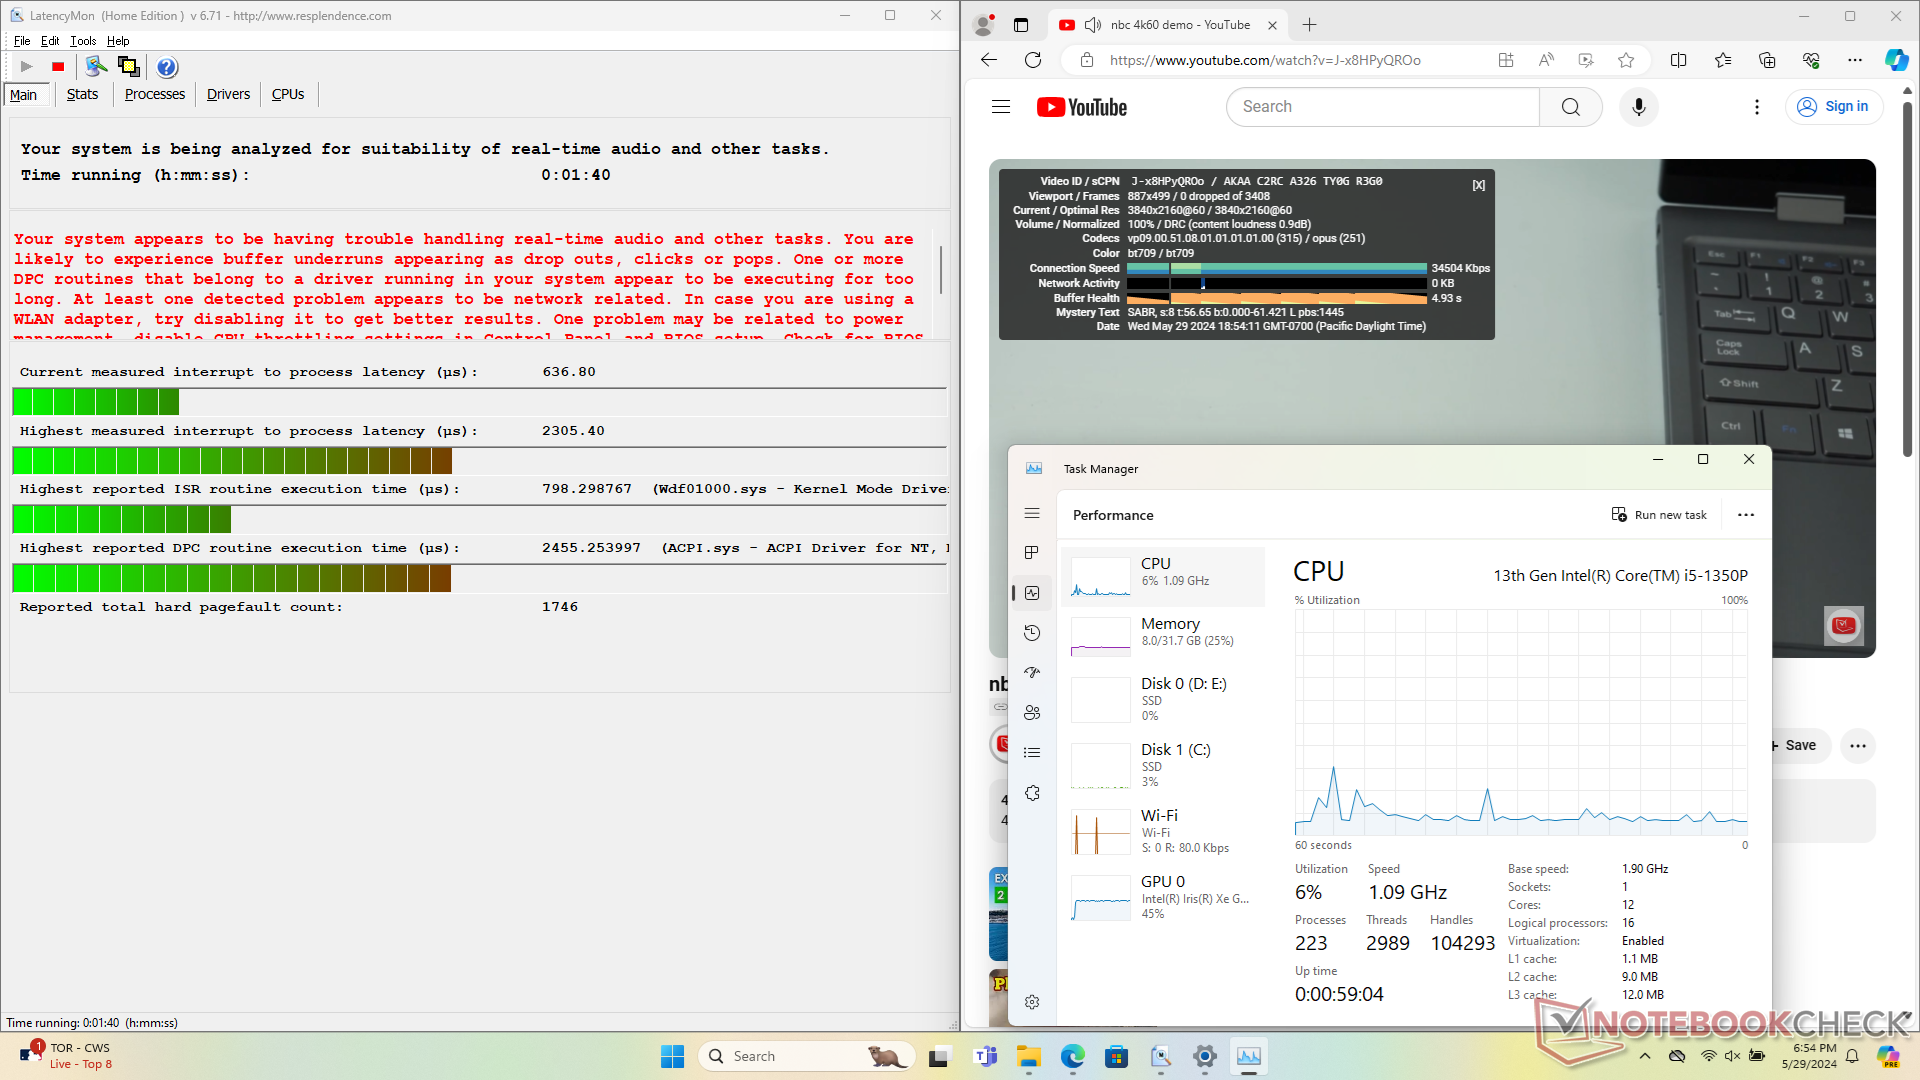
| DPC Latencies / LatencyMon - interrupt to process latency (max), Web, Youtube, Prime95 | |
| Dell Latitude 14 5420-D2G5W | |
| Getac S410 G5 | |
| Durabook S14I | |
| Getac S410 Gen 4 | |
| Panasonic Toughbook 40 | |
| Dell Latitude 7330 Rugged Extreme | |
* ... smaller is better
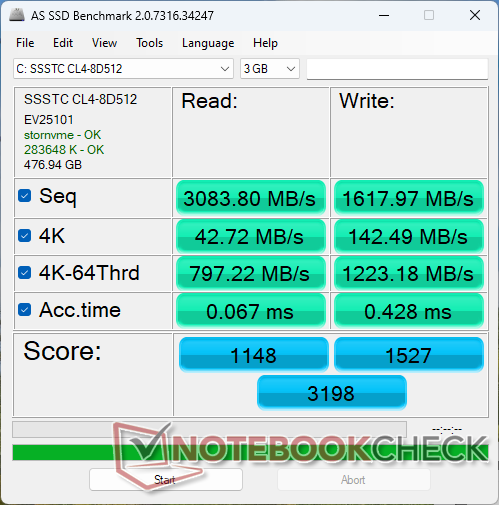
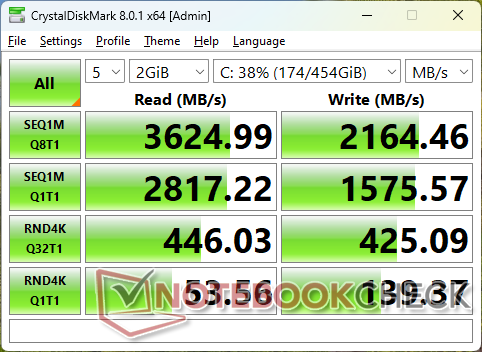
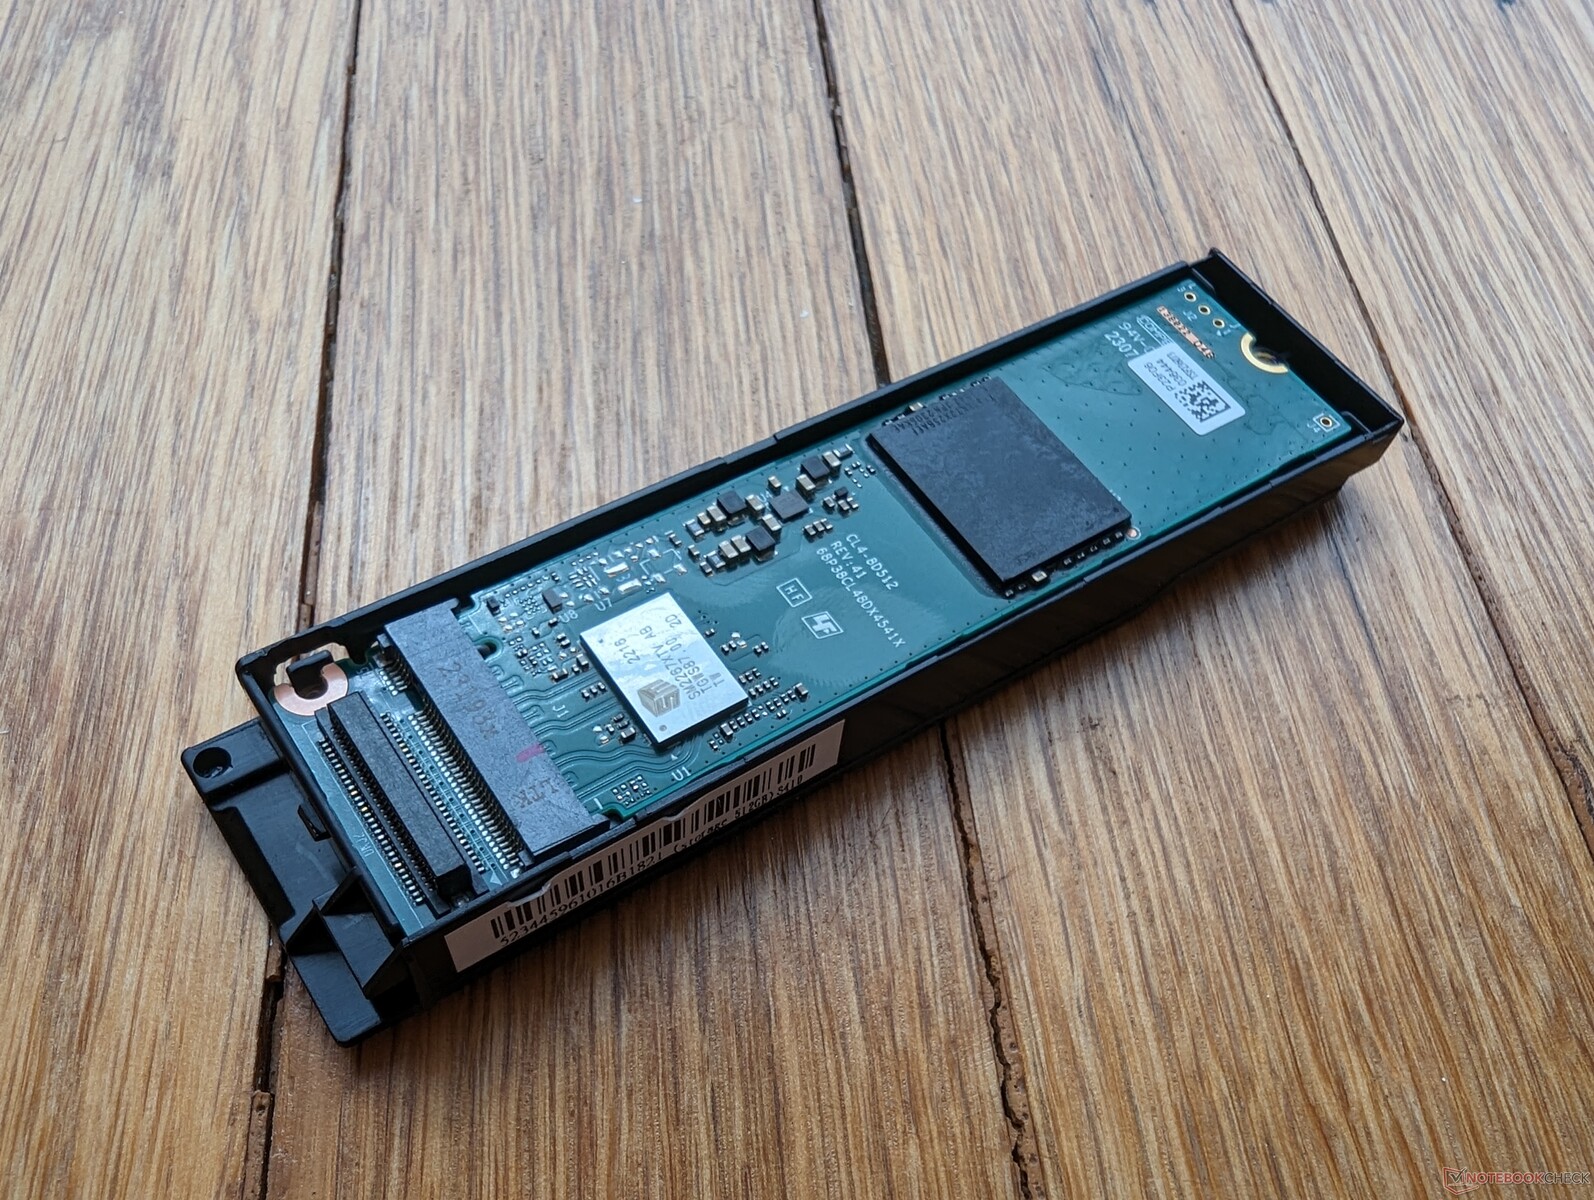
存储设备
我们的测试设备配有 SSSTC CL4-8D512而较旧的 S410 G4 配备的是 SSSTC CA5-8D256。较新的硬盘在各方面的速度都更快一些,但它仍然比其他大多数硬盘的访问时间稍长。

| Drive Performance Rating - Percent | |
| Dell Latitude 7330 Rugged Extreme | |
| Getac S410 G5 | |
| Durabook S14I | |
| Panasonic Toughbook 40 | |
| Dell Latitude 14 5420-D2G5W | |
| Getac S410 Gen 4 | |
* ... smaller is better
Disk Throttling: DiskSpd Read Loop, Queue Depth 8
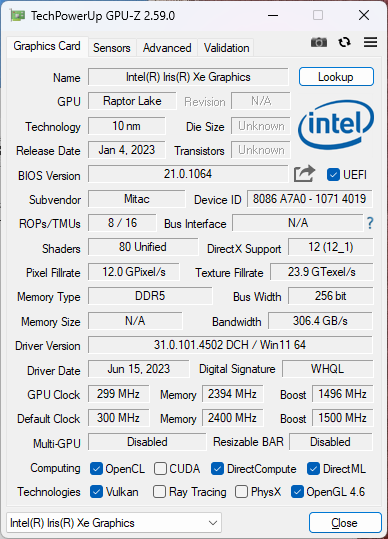
GPU 性能--Iris Xe 再度登场
Tiger Lake-U 和 Raptor Lake-P 共享相同的 Iris Xe 底层架构,因此 S410 G4 和 S410 G5 之间的任何性能提升都微乎其微。S410 G4 和 S410 G5 之间的性能提升微乎其微。 Iris Xe Graphics G7 80 EUs仅比我们设备中的 Iris Xe Graphics G7 96 EUs快 10%。对于绝大多数应用来说,这种微小的优势并不明显。
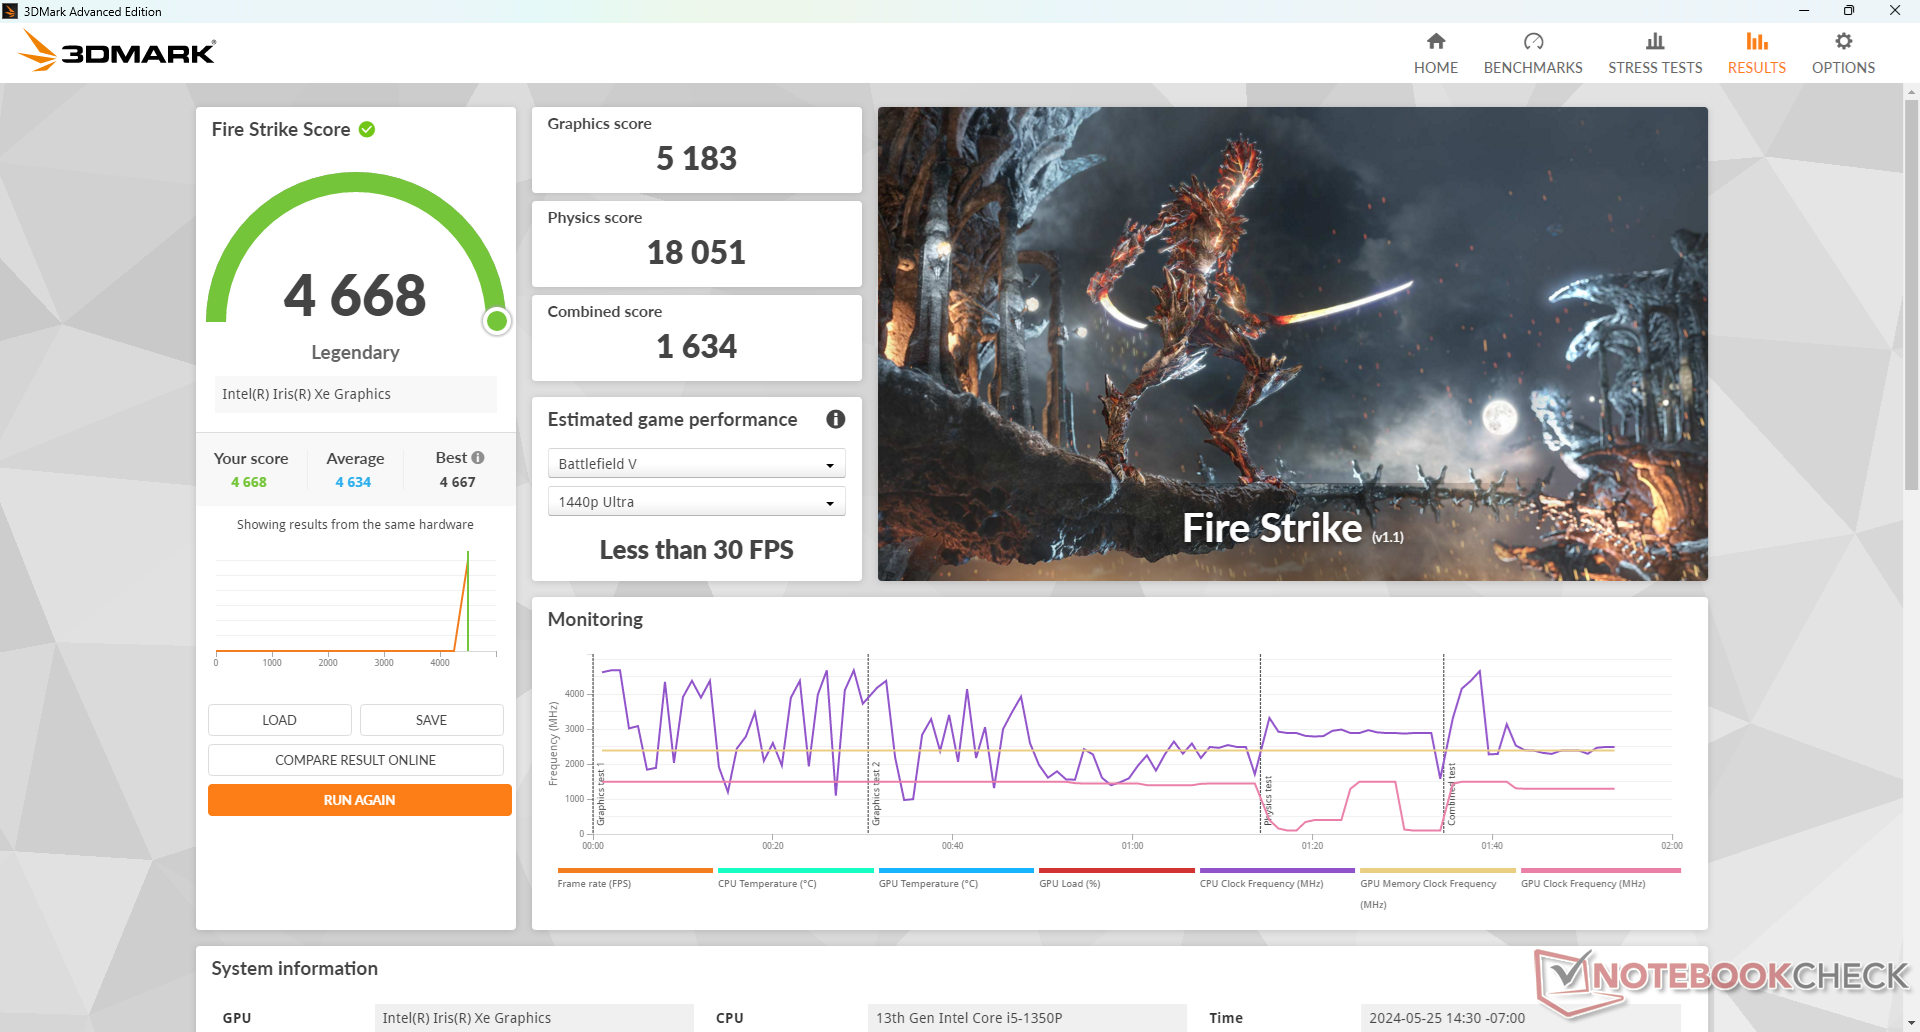
| 电源配置文件 | 图形得分 | 物理得分 | 综合得分 |
| 极限配置文件 | 5183 | 18051 | 1634 |
| 默认配置文件 | 5169 (-0%) | 17729 (-2%) | 1648 (-0%) |
| 电池电量 | 5186 (-0%) | 11113 (-38%) | 1725 (-0%) |
如Fire Strike 上表所示,在极限性能模式下运行并不比普通默认性能模式下运行速度更快。不过,如果使用电池供电,CPU 性能会严重下降,这在野外会令人失望。
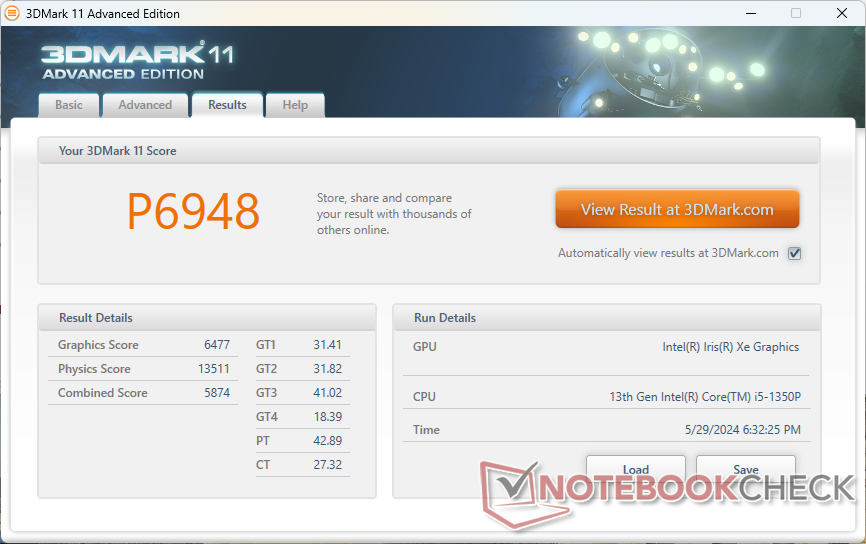
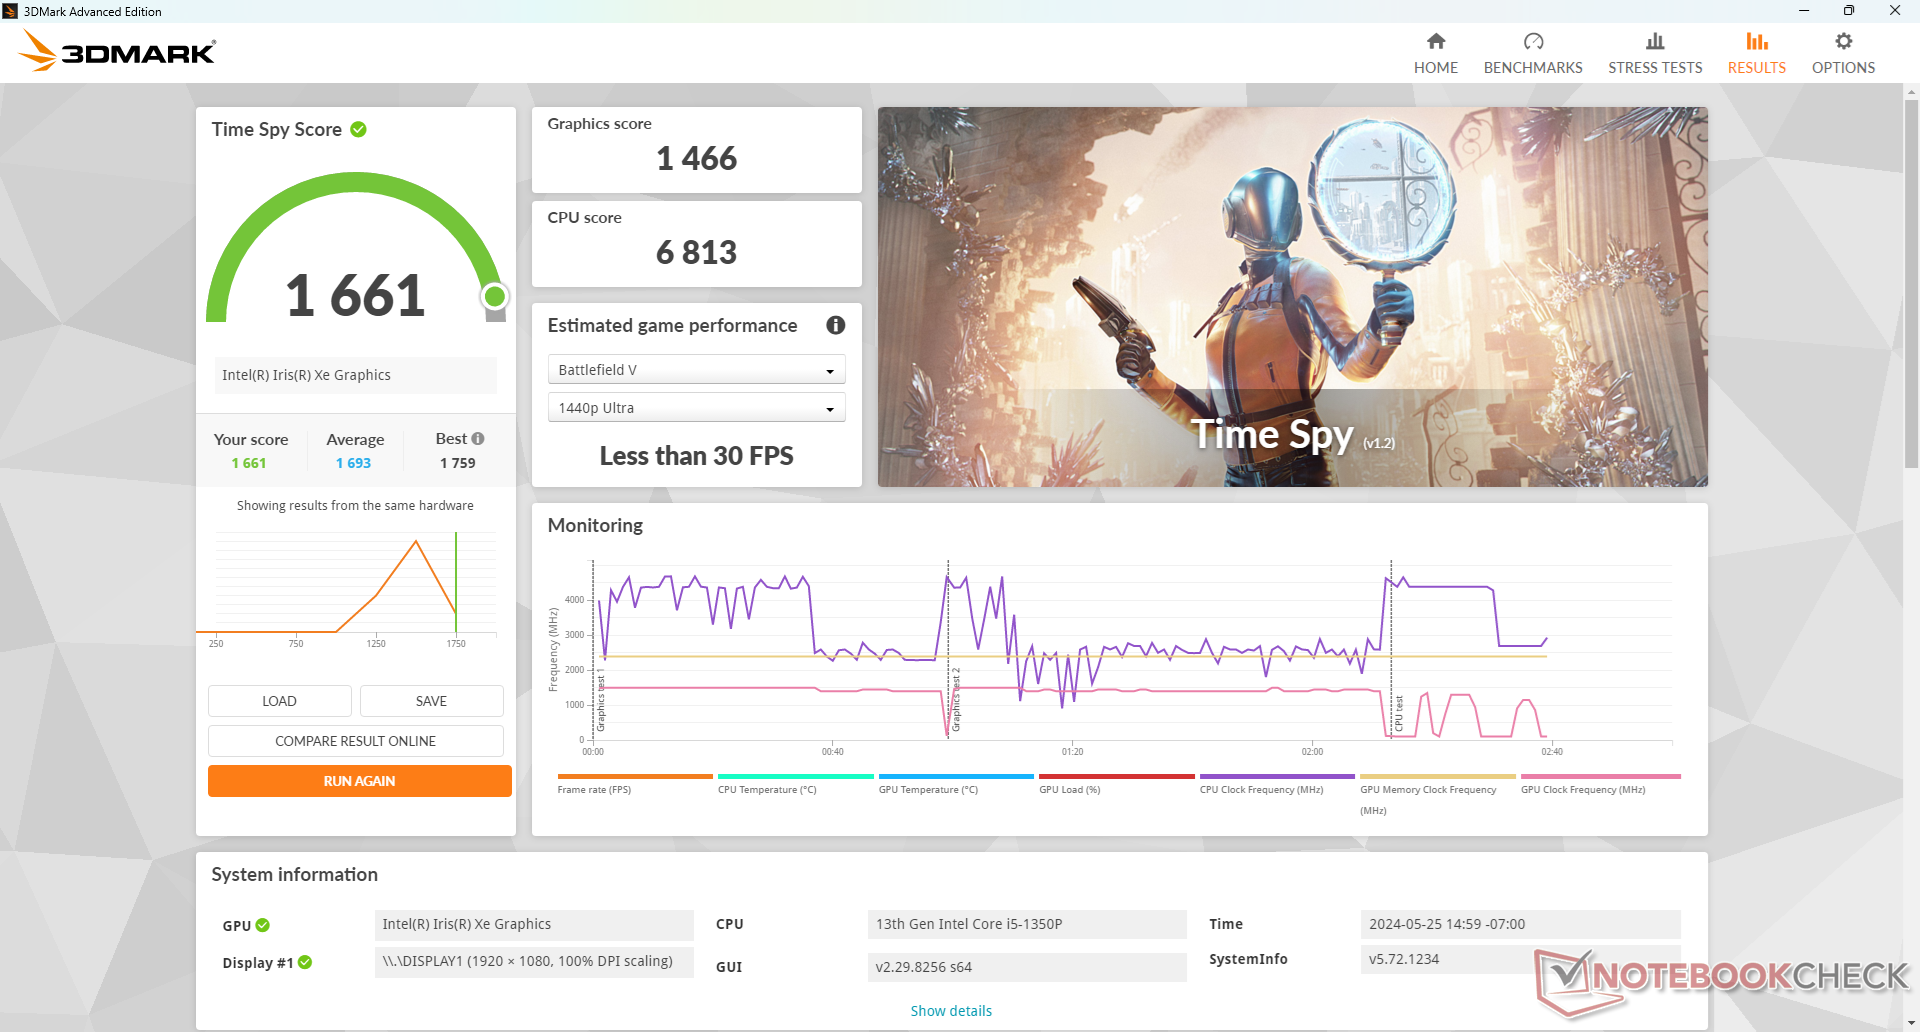
| 3DMark 11 Performance | 6948 points | |
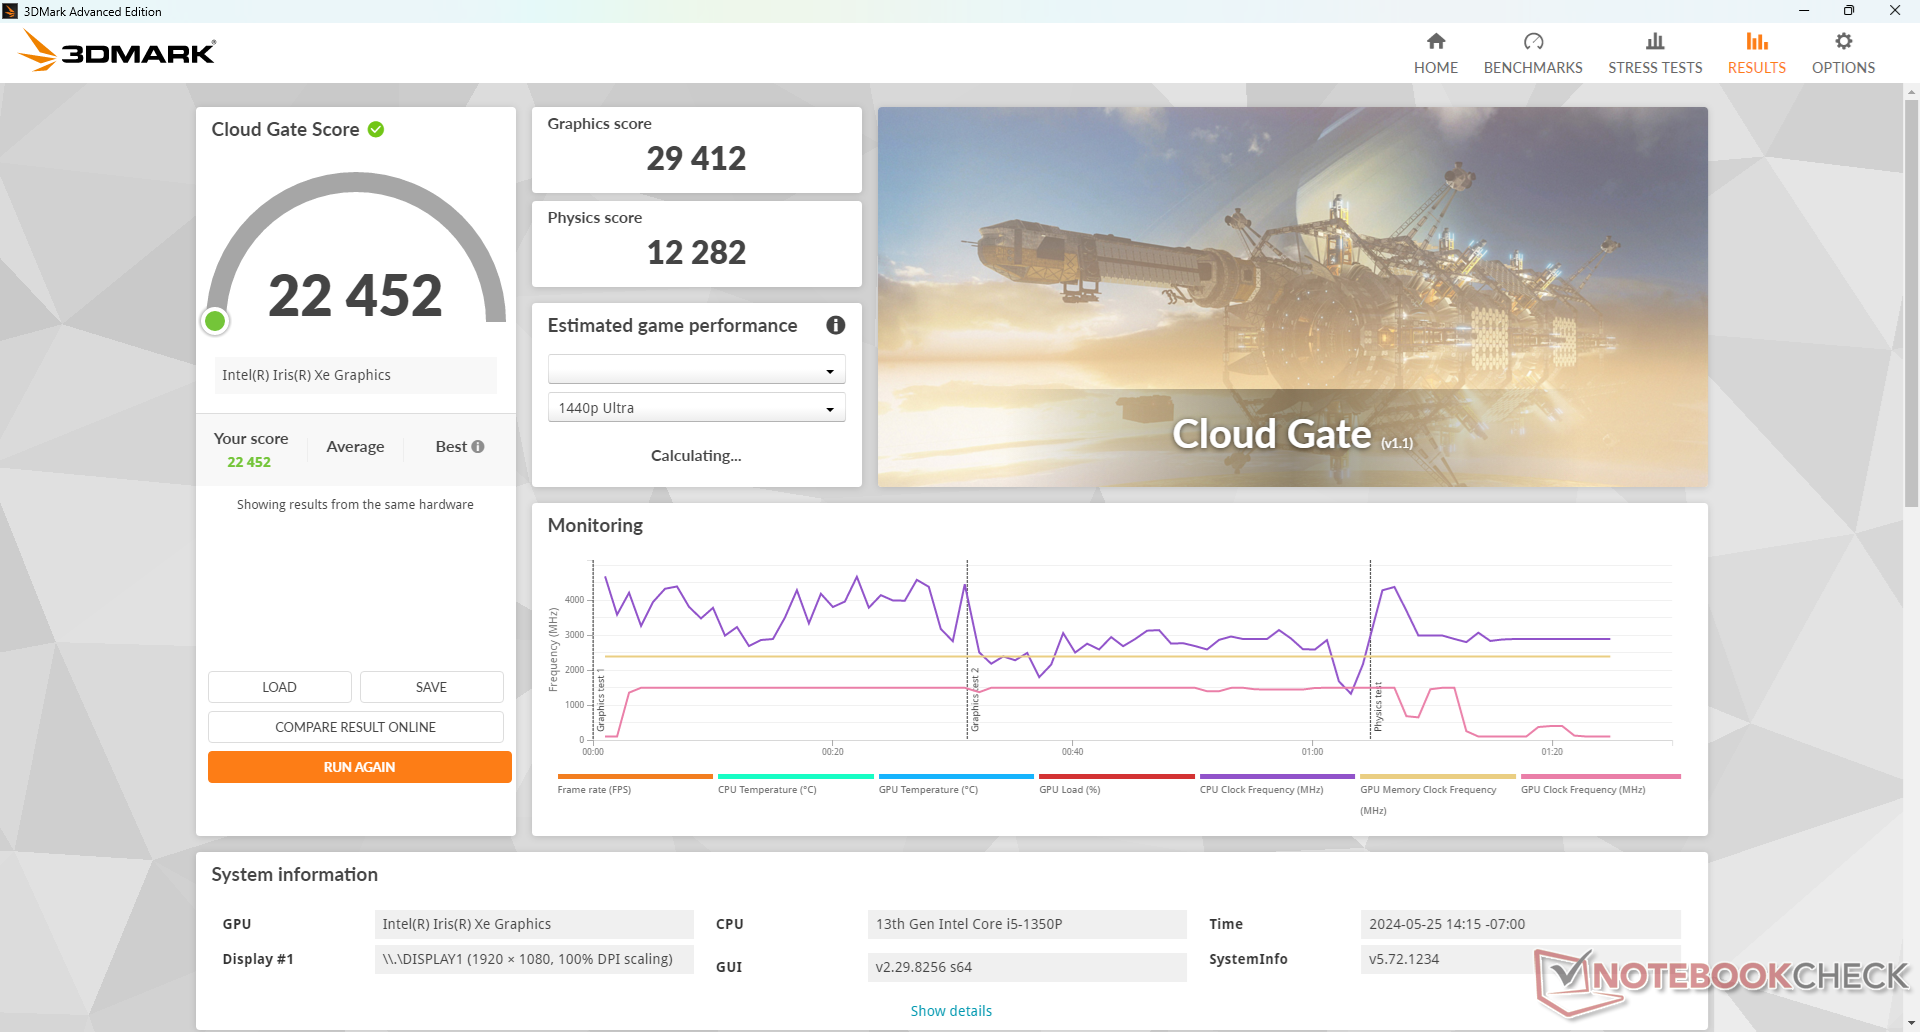
| 3DMark Cloud Gate Standard Score | 22452 points | |
| 3DMark Fire Strike Score | 4668 points | |
| 3DMark Time Spy Score | 1661 points | |
Help | ||
| Blender - v3.3 Classroom CPU | |
| Getac S410 G5 | |
* ... smaller is better
| Performance Rating - Percent | |
| Getac S410 G5 | |
| Dell Latitude 7330 Rugged Extreme -2! | |
| Getac S410 Gen 4 | |
| Panasonic Toughbook 40 -2! | |
| Durabook S14I -3! | |
| Dell Latitude 14 5420-D2G5W -3! | |
| GTA V | |
| 1024x768 Lowest Settings possible | |
| Getac S410 G5 | |
| Average Intel Iris Xe Graphics G7 80EUs (36.5 - 144.6, n=82) | |
| Getac S410 Gen 4 | |
| Dell Latitude 14 5420-D2G5W | |
| 1920x1080 Lowest Settings possible | |
| Getac S410 G5 | |
| Average Intel Iris Xe Graphics G7 80EUs (21.5 - 98.1, n=66) | |
| Getac S410 Gen 4 | |
| 1366x768 Normal/Off AF:4x | |
| Getac S410 G5 | |
| Average Intel Iris Xe Graphics G7 80EUs (28.9 - 133.8, n=85) | |
| Getac S410 Gen 4 | |
| Dell Latitude 14 5420-D2G5W | |
| 1920x1080 Normal/Off AF:4x | |
| Getac S410 G5 | |
| Average Intel Iris Xe Graphics G7 80EUs (18.8 - 97.2, n=66) | |
| Getac S410 Gen 4 | |
| 1920x1080 High/On (Advanced Graphics Off) AA:2xMSAA + FX AF:8x | |
| Getac S410 G5 | |
| Getac S410 Gen 4 | |
| Average Intel Iris Xe Graphics G7 80EUs (7.81 - 32, n=84) | |
| Dell Latitude 14 5420-D2G5W | |
| 1920x1080 Highest Settings possible AA:4xMSAA + FX AF:16x | |
| Getac S410 G5 | |
| Getac S410 Gen 4 | |
| Average Intel Iris Xe Graphics G7 80EUs (3.07 - 11.6, n=71) | |
在Witcher 3 上空闲运行时,帧速率保持稳定,只有在测试进行了 40 分钟后,帧速率下降到只有 10 FPS,表明后台活动中断。对于工业或坚固耐用的系统来说,这种情况令人失望,因为在这些系统中,稳定性是最重要的,任何后台应用都不应该被优先考虑。
Witcher 3 FPS Chart
| low | med. | high | ultra | |
|---|---|---|---|---|
| GTA V (2015) | 101.8 | 94.6 | 22.5 | 9.58 |
| The Witcher 3 (2015) | 79.9 | 56.3 | 31.5 | 28 |
| Dota 2 Reborn (2015) | 94.8 | 71.3 | 55.8 | 49.5 |
| Final Fantasy XV Benchmark (2018) | 40.4 | 22 | 15.8 | |
| X-Plane 11.11 (2018) | 47.6 | 36.1 | 32.7 | |
| Strange Brigade (2018) | 86.2 | 38.9 | 31 | 25.1 |
排放量
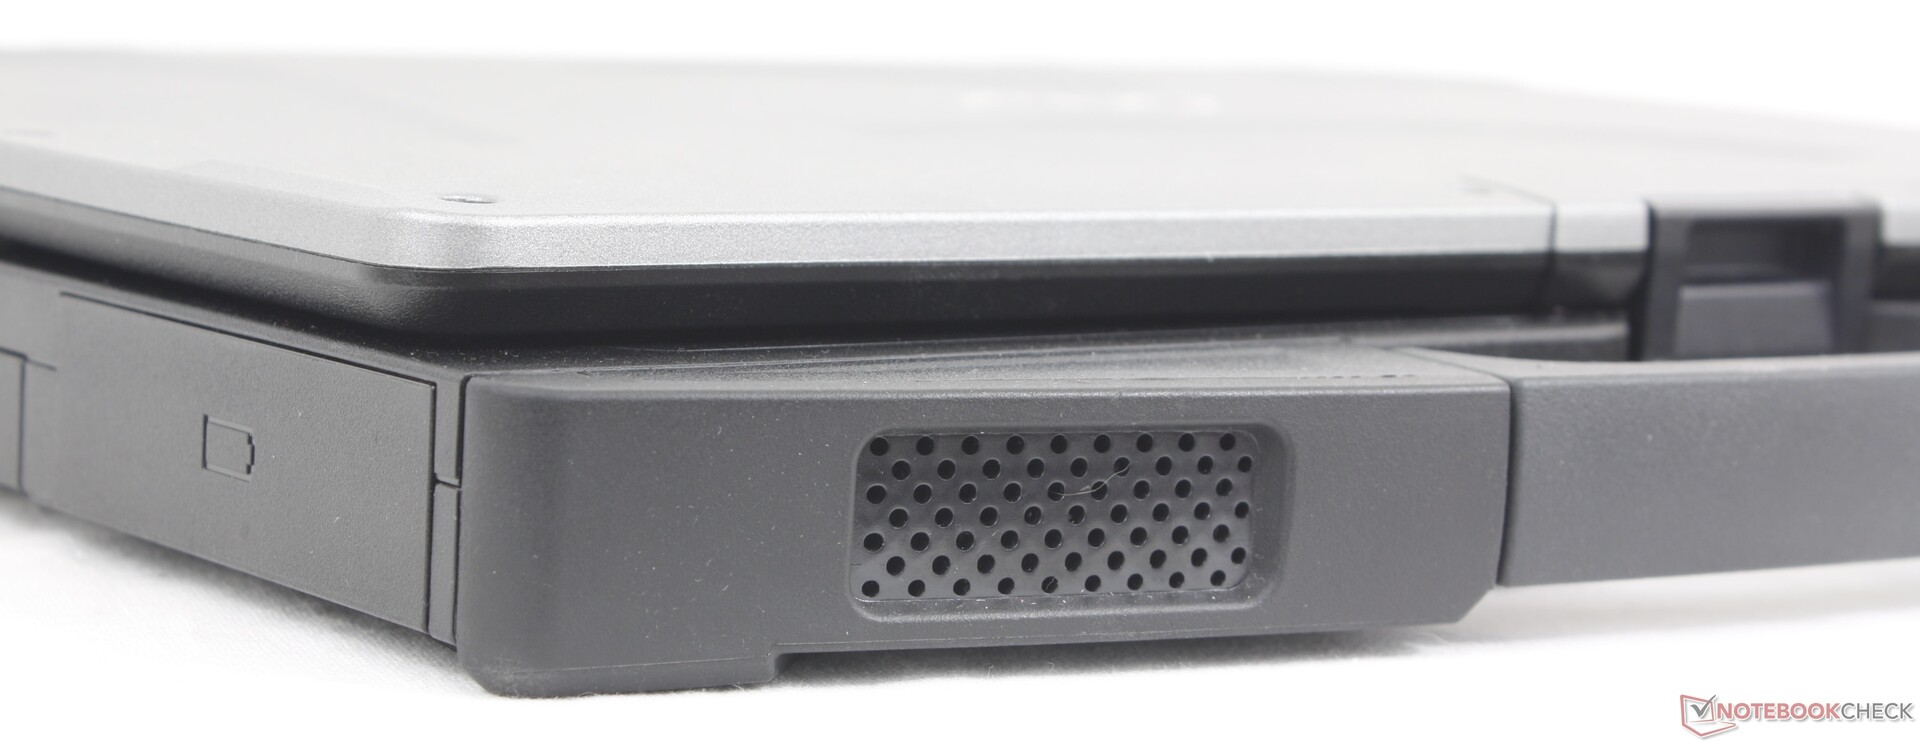
系统噪音 - 高音调风扇
风扇的噪音表现与之前的地板和天花板基本相同。最令人失望的是,相对高亢的风扇噪音依然存在,这使得风扇在使用过程中更加引人注目。
Noise Level
| Idle |
| 23.4 / 25.9 / 26 dB(A) |
| Load |
| 38.7 / 42.1 dB(A) |
 | ||
30 dB silent 40 dB(A) audible 50 dB(A) loud |
||
min: | ||
| Getac S410 G5 Iris Xe G7 80EUs, i5-1350P, SSSTC CL4-8D512 | Getac S410 Gen 4 Iris Xe G7 96EUs, i7-1185G7, SSSTC CA5-8D256 | Durabook S14I Iris Xe G7 96EUs, i7-1165G7, UDinfo M2P M2P80DE512GBAEP | Dell Latitude 14 5420-D2G5W Iris Xe G7 80EUs, i5-1135G7, WDC PC SN530 SDBPTPZ-256G | Dell Latitude 7330 Rugged Extreme Iris Xe G7 96EUs, i7-1185G7 | Panasonic Toughbook 40 Iris Xe G7 96EUs, i7-1185G7, Samsung PM991 MZVLQ1T0HALB | |
|---|---|---|---|---|---|---|
| Noise | -2% | -4% | -4% | 13% | 1% | |
| off / environment * | 23.4 | 23.3 -0% | 25.2 -8% | 25 -7% | 22.9 2% | 22.8 3% |
| Idle Minimum * | 23.4 | 23.5 -0% | 25.2 -8% | 25 -7% | 23.1 1% | 26 -11% |
| Idle Average * | 25.9 | 23.5 9% | 25.2 3% | 25 3% | 23.1 11% | 26 -0% |
| Idle Maximum * | 26 | 28 -8% | 34.5 -33% | 25 4% | 23.1 11% | 26 -0% |
| Load Average * | 38.7 | 42.8 -11% | 34.5 11% | 36.5 6% | 28 28% | 37.6 3% |
| Witcher 3 ultra * | 42.1 | 42.3 -0% | 31.2 26% | 37.8 10% | ||
| Load Maximum * | 42.1 | 42.6 -1% | 36.2 14% | 52.4 -24% | 36.2 14% | 40.3 4% |
* ... smaller is better
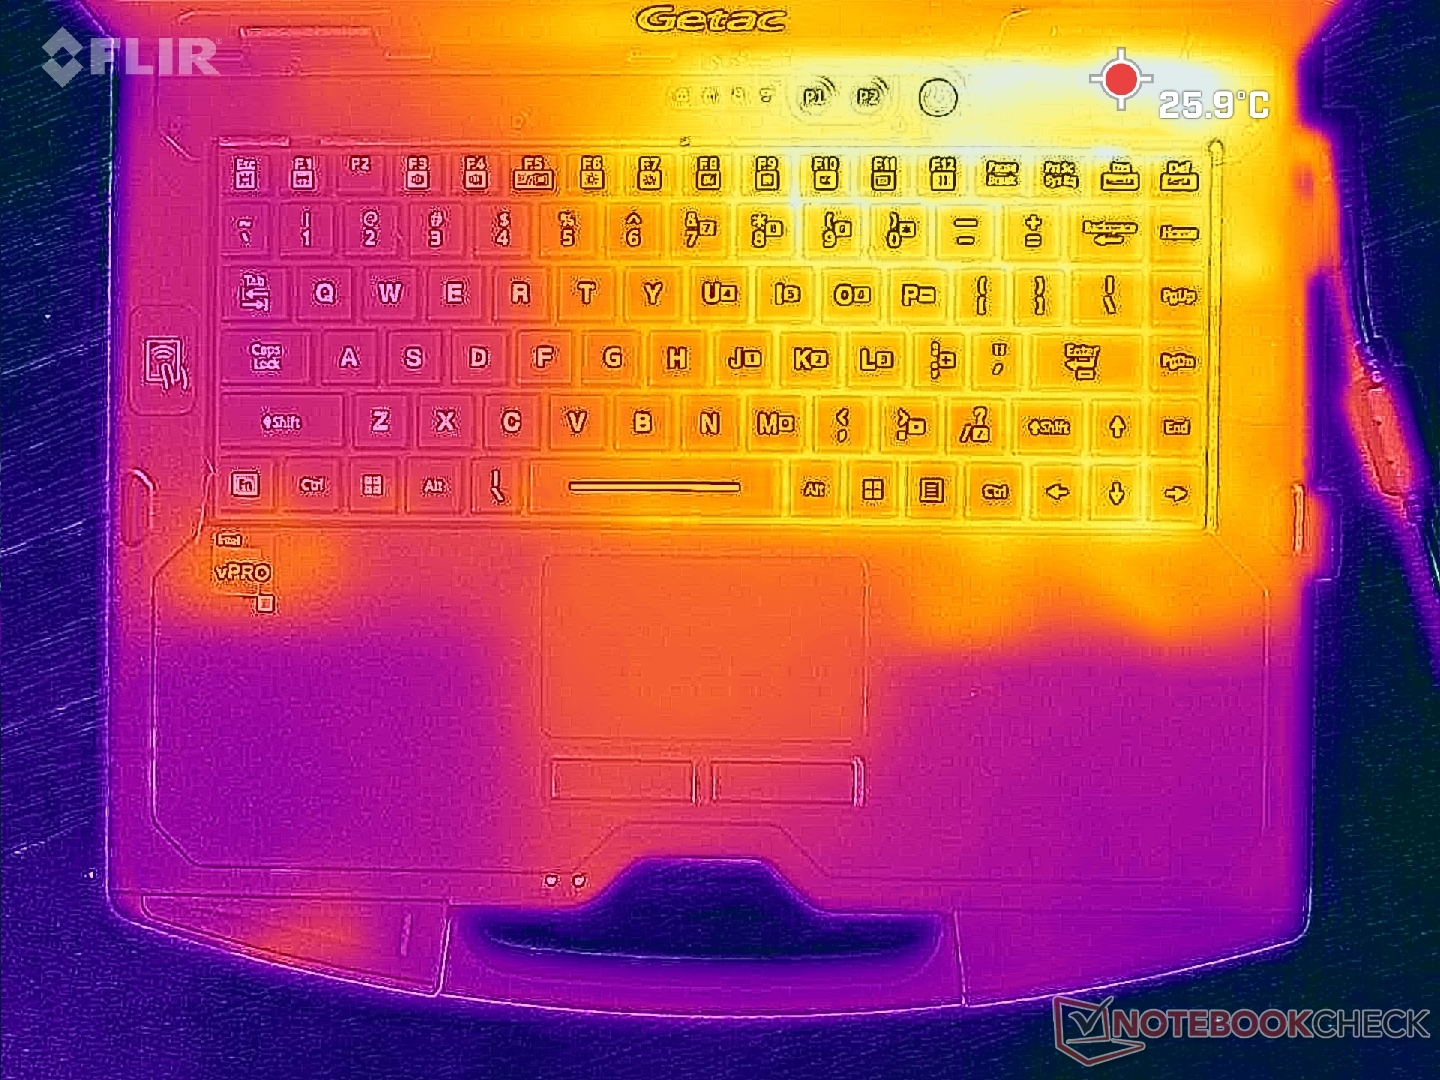
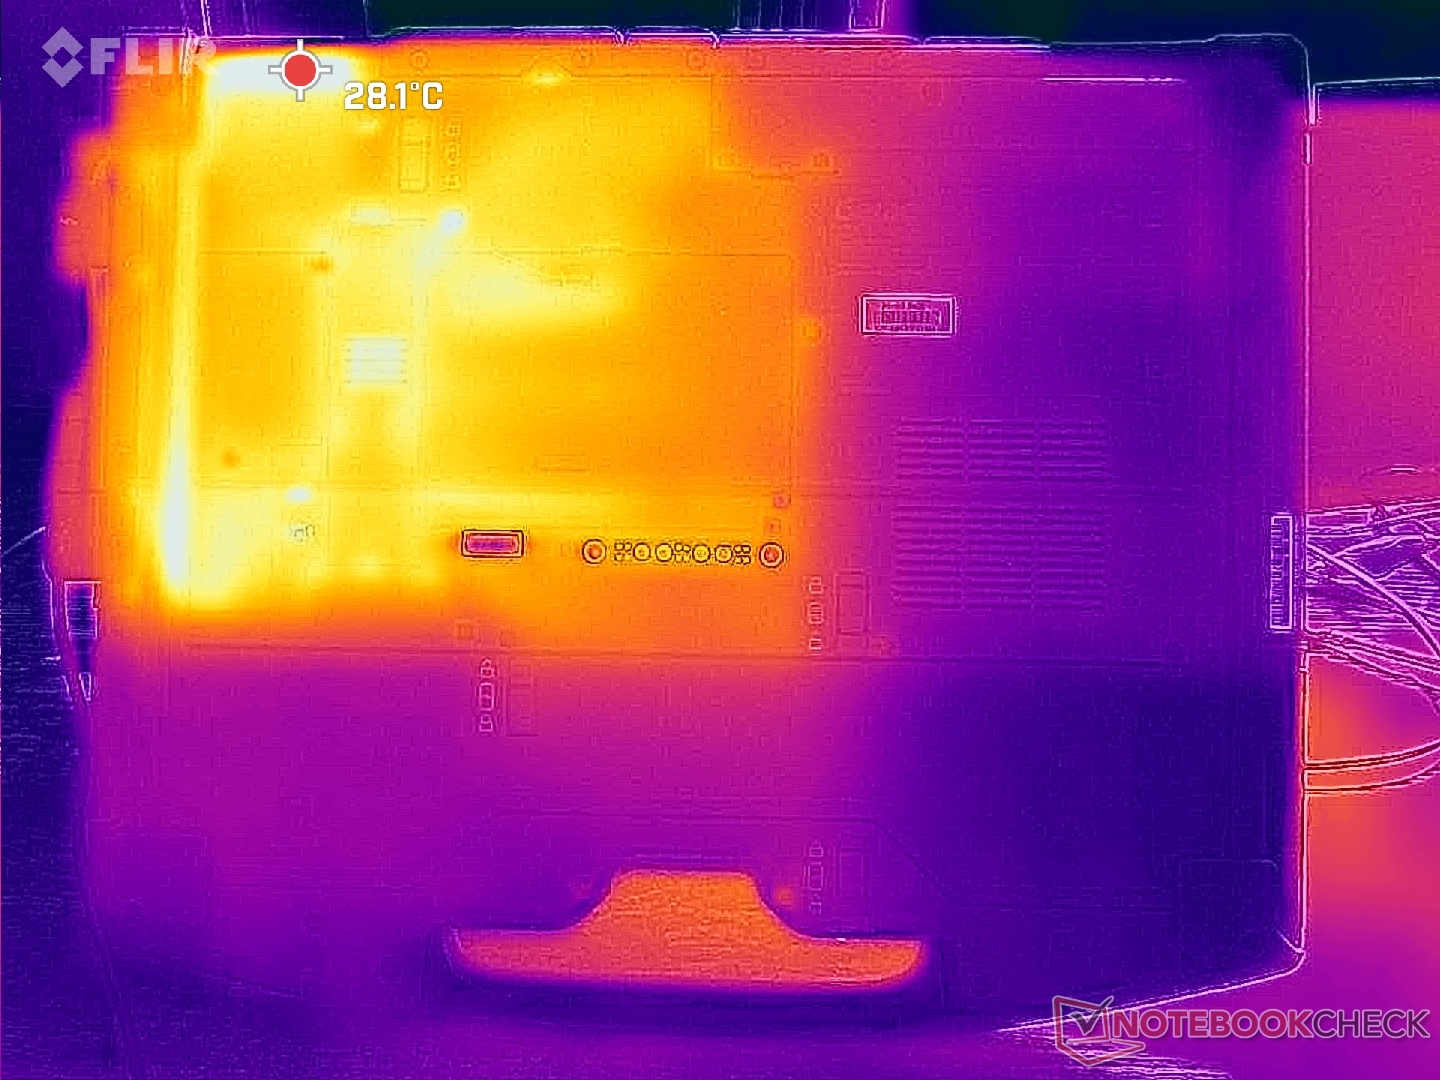
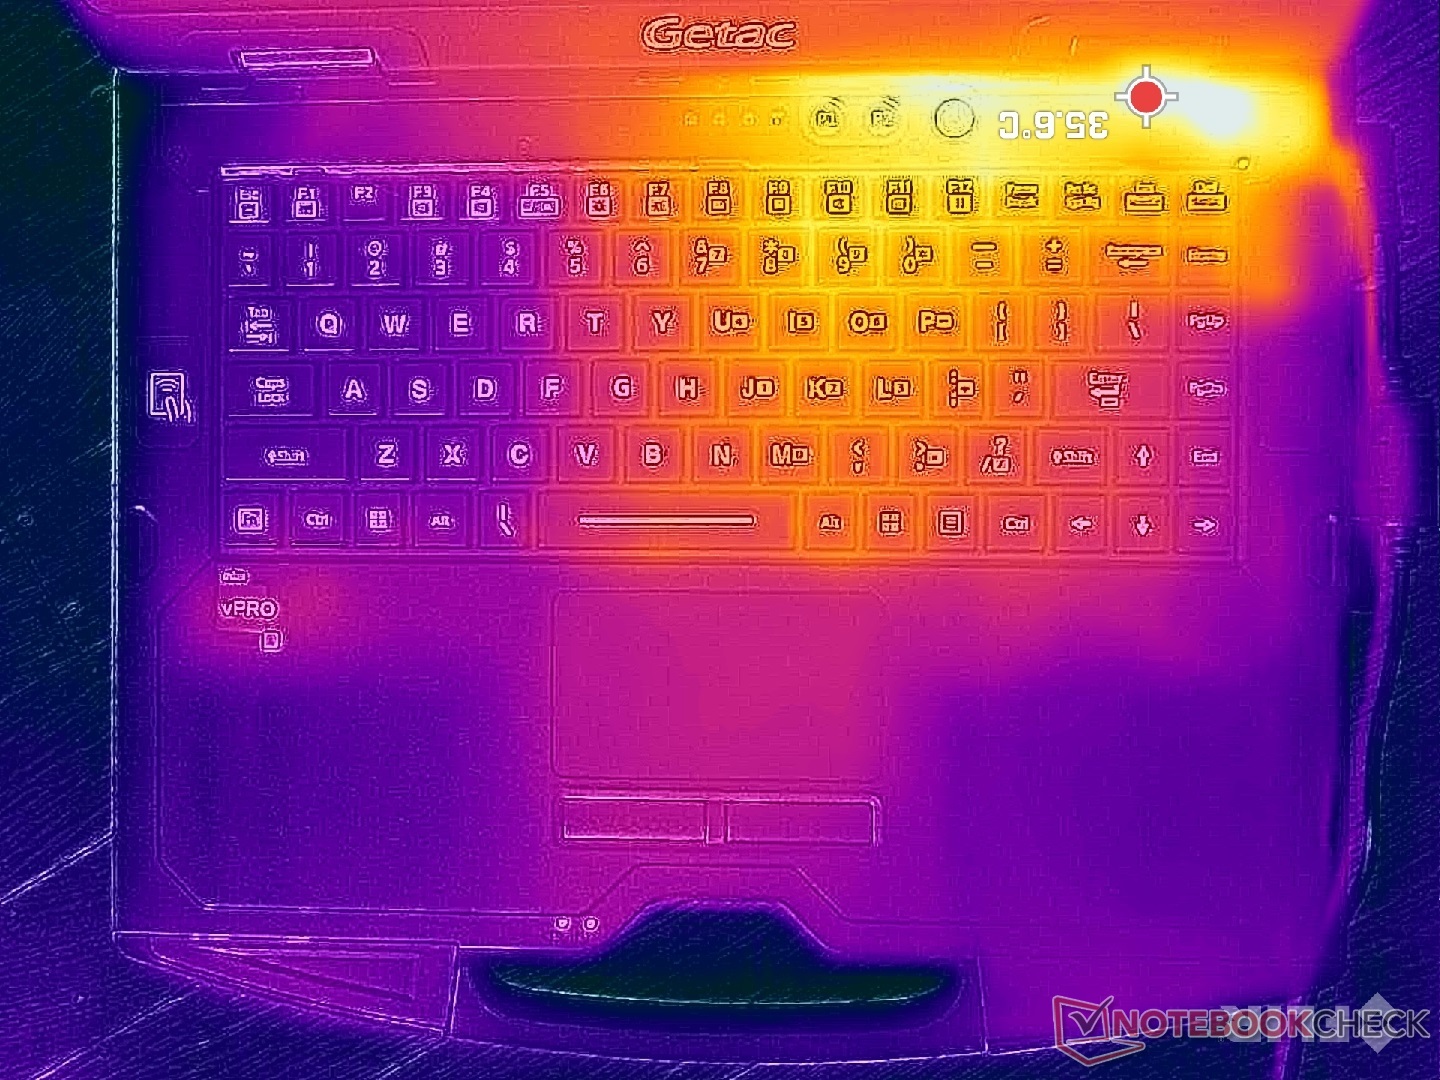
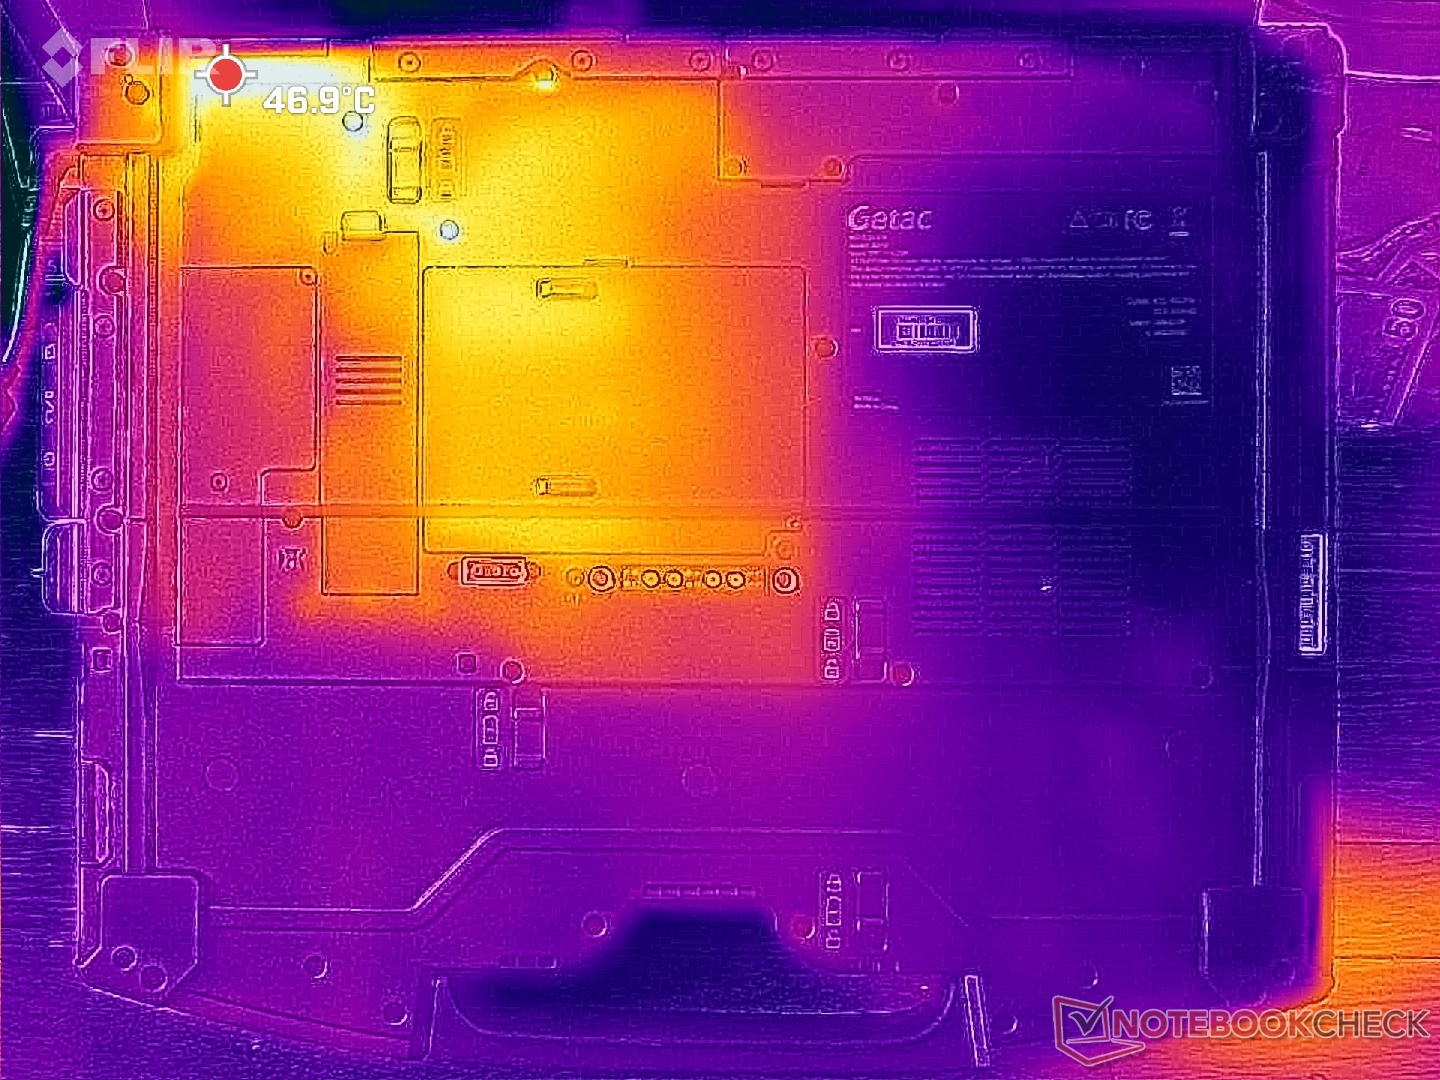
温度
机身右半部分的表面温度高于左半部分。笔记本 C 盖和 D 盖上的热点温度分别高达 36 摄氏度和 47 摄氏度,但这些区域都集中在后部,手指或皮肤不太可能接触到。
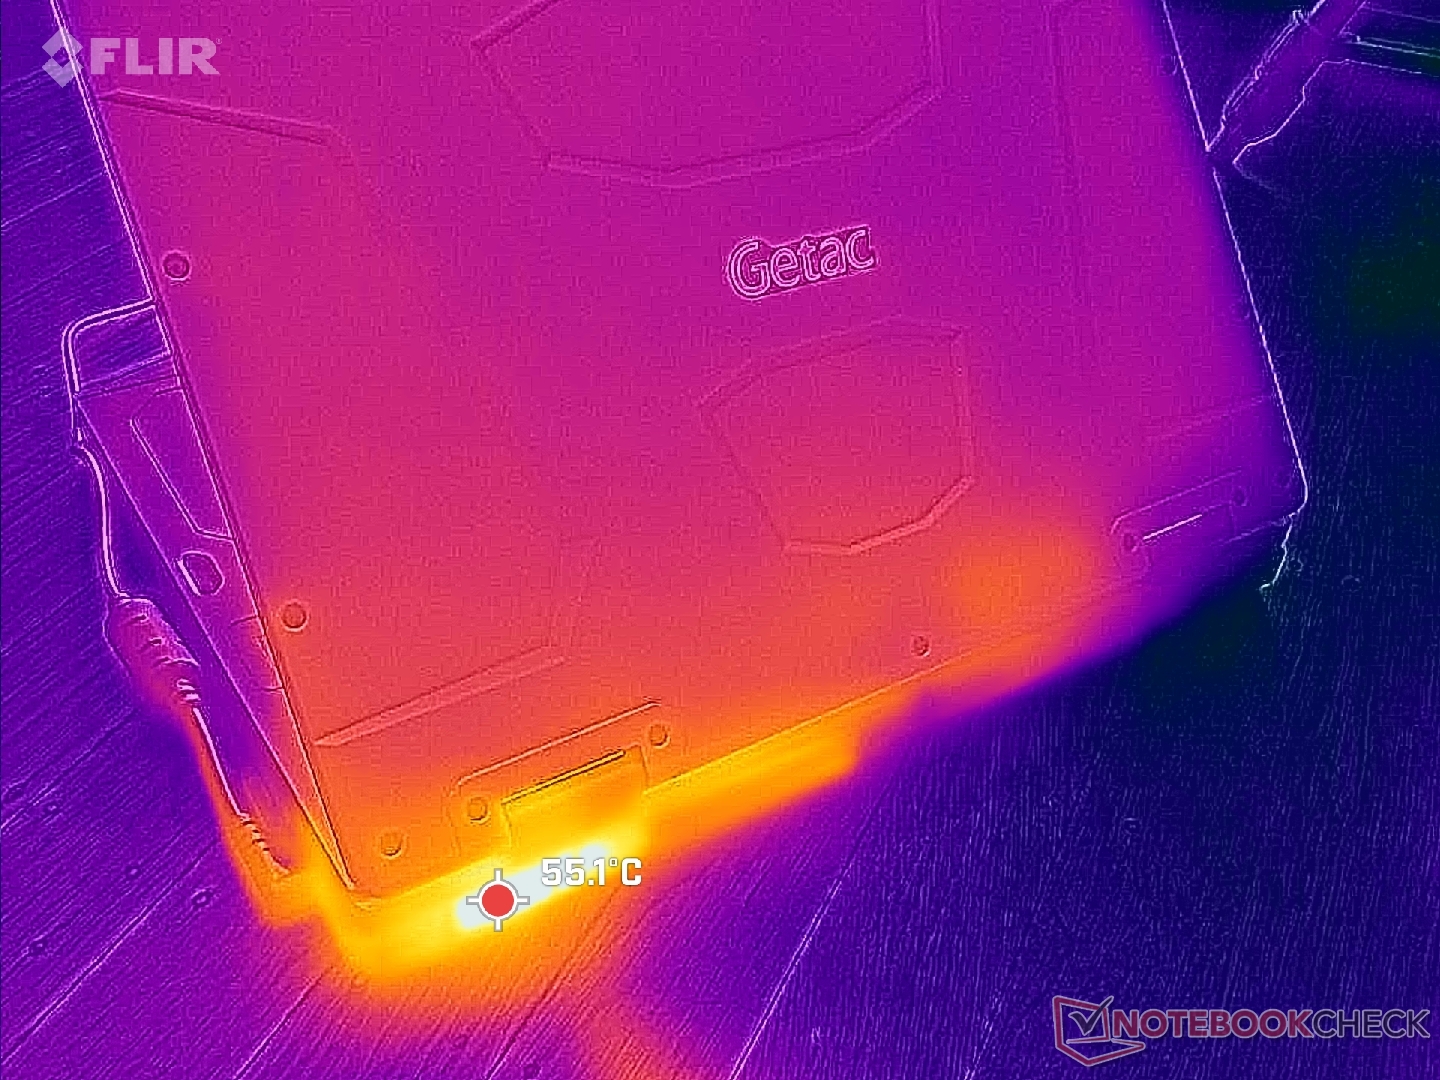
(+) The maximum temperature on the upper side is 37 °C / 99 F, compared to the average of 34.3 °C / 94 F, ranging from 21.2 to 62.5 °C for the class Office.
(±) The bottom heats up to a maximum of 42.2 °C / 108 F, compared to the average of 36.8 °C / 98 F
(+) In idle usage, the average temperature for the upper side is 25.6 °C / 78 F, compared to the device average of 29.5 °C / 85 F.
(+) The palmrests and touchpad are cooler than skin temperature with a maximum of 26.8 °C / 80.2 F and are therefore cool to the touch.
(±) The average temperature of the palmrest area of similar devices was 27.6 °C / 81.7 F (+0.8 °C / 1.5 F).
| Getac S410 G5 Intel Core i5-1350P, Intel Iris Xe Graphics G7 80EUs | Getac S410 Gen 4 Intel Core i7-1185G7, Intel Iris Xe Graphics G7 96EUs | Durabook S14I Intel Core i7-1165G7, Intel Iris Xe Graphics G7 96EUs | Dell Latitude 14 5420-D2G5W Intel Core i5-1135G7, Intel Iris Xe Graphics G7 80EUs | Dell Latitude 7330 Rugged Extreme Intel Core i7-1185G7, Intel Iris Xe Graphics G7 96EUs | Panasonic Toughbook 40 Intel Core i7-1185G7, Intel Iris Xe Graphics G7 96EUs | |
|---|---|---|---|---|---|---|
| Heat | -7% | -1% | 2% | 14% | 5% | |
| Maximum Upper Side * | 37 | 36 3% | 36.4 2% | 41.7 -13% | 34.6 6% | 35.6 4% |
| Maximum Bottom * | 42.2 | 46.8 -11% | 38.6 9% | 35.6 16% | 36.6 13% | 40 5% |
| Idle Upper Side * | 28.8 | 30 -4% | 32.6 -13% | 29.9 -4% | 24.8 14% | 28.6 1% |
| Idle Bottom * | 33 | 38.2 -16% | 33.8 -2% | 29.7 10% | 25.2 24% | 29.4 11% |
* ... smaller is better
压力测试
负载下的核心温度比去年的 S410 G4 稍低几摄氏度。在运行 Prime95 压力测试时,由于 Turbo Boost 可持续性有限,CPU 会提升至 3.1 GHz、53 W 和 97 C,直到测试开始一分钟后才降至 1.9 GHz、88 C 和 29 W。运行时的核心温度也相似 Witcher 3而 S410 G4 的 CPU 稳定在 90 C 以上。
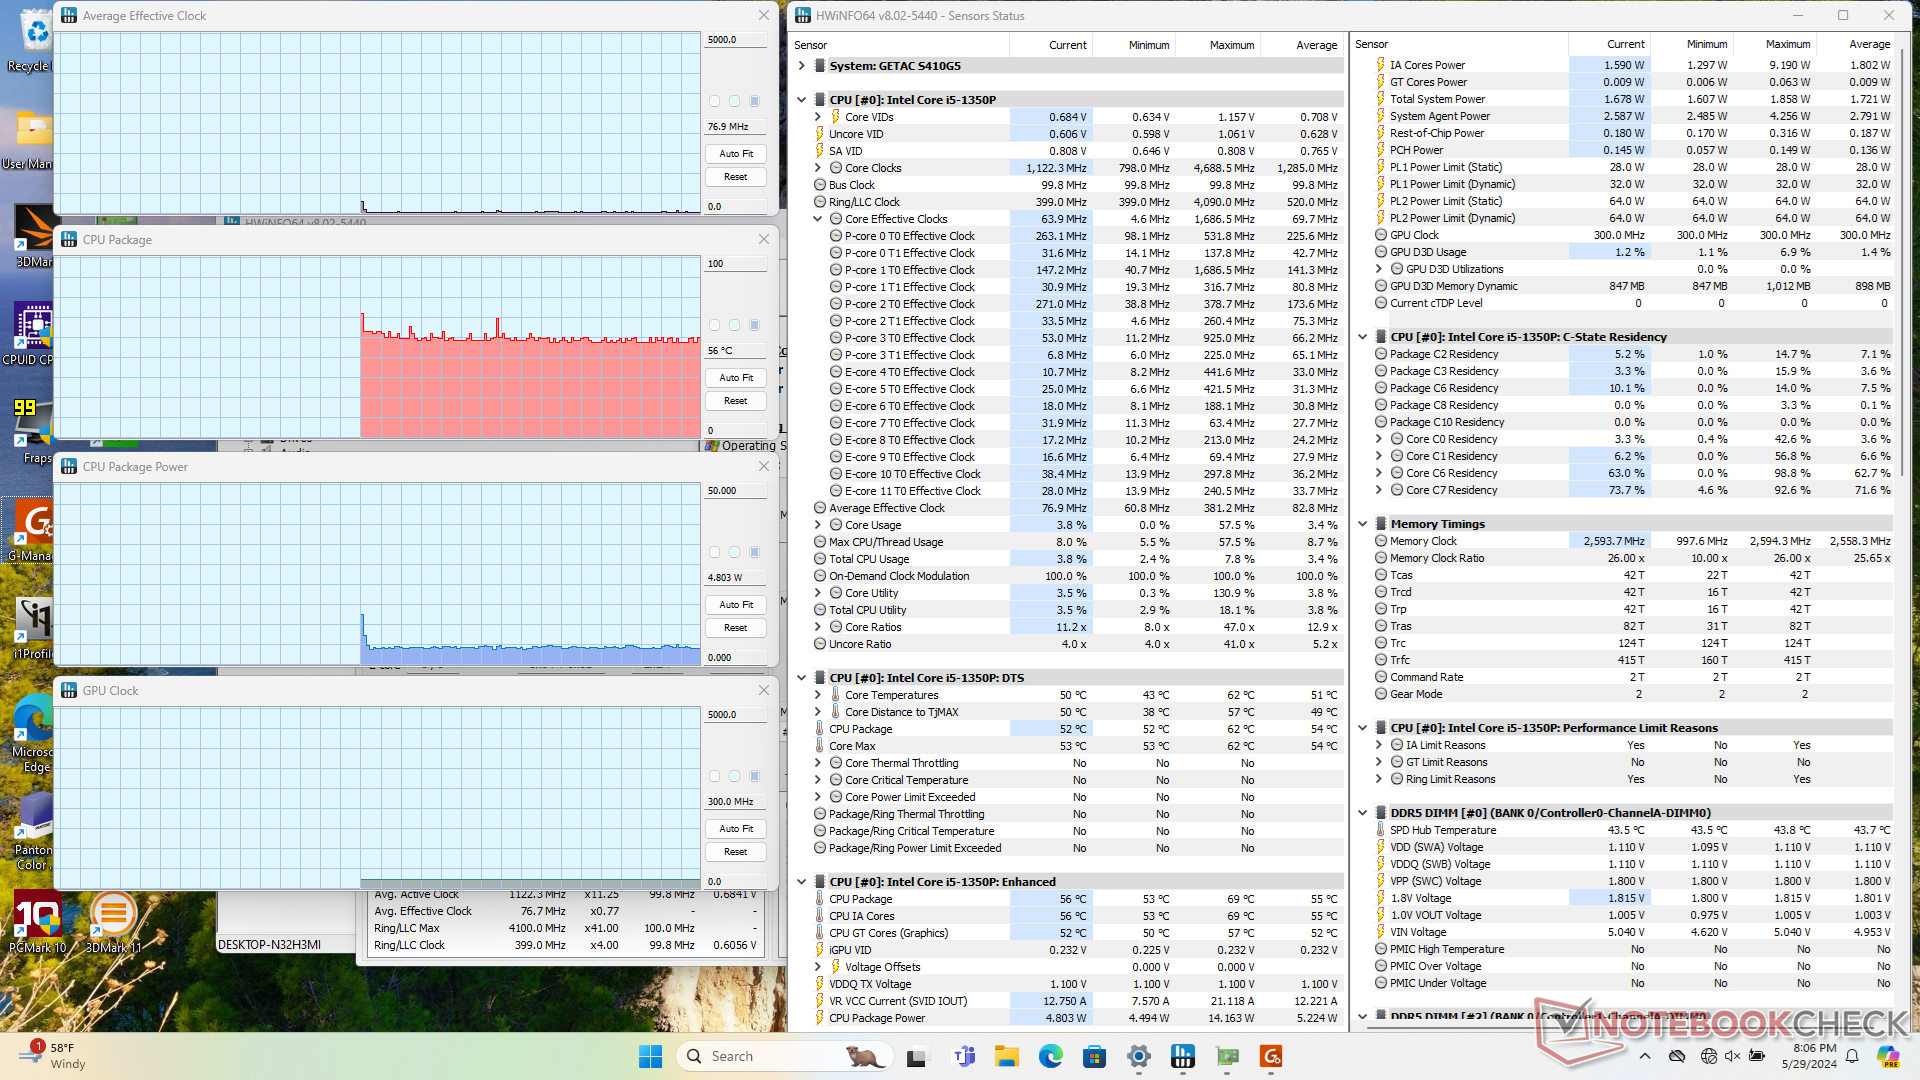
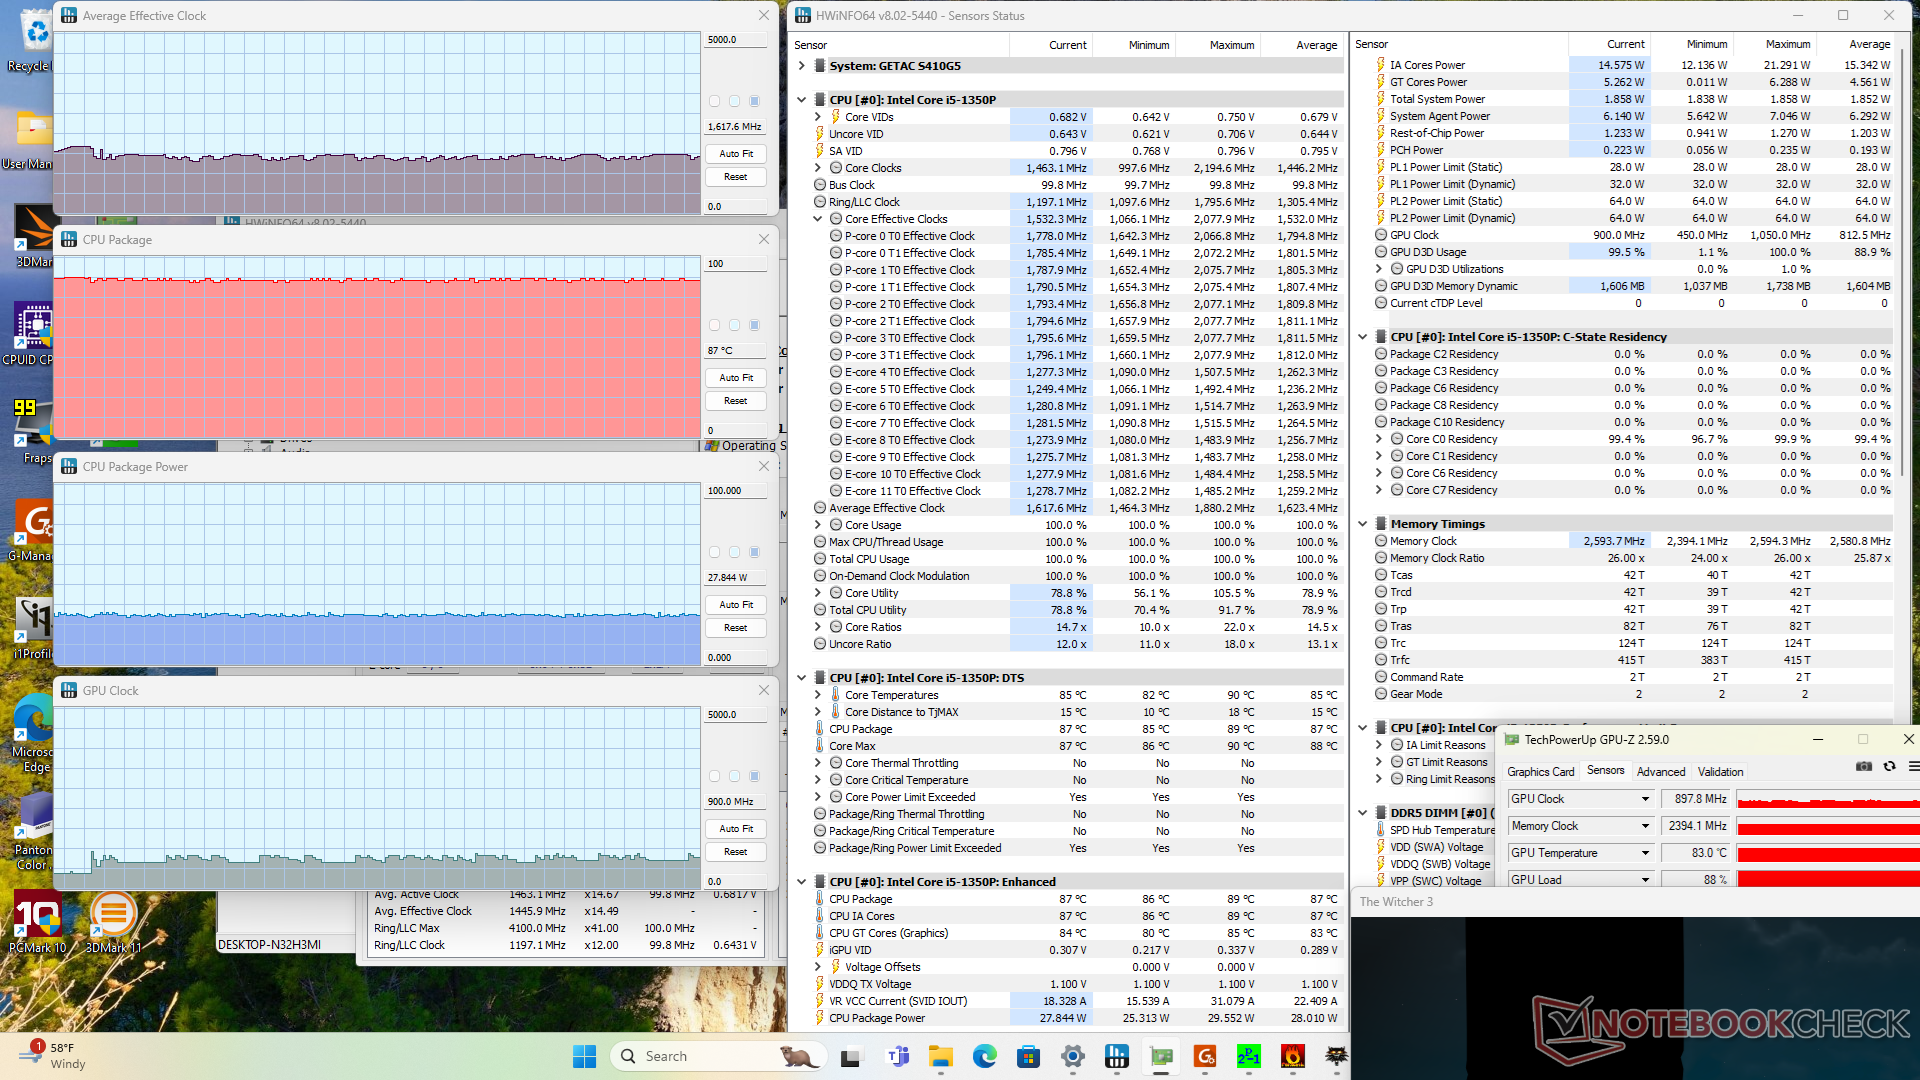
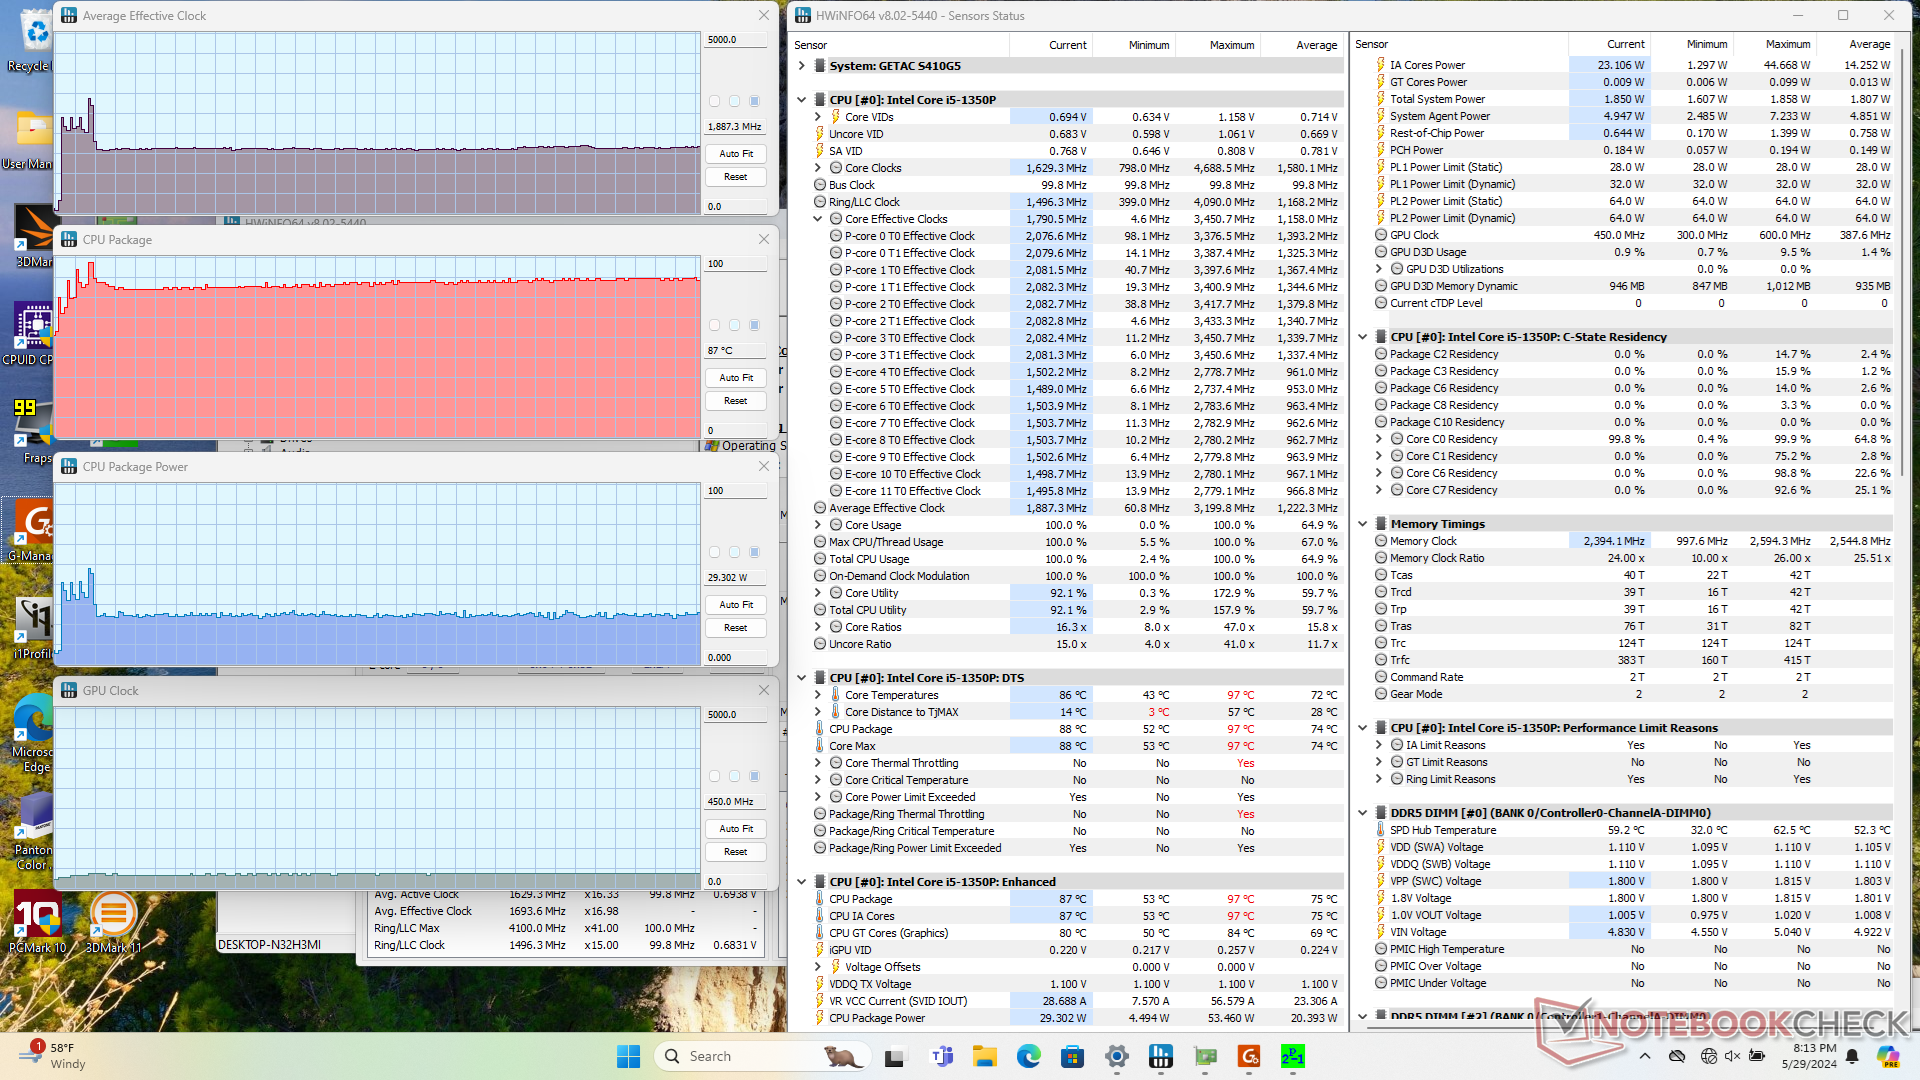
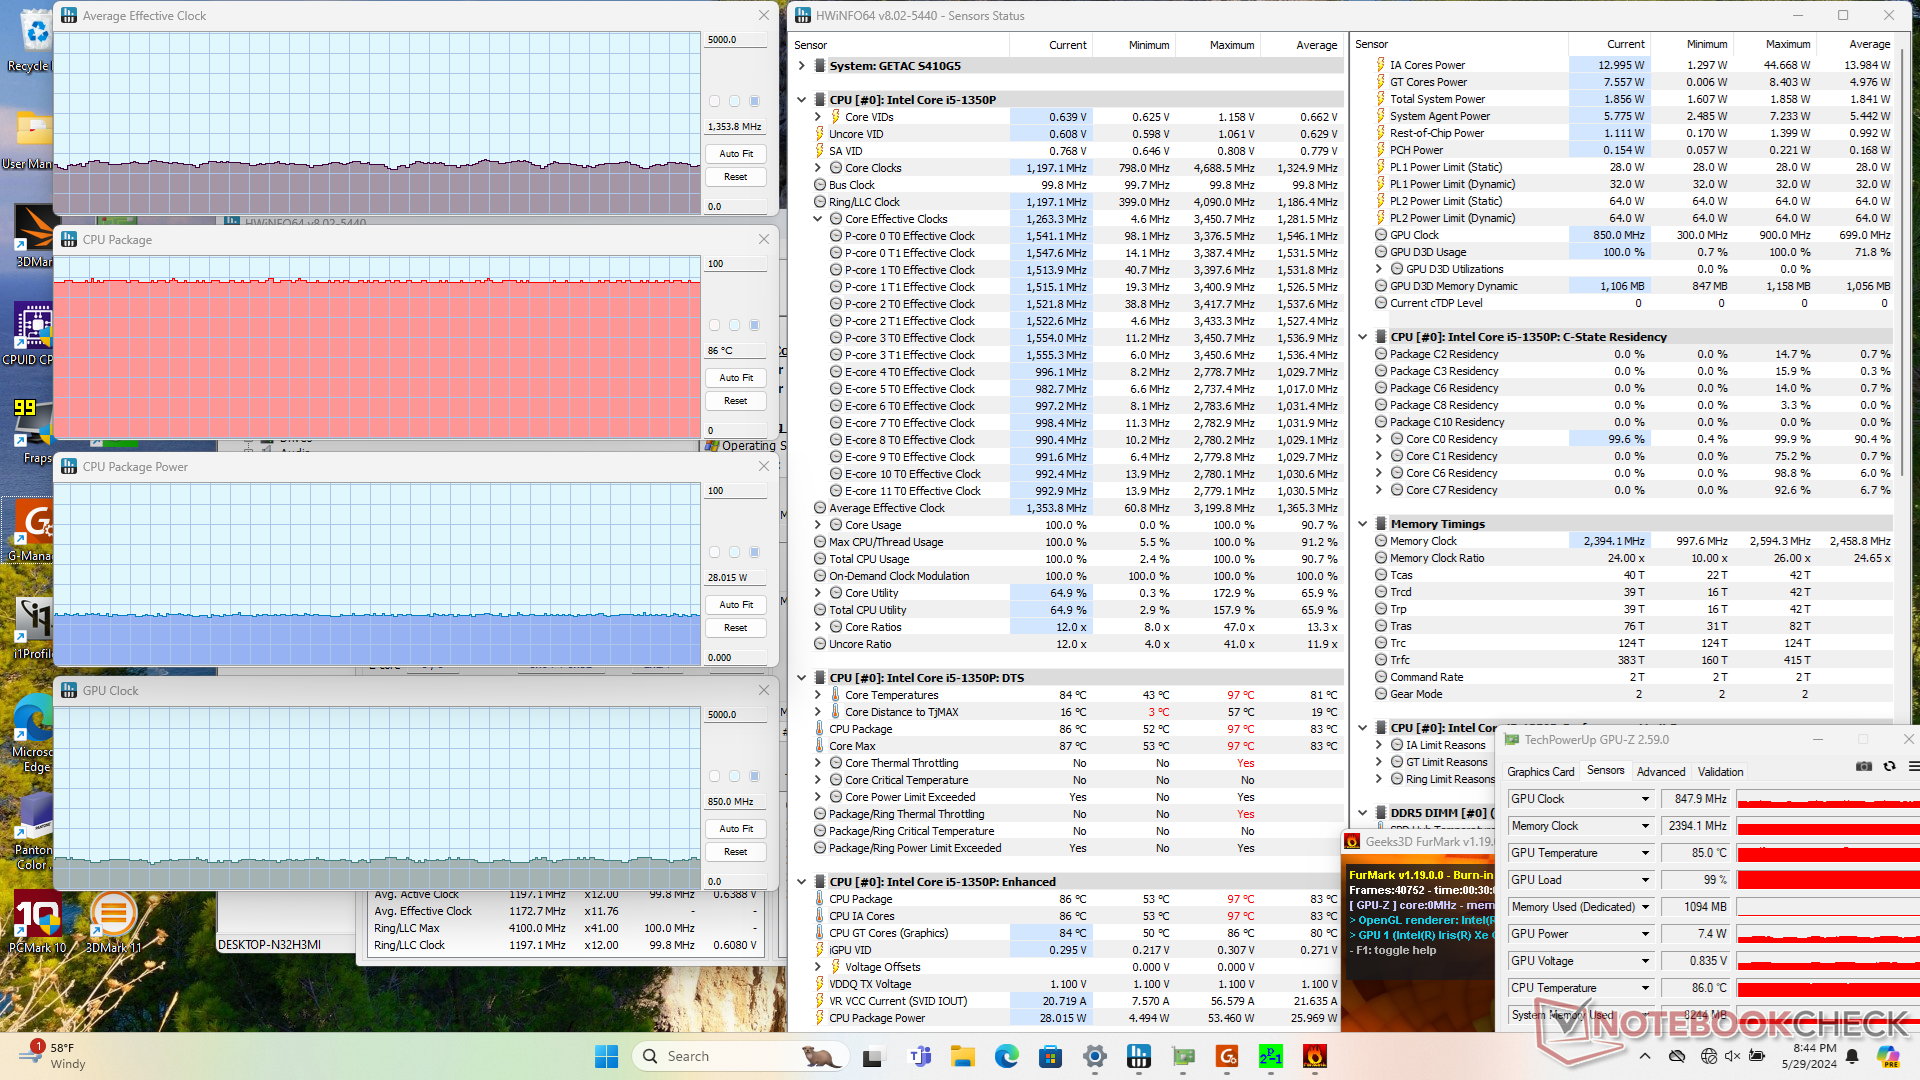
| CPU 平均时钟 (GHz) | GPU 时钟 (MHz) | CPU 平均温度 (°C) | |
| 系统闲置 | -- | -- | 56 |
| Prime95 压力 | 1.9 | -- | 88 |
| Prime95 + FurMark 压力 | 1.2 - 1.5 | 850 | 86 |
| Witcher 3 压力 | 1.6 | 900 | 87 |
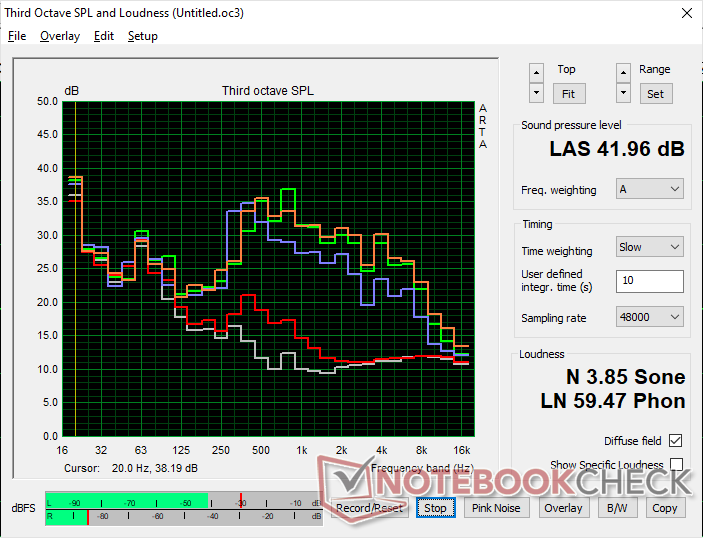
发言人
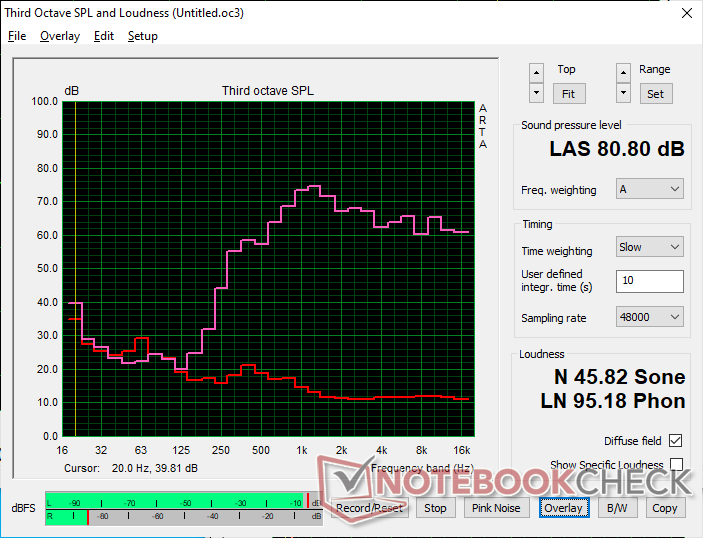
Getac S410 G5 audio analysis
(±) | speaker loudness is average but good (80.8 dB)
Bass 100 - 315 Hz
(-) | nearly no bass - on average 29.2% lower than median
(±) | linearity of bass is average (13.4% delta to prev. frequency)
Mids 400 - 2000 Hz
(±) | higher mids - on average 6.7% higher than median
(±) | linearity of mids is average (7.5% delta to prev. frequency)
Highs 2 - 16 kHz
(+) | balanced highs - only 2.9% away from median
(+) | highs are linear (6% delta to prev. frequency)
Overall 100 - 16.000 Hz
(±) | linearity of overall sound is average (23.3% difference to median)
Compared to same class
» 64% of all tested devices in this class were better, 8% similar, 28% worse
» The best had a delta of 7%, average was 21%, worst was 53%
Compared to all devices tested
» 68% of all tested devices were better, 6% similar, 27% worse
» The best had a delta of 4%, average was 24%, worst was 134%
Apple MacBook Pro 16 2021 M1 Pro audio analysis
(+) | speakers can play relatively loud (84.7 dB)
Bass 100 - 315 Hz
(+) | good bass - only 3.8% away from median
(+) | bass is linear (5.2% delta to prev. frequency)
Mids 400 - 2000 Hz
(+) | balanced mids - only 1.3% away from median
(+) | mids are linear (2.1% delta to prev. frequency)
Highs 2 - 16 kHz
(+) | balanced highs - only 1.9% away from median
(+) | highs are linear (2.7% delta to prev. frequency)
Overall 100 - 16.000 Hz
(+) | overall sound is linear (4.6% difference to median)
Compared to same class
» 0% of all tested devices in this class were better, 0% similar, 100% worse
» The best had a delta of 5%, average was 18%, worst was 45%
Compared to all devices tested
» 0% of all tested devices were better, 0% similar, 100% worse
» The best had a delta of 4%, average was 24%, worst was 134%
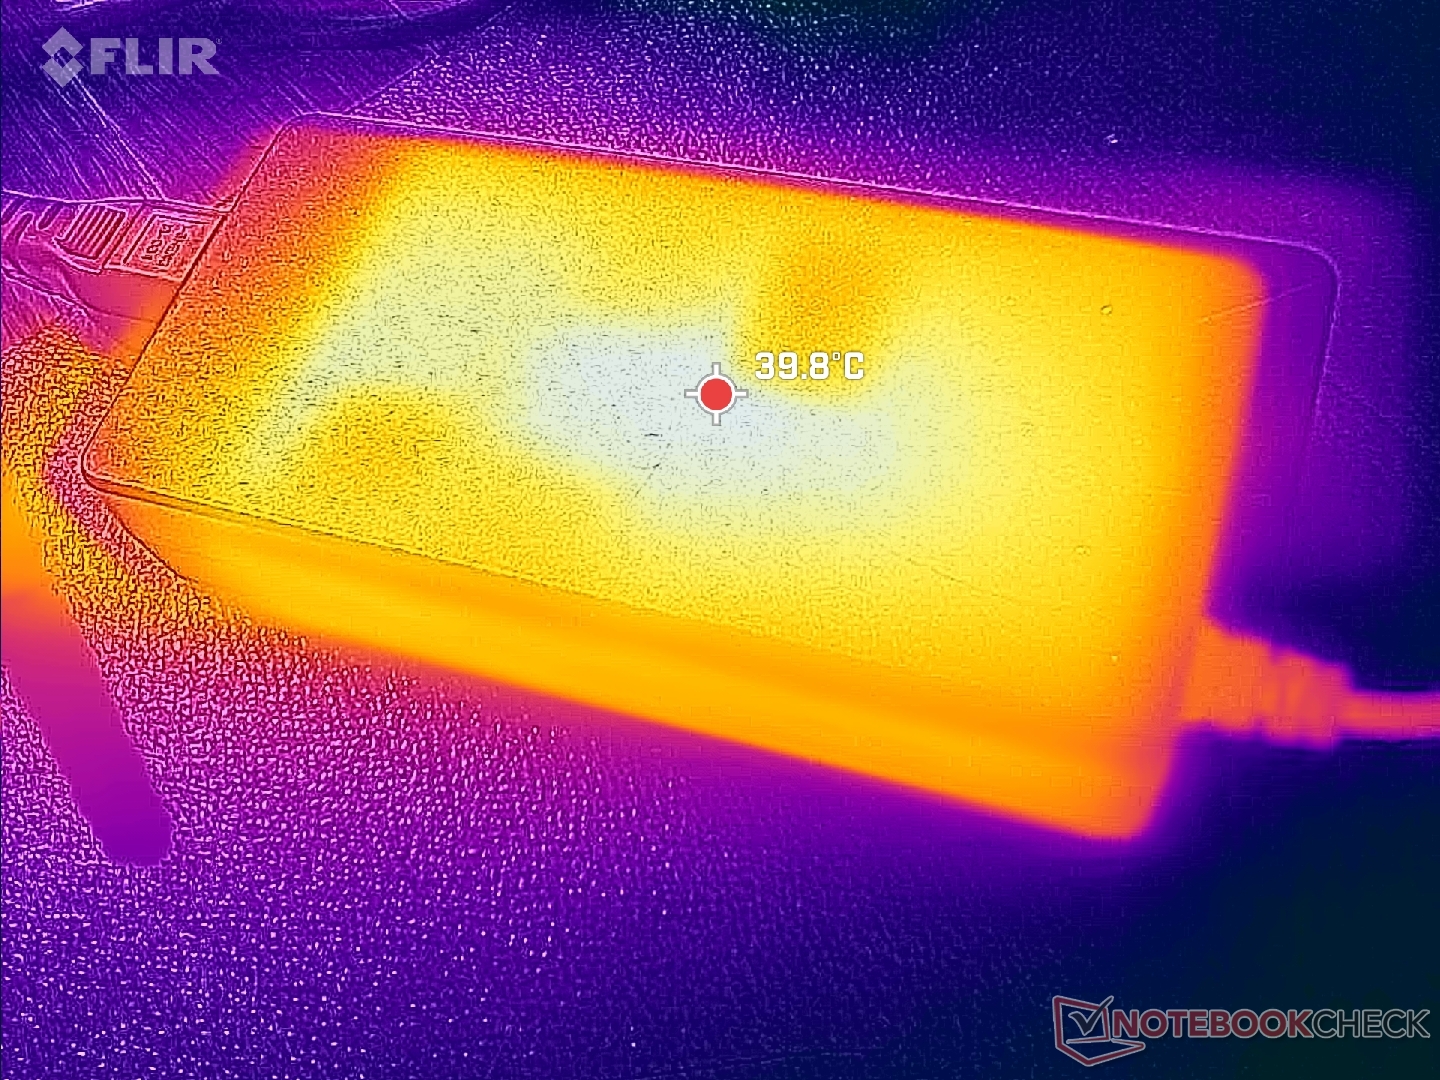
能源管理
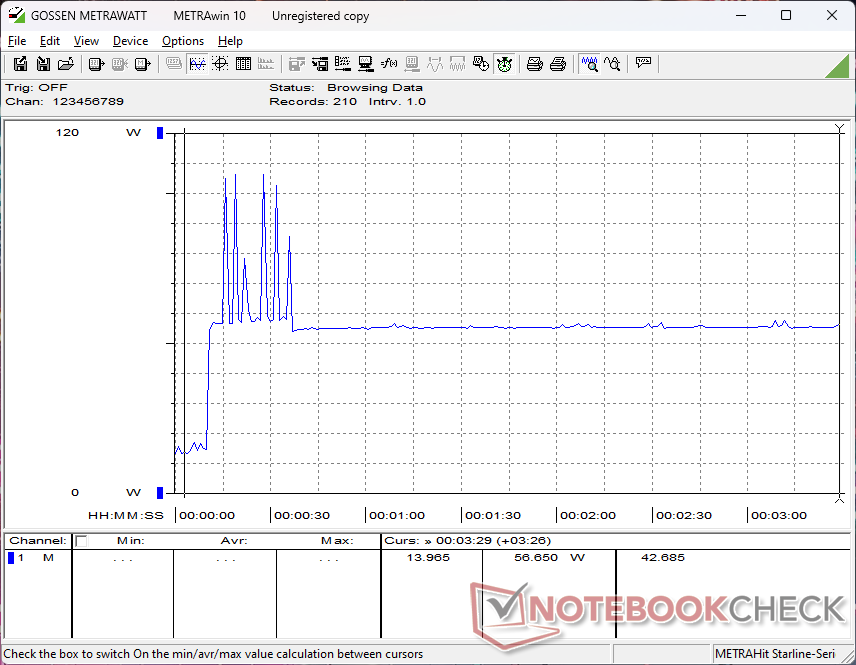
耗电量
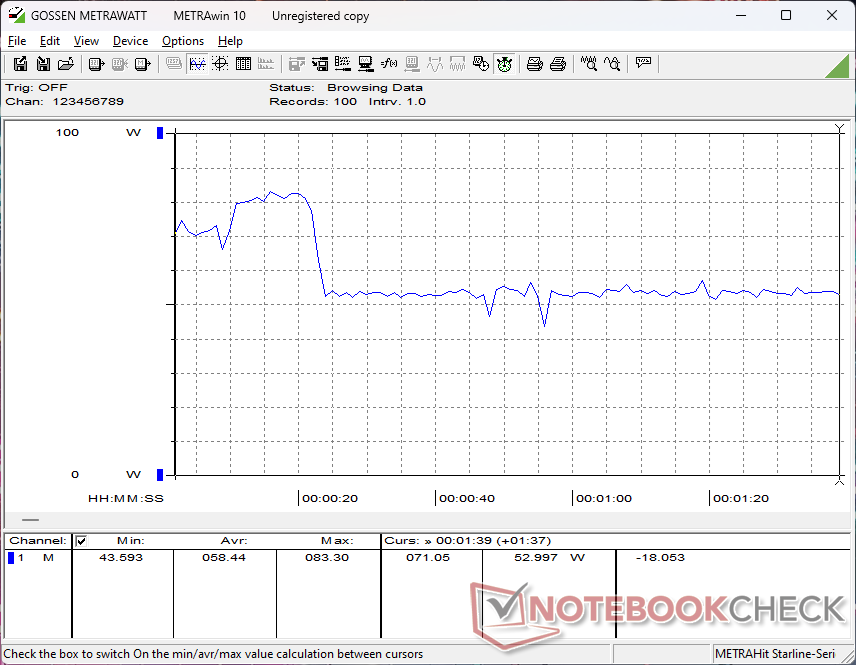
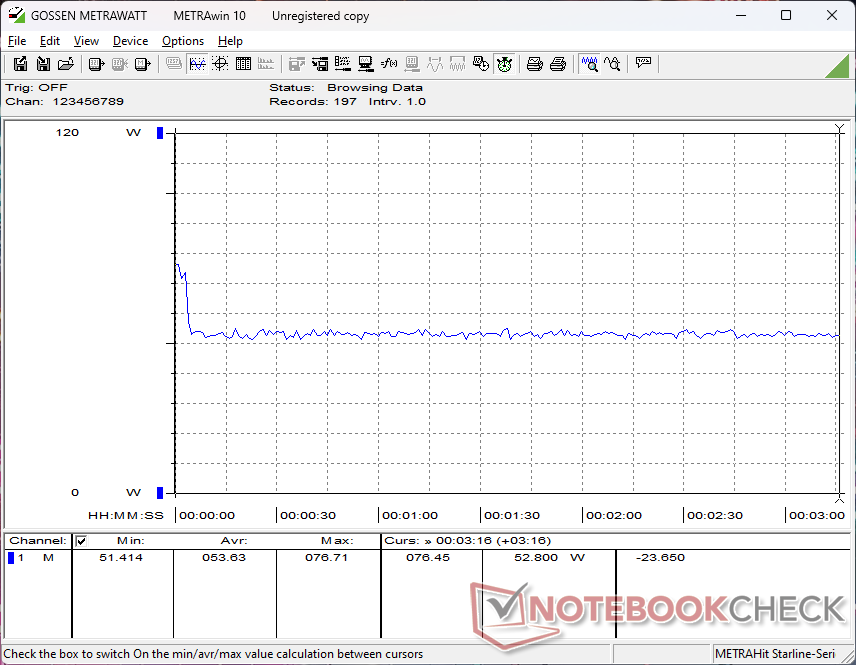
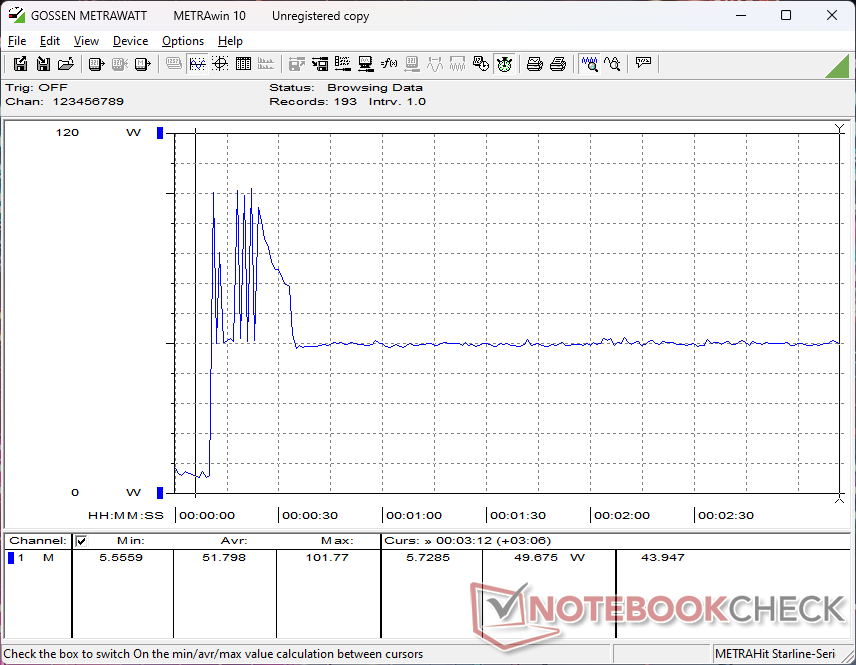
功耗与 S410 G4 相当,但与 CPU 有关的一个明显例外。如上所述,新的酷睿 i5-1350P 比酷睿 i7-1185G7 明显更快,但这是以更高的功耗为代价的,尤其是在启动 Turbo Boost 时。例如,当 Turbo Boost 速度最快时,在 Prime95 压力测试的前几秒钟,功耗可高达 102 W,而 S410 G4 的功耗仅为 73 W。即便如此,在任何节流之前和之后,新款 CPU 的每瓦性能仍然更胜一筹。
该机型配备的 90 瓦交流适配器与以前相同。
| Off / Standby | |
| Idle | |
| Load |
|
Key:
min: | |
| Getac S410 G5 i5-1350P, Iris Xe G7 80EUs, SSSTC CL4-8D512, IPS, 1920x1080, 14" | Getac S410 Gen 4 i7-1185G7, Iris Xe G7 96EUs, SSSTC CA5-8D256, IPS, 1920x1080, 14" | Durabook S14I i7-1165G7, Iris Xe G7 96EUs, UDinfo M2P M2P80DE512GBAEP, TN, 1920x1080, 14" | Dell Latitude 14 5420-D2G5W i5-1135G7, Iris Xe G7 80EUs, WDC PC SN530 SDBPTPZ-256G, IPS, 1920x1080, 14" | Dell Latitude 7330 Rugged Extreme i7-1185G7, Iris Xe G7 96EUs, , IPS, 1920x1080, 13.3" | Panasonic Toughbook 40 i7-1185G7, Iris Xe G7 96EUs, Samsung PM991 MZVLQ1T0HALB, IPS, 1920x1080, 14" | |
|---|---|---|---|---|---|---|
| Power Consumption | 10% | 11% | 44% | 23% | 18% | |
| Idle Minimum * | 7.9 | 8.3 -5% | 6.8 14% | 3.4 57% | 4.1 48% | 4.9 38% |
| Idle Average * | 14.4 | 10.5 27% | 16.4 -14% | 7.1 51% | 11.7 19% | 12.3 15% |
| Idle Maximum * | 15.2 | 14.9 2% | 16.9 -11% | 8.4 45% | 11.8 22% | 14 8% |
| Load Average * | 58.4 | 48.6 17% | 39.2 33% | 35.3 40% | 48.5 17% | 54 8% |
| Witcher 3 ultra * | 53.7 | 50.9 5% | 35.4 34% | 44.3 18% | 46.3 14% | |
| Load Maximum * | 106.5 | 90.1 15% | 73.1 31% | 67 37% | 91 15% | 83.6 22% |
* ... smaller is better
Power Consumption Witcher 3 / Stresstest
Power Consumption external Monitor
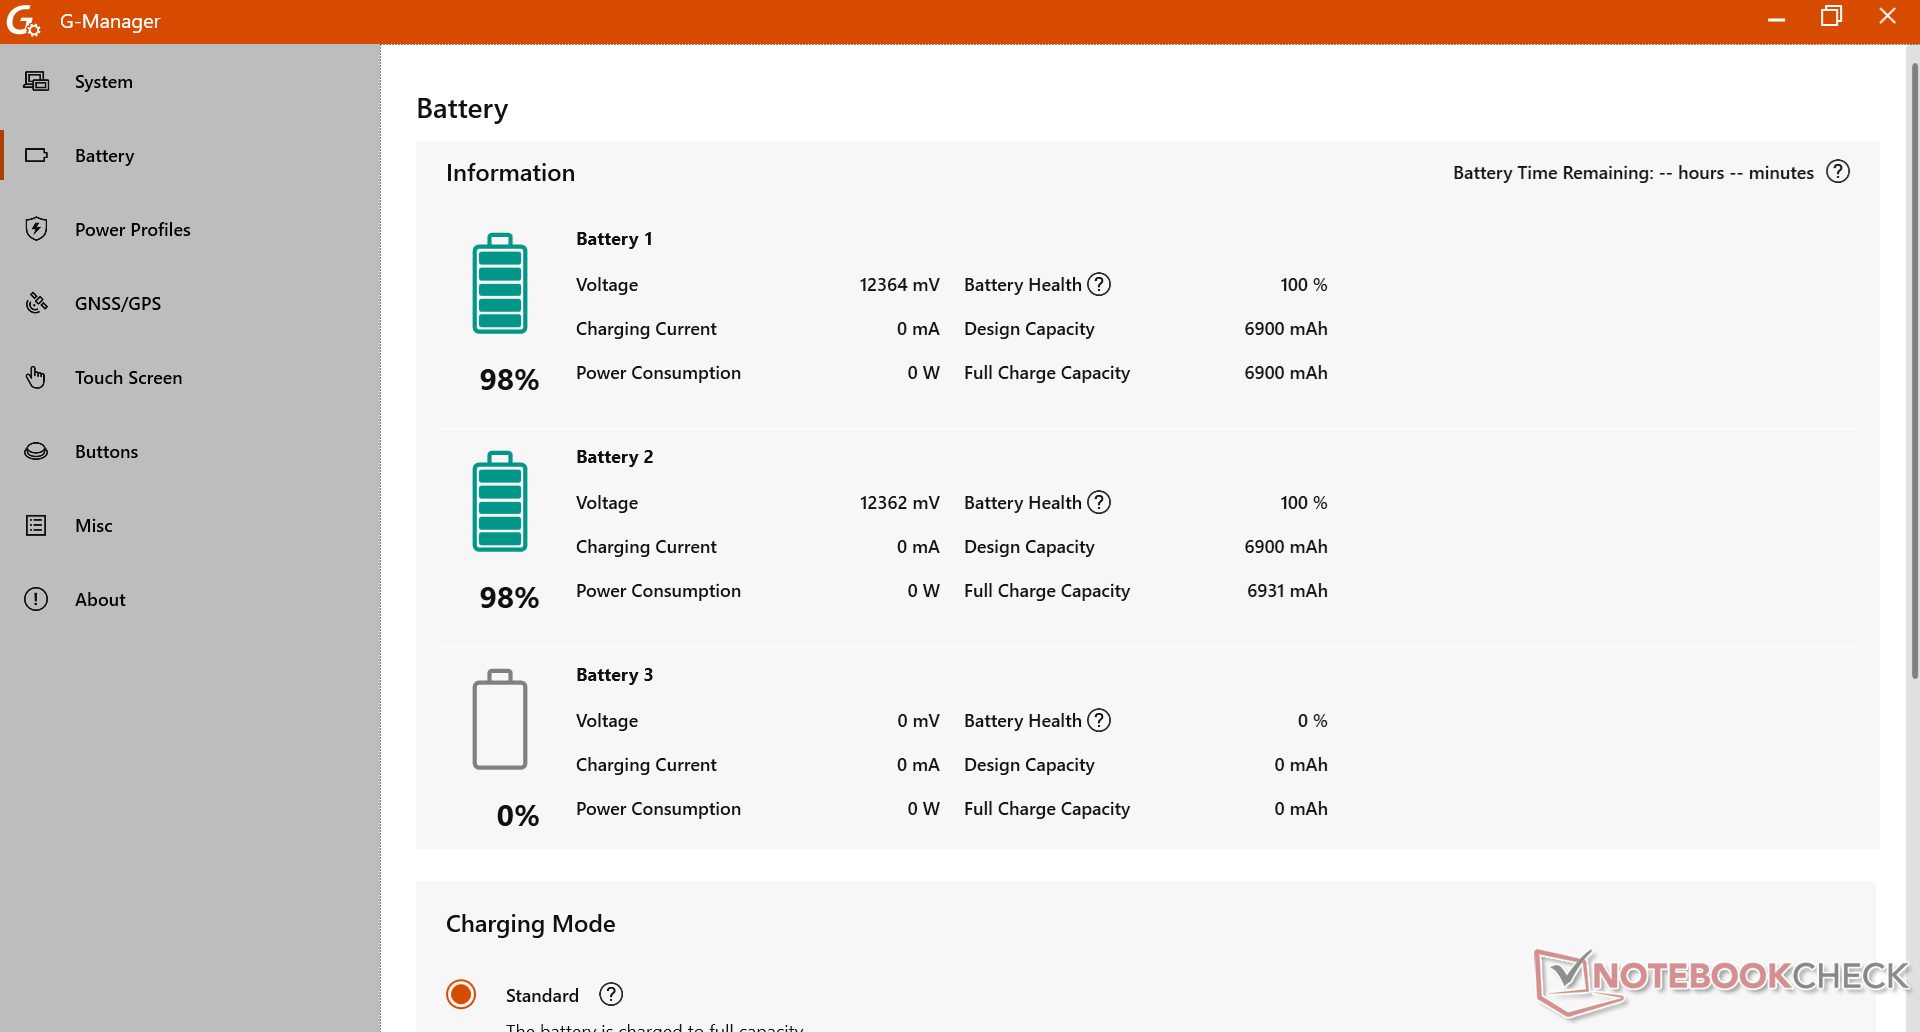
电池寿命
与 S410 G4 不同的是,我们的 S410 G5 测试机不包括内置电池,而是依靠两块可拆卸的 75 Wh 电池,总容量为 150 Wh。即使考虑到总容量较小的因素,无线局域网的运行时间仍然比去年的机型短得多(17.5 小时对 28.5 小时)。电池续航时间的差异在很大程度上归因于 Raptor Lake-P CPU 的要求更高,这一点在上文的功耗部分已经提到。
| Getac S410 G5 i5-1350P, Iris Xe G7 80EUs, 150 Wh | Getac S410 Gen 4 i7-1185G7, Iris Xe G7 96EUs, 194 Wh | Durabook S14I i7-1165G7, Iris Xe G7 96EUs, 50 Wh | Dell Latitude 14 5420-D2G5W i5-1135G7, Iris Xe G7 80EUs, 63 Wh | Dell Latitude 7330 Rugged Extreme i7-1185G7, Iris Xe G7 96EUs, 107 Wh | Panasonic Toughbook 40 i7-1185G7, Iris Xe G7 96EUs, 136 Wh | |
|---|---|---|---|---|---|---|
| Battery Runtime | 63% | -69% | -27% | 2% | 8% | |
| WiFi v1.3 | 1052 | 1715 63% | 329 -69% | 769 -27% | 1077 2% | 1137 8% |
| Reader / Idle | 1371 | |||||
| Load | 146 |
Pros
Cons
判决
S410 G5 保持了与上一代机型的兼容性,这对工业和政府应用非常重要。减少显示屏重影和提高 CPU 性能无疑是最新机型的亮点,也是购买 S410 G5 而不是旧款 S410 G4 的主要原因。电池续航时间因更快的 CPU 而受到影响,但仍然很长,尤其是系统可以支持多个电池组。同时,更高分辨率的网络摄像头和适当的 Wi-Fi 6E 支持也是不错的额外配置。
由于采用了新的第 13 代 CPU,坚固耐用的 Getac S410 G5 比以前快了很多。不过,一些内部和外部功能需要更新,以改善用户体验。
我们希望在未来的版本中能解决一些恼人的设计问题。例如,一个更大的风扇将有助于降低风扇噪音。扬声器的音量可以更大,端口盖可以更容易打开。此外,键盘按键也不太可靠,有可能敲击某个按键时没有记录输入。这些缺点在 S410 系列上一直存在,而且一年比一年更难忽视。
价格和供应情况
报价可如需报价,请访问 Getac 官方网站。
Getac S410 G5
- 06/05/2024 v7 (old)
Allen Ngo
Transparency
The selection of devices to be reviewed is made by our editorial team. The test sample was provided to the author as a loan by the manufacturer or retailer for the purpose of this review. The lender had no influence on this review, nor did the manufacturer receive a copy of this review before publication. There was no obligation to publish this review. We never accept compensation or payment in return for our reviews. As an independent media company, Notebookcheck is not subjected to the authority of manufacturers, retailers or publishers.
This is how Notebookcheck is testing
Every year, Notebookcheck independently reviews hundreds of laptops and smartphones using standardized procedures to ensure that all results are comparable. We have continuously developed our test methods for around 20 years and set industry standards in the process. In our test labs, high-quality measuring equipment is utilized by experienced technicians and editors. These tests involve a multi-stage validation process. Our complex rating system is based on hundreds of well-founded measurements and benchmarks, which maintains objectivity. Further information on our test methods can be found here.
Price comparison

