

Gigabyte G5 KE评论:中档游戏笔记本,能满足大部分需求
Gigabyte根据性能和预算提供了几个笔记本等级。虽然Aorus和Aero系列是针对高端游戏和内容创作领域,但传统的技嘉变体,如G5和G7,是针对更主流的游戏观众。
我们以前审查过17.3英寸 技嘉G7 KE而现在我们要测试的是15.6英寸的技嘉G5 KE,规格基本相似。
我们的技嘉G5 KE单位配备了一个 英特尔第12代酷睿i5-12500H处理器、 NvidiaGeForce RTX 3060 笔记本电脑GPU,16GB内存,512GB SSD,以及15.6英寸144赫兹IPS面板。
这个配置将使你在印度市场上的94,990英镑(1,155美元)。在这篇评论中,我们对技嘉G5 KE进行了一次旋转,看看它是否能与中端游戏领域的同行相媲美。
潜在的竞争对手比较
Rating | Date | Model | Weight | Height | Size | Resolution | Price |
|---|---|---|---|---|---|---|---|
| 81.8 % v7 (old) | 04 / 2023 | Gigabyte G5 KE i5-12500H, GeForce RTX 3060 Laptop GPU | 2 kg | 23.9 mm | 15.60" | 1920x1080 | |
| 82.8 % v7 (old) | 10 / 2022 | Lenovo IdeaPad Gaming 3 15IAH7 i5-12500H, GeForce RTX 3050 Ti Laptop GPU | 2.4 kg | 26 mm | 15.60" | 1920x1080 | |
| 83.3 % v7 (old) | 01 / 2023 | Gigabyte G7 KE i5-12500H, GeForce RTX 3060 Laptop GPU | 2.6 kg | 25 mm | 17.30" | 1920x1080 | |
| 87.4 % v7 (old) | 09 / 2022 | Honor MagicBook 14 2022 i5-12500H, GeForce RTX 2050 Mobile | 1.6 kg | 16.9 mm | 14.00" | 2160x1440 | |
| 87.9 % v7 (old) | 01 / 2023 | SCHENKER XMG Core 15 (M22) R7 6800H, GeForce RTX 3060 Laptop GPU | 2.1 kg | 23 mm | 15.60" | 2560x1440 | |
| 86.1 % v7 (old) | 10 / 2022 | Dell G16 7620 i7-12700H, GeForce RTX 3060 Laptop GPU | 2.6 kg | 26.9 mm | 16.00" | 2560x1600 | |
| 82.3 % v7 (old) | 09 / 2022 | Gigabyte A5 K1 R5 5600H, GeForce RTX 3060 Laptop GPU | 2.2 kg | 34 mm | 15.60" | 1920x1080 | |
| 87.2 % v7 (old) | 03 / 2022 | Asus TUF Gaming F15 FX507ZM i7-12700H, GeForce RTX 3060 Laptop GPU | 2.1 kg | 24.95 mm | 15.60" | 1920x1080 | |
| 84.3 % v7 (old) | 10 / 2021 | HP Victus 16-e0179ng R7 5800H, GeForce RTX 3060 Laptop GPU | 2.5 kg | 23.5 mm | 16.10" | 1920x1080 |
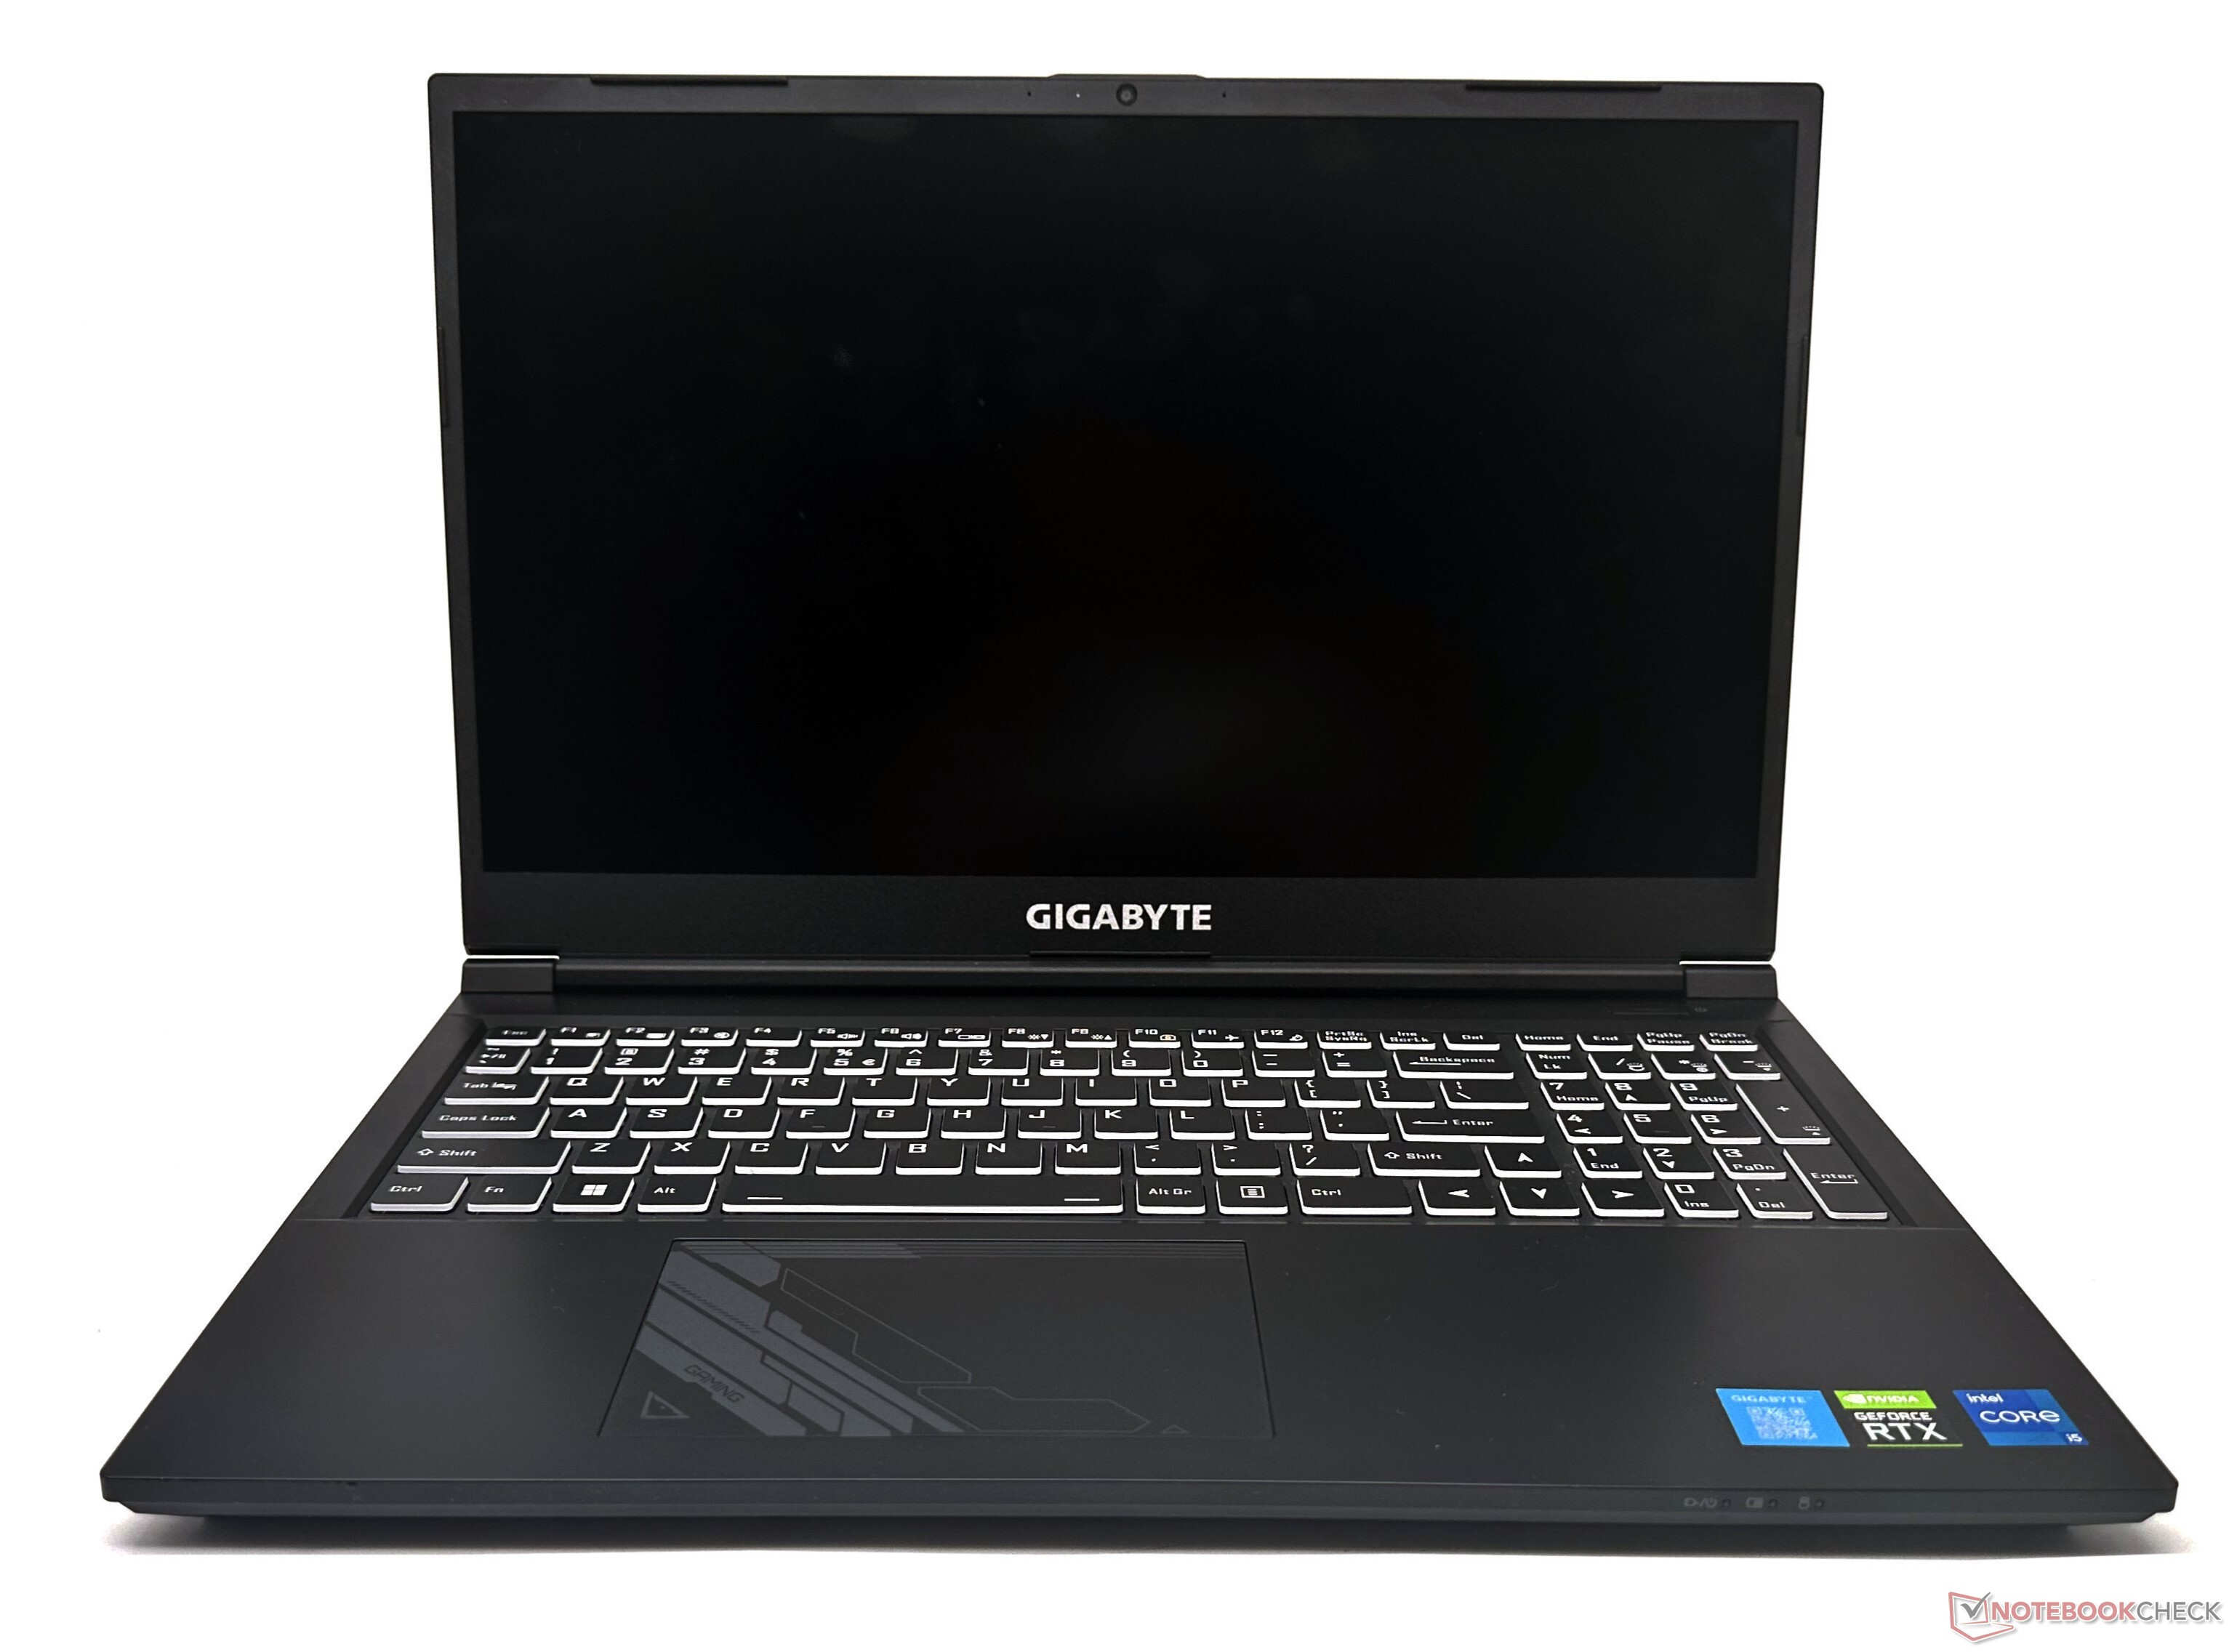
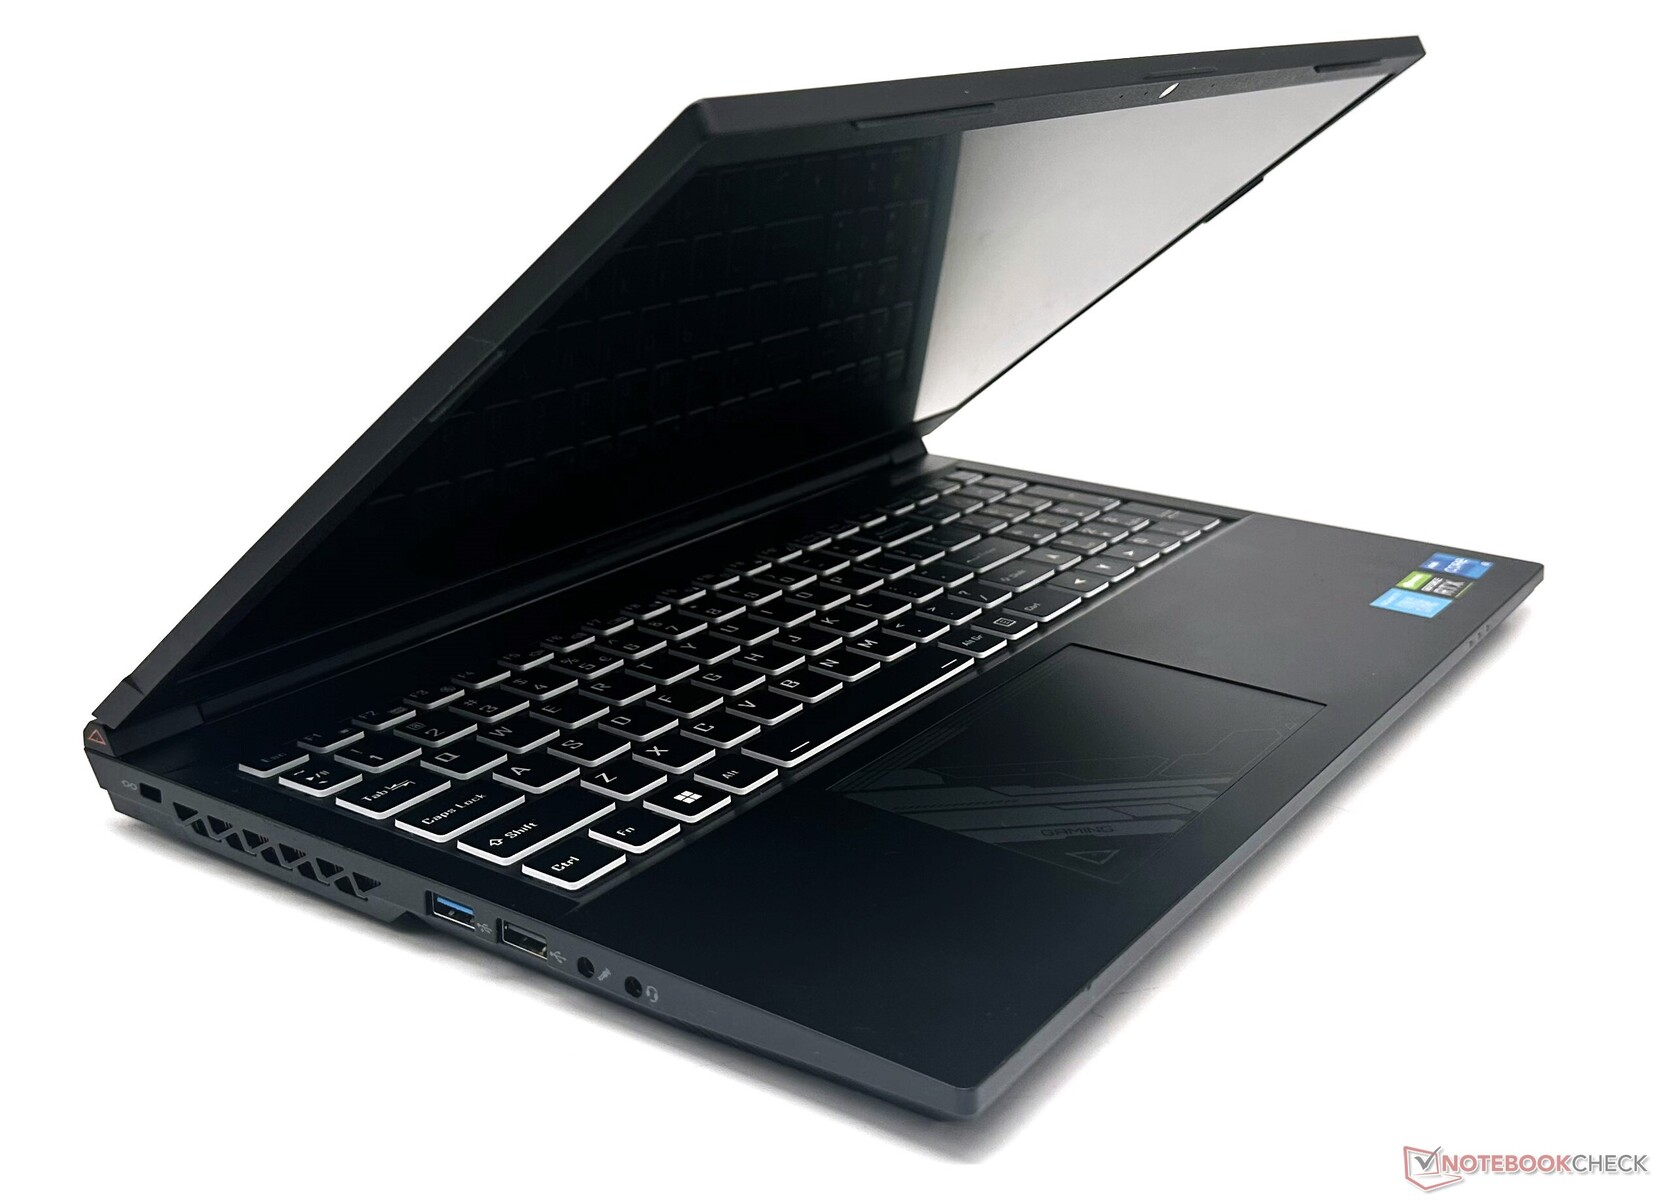
底盘:主要是塑料,有一些弯曲
Gigabyte G5 KE的结构在这个价格范围内是预期的。它基本上是一个Clevo设计,完全是塑料结构,表面光滑、无光泽,在盖子的背面和触摸板上有一些微妙的点缀。
G5 KE的厚度为23.9毫米,与该细分市场上的竞争对手相似,同时比G5 K1要薄很多。 技嘉A5 K1.
G5 KE的机箱不是我们所见过的最坚硬的机箱--在键盘甲板的压力下有相当大的弯曲,盖子也会出现扭曲的情况。然而,用户在日常使用中不可能遇到这种情况。
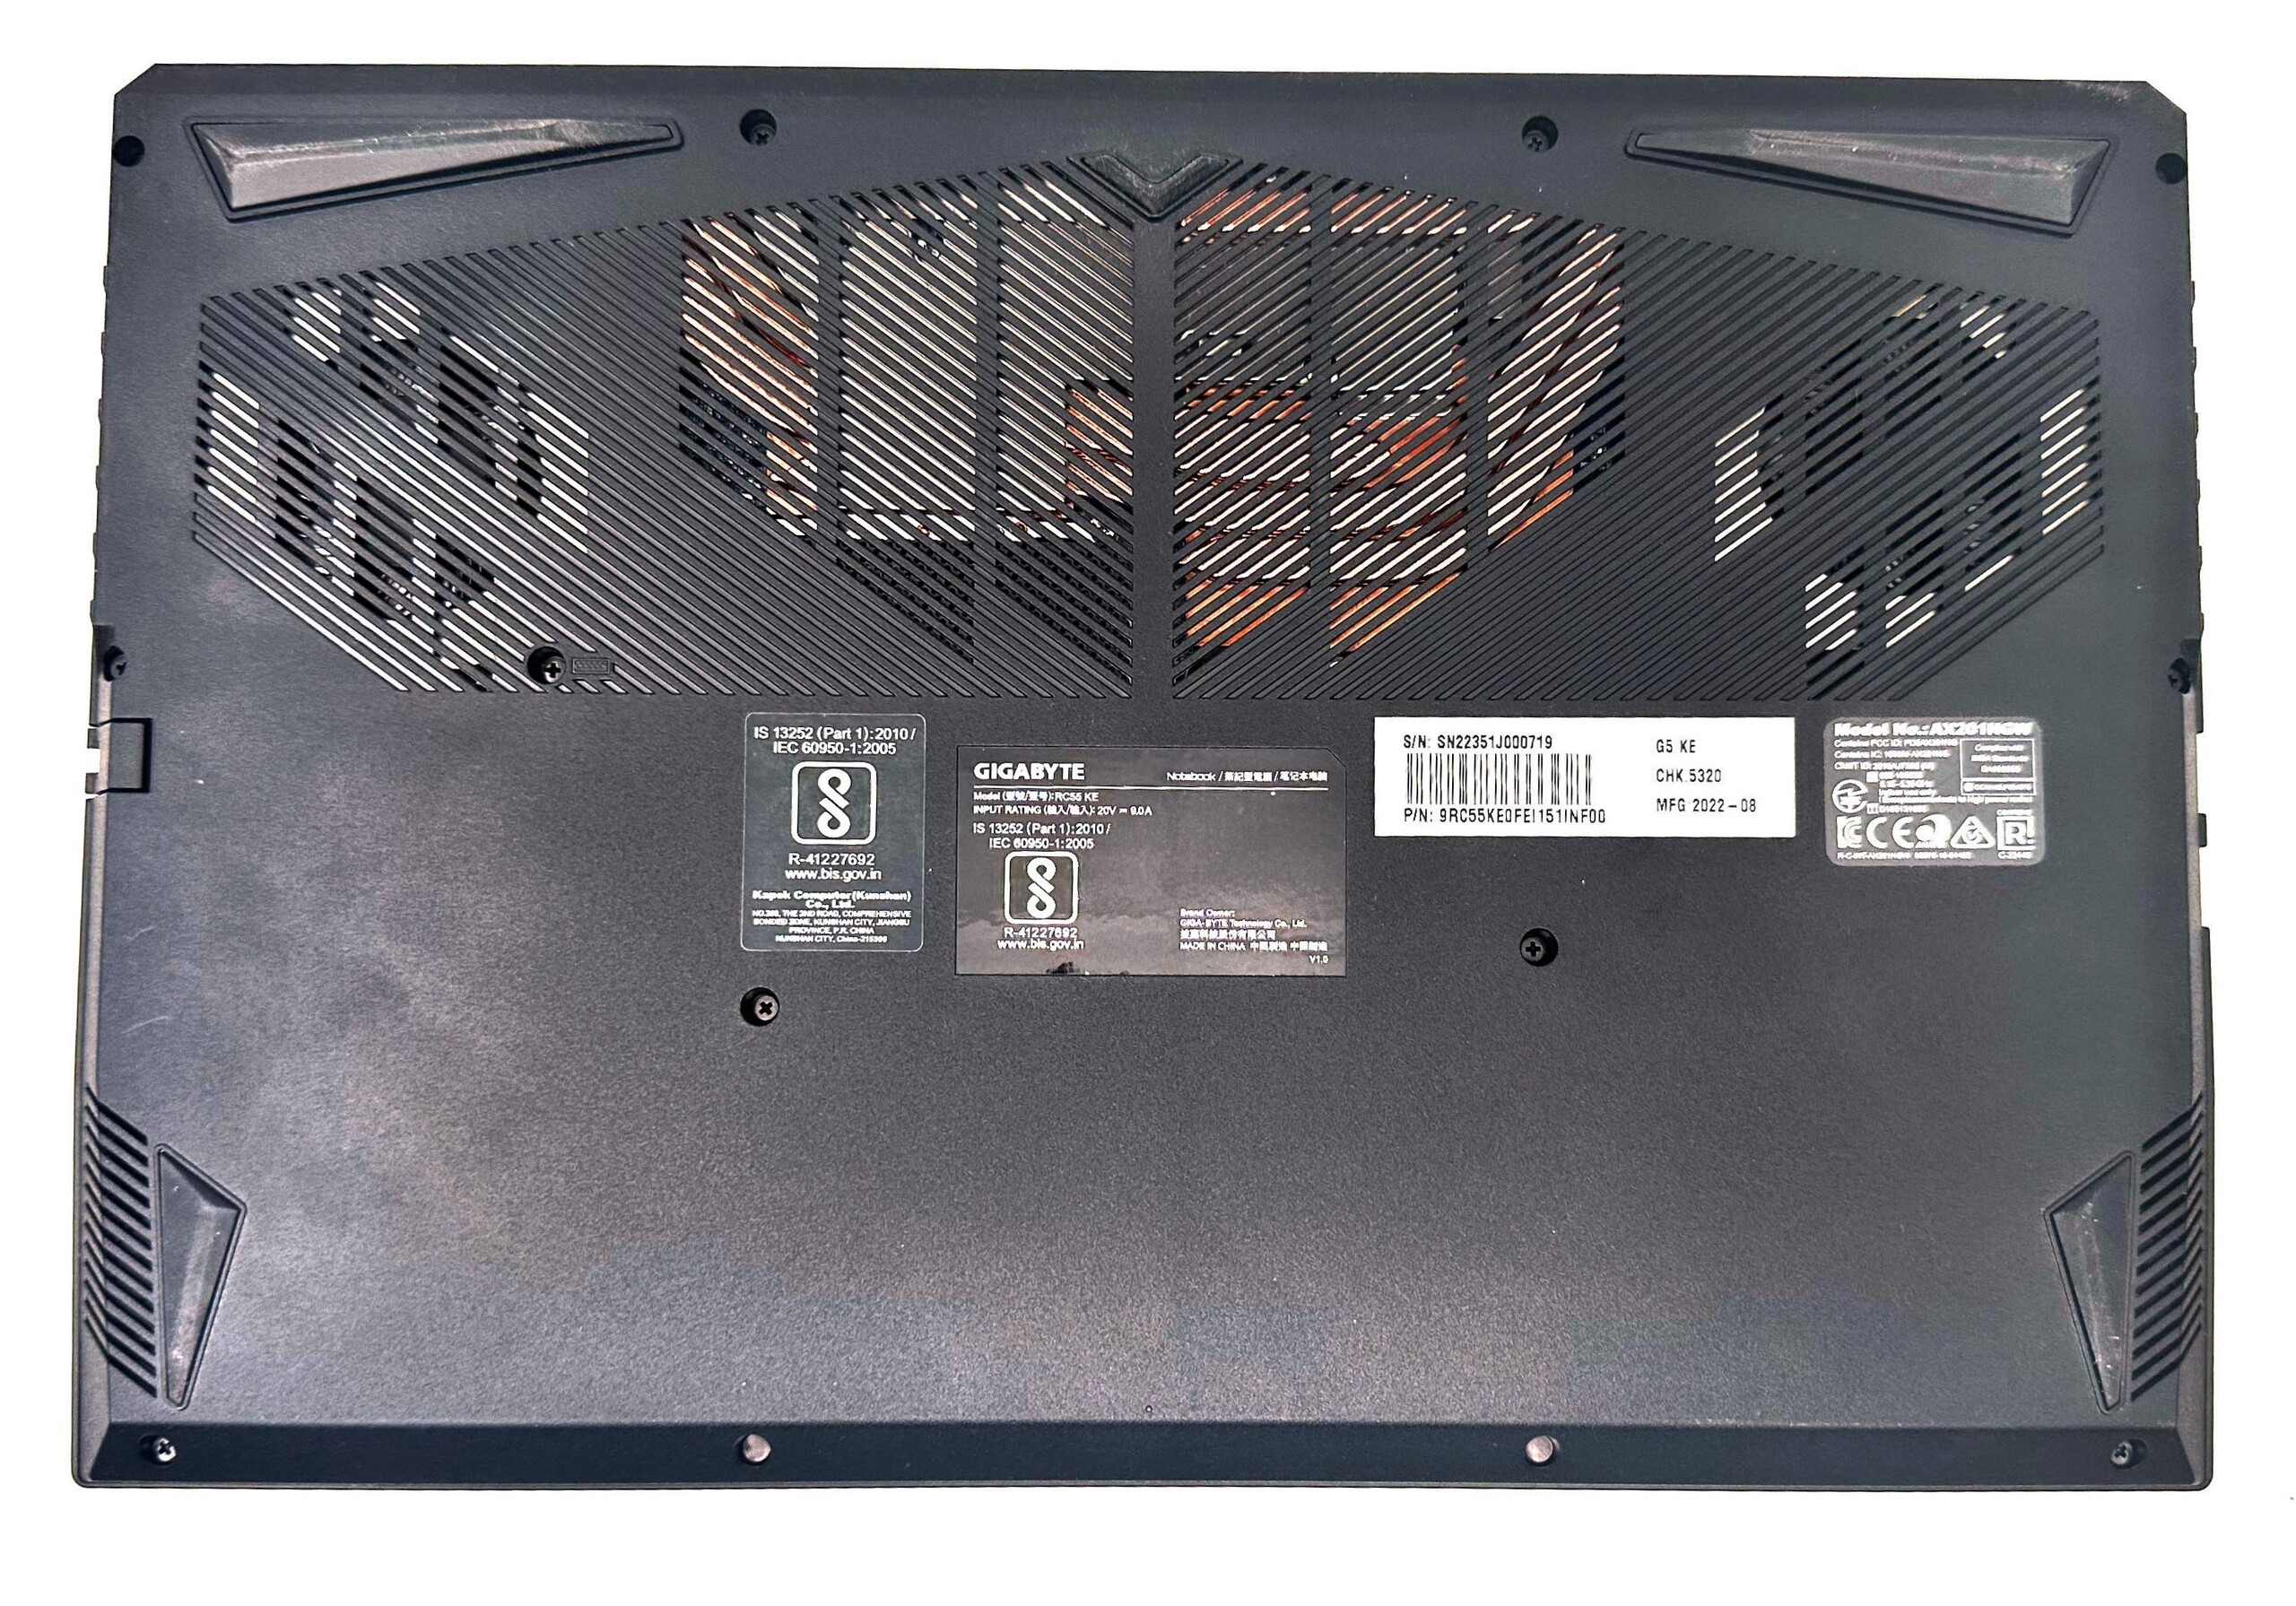
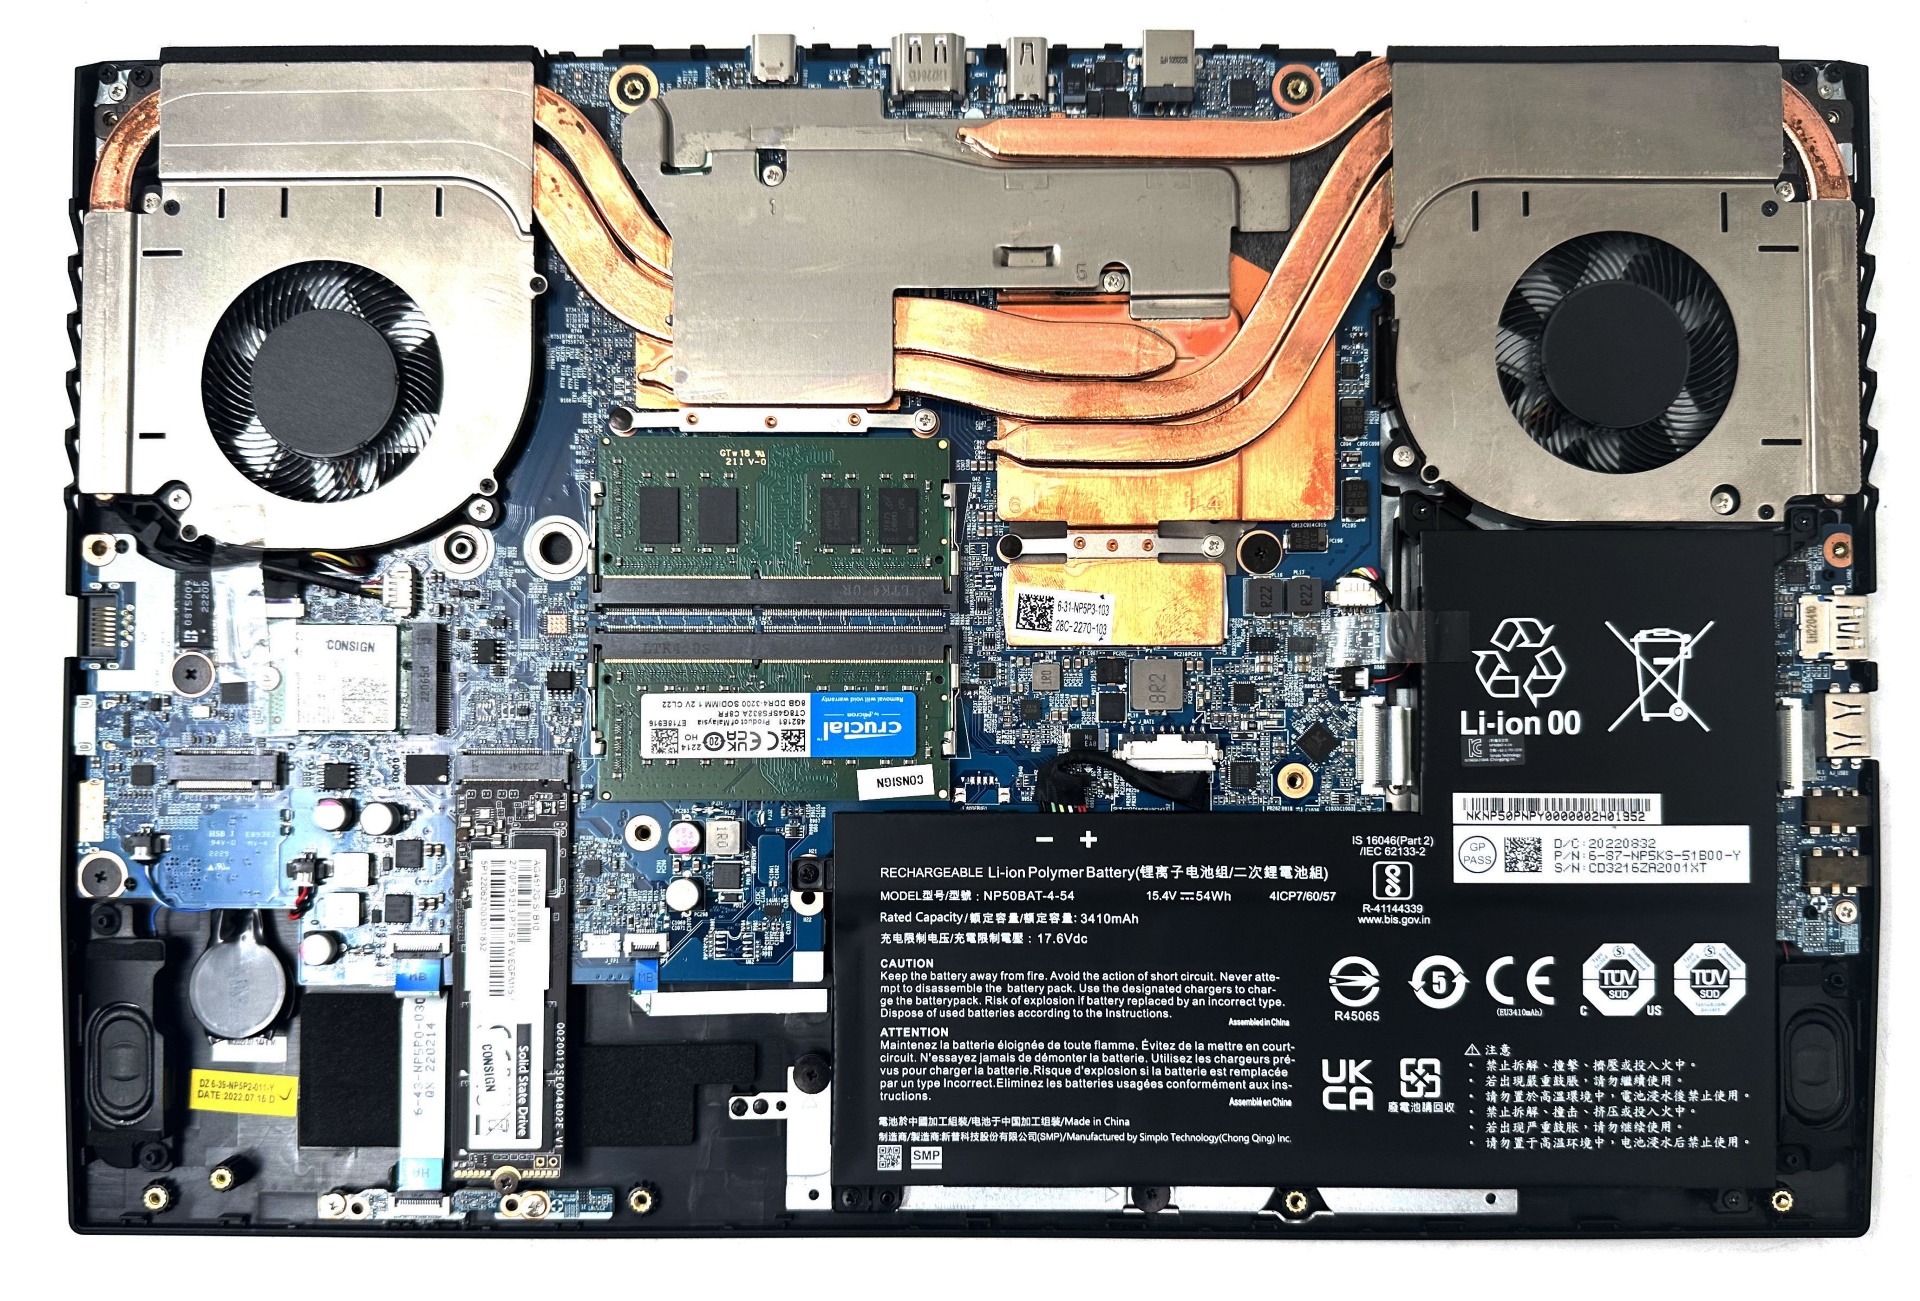
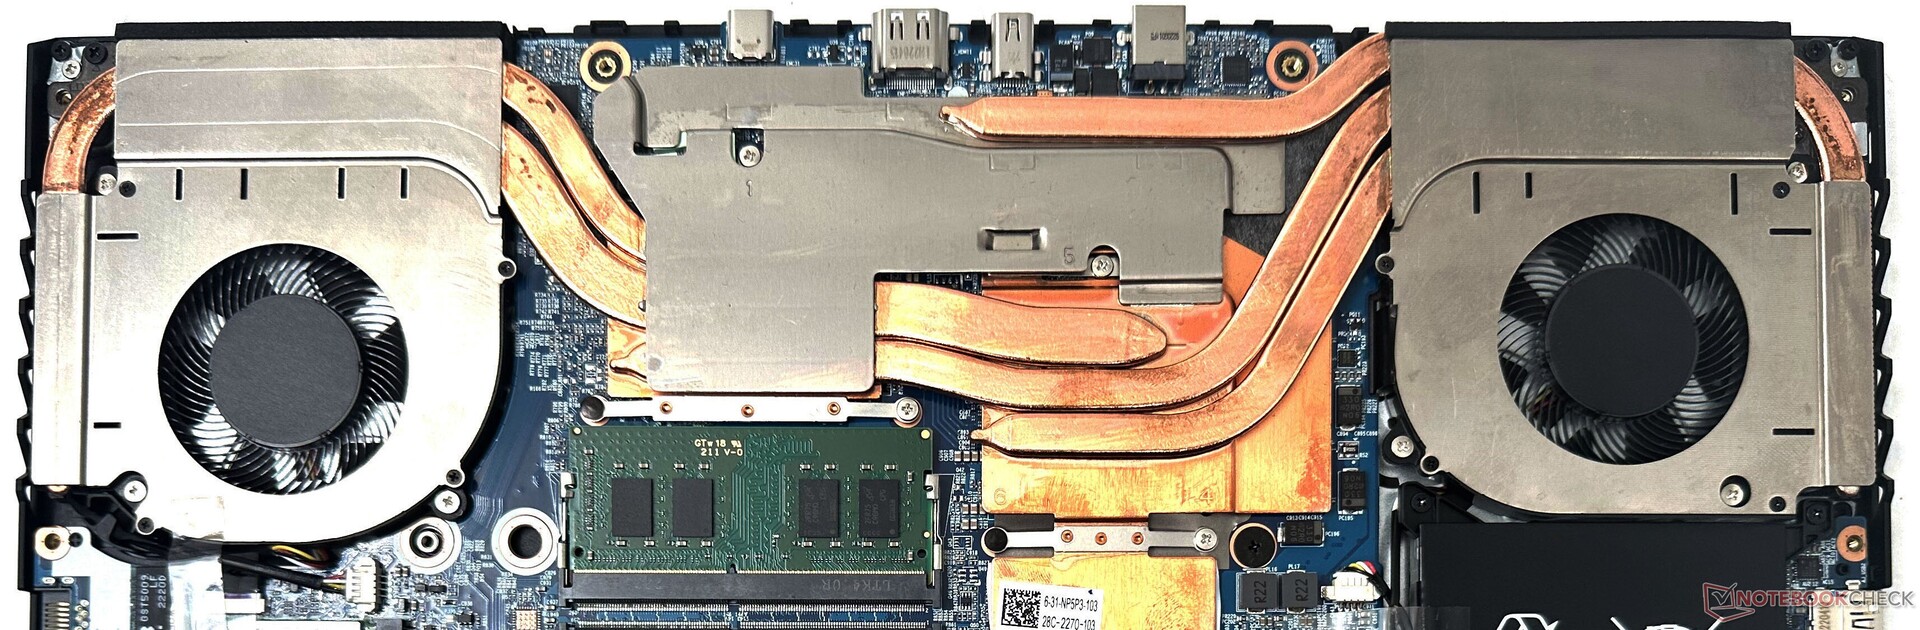
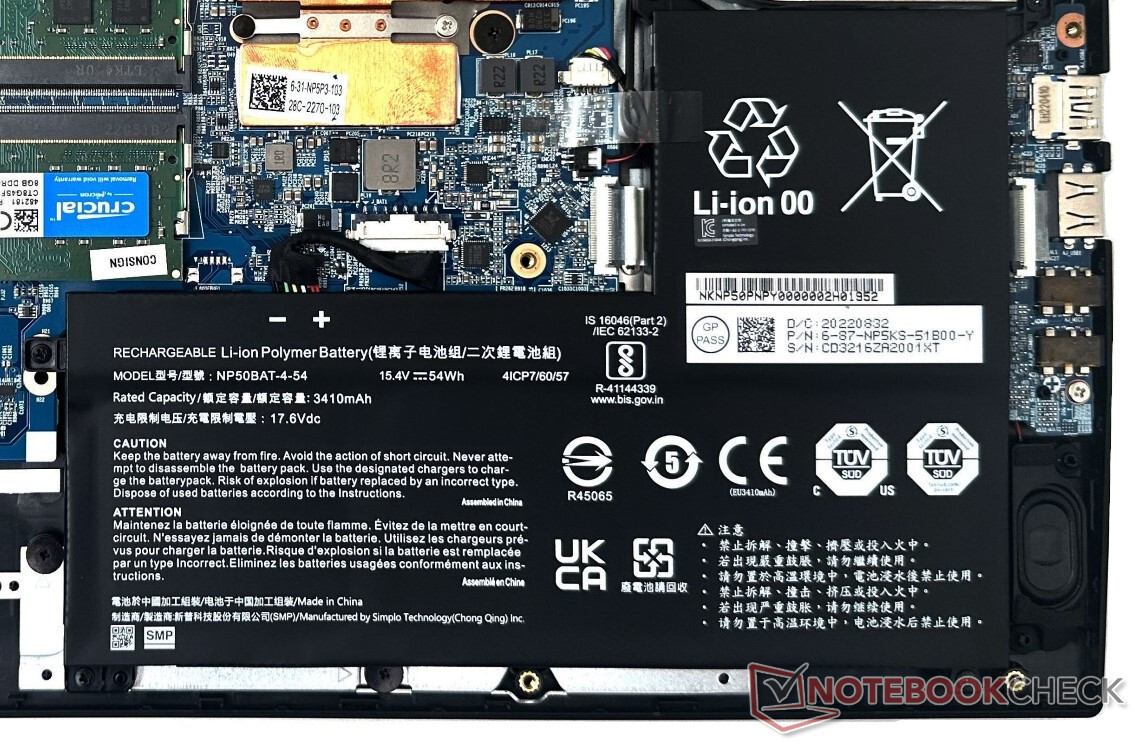
打开13个飞利浦螺钉,就可以看到内部结构。如果需要,DDR4内存、WLAN卡和固态硬盘可以被替换和升级。


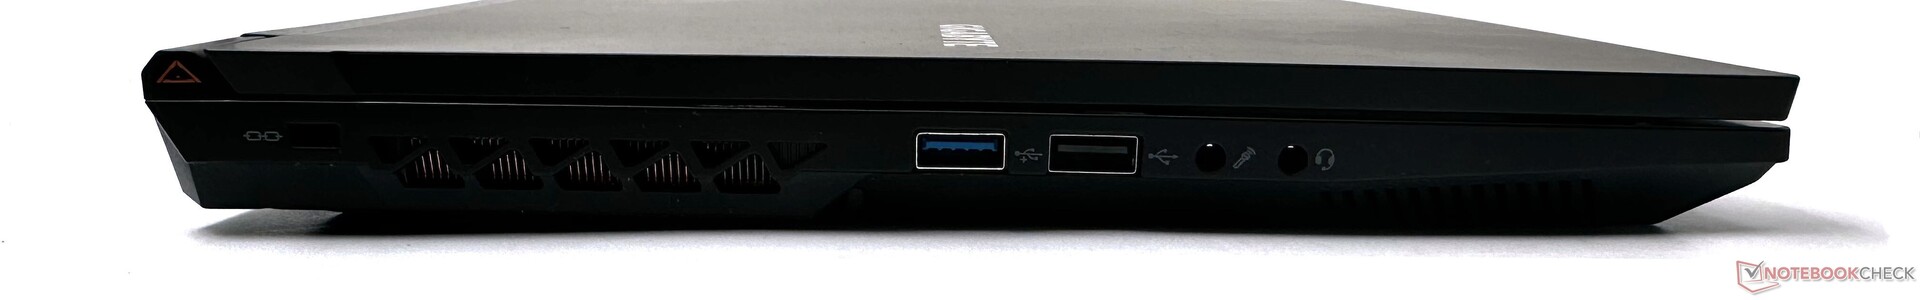
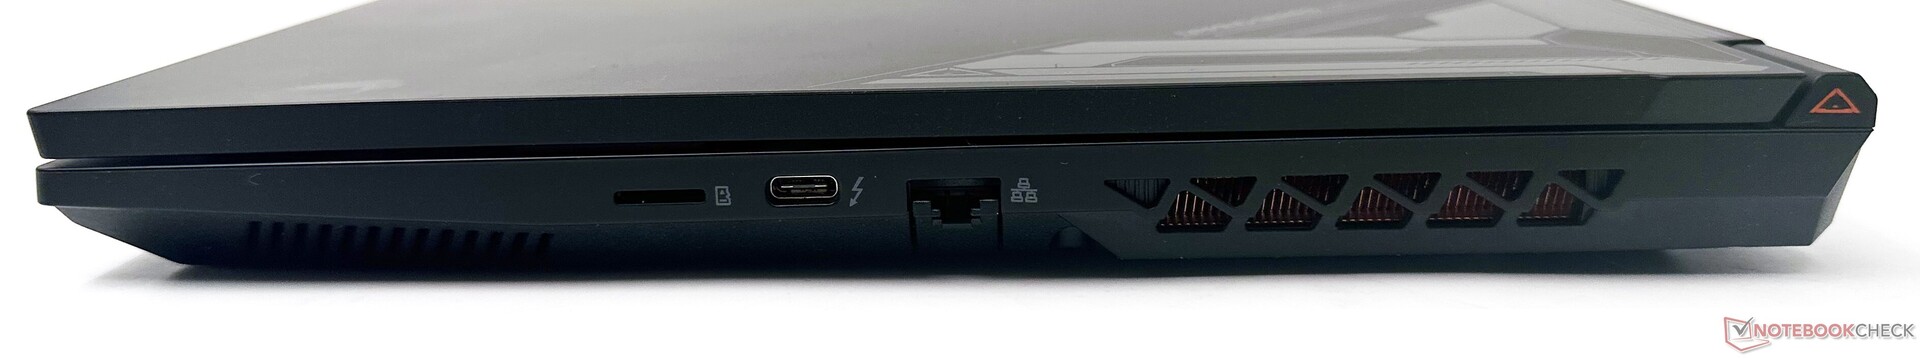
连接性:充足的端口选择和稳定的Wi-Fi
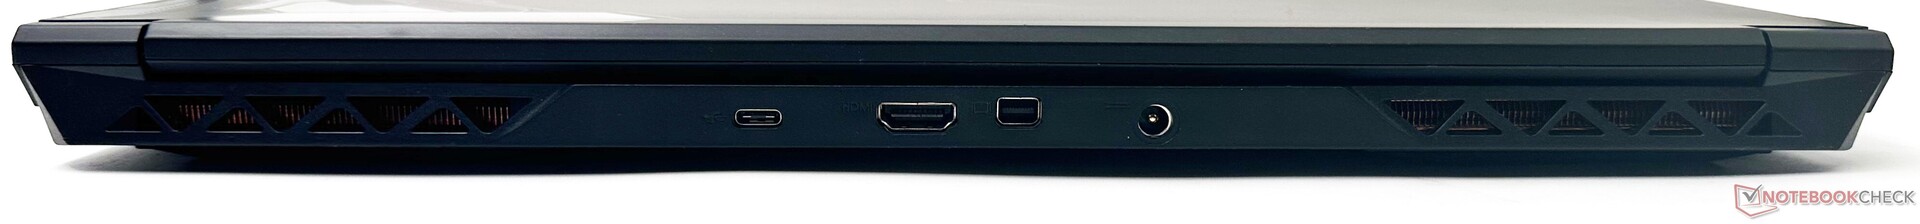
G5 KE提供了一个全面的端口选择,有USB Type-A和Type-C端口的组合,包括Thunderbolt 4。除了HDMI 2.1外,还有一个迷你显示端口1.4,有助于轻松连接到具有高刷新率的4K显示器。
这些端口在连接多个设备时不会构成任何障碍。一个专用的麦克风输入端口--现在很罕见--对连接高质量的麦克风很有帮助,或者可以重新配置以支持多通道音频。
微型SD卡的读取速度可能会更好,但G5 KE在这方面没有什么竞争力。
| SD Card Reader | |
| average JPG Copy Test (av. of 3 runs) | |
| Average of class Gaming (19 - 197.3, n=67, last 2 years) | |
| Gigabyte G5 KE (AV PRO microSD 128 GB V60) | |
| SCHENKER XMG Core 15 (M22) (AV PRO microSD 128 GB V60) | |
| HP Victus 16-e0179ng (AV PRO microSD 128 GB V60) | |
| maximum AS SSD Seq Read Test (1GB) | |
| Average of class Gaming (25.8 - 258, n=66, last 2 years) | |
| Gigabyte G5 KE (AV PRO microSD 128 GB V60) | |
| Gigabyte G7 KE (AV PRO microSD 128 GB V60) | |
| SCHENKER XMG Core 15 (M22) (AV PRO microSD 128 GB V60) | |
| HP Victus 16-e0179ng (AV PRO microSD 128 GB V60) | |
G5 KE不提供Wi-Fi 6E。然而,我们观察到,在与我们的参考华硕ROG Rapture GT-AXE11000路由器一起测试时,5GHz频段的吞吐量非常好且相当稳定。
720p的网络摄像头显示出较大的色彩偏差,图像缺乏整体清晰度。它应该仍然可以满足一两个奇怪的视频通话。


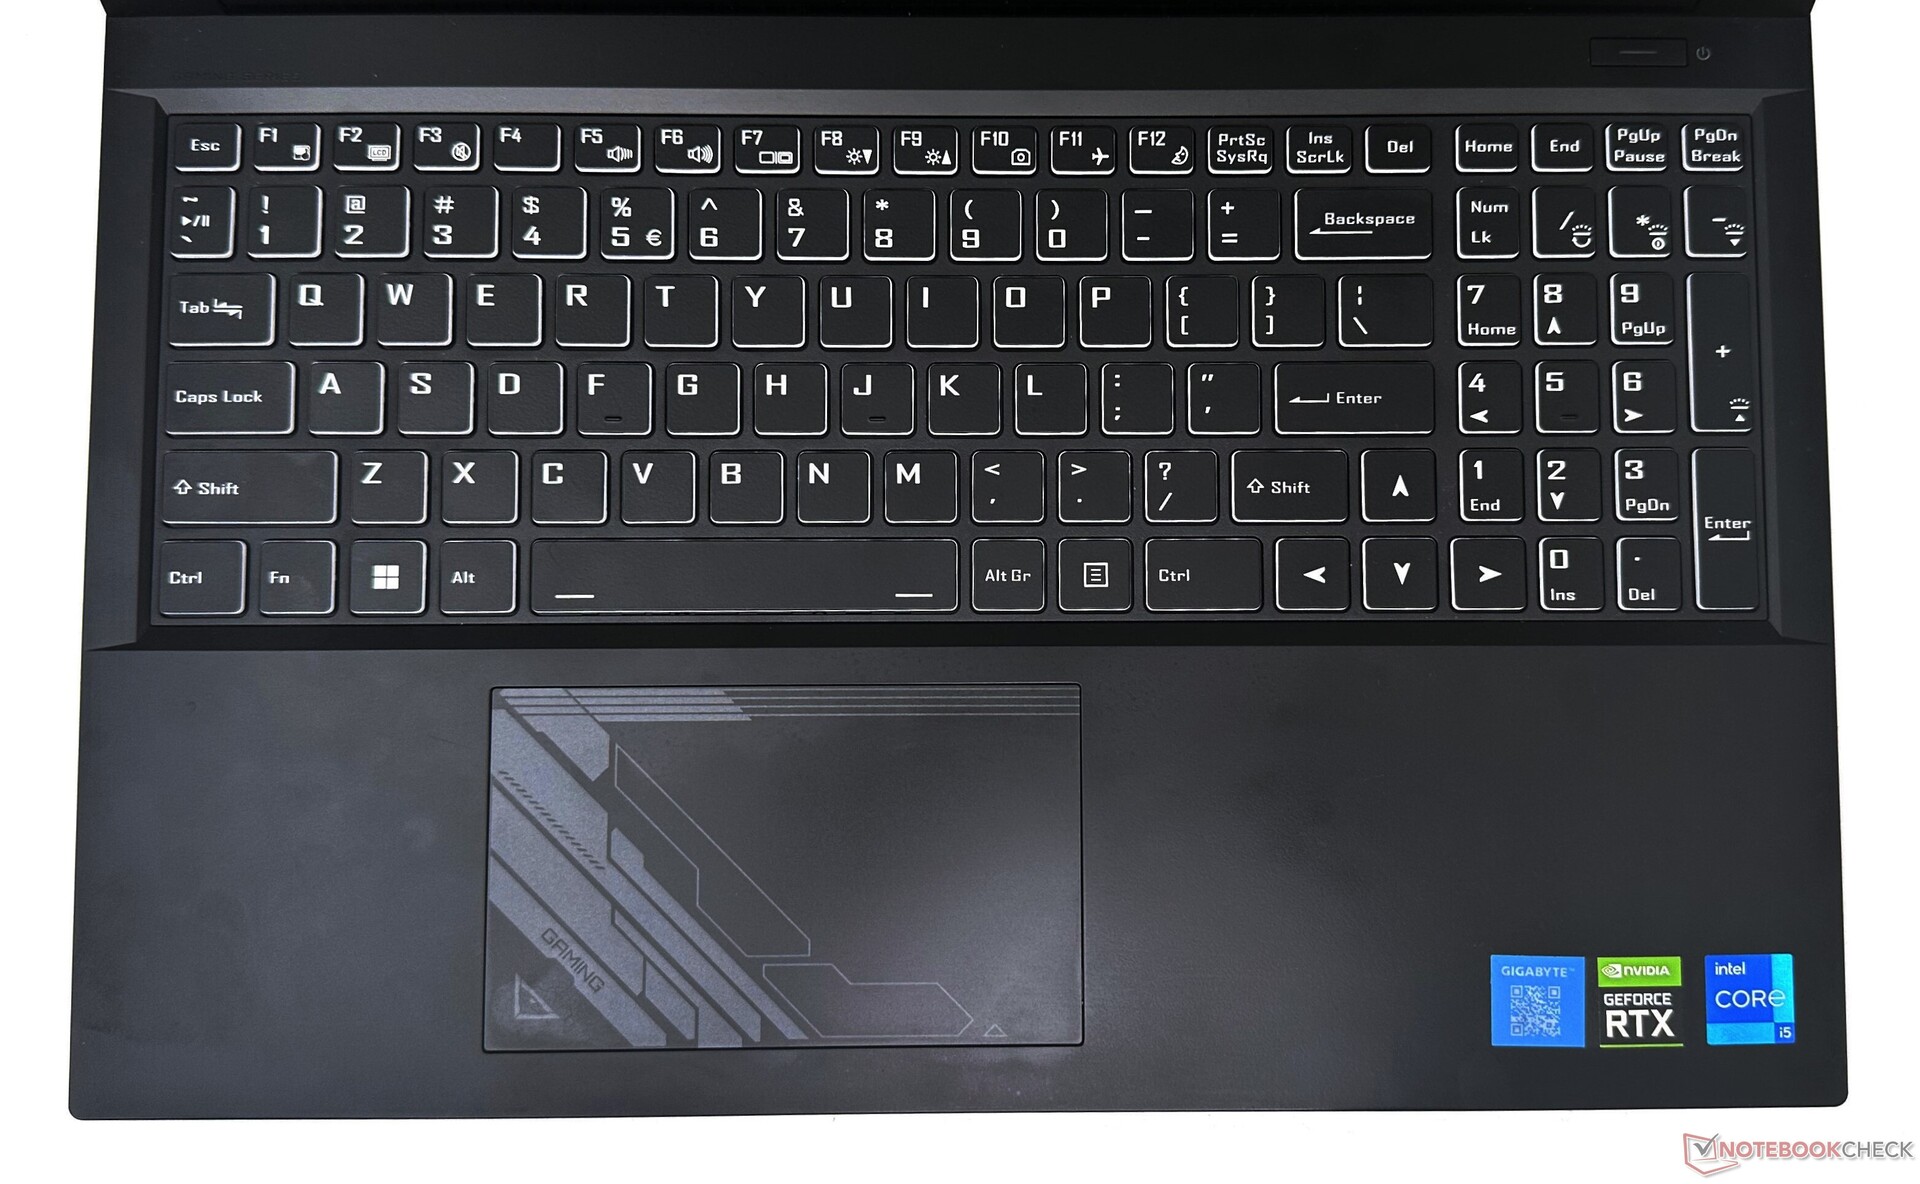
输入设备:全尺寸方向键
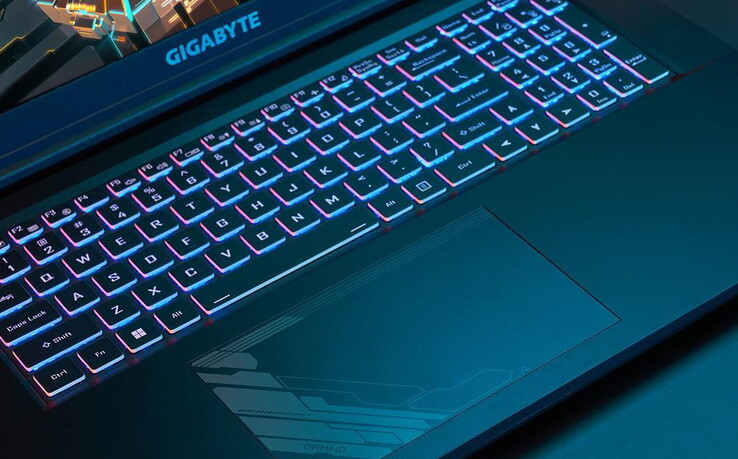
Chiclet键盘提供了体面的行程和驱动力。然而,打字时感觉有些糊糊的,触觉反馈也有点欠缺。全尺寸的方向键允许在文档和电子表格中进行舒适的导航。
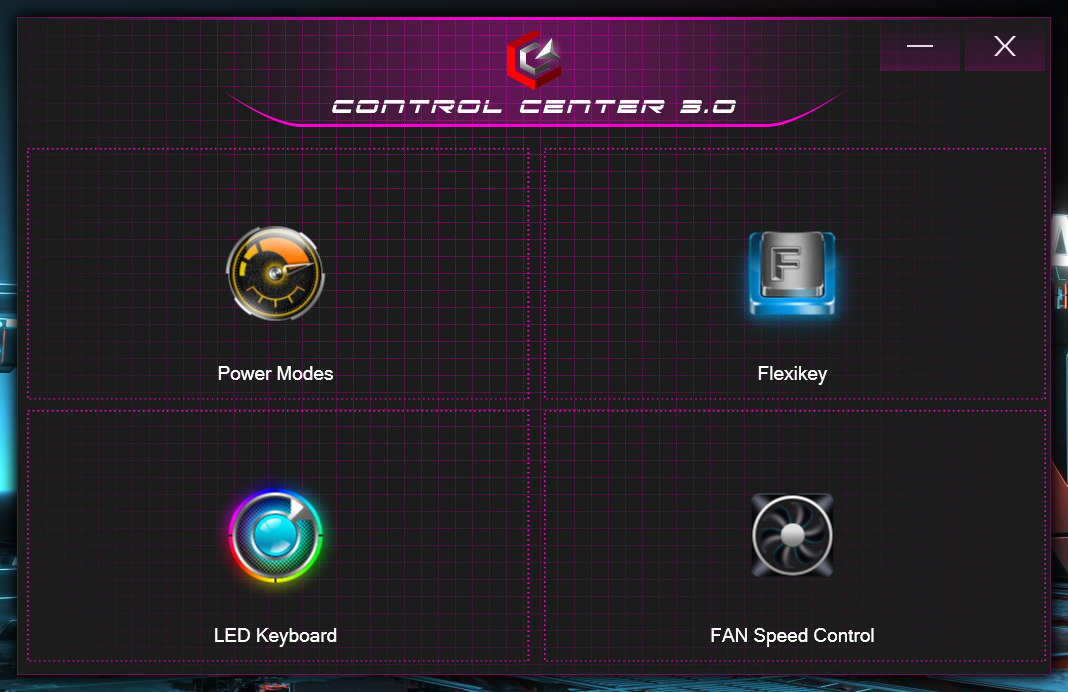
RGB背光可以分四步调整。这不是一个多区RGB键盘,但通过控制中心3.0软件可以进行一些定制。
12厘米×7.5厘米的触摸板空间足够大,支持WindowsPrecision 手势,并提供了良好的滑行体验,阻力最小。整个表面就像一个鼠标左键。点击的行程短,触感好。
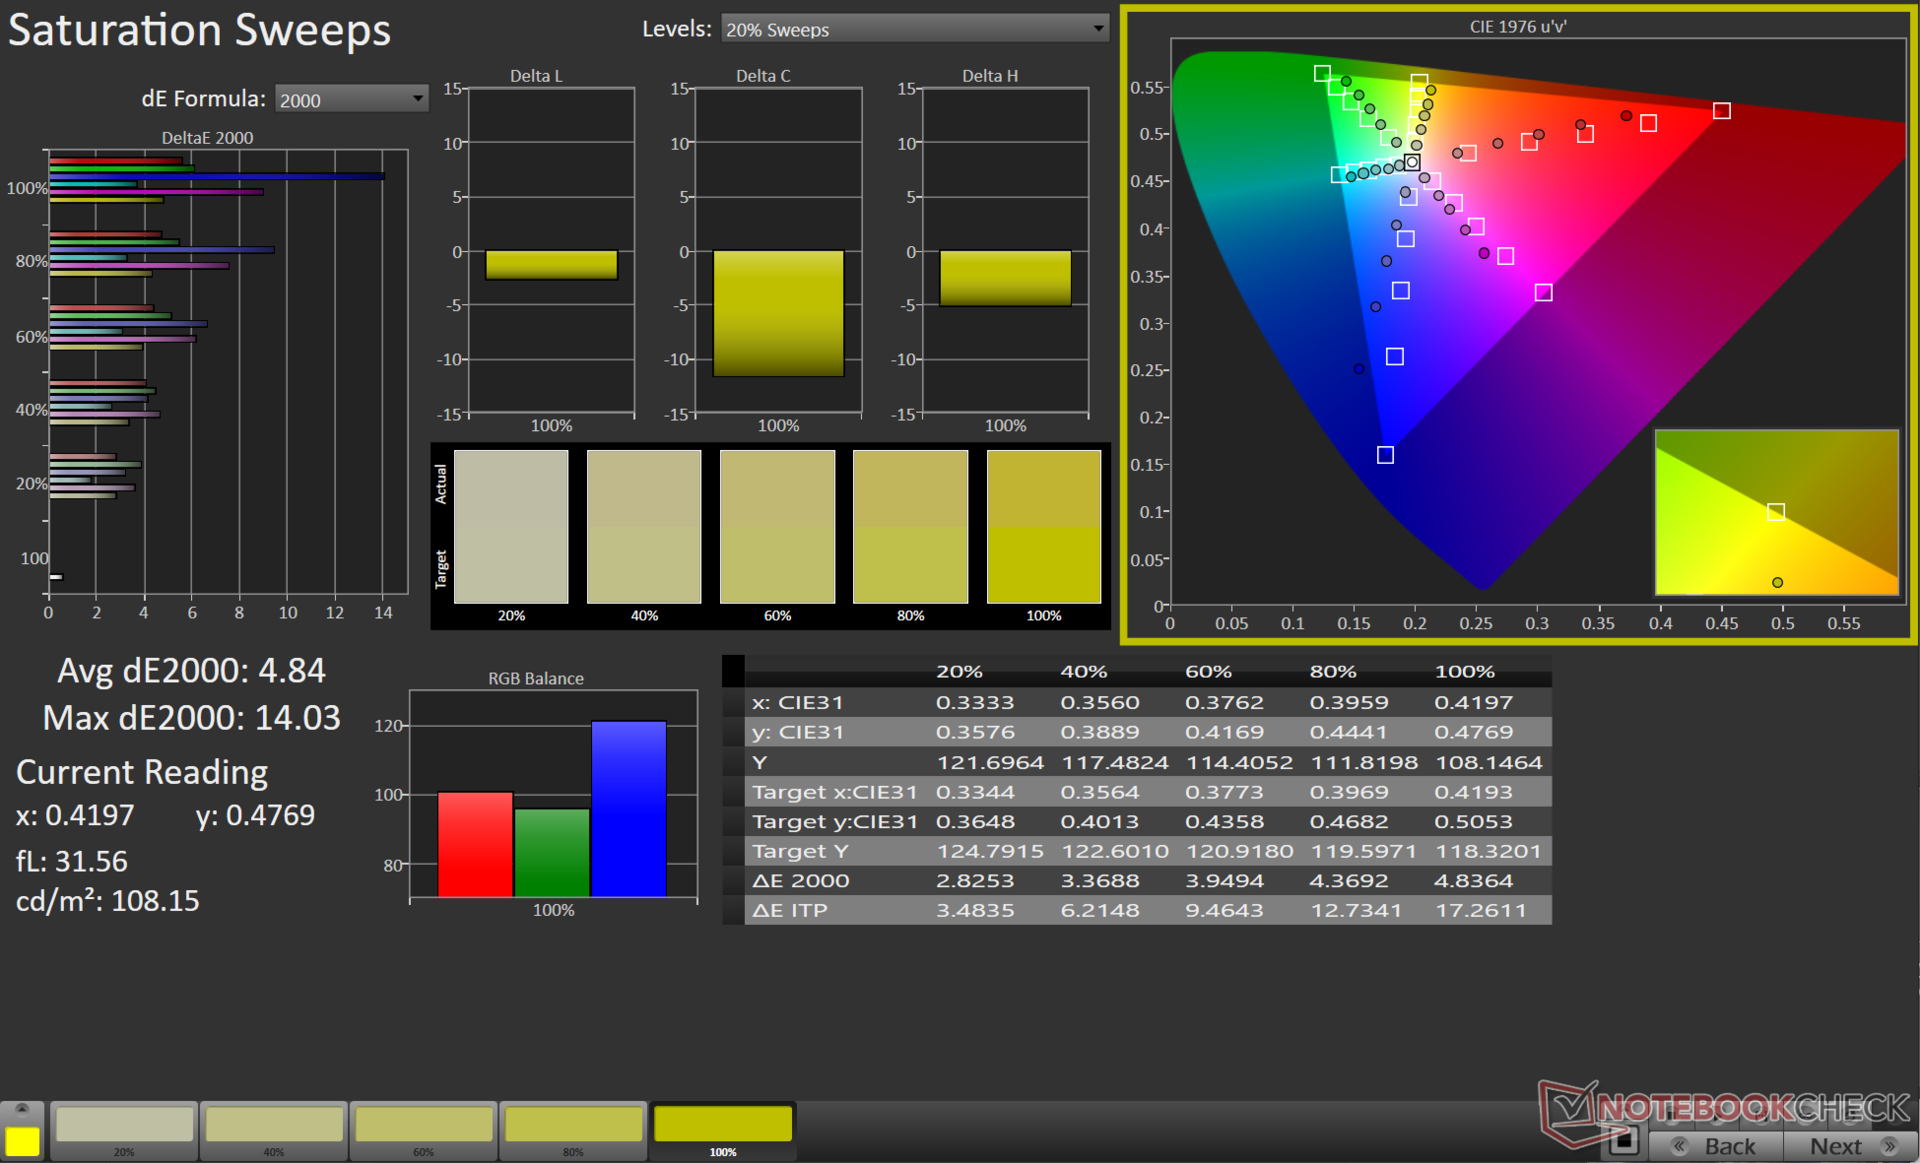
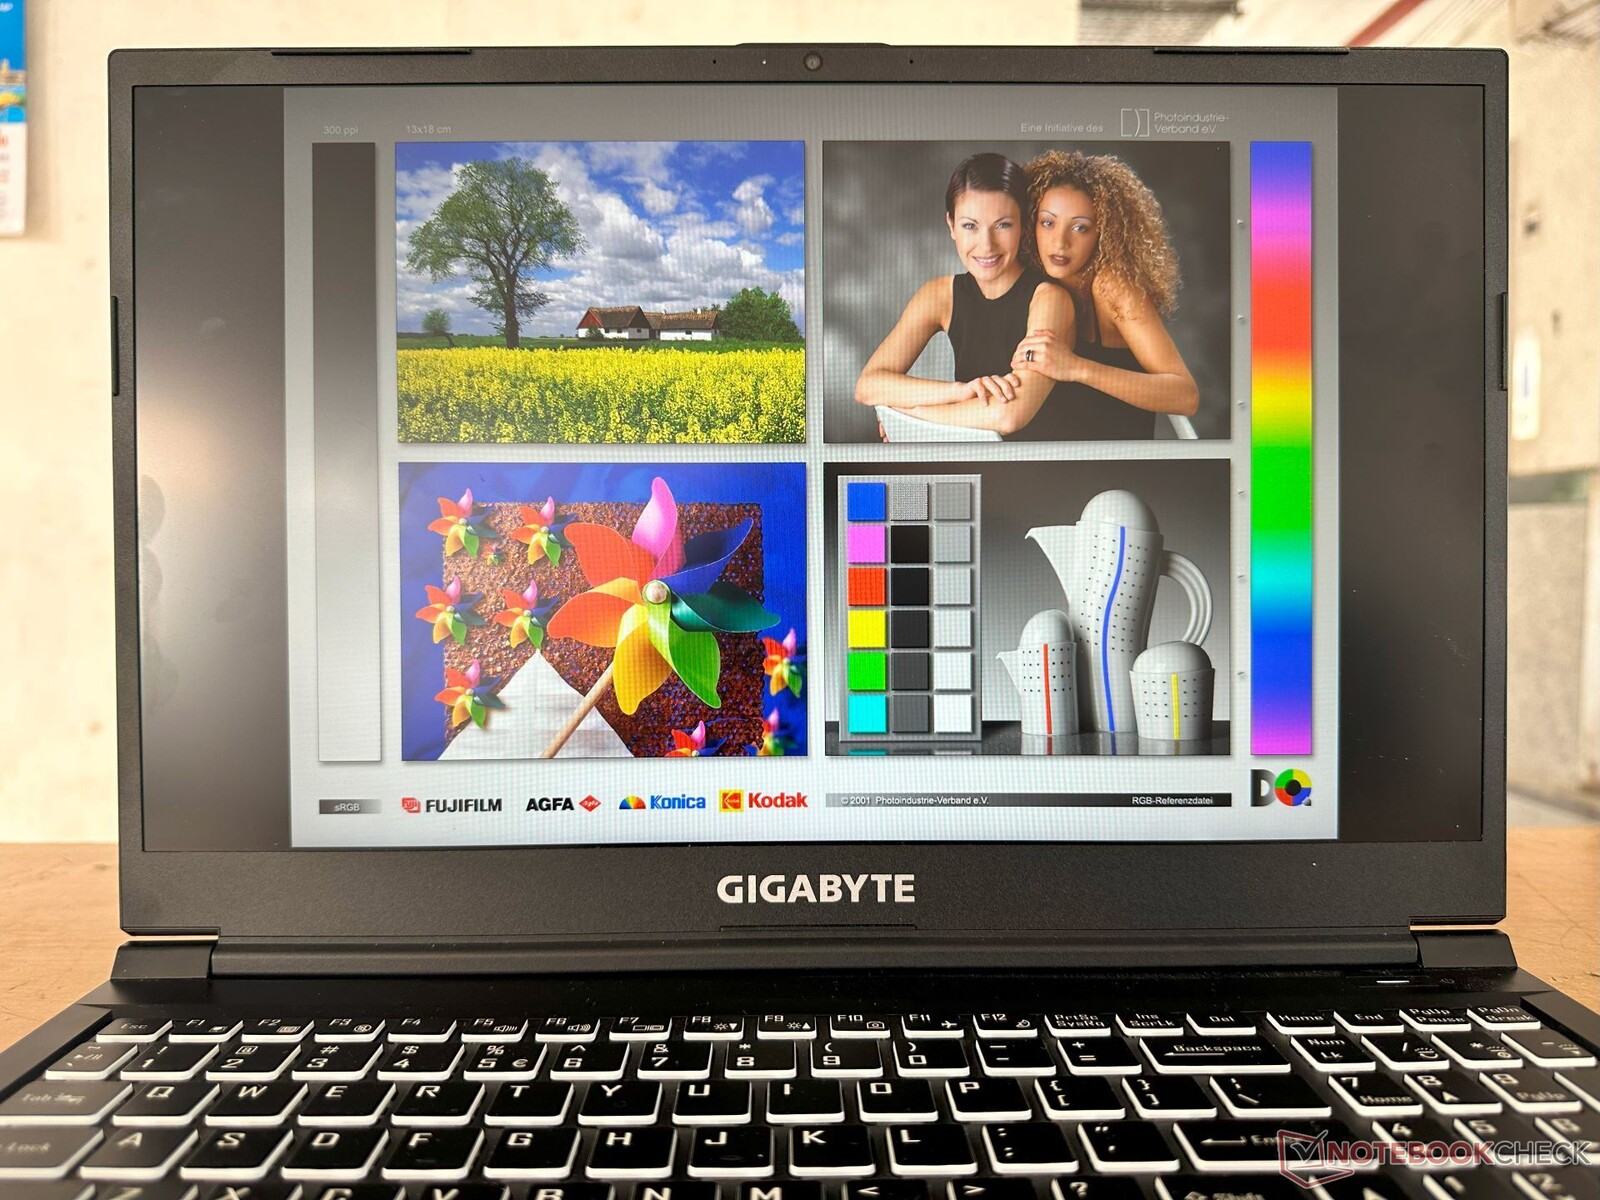
显示:色域覆盖率低,响应时间长,没有PWM功能
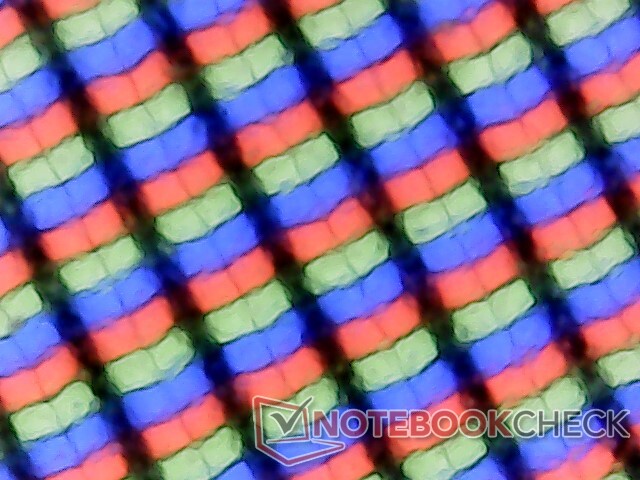
Gigabyte G5 KE的1080p 144 Hz奇美面板在这一点上开始显示出它的年龄。我们以前在2021年的时候就见过这种面板。 技嘉G5 GD和 华硕TUF Gaming F15 FX506HM.竞争已经转移到更好的面板上,其色域覆盖面更广。
亮度分布为85%,还算不错,但对于2023年的笔记本电脑来说,色域范围很差,sRGB覆盖率仅约为61%。

| |||||||||||||||||||||||||
Brightness Distribution: 85 %
Center on Battery: 266 cd/m²
Contrast: 538:1 (Black: 0.5 cd/m²)
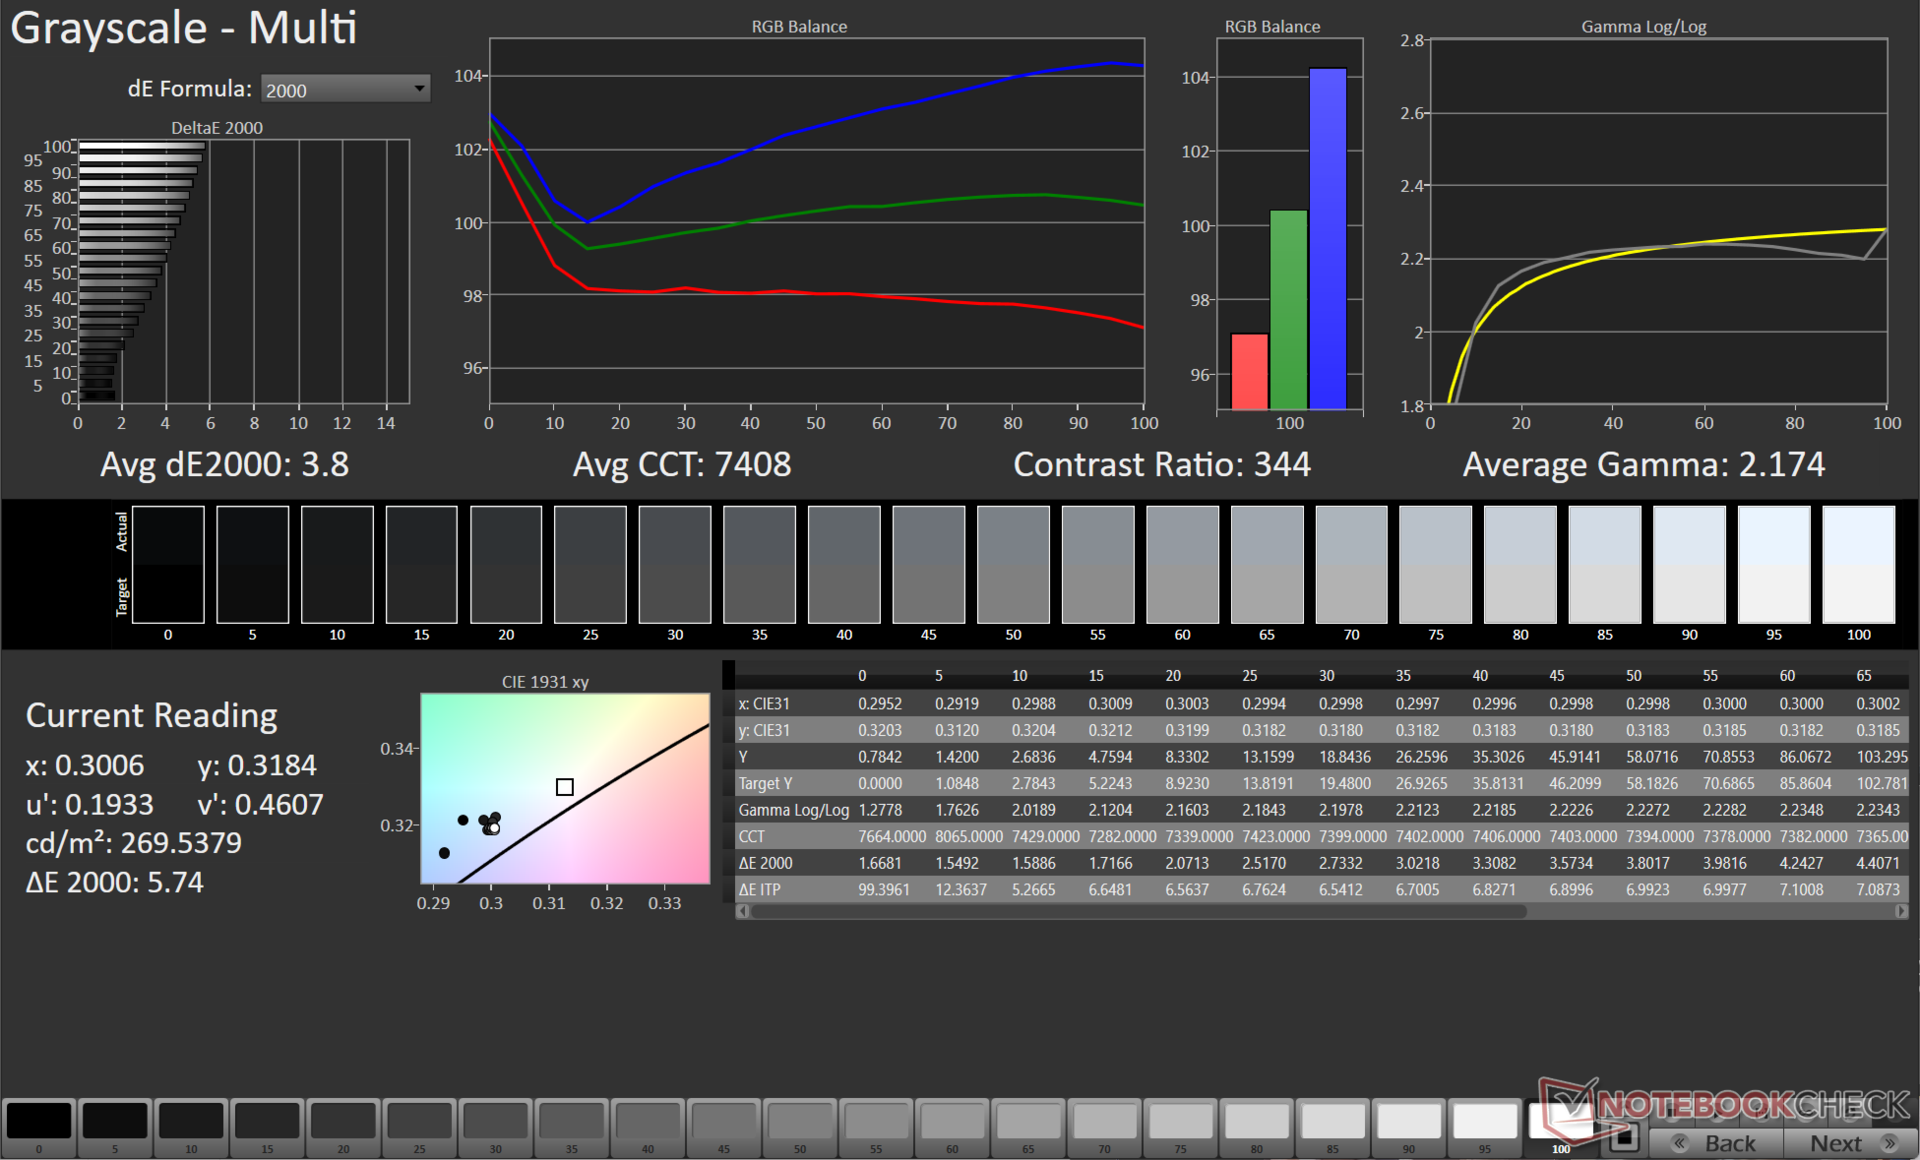
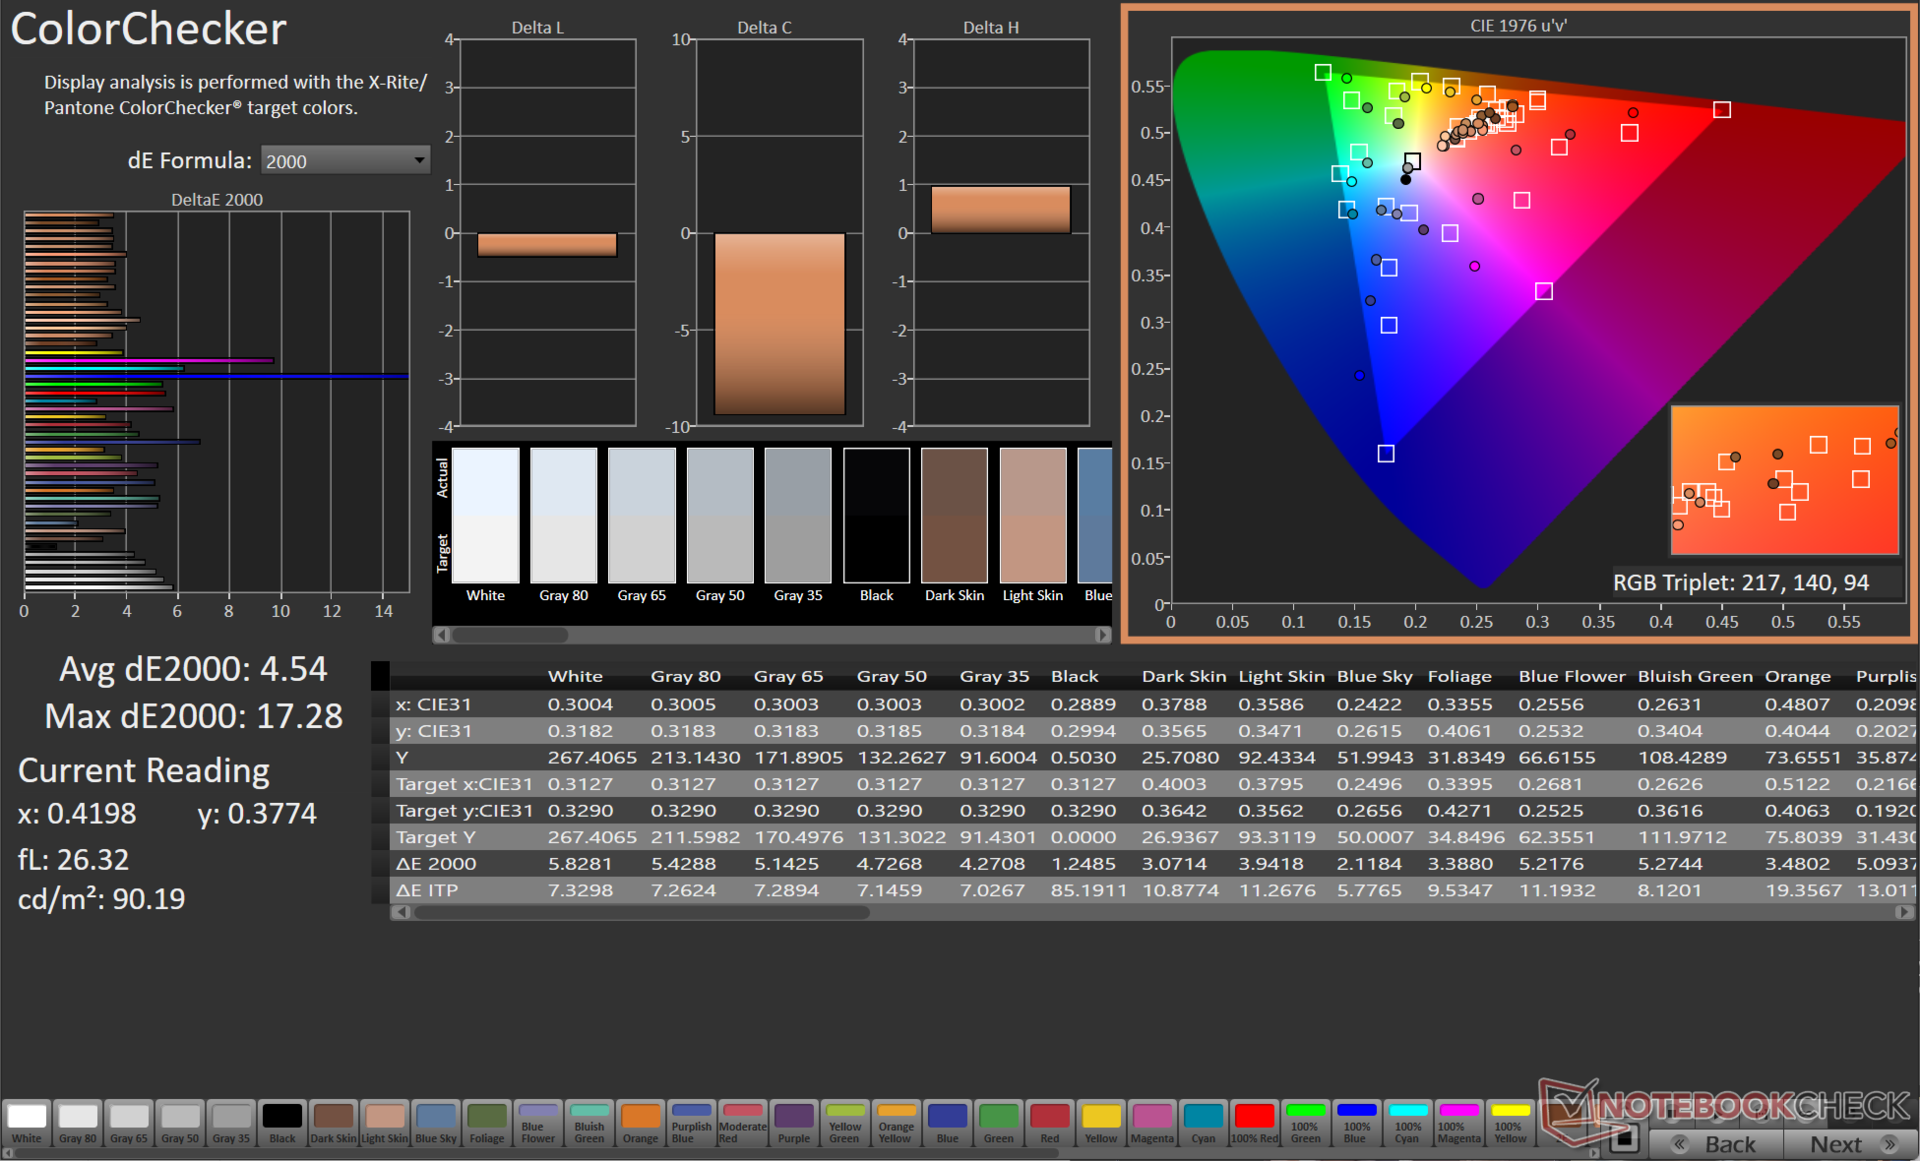
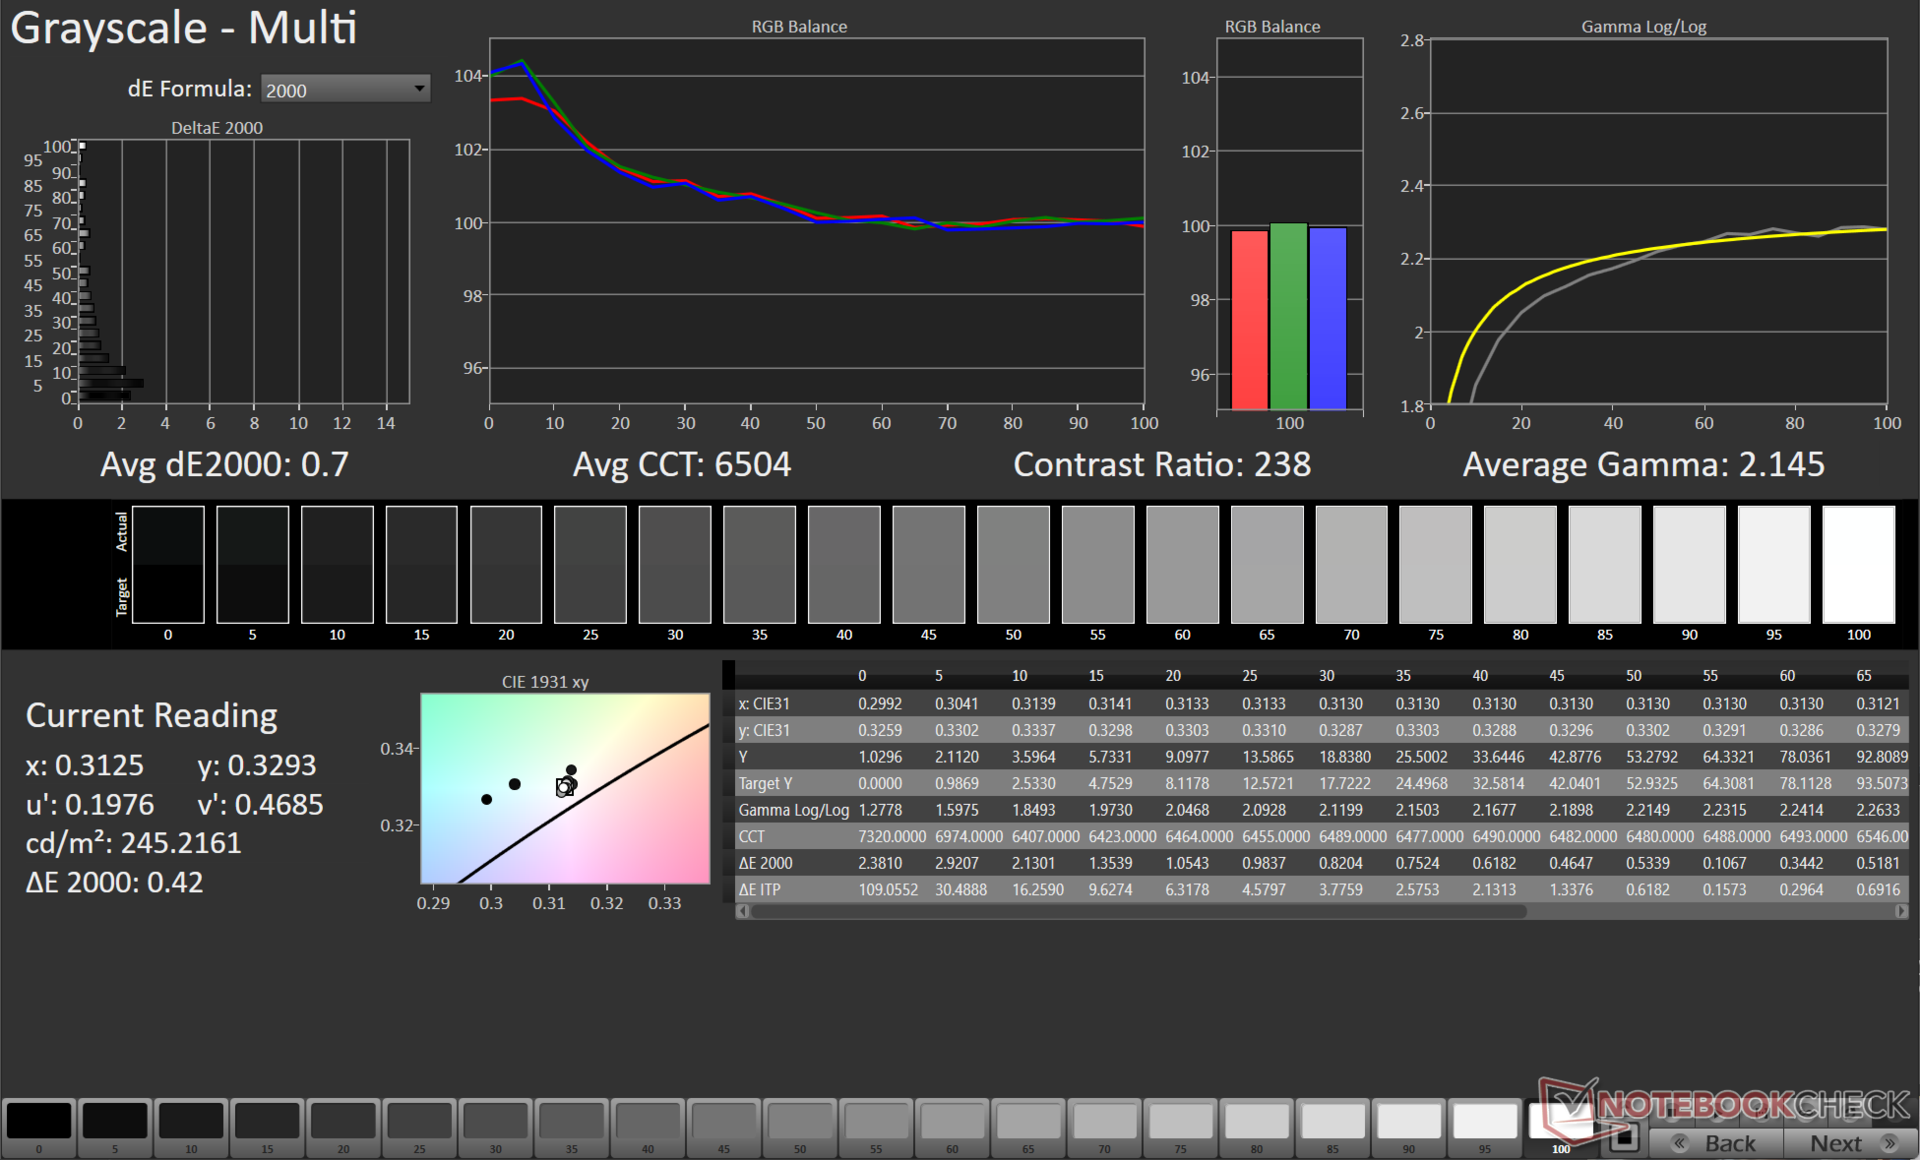
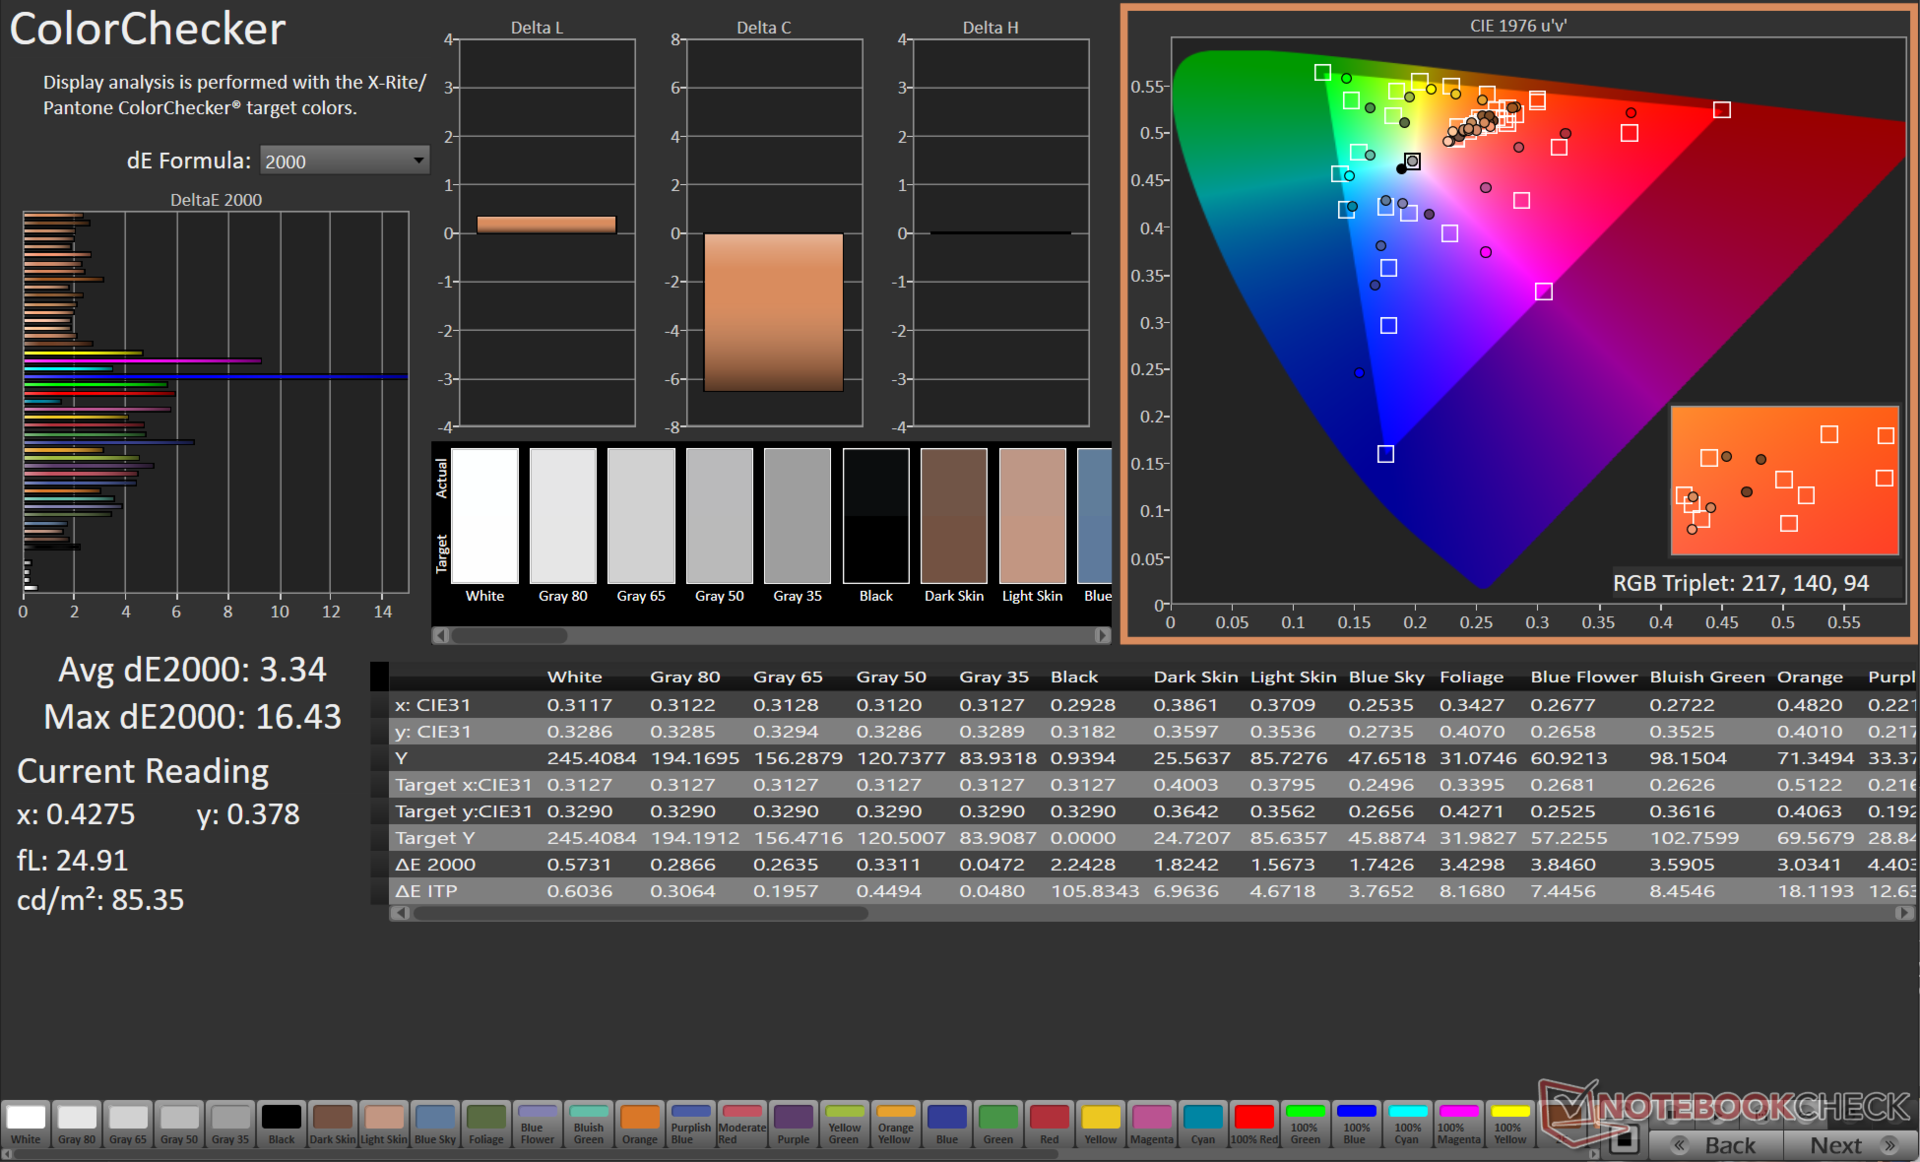
ΔE Color 4.54 | 0.5-29.43 Ø4.86, calibrated: 3.34
ΔE Greyscale 3.8 | 0.5-98 Ø5.1
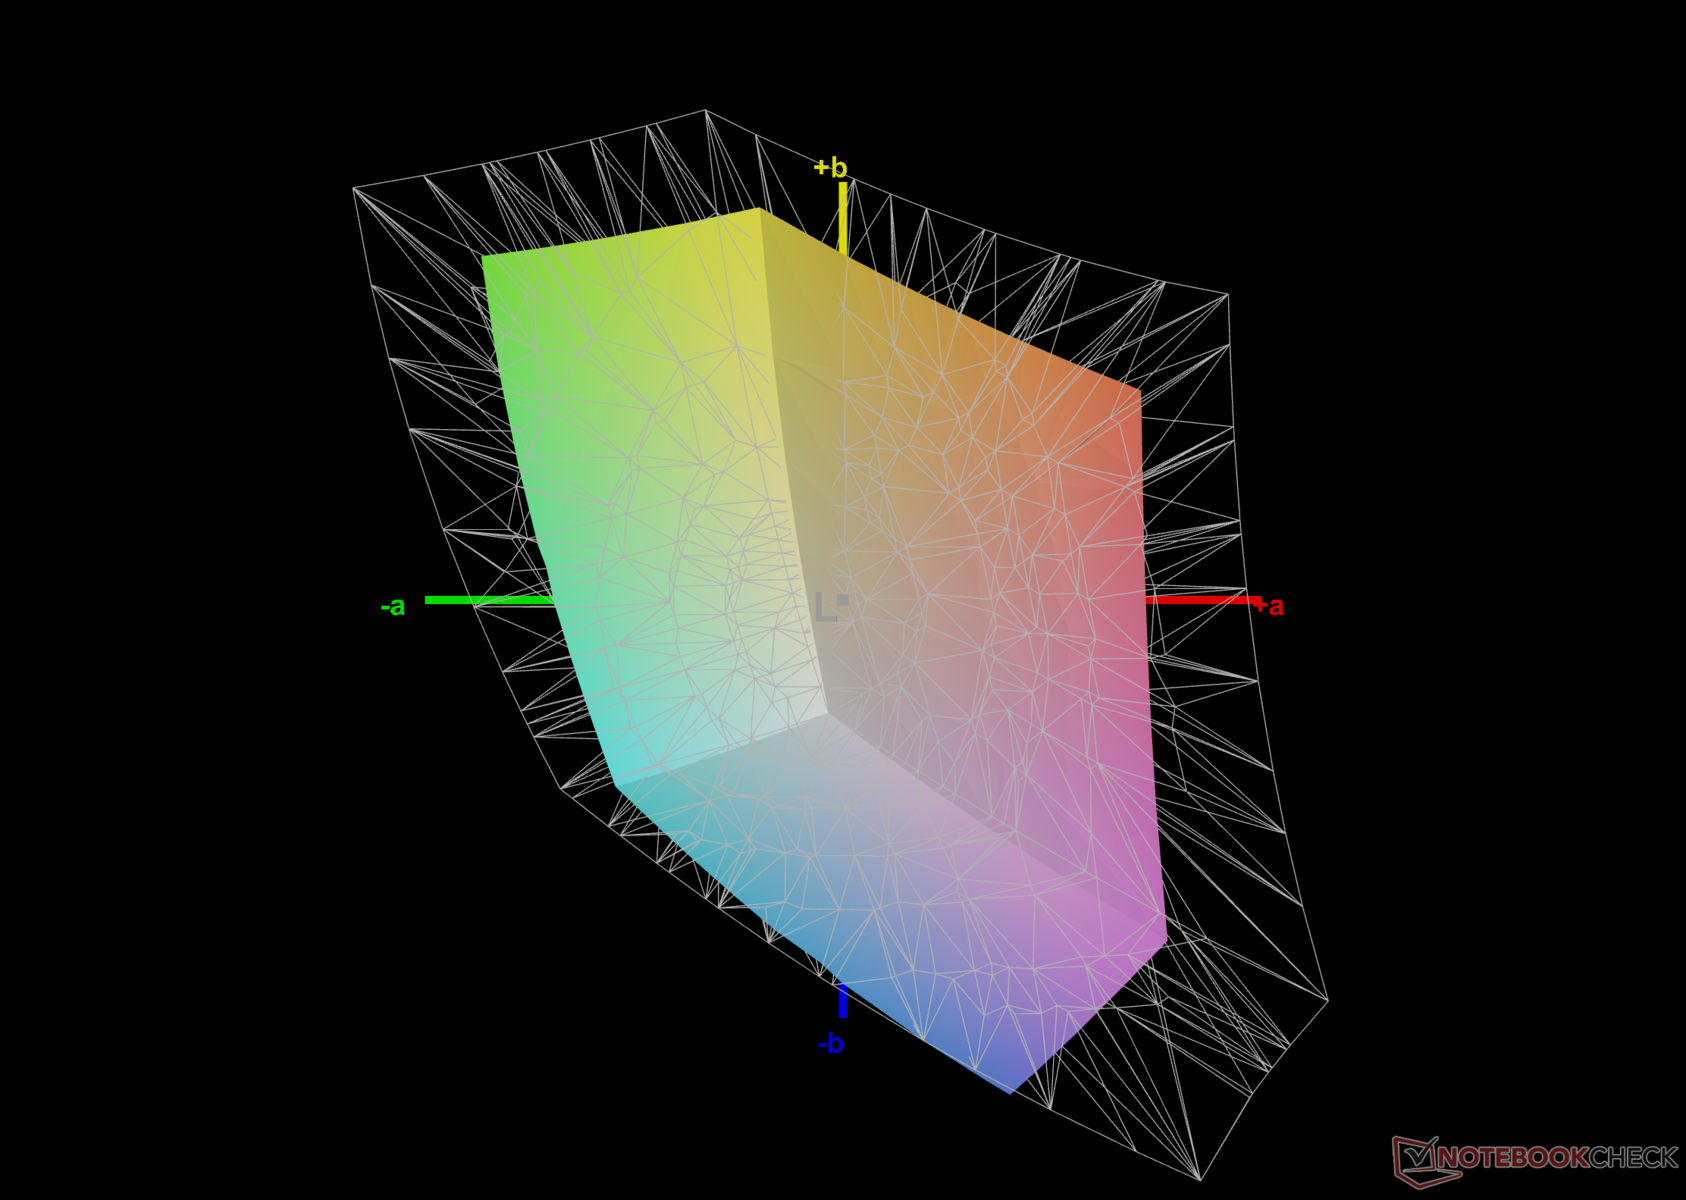
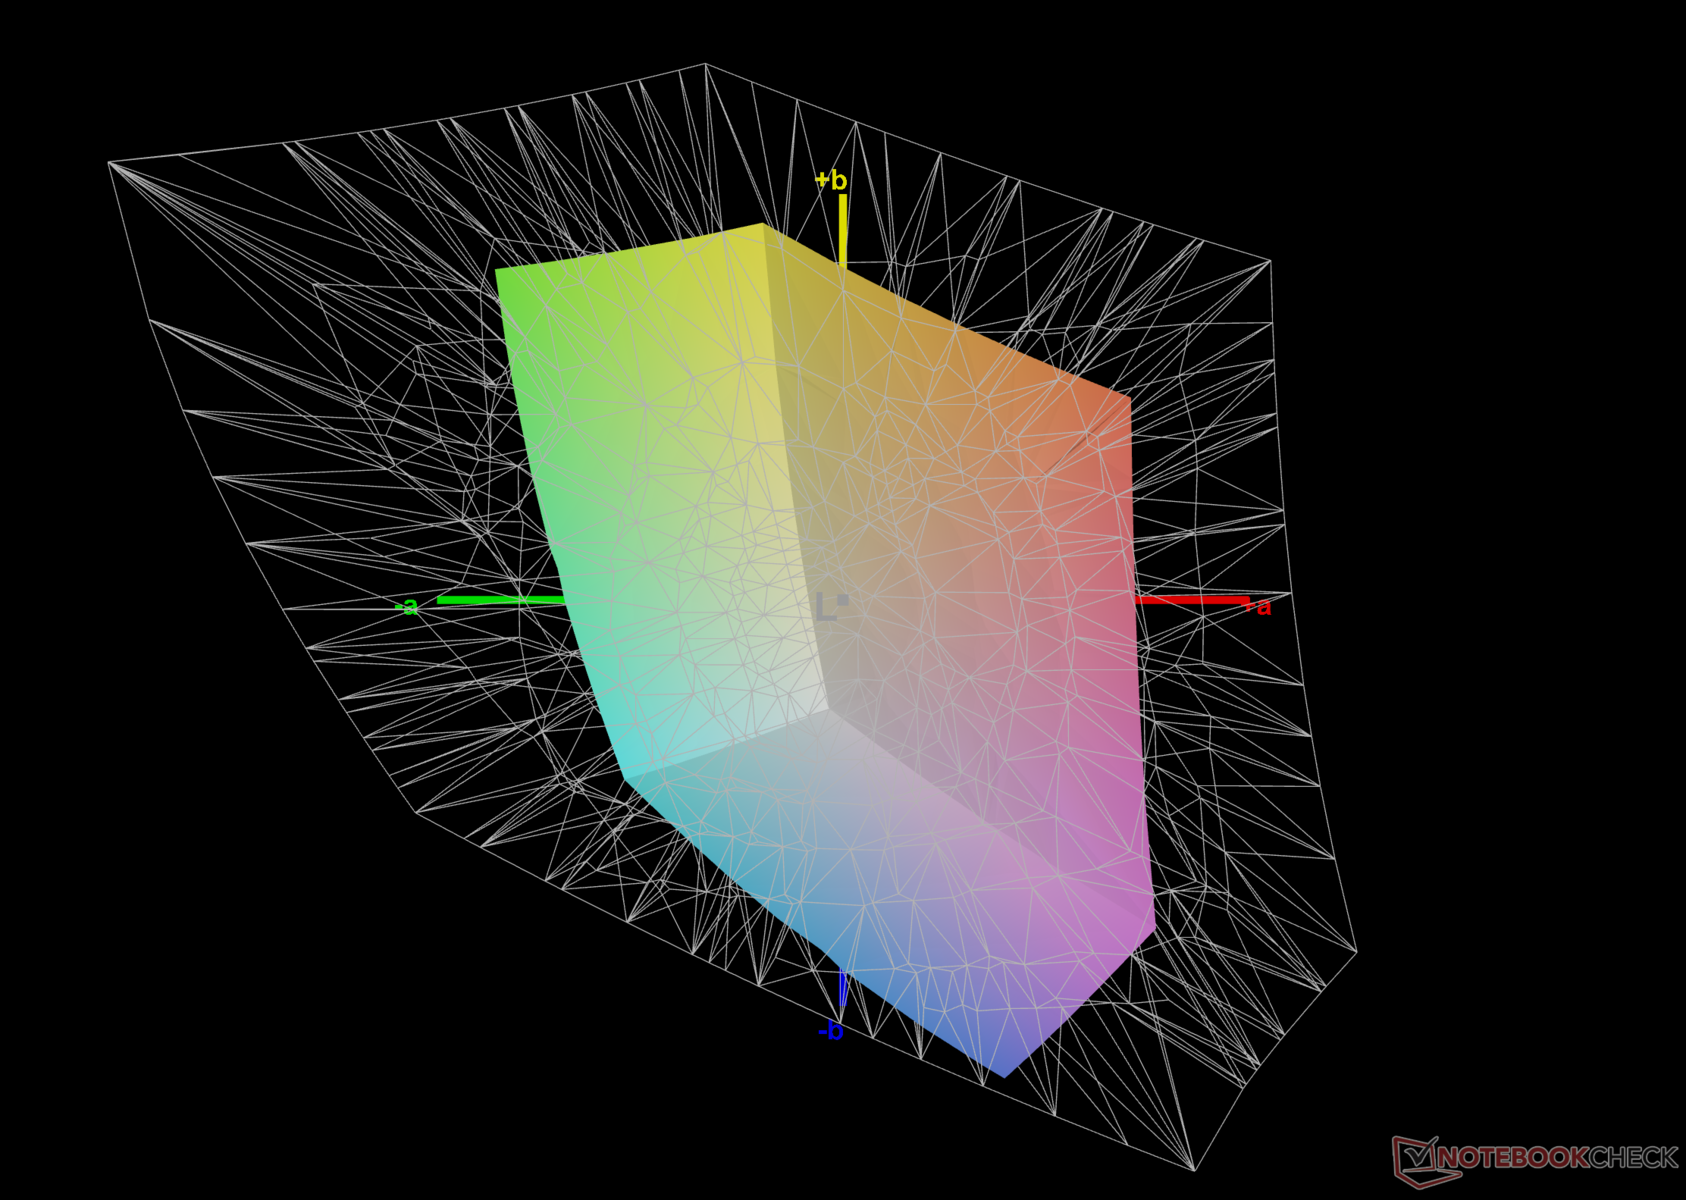
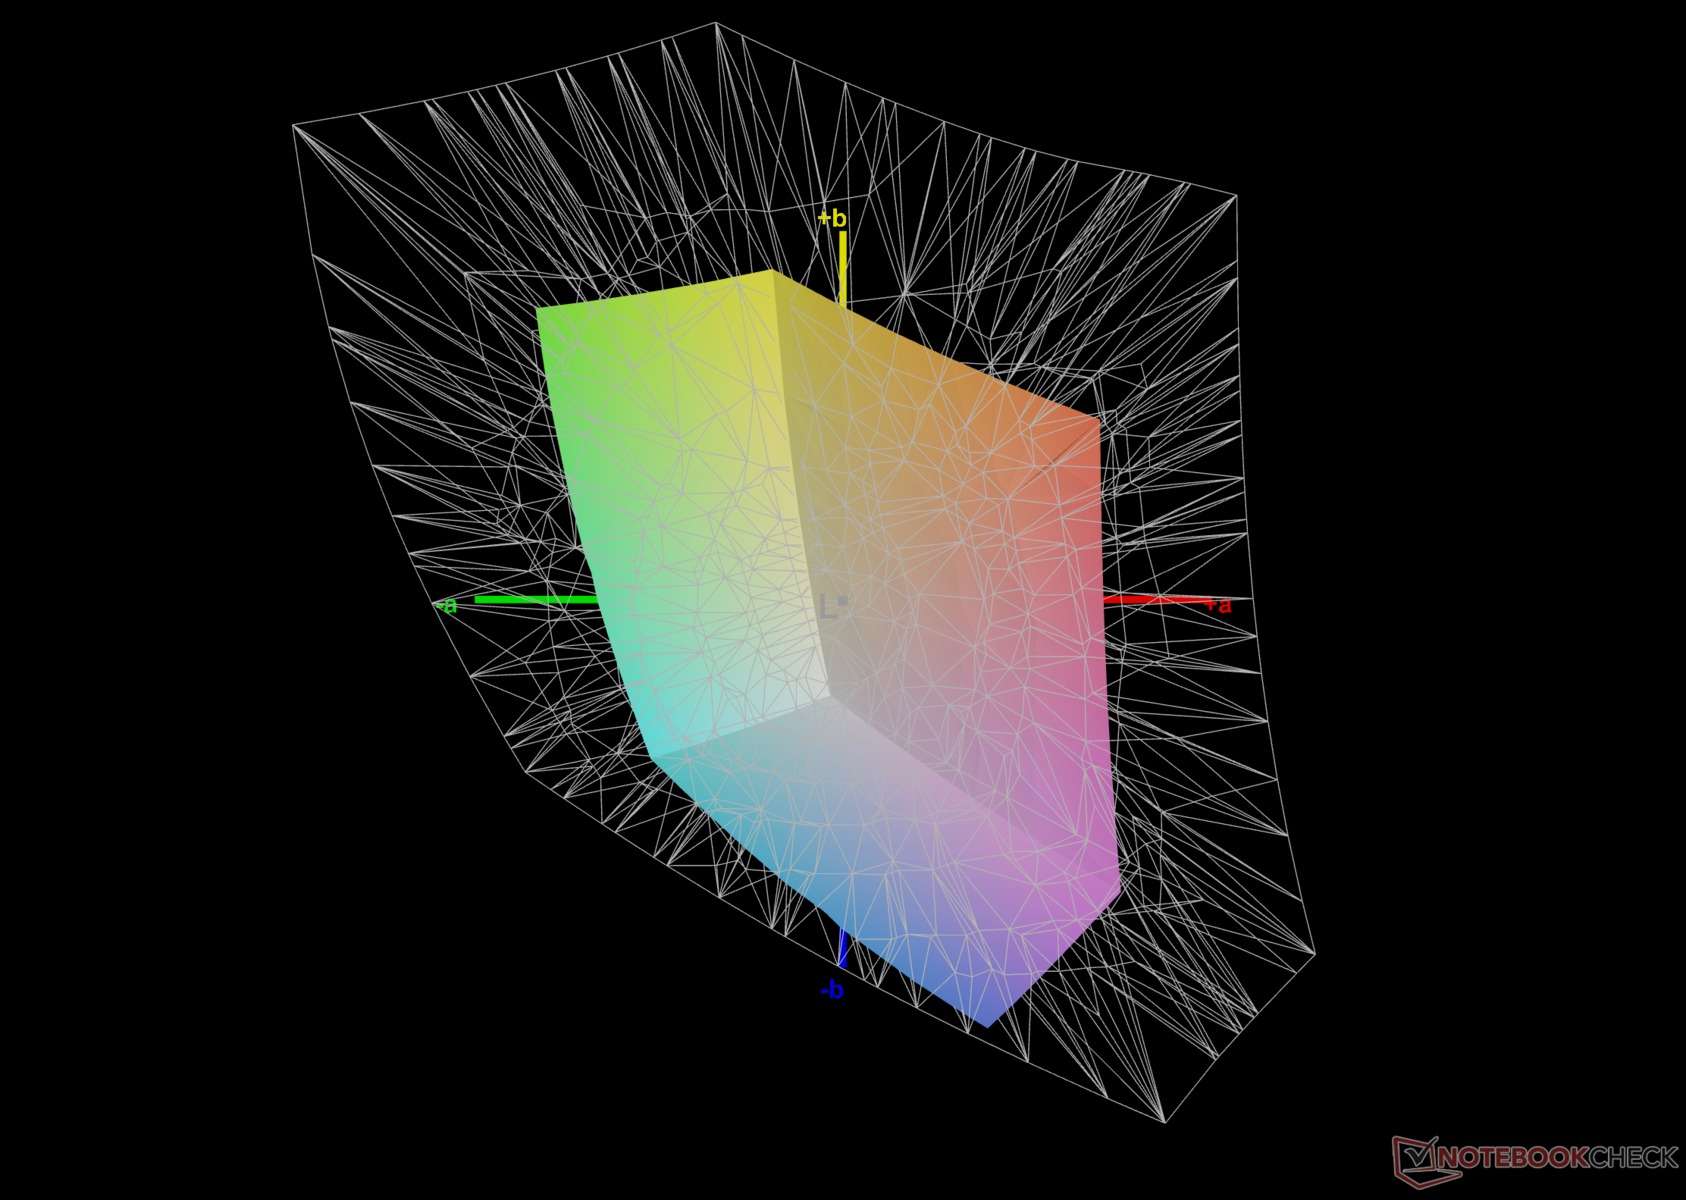
42.1% AdobeRGB 1998 (Argyll 2.2.0 3D)
61% sRGB (Argyll 2.2.0 3D)
40.7% Display P3 (Argyll 2.2.0 3D)
Gamma: 2.17
| Gigabyte G5 KE Chi Mei N156HRA-EA1, , 1920x1080, 15.6" | Lenovo IdeaPad Gaming 3 15IAH7 Lenovo LEN156FHD, , 1920x1080, 15.6" | Gigabyte G7 KE AU Optronics B173HAN05.1, , 1920x1080, 17.3" | Honor MagicBook 14 2022 HD140ZB-01A, , 2160x1440, 14" | SCHENKER XMG Core 15 (M22) CSOT MNF601CA1-1, , 2560x1440, 15.6" | Dell G16 7620 BOE NE16QDM, , 2560x1600, 16" | Gigabyte A5 K1 BOEhydis NV156FHM-N4K (BOE08B3), , 1920x1080, 15.6" | Asus TUF Gaming F15 FX507ZM TL156VDXP0101, , 1920x1080, 15.6" | HP Victus 16-e0179ng BOE09BE, , 1920x1080, 16.1" | |
|---|---|---|---|---|---|---|---|---|---|
| Display | 66% | 69% | 64% | 66% | 65% | 56% | 62% | 72% | |
| Display P3 Coverage | 40.7 | 69.1 70% | 70.4 73% | 67.9 67% | 68.8 69% | 68.3 68% | 64.4 58% | 66.4 63% | 72.6 78% |
| sRGB Coverage | 61 | 99.2 63% | 99.8 64% | 98.5 61% | 99.3 63% | 98 61% | 92.5 52% | 97 59% | 100 64% |
| AdobeRGB 1998 Coverage | 42.1 | 69.9 66% | 71.7 70% | 68.7 63% | 69.9 66% | 70.5 67% | 66.1 57% | 68.5 63% | 73.5 75% |
| Response Times | 53% | 68% | -41% | 50% | 56% | 48% | 55% | 44% | |
| Response Time Grey 50% / Grey 80% * | 26.64 ? | 13 ? 51% | 5 ? 81% | 37.2 ? -40% | 16 ? 40% | 8.6 ? 68% | 14.5 ? 46% | 5.6 ? 79% | 9.6 ? 64% |
| Response Time Black / White * | 18.65 ? | 8.4 ? 55% | 8.3 ? 55% | 26.3 ? -41% | 7.6 ? 59% | 10.4 ? 44% | 9.5 ? 49% | 12.8 ? 31% | 14.4 ? 23% |
| PWM Frequency | 28400 ? | ||||||||
| Screen | 40% | 61% | 57% | 40% | 49% | 31% | 52% | 43% | |
| Brightness middle | 269 | 338 26% | 307 14% | 330 23% | 378 41% | 369.4 37% | 295 10% | 353.7 31% | 361 34% |
| Brightness | 248 | 329 33% | 301 21% | 320 29% | 371 50% | 348 40% | 281 13% | 340 37% | 341 38% |
| Brightness Distribution | 85 | 92 8% | 93 9% | 90 6% | 93 9% | 83 -2% | 83 -2% | 89 5% | 88 4% |
| Black Level * | 0.5 | 0.27 46% | 0.2 60% | 0.21 58% | 0.33 34% | 0.32 36% | 0.29 42% | 0.34 32% | 0.3 40% |
| Contrast | 538 | 1252 133% | 1535 185% | 1571 192% | 1145 113% | 1154 114% | 1017 89% | 1040 93% | 1203 124% |
| Colorchecker dE 2000 * | 4.54 | 2.88 37% | 1.32 71% | 1.8 60% | 2.84 37% | 1.78 61% | 4.36 4% | 1.74 62% | 2.44 46% |
| Colorchecker dE 2000 max. * | 17.28 | 9.35 46% | 4.6 73% | 4.7 73% | 5.51 68% | 4.41 74% | 6.92 60% | 3.63 79% | 6.37 63% |
| Colorchecker dE 2000 calibrated * | 3.34 | 1.22 63% | 1.03 69% | 1.6 52% | 2.75 18% | 1.22 63% | 1.2 64% | 0.5 85% | 1.26 62% |
| Greyscale dE 2000 * | 3.8 | 5 -32% | 2.1 45% | 3 21% | 4.08 -7% | 3.2 16% | 3.9 -3% | 2.1 45% | 4.6 -21% |
| Gamma | 2.17 101% | 2.162 102% | 2.247 98% | 2.18 101% | 2.4 92% | 2.2 100% | 2.106 104% | 2.3 96% | 2.268 97% |
| CCT | 7408 88% | 7497 87% | 6815 95% | 6697 97% | 5841 111% | 6750 96% | 7300 89% | 6257 104% | 6609 98% |
| Total Average (Program / Settings) | 53% /
48% | 66% /
64% | 27% /
45% | 52% /
47% | 57% /
53% | 45% /
39% | 56% /
55% | 53% /
50% |
* ... smaller is better
我们使用X-Rite i1Basic Pro 3分光光度计和Portrait Displays公司的Calman Ultimate色彩校准软件的校准程序,使灰度Delta E 2000值得到明显改善。
然而,改进ColorChecker值的余地不大。100%的蓝色和100%的品红色导致了色彩准确性的巨大偏差。
校准后的ICC配置文件可以从上面的链接下载。

Display Response Times
| ↔ Response Time Black to White | ||
|---|---|---|
| 18.65 ms ... rise ↗ and fall ↘ combined | ↗ 10.83 ms rise | 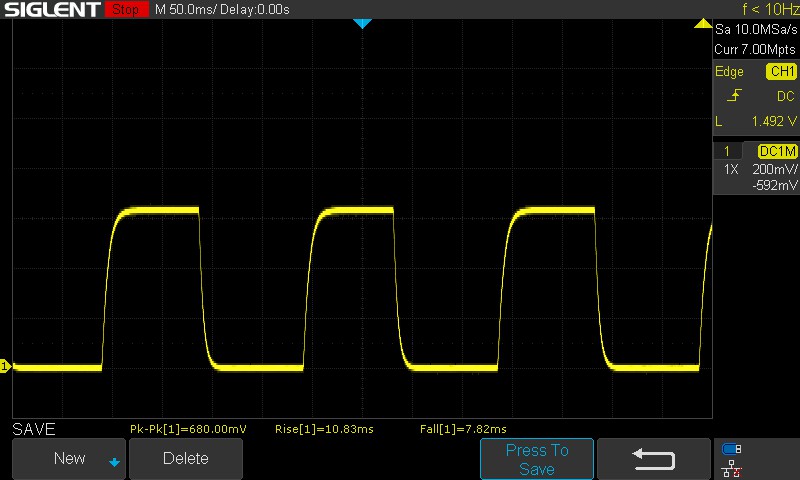 |
| ↘ 7.82 ms fall | ||
| The screen shows good response rates in our tests, but may be too slow for competitive gamers. In comparison, all tested devices range from 0.1 (minimum) to 240 (maximum) ms. » 38 % of all devices are better. This means that the measured response time is similar to the average of all tested devices (20.7 ms). | ||
| ↔ Response Time 50% Grey to 80% Grey | ||
| 26.64 ms ... rise ↗ and fall ↘ combined | ↗ 12.52 ms rise | 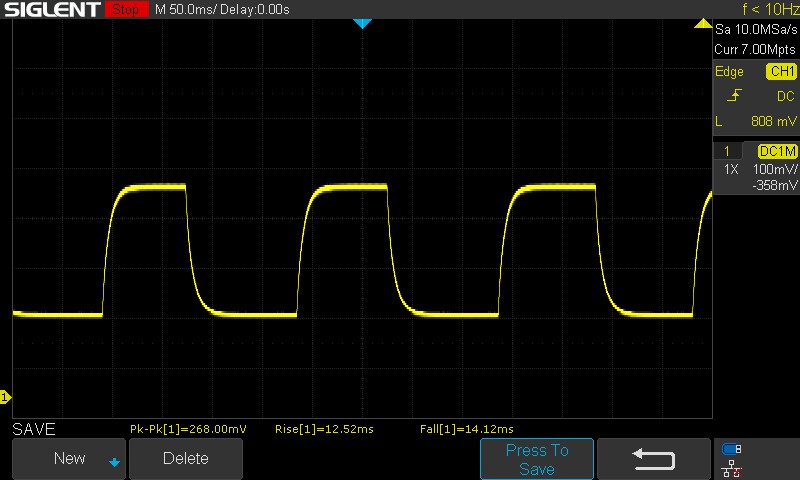 |
| ↘ 14.12 ms fall | ||
| The screen shows relatively slow response rates in our tests and may be too slow for gamers. In comparison, all tested devices range from 0.165 (minimum) to 636 (maximum) ms. » 34 % of all devices are better. This means that the measured response time is better than the average of all tested devices (32.5 ms). | ||
Screen Flickering / PWM (Pulse-Width Modulation)
| Screen flickering / PWM not detected | 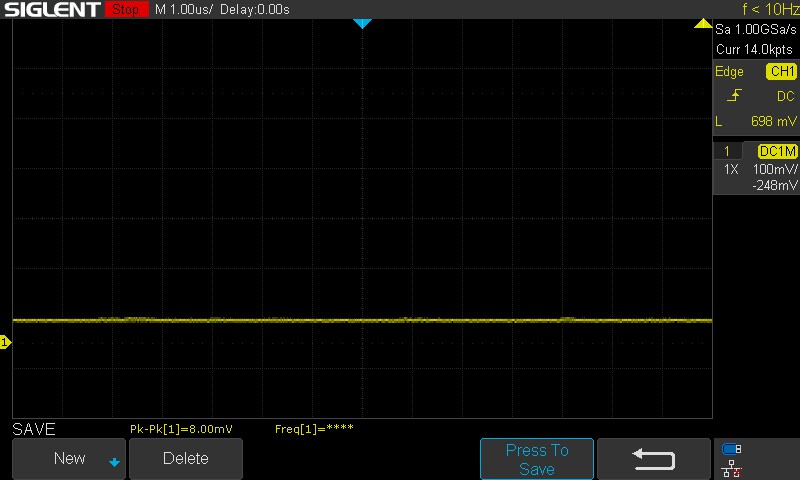 | ||
| ≤ 100 cd/m² brightness | |||
In comparison: 53 % of all tested devices do not use PWM to dim the display. If PWM was detected, an average of 8485 (minimum: 5 - maximum: 343500) Hz was measured. | |||
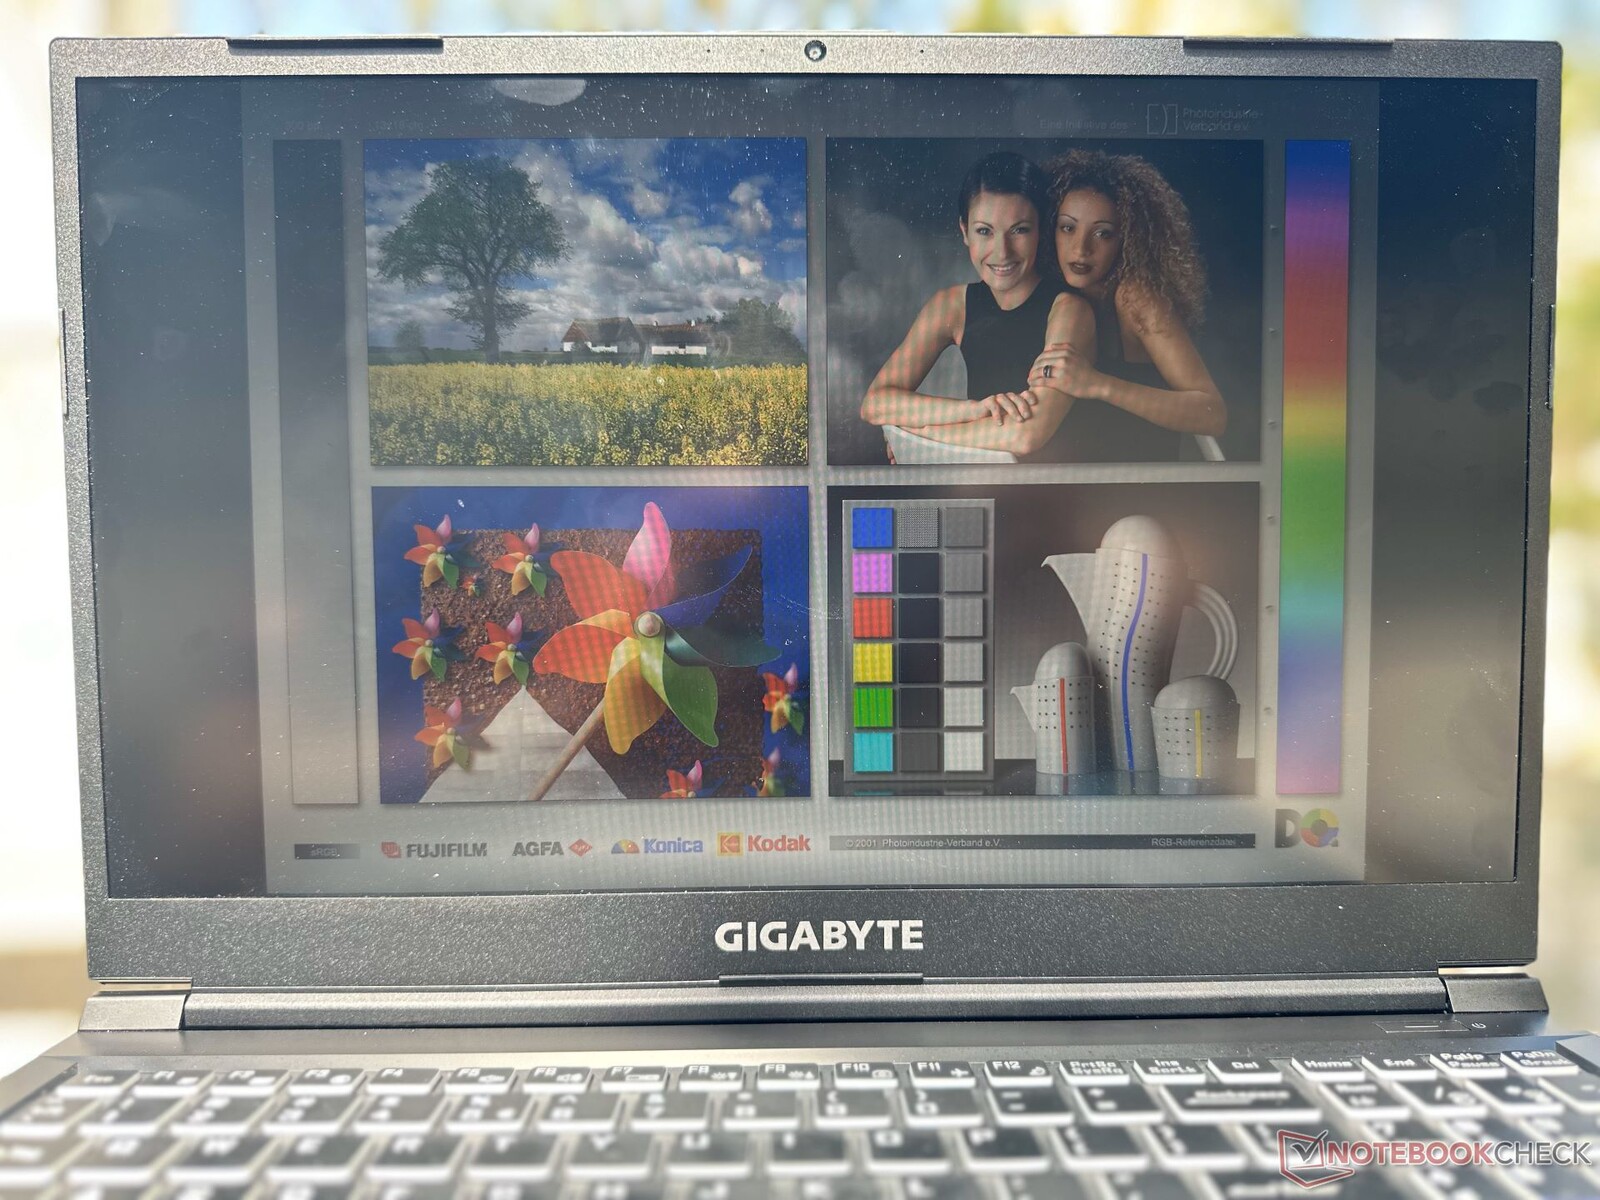
只要没有阳光直接落在屏幕上,户外观看是可以辨认的。在极端的观察角度下,会有亮度和色彩信息的损失。


性能:酷睿i5-12500H和RTX 3060的组合没有带来任何重大惊喜
Gigabyte提供G5的两个变体:G5 KE和G5 ME,配备12C/16T英特尔酷睿i5-12500HCPU。虽然G5 KE提供了一个 NvidiaGeForce RTX 3060 笔记本GPU而G5 ME则采用了一个 RTX 3050 Ti笔记本GPU并且缺少一个雷电4端口。
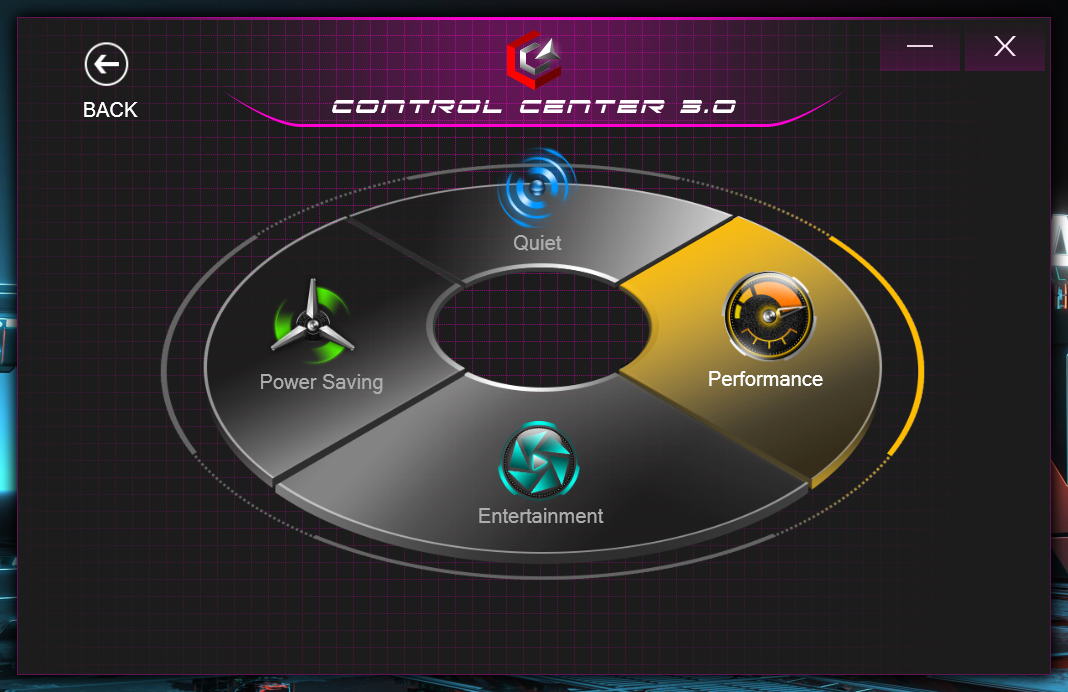
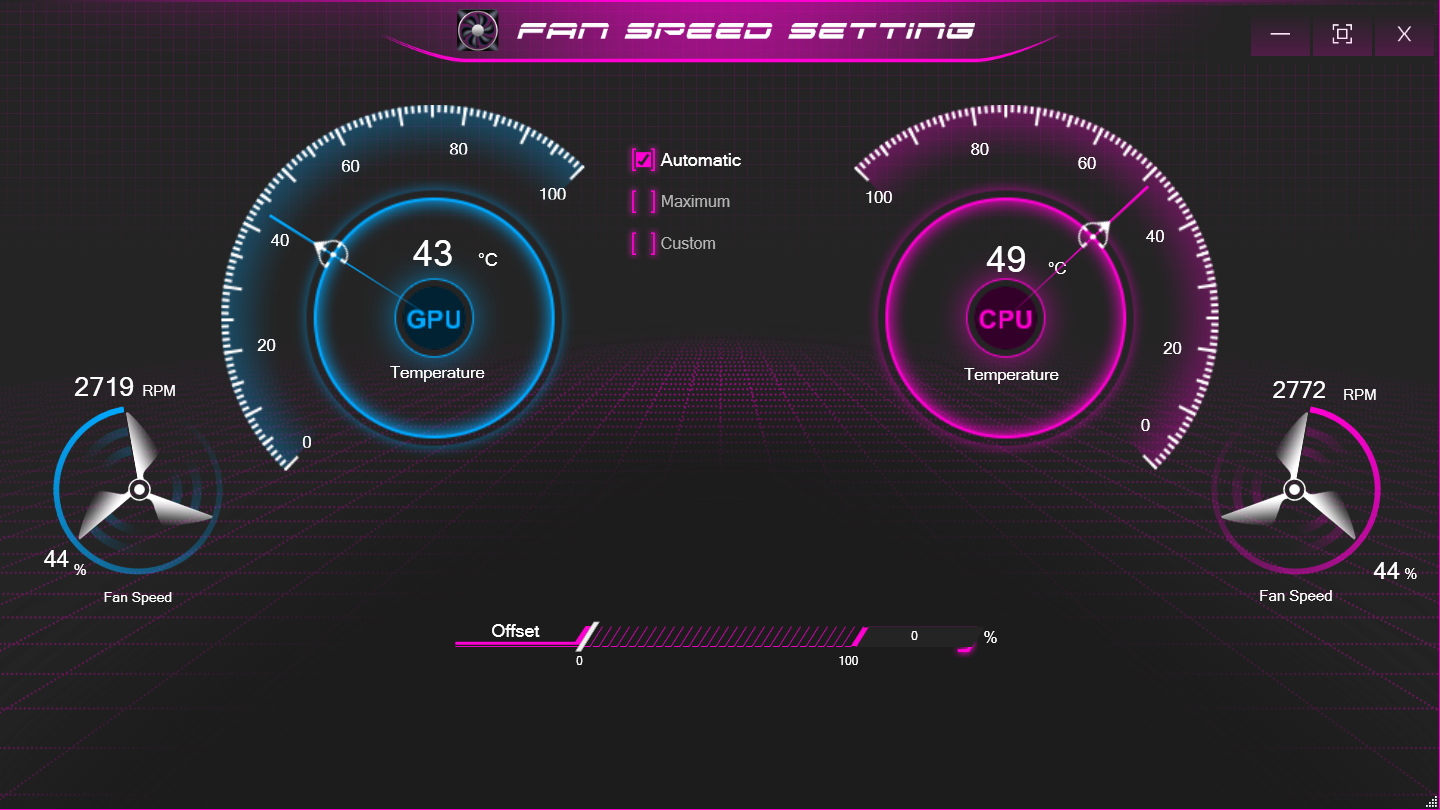
G5 KE提供四种性能模式,详见下表:
| 性能模式 | PL1(PBP)/ Tau | PL2(MTP)/ Tau |
|---|---|---|
| 静音 | 15 W / 8 s | 30 W / 2.44 ms |
| 省电模式 | 30 W / 8 s | 30 W / 2.44 ms |
| 娱乐 | 50 W / 28 s | 115 W / 2.44 ms |
| 性能 | 115 W / 80 s | 135 W / 2.44 ms |
我们在所有的基准测试中使用了性能配置文件,而电池测试是在省电模式下进行的。Clevo的控制中心3.0允许选择各种性能配置和风扇速度设置。
处理器
G5 KE的酷睿i5-12500H与G7 KE中的酷睿i5-12500H很接近,也与 AMD Ryzen 7 6800H中的 XMG Core 15 (M22)在累积的CPU分数中。然而,它比Core i7-12700H落后了15%。 酷睿i7-12700H在 华硕TUF游戏F15.
在我们的Cinebench R15多核循环测试中,除了在运行过程中分数有极小的瞬间下降外,大部分的持续性能都很好。
Cinebench R15 Multi Loop
Cinebench R20: CPU (Single Core) | CPU (Multi Core)
Cinebench R15: CPU Single 64Bit | CPU Multi 64Bit
Blender: v2.79 BMW27 CPU
7-Zip 18.03: 7z b 4 -mmt1 | 7z b 4
Geekbench 5.5: Single-Core | Multi-Core
HWBOT x265 Benchmark v2.2: 4k Preset
LibreOffice : 20 Documents To PDF
R Benchmark 2.5: Overall mean
| CPU Performance Rating | |
| Average of class Gaming | |
| Asus TUF Gaming F15 FX507ZM | |
| Dell G16 7620 | |
| Gigabyte G7 KE | |
| SCHENKER XMG Core 15 (M22) | |
| Gigabyte G5 KE | |
| Honor MagicBook 14 2022 | |
| Lenovo IdeaPad Gaming 3 15IAH7 | |
| Average Intel Core i5-12500H | |
| HP Victus 16-e0179ng | |
| Gigabyte A5 K1 | |
* ... smaller is better
我们的专用 英特尔酷睿i5-12500H页面提供更多信息和基准比较。
系统性能
G5 KE的PCMark 10总体性能与基于Core i7-12700H的笔记本电脑相当,同时在CrossMark中与Ryzen 7 6800H驱动的Schenker XMG Core 15(M22)相比有明显的领先。
CrossMark: Overall | Productivity | Creativity | Responsiveness
| PCMark 10 / Score | |
| Average of class Gaming (5776 - 9852, n=132, last 2 years) | |
| Asus TUF Gaming F15 FX507ZM | |
| SCHENKER XMG Core 15 (M22) | |
| Dell G16 7620 | |
| Gigabyte G5 KE | |
| Lenovo IdeaPad Gaming 3 15IAH7 | |
| Average Intel Core i5-12500H, NVIDIA GeForce RTX 3060 Laptop GPU (6126 - 7201, n=2) | |
| HP Victus 16-e0179ng | |
| Honor MagicBook 14 2022 | |
| Gigabyte A5 K1 | |
| Gigabyte G7 KE | |
| PCMark 8 Home Score Accelerated v2 | 5554 points | |
| PCMark 8 Work Score Accelerated v2 | 5937 points | |
| PCMark 10 Score | 7201 points | |
Help | ||
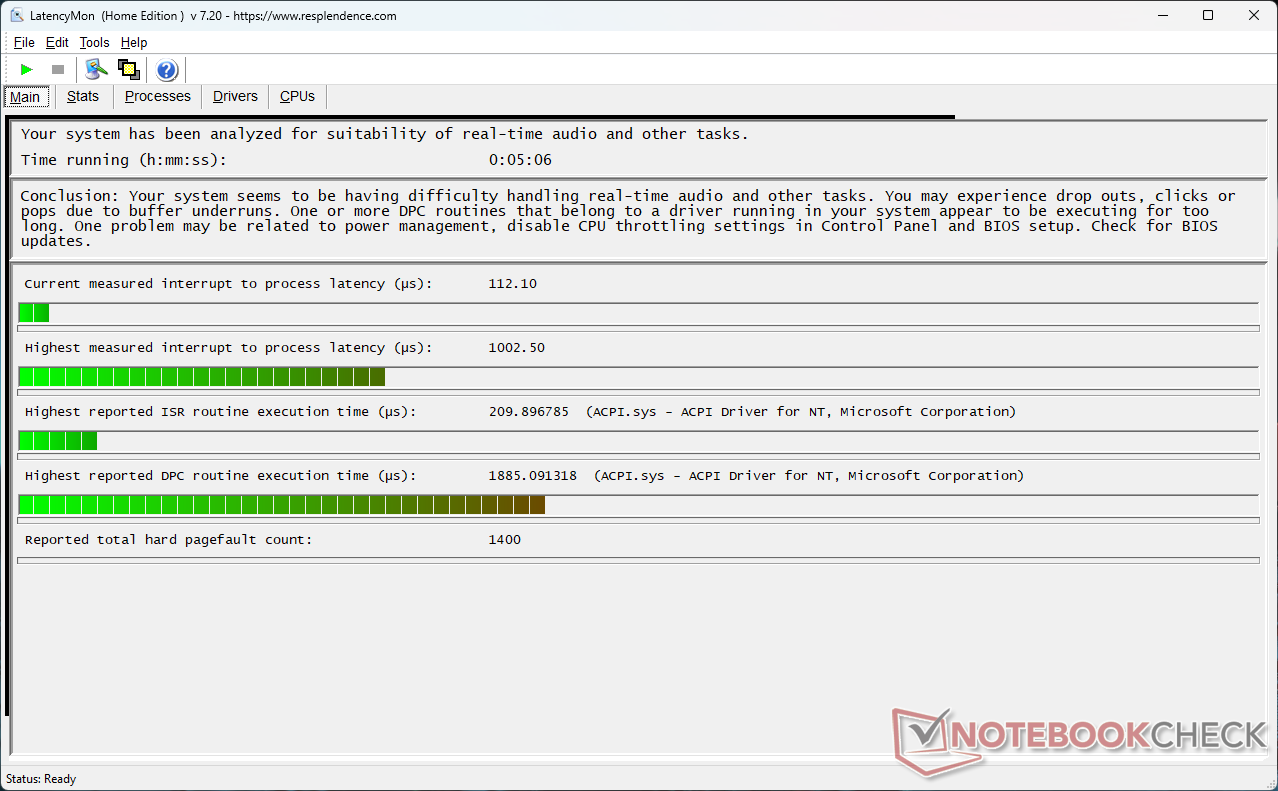
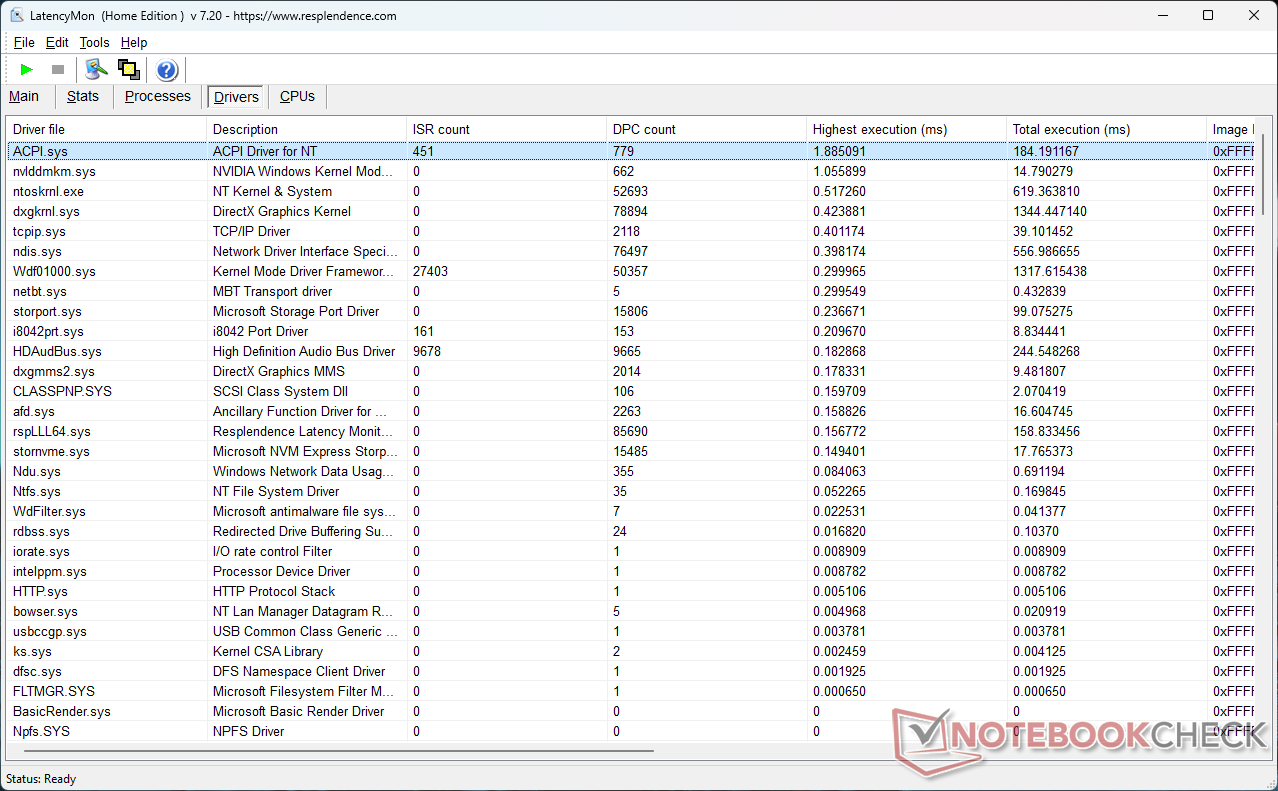
DPC延时
G5 KE的DPC延迟可以说比大多数竞争对手要好,但数值仍然偏高。
| DPC Latencies / LatencyMon - interrupt to process latency (max), Web, Youtube, Prime95 | |
| SCHENKER XMG Core 15 (M22) | |
| Gigabyte G7 KE | |
| Lenovo IdeaPad Gaming 3 15IAH7 | |
| HP Victus 16-e0179ng | |
| Gigabyte A5 K1 | |
| Gigabyte G5 KE | |
| Dell G16 7620 | |
| Asus TUF Gaming F15 FX507ZM | |
| Honor MagicBook 14 2022 | |
* ... smaller is better
请参考我们的DPC 延迟排查页面,以了解更多跨评测设备的延时比较。
存储设备
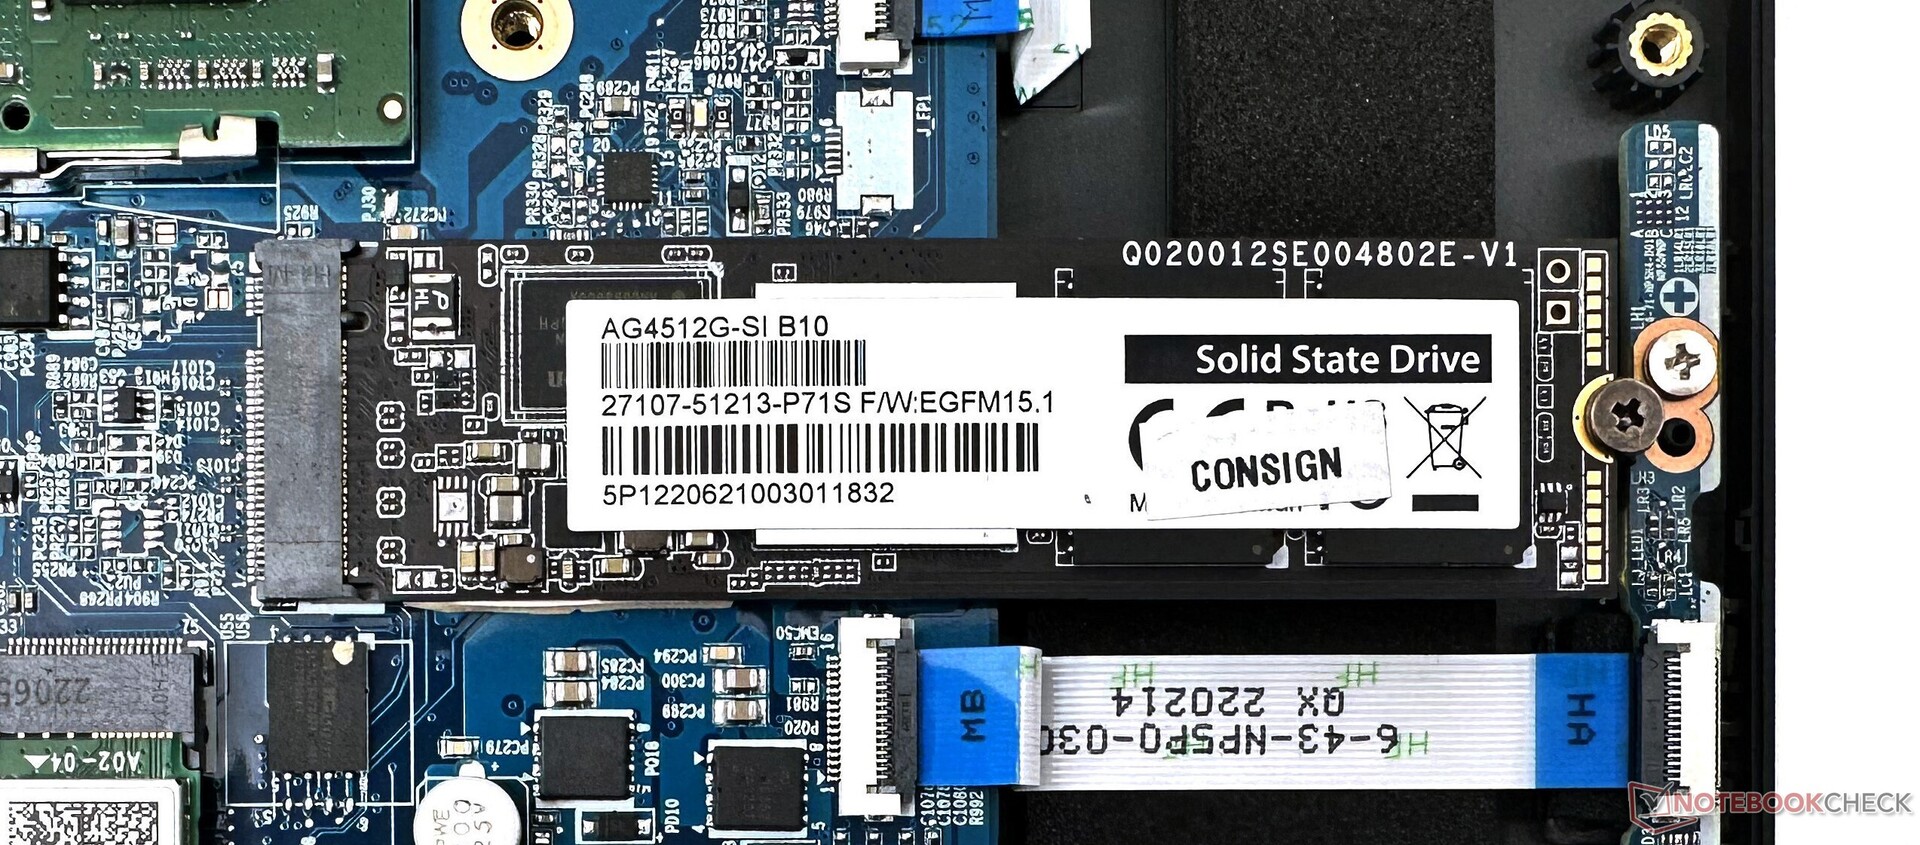
我们的G5 KE设备配备了512GB的技嘉NVMe SSD。然而,我们发现G7 KE中的1TB变种硬盘几乎在各方面都表现得更好。在我们的DiskSpd读取循环测试中,该固态硬盘遭受了剧烈的节流。
可以安装第二块NVMe固态硬盘,但没有添加2.5英寸SATA硬盘的空间。
| Gigabyte G5 KE Gigabyte AG4512G-SI B10 | Lenovo IdeaPad Gaming 3 15IAH7 Intel SSD 660p SSDPEKNW512G8 | Gigabyte G7 KE Gigabyte AG470S1TB-SI B10 | Honor MagicBook 14 2022 Samsung PM9A1 MZVL2512HCJQ | Asus TUF Gaming F15 FX507ZM SK Hynix HFM001TD3JX013N | HP Victus 16-e0179ng WDC PC SN730 SDBPNTY-1T00 | Average Gigabyte AG4512G-SI B10 | Average of class Gaming | |
|---|---|---|---|---|---|---|---|---|
| CrystalDiskMark 5.2 / 6 | -42% | 22% | 43% | -8% | -16% | 0% | 19% | |
| Write 4K | 303.3 | 64 -79% | 363.1 20% | 229.88 -24% | 217.7 -28% | 157.3 -48% | 303 ? 0% | 213 ? -30% |
| Read 4K | 64.25 | 77.05 20% | 59.23 -8% | 91.45 42% | 70.1 9% | 49 -24% | 64.3 ? 0% | 67.7 ? 5% |
| Write Seq | 2258 | 93.07 -96% | 2605 15% | 2844 26% | 2983 32% | 2258 ? 0% | 3862 ? 71% | |
| Read Seq | 2561 | 2570 0% | 2337 -9% | 2492 -3% | 2247 -12% | 2561 ? 0% | 3792 ? 48% | |
| Write 4K Q32T1 | 620.6 | 184.6 -70% | 806.9 30% | 627.94 1% | 408.3 -34% | 395 -36% | 621 ? 0% | 524 ? -16% |
| Read 4K Q32T1 | 866.2 | 461.5 -47% | 1019 18% | 868.92 0% | 524 -40% | 557 -36% | 866 ? 0% | 662 ? -24% |
| Write Seq Q32T1 | 2264.3 | 1659 -27% | 3612 60% | 5118.5 126% | 3011 33% | 3094 37% | 2264 ? 0% | 4810 ? 112% |
| Read Seq Q32T1 | 4717.3 | 2936 -38% | 7067 50% | 6866.5 46% | 3553 -25% | 2871 -39% | 4717 ? 0% | 6364 ? 35% |
| Write 4K Q8T8 | 2239.2 | 2910.25 30% | 2239 ? 0% | 1300 ? -42% | ||||
| Read 4K Q8T8 | 1188.1 | 2687.03 126% | 1188 ? 0% | 1557 ? 31% | ||||
| AS SSD | -48% | 39% | 28% | -23% | -21% | 0% | 8% | |
| Seq Read | 3697.92 | 2432.02 -34% | 4540.75 23% | 5233 42% | 3013 -19% | 2383 -36% | 3698 ? 0% | 4932 ? 33% |
| Seq Write | 2106.21 | 1229.14 -42% | 3805.55 81% | 3857 83% | 2768 31% | 2466 17% | 2106 ? 0% | 3806 ? 81% |
| 4K Read | 82.5 | 75.66 -8% | 99.79 21% | 85.14 3% | 66.9 -19% | 44.14 -46% | 82.5 ? 0% | 65.4 ? -21% |
| 4K Write | 312.09 | 242.19 -22% | 325.41 4% | 216.33 -31% | 184.8 -41% | 117.5 -62% | 312 ? 0% | 216 ? -31% |
| 4K-64 Read | 1675.54 | 441.63 -74% | 2914.54 74% | 2468.58 47% | 1923 15% | 1734 3% | 1676 ? 0% | 1883 ? 12% |
| 4K-64 Write | 1865.08 | 1218.61 -35% | 2915.33 56% | 3003.26 61% | 2198 18% | 2088 12% | 1865 ? 0% | 2531 ? 36% |
| Access Time Read * | 0.066 | 0.073 -11% | 0.094 -42% | 0.023 65% | 0.03 55% | 0.049 26% | 0.066 ? -0% | 0.05728 ? 13% |
| Access Time Write * | 0.013 | 0.033 -154% | 0.012 8% | 0.02 -54% | 0.081 -523% | 0.032 -146% | 0.013 ? -0% | 0.0518 ? -298% |
| Score Read | 2128 | 760 -64% | 3468 63% | 3077 45% | 2291 8% | 2017 -5% | 2128 ? 0% | 2448 ? 15% |
| Score Write | 2388 | 1584 -34% | 3621 52% | 3605 51% | 2660 11% | 2452 3% | 2388 ? 0% | 3123 ? 31% |
| Score Total | 5541 | 2702 -51% | 8837 59% | 8195 48% | 6117 10% | 5503 -1% | 5541 ? 0% | 6759 ? 22% |
| Copy ISO MB/s | 1077.37 | 1949.01 81% | 2093.45 94% | 2143 99% | 1077 ? 0% | 2912 ? 170% | ||
| Copy Program MB/s | 827.5 | 1079.42 30% | 447.36 -46% | 871 5% | 828 ? 0% | 945 ? 14% | ||
| Copy Game MB/s | 1460.58 | 2042.84 40% | 1195.09 -18% | 1840 26% | 1461 ? 0% | 2049 ? 40% | ||
| Total Average (Program / Settings) | -45% /
-46% | 31% /
33% | 36% /
34% | -16% /
-18% | -19% /
-19% | 0% /
0% | 14% /
13% |
* ... smaller is better

Disk Throttling: DiskSpd Read Loop, Queue Depth 8
请查看我们专门的 SSD和HDD基准测试页面,了解更多存储设备的比较。
GPU性能
115瓦的 NvidiaGeForce RTX 3060 笔记本电脑GPU在3DMark测试中的表现不相上下。G5 KE显示出良好的领先优势,超过了 HP Victus在合成测试中显示出良好的领先优势,这是因为后者采用了95瓦的TGP配置。
| 3DMark 11 Performance | 26505 points | |
| 3DMark Ice Storm Standard Score | 188480 points | |
| 3DMark Cloud Gate Standard Score | 53162 points | |
| 3DMark Fire Strike Score | 19966 points | |
| 3DMark Fire Strike Extreme Score | 10252 points | |
| 3DMark Time Spy Score | 8922 points | |
Help | ||
游戏性能
技嘉G5 KE的游戏性能与我们测试过的其他基于RTX 3060的笔记本电脑相似,甚至能在几个游戏中超过具有相同配置的G7 KE。
我们注意到,在用TheWitcher 3 ,在1080p Ultra下对笔记本电脑进行压力测试时,没有发现明显的帧数下降。
The Witcher 3 FPS Chart
| low | med. | high | ultra | |
|---|---|---|---|---|
| GTA V (2015) | 183.4 | 179.9 | 172.8 | 103 |
| The Witcher 3 (2015) | 333 | 255 | 168.7 | 87.6 |
| Dota 2 Reborn (2015) | 168.5 | 153.1 | 144.8 | 137.5 |
| Final Fantasy XV Benchmark (2018) | 179.3 | 118.9 | 90.3 | |
| X-Plane 11.11 (2018) | 118.4 | 105.6 | 86.7 | |
| Far Cry 5 (2018) | 159 | 134 | 129 | 118 |
| Strange Brigade (2018) | 385 | 216 | 175.3 | 153.3 |
| F1 2021 (2021) | 303 | 200 | 177.9 | 105.1 |
| Cyberpunk 2077 1.6 (2022) | 105.4 | 85.3 | 72.5 | 68 |
| F1 22 (2022) | 197 | 189.4 | 153.3 | 55.9 |
查看我们的专用 NvidiaGeForce RTX 3060 Laptop GPU页面,以及我们的 详尽的游戏比较列表以了解更多信息和性能比较。
Emissions: High surface temperatures and fan noise under load
系统噪音
在测试的性能模式下,空闲的系统噪音有些偏高,约为31 dB(A)。风扇噪音达到了55 dB(A),而不考虑负载。
在安静模式下,技嘉似乎已经将风扇噪音控制在30dB(A)以下。只有 Witcher 3,在省电模式下,风扇噪音排放较高,如下表所示。
| 性能模式 | 空闲分贝(A) | 负载平均分贝(A) | 负载最大分贝(A) | Witcher 3 分贝(A) |
|---|---|---|---|---|
| 静音 | 22.21 | 25.73 | 24.64 | 27.62 |
| 省电 | 22.65 | 24.75 | 24.62 | 49.05 |
| 娱乐 | 22.63 | 54.67 | 55.52 | 53.11 |
| 性能 | 31.05 | 55.66 | 55.51 | 55.65 |
Noise Level
| Idle |
| 31.05 / 31.05 / 31.05 dB(A) |
| Load |
| 55.66 / 55.51 dB(A) |
 | ||
30 dB silent 40 dB(A) audible 50 dB(A) loud |
||
min: | ||
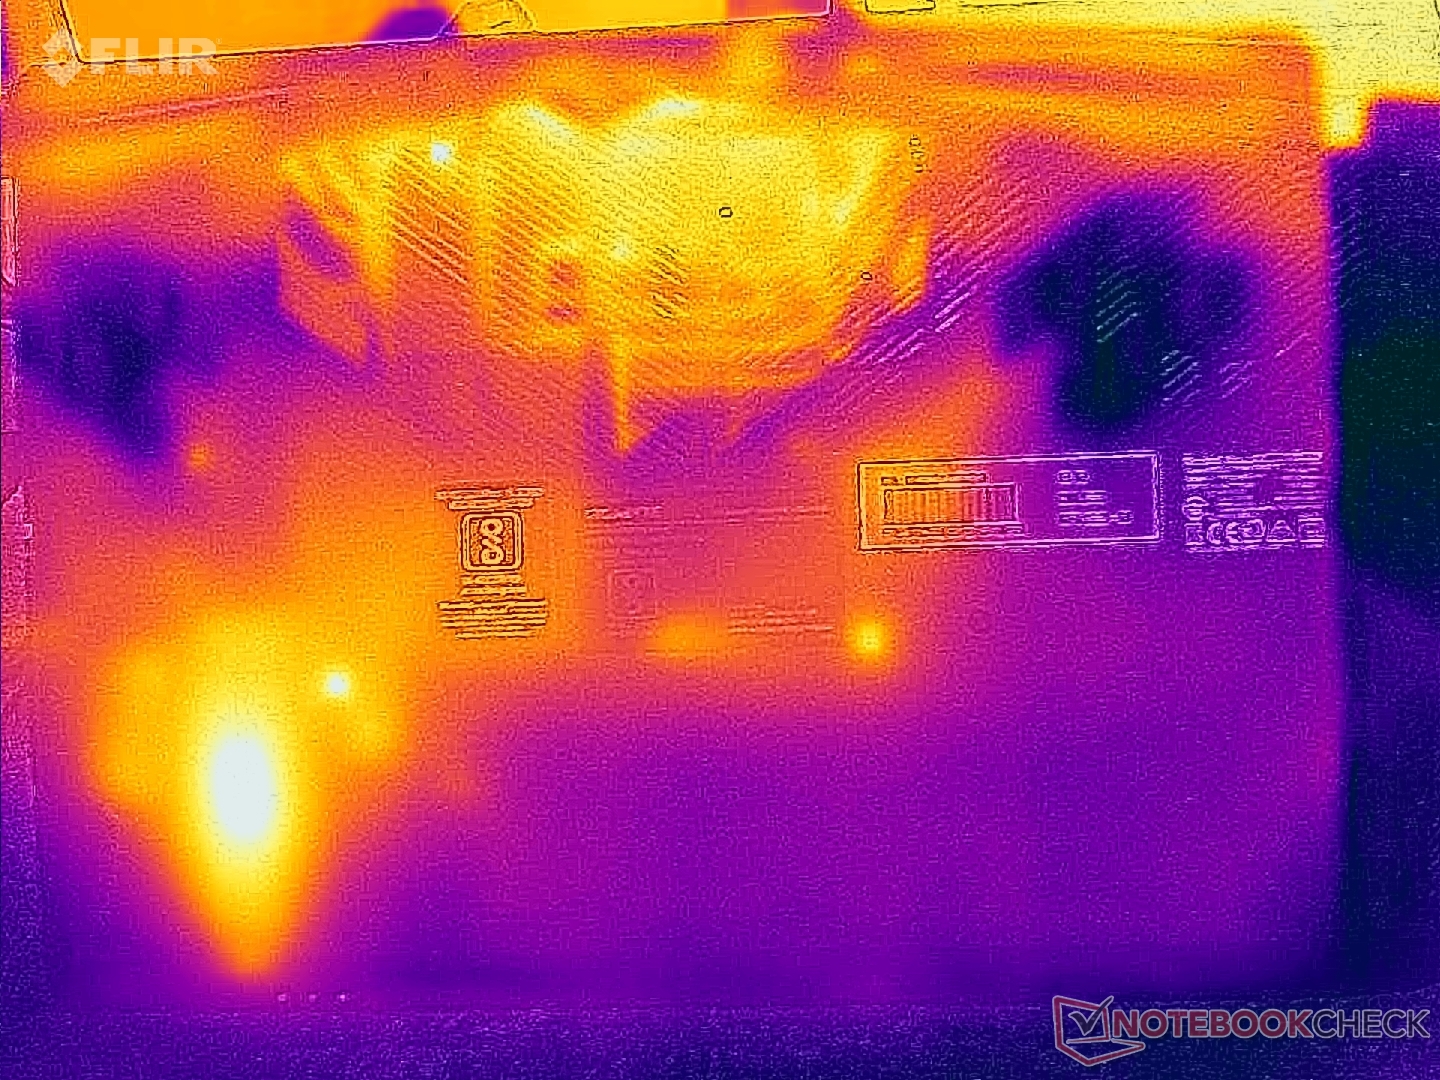
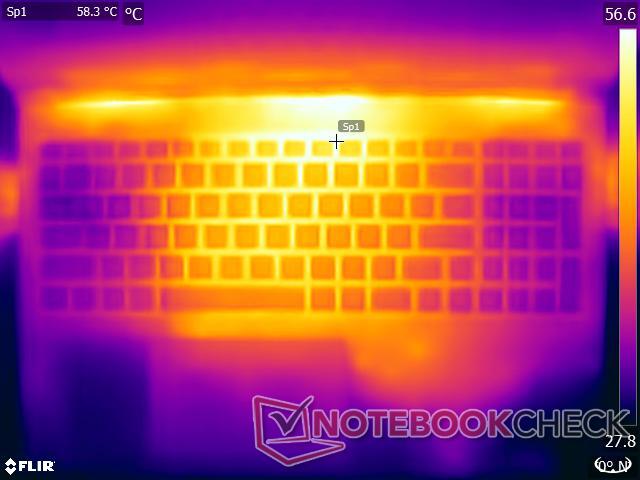
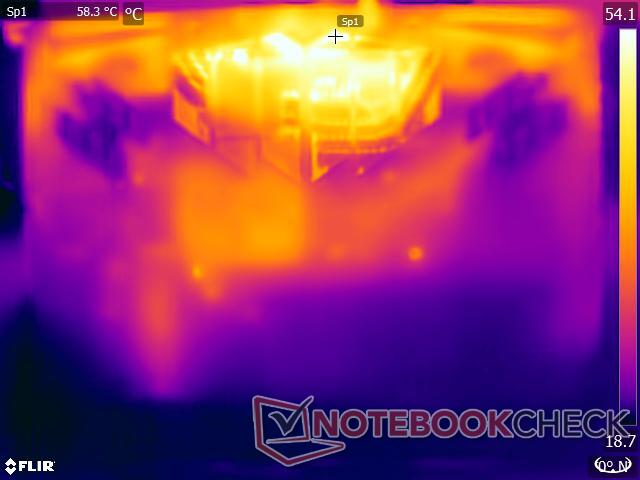
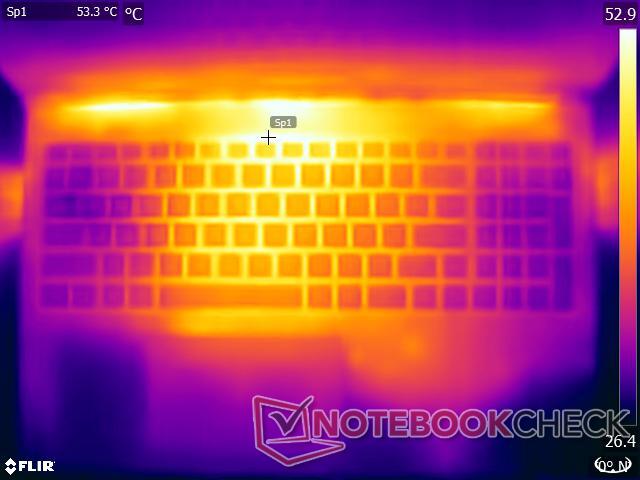
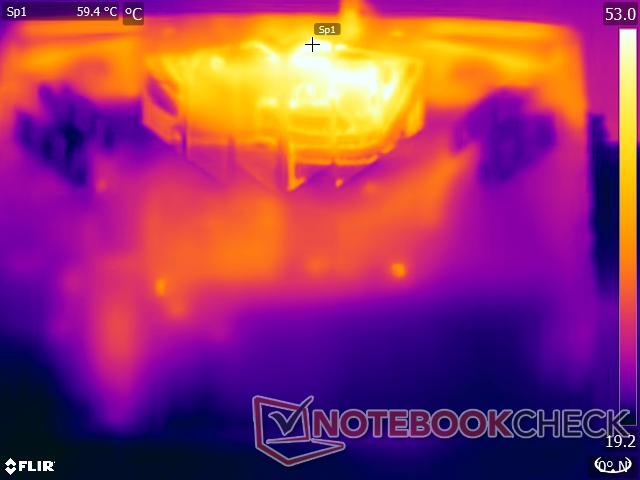
温度
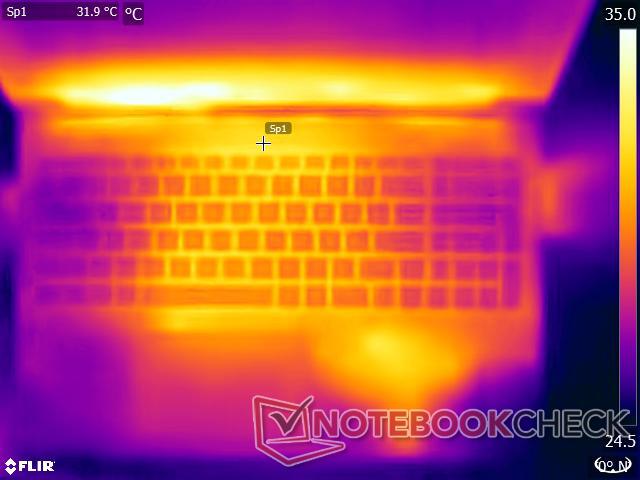
技嘉G5 KE的双风扇四热管系统在控制核心温度方面做得很好,但在重载情况下,表面温度最高可达52.6℃,底部最高可达62.4℃。
触摸板区域也会变得相当热。
(-) The maximum temperature on the upper side is 52.6 °C / 127 F, compared to the average of 40.4 °C / 105 F, ranging from 21.2 to 68.8 °C for the class Gaming.
(-) The bottom heats up to a maximum of 62.4 °C / 144 F, compared to the average of 43.2 °C / 110 F
(±) In idle usage, the average temperature for the upper side is 32 °C / 90 F, compared to the device average of 33.9 °C / 93 F.
(-) Playing The Witcher 3, the average temperature for the upper side is 42.9 °C / 109 F, compared to the device average of 33.9 °C / 93 F.
(-) The palmrests and touchpad can get very hot to the touch with a maximum of 41.2 °C / 106.2 F.
(-) The average temperature of the palmrest area of similar devices was 28.9 °C / 84 F (-12.3 °C / -22.2 F).
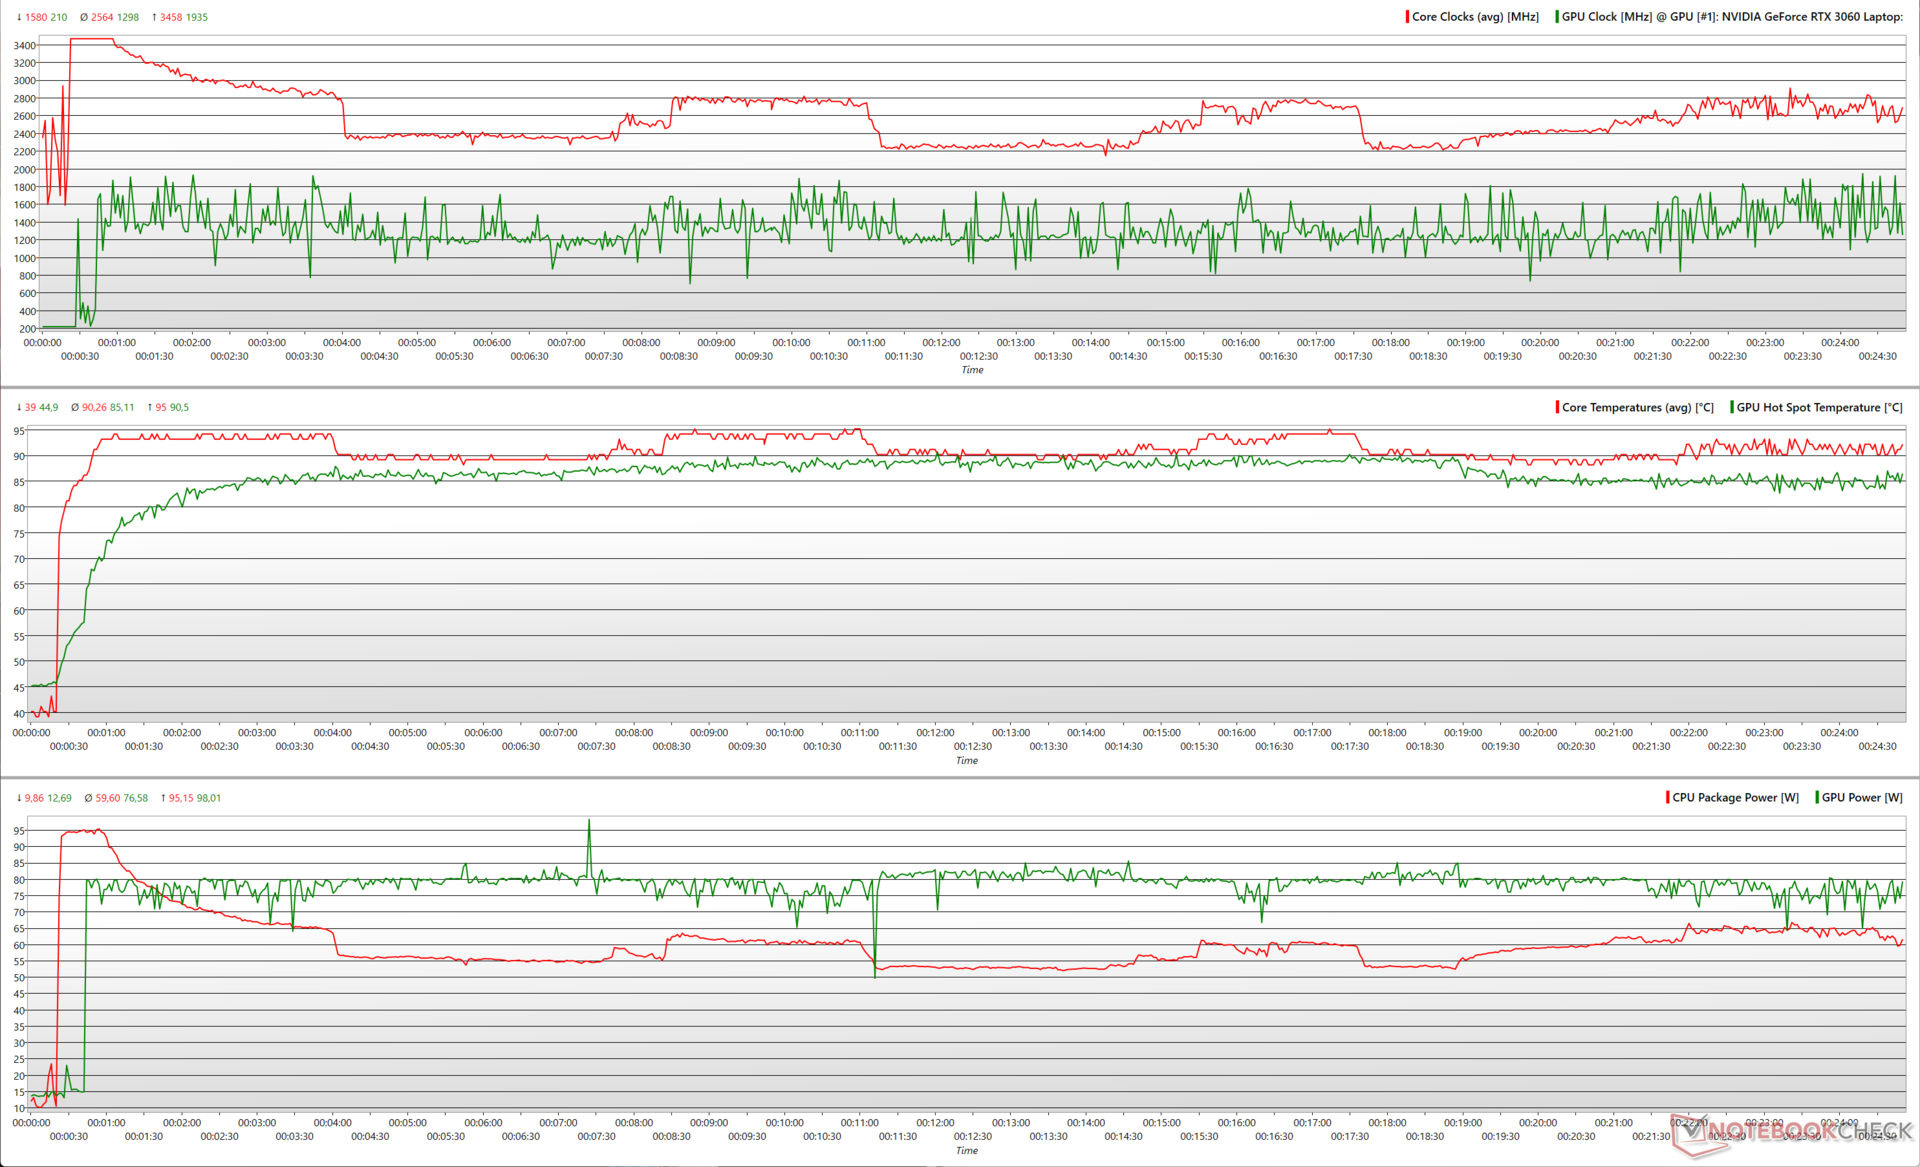
在Prime95和FurMark的综合压力下,Core i5-12500H短暂地达到了约3.5 GHz的峰值,功率为95 W,然后下降到约2.5 GHz,接近平均60 W。RTX 3060笔记本GPU的平均功率约为75.6W,但确实达到了98W的峰值,导致最大核心时钟为1.9GHz。
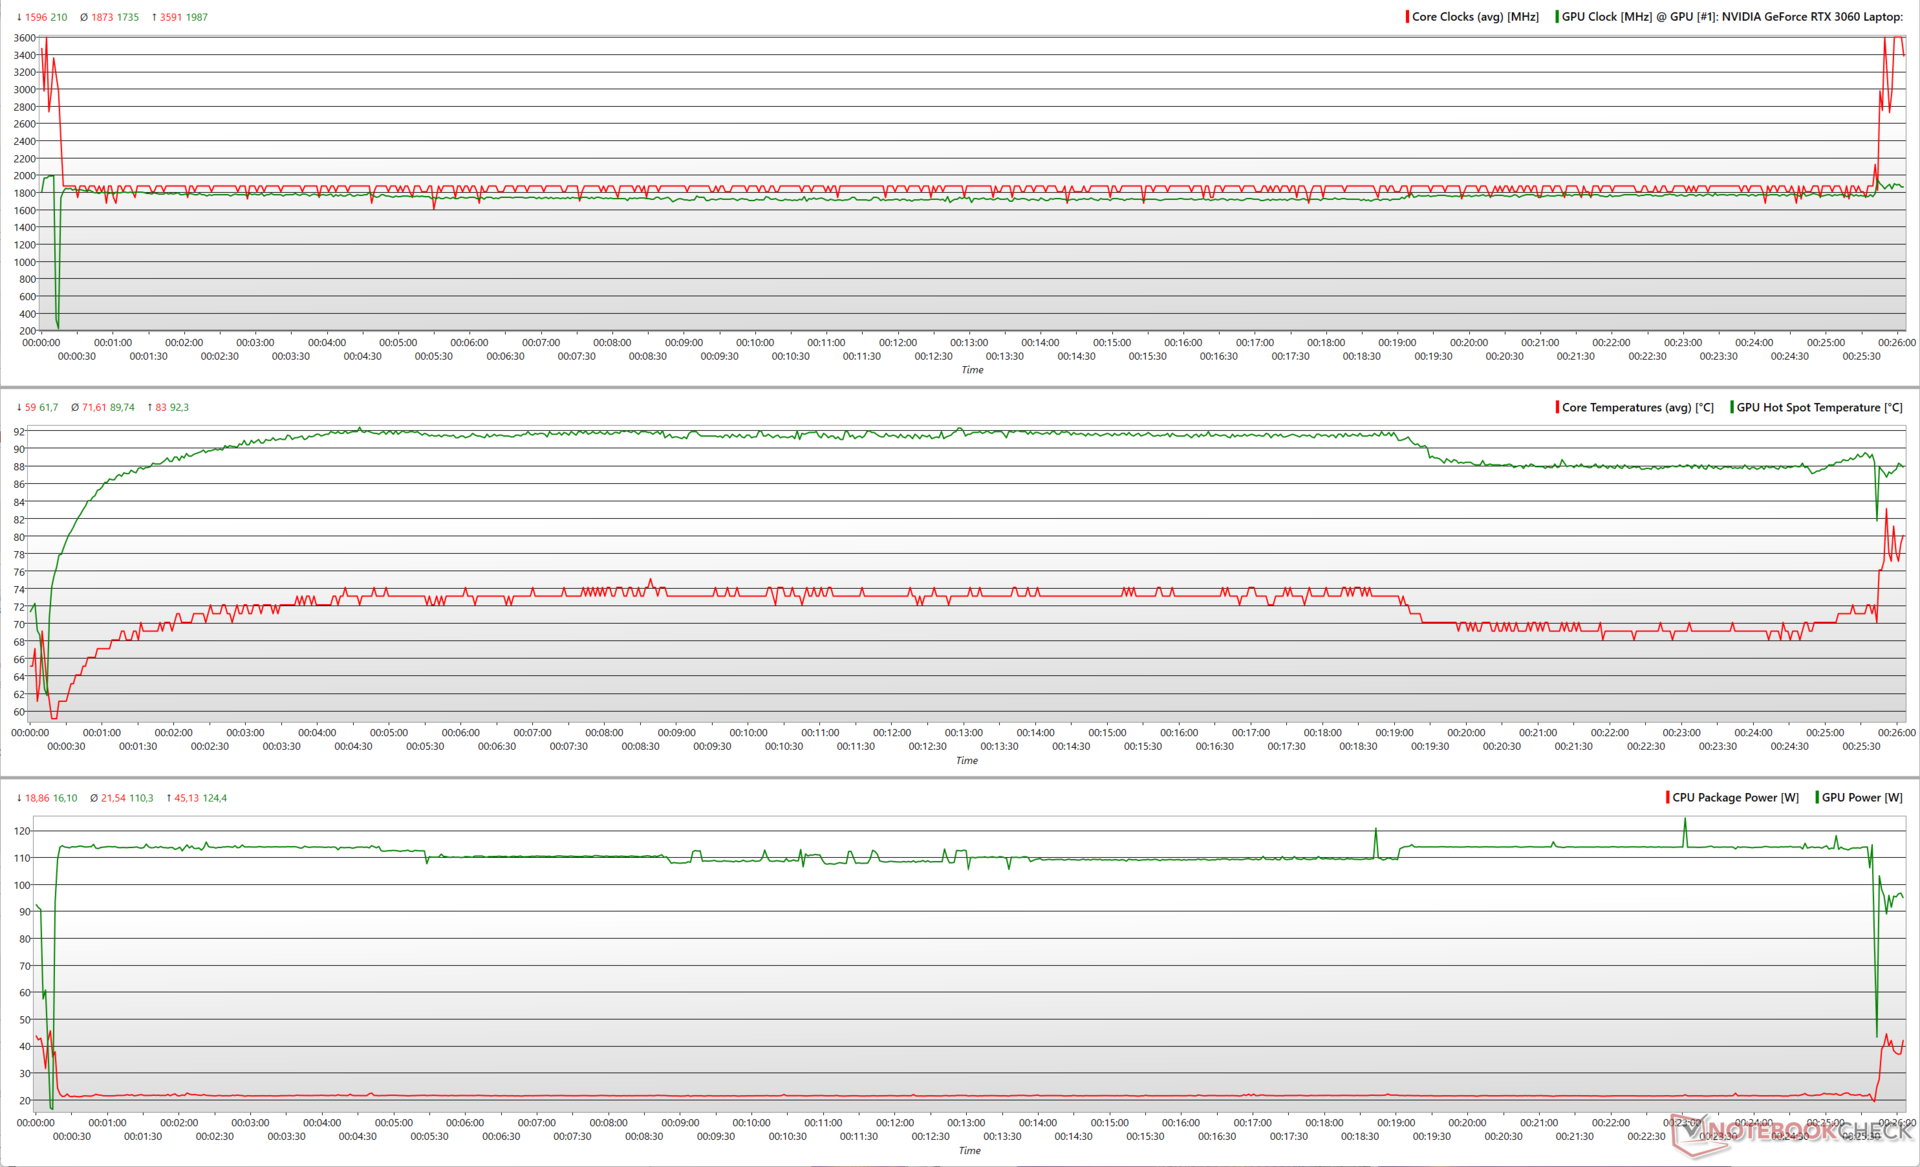
在《Witcher 3 》的压力下,我们看到类似的峰值时钟,但CPU的平均封装功率进一步下降到约21.5 W,使RTX 3060的平均消耗量达到110 W。
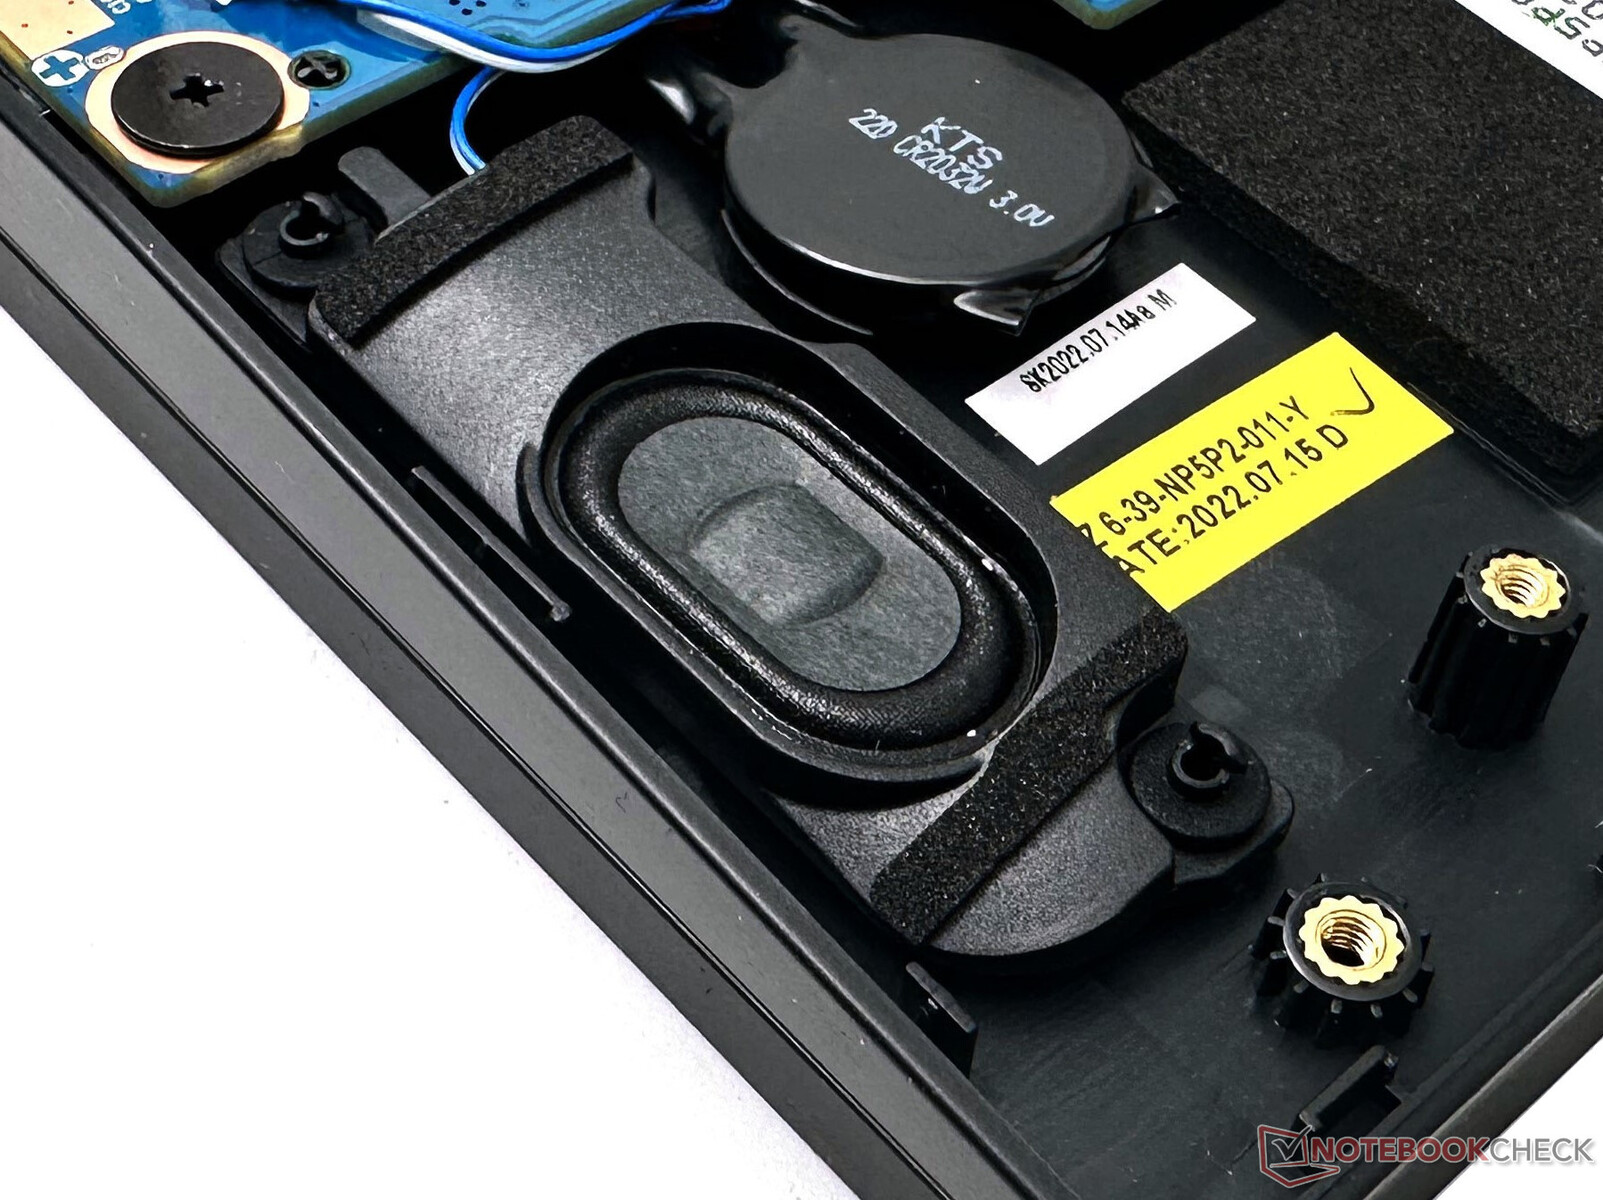
发言人
G5 KE的扬声器在大多数情况下是可以使用的,其响度接近75dB(A)。低音响应几乎不存在,但中音和高音可以很好地再现。
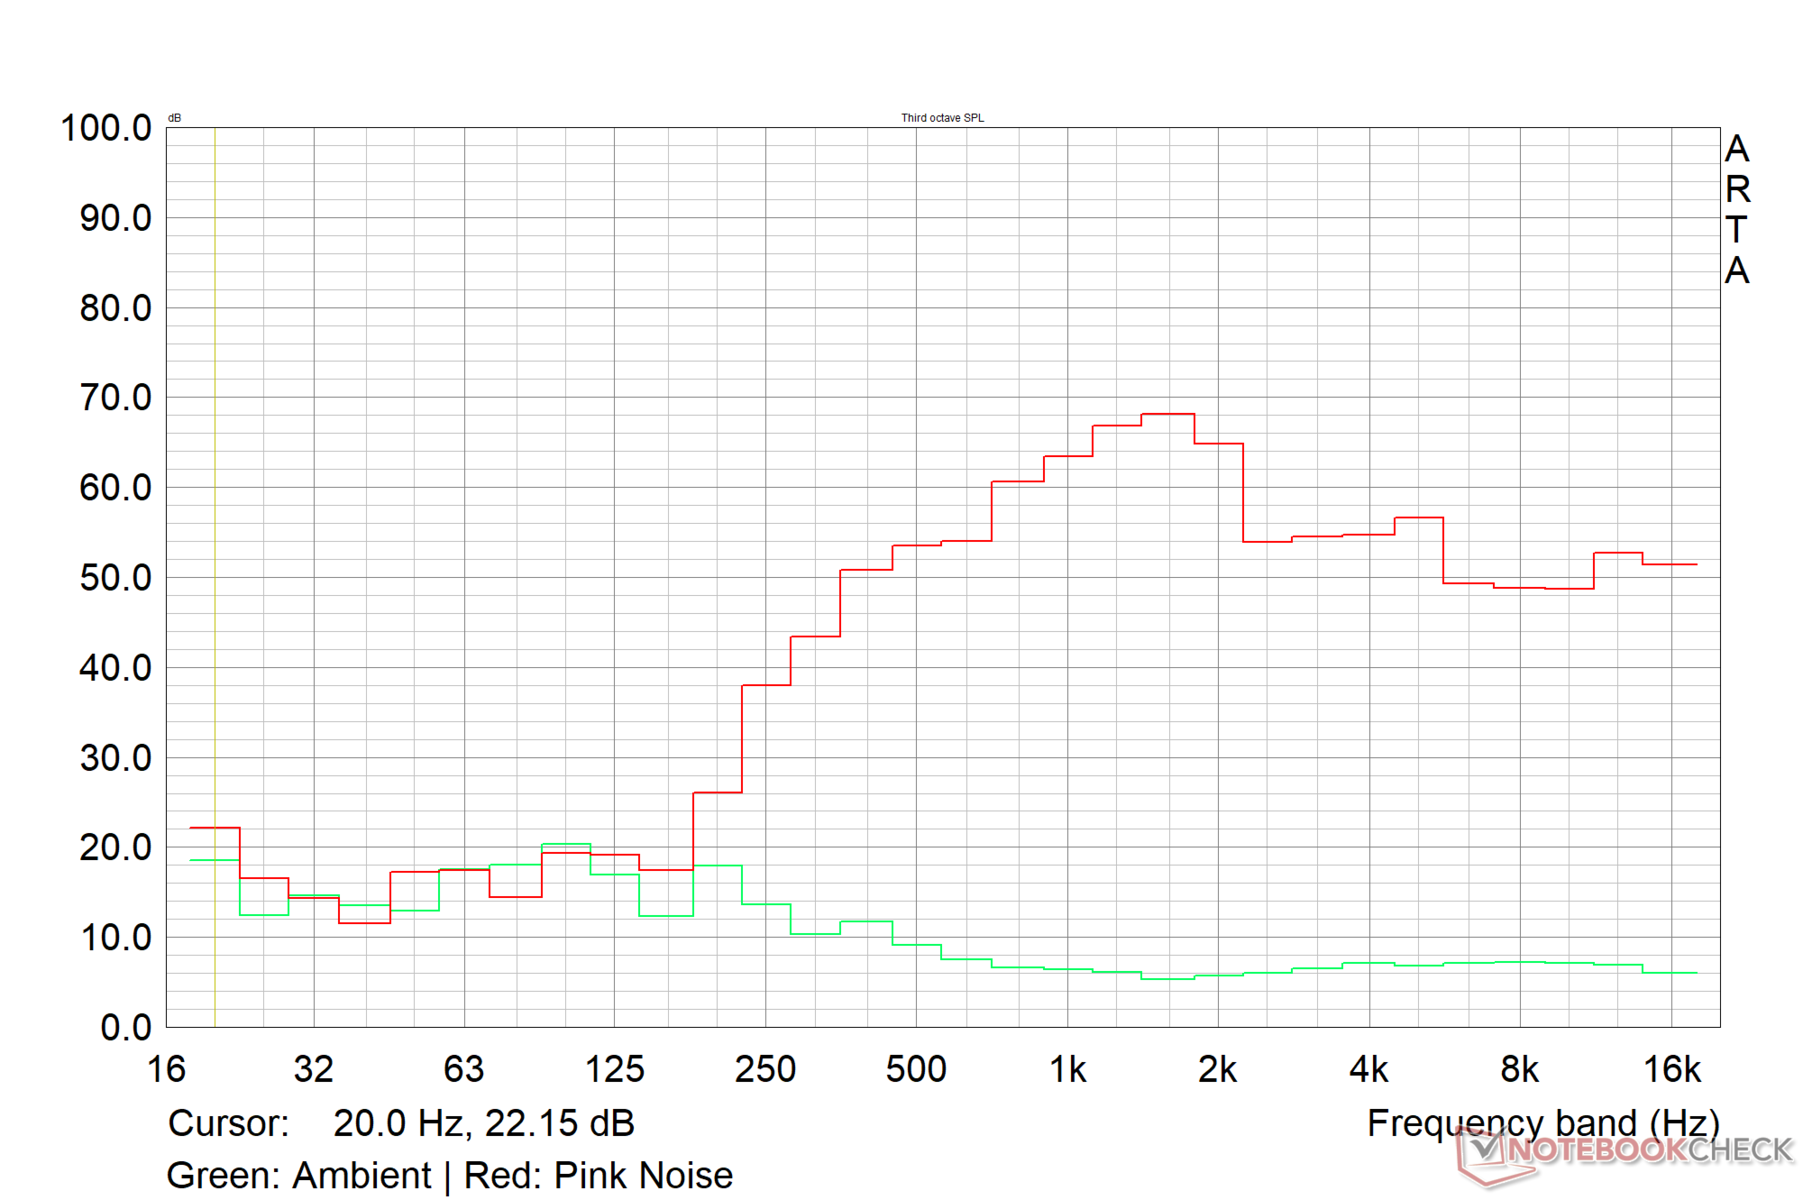
Gigabyte G5 KE audio analysis
(±) | speaker loudness is average but good (73.6 dB)
Bass 100 - 315 Hz
(-) | nearly no bass - on average 25.5% lower than median
(±) | linearity of bass is average (12% delta to prev. frequency)
Mids 400 - 2000 Hz
(±) | higher mids - on average 8.1% higher than median
(±) | linearity of mids is average (7.7% delta to prev. frequency)
Highs 2 - 16 kHz
(+) | balanced highs - only 2.9% away from median
(+) | highs are linear (6.7% delta to prev. frequency)
Overall 100 - 16.000 Hz
(±) | linearity of overall sound is average (25.1% difference to median)
Compared to same class
» 89% of all tested devices in this class were better, 3% similar, 8% worse
» The best had a delta of 6%, average was 18%, worst was 132%
Compared to all devices tested
» 75% of all tested devices were better, 5% similar, 20% worse
» The best had a delta of 4%, average was 24%, worst was 134%
Apple MacBook Pro 16 2021 M1 Pro audio analysis
(+) | speakers can play relatively loud (84.7 dB)
Bass 100 - 315 Hz
(+) | good bass - only 3.8% away from median
(+) | bass is linear (5.2% delta to prev. frequency)
Mids 400 - 2000 Hz
(+) | balanced mids - only 1.3% away from median
(+) | mids are linear (2.1% delta to prev. frequency)
Highs 2 - 16 kHz
(+) | balanced highs - only 1.9% away from median
(+) | highs are linear (2.7% delta to prev. frequency)
Overall 100 - 16.000 Hz
(+) | overall sound is linear (4.6% difference to median)
Compared to same class
» 0% of all tested devices in this class were better, 0% similar, 100% worse
» The best had a delta of 5%, average was 18%, worst was 45%
Compared to all devices tested
» 0% of all tested devices were better, 0% similar, 100% worse
» The best had a delta of 4%, average was 24%, worst was 134%
能源管理:闲置时节俭用电,电池寿命平平
消耗功率
在功耗方面,技嘉G5 KE比G7 KE要经济不少,特别是在空闲时。
该 联想IdeaPad Gaming 3's RTX 3050 Ti笔记本GPU和惠普Victus的95W RTX 3060和Ryzen 7 5800H的组合。 Ryzen 7 5800H帮助这些设备总体上消耗较少的电力。
| Off / Standby | |
| Idle | |
| Load |
|
Key:
min: | |
| Gigabyte G5 KE i5-12500H, GeForce RTX 3060 Laptop GPU, IPS, 1920x1080, 15.6" | Lenovo IdeaPad Gaming 3 15IAH7 i5-12500H, GeForce RTX 3050 Ti Laptop GPU, IPS, 1920x1080, 15.6" | Gigabyte G7 KE i5-12500H, GeForce RTX 3060 Laptop GPU, IPS, 1920x1080, 17.3" | SCHENKER XMG Core 15 (M22) R7 6800H, GeForce RTX 3060 Laptop GPU, IPS, 2560x1440, 15.6" | Dell G16 7620 i7-12700H, GeForce RTX 3060 Laptop GPU, IPS, 2560x1600, 16" | Asus TUF Gaming F15 FX507ZM i7-12700H, GeForce RTX 3060 Laptop GPU, IPS, 1920x1080, 15.6" | HP Victus 16-e0179ng R7 5800H, GeForce RTX 3060 Laptop GPU, IPS, 1920x1080, 16.1" | Average NVIDIA GeForce RTX 3060 Laptop GPU | Average of class Gaming | |
|---|---|---|---|---|---|---|---|---|---|
| Power Consumption | 9% | -33% | -14% | -42% | -8% | 9% | -18% | -43% | |
| Idle Minimum * | 7.66 | 8 -4% | 15 -96% | 11.8 -54% | 14.4 -88% | 6.3 18% | 5 35% | 10.4 ? -36% | 13.5 ? -76% |
| Idle Average * | 10.3 | 10 3% | 17 -65% | 14.7 -43% | 17.8 -73% | 9.8 5% | 10 3% | 14.5 ? -41% | 19 ? -84% |
| Idle Maximum * | 16.05 | 16 -0% | 24 -50% | 15 7% | 31.5 -96% | 26.5 -65% | 20 -25% | 21.4 ? -33% | 26.4 ? -64% |
| Load Average * | 115.8 | 99 15% | 111 4% | 100 14% | 101.2 13% | 103.8 10% | 108 7% | 109.3 ? 6% | 102.1 ? 12% |
| Witcher 3 ultra * | 168.7 | 144.6 14% | 174.1 -3% | 184 -9% | 176.9 -5% | 189 -12% | 145 14% | ||
| Load Maximum * | 234.6 | 168 28% | 208 11% | 237 -1% | 242.9 -4% | 241.9 -3% | 189 19% | 206 ? 12% | 247 ? -5% |
* ... smaller is better
Power Consumption: The Witcher 3 / Stress test
Power Consumption: External monitor
电池寿命
即使在降低了150尼特亮度的情况下,技嘉G5 KE的电池运行时间也是偏低的。然而,这在游戏笔记本中并不罕见。
与我们对G7 KE的观察类似,我们注意到在150尼特的H.264 1080p视频循环播放测试中,即使所有的驱动器和操作系统补丁都是最新的,运行时间也只有两小时多一点。
Pros
Cons
评语:主流游戏玩家有不可避免的妥协
虽然技嘉很快就会在未来几周内推出一系列更新的英特尔13代和RTX 40系列Aorus、Aero和技嘉笔记本电脑,但G5 KE配备了 英特尔酷睿i5-12500HCPU和 Nvidia RTX 3060笔记本GPU仍然是一个很好的主流游戏选择。
技嘉很好地利用了酷睿i5-12500H和RTX 3060笔记本GPU组合,我们没有发现整体性能的不良问题。双风扇四热管的冷却安排很好地确保了底层硬件在负载下不被扼杀。
技嘉G5 KE是一款有能力进行1080p超级游戏的主流笔记本电脑,其CPU和GPU性能非常好。然而,它在其他方面有所不足,这可能是或可能不是关键,取决于你的优先事项。
也就是说,与2023年的标准相比,显示屏是低于标准的,特别是当竞争设备,如 联想IdeaPad Gaming 3, 申科XMG Core 15 (M22),华硕TUF Gaming F15,以及技嘉自己的 G7 KE提供具有广泛色域覆盖和快速响应时间的巨大优势面板。
其他突出的不足之处包括:固态硬盘在负载下急剧节流,表面温度高,风扇声音大,视频播放时电池寿命差。
如果这些妥协对你来说并不重要,那么从纯粹的性能角度来看,技嘉G5 KE是一款体面的中端笔记本电脑,适合FHD游戏,应该可以为你服务到2023年。
价格和可用性
在印度,技嘉G5 KE目前在Flipkart上零售。折扣价为94,990,而印度亚马逊以95,901的价格提供配备RTX 3050 Ti的G5 ME。
配备RTX 3060的G5 KE在国际市场上有点难找,因为这款笔记本电脑正被基于RTX 4050或RTX 4060的配置所取代。
Gigabyte G5 KE
- 04/24/2023 v7 (old)
Vaidyanathan Subramaniam
Transparency
The selection of devices to be reviewed is made by our editorial team. The test sample was provided to the author as a loan by the manufacturer or retailer for the purpose of this review. The lender had no influence on this review, nor did the manufacturer receive a copy of this review before publication. There was no obligation to publish this review. We never accept compensation or payment in return for our reviews. As an independent media company, Notebookcheck is not subjected to the authority of manufacturers, retailers or publishers.
This is how Notebookcheck is testing
Every year, Notebookcheck independently reviews hundreds of laptops and smartphones using standardized procedures to ensure that all results are comparable. We have continuously developed our test methods for around 20 years and set industry standards in the process. In our test labs, high-quality measuring equipment is utilized by experienced technicians and editors. These tests involve a multi-stage validation process. Our complex rating system is based on hundreds of well-founded measurements and benchmarks, which maintains objectivity. Further information on our test methods can be found here.
Price comparison

