

惠普 OmniStudio X 32 评论--适合办公室、在家办公或学校使用的完美 AI 一体机?
全面的解决方案
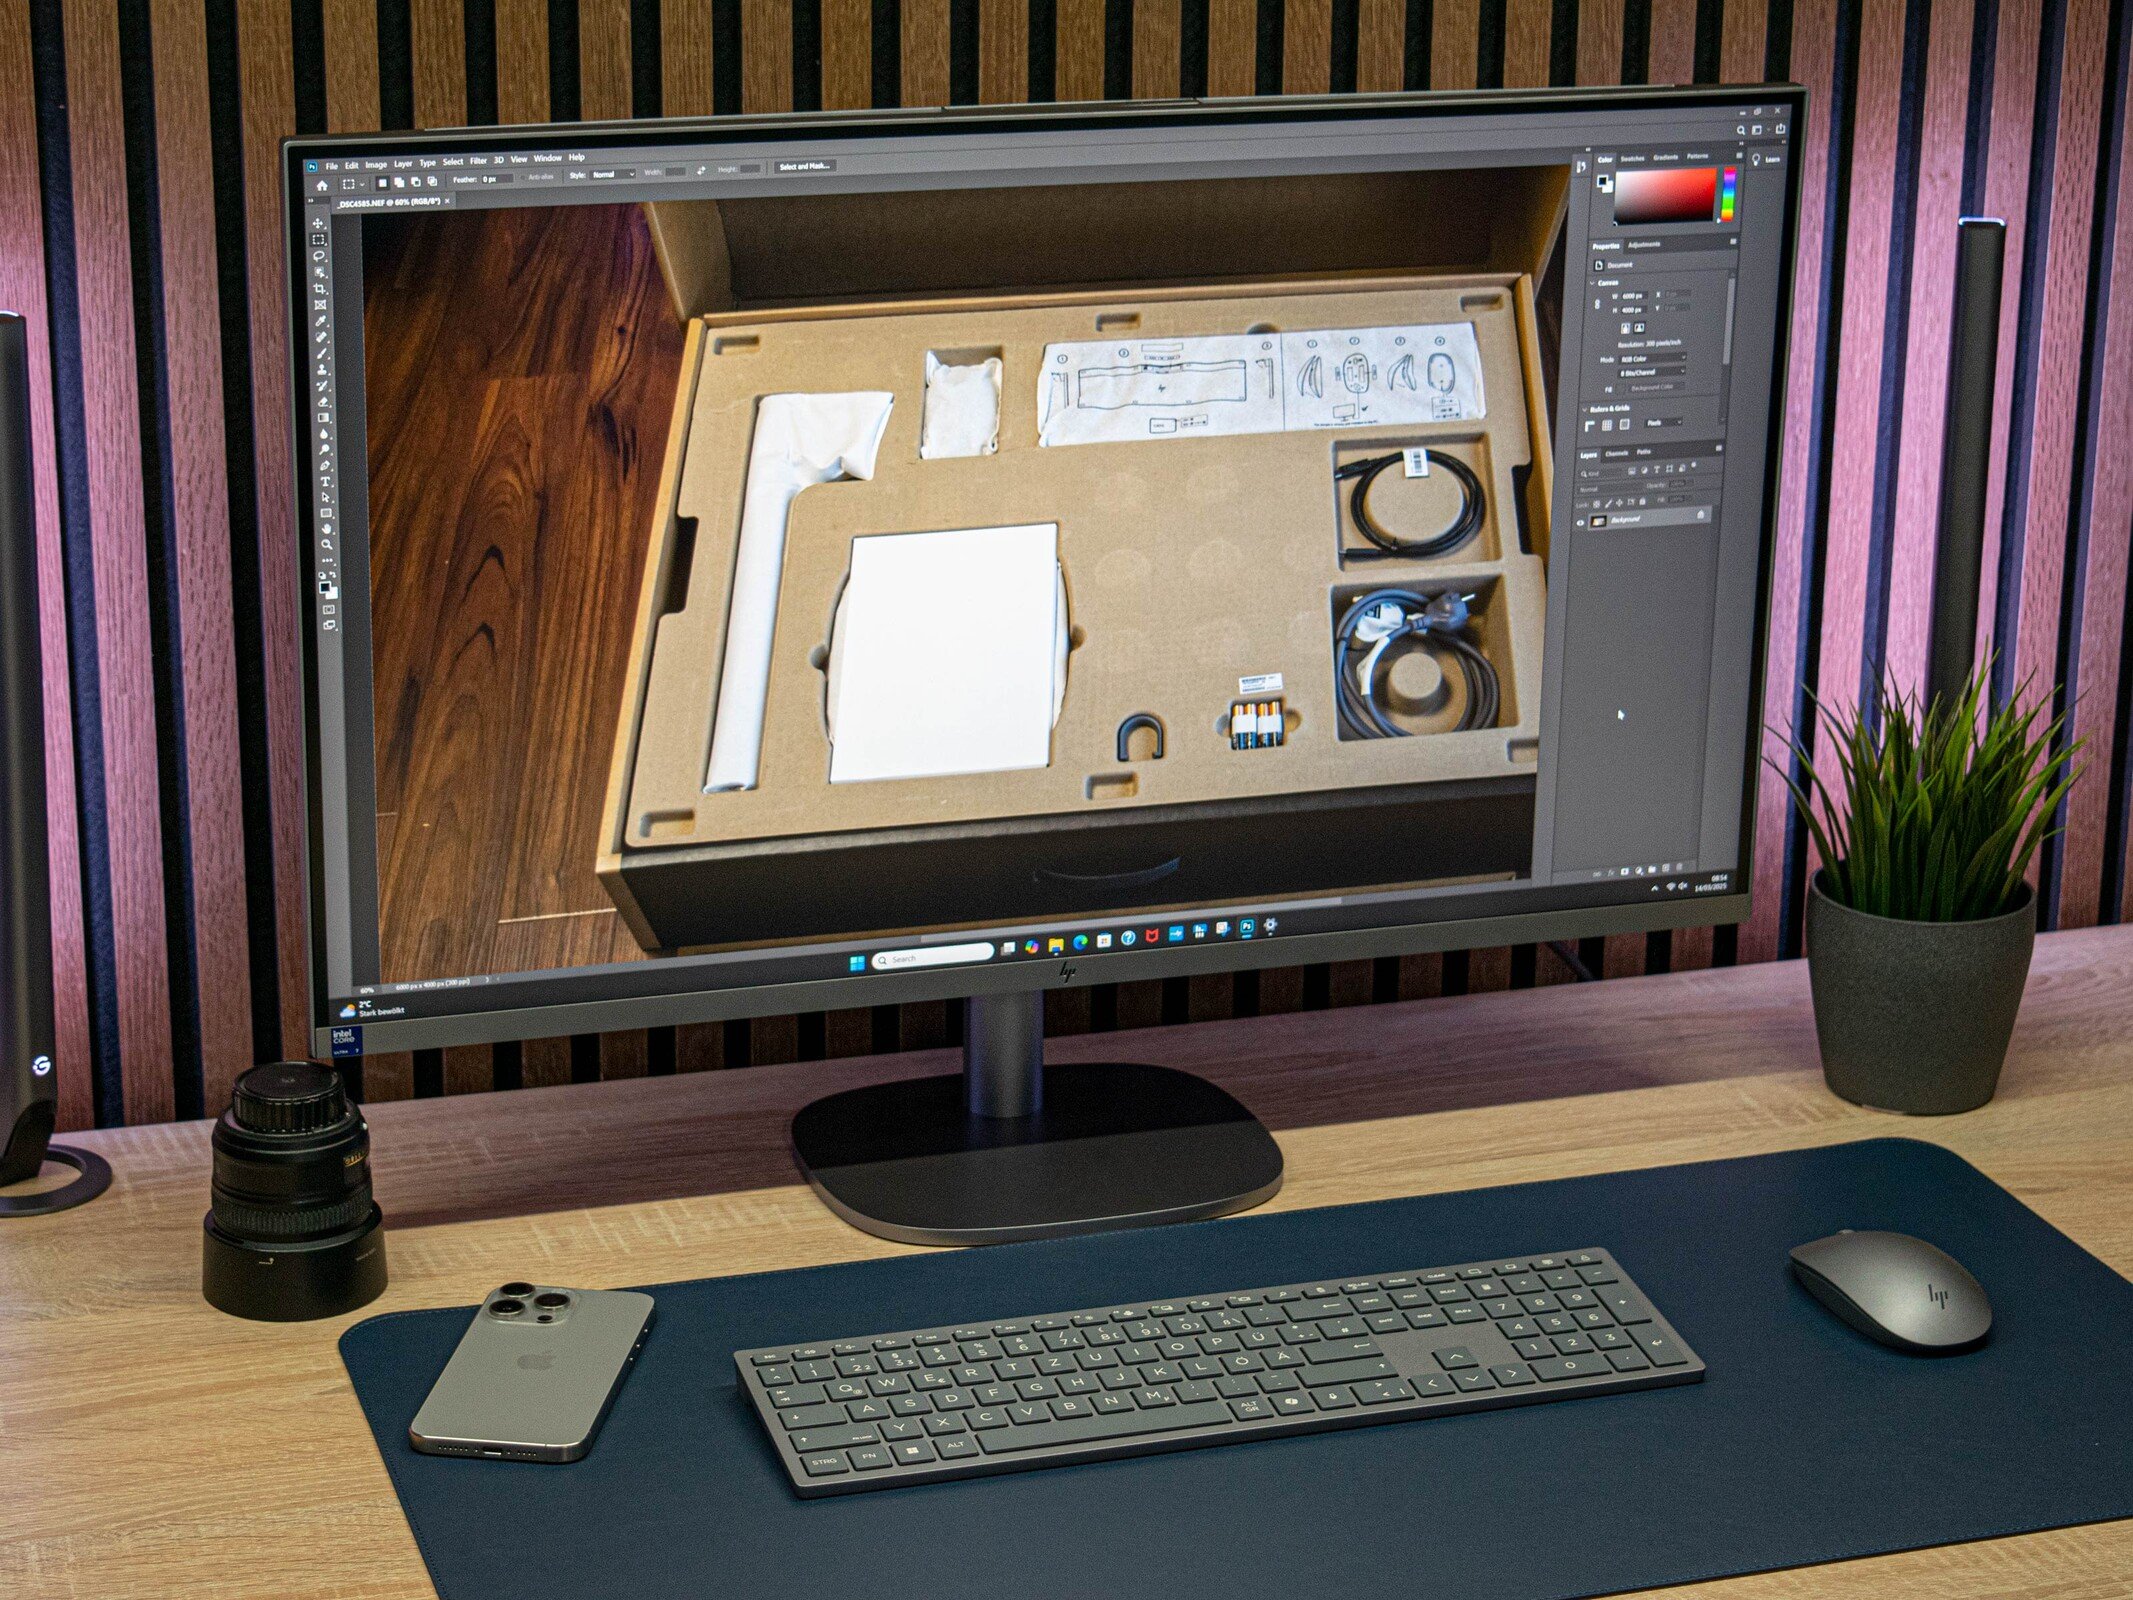
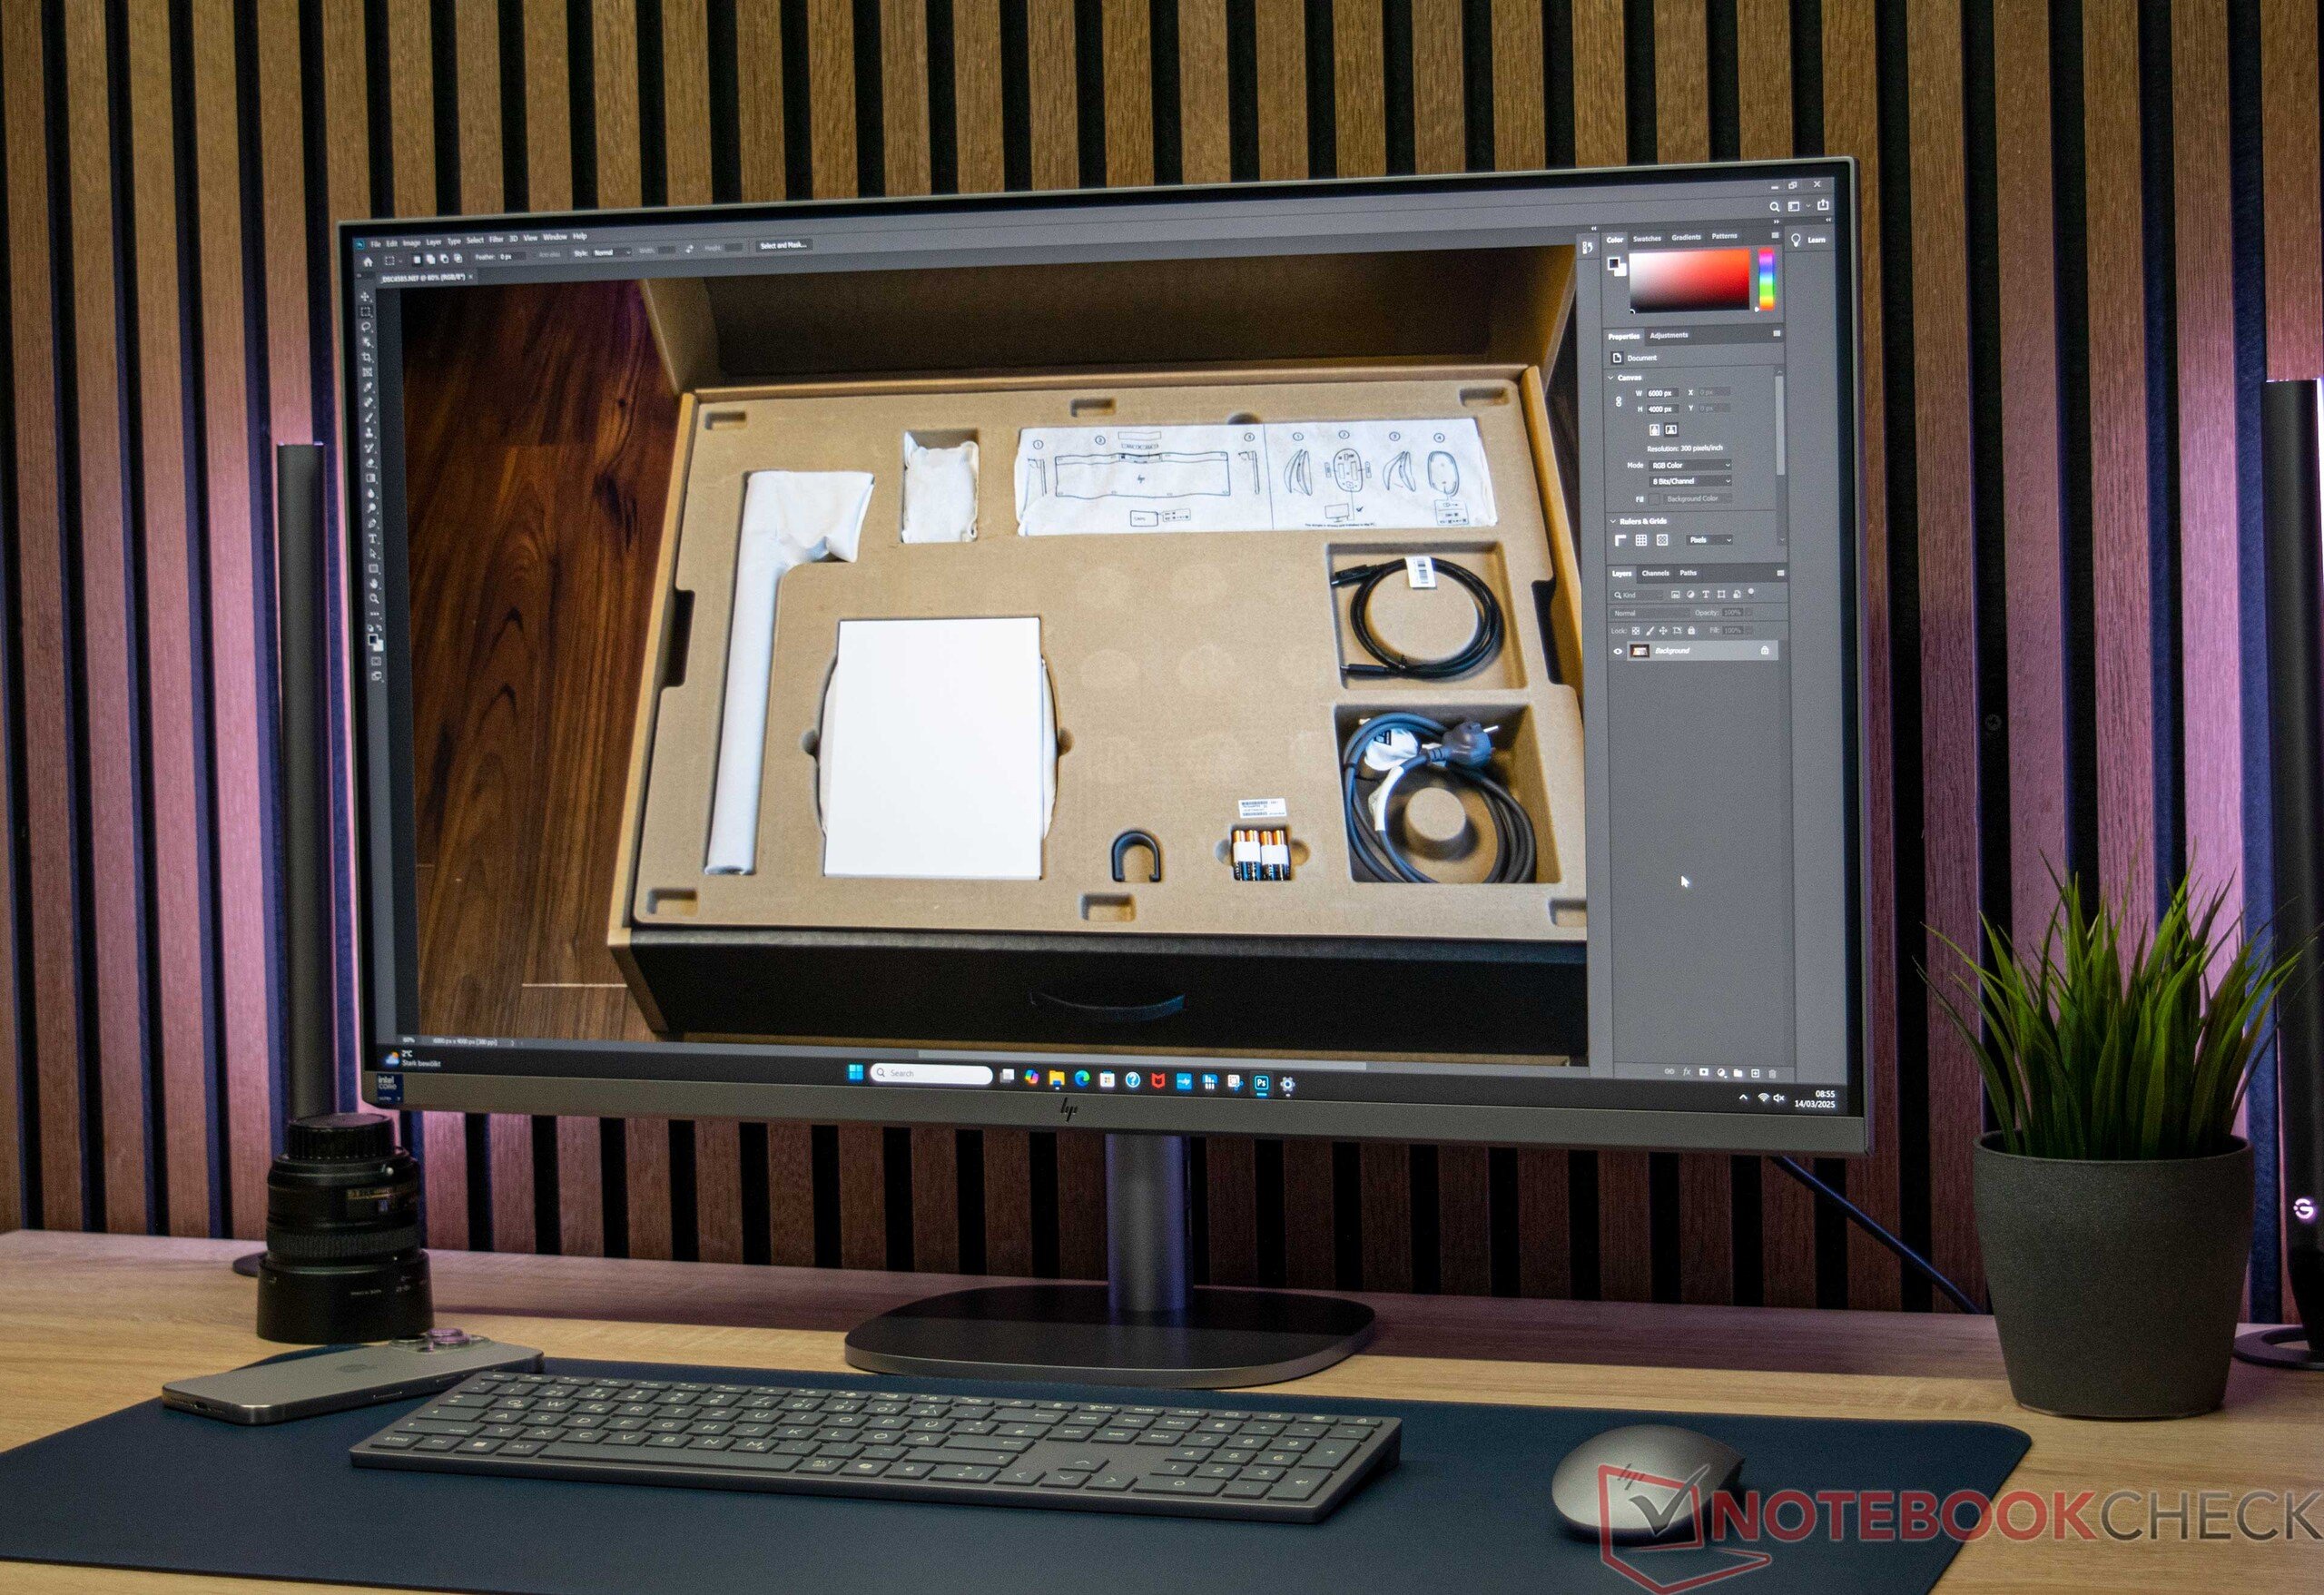
作为一款功能强大的一体式人工智能电脑,惠普 OmniStudio X 32 承诺将性能、设计和功能完美结合。无论是用于工作、学习还是创意项目,我们都测试了这款 32 英寸的智能设备到底有多出色,是否符合其全能型多面手的定位。Sebastian Bade, 👁 Sebastian Bade (translated by DeepL / Ninh Duy) Published 🇺🇸 🇩🇪 ...
结论 - 惠普 OmniStudio X 32 向杂乱电缆宣战
惠普 OmniStudio X 32 是一款功能强大的一体机系统,特别适合创意任务。它采用英特尔酷睿 7 155H 和 NvidiaGeForce RTX 4050 笔记本电脑,可为图像和视频编辑以及人工智能任务提供稳定的性能。其高分辨率 4K 屏幕可清晰显示内容,并拥有较高的色彩空间覆盖率,但在照明方面存在不足。电脑的冷却系统工作高效,将温度控制在极限范围内,并确保背景噪音水平适中。
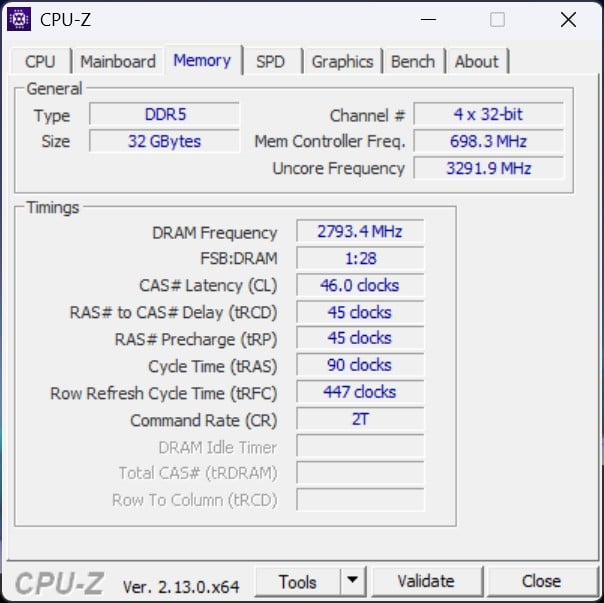
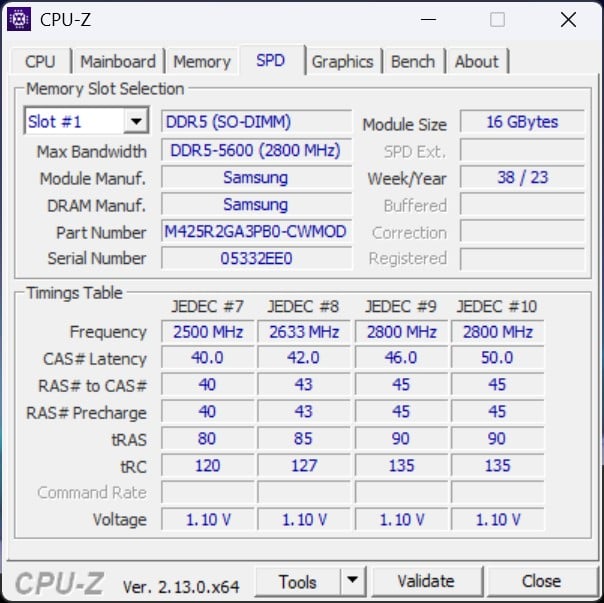
它的存储和内存配置包括快速的 2 TB SSD 和 32 GB DDR5 内存,足以满足需求,但在升级选项方面却受到了严重限制。它的性能只能满足部分游戏需求,因为 NvidiaGeForce RTX 4050 笔记本电脑很快就达到了极限。缺少 144 Hz 面板,这对某些用户来说可能是个不利因素。总之,OmniStudio X 32 提供了一个经过深思熟虑的整体方案,尤其对专业创作人员来说是一个有趣的选择,并能保持工作空间的整洁。
Pros
Cons

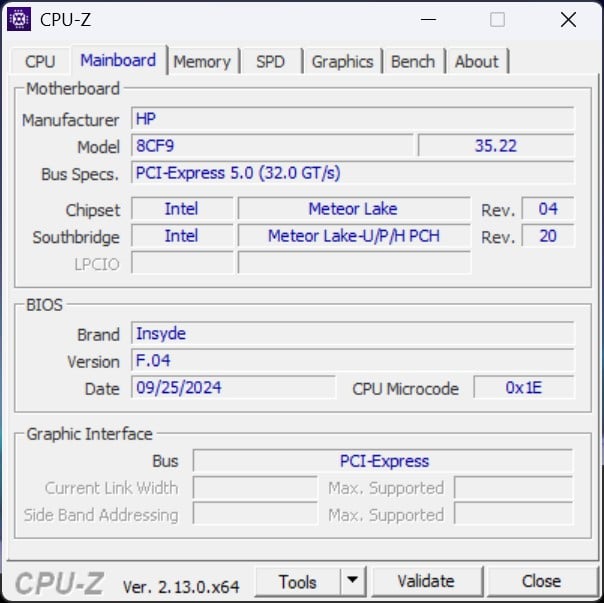
惠普的 OmniStudio-X 系列一体机将笔记本电脑硬件与大显示屏结合在一起。其节俭的组件可为各种应用提供足够的性能。惠普提供 27 英寸和 32 英寸两种机型。配备英特尔酷睿 Ultra 5 处理器、16 GB 内存和 512 GB 固态硬盘的 27 英寸机型价格约为 1100 美元,而配备 32 GB 内存、2 TB 固态硬盘和GeForce RTX 4050 笔记本电脑的 32 英寸机型价格约为 2000 美元。
可能的替代品比较
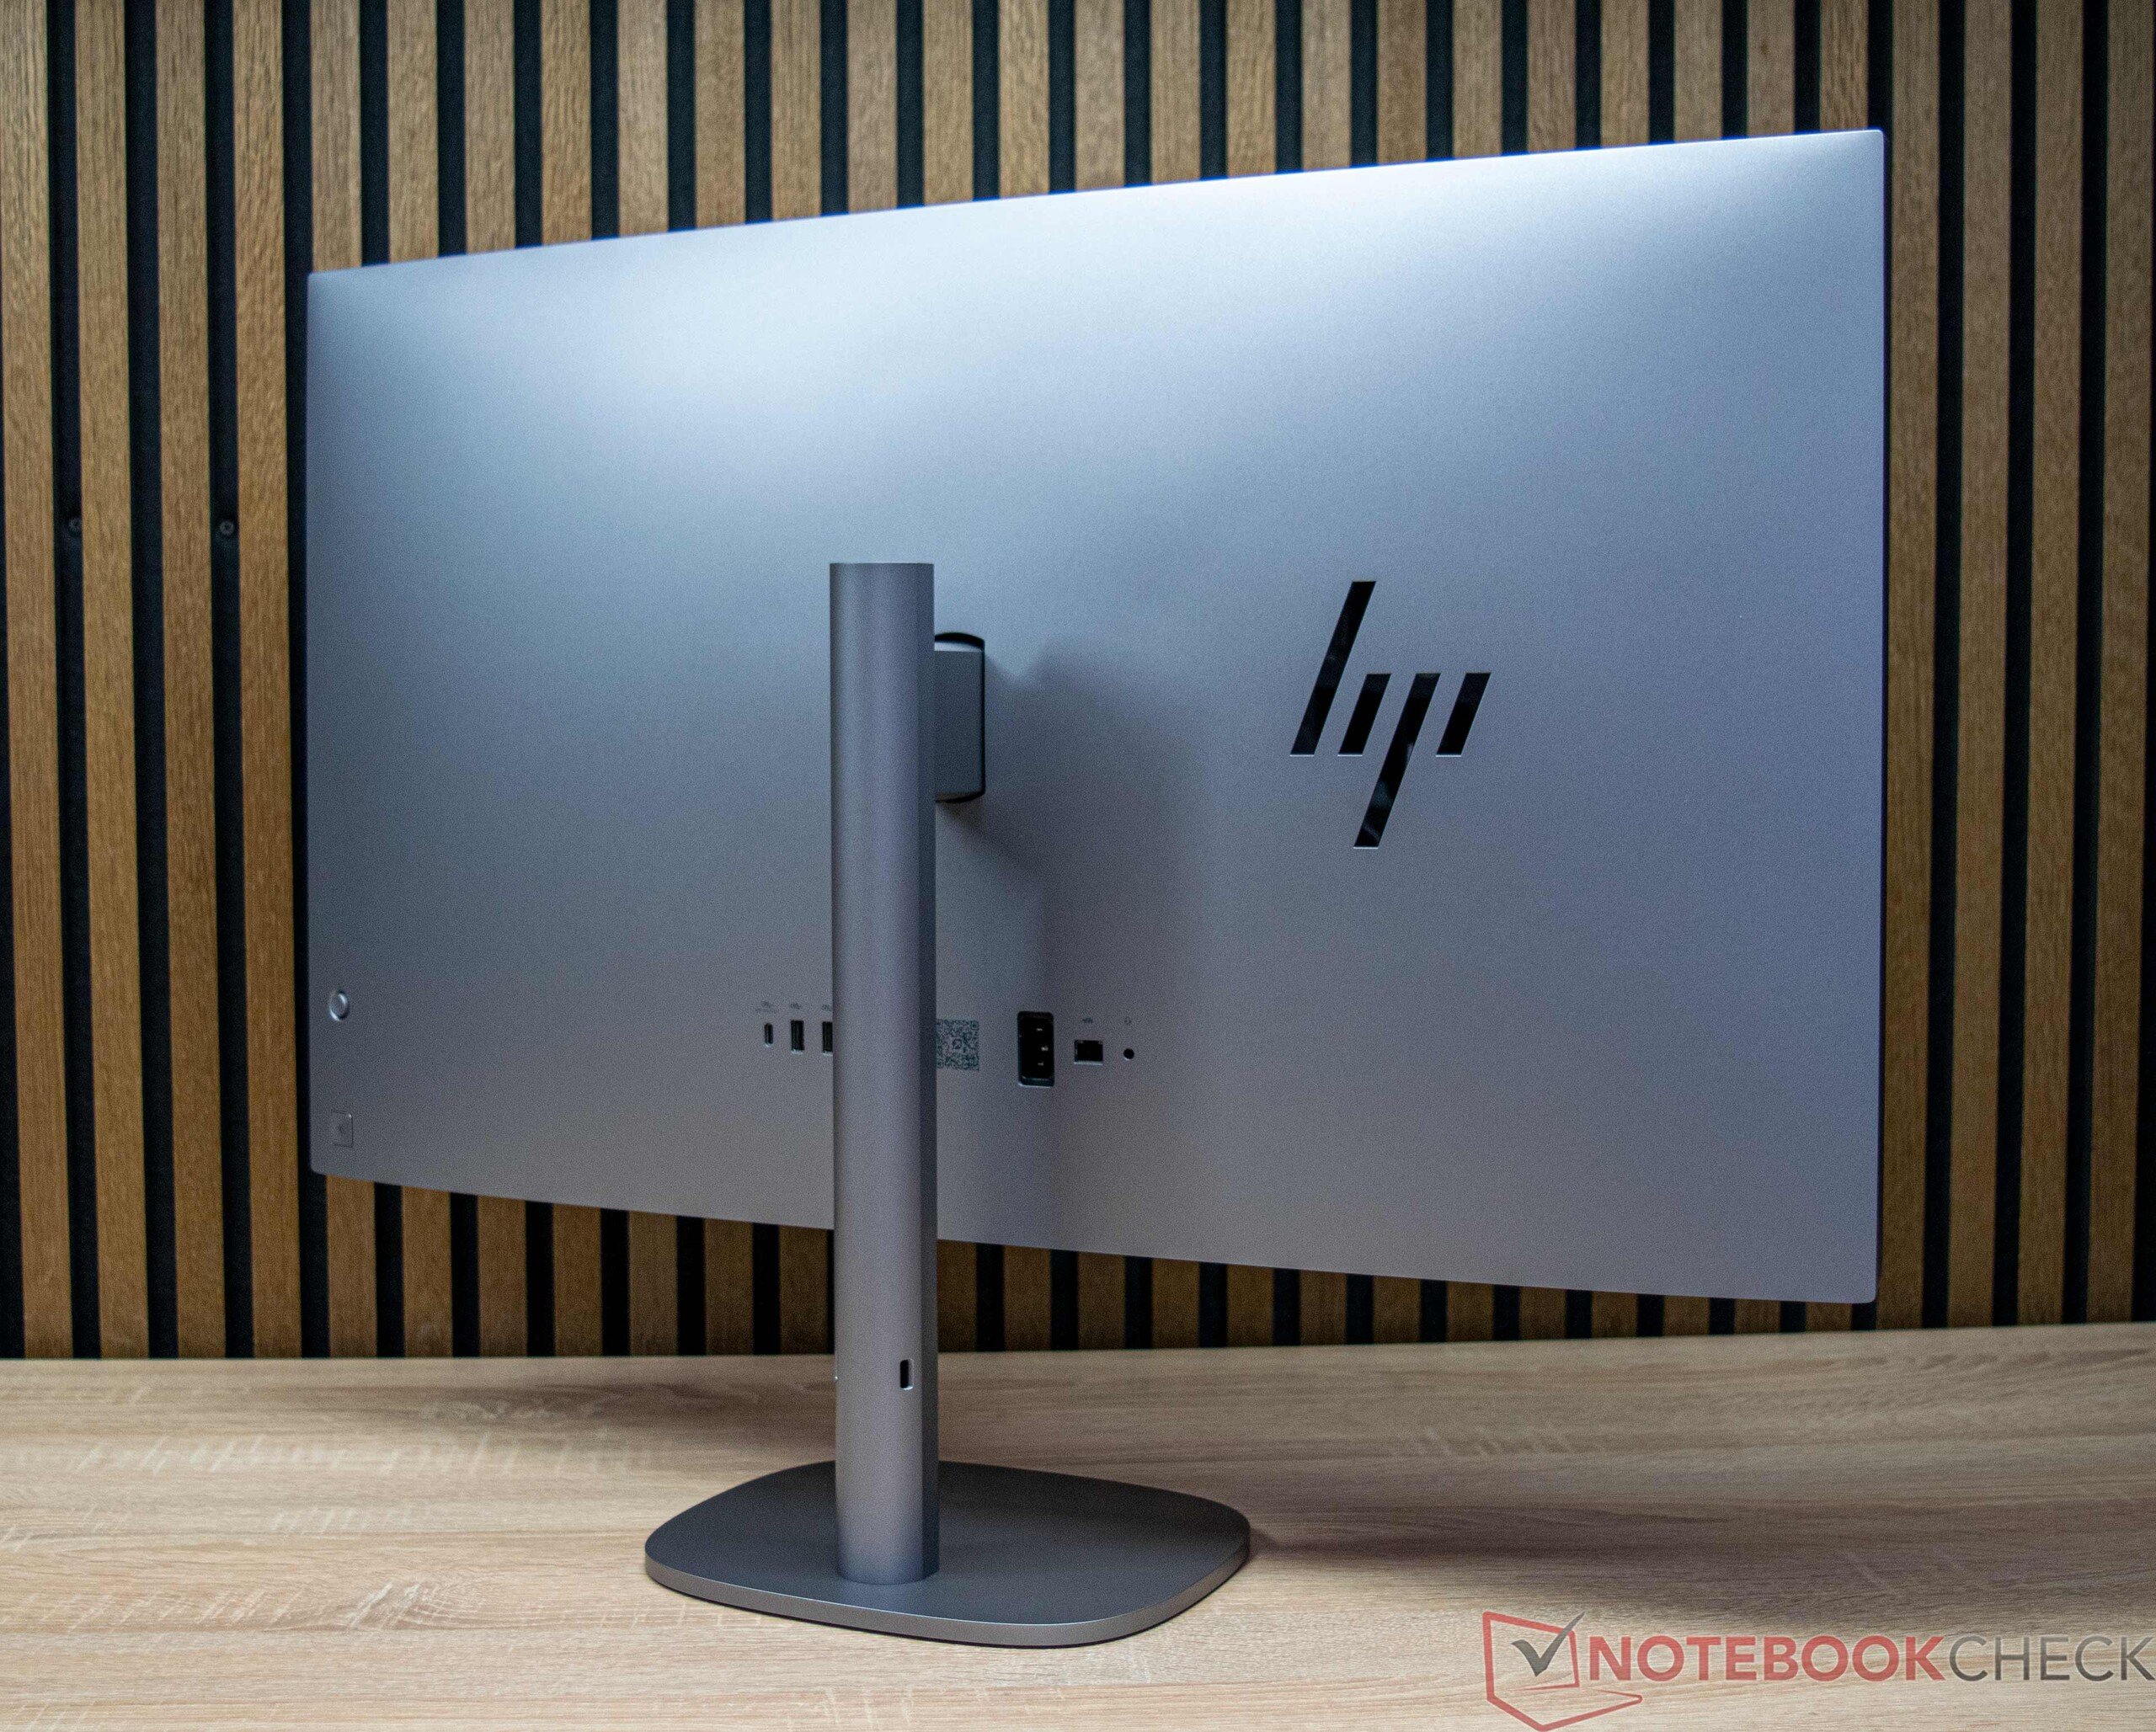
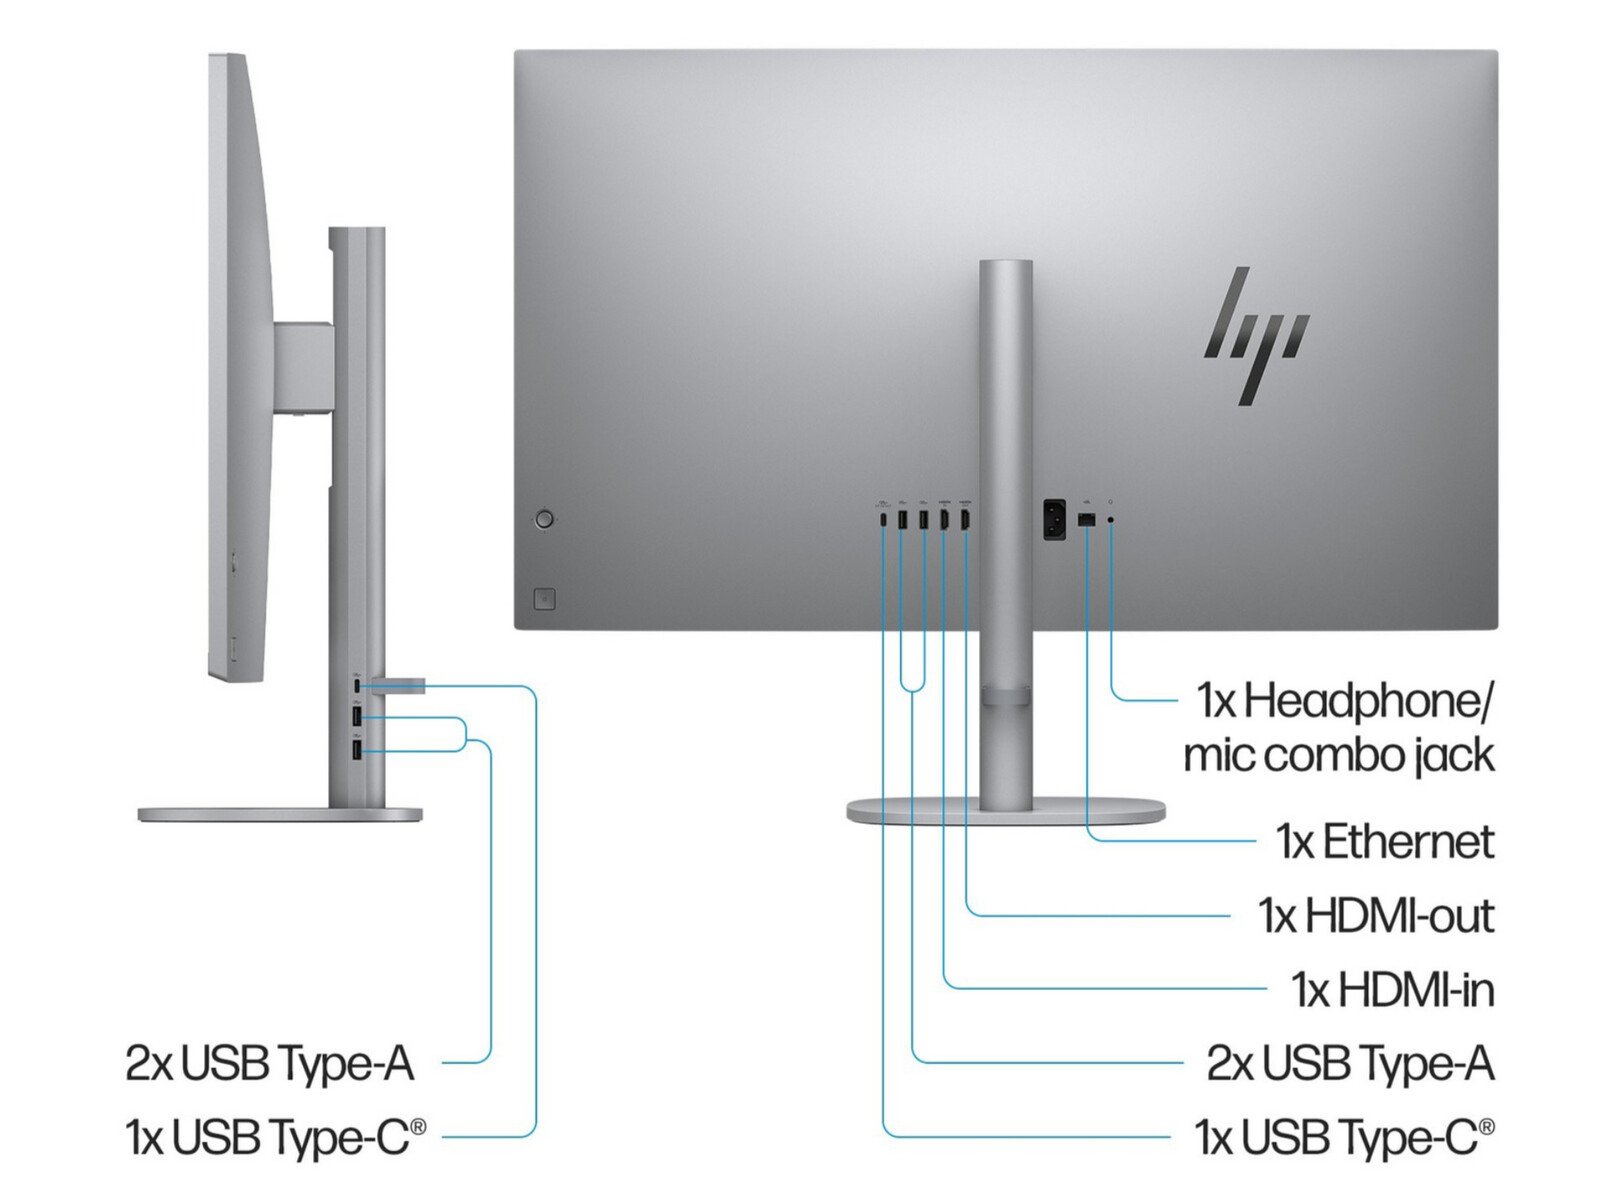
外壳和连接
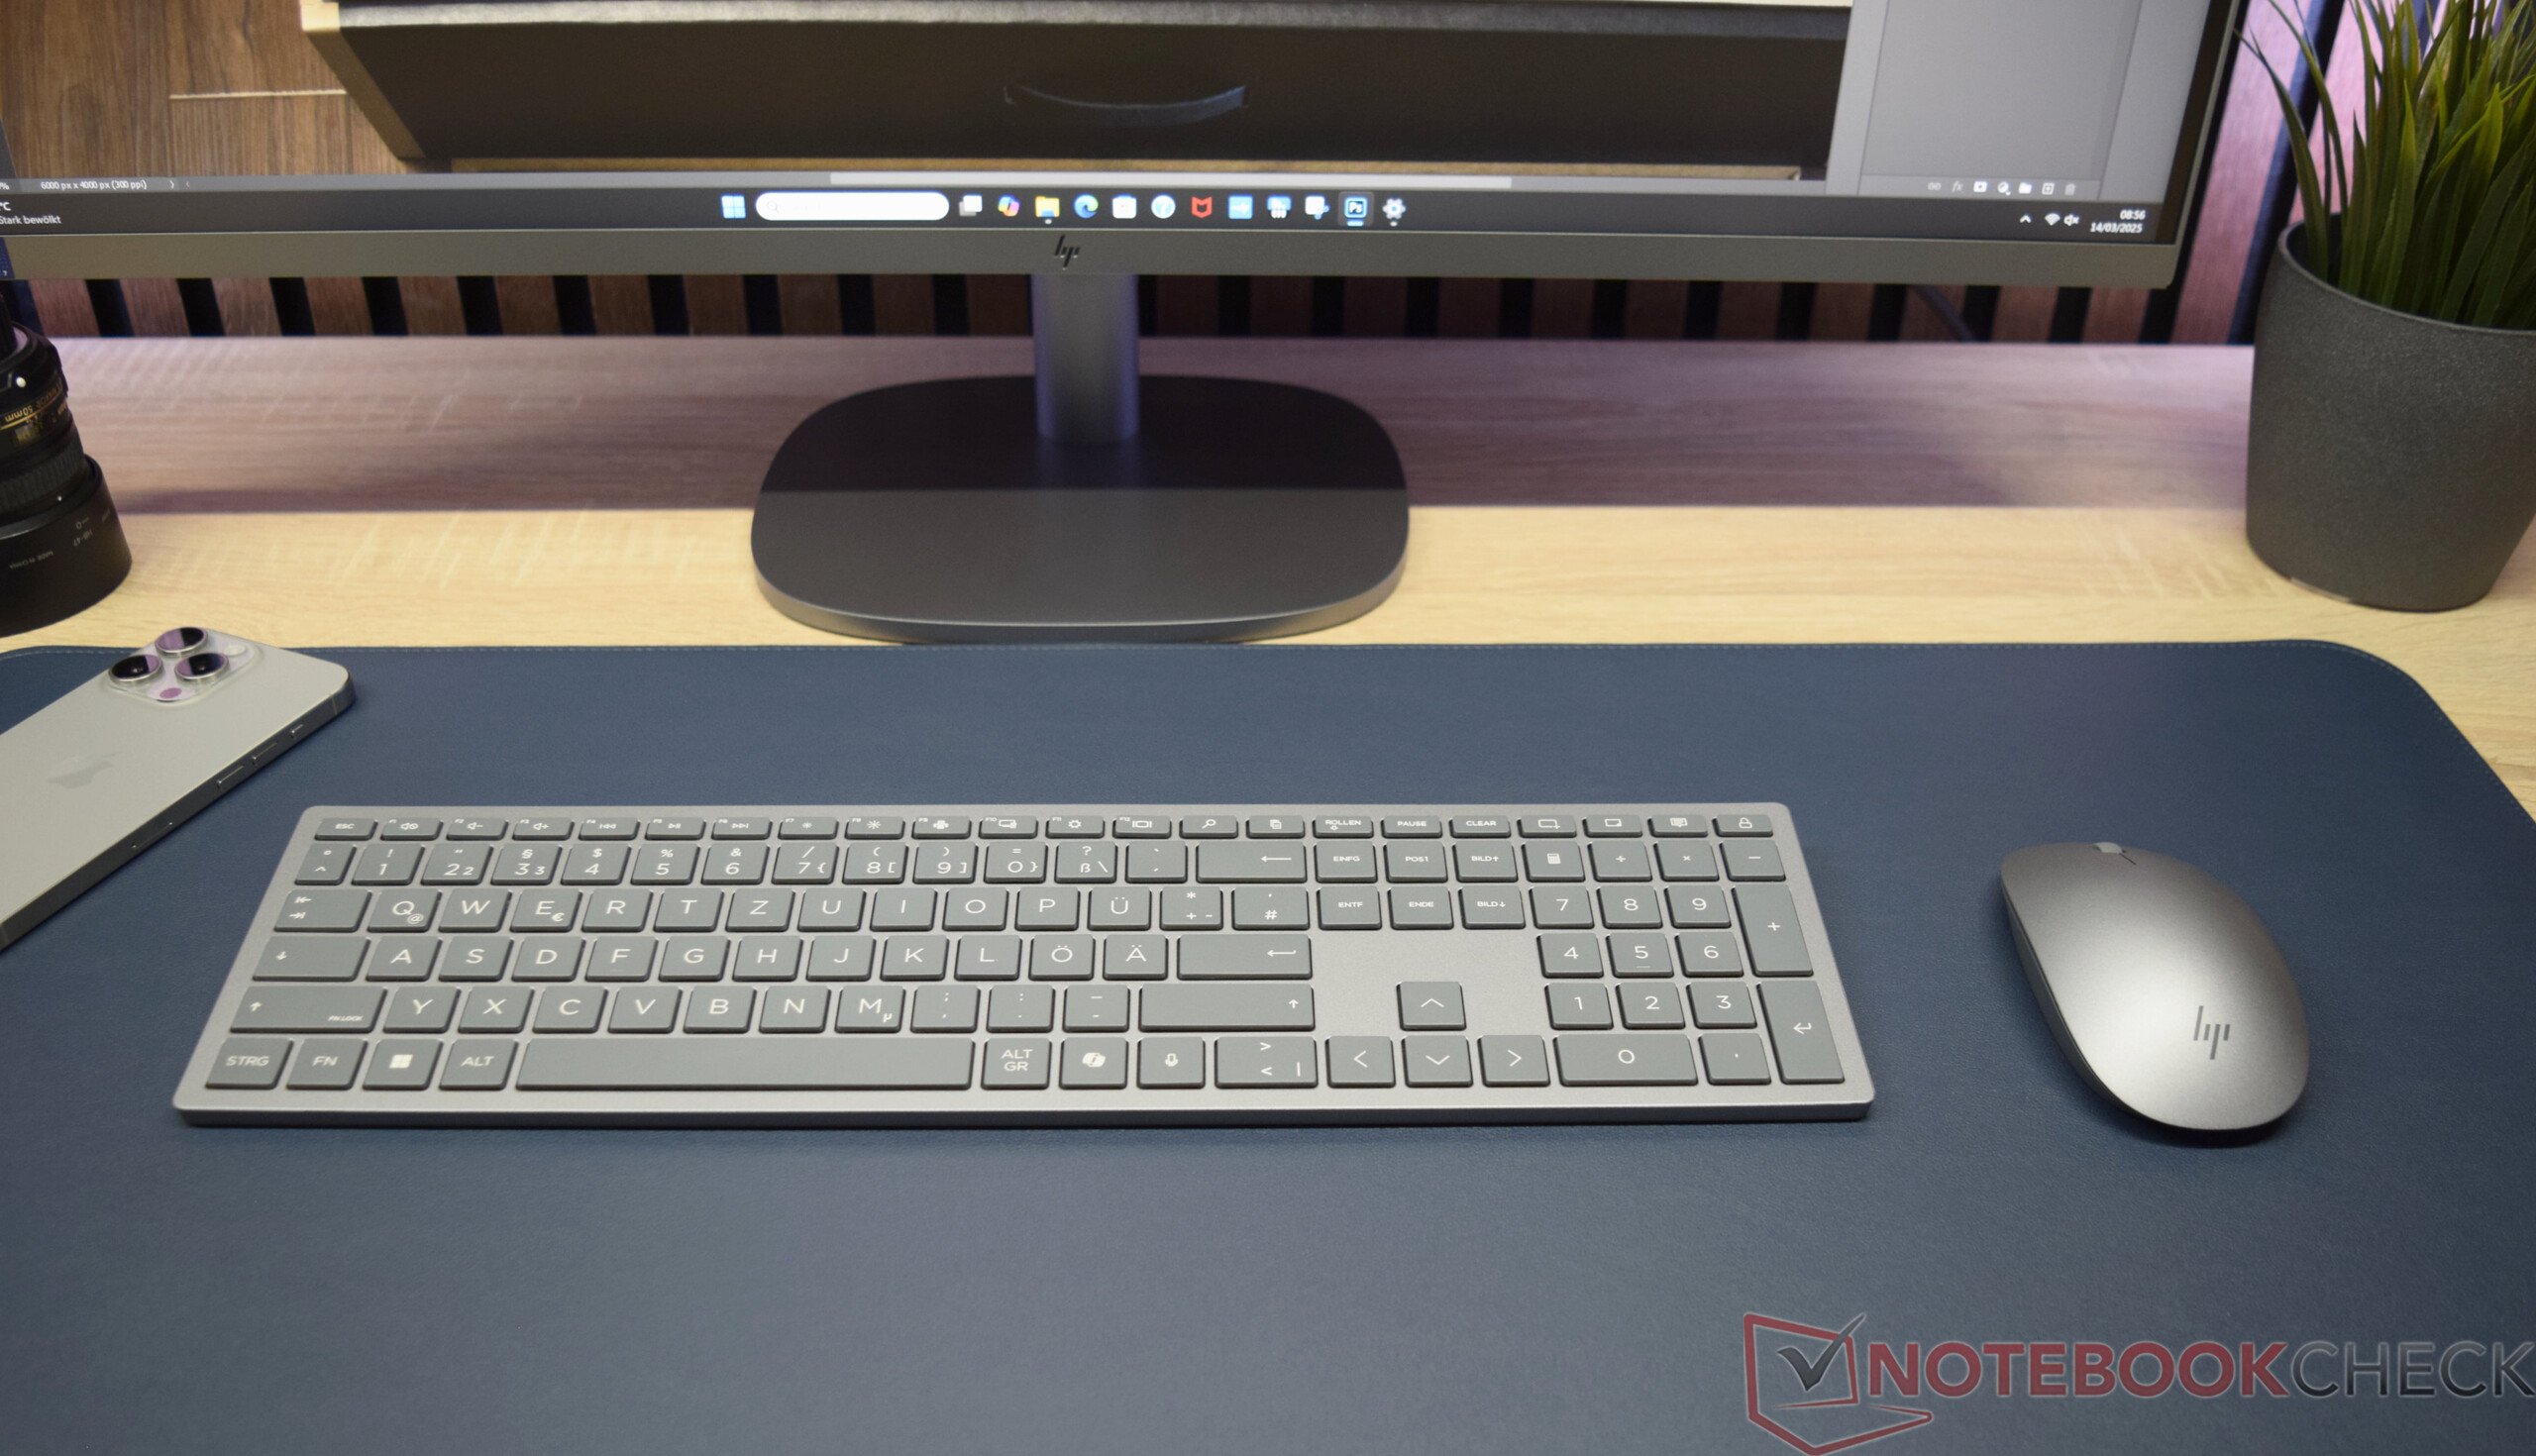
惠普 OmniStudio X 集纤薄设计和强大功能于一身。其优雅的外壳将显示器、扬声器和电脑硬件巧妙地融为一体。附带流星银配色的无线键盘和鼠标。
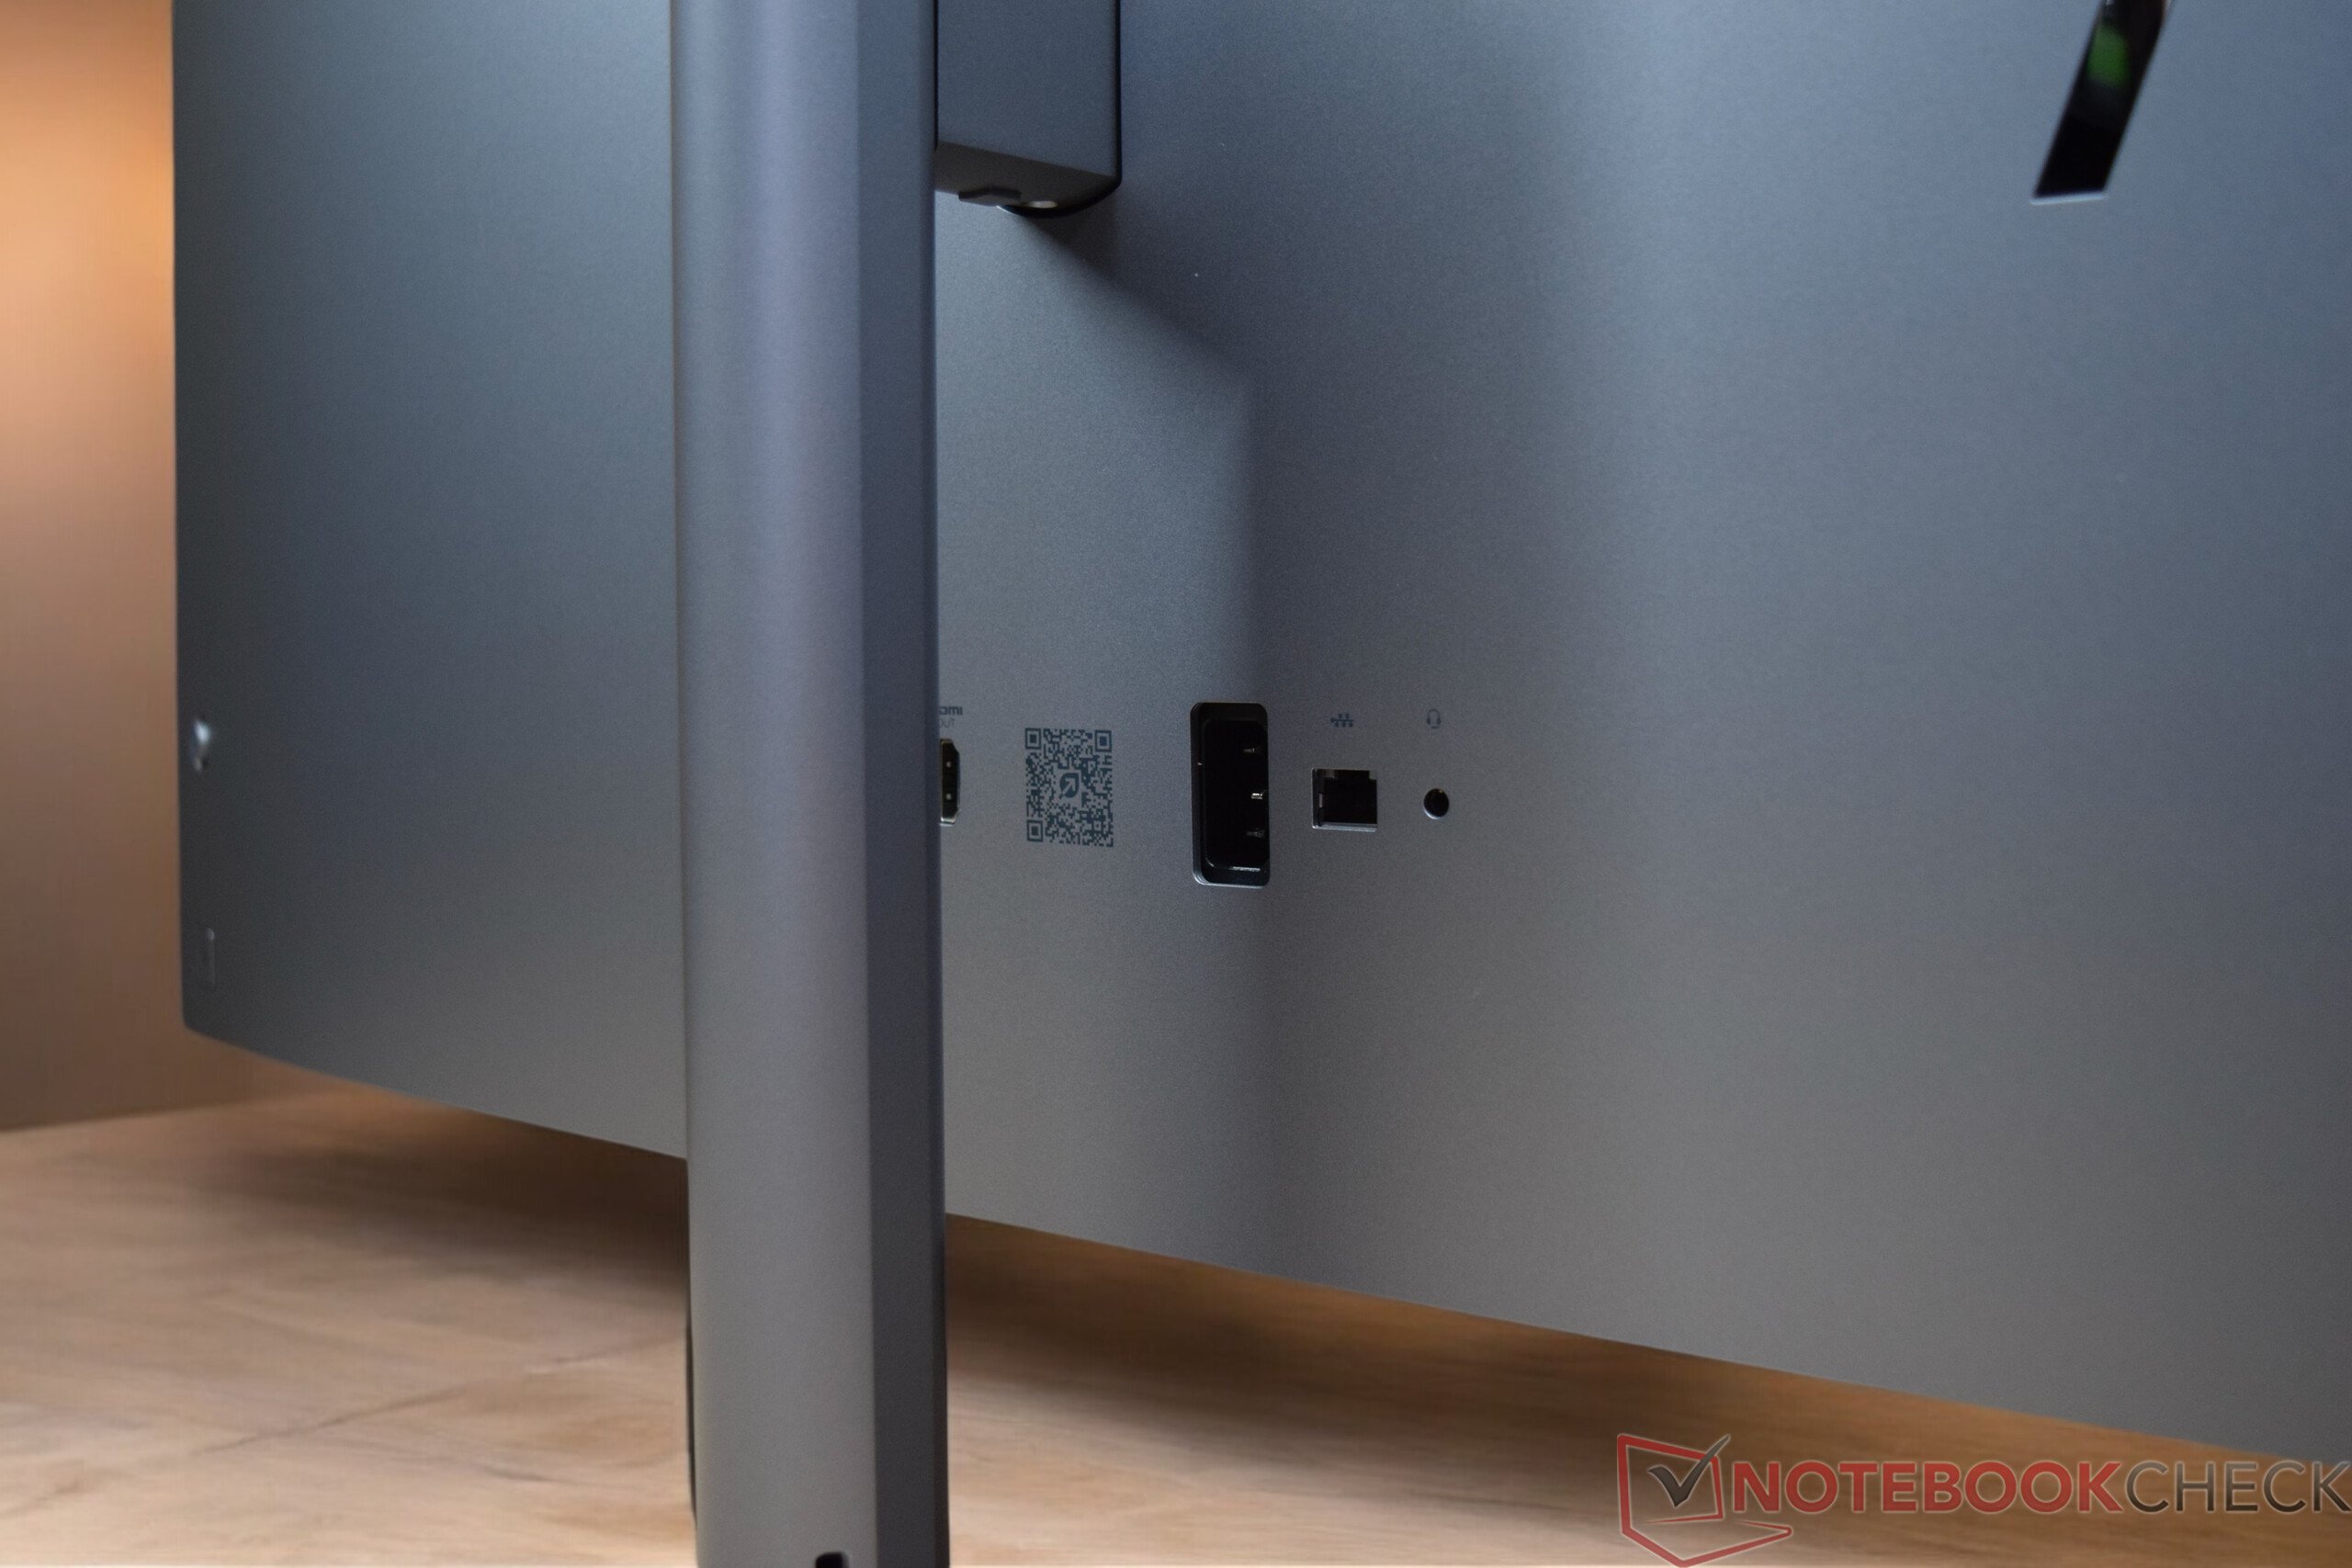
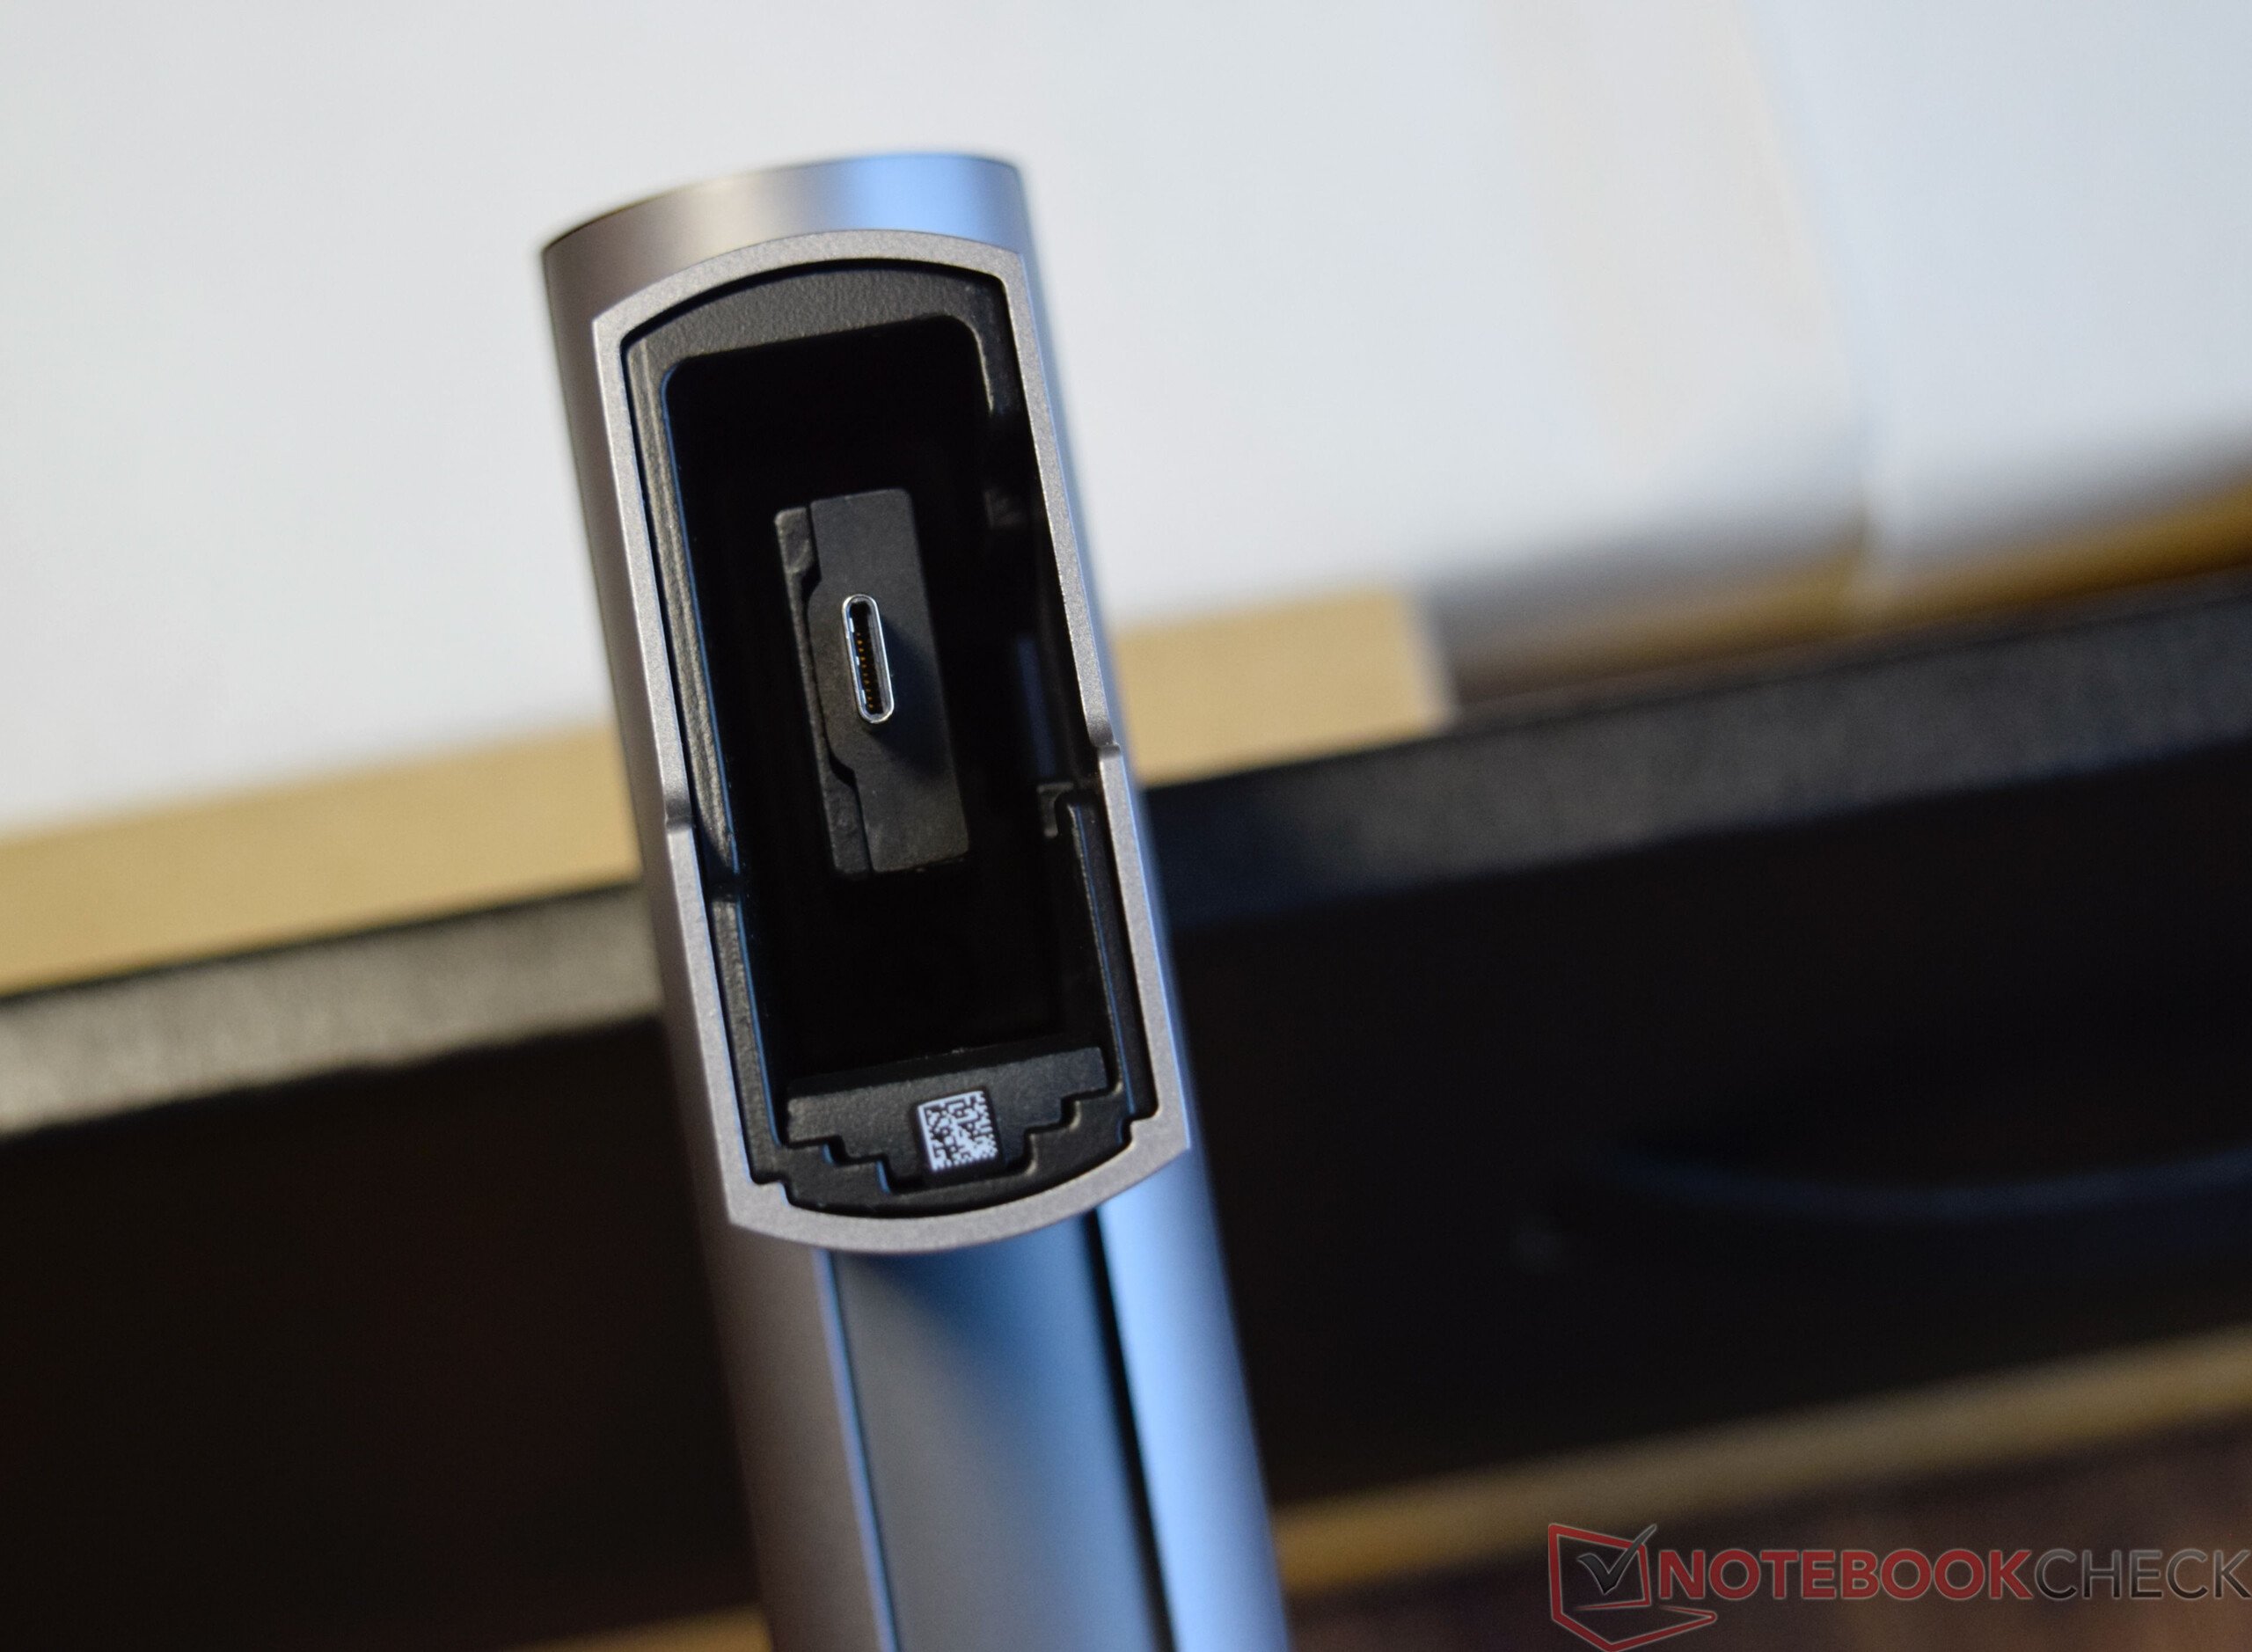
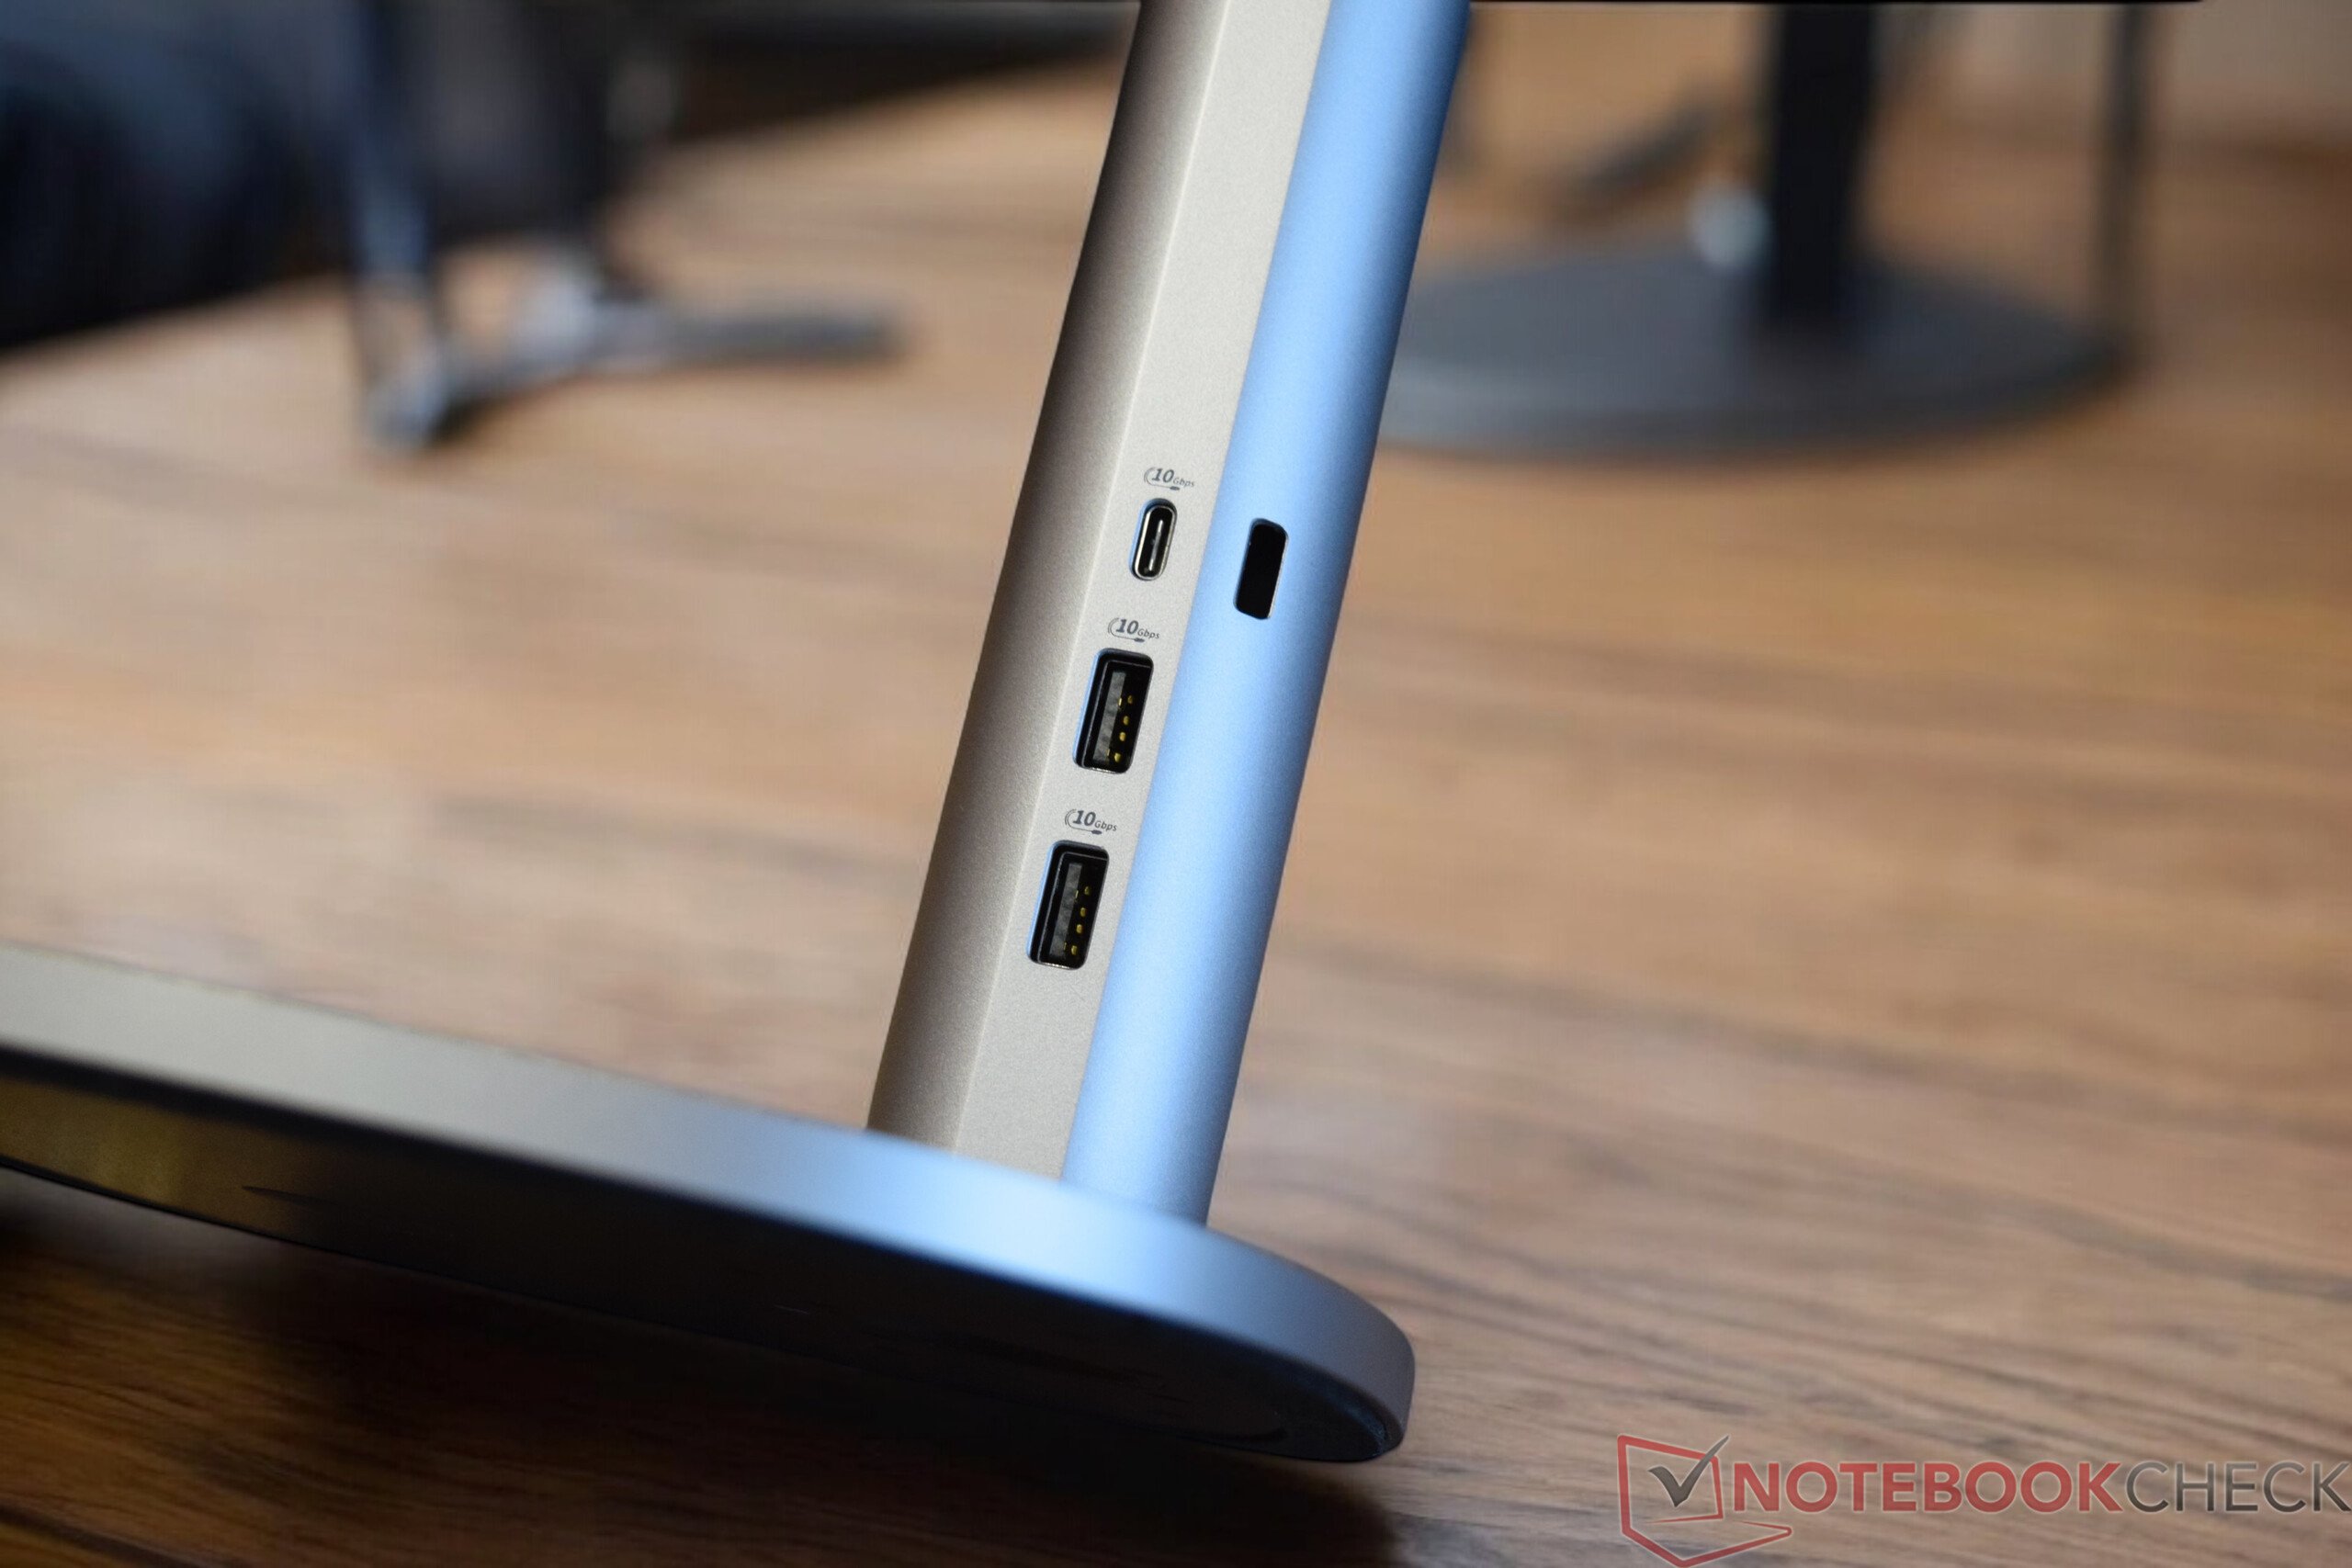
支架上有三个 USB 端口,背面还有三个 USB 端口,所有这些端口都可以轻松接入。两个 HDMI 端口,包括一个 HDMI-in 连接,可用作外接显示器。英特尔 Wi-Fi 7 可用于无线连接,也可使用 2.5 Gbit/s RJ45 连接。有关维护工作,请参阅HP 的支持视频。.
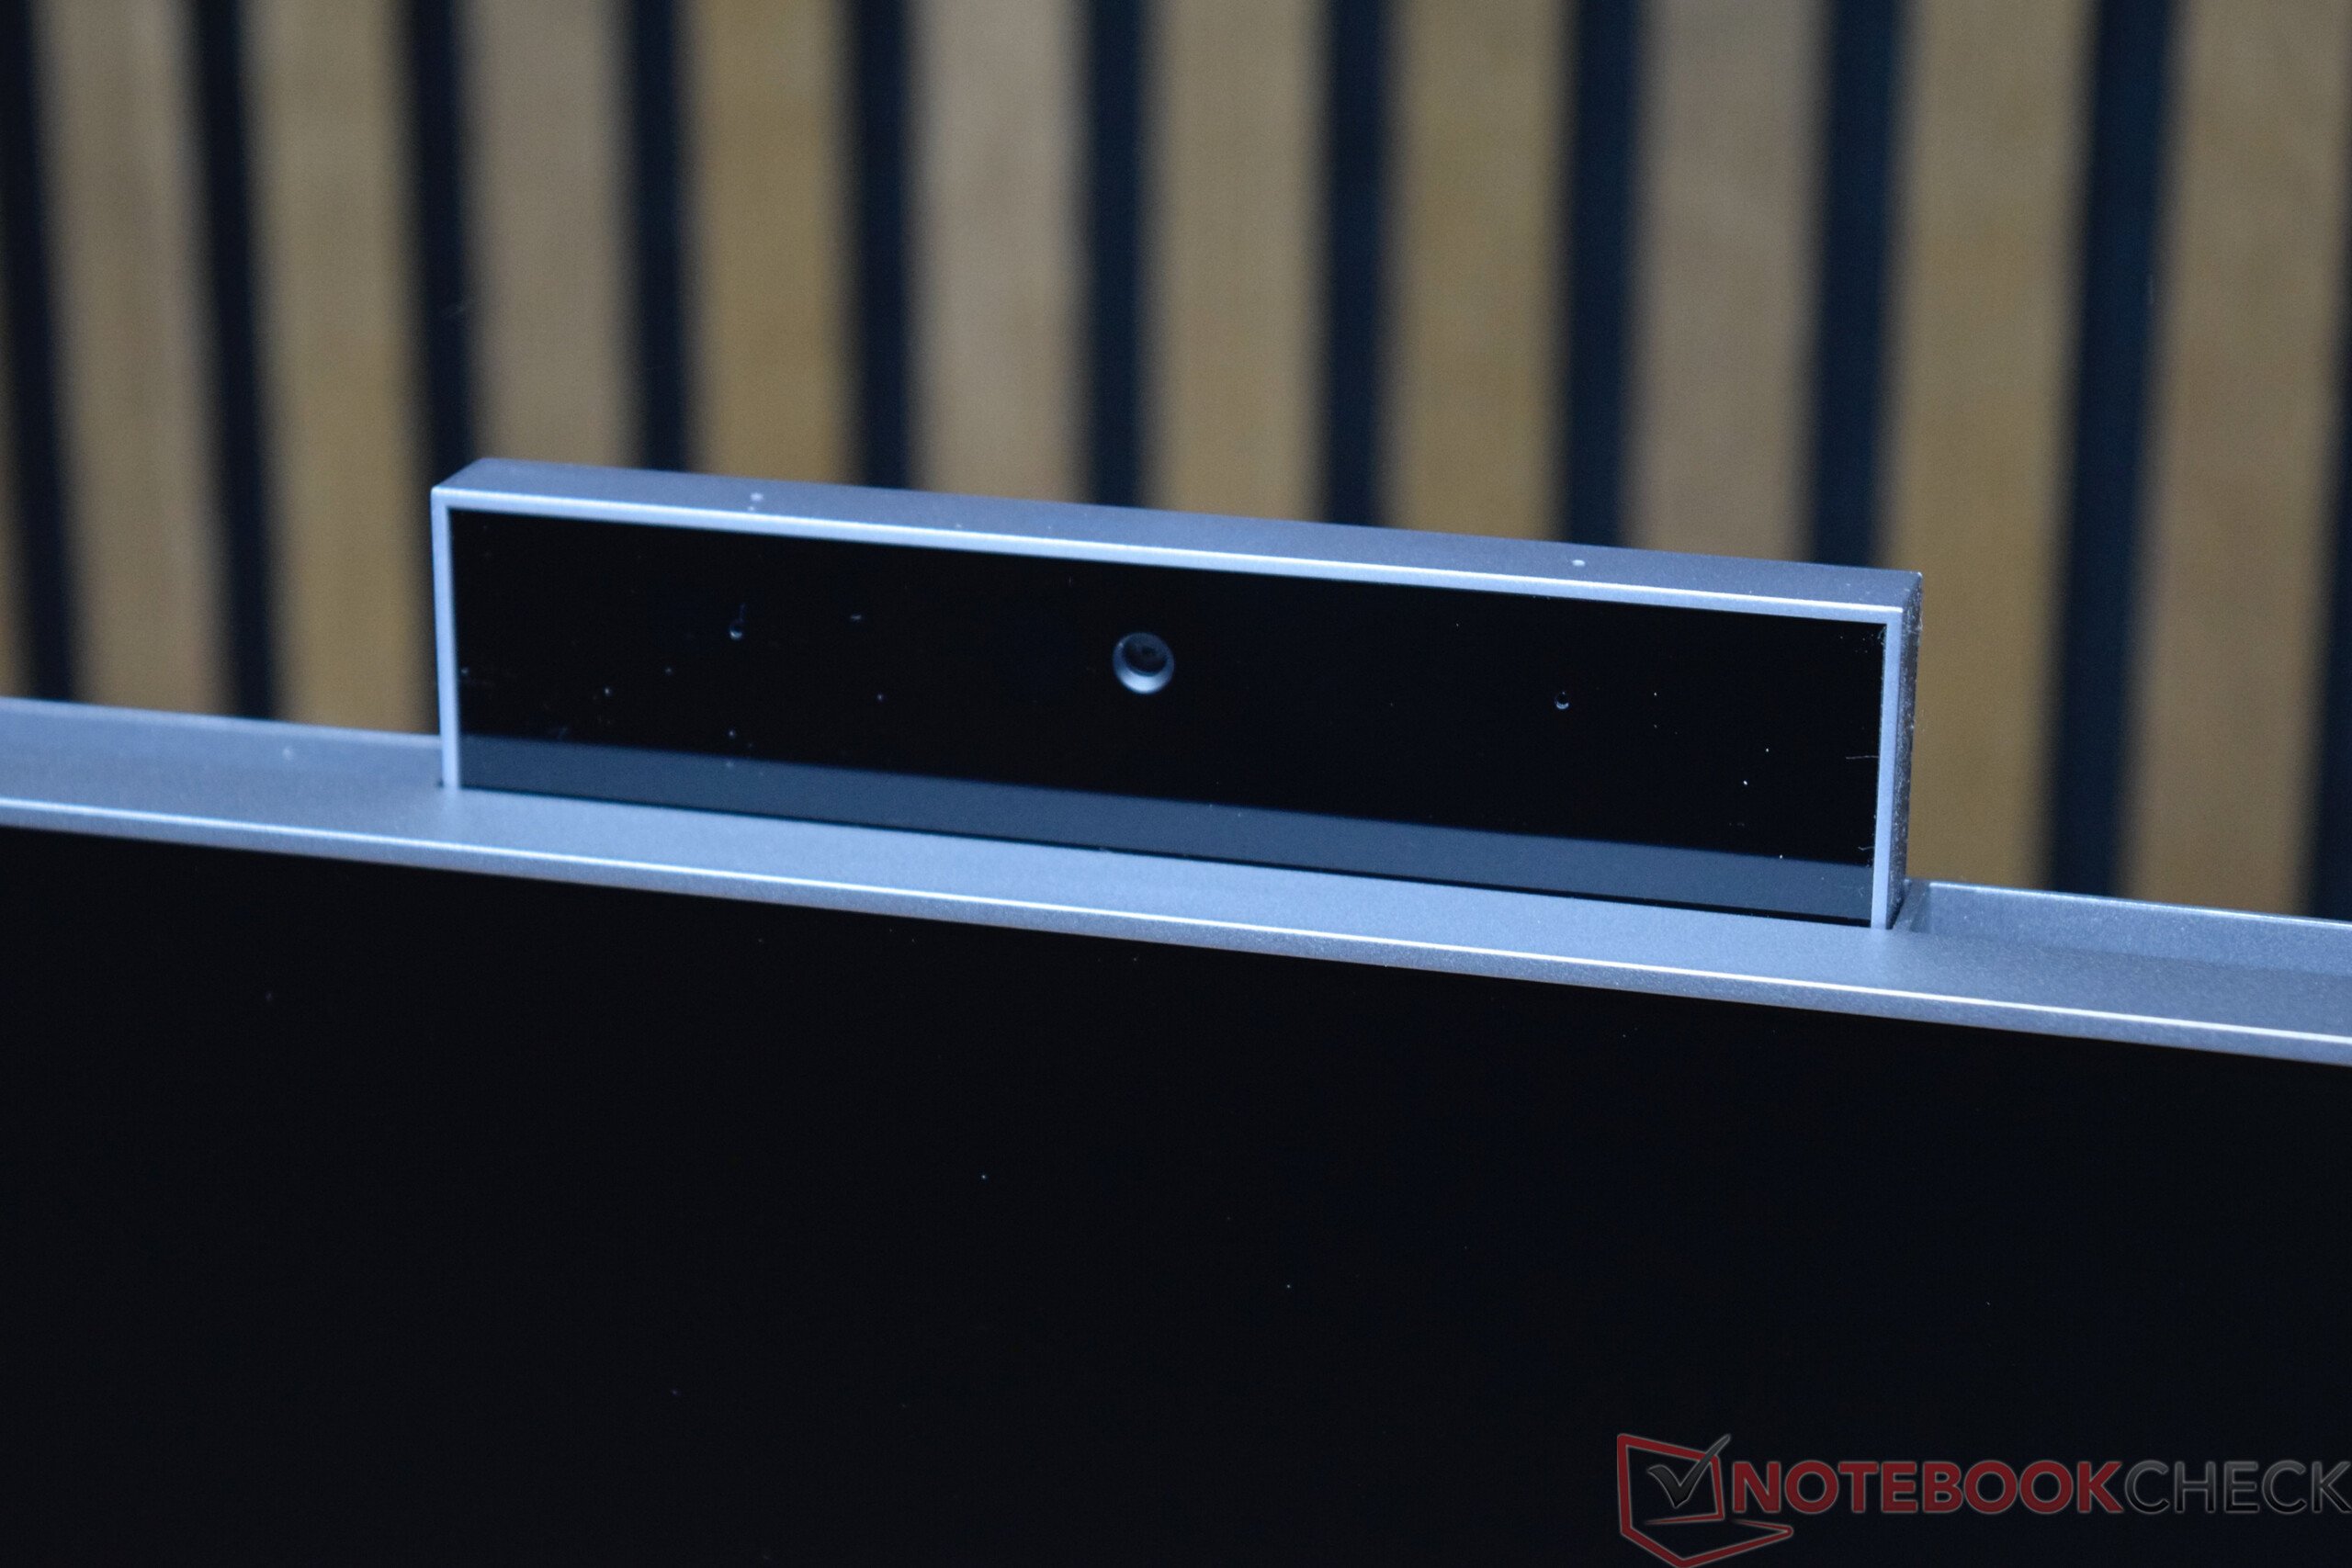
网络摄像头
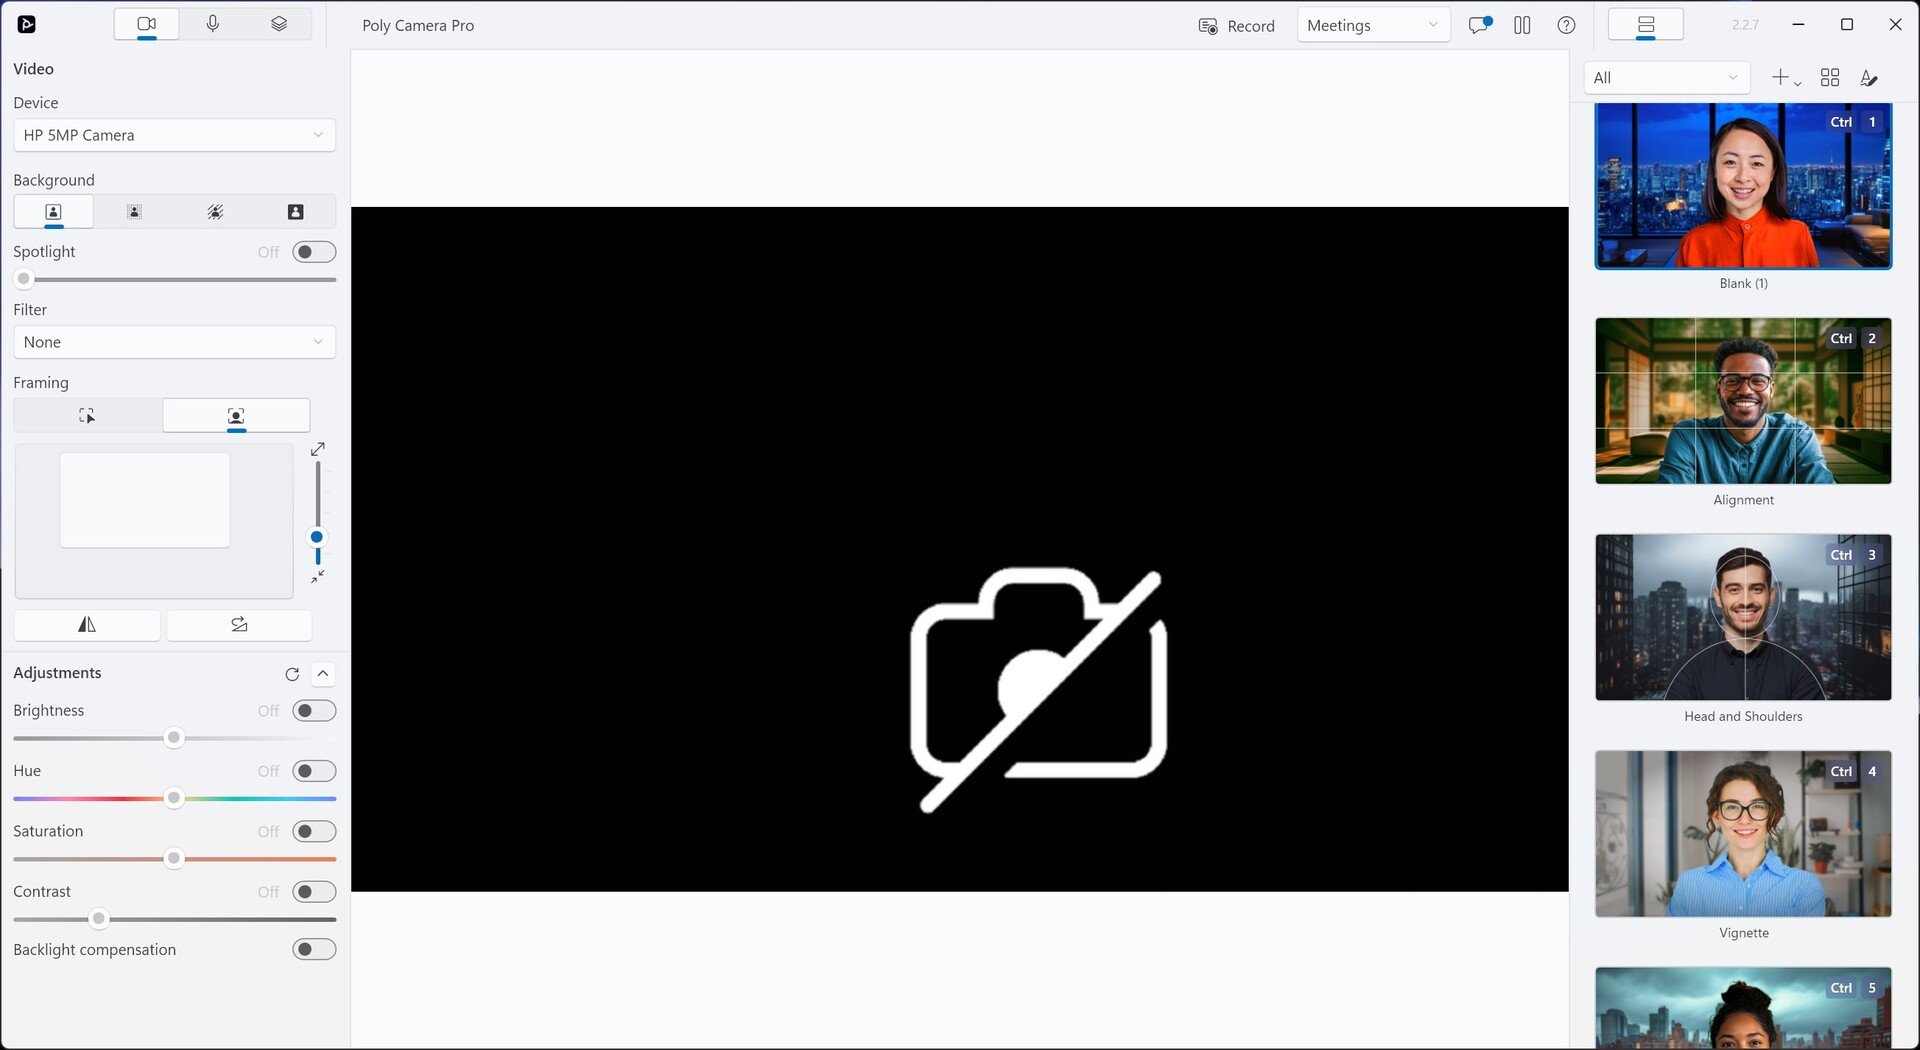
HP OmniStudio X 有一个可伸缩的 500 万像素摄像头,在光线不足的条件下会很快失焦。随附的 Poly Camera Pro 软件可让您使用预定义的配置文件轻松定制摄像头。它还具有模糊滤镜和跟踪模式,可自动保持面部对焦。


可持续性
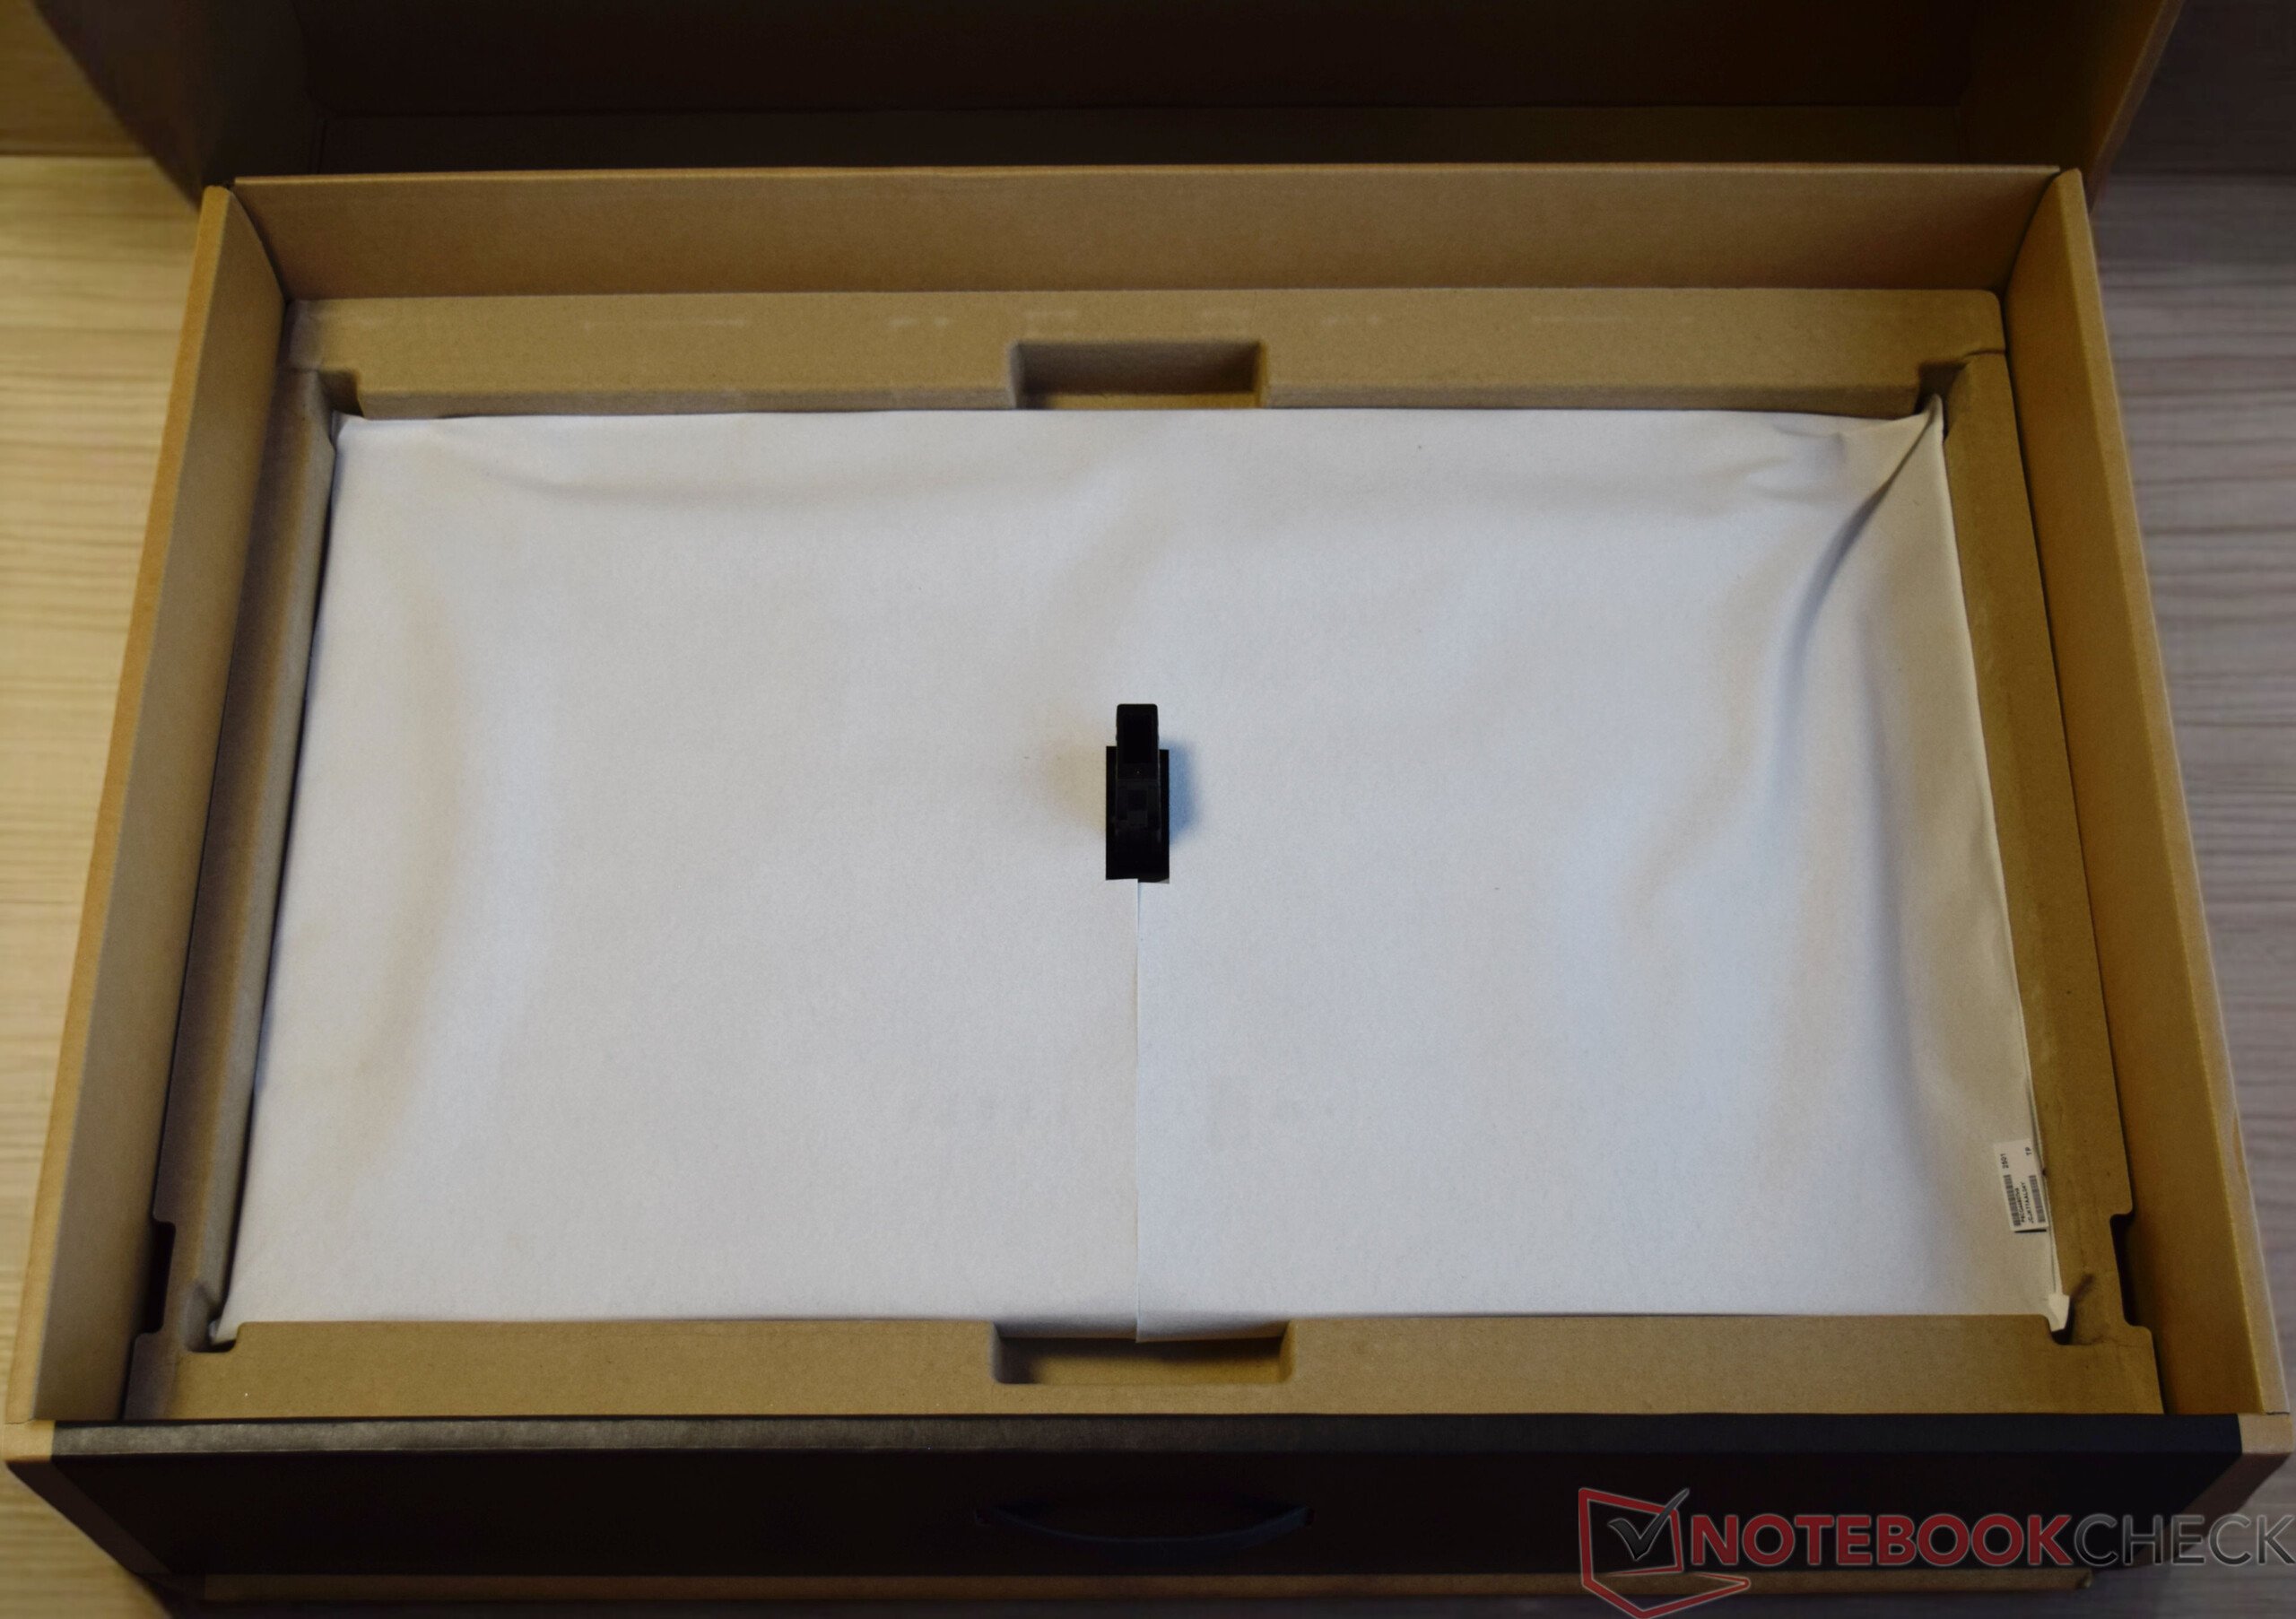
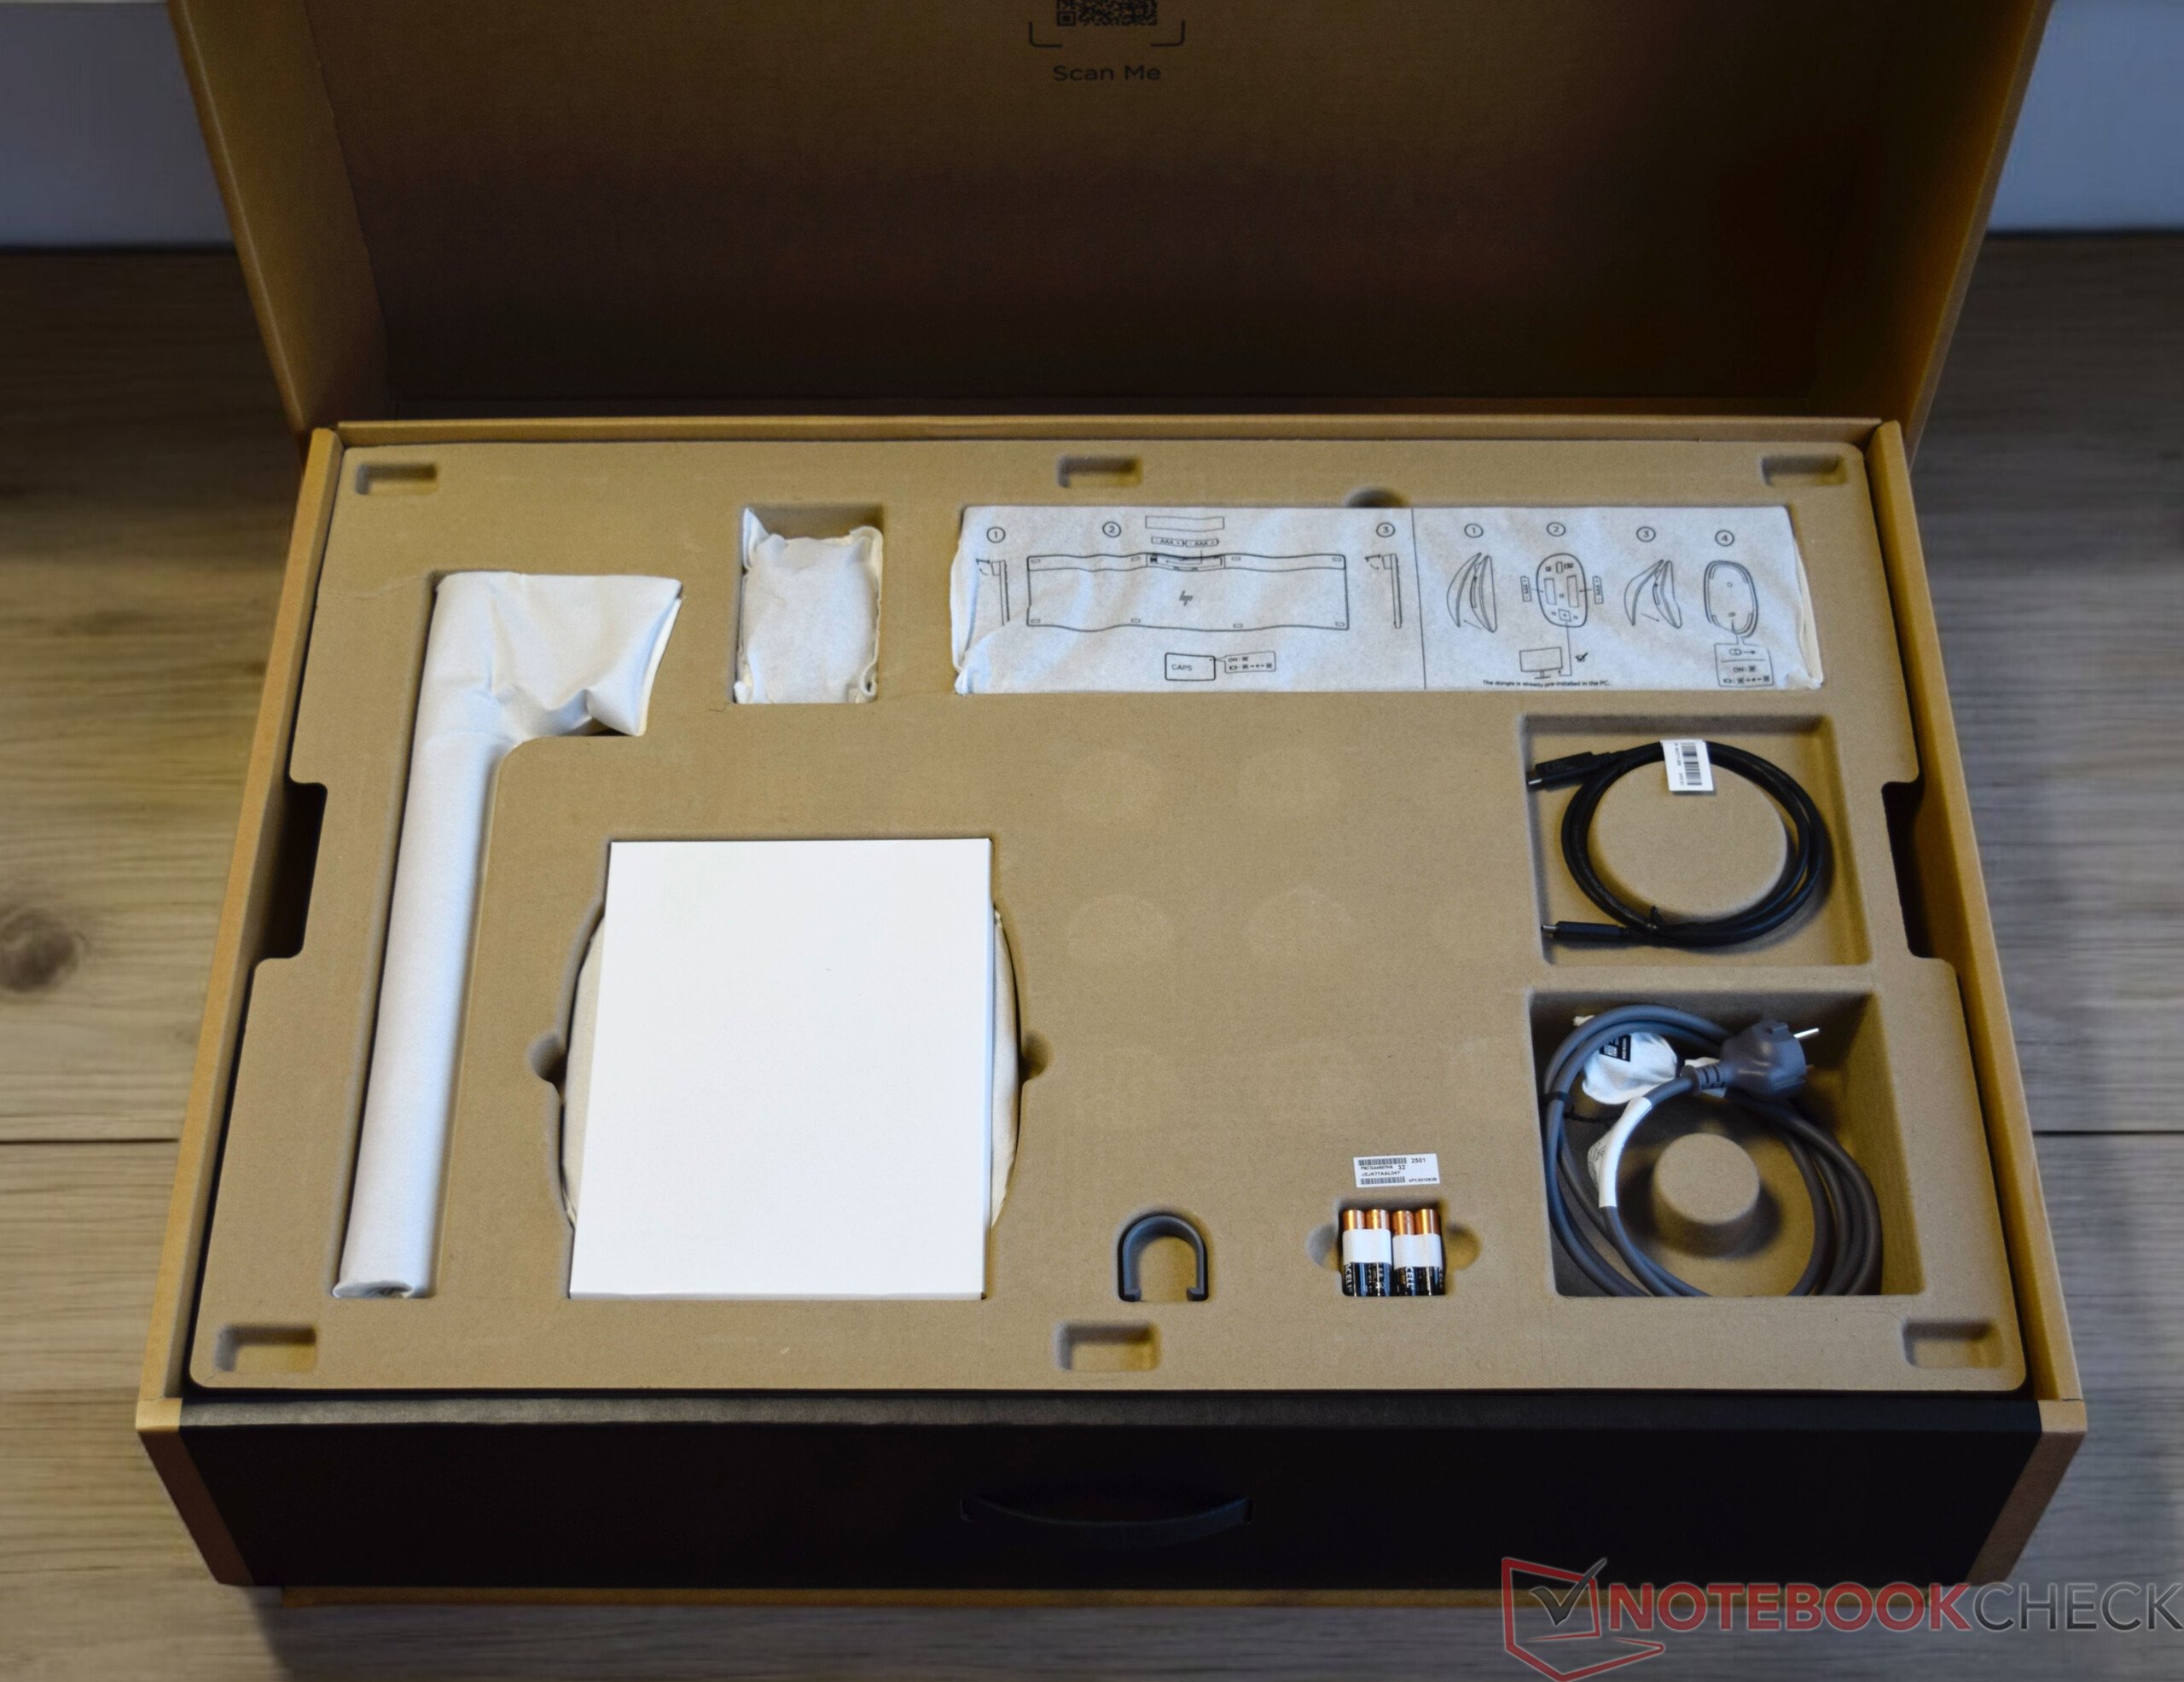
惠普 OmniStudio X 设备符合 EPEAT 和能源之星的要求,并已获得这些认证。惠普还使用海洋塑料(OBP)和回收的消费后塑料,这对环境很有好处。我们还不得不称赞惠普的包装,它完全不使用任何塑料。
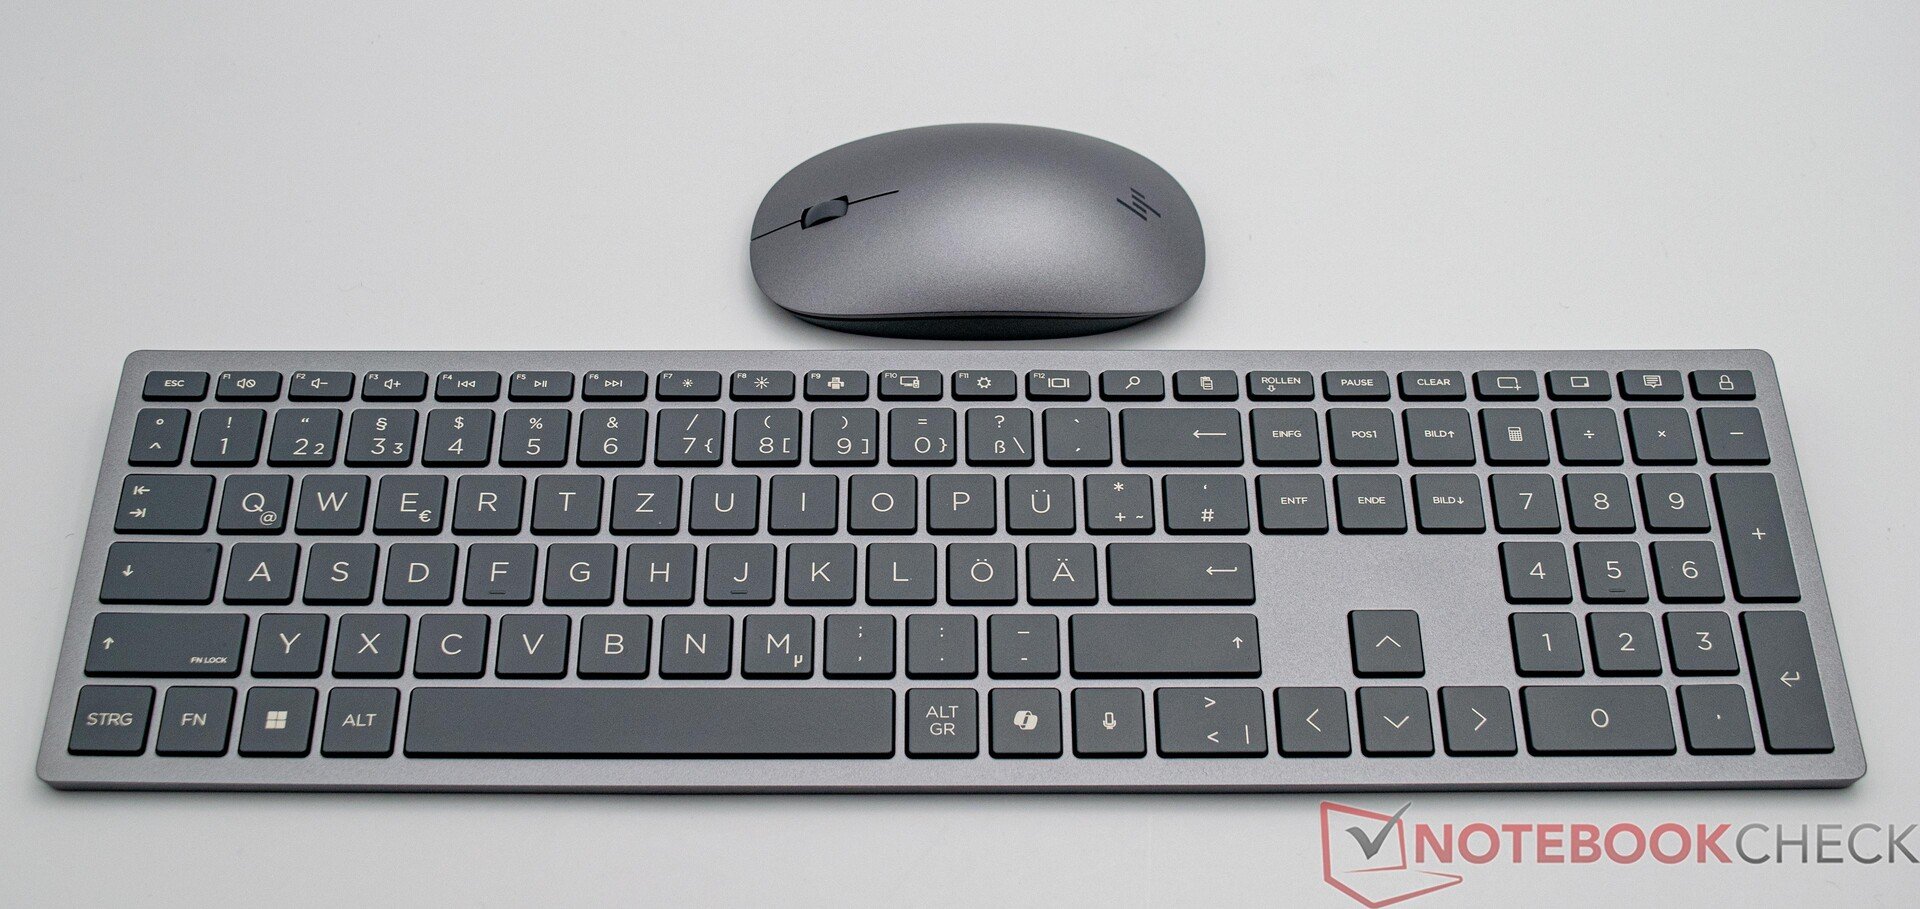
输入设备 - 包括鼠标和键盘
惠普 OmniStudio X 配备了流星银配色的时尚键盘和鼠标组合。两款设备均可无线连接,键盘因其良好的键入手感和数字键盘而得分。鼠标的边缘锋利,不太符合人体工程学。缺少键盘背光也是一个小缺点。
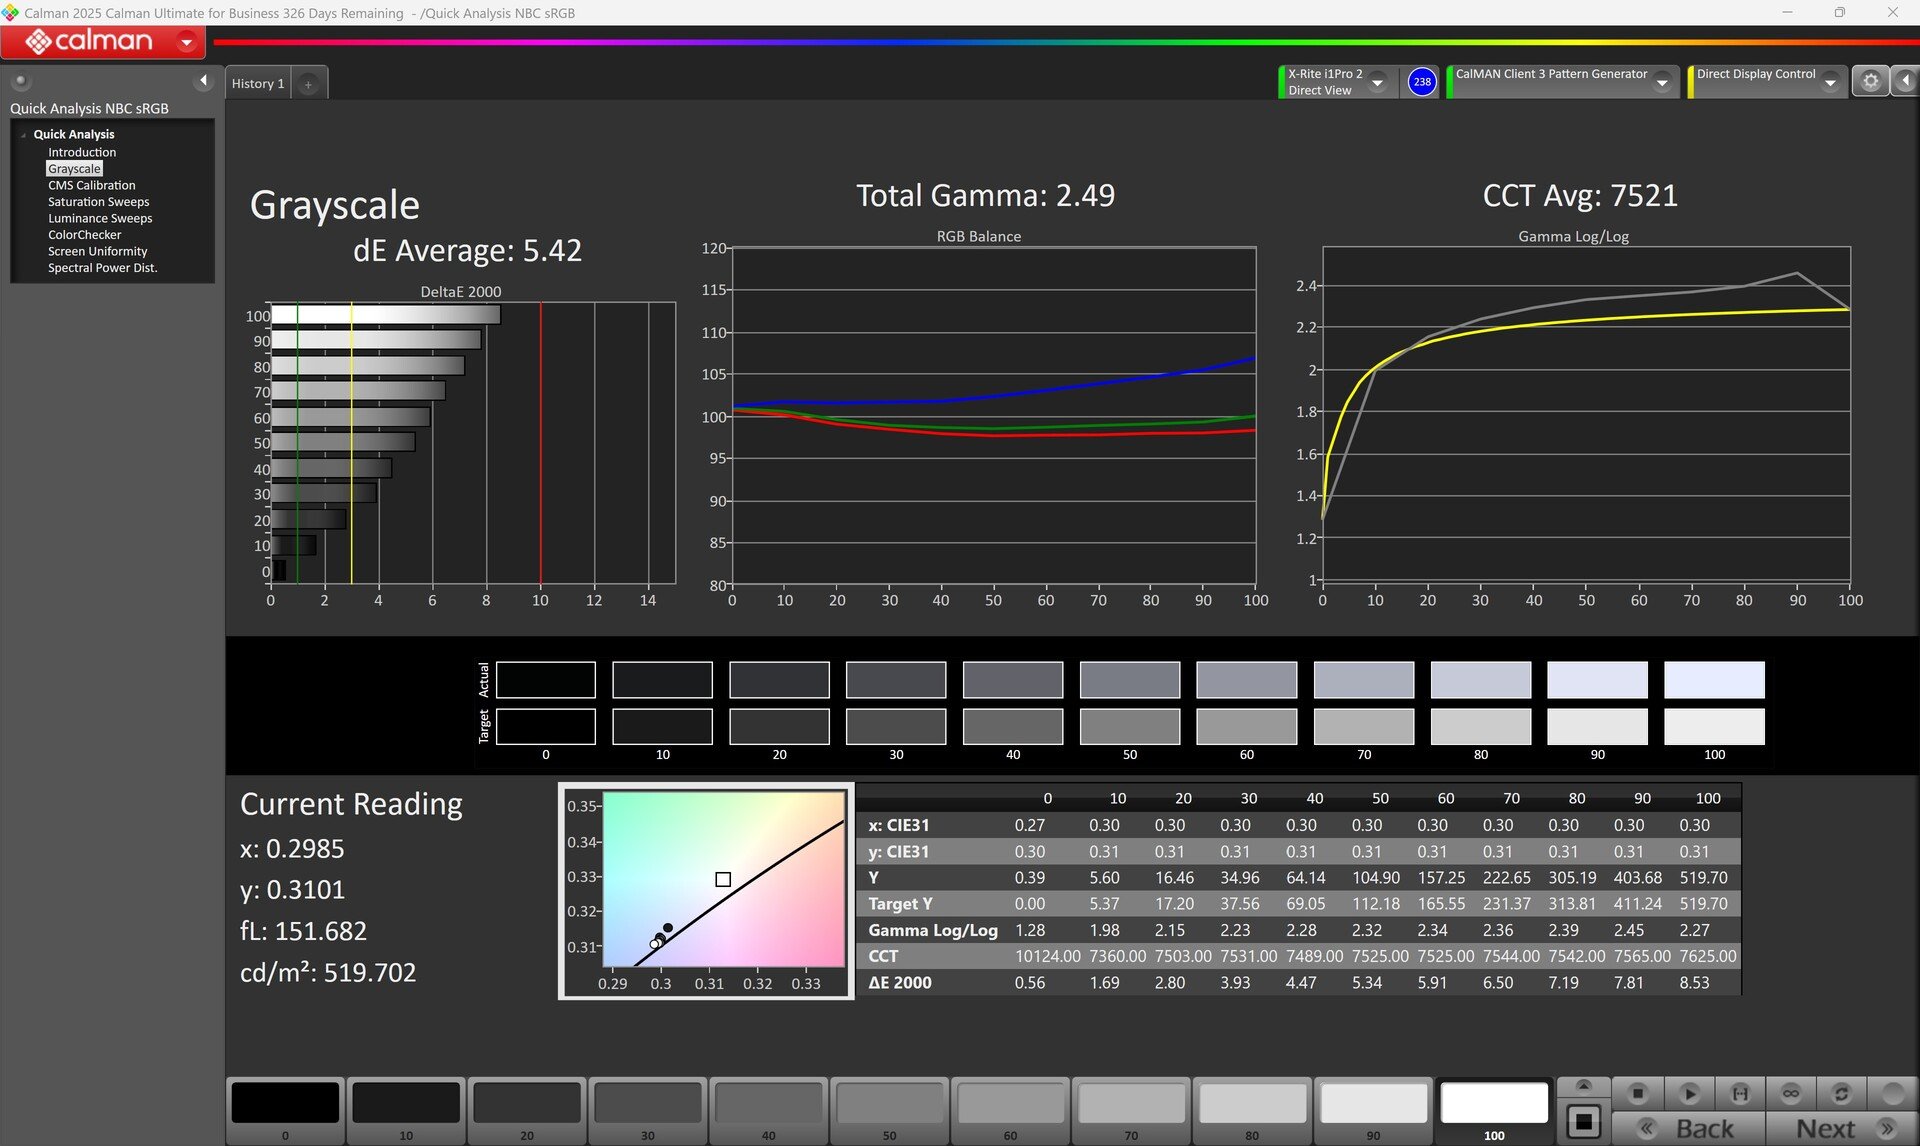
显示屏 - 4K IPS,仅 60 赫兹

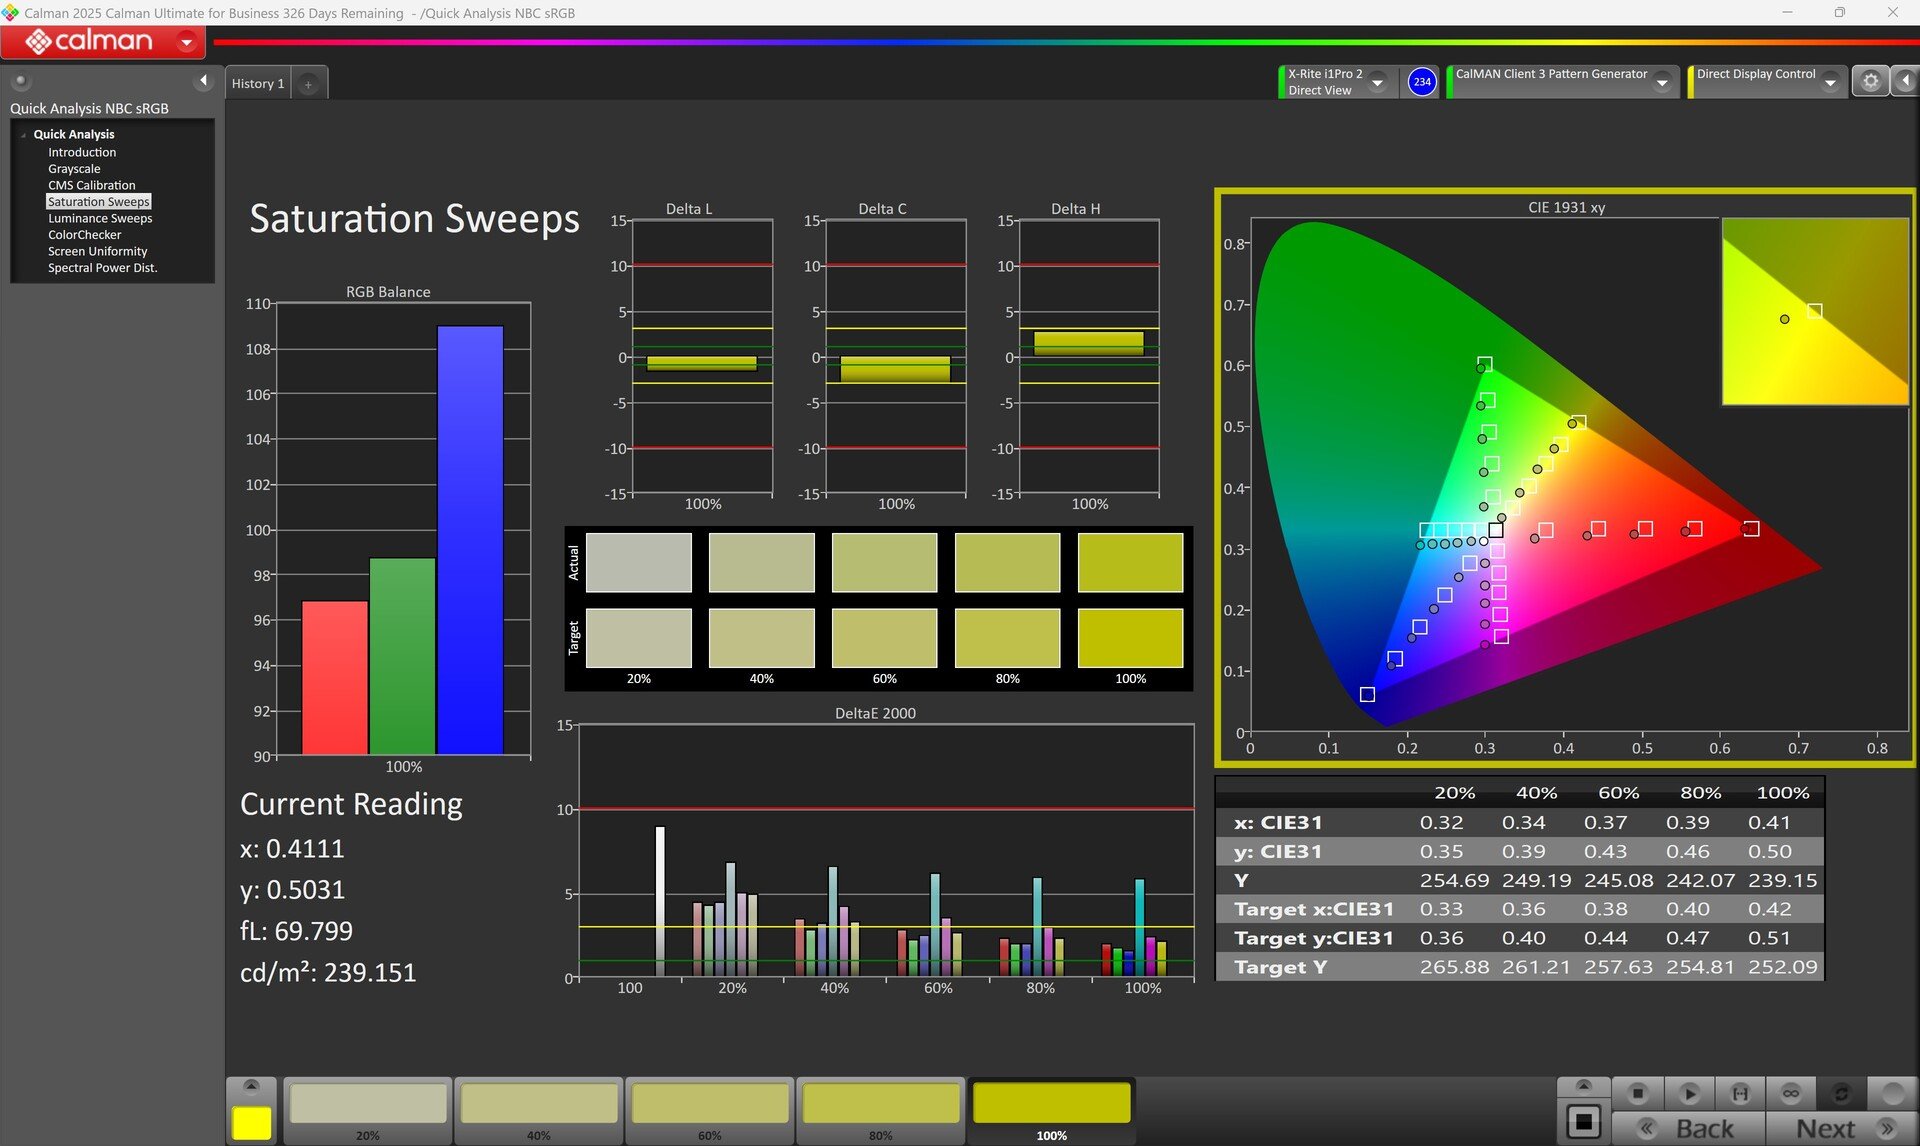
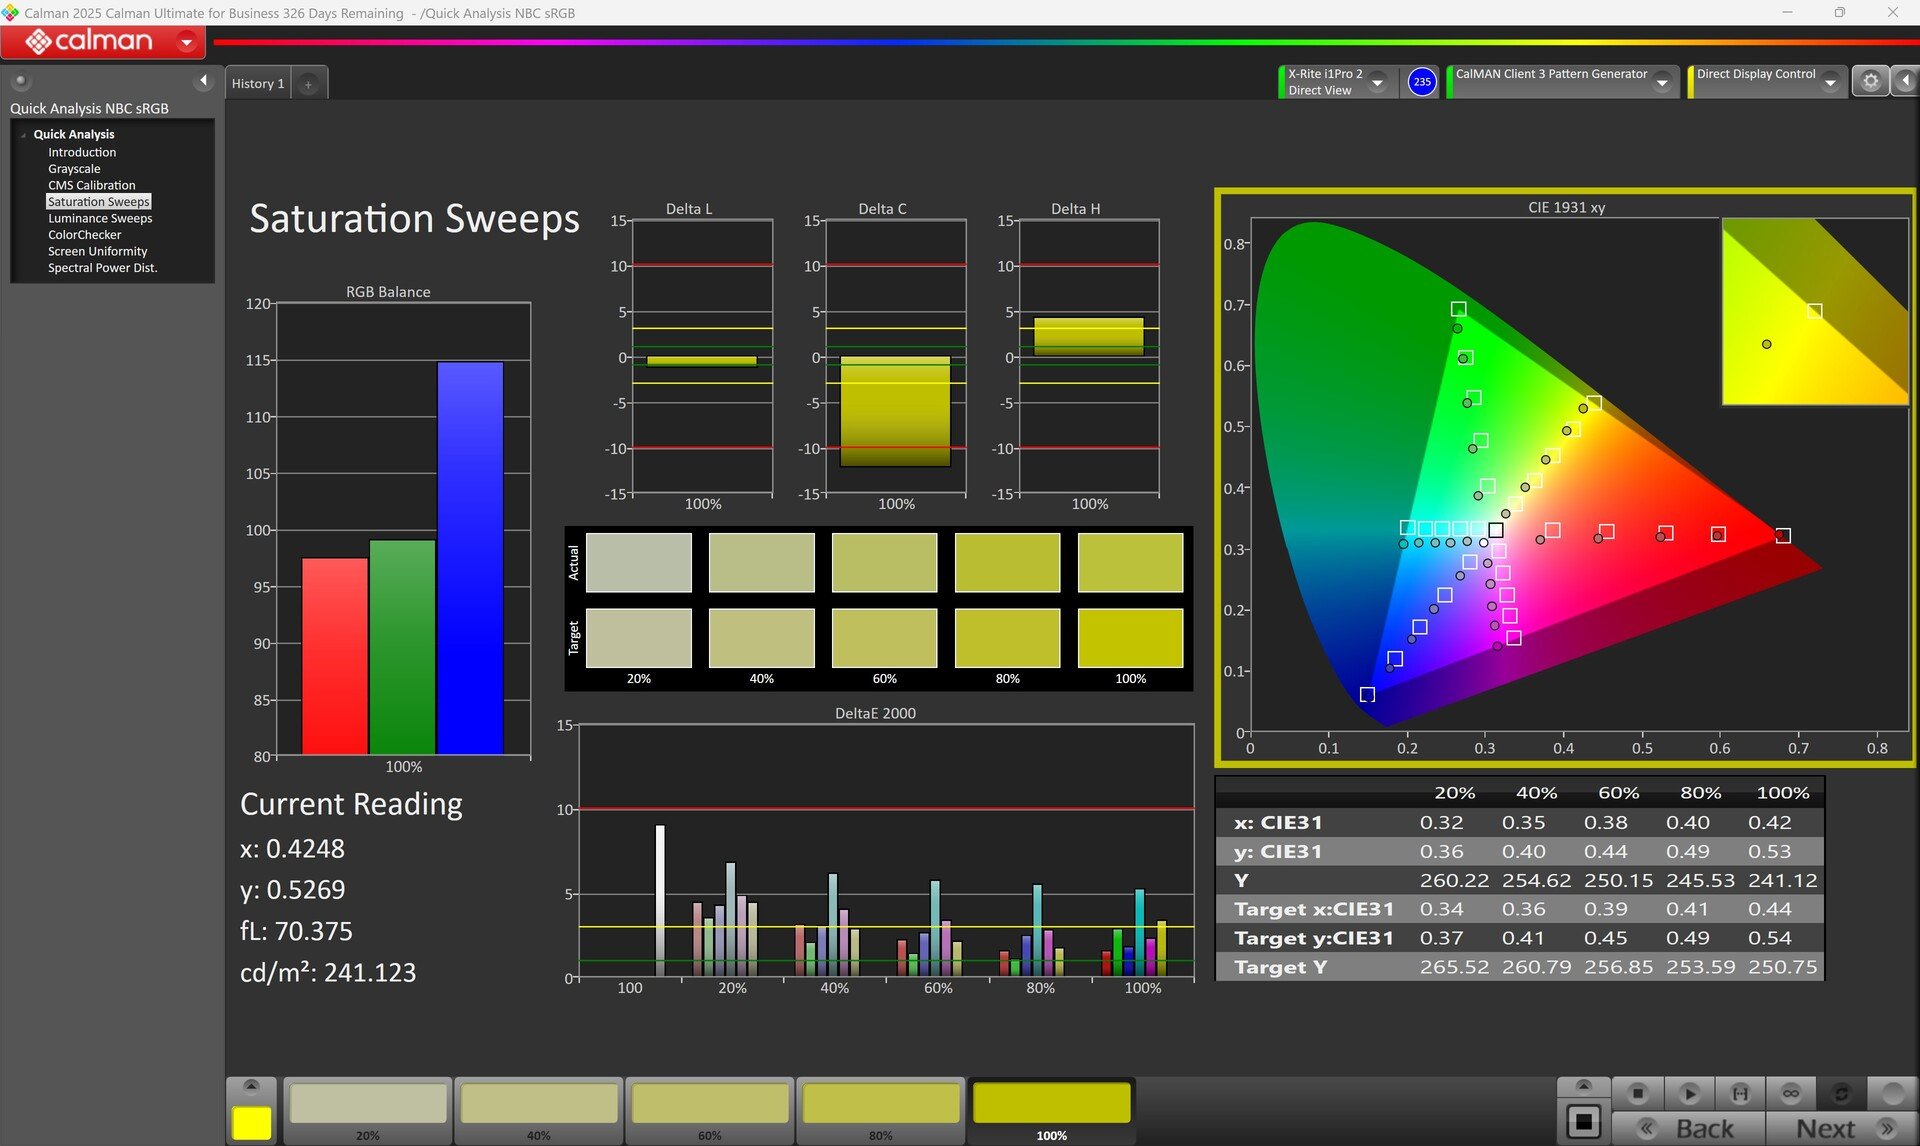
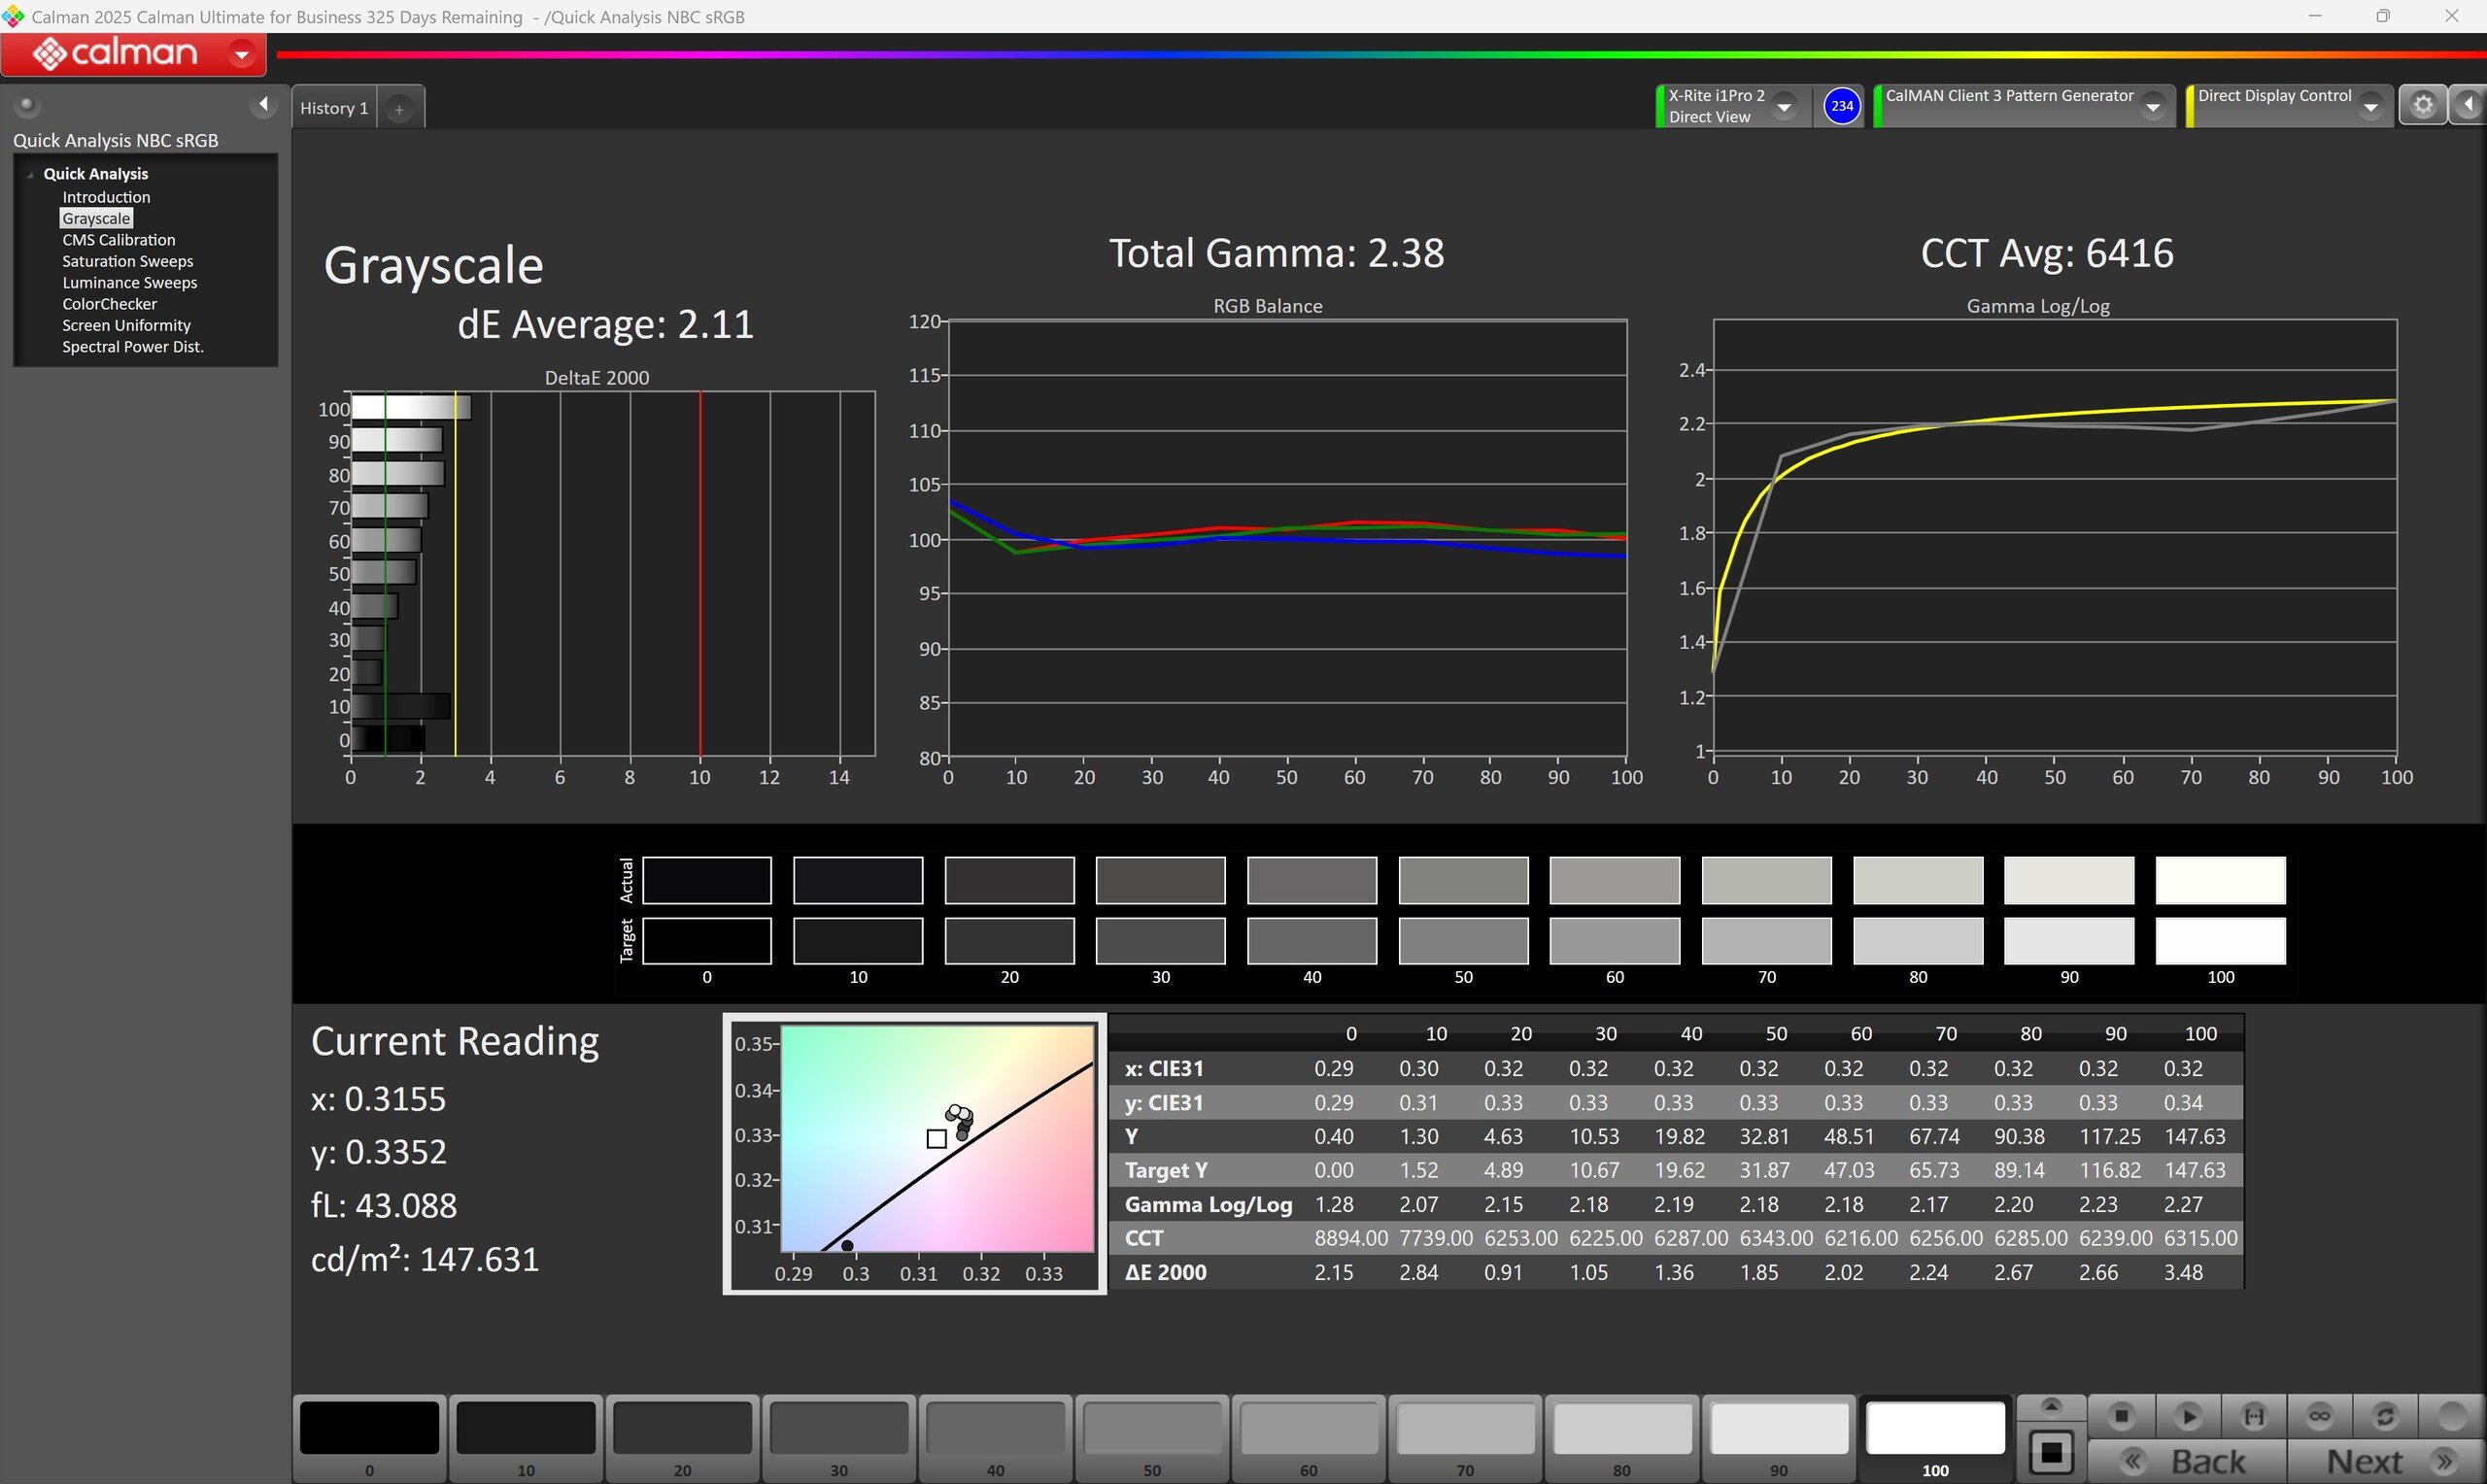
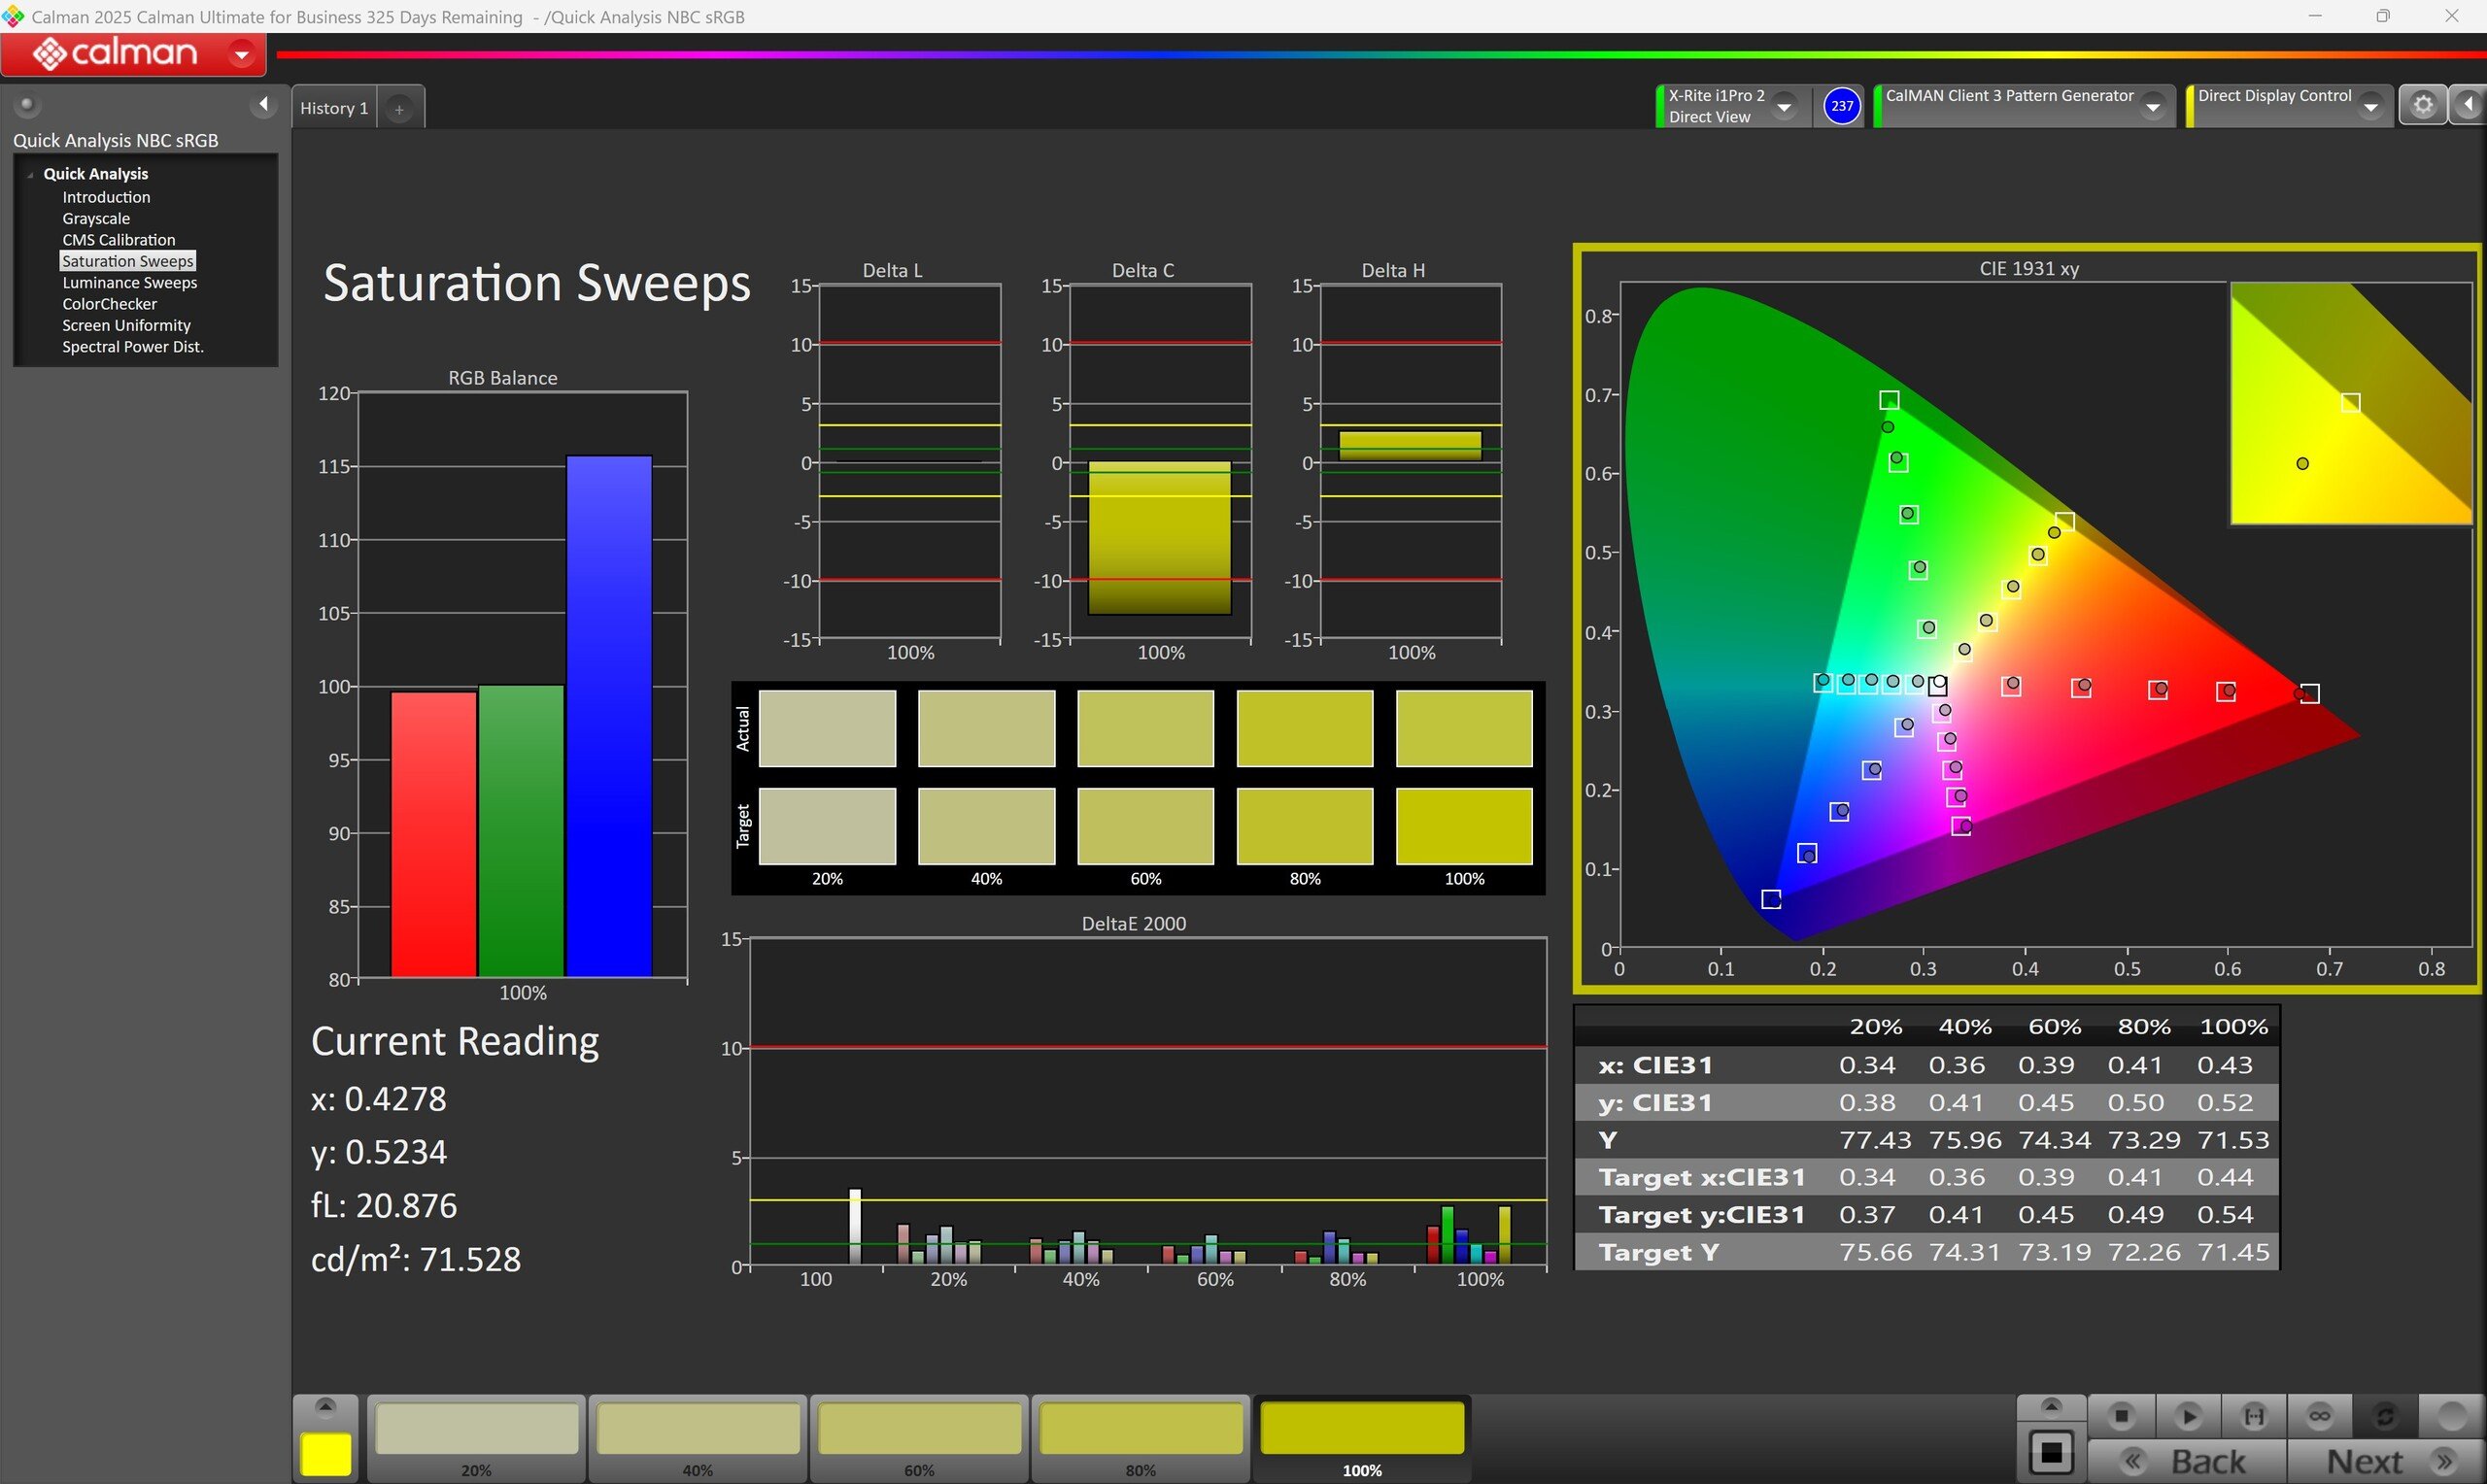
惠普为 OmniStudio X 32 配备了高分辨率 4K 显示屏(3840 x 2160 像素),屏幕比例为 16:9。该面板在照明不均匀方面略显不足,尤其是在显示暗色背景时。我们无法检测到 PWM 闪烁,因此比较容易看清。在我们的测试中,其最大亮度平均为 488 cd/m²,略低于制造商的规格要求。
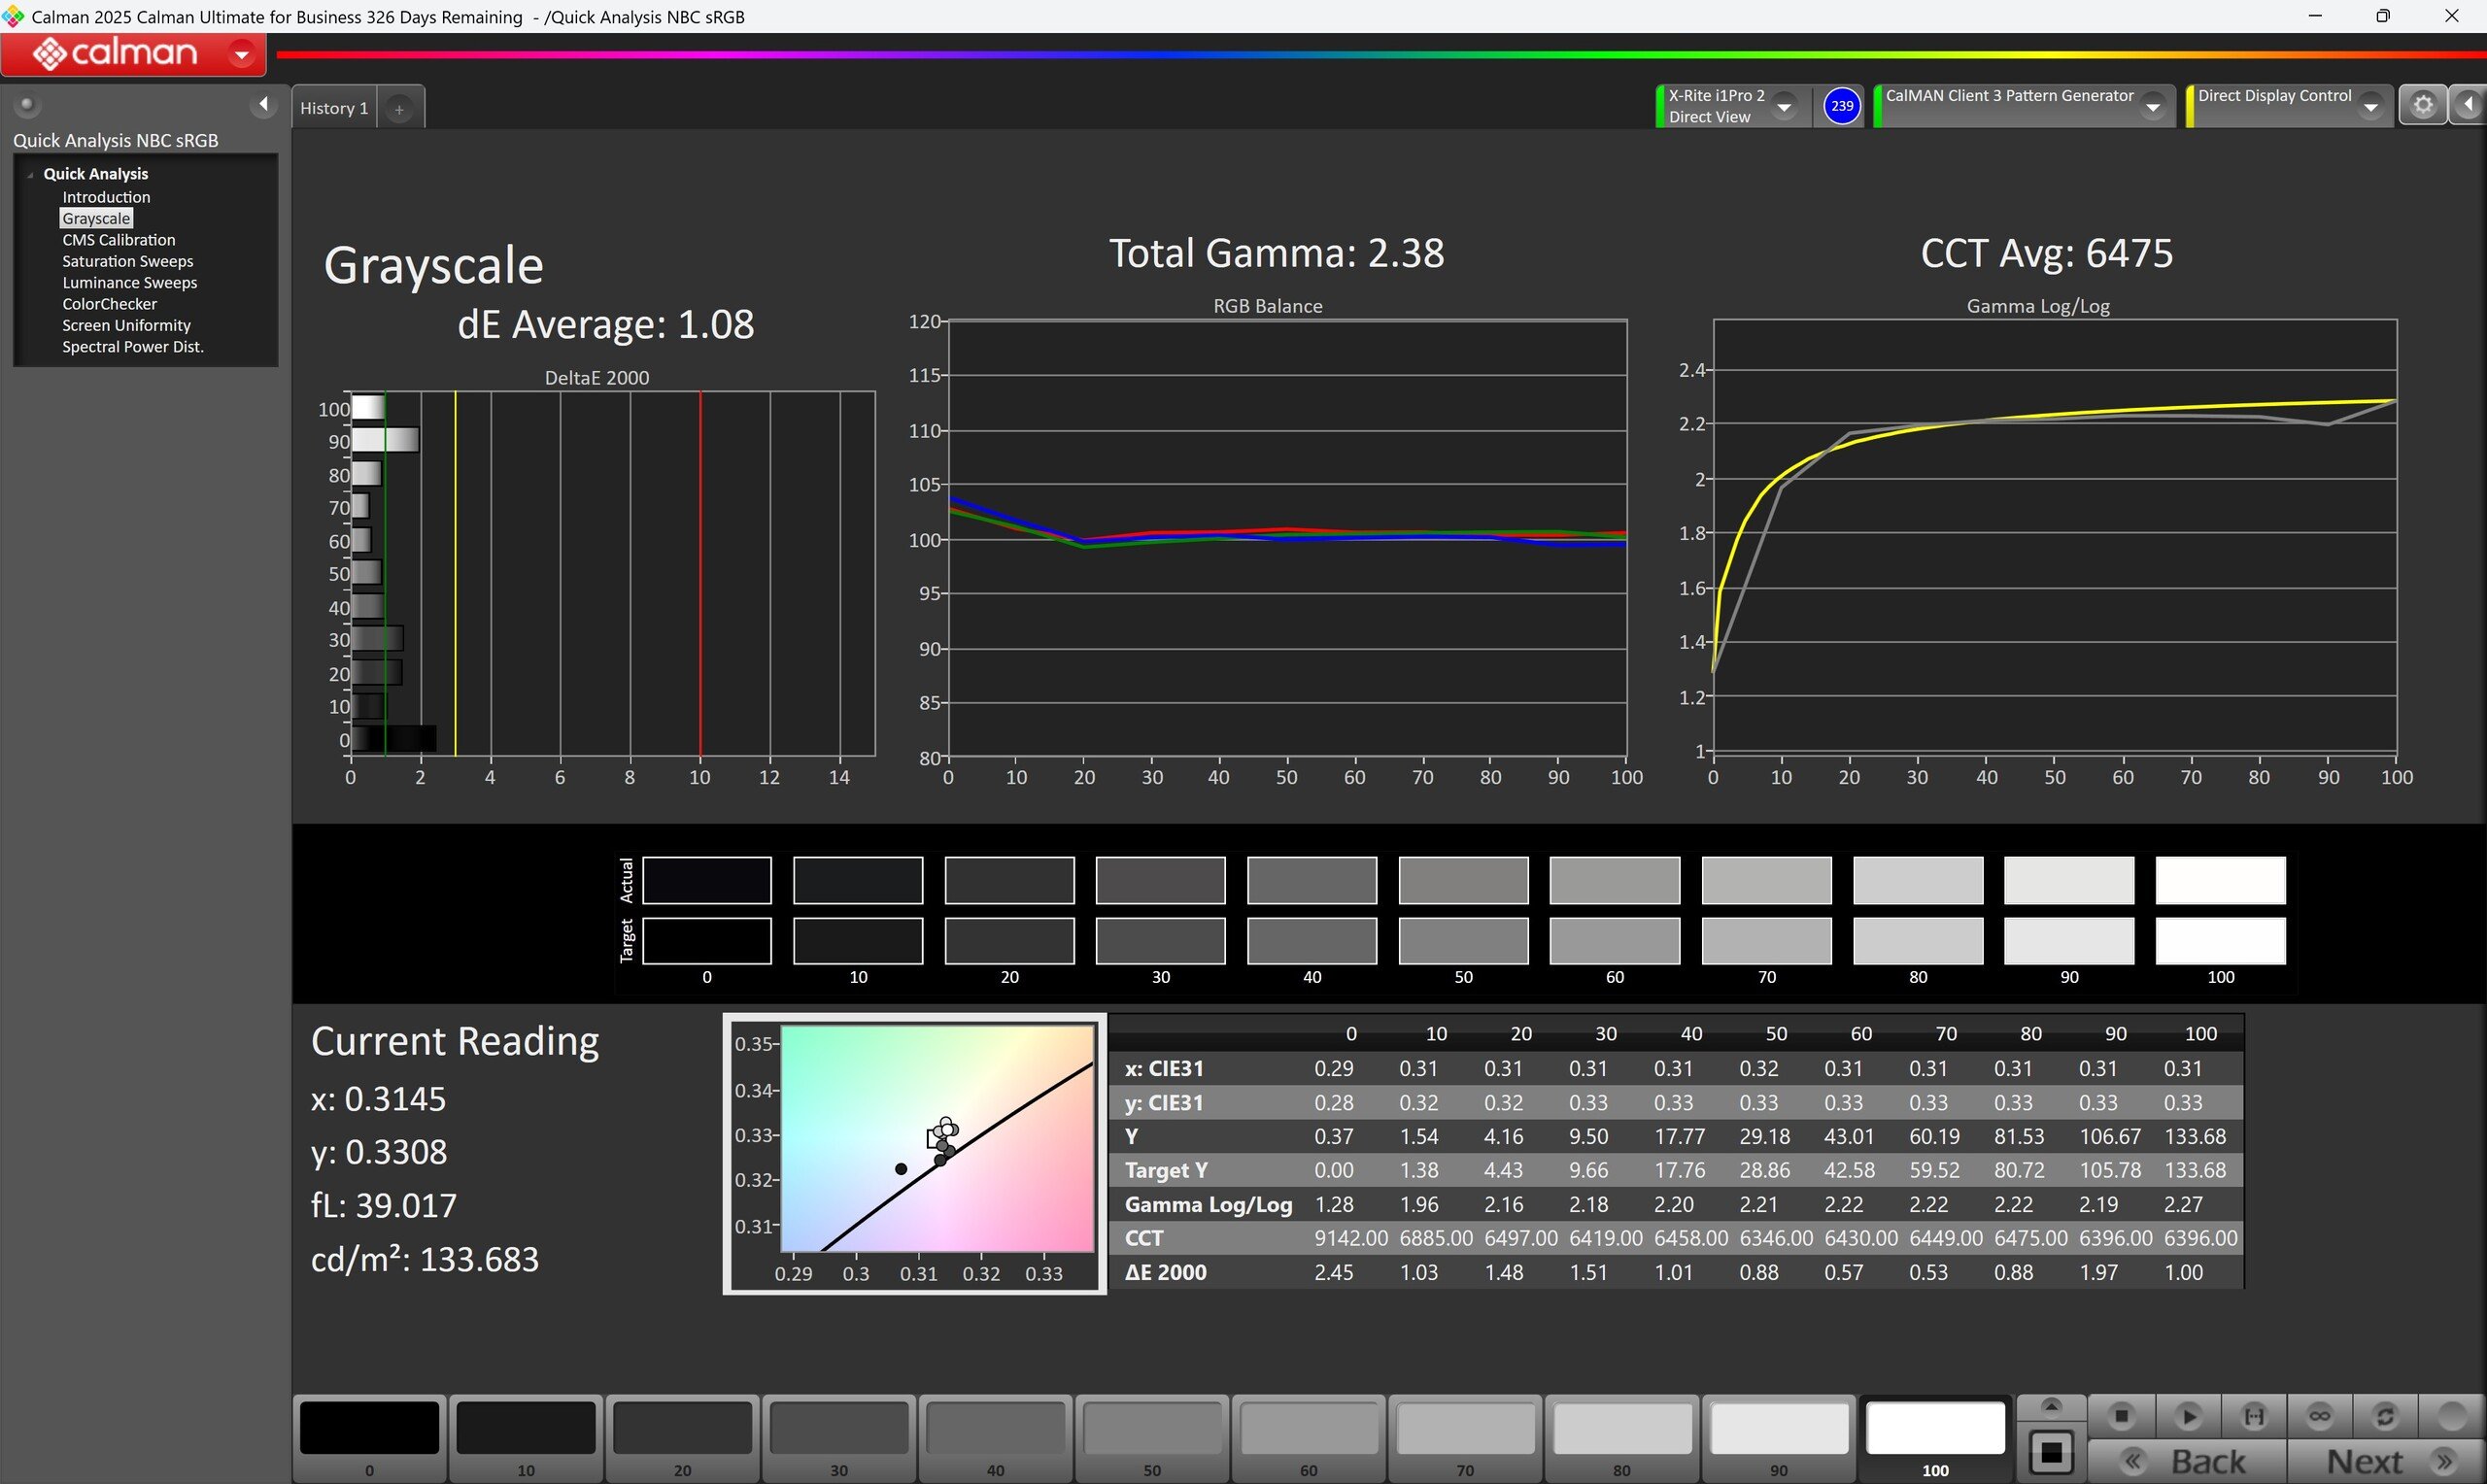
由于黑阶增加,对比度略受负面影响。该面板没有进行出厂校准,这反映在 Delta-E-2000 值的增加上。无论使用哪种色彩配置文件,色彩偏差都很明显,只有通过手动校准才能显著减少偏差。
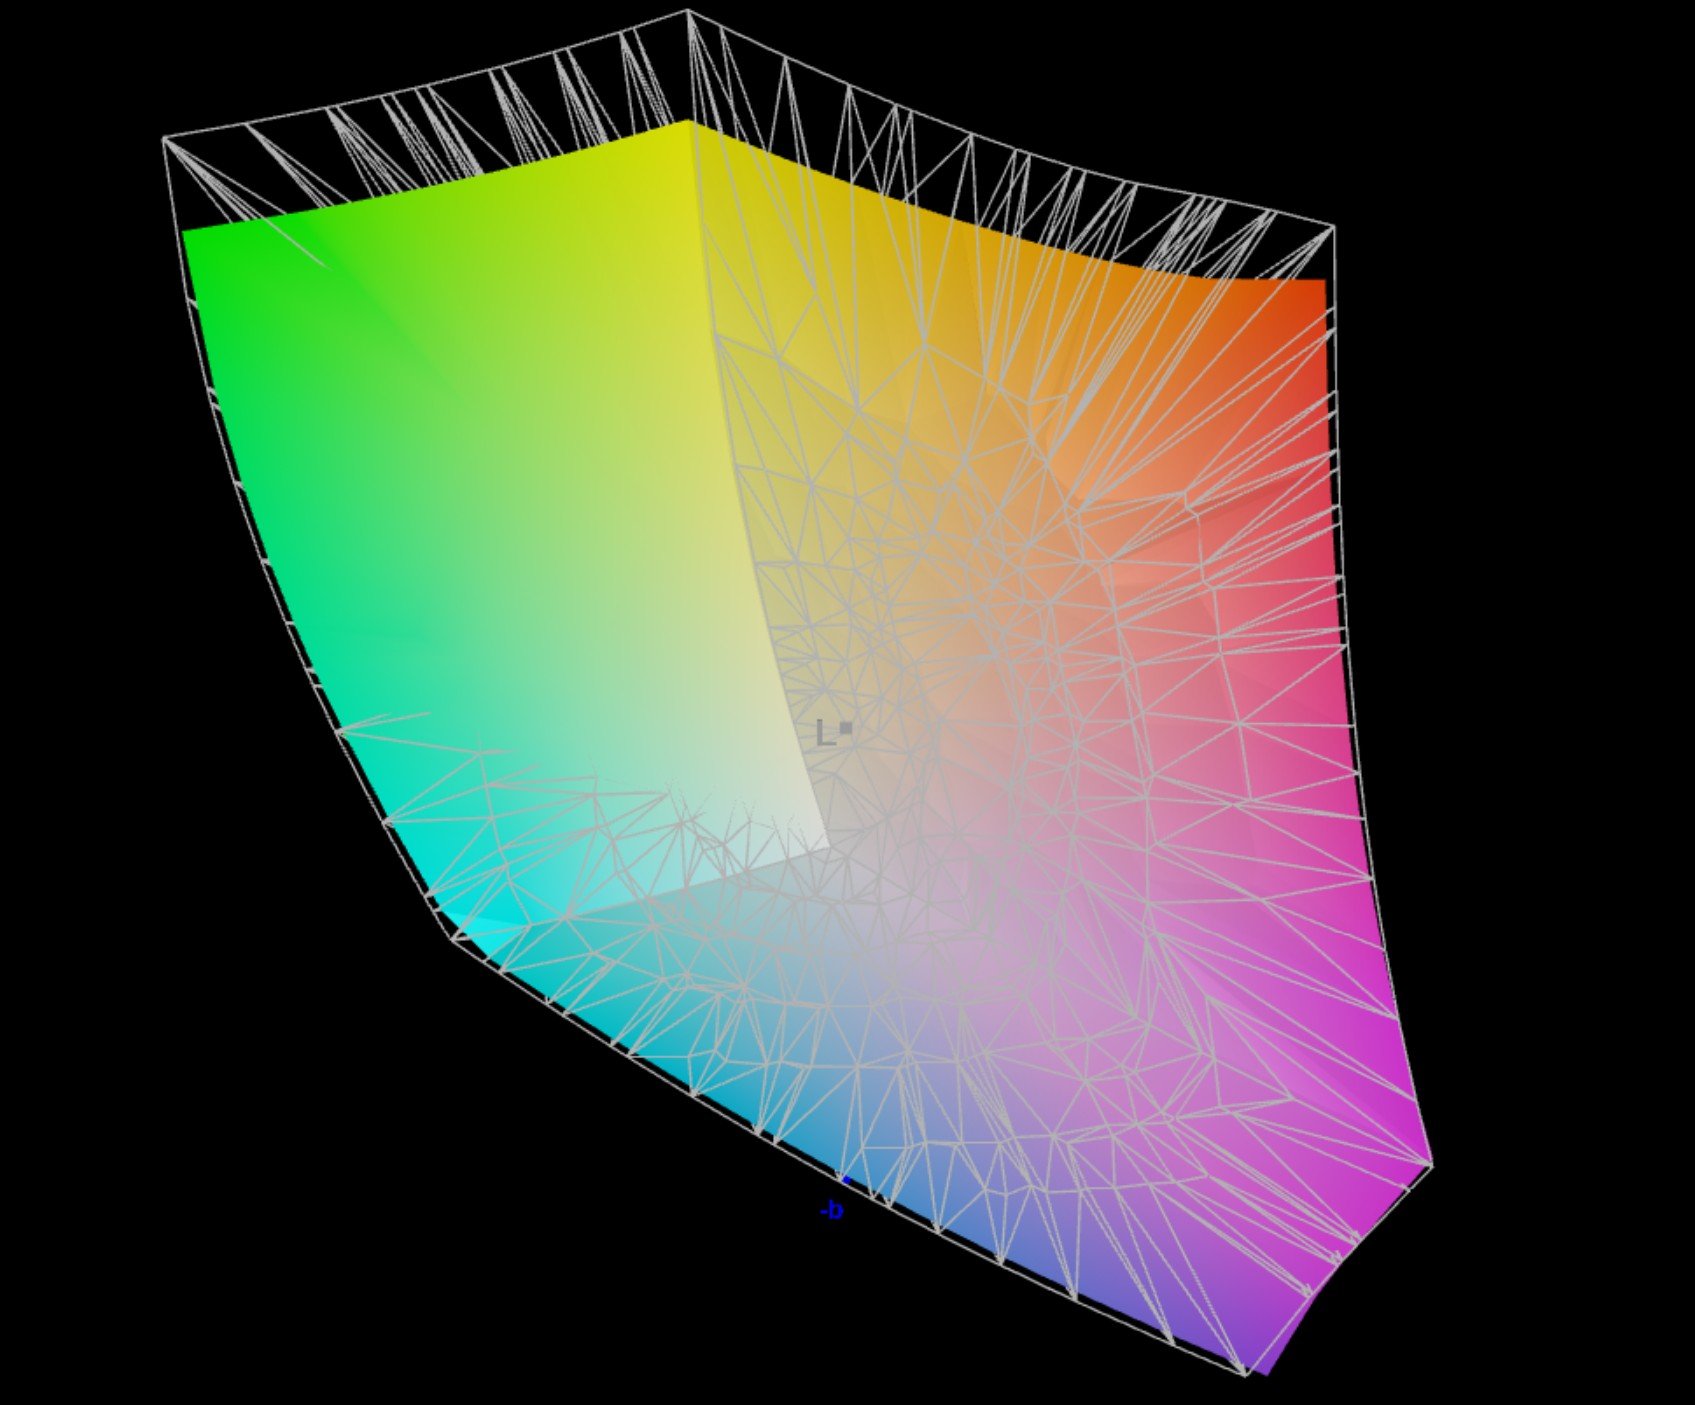
总的来说,该显示器的画质不错,色彩空间覆盖率高,适合专业照片和视频编辑。但缺少 144 Hz 选项,这将进一步提升该设备的性能,并突出其专业性。
| |||||||||||||||||||||||||
Brightness Distribution: 88 %
Contrast: 1338:1 (Black: 0.39 cd/m²)
ΔE Color 3.76 | 0.5-29.43 Ø4.87, calibrated: 0.89
ΔE Greyscale 5.42 | 0.5-98 Ø5.1
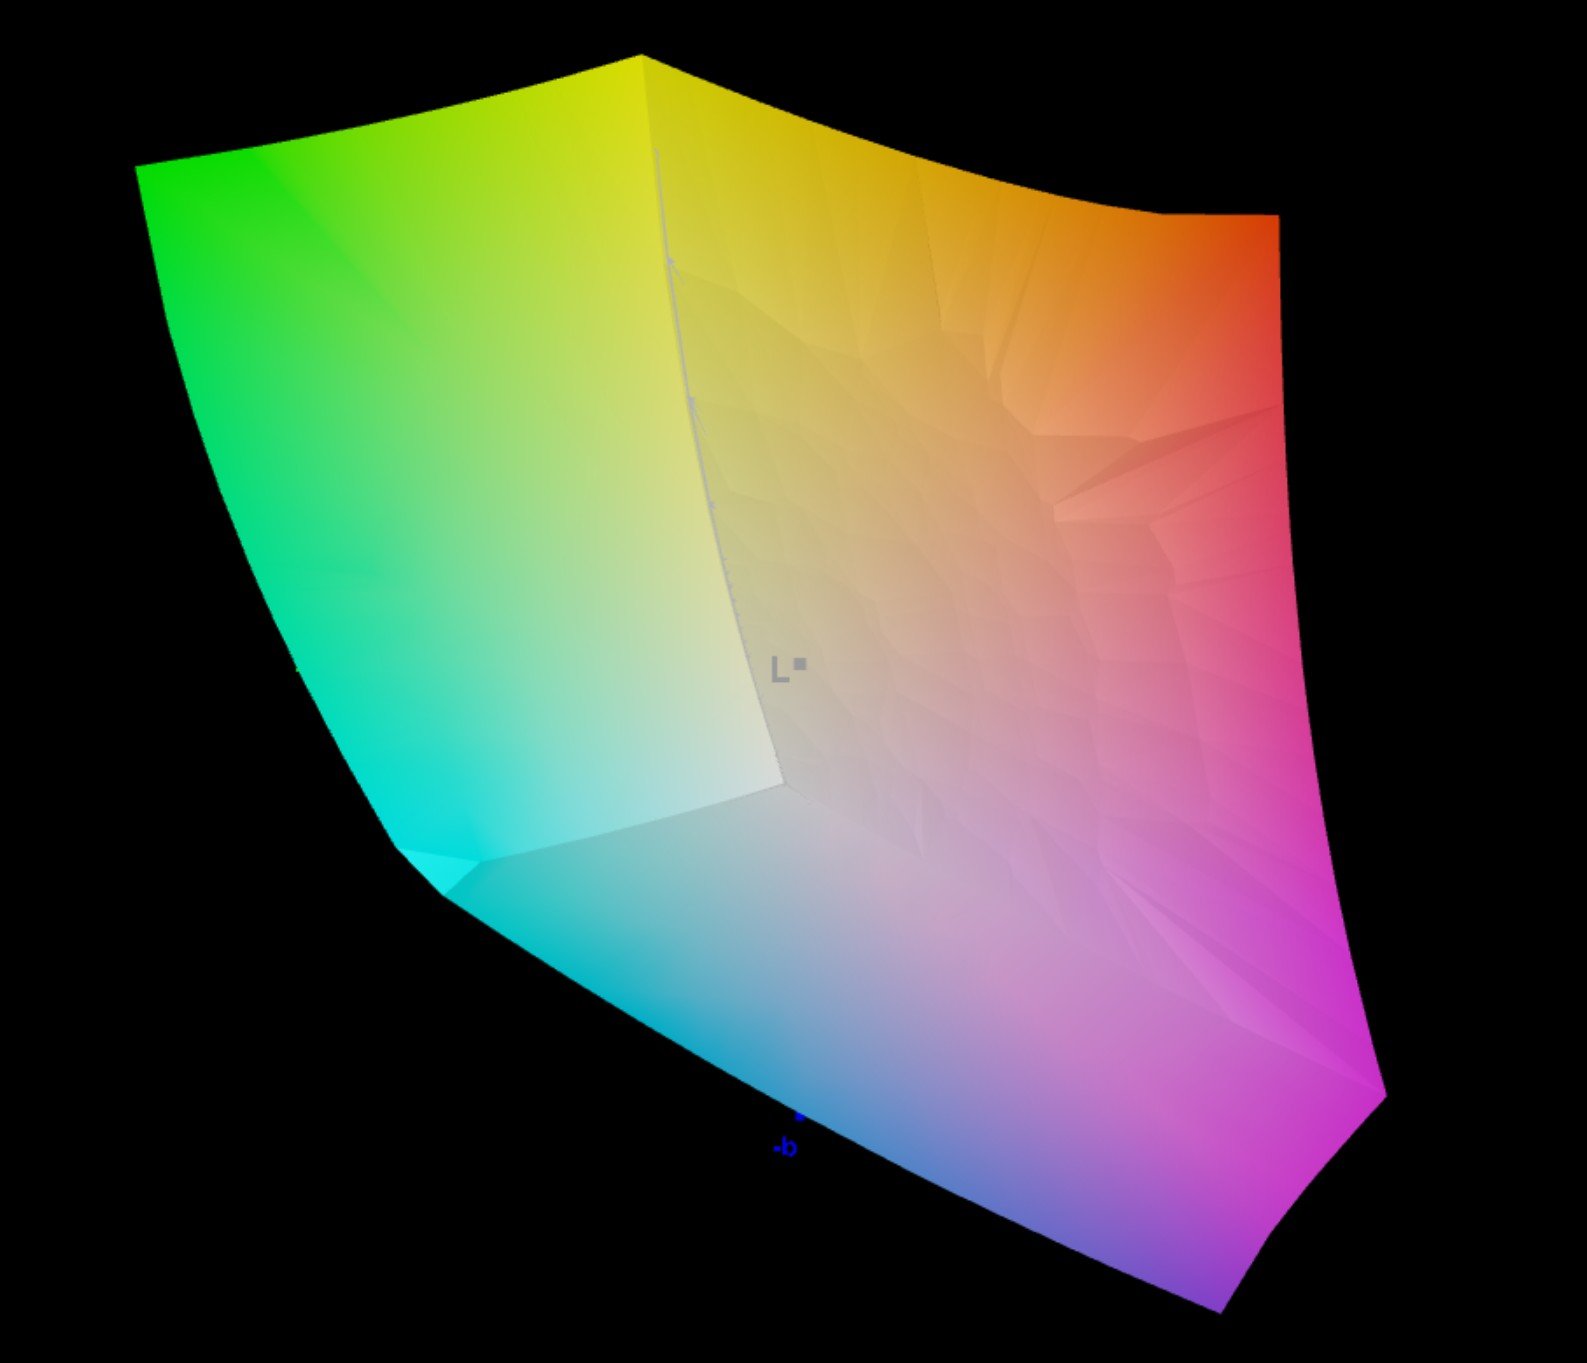
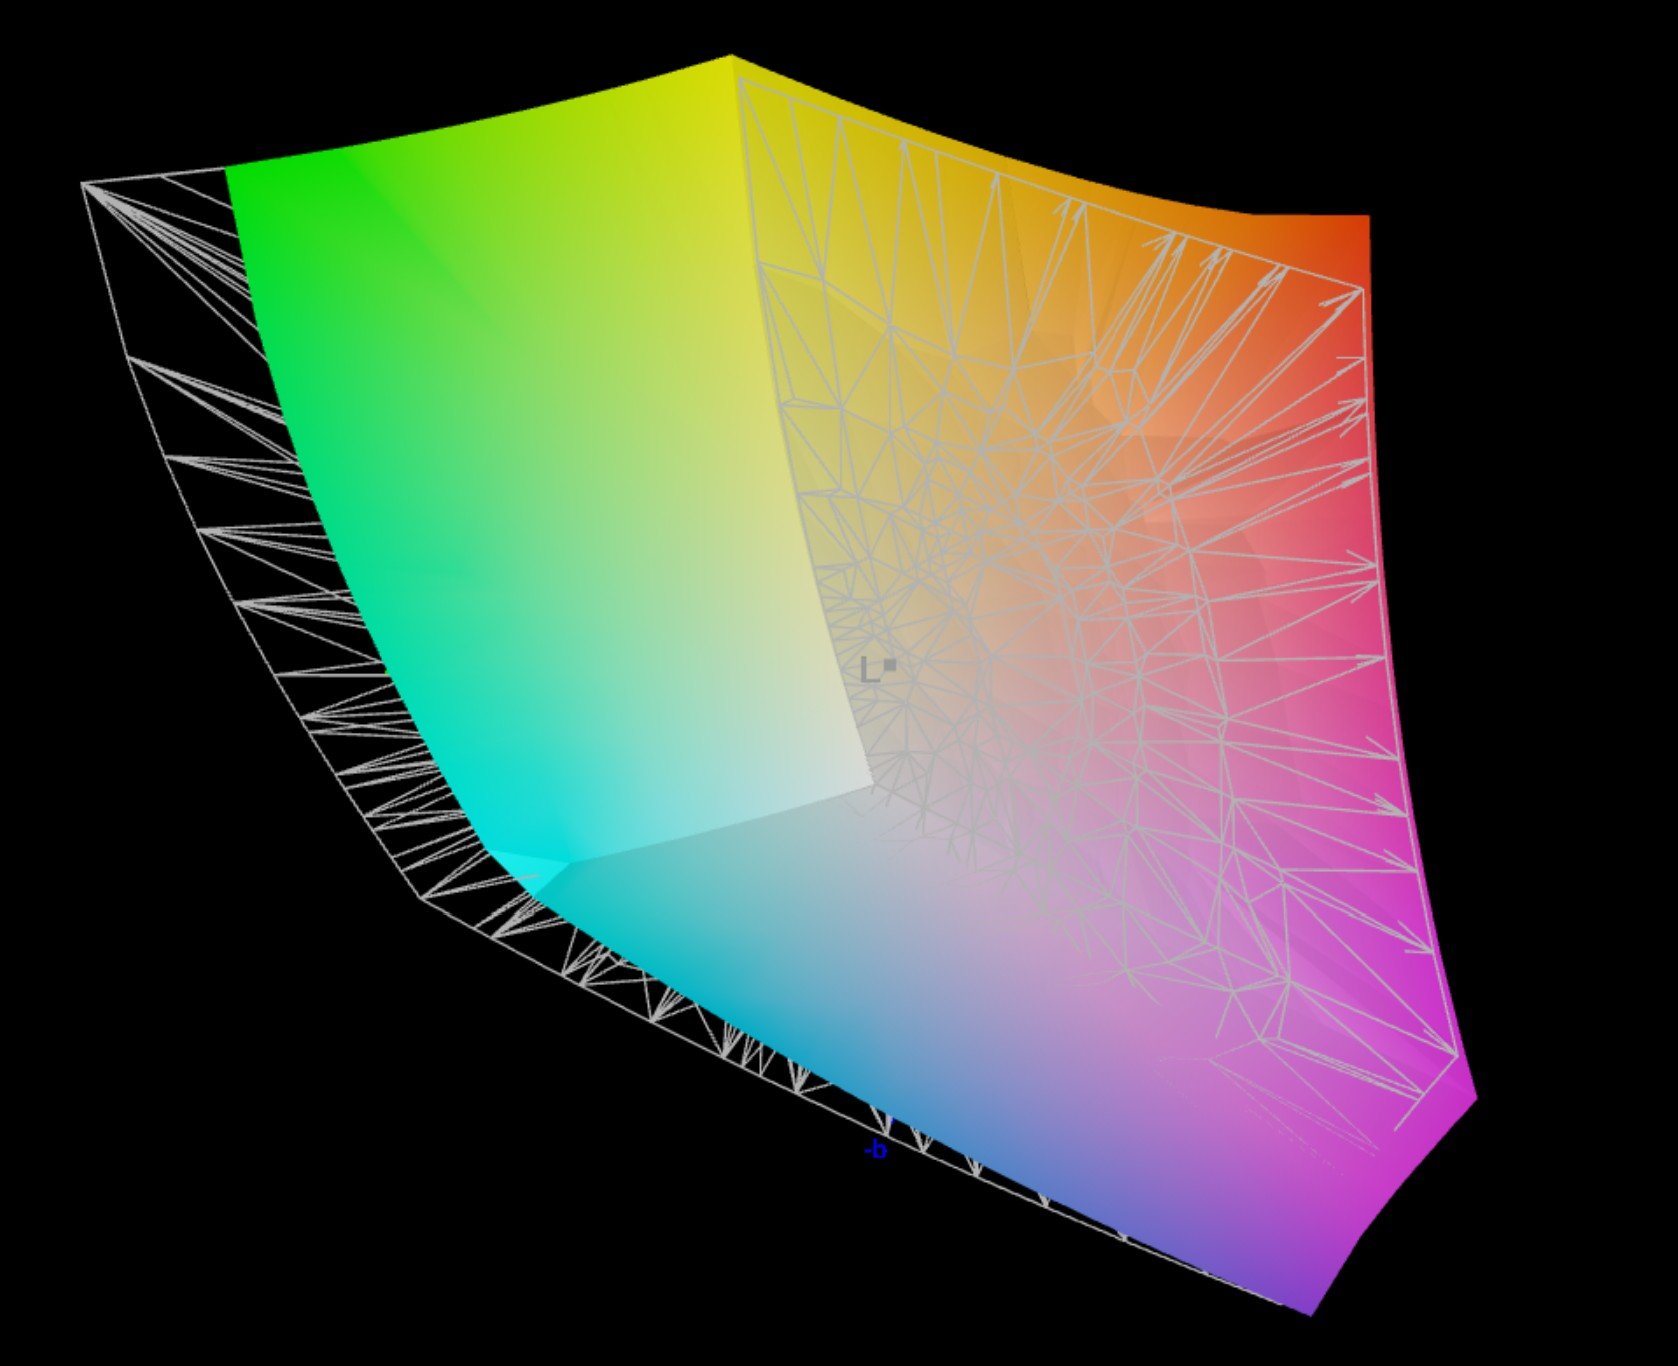
85.8% AdobeRGB 1998 (Argyll 2.2.0 3D)
100% sRGB (Argyll 2.2.0 3D)
89.8% Display P3 (Argyll 2.2.0 3D)
Gamma: 2.49
| HP OmniStudio X 32-c0077ng HPN406F, IPS, 3840x2160, 32", 60 Hz | KTC KTC G42P5 OLED 3840x2160, 42", Hz | AOC CU34G2XPD VA , WLED, 3440x1440, 34", 180 Hz | Philips Evnia 34M2C8600 QD OLED, 3440x1440, 34", 175 Hz | |
|---|---|---|---|---|
| Display | 3% | -5% | 6% | |
| Display P3 Coverage | 89.8 | 95.5 6% | 82.6 -8% | 98.4 10% |
| sRGB Coverage | 100 | 100 0% | 99.6 0% | 99.9 0% |
| AdobeRGB 1998 Coverage | 85.8 | 88.8 3% | 80.7 -6% | 93.9 9% |
| Response Times | 97% | 64% | 94% | |
| Response Time Grey 50% / Grey 80% * | 30.4 ? | 0.6 ? 98% | 11.6 ? 62% | 1.4 ? 95% |
| Response Time Black / White * | 20 ? | 1 ? 95% | 7 ? 65% | 1.4 ? 93% |
| PWM Frequency | 60 | 175 | ||
| Screen | 4739% | -14% | 6% | |
| Brightness middle | 522 | 448 -14% | 194 -63% | 231 -56% |
| Brightness | 488 | 177 -64% | 210 -57% | |
| Brightness Distribution | 88 | 86 -2% | 85 -3% | |
| Black Level * | 0.39 | 0.001 100% | 0.05 87% | 0.1 74% |
| Contrast | 1338 | 448000 33383% | 3880 190% | 2310 73% |
| Colorchecker dE 2000 * | 3.76 | 4.08 -9% | 2.46 35% | 2.02 46% |
| Colorchecker dE 2000 max. * | 9.04 | 10.09 -12% | 4.36 52% | 5.12 43% |
| Colorchecker dE 2000 calibrated * | 0.89 | 3.3 -271% | 3.67 -312% | 2.02 -127% |
| Greyscale dE 2000 * | 5.42 | 5.63 -4% | 8.02 -48% | 2.11 61% |
| Gamma | 2.49 88% | 2.38 92% | 2.4 92% | 2.49 88% |
| CCT | 7521 86% | 7094 92% | 6394 102% | 6229 104% |
| Total Average (Program / Settings) | 1613% /
2781% | 15% /
-1% | 35% /
19% |
* ... smaller is better
使用 sRGB 色彩配置文件的测量结果


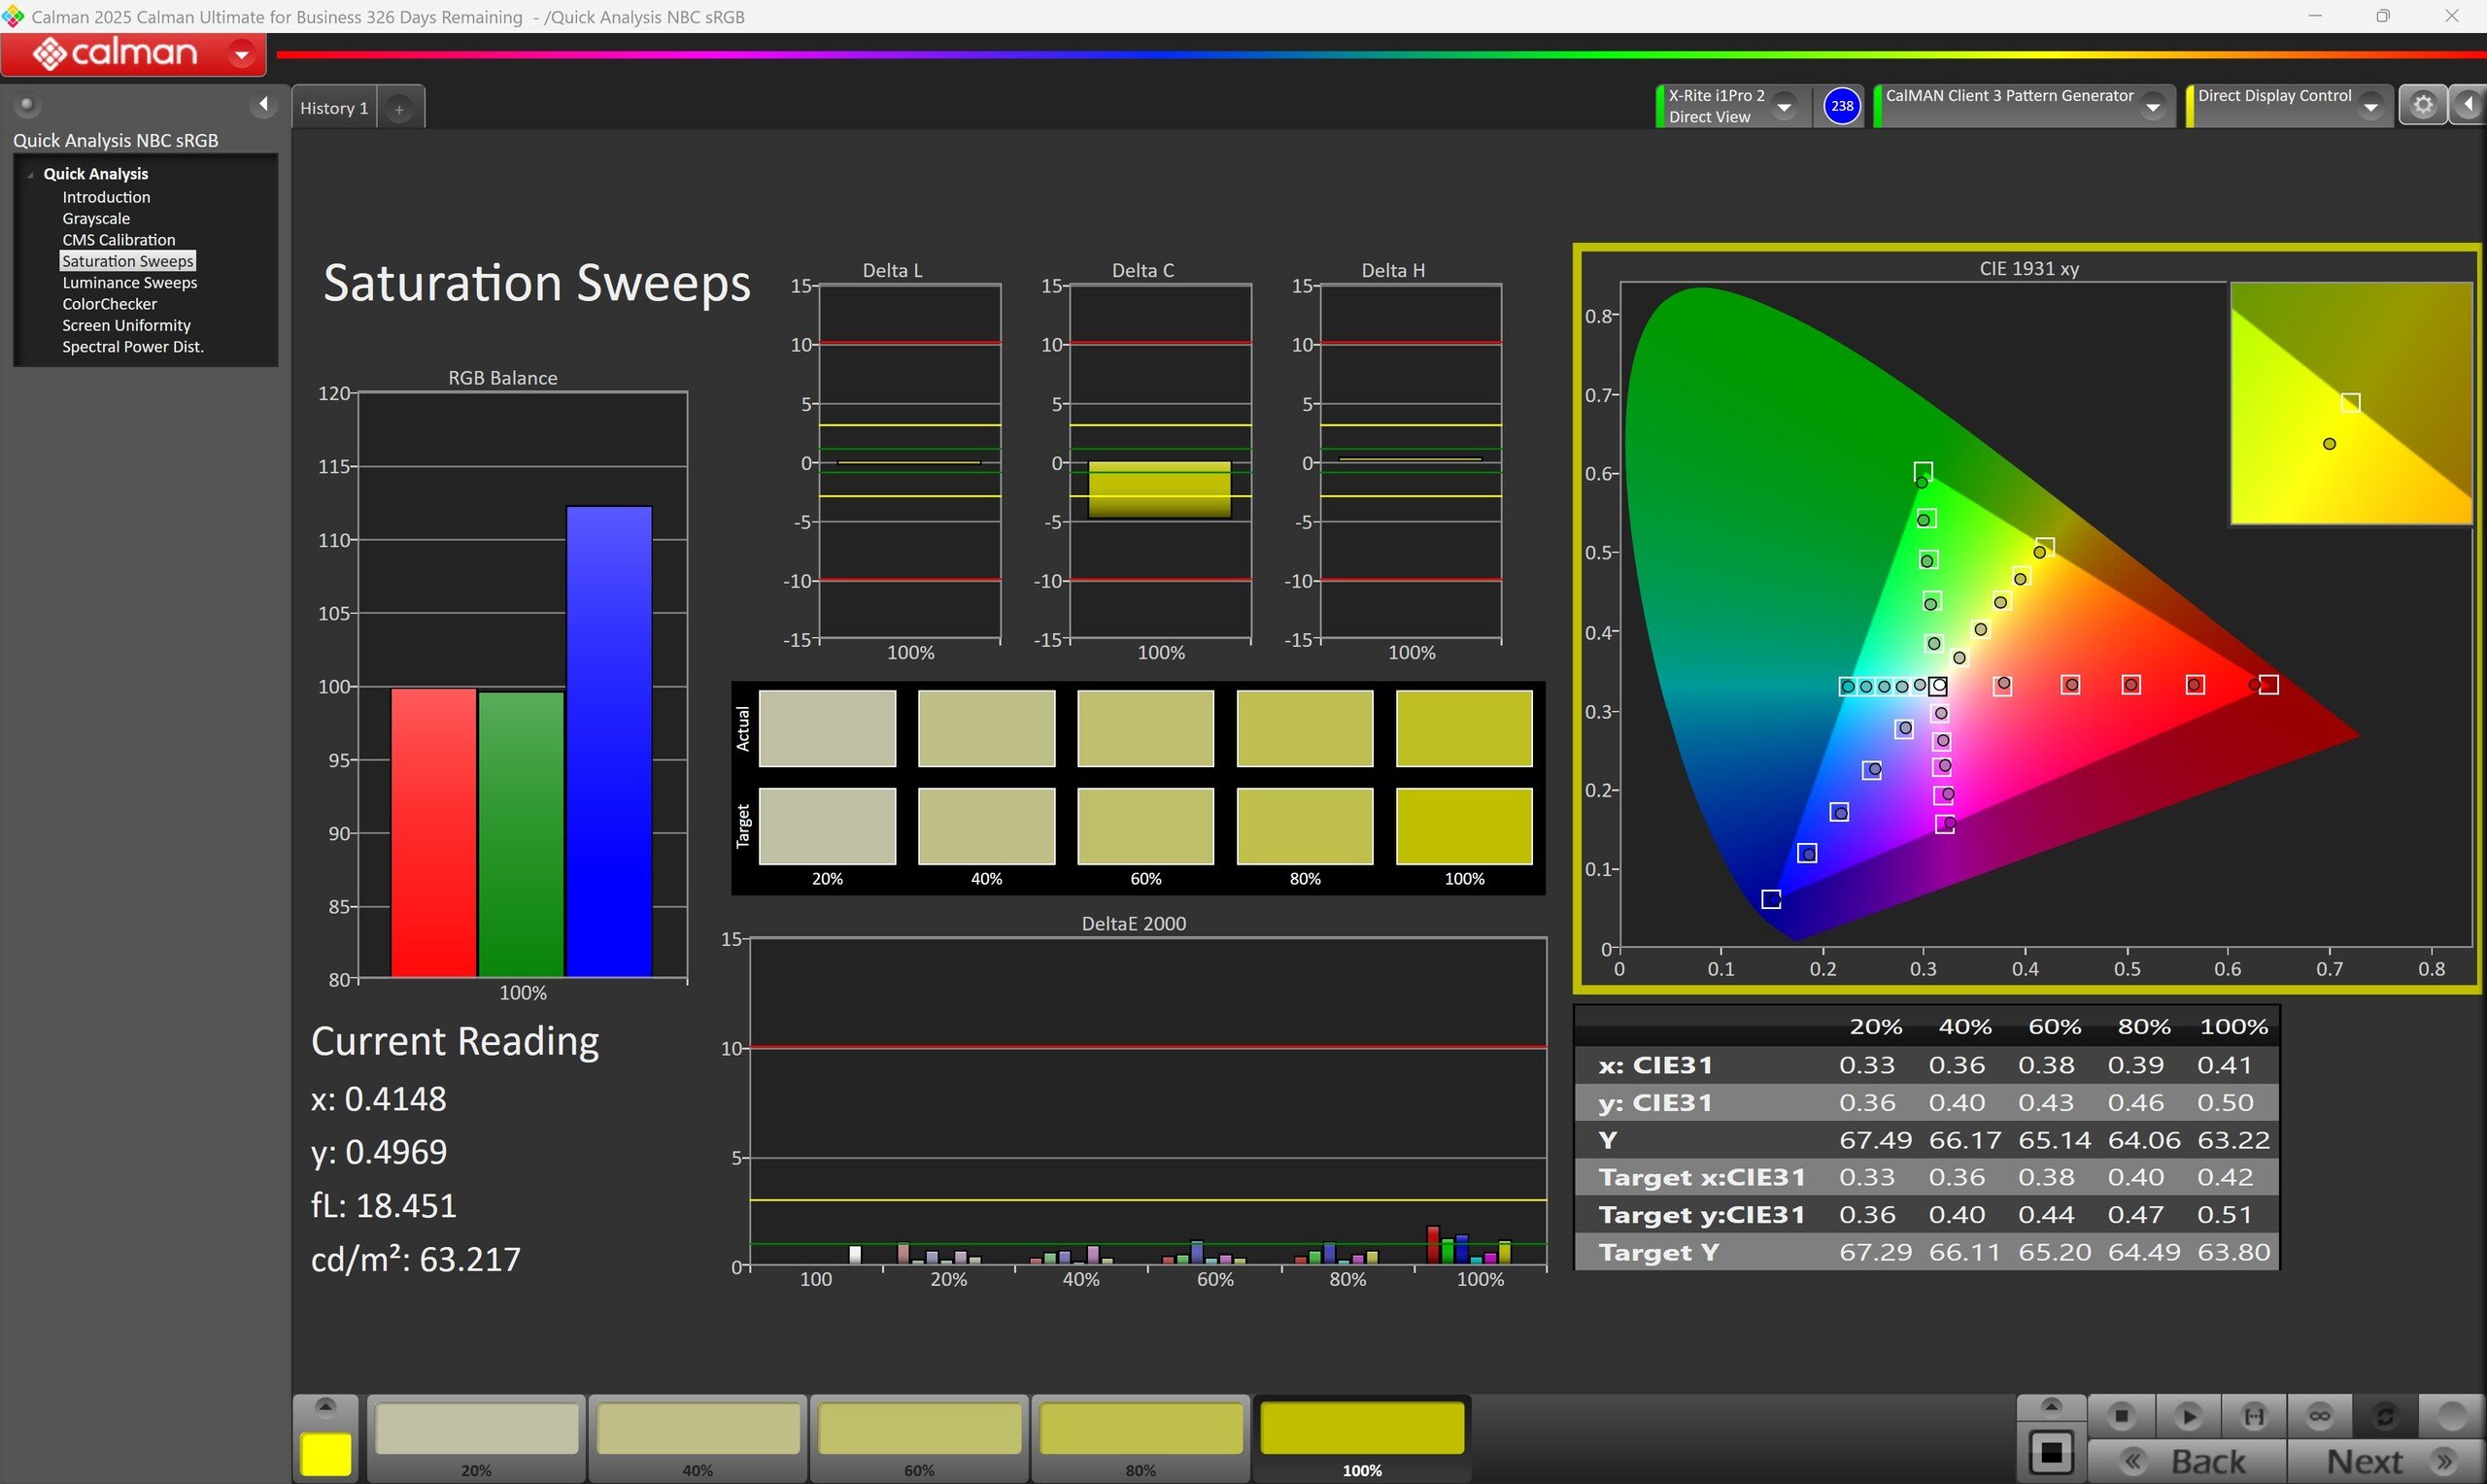
使用 P3 色彩曲线的测量结果


色彩空间覆盖率
Display Response Times
| ↔ Response Time Black to White | ||
|---|---|---|
| 20 ms ... rise ↗ and fall ↘ combined | ↗ 11.6 ms rise | 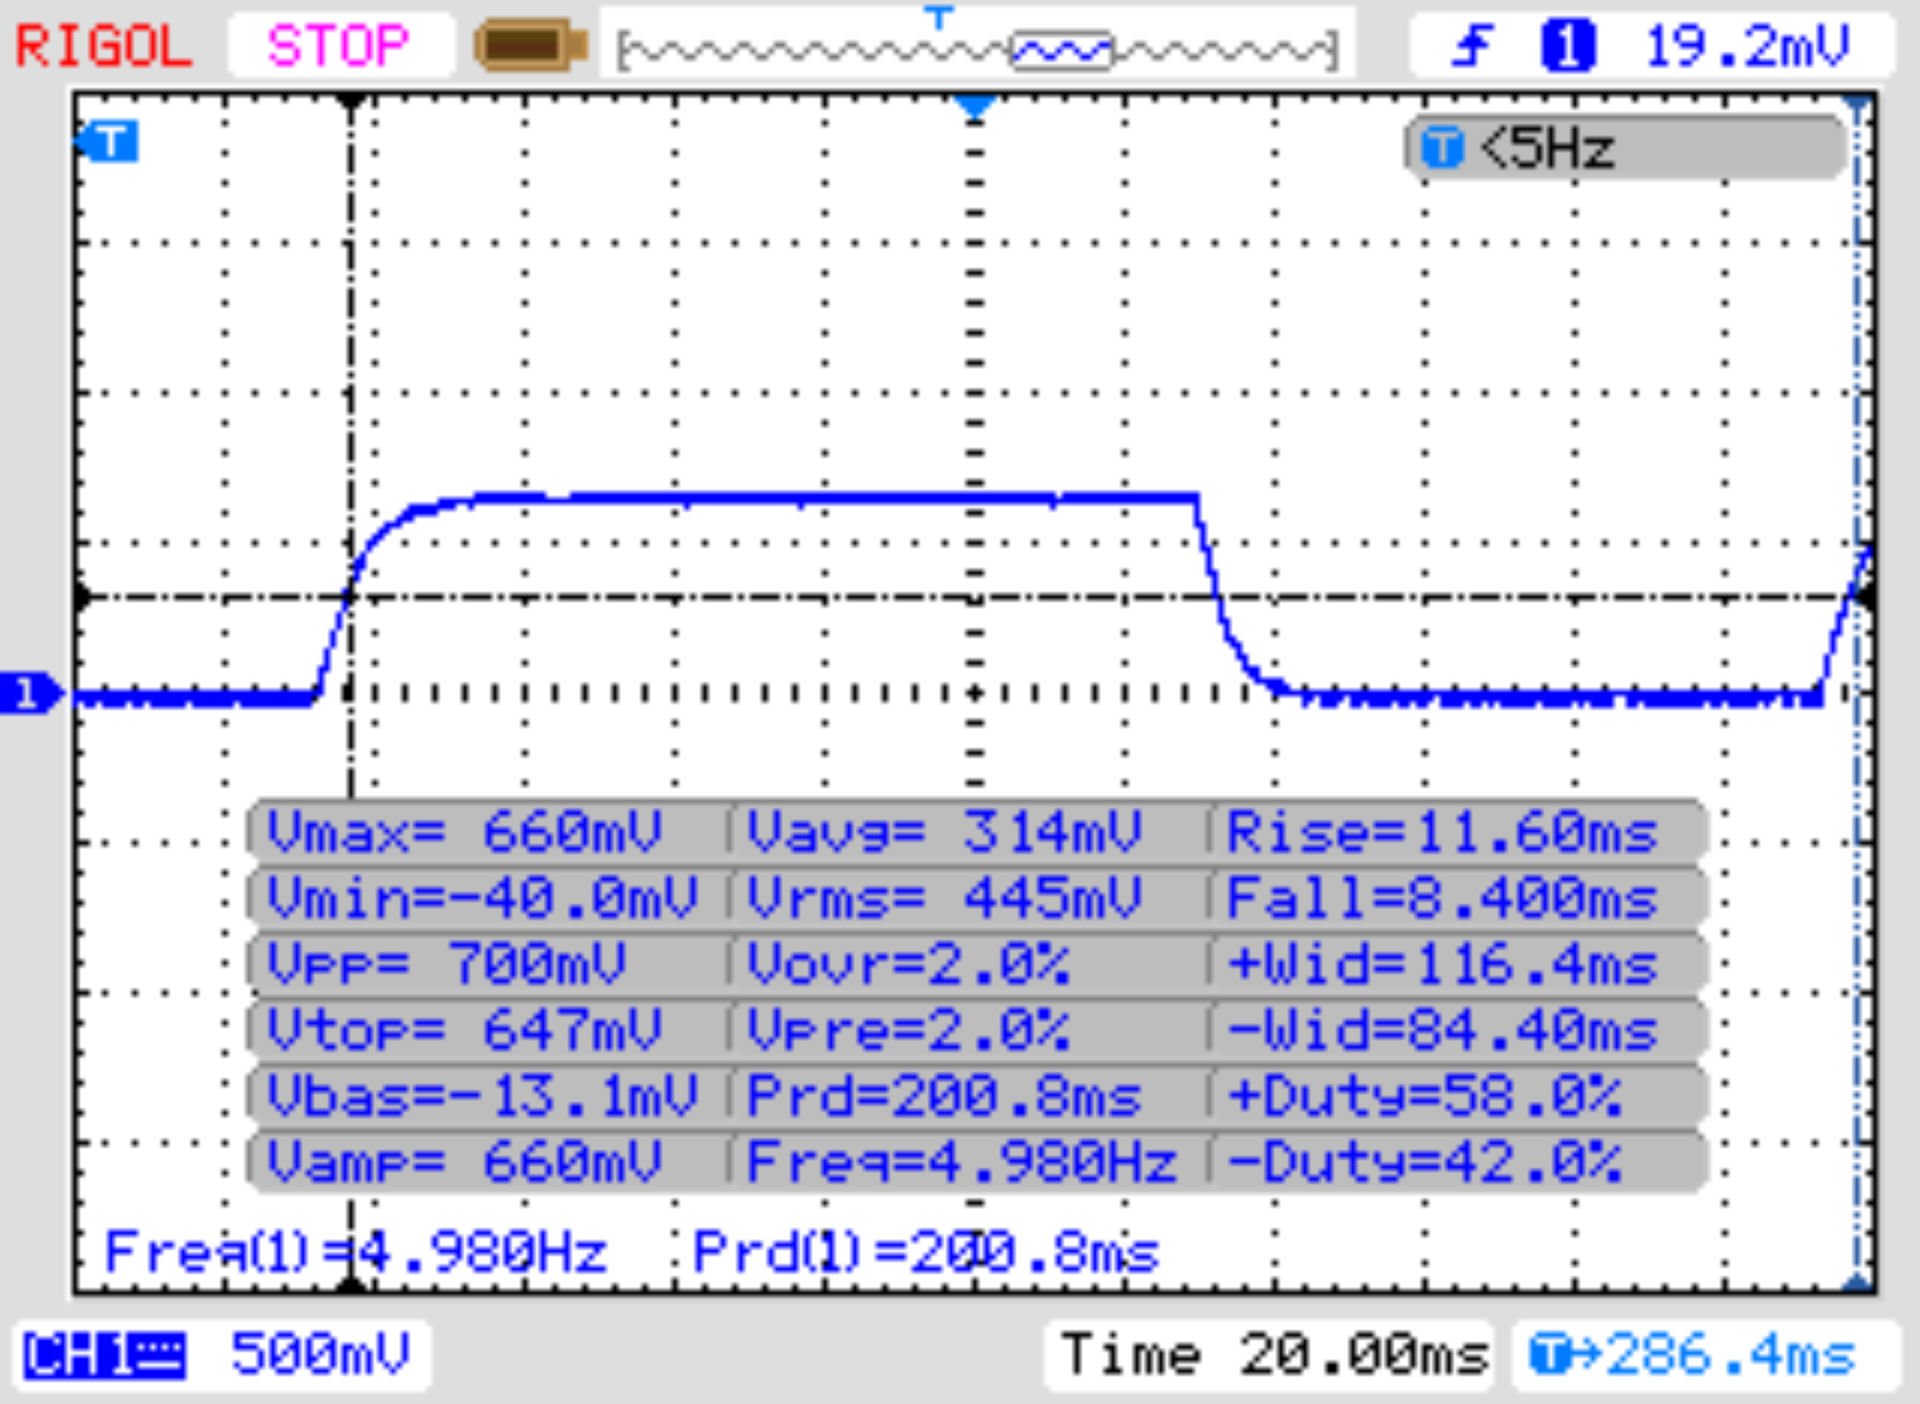 |
| ↘ 8.4 ms fall | ||
| The screen shows good response rates in our tests, but may be too slow for competitive gamers. In comparison, all tested devices range from 0.1 (minimum) to 240 (maximum) ms. » 40 % of all devices are better. This means that the measured response time is similar to the average of all tested devices (20.8 ms). | ||
| ↔ Response Time 50% Grey to 80% Grey | ||
| 30.4 ms ... rise ↗ and fall ↘ combined | ↗ 16.4 ms rise | 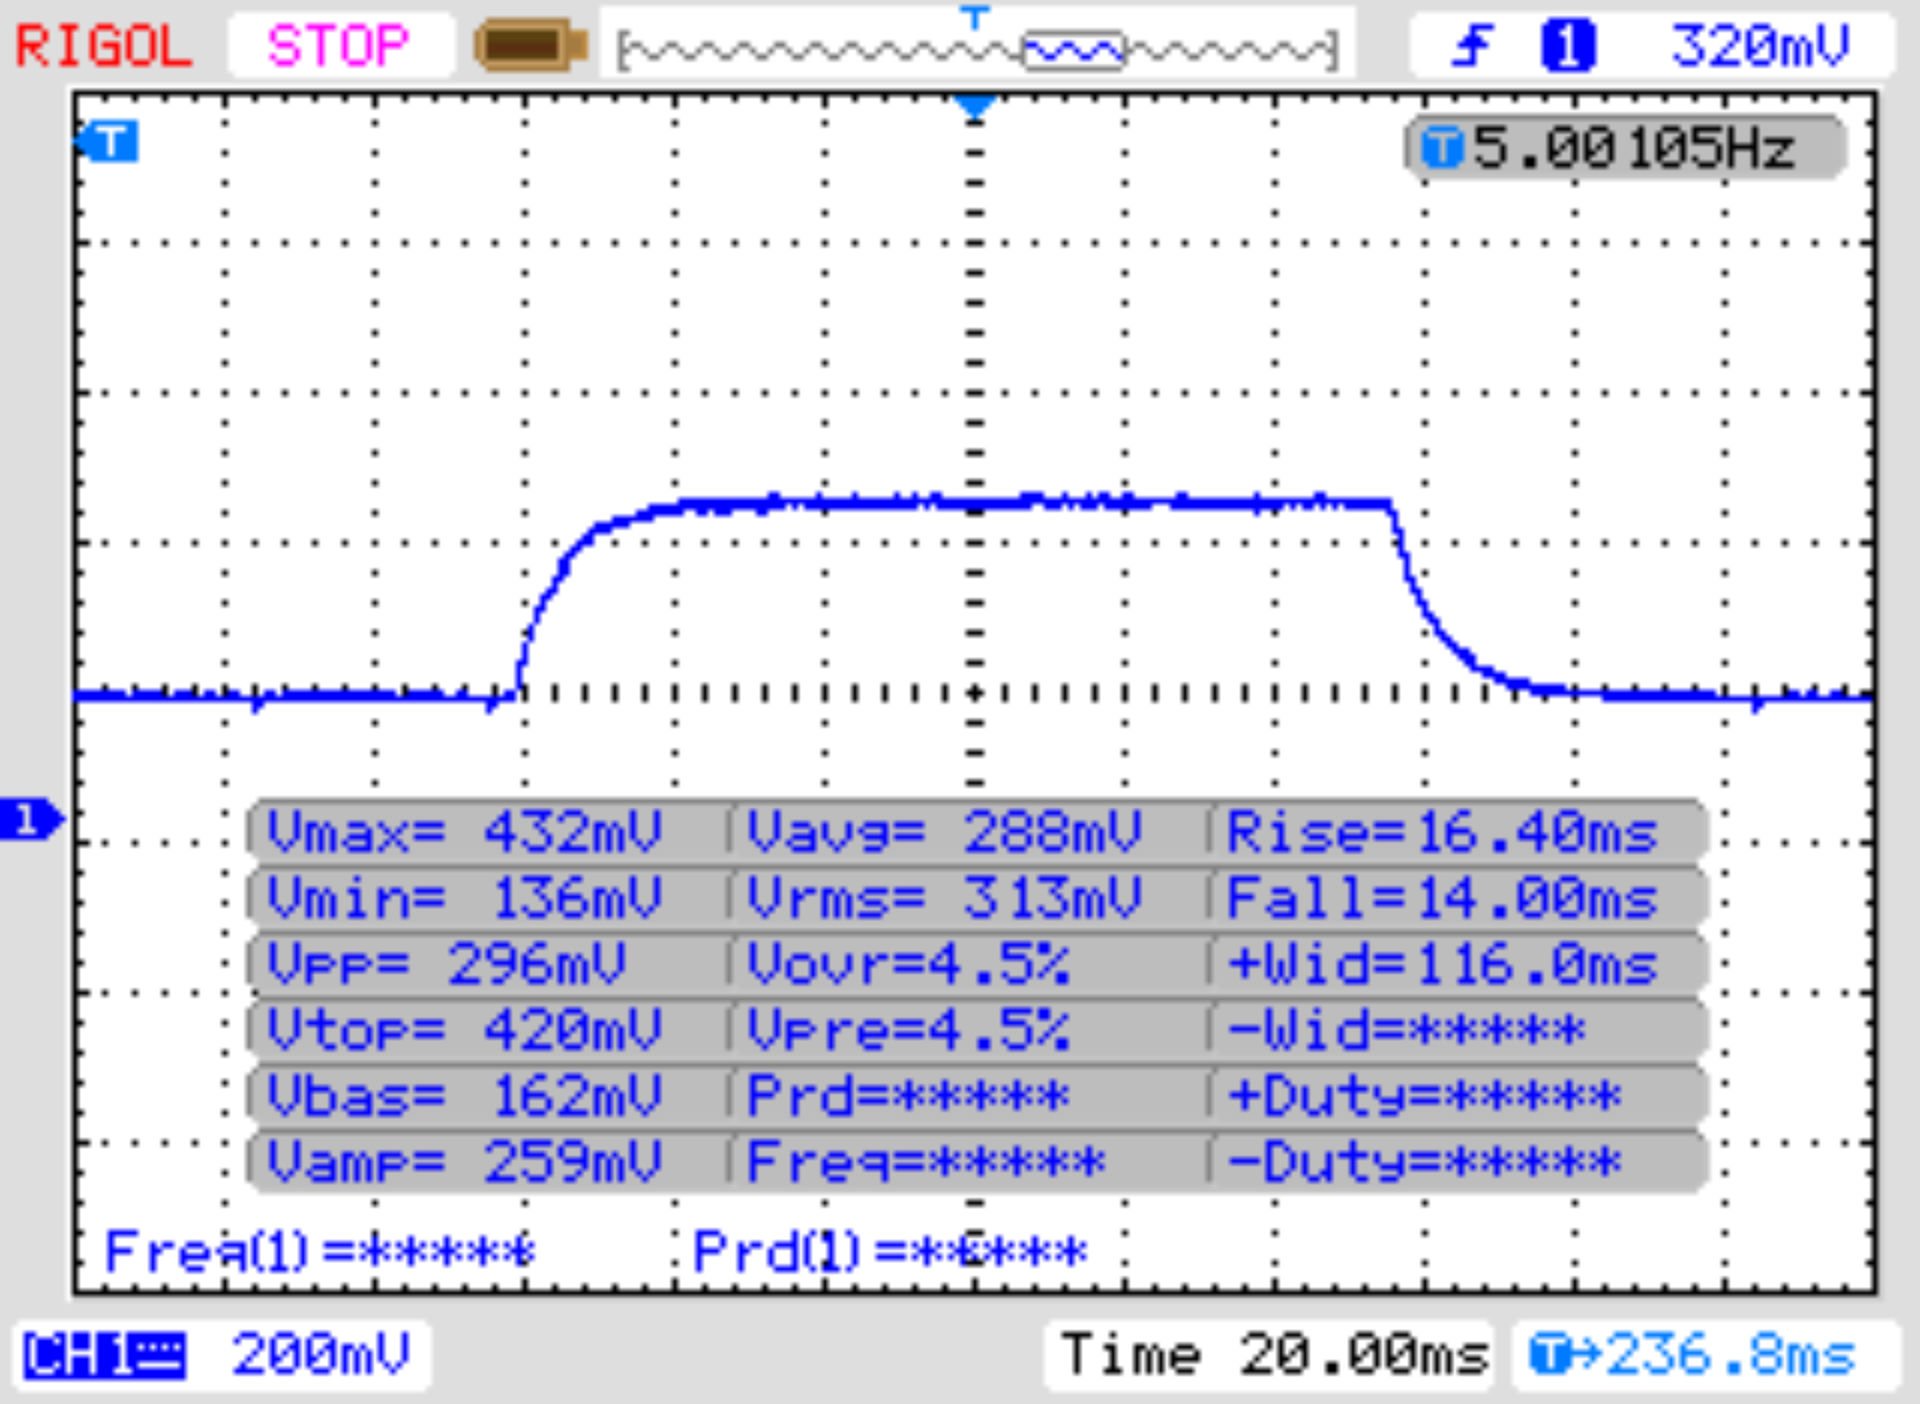 |
| ↘ 14 ms fall | ||
| The screen shows slow response rates in our tests and will be unsatisfactory for gamers. In comparison, all tested devices range from 0.165 (minimum) to 636 (maximum) ms. » 38 % of all devices are better. This means that the measured response time is similar to the average of all tested devices (32.5 ms). | ||
Screen Flickering / PWM (Pulse-Width Modulation)
| Screen flickering / PWM not detected | 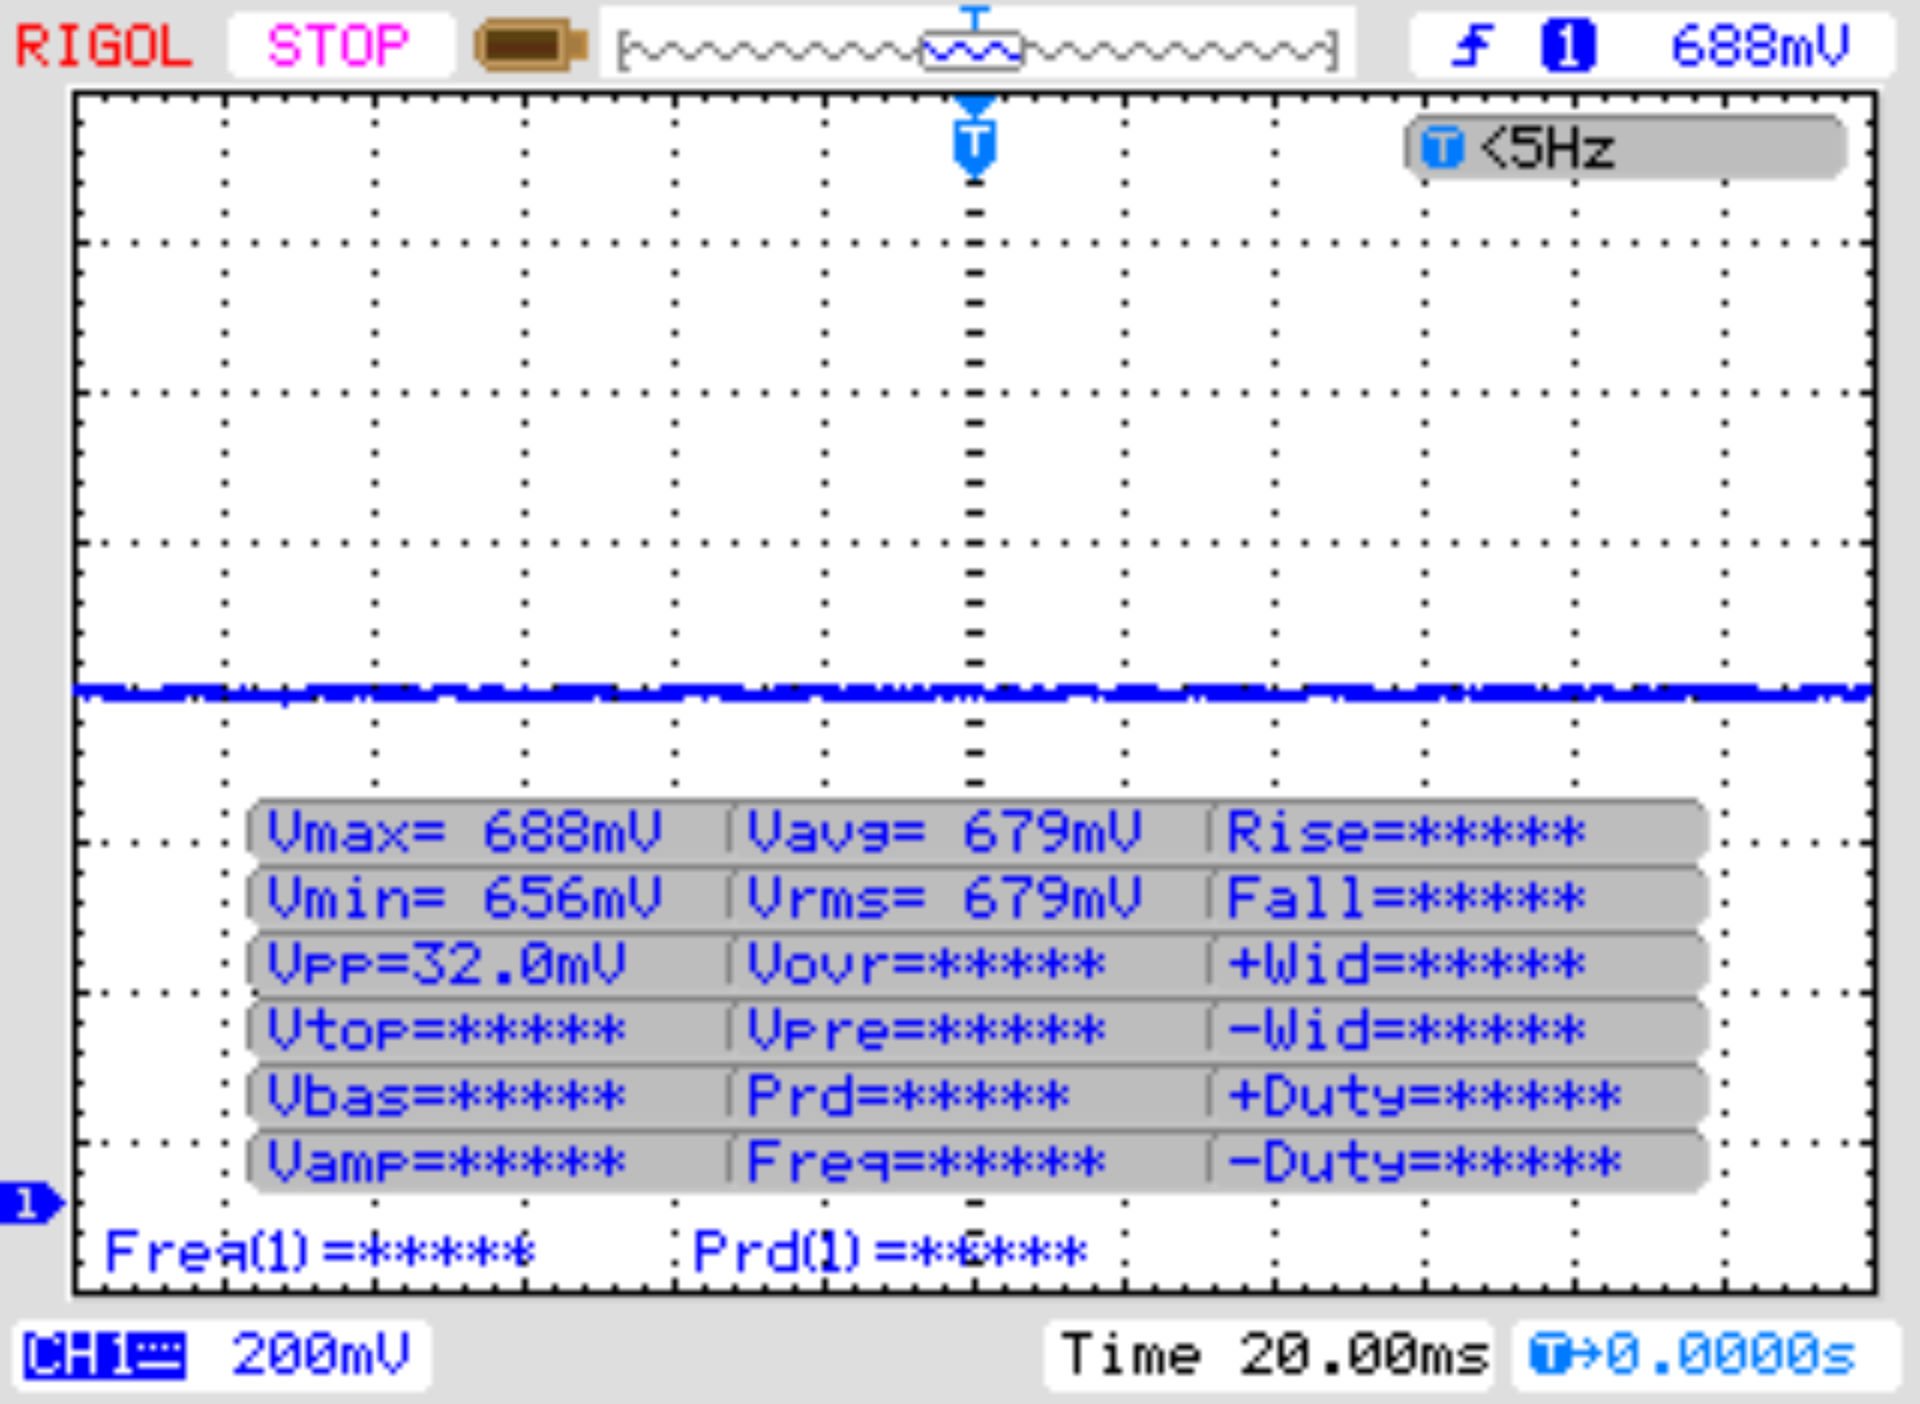 | ||
In comparison: 53 % of all tested devices do not use PWM to dim the display. If PWM was detected, an average of 8516 (minimum: 5 - maximum: 343500) Hz was measured. | |||
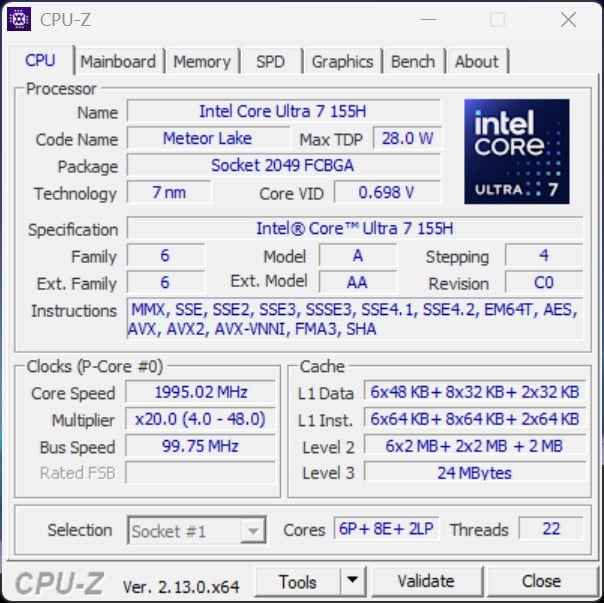
性能 - 配备 16 个内核的英特尔酷睿 Ultra 7 处理器
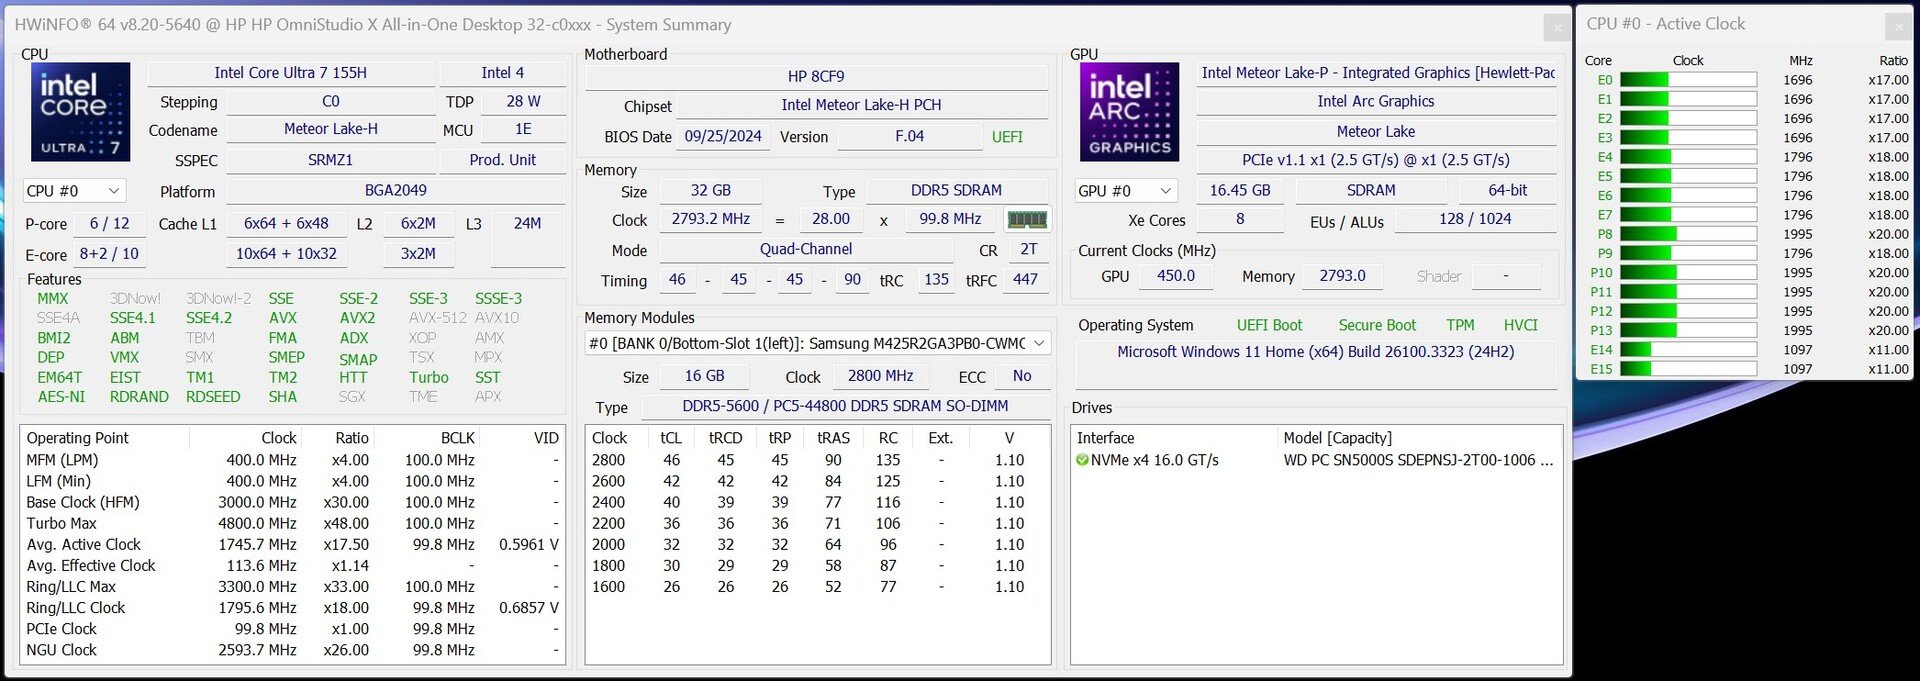
惠普 OmniStudio X 配备了英特尔酷睿 Ultra 7 155H,因此具有良好的计算能力、高效的多任务处理能力和现代人工智能功能。这样的组合对要求苛刻的用户特别有吸引力。安装了 NvidiaGeForce RTX 4050 笔记本电脑,用于 3D 计算。如果省略专用 GPU,惠普 OmniStudio X 的价格略低。
测试条件
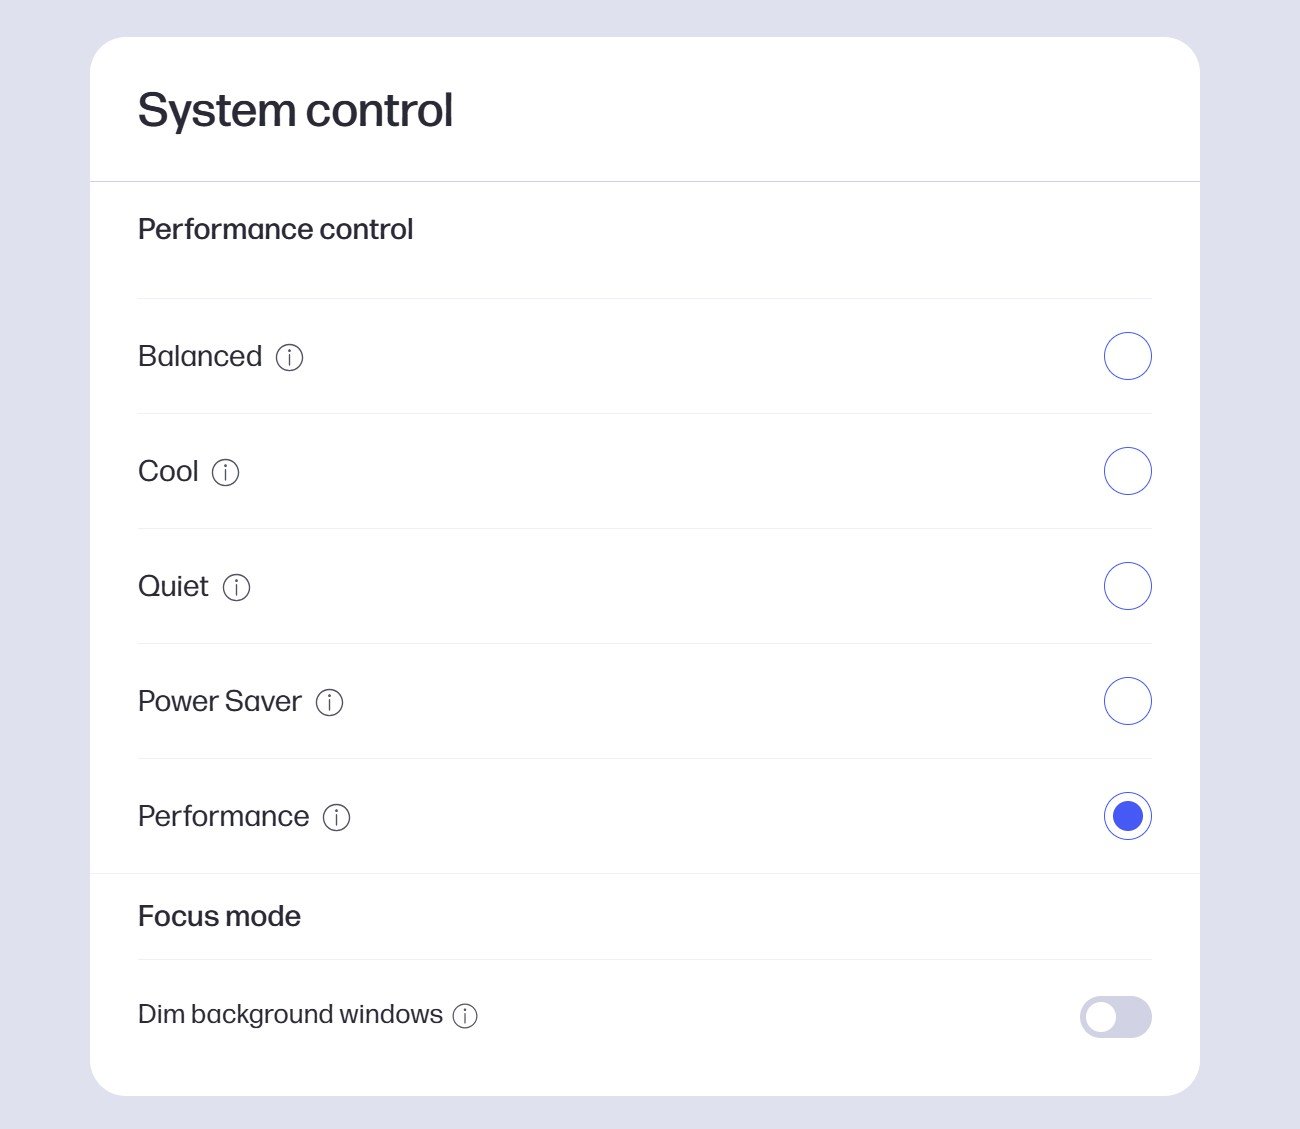
可通过 myHP 应用程序选择多种电源模式。我们使用性能模式进行了所有性能测试。使用该电源配置文件,NvidiaGeForce RTX 4050 笔记本电脑的运行功耗可达 60 瓦。在平衡模式下,专用显卡的功耗降至 35 瓦。
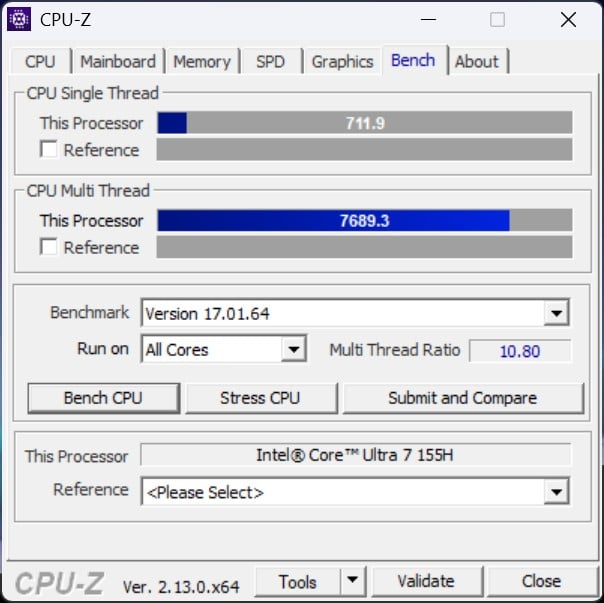
处理器
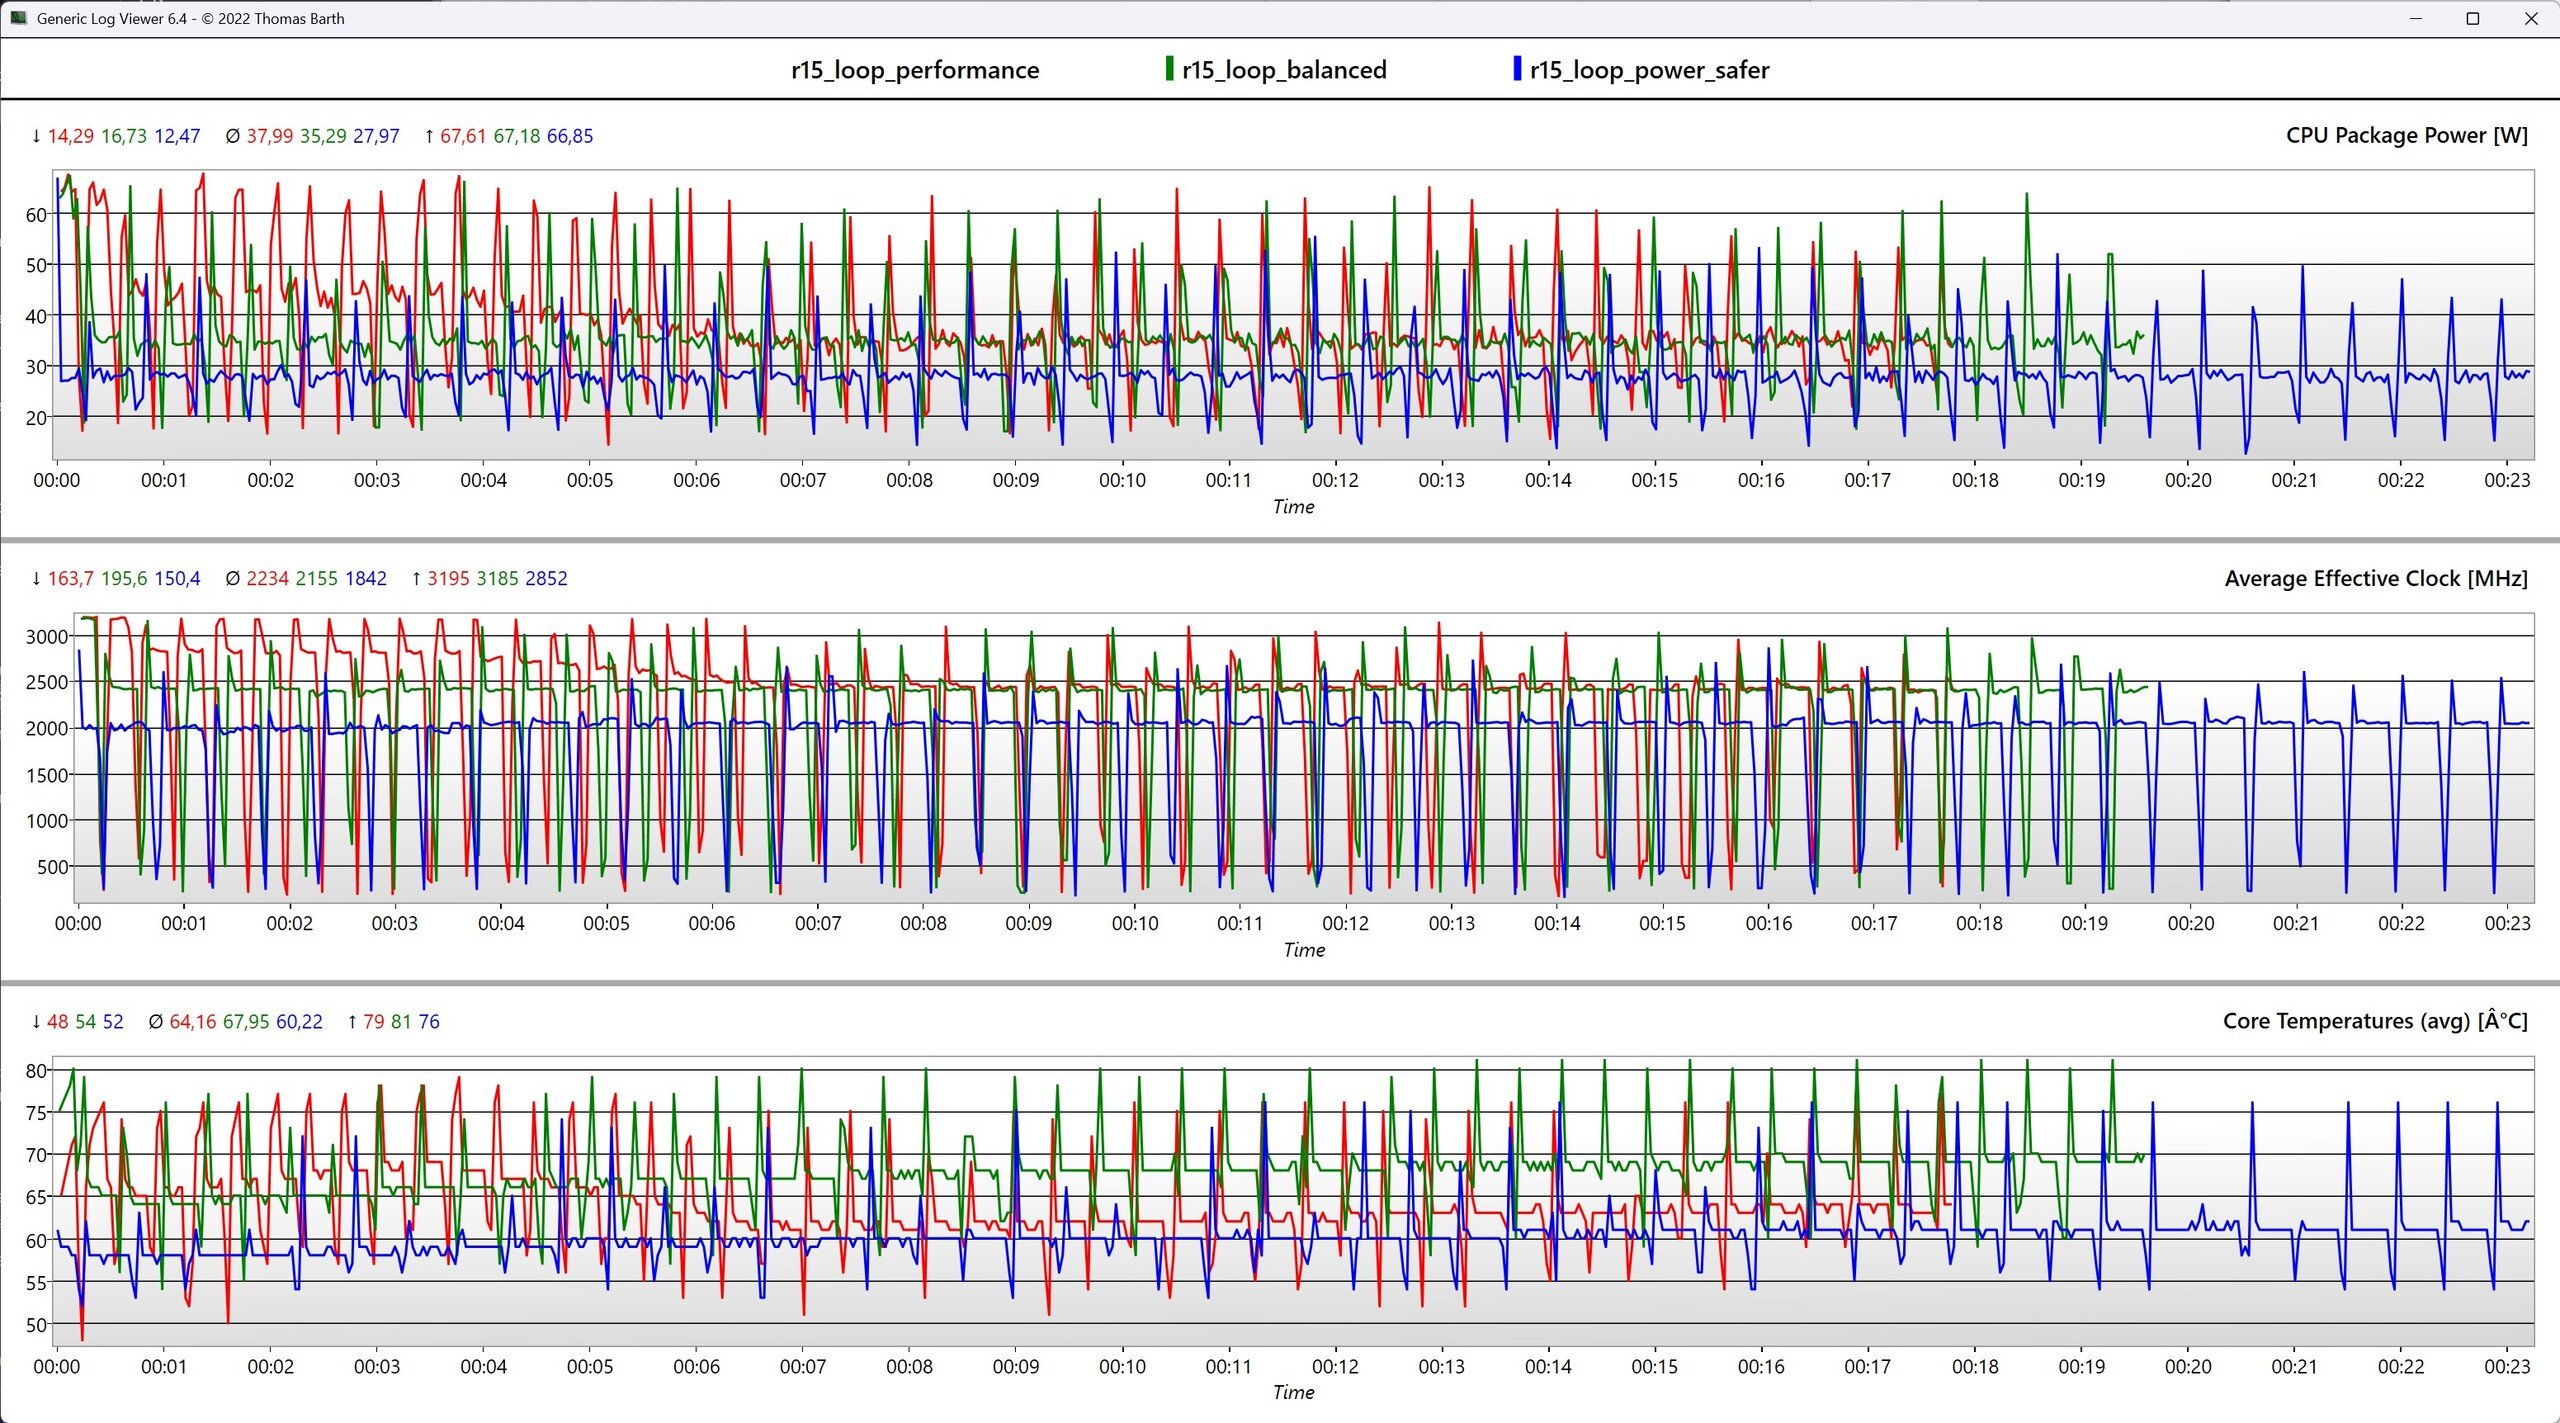
英特尔 英特尔酷睿 7 155HHP OmniStudio X 内置的英特尔酷睿 Ultra 7 155H 处理器拥有 16 个内核和 22 个线程,可为创意应用程序提供足够的性能。该处理器的时钟频率高达 4.8 GHz,性能符合我们的平均测试结果。在基准测试中,无论是单核还是多核任务,它都取得了不错的成绩,但无法与 AMD Ryzen 7 8845HS 的性能相提并论。
| 电源模式 | Cinebench R15 1T | Cinebench R15 nT | Cinebench R20 1T | Cinebench R20 nT | Cinebench R23 1T | Cinebench R23 nT |
|---|---|---|---|---|---|---|
| 省电型 | 206 | 2,140 | 576 | 4,705 | 1,362 | 13,318 |
| 平衡 | 238 | 2,378 | 653 | 5,505 | 1,708 | 14,199 |
| 绩效 | 246 | 2,652 | 674 | 5,710 | 1,722 | 16,119 |
Cinebench R23: Multi Core | Single Core
Cinebench R20: CPU (Multi Core) | CPU (Single Core)
Cinebench R15: CPU Multi 64Bit | CPU Single 64Bit
7-Zip 18.03: 7z b 4 | 7z b 4 -mmt1
Geekbench 6.4: Multi-Core | Single-Core
Geekbench 5.5: Multi-Core | Single-Core
HWBOT x265 Benchmark v2.2: 4k Preset
LibreOffice : 20 Documents To PDF
R Benchmark 2.5: Overall mean
| CPU Performance Rating | |
| Average AMD Ryzen 7 8845HS | |
| Average Intel Core Ultra 7 155H | |
| HP OmniStudio X 32-c0077ng | |
| Average AMD Ryzen 9 6900HX | |
| Average Intel Core Ultra 5 125H | |
| Average Intel Core i7-11800H | |
| Cinebench R23 / Multi Core | |
| Average AMD Ryzen 7 8845HS (14895 - 18037, n=12) | |
| HP OmniStudio X 32-c0077ng | |
| Average Intel Core Ultra 7 155H (9769 - 19007, n=52) | |
| Average AMD Ryzen 9 6900HX (9709 - 15100, n=19) | |
| Average Intel Core Ultra 5 125H (9194 - 14564, n=6) | |
| Average Intel Core i7-11800H (6508 - 14088, n=48) | |
| Cinebench R23 / Single Core | |
| Average AMD Ryzen 7 8845HS (1623 - 1783, n=12) | |
| Average Intel Core Ultra 7 155H (1496 - 1815, n=52) | |
| HP OmniStudio X 32-c0077ng | |
| Average Intel Core Ultra 5 125H (1549 - 1735, n=6) | |
| Average AMD Ryzen 9 6900HX (1516 - 1616, n=19) | |
| Average Intel Core i7-11800H (1386 - 1522, n=45) | |
| Cinebench R20 / CPU (Multi Core) | |
| Average AMD Ryzen 7 8845HS (5808 - 7026, n=12) | |
| Average Intel Core Ultra 7 155H (3798 - 7409, n=50) | |
| HP OmniStudio X 32-c0077ng | |
| Average AMD Ryzen 9 6900HX (3742 - 5813, n=19) | |
| Average Intel Core Ultra 5 125H (3673 - 5618, n=6) | |
| Average Intel Core i7-11800H (2498 - 5408, n=50) | |
| Cinebench R20 / CPU (Single Core) | |
| Average AMD Ryzen 7 8845HS (673 - 698, n=12) | |
| HP OmniStudio X 32-c0077ng | |
| Average Intel Core Ultra 7 155H (601 - 696, n=50) | |
| Average Intel Core Ultra 5 125H (622 - 664, n=6) | |
| Average AMD Ryzen 9 6900HX (595 - 631, n=19) | |
| Average Intel Core i7-11800H (520 - 586, n=47) | |
| Cinebench R15 / CPU Multi 64Bit | |
| HP OmniStudio X 32-c0077ng | |
| Average AMD Ryzen 7 8845HS (2342 - 2908, n=12) | |
| Average Intel Core Ultra 7 155H (1932 - 2880, n=56) | |
| Average AMD Ryzen 9 6900HX (1588 - 2411, n=19) | |
| Average Intel Core Ultra 5 125H (1700 - 2245, n=6) | |
| Average Intel Core i7-11800H (1342 - 2173, n=50) | |
| Cinebench R15 / CPU Single 64Bit | |
| Average AMD Ryzen 7 8845HS (269 - 283, n=12) | |
| Average AMD Ryzen 9 6900HX (241 - 261, n=19) | |
| Average Intel Core Ultra 7 155H (99.6 - 268, n=52) | |
| HP OmniStudio X 32-c0077ng | |
| Average Intel Core Ultra 5 125H (235 - 251, n=6) | |
| Average Intel Core i7-11800H (201 - 231, n=46) | |
| 7-Zip 18.03 / 7z b 4 | |
| Average AMD Ryzen 7 8845HS (62669 - 74664, n=12) | |
| HP OmniStudio X 32-c0077ng | |
| Average AMD Ryzen 9 6900HX (49526 - 65336, n=20) | |
| Average Intel Core Ultra 7 155H (41739 - 70254, n=50) | |
| Average Intel Core i7-11800H (33718 - 56758, n=46) | |
| Average Intel Core Ultra 5 125H (0 - 0, n=2) | |
| 7-Zip 18.03 / 7z b 4 -mmt1 | |
| Average AMD Ryzen 7 8845HS (5197 - 6714, n=12) | |
| Average AMD Ryzen 9 6900HX (5090 - 6070, n=20) | |
| Average Intel Core i7-11800H (5138 - 5732, n=46) | |
| Average Intel Core Ultra 7 155H (4594 - 5621, n=50) | |
| HP OmniStudio X 32-c0077ng | |
| Average Intel Core Ultra 5 125H (4663 - 5136, n=6) | |
| Geekbench 6.4 / Multi-Core | |
| Average AMD Ryzen 7 8845HS (11073 - 14014, n=16) | |
| HP OmniStudio X 32-c0077ng | |
| Average Intel Core Ultra 7 155H (7732 - 13656, n=55) | |
| Average Intel Core Ultra 5 125H (11087 - 11749, n=6) | |
| Average AMD Ryzen 9 6900HX (n=1) | |
| Average Intel Core i7-11800H (8860 - 9647, n=2) | |
| Geekbench 6.4 / Single-Core | |
| Average AMD Ryzen 7 8845HS (2510 - 2698, n=14) | |
| HP OmniStudio X 32-c0077ng | |
| Average Intel Core Ultra 7 155H (1901 - 2473, n=52) | |
| Average Intel Core Ultra 5 125H (2199 - 2316, n=6) | |
| Average Intel Core i7-11800H (2165 - 2220, n=2) | |
| Average AMD Ryzen 9 6900HX (n=1) | |
| Geekbench 5.5 / Multi-Core | |
| HP OmniStudio X 32-c0077ng | |
| Average Intel Core Ultra 7 155H (10017 - 13556, n=52) | |
| Average AMD Ryzen 7 8845HS (11256 - 12726, n=13) | |
| Average Intel Core Ultra 5 125H (9696 - 10856, n=6) | |
| Average AMD Ryzen 9 6900HX (8313 - 10490, n=21) | |
| Average Intel Core i7-11800H (4655 - 9851, n=40) | |
| Geekbench 5.5 / Single-Core | |
| Average AMD Ryzen 7 8845HS (1765 - 2004, n=13) | |
| HP OmniStudio X 32-c0077ng | |
| Average Intel Core Ultra 7 155H (1462 - 1824, n=52) | |
| Average Intel Core Ultra 5 125H (1593 - 1699, n=6) | |
| Average AMD Ryzen 9 6900HX (1523 - 1652, n=21) | |
| Average Intel Core i7-11800H (1429 - 1625, n=40) | |
| HWBOT x265 Benchmark v2.2 / 4k Preset | |
| Average AMD Ryzen 7 8845HS (18.6 - 22.7, n=12) | |
| HP OmniStudio X 32-c0077ng | |
| Average AMD Ryzen 9 6900HX (12.6 - 18.7, n=20) | |
| Average Intel Core Ultra 7 155H (9.93 - 21.2, n=50) | |
| Average Intel Core i7-11800H (7.38 - 17.4, n=46) | |
| Average Intel Core Ultra 5 125H (9.7 - 16.7, n=6) | |
| LibreOffice / 20 Documents To PDF | |
| HP OmniStudio X 32-c0077ng | |
| Average Intel Core Ultra 5 125H (42.7 - 70.9, n=6) | |
| Average AMD Ryzen 9 6900HX (44.8 - 81.7, n=20) | |
| Average AMD Ryzen 7 8845HS (44.4 - 77, n=12) | |
| Average Intel Core Ultra 7 155H (37.5 - 79.2, n=49) | |
| Average Intel Core i7-11800H (38.6 - 59.9, n=45) | |
| R Benchmark 2.5 / Overall mean | |
| Average Intel Core i7-11800H (0.548 - 0.615, n=46) | |
| Average Intel Core Ultra 5 125H (0.4898 - 0.53, n=6) | |
| HP OmniStudio X 32-c0077ng | |
| Average AMD Ryzen 9 6900HX (0.4627 - 0.4974, n=20) | |
| Average Intel Core Ultra 7 155H (0.4457 - 0.53, n=49) | |
| Average AMD Ryzen 7 8845HS (0.4304 - 0.4935, n=12) | |
* ... smaller is better
Cinebench R15 Multi continuous test
AIDA64: FP32 Ray-Trace | FPU Julia | CPU SHA3 | CPU Queen | FPU SinJulia | FPU Mandel | CPU AES | CPU ZLib | FP64 Ray-Trace | CPU PhotoWorxx
| Performance Rating | |
| Average AMD Ryzen 7 8845HS | |
| Average AMD Ryzen 9 6900HX | |
| Average Intel Core Ultra 7 155H | |
| HP OmniStudio X 32-c0077ng | |
| Average Intel Core i7-11800H | |
| Average Intel Core Ultra 5 125H | |
| AIDA64 / FP32 Ray-Trace | |
| Average AMD Ryzen 7 8845HS (23708 - 29544, n=12) | |
| Average AMD Ryzen 9 6900HX (10950 - 17963, n=20) | |
| Average Intel Core i7-11800H (8772 - 15961, n=20) | |
| Average Intel Core Ultra 7 155H (6670 - 18470, n=50) | |
| HP OmniStudio X 32-c0077ng | |
| Average Intel Core Ultra 5 125H (8430 - 13639, n=6) | |
| AIDA64 / FPU Julia | |
| Average AMD Ryzen 7 8845HS (99659 - 125873, n=12) | |
| Average AMD Ryzen 9 6900HX (71414 - 110797, n=20) | |
| Average Intel Core Ultra 7 155H (40905 - 93181, n=50) | |
| HP OmniStudio X 32-c0077ng | |
| Average Intel Core i7-11800H (39404 - 65636, n=20) | |
| Average Intel Core Ultra 5 125H (43652 - 70880, n=6) | |
| AIDA64 / CPU SHA3 | |
| Average AMD Ryzen 7 8845HS (4332 - 5180, n=12) | |
| Average Intel Core i7-11800H (2599 - 4439, n=20) | |
| Average AMD Ryzen 9 6900HX (2471 - 3804, n=20) | |
| Average Intel Core Ultra 7 155H (1940 - 4436, n=50) | |
| HP OmniStudio X 32-c0077ng | |
| Average Intel Core Ultra 5 125H (2047 - 3404, n=6) | |
| AIDA64 / CPU Queen | |
| Average AMD Ryzen 7 8845HS (109458 - 124695, n=12) | |
| Average AMD Ryzen 9 6900HX (84185 - 107544, n=20) | |
| Average Intel Core i7-11800H (85233 - 91941, n=20) | |
| Average Intel Core Ultra 7 155H (64698 - 94181, n=50) | |
| Average Intel Core Ultra 5 125H (77892 - 79986, n=6) | |
| HP OmniStudio X 32-c0077ng | |
| AIDA64 / FPU SinJulia | |
| Average AMD Ryzen 7 8845HS (14062 - 15519, n=12) | |
| Average AMD Ryzen 9 6900HX (10970 - 13205, n=20) | |
| Average Intel Core i7-11800H (6420 - 9792, n=20) | |
| Average Intel Core Ultra 7 155H (5639 - 10647, n=50) | |
| HP OmniStudio X 32-c0077ng | |
| Average Intel Core Ultra 5 125H (6588 - 7851, n=6) | |
| AIDA64 / FPU Mandel | |
| Average AMD Ryzen 7 8845HS (53436 - 67367, n=12) | |
| Average AMD Ryzen 9 6900HX (39164 - 61370, n=20) | |
| Average Intel Core i7-11800H (23365 - 39464, n=20) | |
| Average Intel Core Ultra 7 155H (18236 - 47685, n=50) | |
| HP OmniStudio X 32-c0077ng | |
| Average Intel Core Ultra 5 125H (21210 - 35321, n=6) | |
| AIDA64 / CPU AES | |
| Average Intel Core i7-11800H (74617 - 149388, n=20) | |
| Average AMD Ryzen 9 6900HX (54613 - 142360, n=20) | |
| Average AMD Ryzen 7 8845HS (64515 - 172642, n=12) | |
| Average Intel Core Ultra 7 155H (45713 - 152179, n=50) | |
| Average Intel Core Ultra 5 125H (45524 - 108402, n=6) | |
| HP OmniStudio X 32-c0077ng | |
| AIDA64 / CPU ZLib | |
| Average AMD Ryzen 7 8845HS (627 - 1080, n=12) | |
| Average Intel Core Ultra 7 155H (557 - 1250, n=50) | |
| HP OmniStudio X 32-c0077ng | |
| Average Intel Core Ultra 5 125H (594 - 994, n=6) | |
| Average AMD Ryzen 9 6900HX (578 - 911, n=20) | |
| Average Intel Core i7-11800H (461 - 830, n=43) | |
| AIDA64 / FP64 Ray-Trace | |
| Average AMD Ryzen 7 8845HS (12361 - 15911, n=12) | |
| Average AMD Ryzen 9 6900HX (5798 - 9540, n=20) | |
| Average Intel Core i7-11800H (4545 - 8717, n=21) | |
| Average Intel Core Ultra 7 155H (3569 - 9802, n=50) | |
| HP OmniStudio X 32-c0077ng | |
| Average Intel Core Ultra 5 125H (4345 - 7221, n=6) | |
| AIDA64 / CPU PhotoWorxx | |
| Average Intel Core Ultra 5 125H (45724 - 49844, n=6) | |
| Average Intel Core Ultra 7 155H (32719 - 54223, n=50) | |
| HP OmniStudio X 32-c0077ng | |
| Average AMD Ryzen 7 8845HS (33192 - 41668, n=12) | |
| Average AMD Ryzen 9 6900HX (26873 - 30604, n=20) | |
| Average Intel Core i7-11800H (11898 - 26757, n=21) | |
系统性能
惠普 OmniStudio X 一体机提供强大的系统性能,足以满足创意和生产应用的需要。英特尔酷睿 7 155H 和 NvidiaGeForce RTX 4050 笔记本电脑的组合具有足够的储备,即使是耗电的任务也能应付自如。得益于其 4K 显示屏,它是图像和视频编辑的理想之选。总之,它是一款功能强大的一体化系统,适合专业用户使用。
CrossMark: Overall | Productivity | Creativity | Responsiveness
WebXPRT 3: Overall
WebXPRT 4: Overall
Mozilla Kraken 1.1: Total
| PCMark 10 / Score | |
| Average AMD Ryzen 7 8845HS (7120 - 8822, n=13) | |
| HP OmniStudio X 32-c0077ng | |
| Average AMD Ryzen 9 6900HX (6251 - 7669, n=21) | |
| Average Intel Core Ultra 7 155H, NVIDIA GeForce RTX 4050 Laptop GPU (6537 - 6973, n=5) | |
| Average Intel Core Ultra 7 155H (4809 - 7761, n=51) | |
| Average Intel Core i7-11800H (4960 - 7470, n=40) | |
| Average Intel Core Ultra 5 125H (6194 - 6463, n=7) | |
| PCMark 10 / Essentials | |
| Average AMD Ryzen 7 8845HS (9936 - 11570, n=13) | |
| Average Intel Core Ultra 7 155H (7605 - 11289, n=51) | |
| Average AMD Ryzen 9 6900HX (9374 - 11323, n=21) | |
| Average Intel Core Ultra 7 155H, NVIDIA GeForce RTX 4050 Laptop GPU (9463 - 10446, n=5) | |
| Average Intel Core i7-11800H (8472 - 11064, n=40) | |
| Average Intel Core Ultra 5 125H (9184 - 10697, n=7) | |
| HP OmniStudio X 32-c0077ng | |
| PCMark 10 / Productivity | |
| Average AMD Ryzen 7 8845HS (9631 - 14612, n=13) | |
| Average AMD Ryzen 9 6900HX (7704 - 10210, n=21) | |
| HP OmniStudio X 32-c0077ng | |
| Average Intel Core Ultra 7 155H, NVIDIA GeForce RTX 4050 Laptop GPU (8769 - 9272, n=5) | |
| Average Intel Core Ultra 7 155H (6042 - 10591, n=51) | |
| Average Intel Core i7-11800H (6562 - 9803, n=40) | |
| Average Intel Core Ultra 5 125H (7042 - 8538, n=7) | |
| PCMark 10 / Digital Content Creation | |
| Average AMD Ryzen 7 8845HS (9009 - 13528, n=13) | |
| HP OmniStudio X 32-c0077ng | |
| Average AMD Ryzen 9 6900HX (6920 - 11572, n=21) | |
| Average Intel Core Ultra 7 155H, NVIDIA GeForce RTX 4050 Laptop GPU (8602 - 10622, n=5) | |
| Average Intel Core Ultra 7 155H (4985 - 13035, n=51) | |
| Average Intel Core i7-11800H (5081 - 11323, n=40) | |
| Average Intel Core Ultra 5 125H (8198 - 9506, n=7) | |
| CrossMark / Overall | |
| Average AMD Ryzen 7 8845HS (1531 - 1939, n=11) | |
| HP OmniStudio X 32-c0077ng | |
| Average Intel Core Ultra 7 155H (1366 - 1903, n=50) | |
| Average Intel Core Ultra 7 155H, NVIDIA GeForce RTX 4050 Laptop GPU (1552 - 1740, n=5) | |
| Average AMD Ryzen 9 6900HX (1476 - 1743, n=16) | |
| Average Intel Core Ultra 5 125H (1522 - 1633, n=5) | |
| Average Intel Core i7-11800H (1367 - 1683, n=9) | |
| CrossMark / Productivity | |
| Average AMD Ryzen 7 8845HS (1488 - 1872, n=11) | |
| Average AMD Ryzen 9 6900HX (1451 - 1738, n=16) | |
| Average Intel Core Ultra 7 155H (1291 - 1798, n=49) | |
| HP OmniStudio X 32-c0077ng | |
| Average Intel Core Ultra 7 155H, NVIDIA GeForce RTX 4050 Laptop GPU (1459 - 1659, n=5) | |
| Average Intel Core i7-11800H (1389 - 1660, n=9) | |
| Average Intel Core Ultra 5 125H (1432 - 1594, n=5) | |
| CrossMark / Creativity | |
| HP OmniStudio X 32-c0077ng | |
| Average AMD Ryzen 7 8845HS (1683 - 2102, n=11) | |
| Average Intel Core Ultra 7 155H, NVIDIA GeForce RTX 4050 Laptop GPU (1811 - 1943, n=5) | |
| Average Intel Core Ultra 7 155H (1519 - 2014, n=49) | |
| Average Intel Core Ultra 5 125H (1683 - 1765, n=5) | |
| Average AMD Ryzen 9 6900HX (1632 - 1867, n=16) | |
| Average Intel Core i7-11800H (1430 - 1728, n=9) | |
| CrossMark / Responsiveness | |
| Average AMD Ryzen 7 8845HS (1255 - 1849, n=11) | |
| Average Intel Core Ultra 7 155H (939 - 1802, n=49) | |
| Average AMD Ryzen 9 6900HX (1060 - 1715, n=16) | |
| HP OmniStudio X 32-c0077ng | |
| Average Intel Core i7-11800H (1038 - 1633, n=9) | |
| Average Intel Core Ultra 5 125H (1171 - 1520, n=5) | |
| Average Intel Core Ultra 7 155H, NVIDIA GeForce RTX 4050 Laptop GPU (1167 - 1467, n=5) | |
| WebXPRT 3 / Overall | |
| Average AMD Ryzen 7 8845HS (275 - 334, n=12) | |
| Average AMD Ryzen 9 6900HX (248 - 304, n=17) | |
| Average Intel Core Ultra 7 155H (213 - 299, n=50) | |
| Average Intel Core Ultra 7 155H, NVIDIA GeForce RTX 4050 Laptop GPU (262 - 285, n=5) | |
| Average Intel Core i7-11800H (251 - 280, n=40) | |
| HP OmniStudio X 32-c0077ng | |
| Average Intel Core Ultra 5 125H (245 - 263, n=6) | |
| WebXPRT 4 / Overall | |
| Average Intel Core Ultra 7 155H, NVIDIA GeForce RTX 4050 Laptop GPU (247 - 260, n=5) | |
| Average AMD Ryzen 7 8845HS (176.4 - 314, n=11) | |
| Average Intel Core Ultra 7 155H (166.4 - 309, n=45) | |
| HP OmniStudio X 32-c0077ng | |
| Average Intel Core Ultra 5 125H (227 - 240, n=5) | |
| Average AMD Ryzen 9 6900HX (200 - 233, n=15) | |
| Average Intel Core i7-11800H (211 - 218, n=3) | |
| Mozilla Kraken 1.1 / Total | |
| Average Intel Core i7-11800H (600 - 690, n=45) | |
| Average AMD Ryzen 9 6900HX (564 - 607, n=18) | |
| Average Intel Core Ultra 5 125H (560 - 595, n=6) | |
| HP OmniStudio X 32-c0077ng | |
| Average Intel Core Ultra 7 155H (416 - 642, n=50) | |
| Average AMD Ryzen 7 8845HS (496 - 664, n=12) | |
| Average Intel Core Ultra 7 155H, NVIDIA GeForce RTX 4050 Laptop GPU (416 - 561, n=5) | |
* ... smaller is better
| PCMark 10 Score | 6956 points | |
Help | ||
| AIDA64 / Memory Copy | |
| Average Intel Core Ultra 7 155H (62397 - 96791, n=50) | |
| Average Intel Core Ultra 5 125H (67482 - 87473, n=6) | |
| HP OmniStudio X 32-c0077ng | |
| Average AMD Ryzen 7 8845HS (61459 - 71873, n=12) | |
| Average AMD Ryzen 9 6900HX (47938 - 53345, n=20) | |
| Average Intel Core i7-11800H (24508 - 48144, n=21) | |
| AIDA64 / Memory Read | |
| Average Intel Core Ultra 7 155H (60544 - 90647, n=50) | |
| HP OmniStudio X 32-c0077ng | |
| Average Intel Core Ultra 5 125H (70520 - 76803, n=6) | |
| Average AMD Ryzen 7 8845HS (49866 - 61976, n=12) | |
| Average AMD Ryzen 9 6900HX (43892 - 53321, n=20) | |
| Average Intel Core i7-11800H (25882 - 50365, n=20) | |
| AIDA64 / Memory Write | |
| Average AMD Ryzen 7 8845HS (68425 - 93239, n=12) | |
| Average Intel Core Ultra 7 155H (58692 - 93451, n=50) | |
| HP OmniStudio X 32-c0077ng | |
| Average Intel Core Ultra 5 125H (63162 - 72443, n=6) | |
| Average AMD Ryzen 9 6900HX (51085 - 57202, n=20) | |
| Average Intel Core i7-11800H (22240 - 46214, n=20) | |
| AIDA64 / Memory Latency | |
| HP OmniStudio X 32-c0077ng | |
| Average Intel Core Ultra 5 125H (127.3 - 184.8, n=6) | |
| Average Intel Core Ultra 7 155H (116.2 - 233, n=50) | |
| Average AMD Ryzen 7 8845HS (82.5 - 117, n=12) | |
| Average AMD Ryzen 9 6900HX (80.7 - 120.6, n=20) | |
| Average Intel Core i7-11800H (71.9 - 104.1, n=44) | |
* ... smaller is better
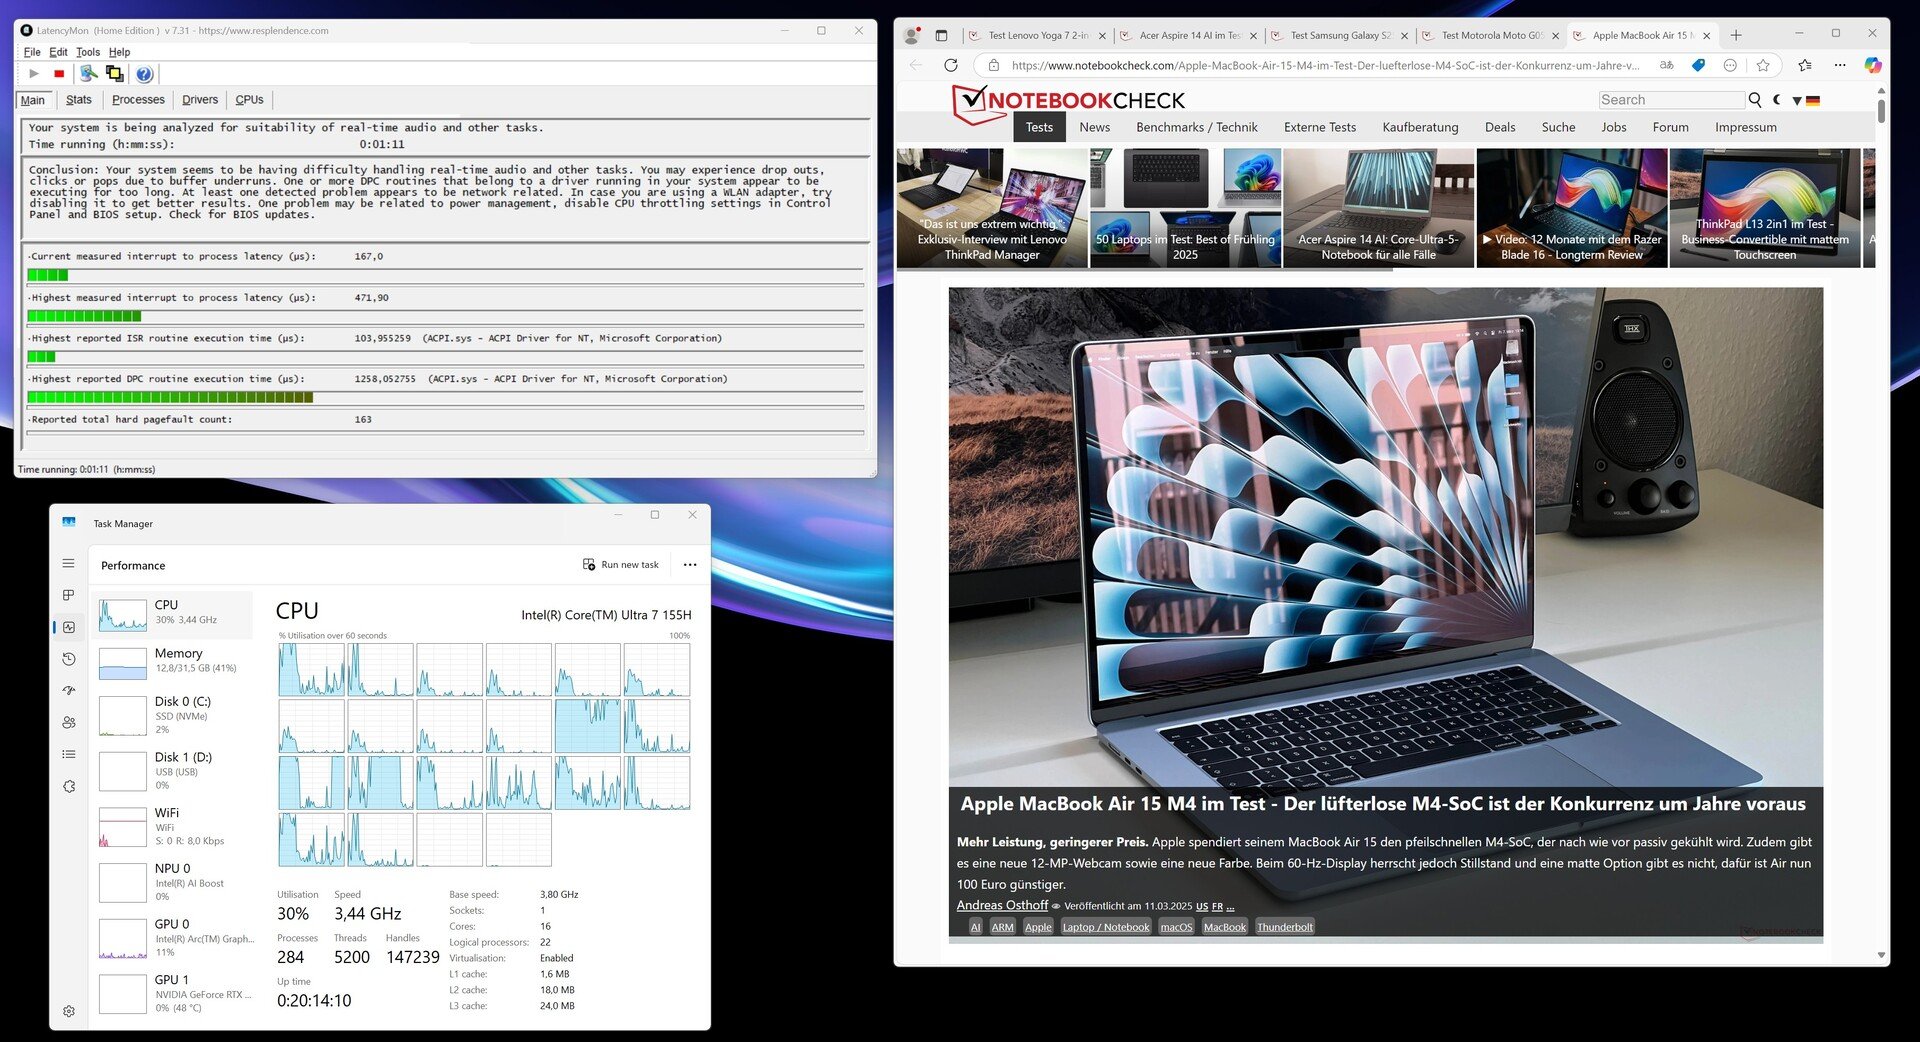
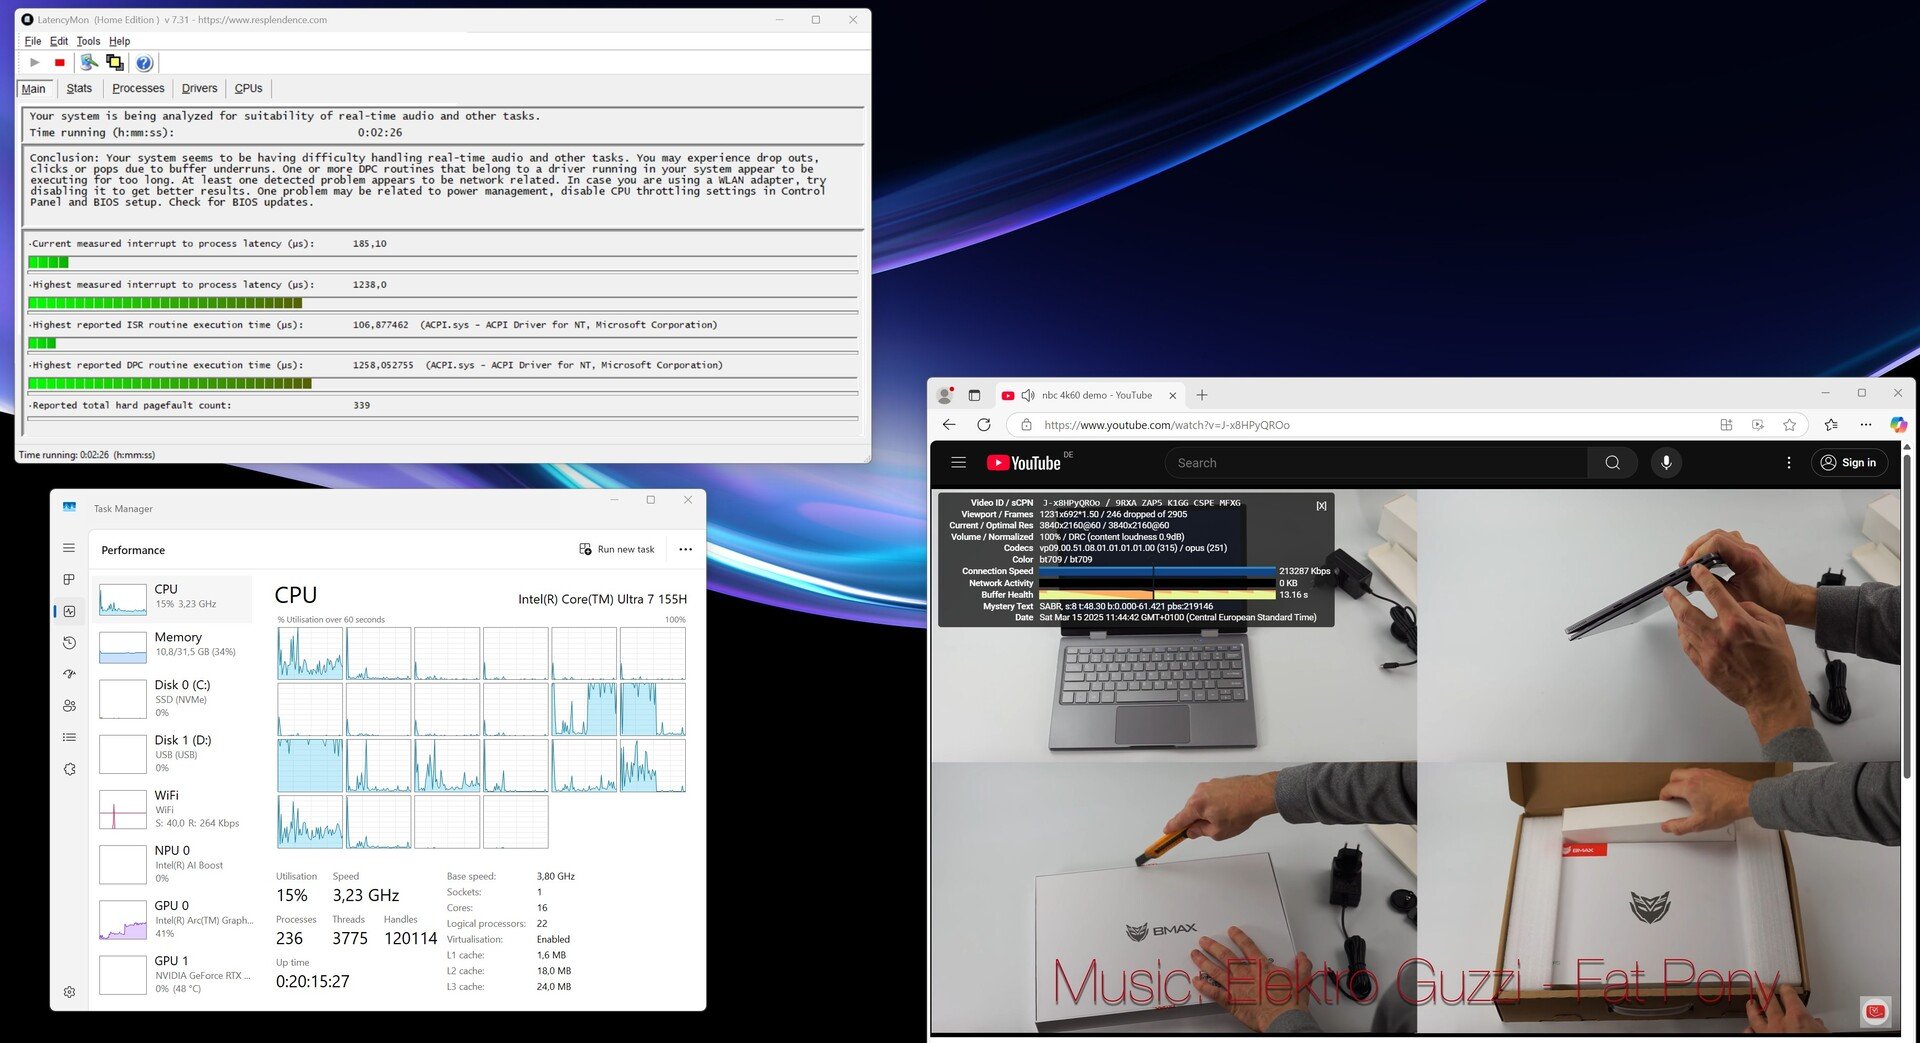
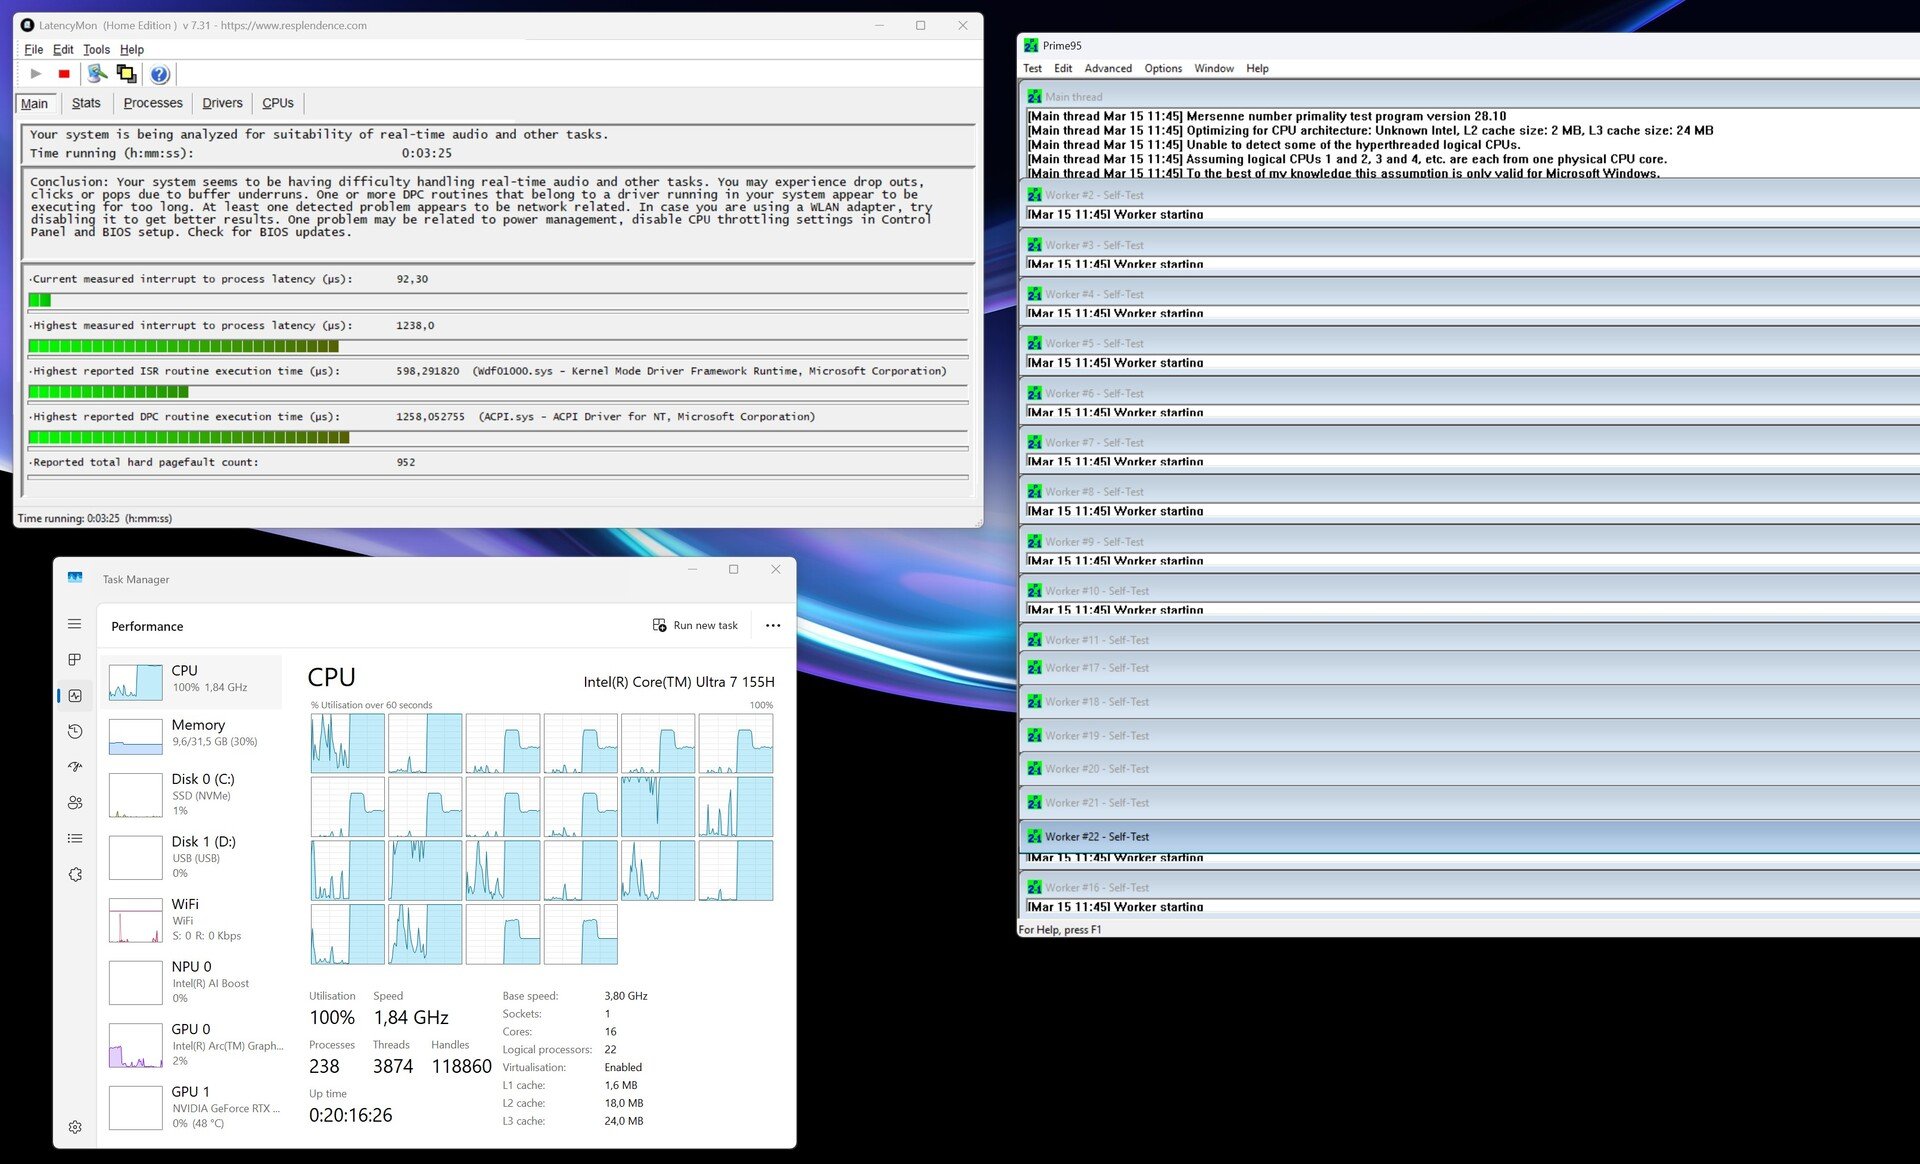
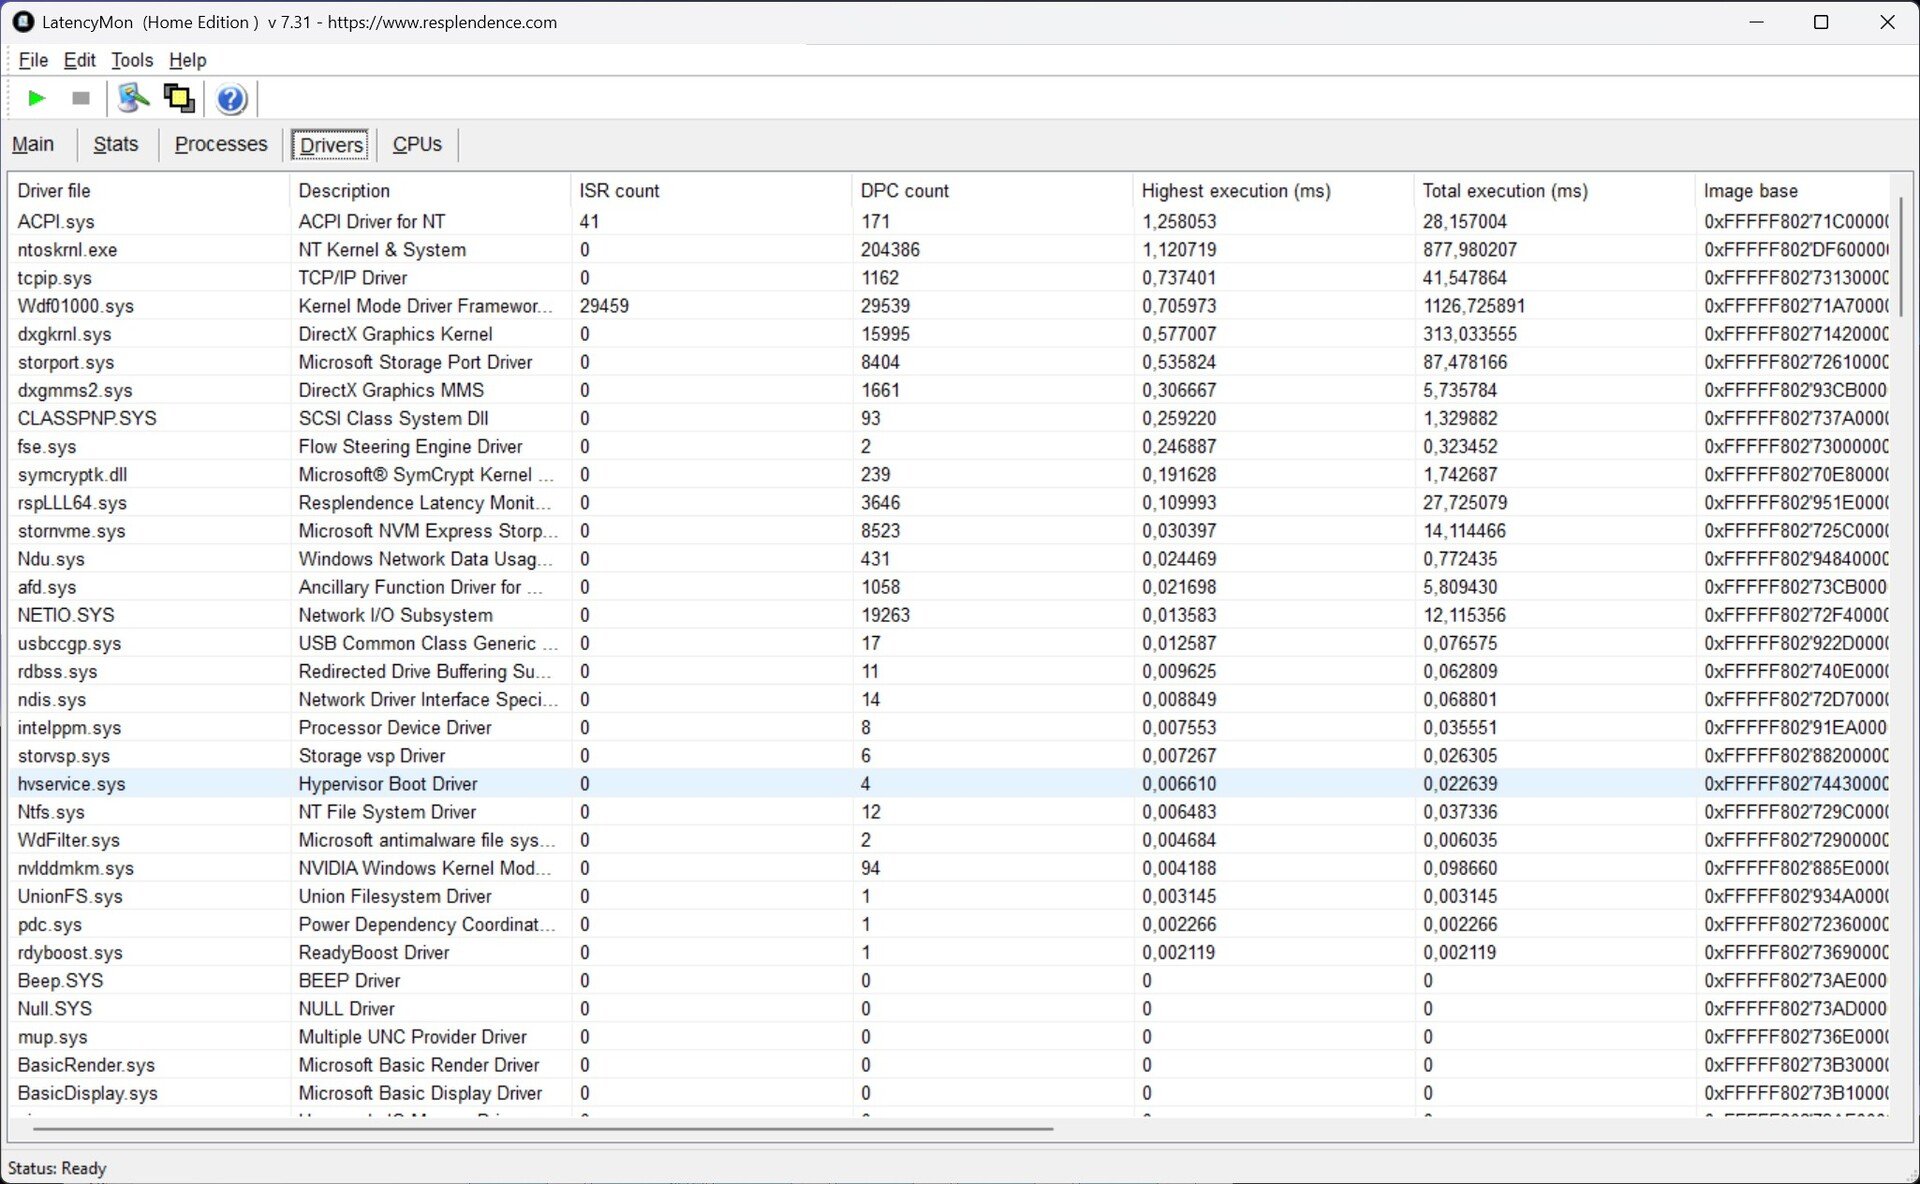
DPC 延迟
在 DPC 延迟测试中,惠普 OmniStudio X 既没有显示出严重的缺陷,也没有显示出突出的数值。我们在使用 Edge 浏览器上网时测得的延迟值最高。在播放 4K 视频时,我们发现在整个播放过程中偶尔会出现明显的丢帧现象。
| DPC Latencies / LatencyMon - interrupt to process latency (max), Web, Youtube, Prime95 | |
| Minisforum AI X1 Pro | |
| Geekom AX8 Pro | |
| HP OmniStudio X 32-c0077ng | |
| Geekom GT1 Mega | |
* ... smaller is better
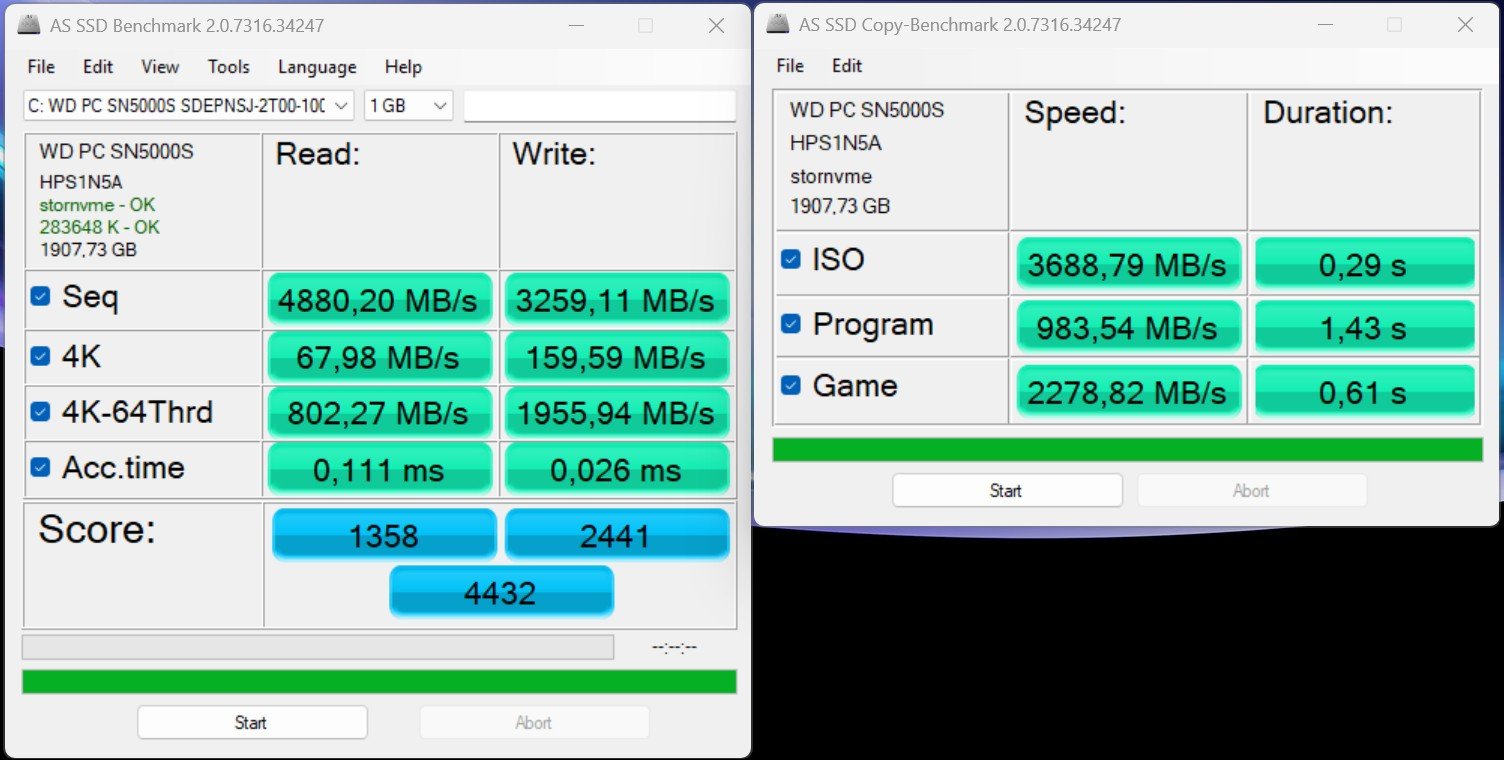
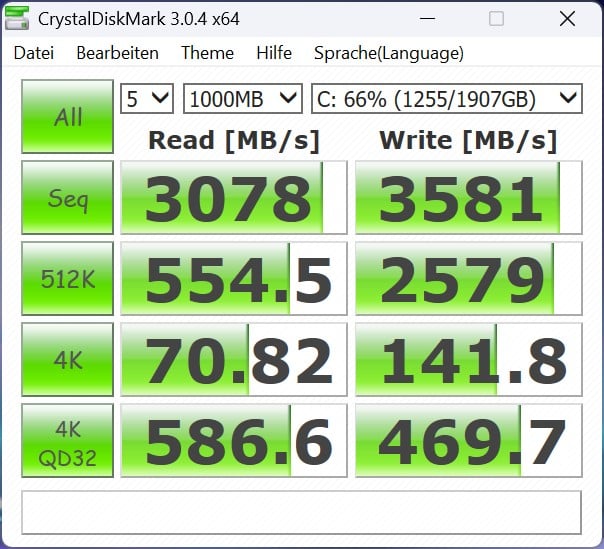
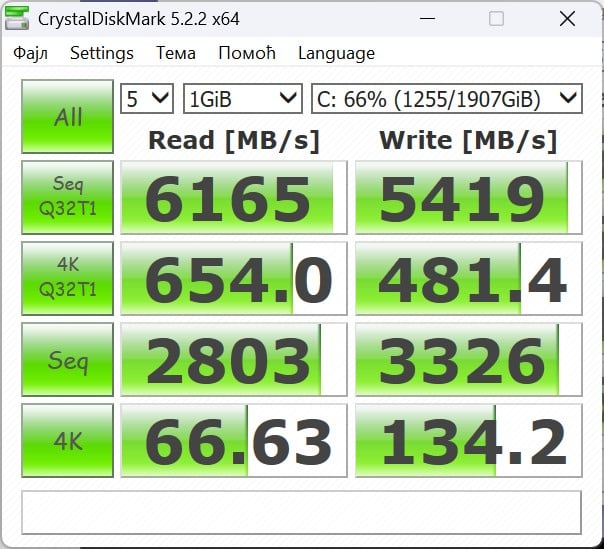
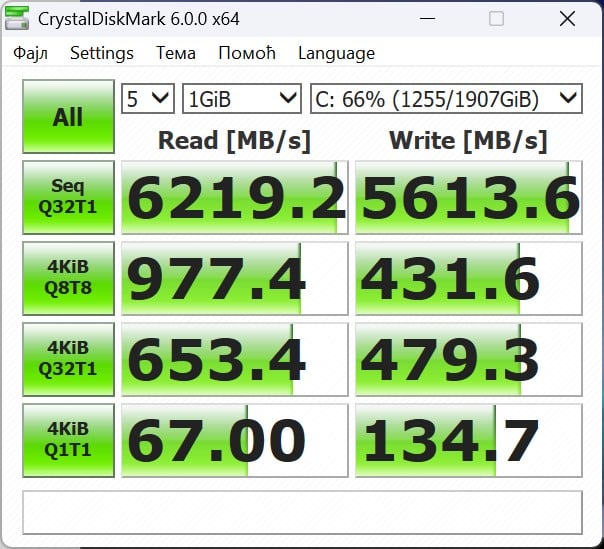
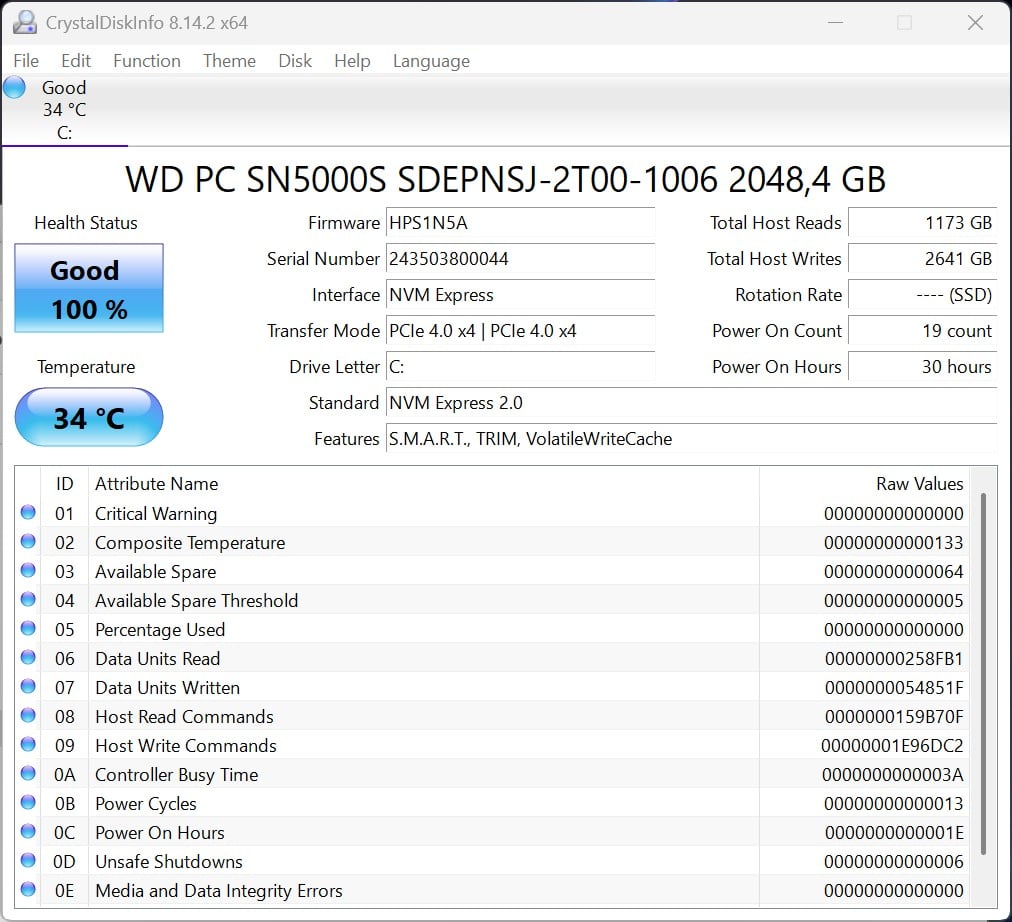
存储设备
惠普 OmniStudio X 使用西部数据公司生产的 2TB SSD。尽管机箱宽敞,但只能安装一个大容量存储设备,这大大限制了它的扩展选择。M.2 固态硬盘的冷却效率很高,即使在连续负载的情况下也不会降低性能。

Reading continuous performance: DiskSpd Read Loop, Queue Depth 8
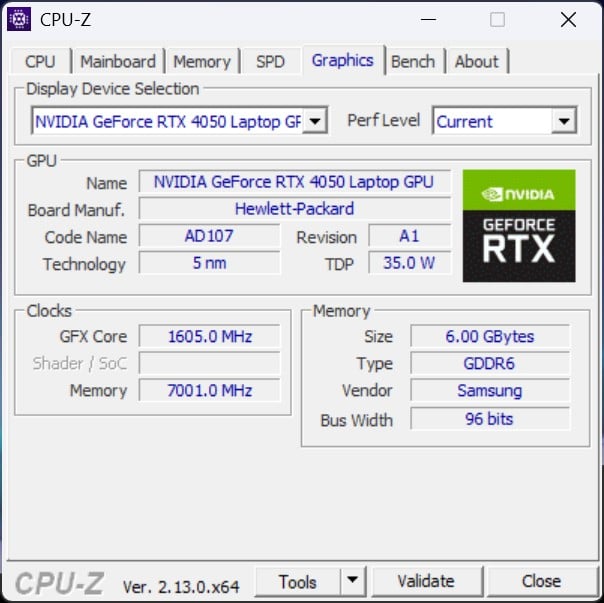
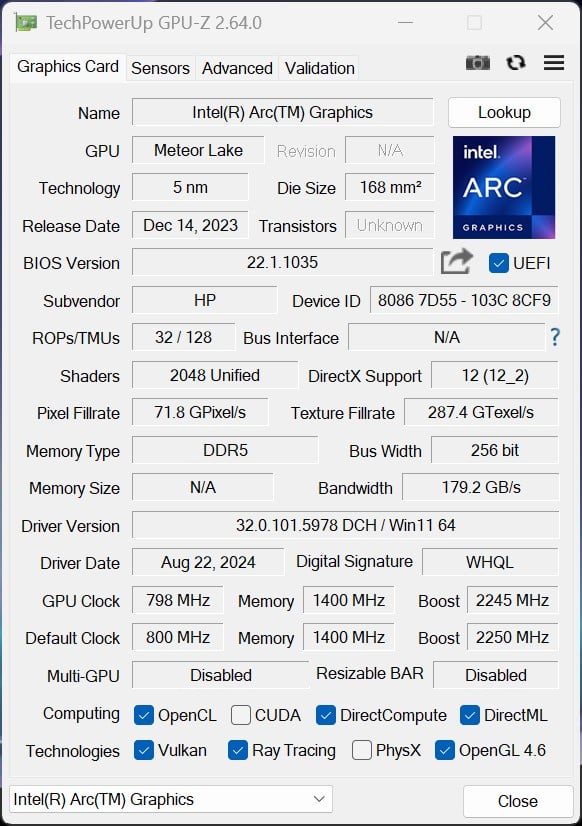
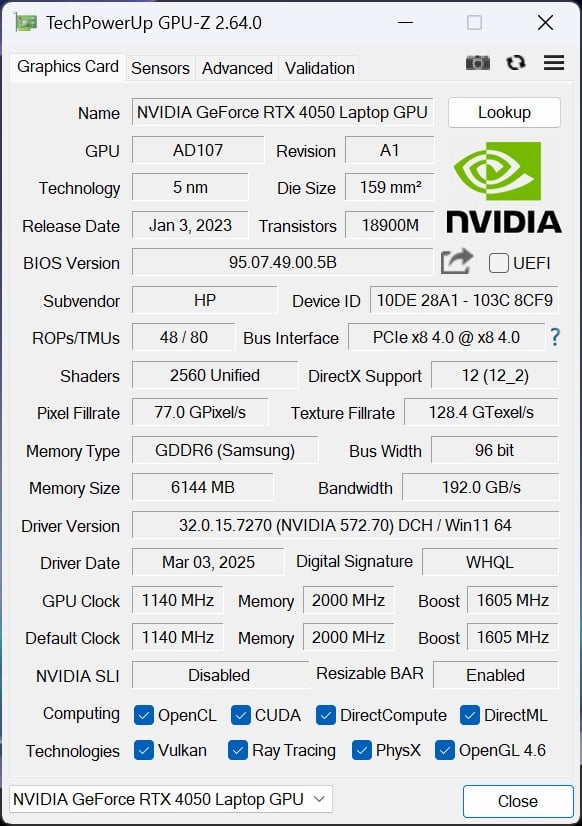
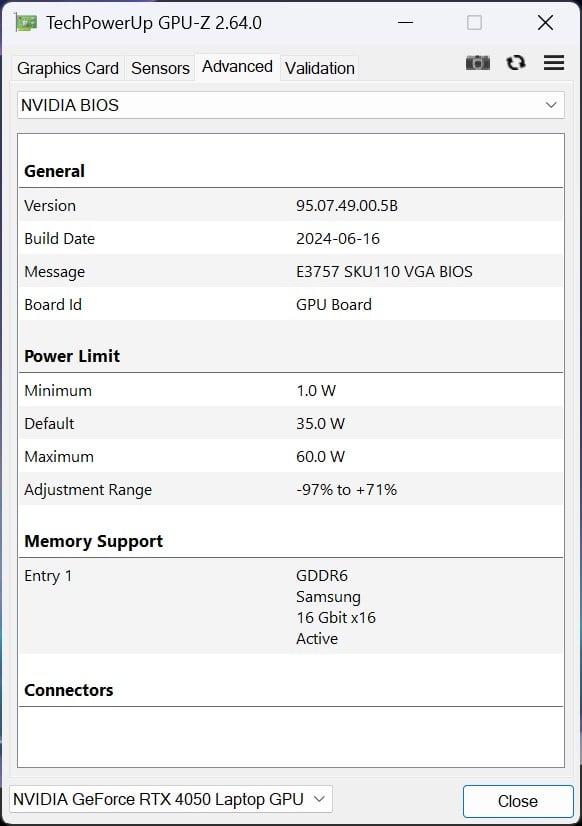
图形卡
惠普 OmniStudio X 的顶级配置使用了 英伟达GeForce RTX 4050 笔记本电脑显然优于 英特尔酷睿 7 155H的 iGPU。由于性能范围有限,它在我们的测试中落后于同类系统,但在图像编辑、人工智能任务和游戏中表现出了更好的性能。它拥有 6GB 的 VRAM,适合休闲游戏,而老游戏则可以 4K 格式运行。现代游戏通常只能以降低细节的全高清分辨率运行。
| 3DMark Performance Rating - Percent | |
| Average of class Desktop | |
| Average NVIDIA GeForce RTX 4050 Laptop GPU | |
| HP OmniStudio X 32-c0077ng | |
| Average AMD Radeon 890M | |
| Average Intel Arc 8-Core iGPU | |
| 3DMark 05 Standard | 46696 points | |
| 3DMark 06 Standard Score | 41211 points | |
| 3DMark Vantage P Result | 70238 points | |
| 3DMark 11 Performance | 25224 points | |
| 3DMark Ice Storm Standard Score | 85052 points | |
| 3DMark Cloud Gate Standard Score | 47951 points | |
| 3DMark Fire Strike Score | 17640 points | |
| 3DMark Fire Strike Extreme Score | 8862 points | |
| 3DMark Time Spy Score | 7762 points | |
| 3DMark Steel Nomad Score | 1669 points | |
Help | ||
* ... smaller is better
| Performance Rating - Percent | |
| Average of class Desktop | |
| Average NVIDIA GeForce RTX 4050 Laptop GPU | |
| HP OmniStudio X 32-c0077ng | |
| Average AMD Radeon 890M | |
| Average Intel Arc 8-Core iGPU | |
| Cyberpunk 2077 2.2 Phantom Liberty - 1920x1080 Ultra Preset (FSR off) | |
| Average of class Desktop (53.9 - 246, n=23, last 2 years) | |
| HP OmniStudio X 32-c0077ng | |
| Average NVIDIA GeForce RTX 4050 Laptop GPU (35.8 - 67.3, n=9) | |
| Average AMD Radeon 890M (23.1 - 28.4, n=15) | |
| Average Intel Arc 8-Core iGPU (13 - 24.7, n=26) | |
| GTA V - 1920x1080 Highest Settings possible AA:4xMSAA + FX AF:16x | |
| Average of class Desktop (9.61 - 170.7, n=14, last 2 years) | |
| HP OmniStudio X 32-c0077ng | |
| Average NVIDIA GeForce RTX 4050 Laptop GPU (14.9 - 101.7, n=34) | |
| Average AMD Radeon 890M (29.7 - 33.3, n=15) | |
| Average Intel Arc 8-Core iGPU (9.59 - 20.6, n=37) | |
| Final Fantasy XV Benchmark - 1920x1080 High Quality | |
| Average of class Desktop (7.05 - 237, n=20, last 2 years) | |
| Average NVIDIA GeForce RTX 4050 Laptop GPU (15.5 - 122.3, n=39) | |
| HP OmniStudio X 32-c0077ng | |
| Average AMD Radeon 890M (26.6 - 34.4, n=13) | |
| Average Intel Arc 8-Core iGPU (14.7 - 31.7, n=44) | |
| Strange Brigade - 1920x1080 ultra AA:ultra AF:16 | |
| Average of class Desktop (12 - 616, n=13, last 2 years) | |
| Average NVIDIA GeForce RTX 4050 Laptop GPU (21.2 - 156.6, n=38) | |
| HP OmniStudio X 32-c0077ng | |
| Average AMD Radeon 890M (48.5 - 59.7, n=13) | |
| Average Intel Arc 8-Core iGPU (27.1 - 58.9, n=40) | |
| Dota 2 Reborn - 1920x1080 ultra (3/3) best looking | |
| Average of class Desktop (31.3 - 292, n=19, last 2 years) | |
| Average NVIDIA GeForce RTX 4050 Laptop GPU (73.5 - 175.6, n=39) | |
| HP OmniStudio X 32-c0077ng | |
| Average Intel Arc 8-Core iGPU (35.2 - 80.9, n=44) | |
| Average AMD Radeon 890M (32.4 - 89.8, n=15) | |
| X-Plane 11.11 - 1920x1080 high (fps_test=3) | |
| Average of class Desktop (19.5 - 197, n=29, last 2 years) | |
| Average NVIDIA GeForce RTX 4050 Laptop GPU (55.5 - 117, n=40) | |
| HP OmniStudio X 32-c0077ng | |
| Average AMD Radeon 890M (42.2 - 53.3, n=14) | |
| Average Intel Arc 8-Core iGPU (27.9 - 43.9, n=45) | |
| The Witcher 3 - 1920x1080 Ultra Graphics & Postprocessing (HBAO+) | |
| Average of class Desktop (7.8 - 369, n=27, last 2 years) | |
| Average NVIDIA GeForce RTX 4050 Laptop GPU (18.5 - 94.7, n=40) | |
| HP OmniStudio X 32-c0077ng | |
| Average AMD Radeon 890M (31 - 36.7, n=5) | |
| Average Intel Arc 8-Core iGPU (14.5 - 43.1, n=31) | |
FPS diagram - 30 minutes of Cyberpunk 2077 1920 x 1080 Ultra preset (FSR off)
| low | med. | high | ultra | QHD | 4K | |
|---|---|---|---|---|---|---|
| GTA V (2015) | 173.4 | 168.4 | 151.5 | 88.2 | 62.6 | 56.8 |
| The Witcher 3 (2015) | 328 | 239 | 144.7 | 74.5 | 52.7 | 41.7 |
| Dota 2 Reborn (2015) | 148.7 | 136.1 | 130.3 | 121.2 | 92.4 | |
| Final Fantasy XV Benchmark (2018) | 155.8 | 101.7 | 73.1 | 52.3 | 29.8 | |
| X-Plane 11.11 (2018) | 78.9 | 73.2 | 59.6 | 51 | ||
| Strange Brigade (2018) | 377 | 174.2 | 141.7 | 124.1 | 83.4 | 44.4 |
| Anno 1800 (2019) | 104.8 | 94.5 | 79 | 48.6 | 45.1 | 31 |
| Baldur's Gate 3 (2023) | 91.8 | 61.4 | 52.8 | 51.1 | 35.3 | 19.5 |
| Cyberpunk 2077 2.2 Phantom Liberty (2023) | 94.6 | 74.4 | 62.8 | 53.9 | 30.8 | 12.7 |
| Total War Pharaoh (2023) | 259.8 | 171.6 | 102.8 | 80 | 55.1 | 27.1 |
| F1 24 (2024) | 181.9 | 169.1 | 135.2 | 40.7 | 24.7 | 10.1 |
| Monster Hunter Wilds (2025) | 54.7 | 45.5 | 4 |
排放与能源
噪音排放
尽管风扇发出的噪音很小,但电脑的工作噪音仍然很低,幸好其频率很低,几乎不会令人感到烦躁。在压力测试中,性能模式下的声压级达到 37.5 dB(A),而在静音模式下最高降至 34 dB(A),差异显著。因此,对设备性能要求不高的用户可以放心使用静音模式。
Noise Level
| Idle |
| 32.3 / 32.4 / 32.6 dB(A) |
| Load |
| 35.9 / 37.5 dB(A) |
 | ||
30 dB silent 40 dB(A) audible 50 dB(A) loud |
||
min: | ||
| HP OmniStudio X 32-c0077ng NVIDIA GeForce RTX 4050 Laptop GPU, Ultra 7 155H, Western Digital PC SN5000S SDEPNSJ-2T00-1006 | Minisforum AtomMan G7 Ti NVIDIA GeForce RTX 4070 Laptop GPU, i9-14900HX, Kingston OM8PGP41024Q-A0 | Minisforum G7 PT Radeon RX 7600M XT, R9 7945HX, Kingston OM8PGP41024Q-A0 | Acemagic M2A GeForce RTX 3080 Laptop GPU, i9-12900H, Rayson RS1D0TSSD710 1024 GB PCIe 4.0 NVMe | |
|---|---|---|---|---|
| Noise | -17% | -4% | -11% | |
| off / environment * | 24 | 24.7 -3% | 24.4 -2% | 24.3 -1% |
| Idle Minimum * | 32.3 | 34 -5% | 29.3 9% | 32.7 -1% |
| Idle Average * | 32.4 | 34.1 -5% | 29.4 9% | 32.8 -1% |
| Idle Maximum * | 32.6 | 34.1 -5% | 29.4 10% | 33.1 -2% |
| Load Average * | 35.9 | 48.6 -35% | 43.5 -21% | 40.7 -13% |
| Cyberpunk 2077 ultra * | 40.8 | 55.2 -35% | 45.5 -12% | 45.8 -12% |
| Load Maximum * | 37.5 | 48.3 -29% | 45 -20% | 53.9 -44% |
| Witcher 3 ultra * | 49.3 |
* ... smaller is better
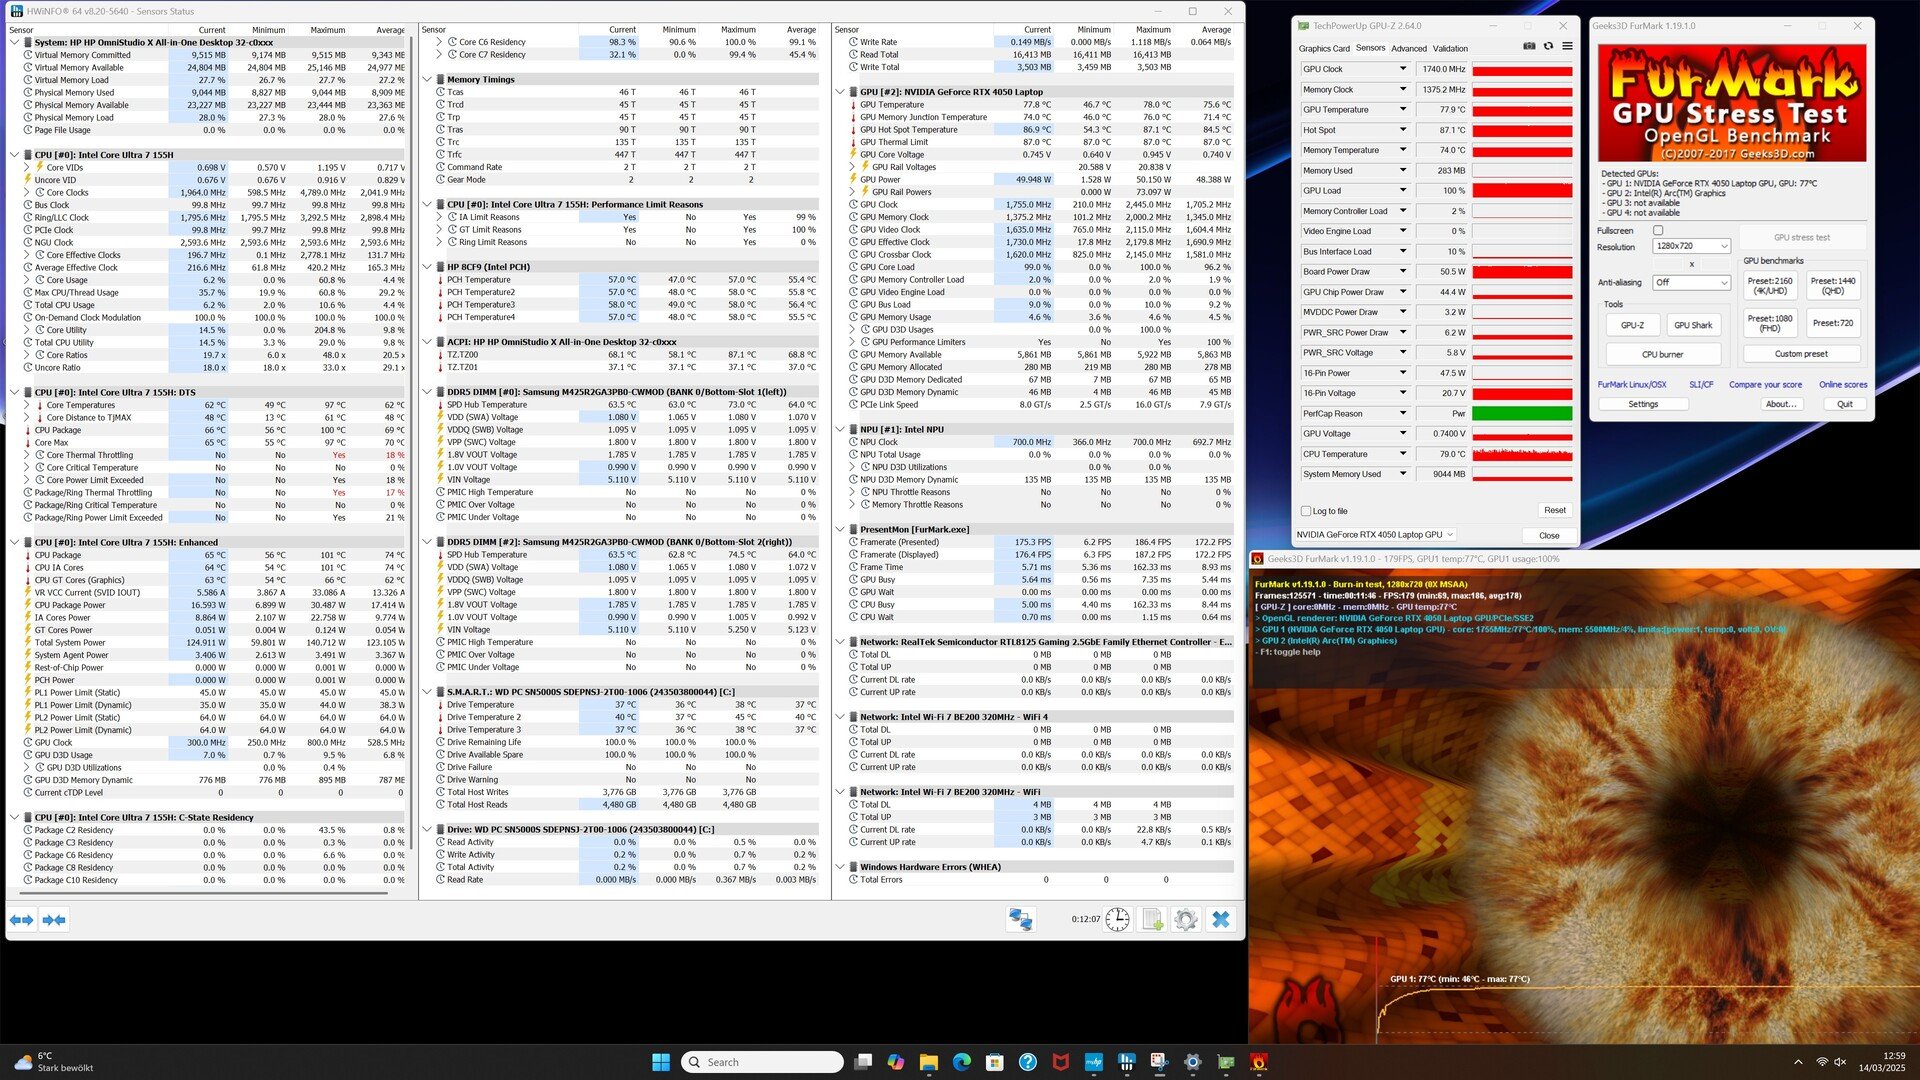
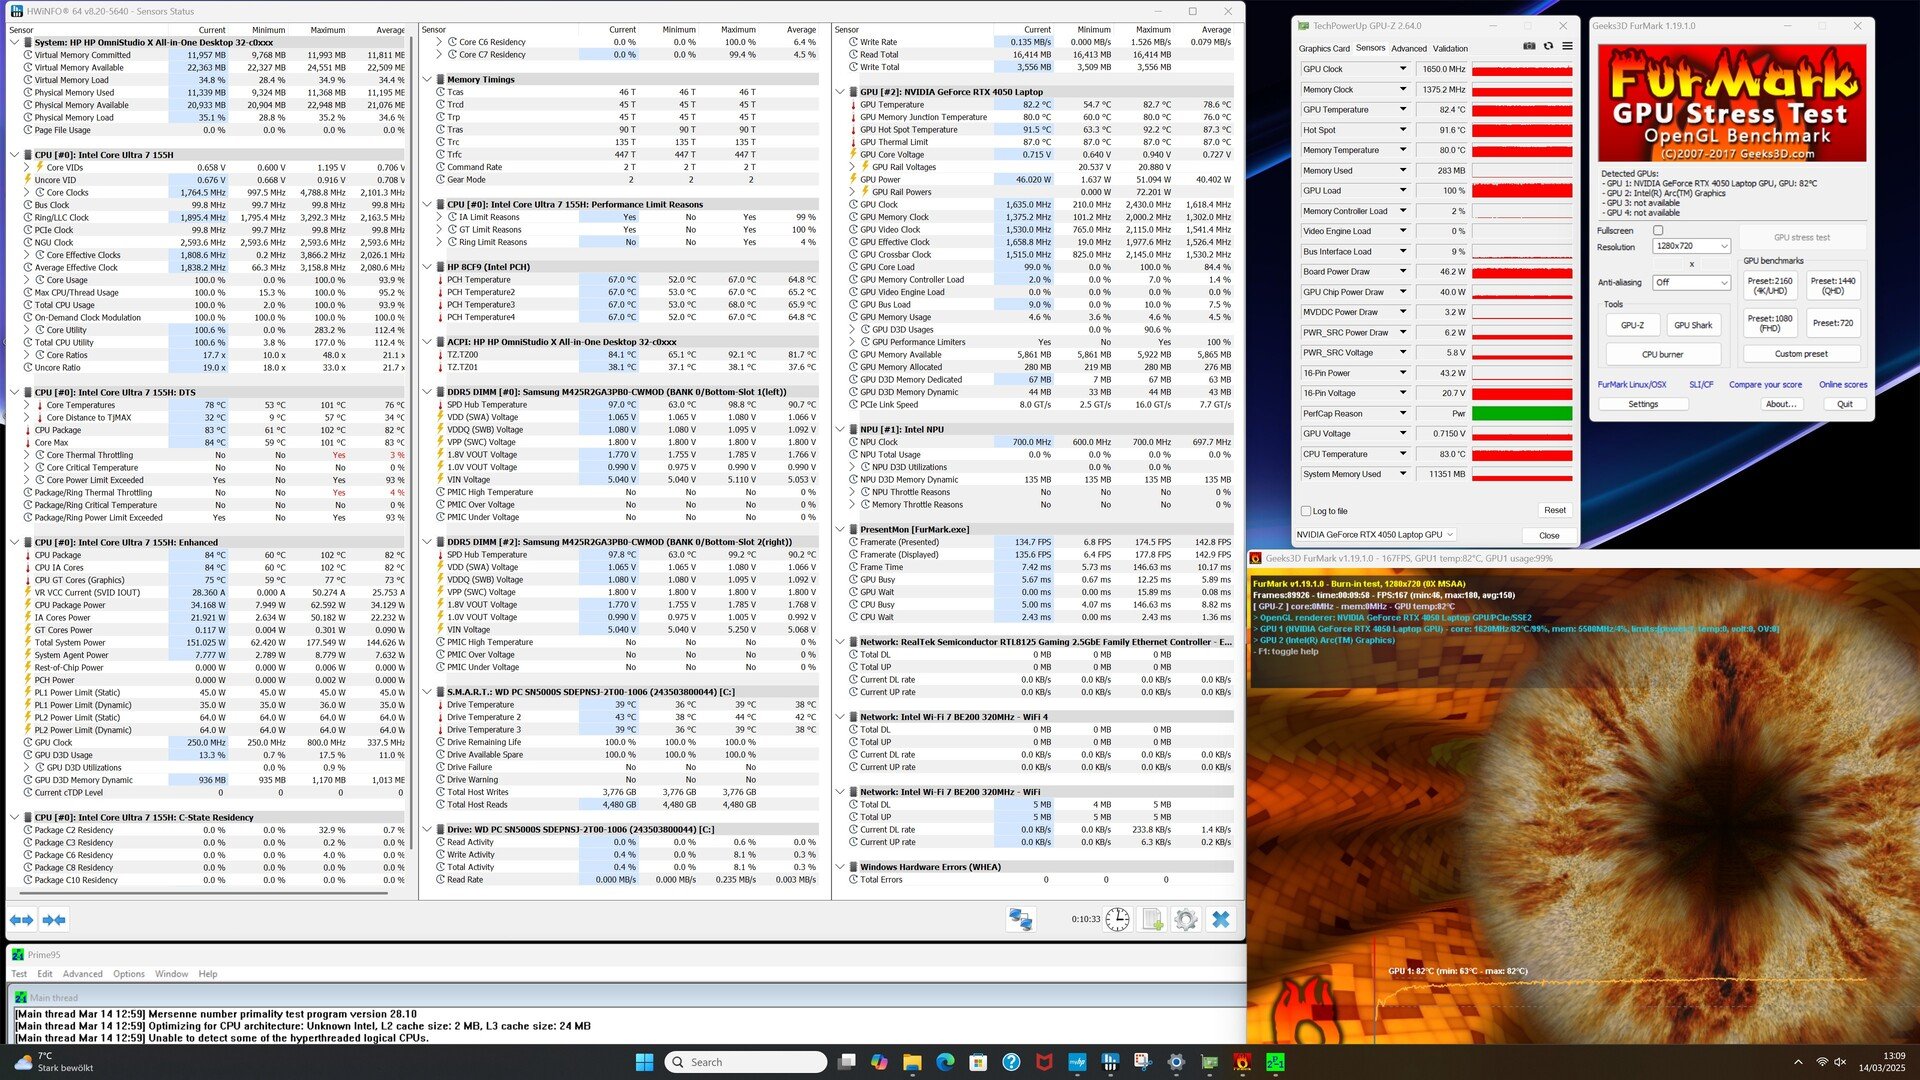
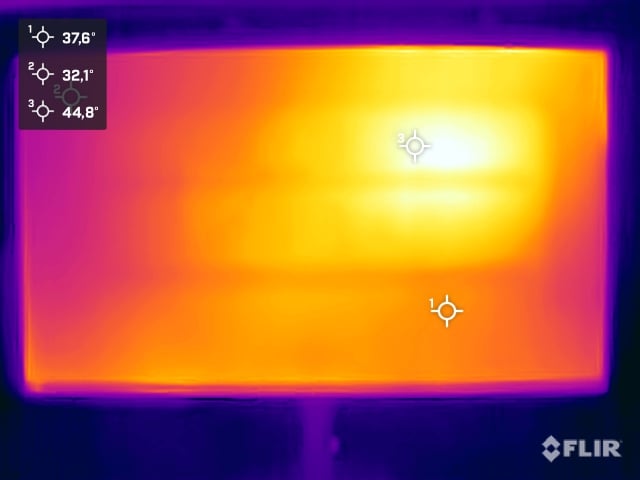
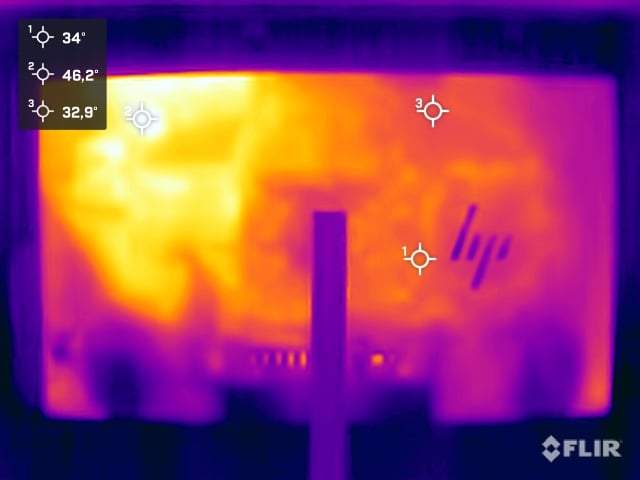
温度
在我们的测试过程中,电脑的冷却系统将其部件保持在 TDP 限制范围内,但 Turbo 模式只运行了很短的时间。SoC 的温度超过了 100 °C,但仍低于 110 °C,而在持续负载情况下,温度稳定在 80 °C。NvidiaGeForce RTX 4050 也达到了较高温度,但配置相对节俭,仅为 50 瓦。

发言人
集成扬声器来自 Bang & Olufsen,声音强劲有力,但在音量达到 70% 左右时开始失真。它们非常适合视频会议和音乐播放。虽然高音和中音比低音略占优势,但声音可以通过声音配置文件进行调整。在中低音量下,低音依然存在,声音饱满悦耳。
HP OmniStudio X 32-c0077ng audio analysis
(+) | speakers can play relatively loud (89.4 dB)
Bass 100 - 315 Hz
(+) | good bass - only 3% away from median
(±) | linearity of bass is average (9.5% delta to prev. frequency)
Mids 400 - 2000 Hz
(+) | balanced mids - only 3.8% away from median
(+) | mids are linear (5% delta to prev. frequency)
Highs 2 - 16 kHz
(+) | balanced highs - only 2.9% away from median
(+) | highs are linear (5% delta to prev. frequency)
Overall 100 - 16.000 Hz
(+) | overall sound is linear (7.2% difference to median)
Compared to same class
» 11% of all tested devices in this class were better, 11% similar, 78% worse
» The best had a delta of 6%, average was 16%, worst was 46%
Compared to all devices tested
» 1% of all tested devices were better, 0% similar, 99% worse
» The best had a delta of 4%, average was 24%, worst was 134%
Apple MacBook Pro 16 2021 M1 Pro audio analysis
(+) | speakers can play relatively loud (84.7 dB)
Bass 100 - 315 Hz
(+) | good bass - only 3.8% away from median
(+) | bass is linear (5.2% delta to prev. frequency)
Mids 400 - 2000 Hz
(+) | balanced mids - only 1.3% away from median
(+) | mids are linear (2.1% delta to prev. frequency)
Highs 2 - 16 kHz
(+) | balanced highs - only 1.9% away from median
(+) | highs are linear (2.7% delta to prev. frequency)
Overall 100 - 16.000 Hz
(+) | overall sound is linear (4.6% difference to median)
Compared to same class
» 0% of all tested devices in this class were better, 0% similar, 100% worse
» The best had a delta of 5%, average was 18%, worst was 45%
Compared to all devices tested
» 0% of all tested devices were better, 0% similar, 100% worse
» The best had a delta of 4%, average was 24%, worst was 134%
耗电量
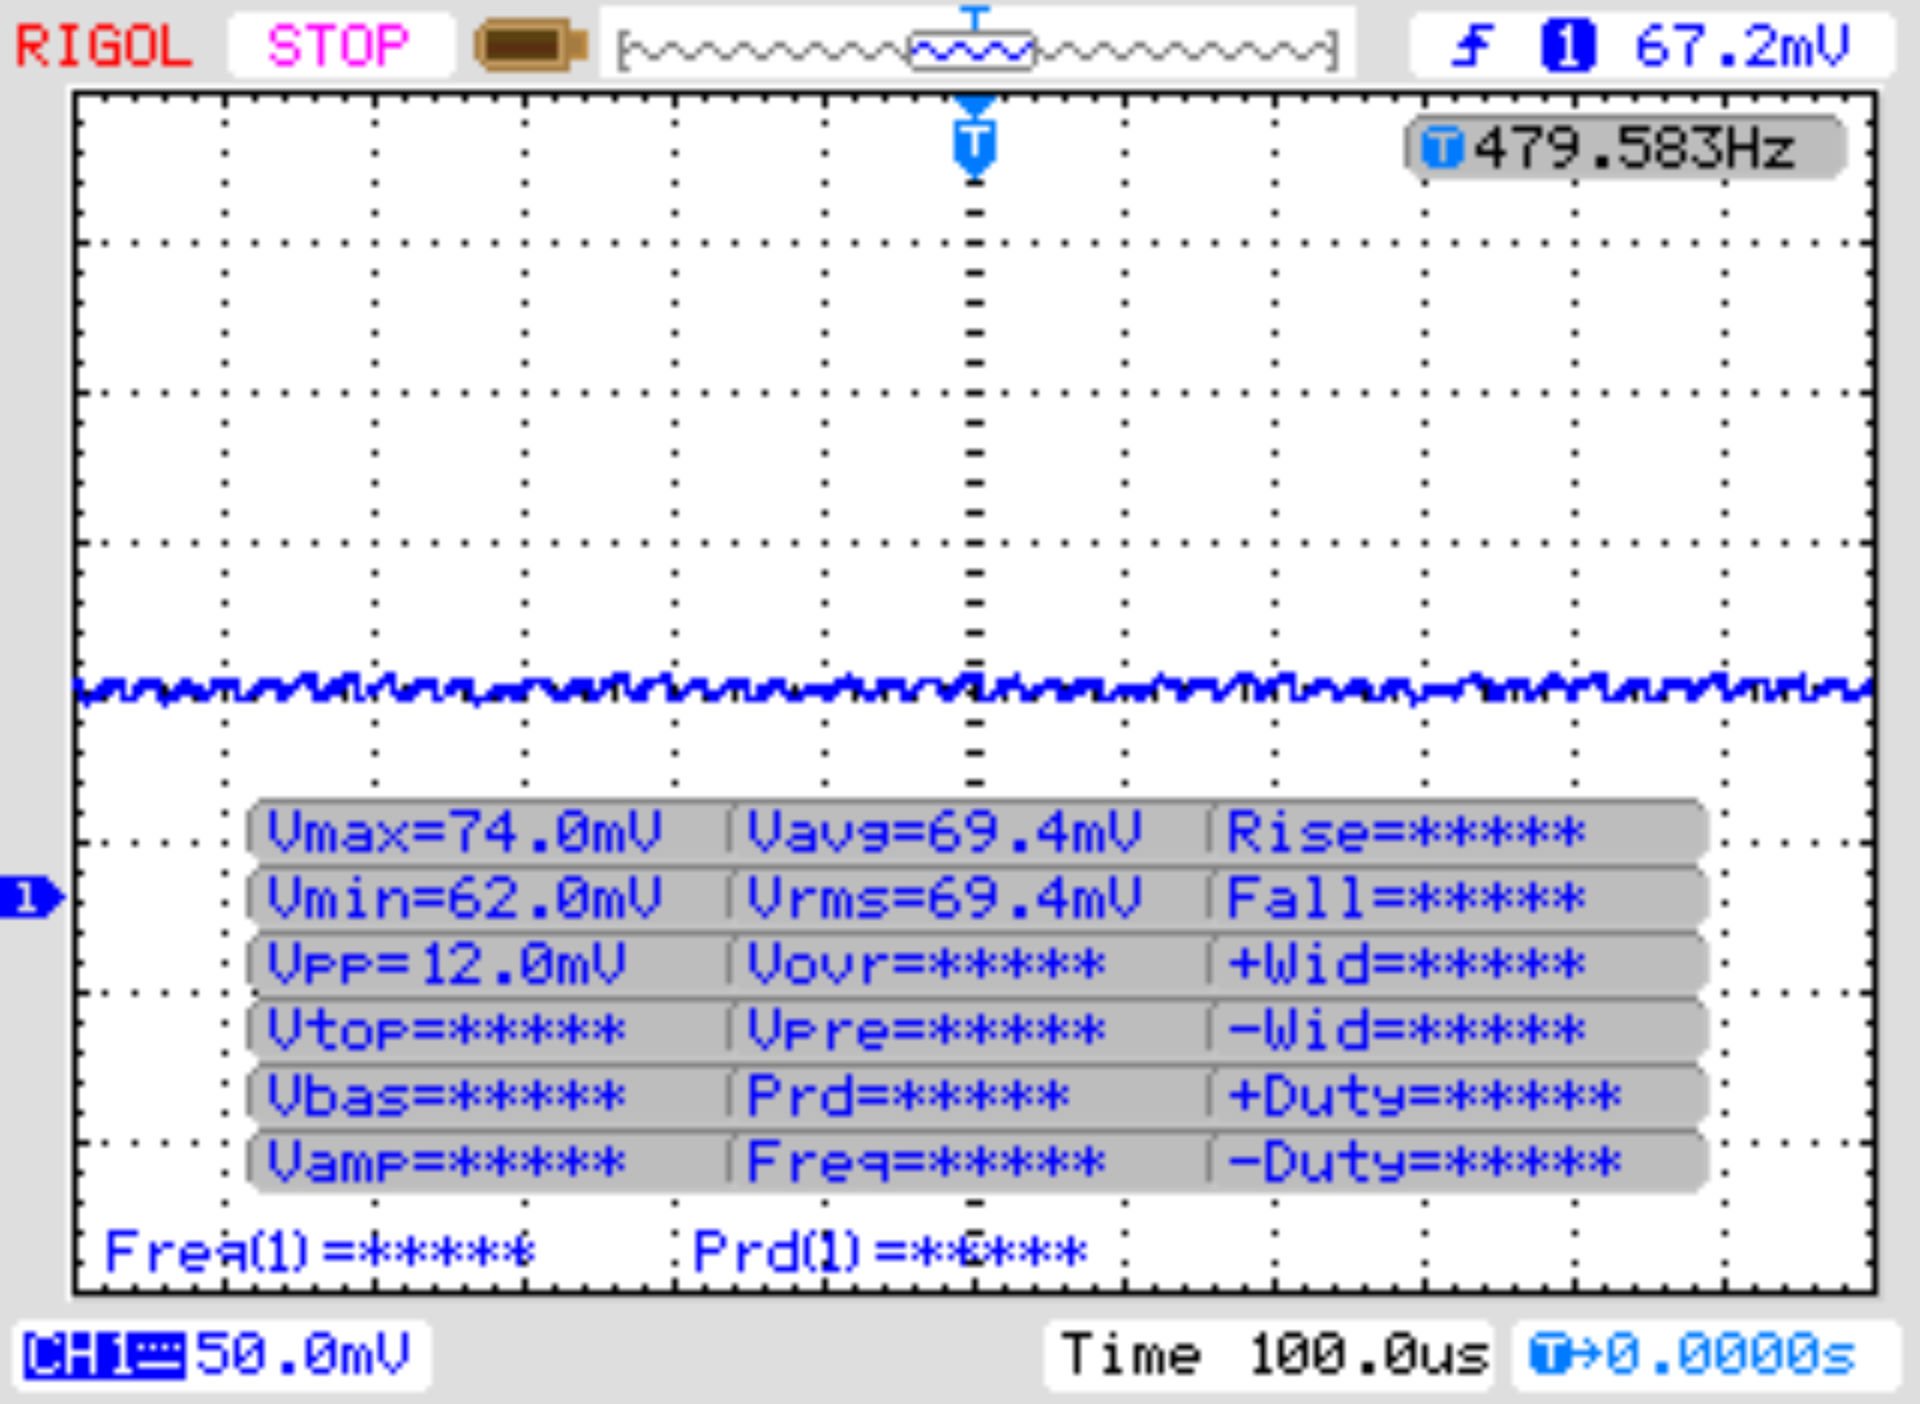
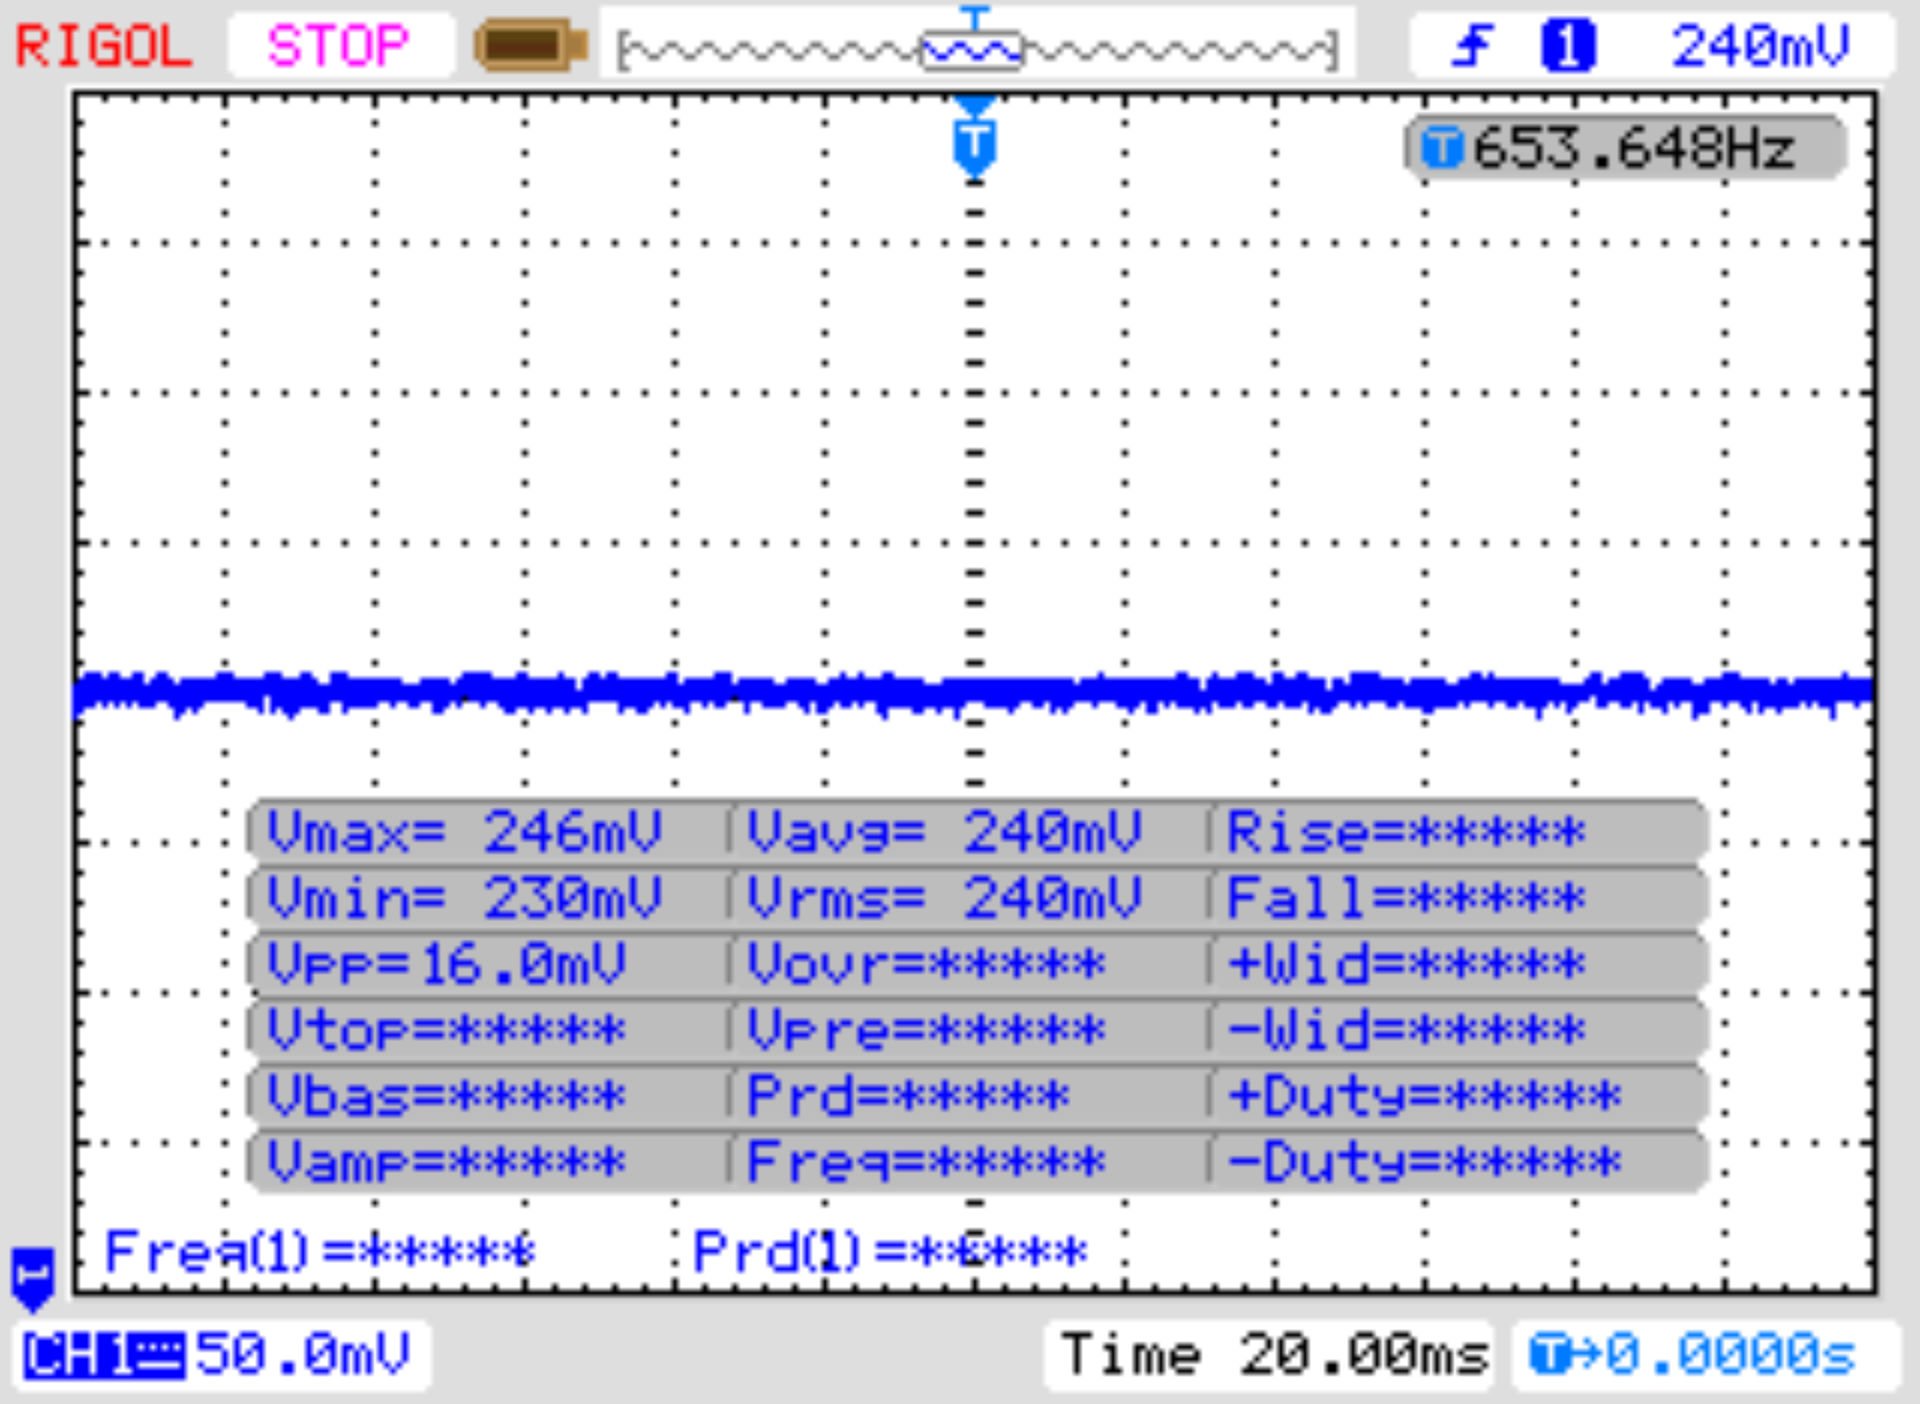
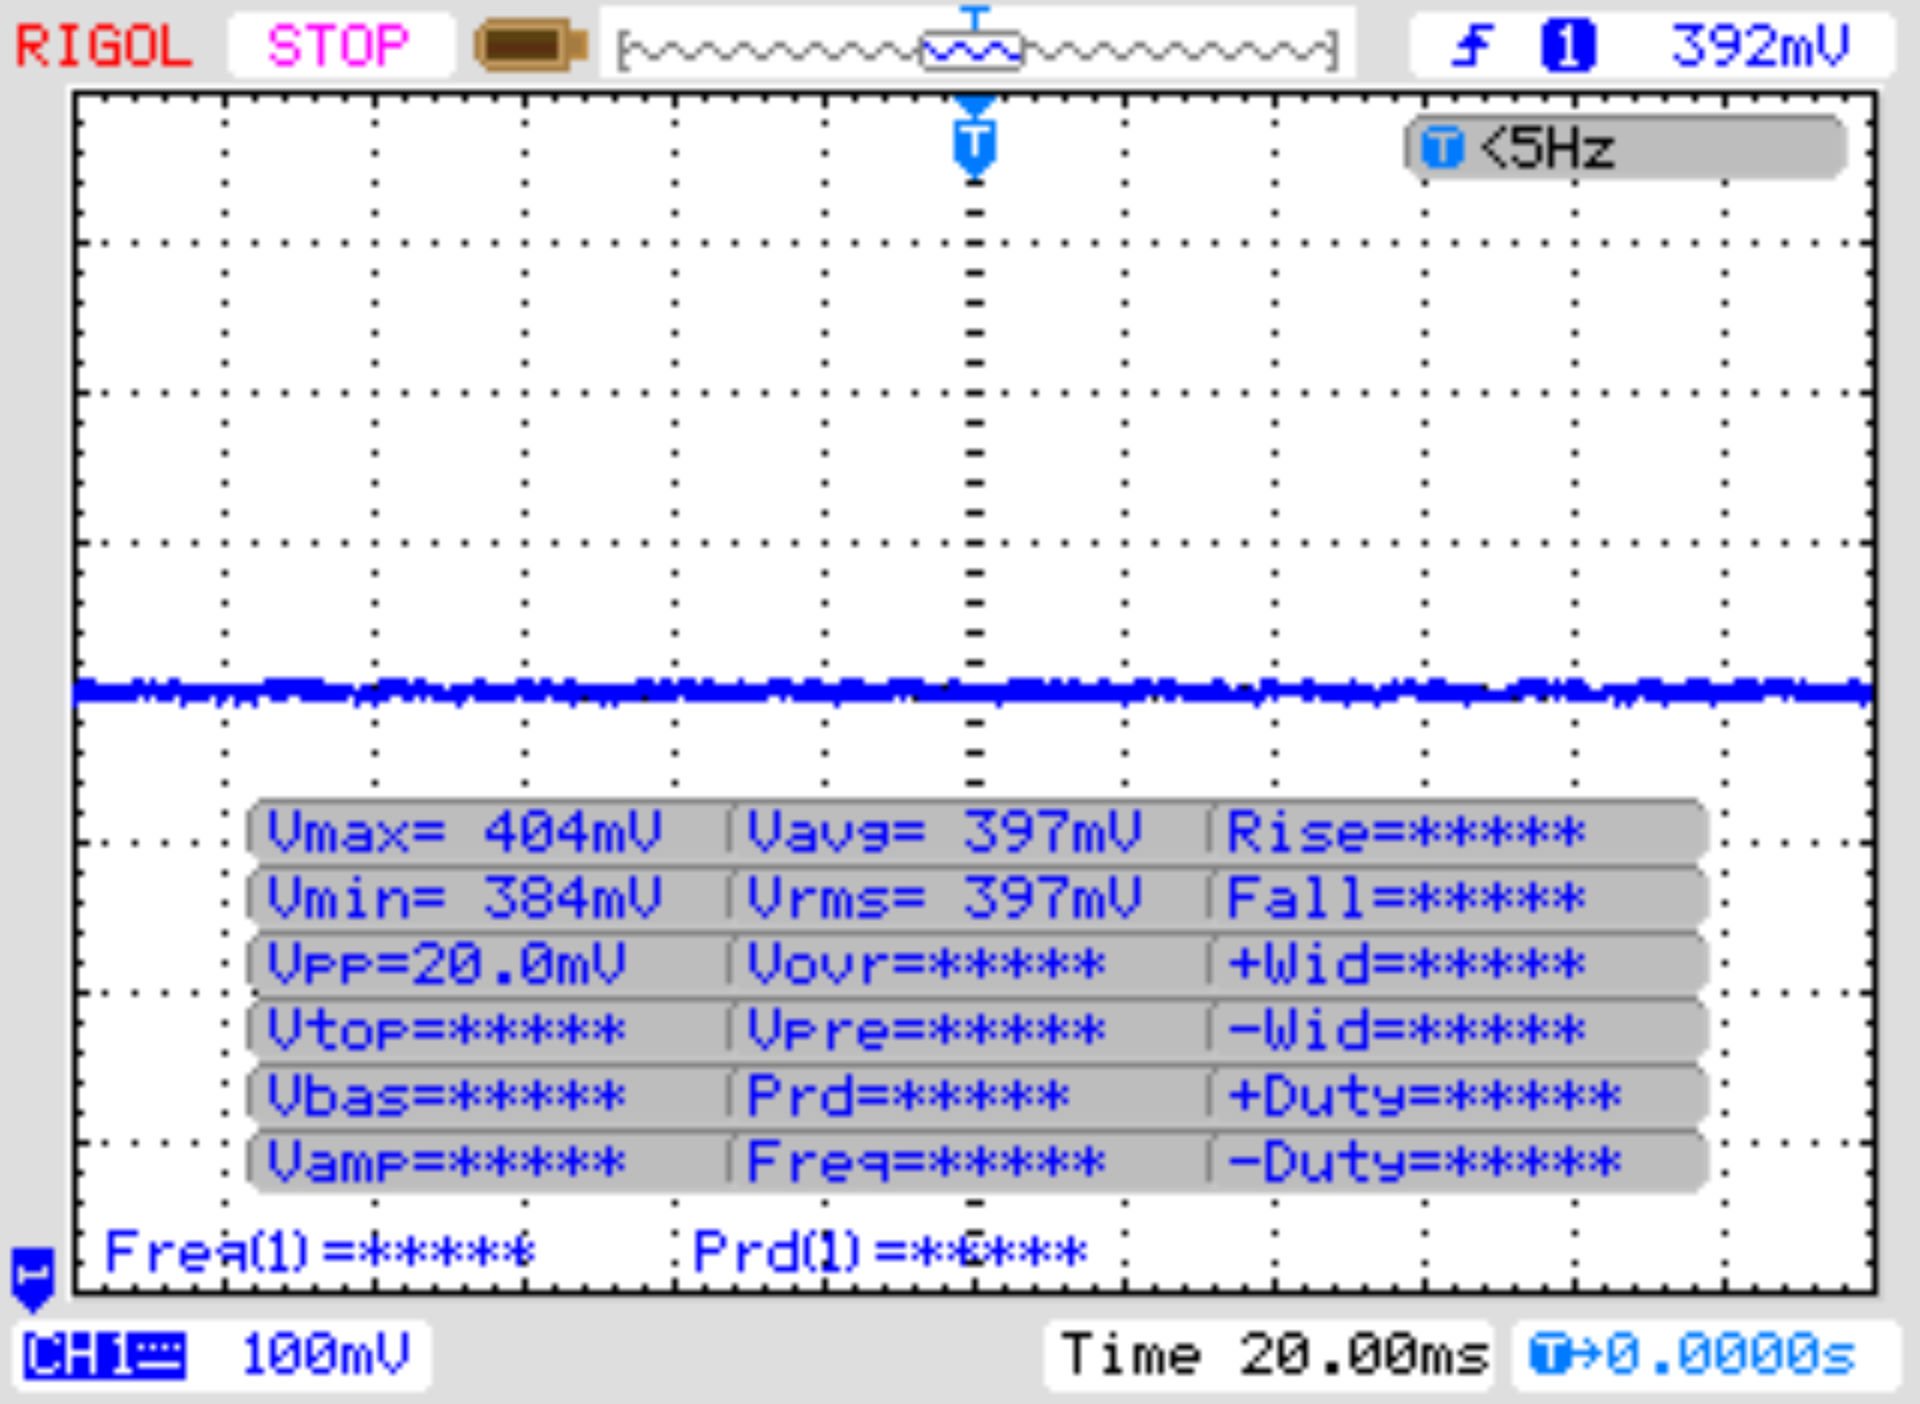
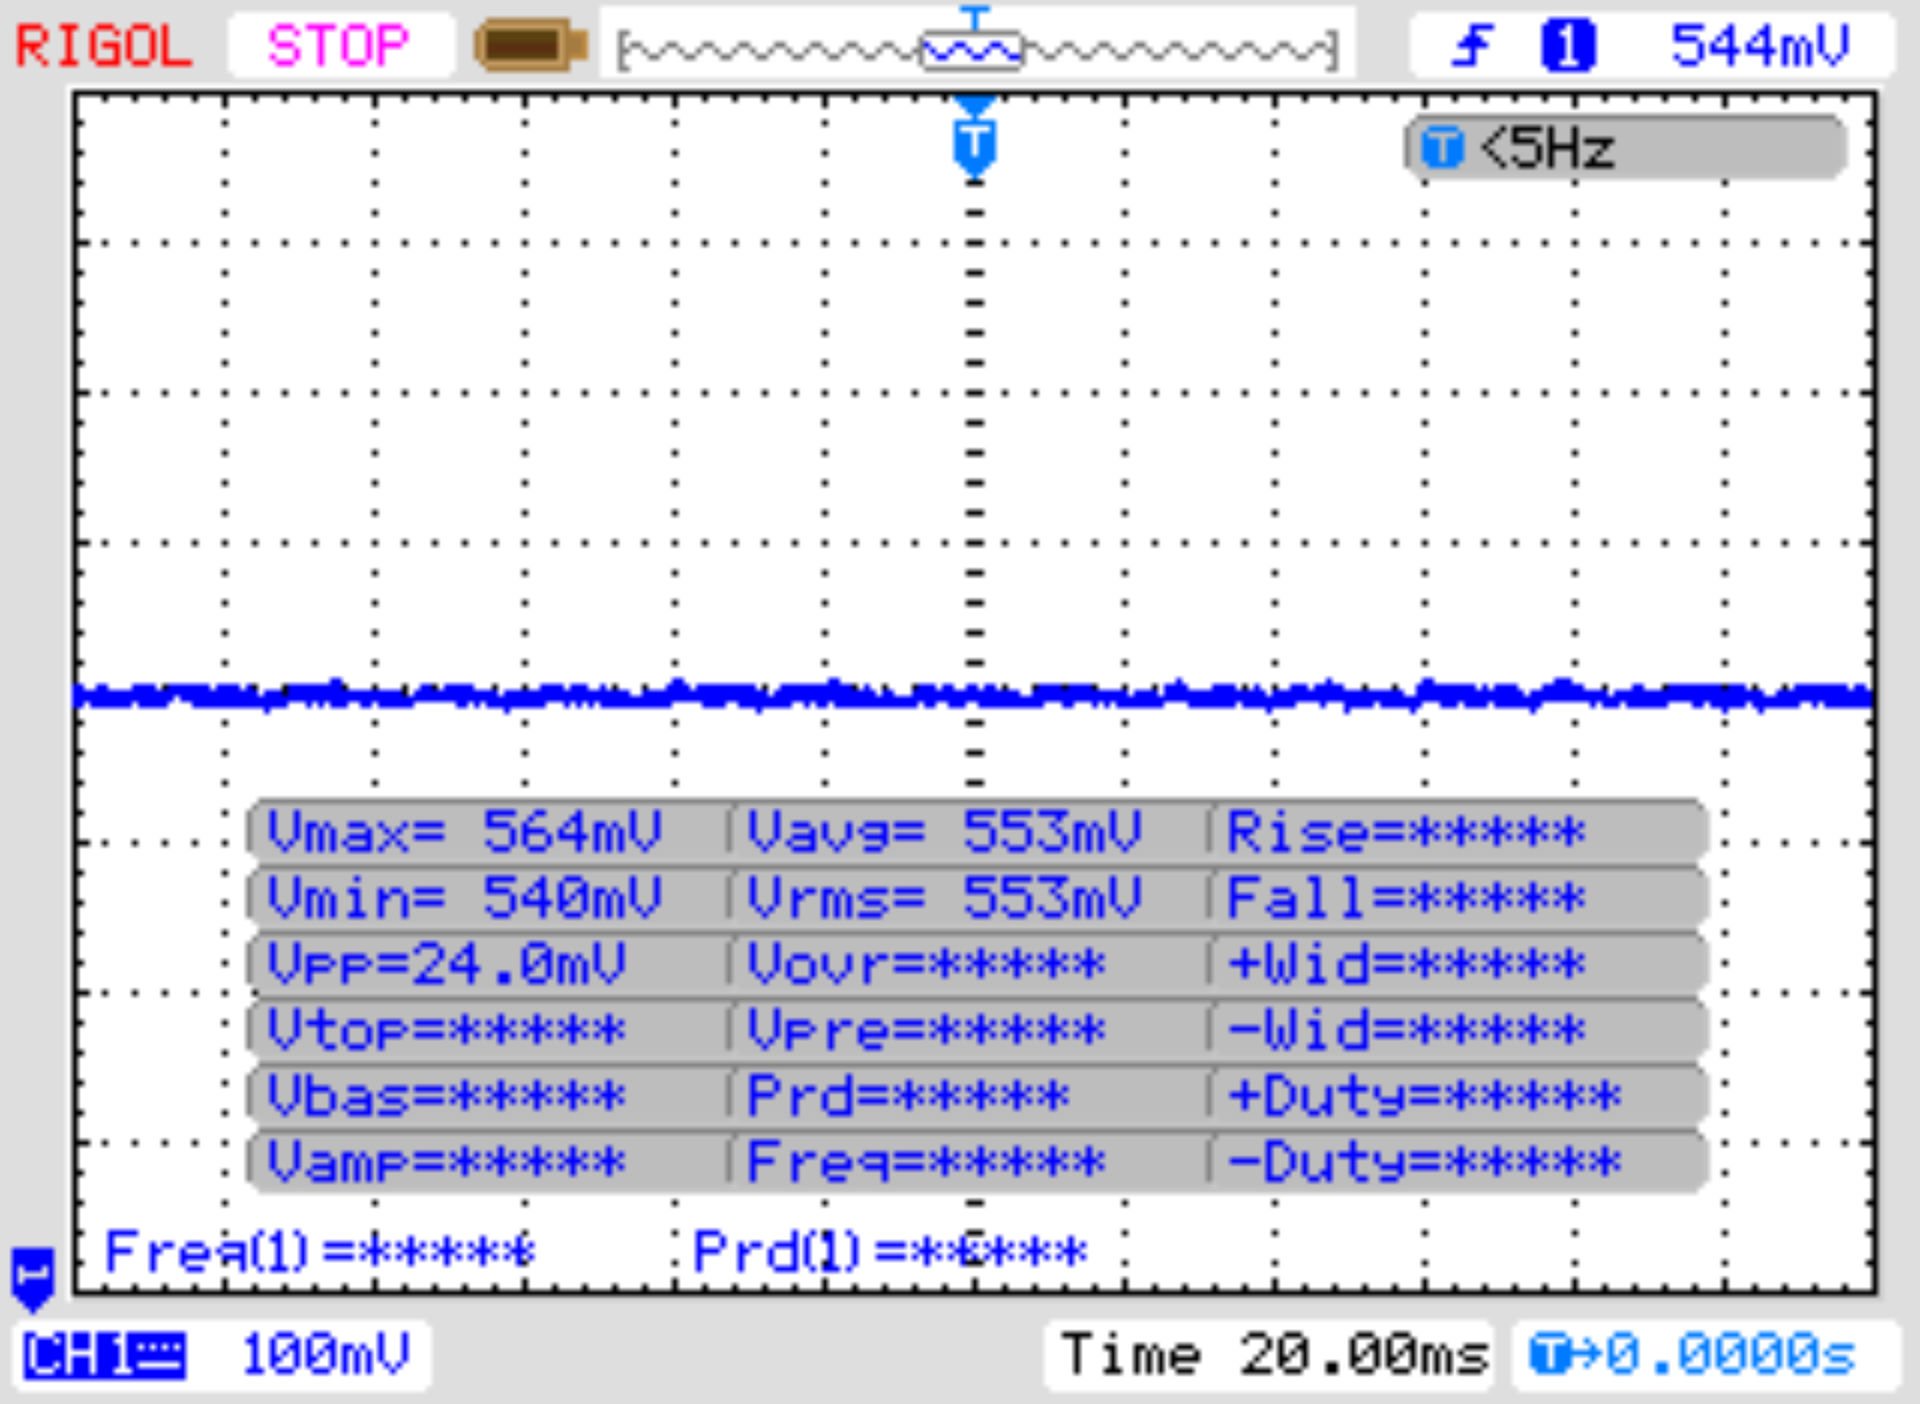
内部电源可提供高达 280 瓦的功率。据惠普称,这是一款通过 80 Plus 白金认证的电源装置。在闲置模式和最低显示亮度下,我们仅测得 24 瓦,但在全亮度下,我们测得 66 瓦。在平均负载情况下,它的能耗需求上升到 121 瓦以下,有时峰值可达 195.2 瓦。
| Off / Standby | |
| Idle | |
| Load |
|
Key:
min: | |
Notebookcheck 总评分
惠普 OmniStudio X 是一款功能强大的一体化系统,适用于创意任务。它配备了英特尔酷睿 7 155H 和 NvidiaGeForce RTX 4050 笔记本电脑,可为图像编辑、人工智能应用和休闲游戏提供稳定的性能。该电脑的 4K 显示屏令人印象深刻,散热效果也很好。GPU 的性能限制和该设备的大容量存储没有任何扩展选项都是负面因素。
Transparency
The selection of devices to be reviewed is made by our editorial team. The test sample was provided to the author as a loan by the manufacturer or retailer for the purpose of this review. The lender had no influence on this review, nor did the manufacturer receive a copy of this review before publication. There was no obligation to publish this review. We never accept compensation or payment in return for our reviews. As an independent media company, Notebookcheck is not subjected to the authority of manufacturers, retailers or publishers.
This is how Notebookcheck is testing
Every year, Notebookcheck independently reviews hundreds of laptops and smartphones using standardized procedures to ensure that all results are comparable. We have continuously developed our test methods for around 20 years and set industry standards in the process. In our test labs, high-quality measuring equipment is utilized by experienced technicians and editors. These tests involve a multi-stage validation process. Our complex rating system is based on hundreds of well-founded measurements and benchmarks, which maintains objectivity. Further information on our test methods can be found here.

