

申克 Work 14 基础版评测--配备大量端口和明亮 IPS 显示屏的经济型办公笔记本电脑
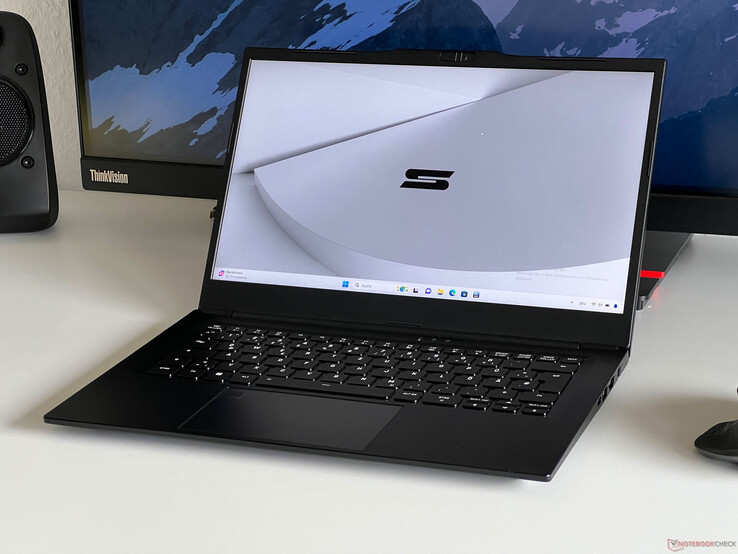
申克的 Work 14 Base 是一款小巧的办公笔记本电脑,除了明亮的哑光 IPS 显示屏外,还提供了非常好的升级选项和包括以太网在内的各种端口,而如今即使是办公或商务笔记本电脑也不再需要以太网了。Work 14 的起价为 750 美元,我们的测试机配备 16GB 内存,目前售价约为 770 美元。
潜在的竞争对手比较
Rating | Date | Model | Weight | Height | Size | Resolution | Price |
|---|---|---|---|---|---|---|---|
| 82 % v7 (old) | 05 / 2024 | SCHENKER Work 14 Base i5-1235U, Iris Xe G7 80EUs | 1.3 kg | 20.2 mm | 14.00" | 1920x1080 | |
| 85.6 % v7 (old) | 11 / 2023 | Acer Swift Go 14 SFG14-71 i5-1335U, Iris Xe G7 80EUs | 1.3 kg | 14.9 mm | 14.00" | 2880x1800 | |
| 84.6 % v7 (old) | 10 / 2023 | HP ProBook 445 G10 R5 7530U, Vega 7 | 1.3 kg | 20 mm | 14.00" | 1920x1080 | |
| 85.3 % v7 (old) | 06 / 2023 | Dell Latitude 3440 i5-1345U, Iris Xe G7 80EUs | 1.5 kg | 19.4 mm | 14.00" | 1920x1080 | |
| 88.6 % v7 (old) | 08 / 2023 | Lenovo ThinkPad L14 G4 21H6S00900 R5 7530U, Vega 7 | 1.5 kg | 19.83 mm | 14.00" | 1920x1080 |
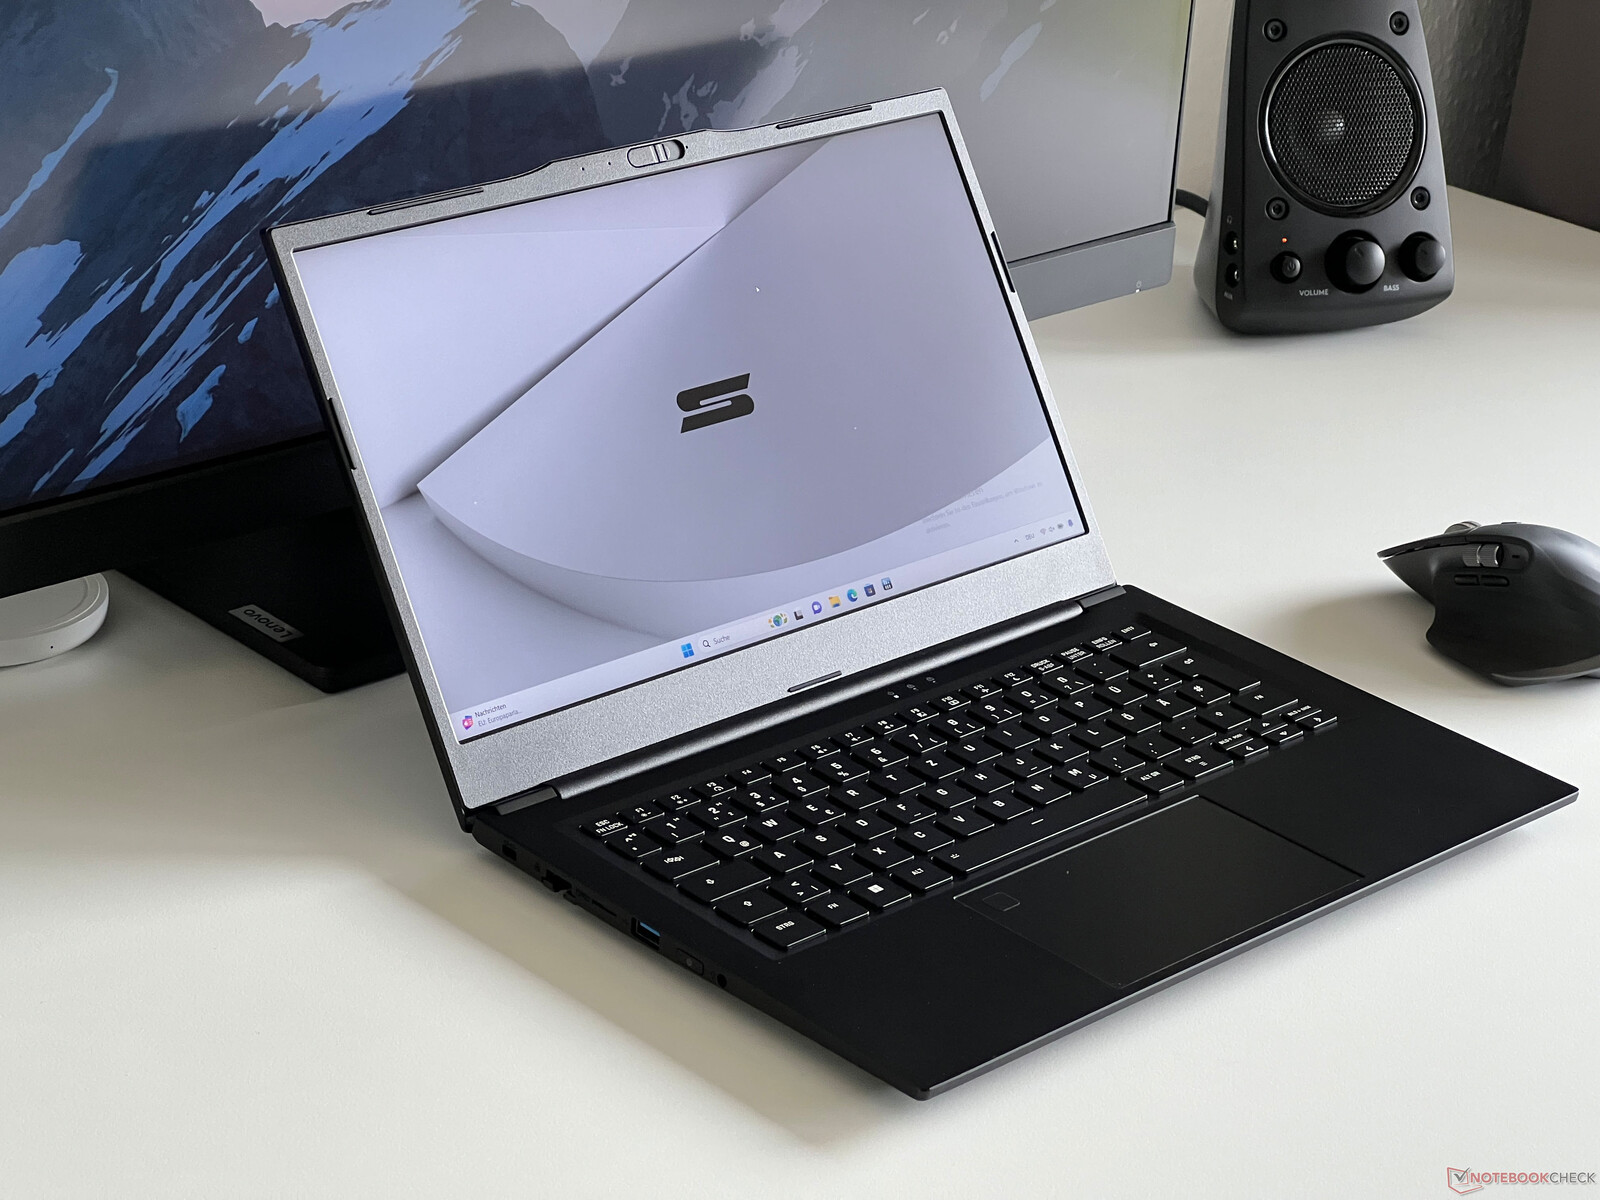
外壳和连接
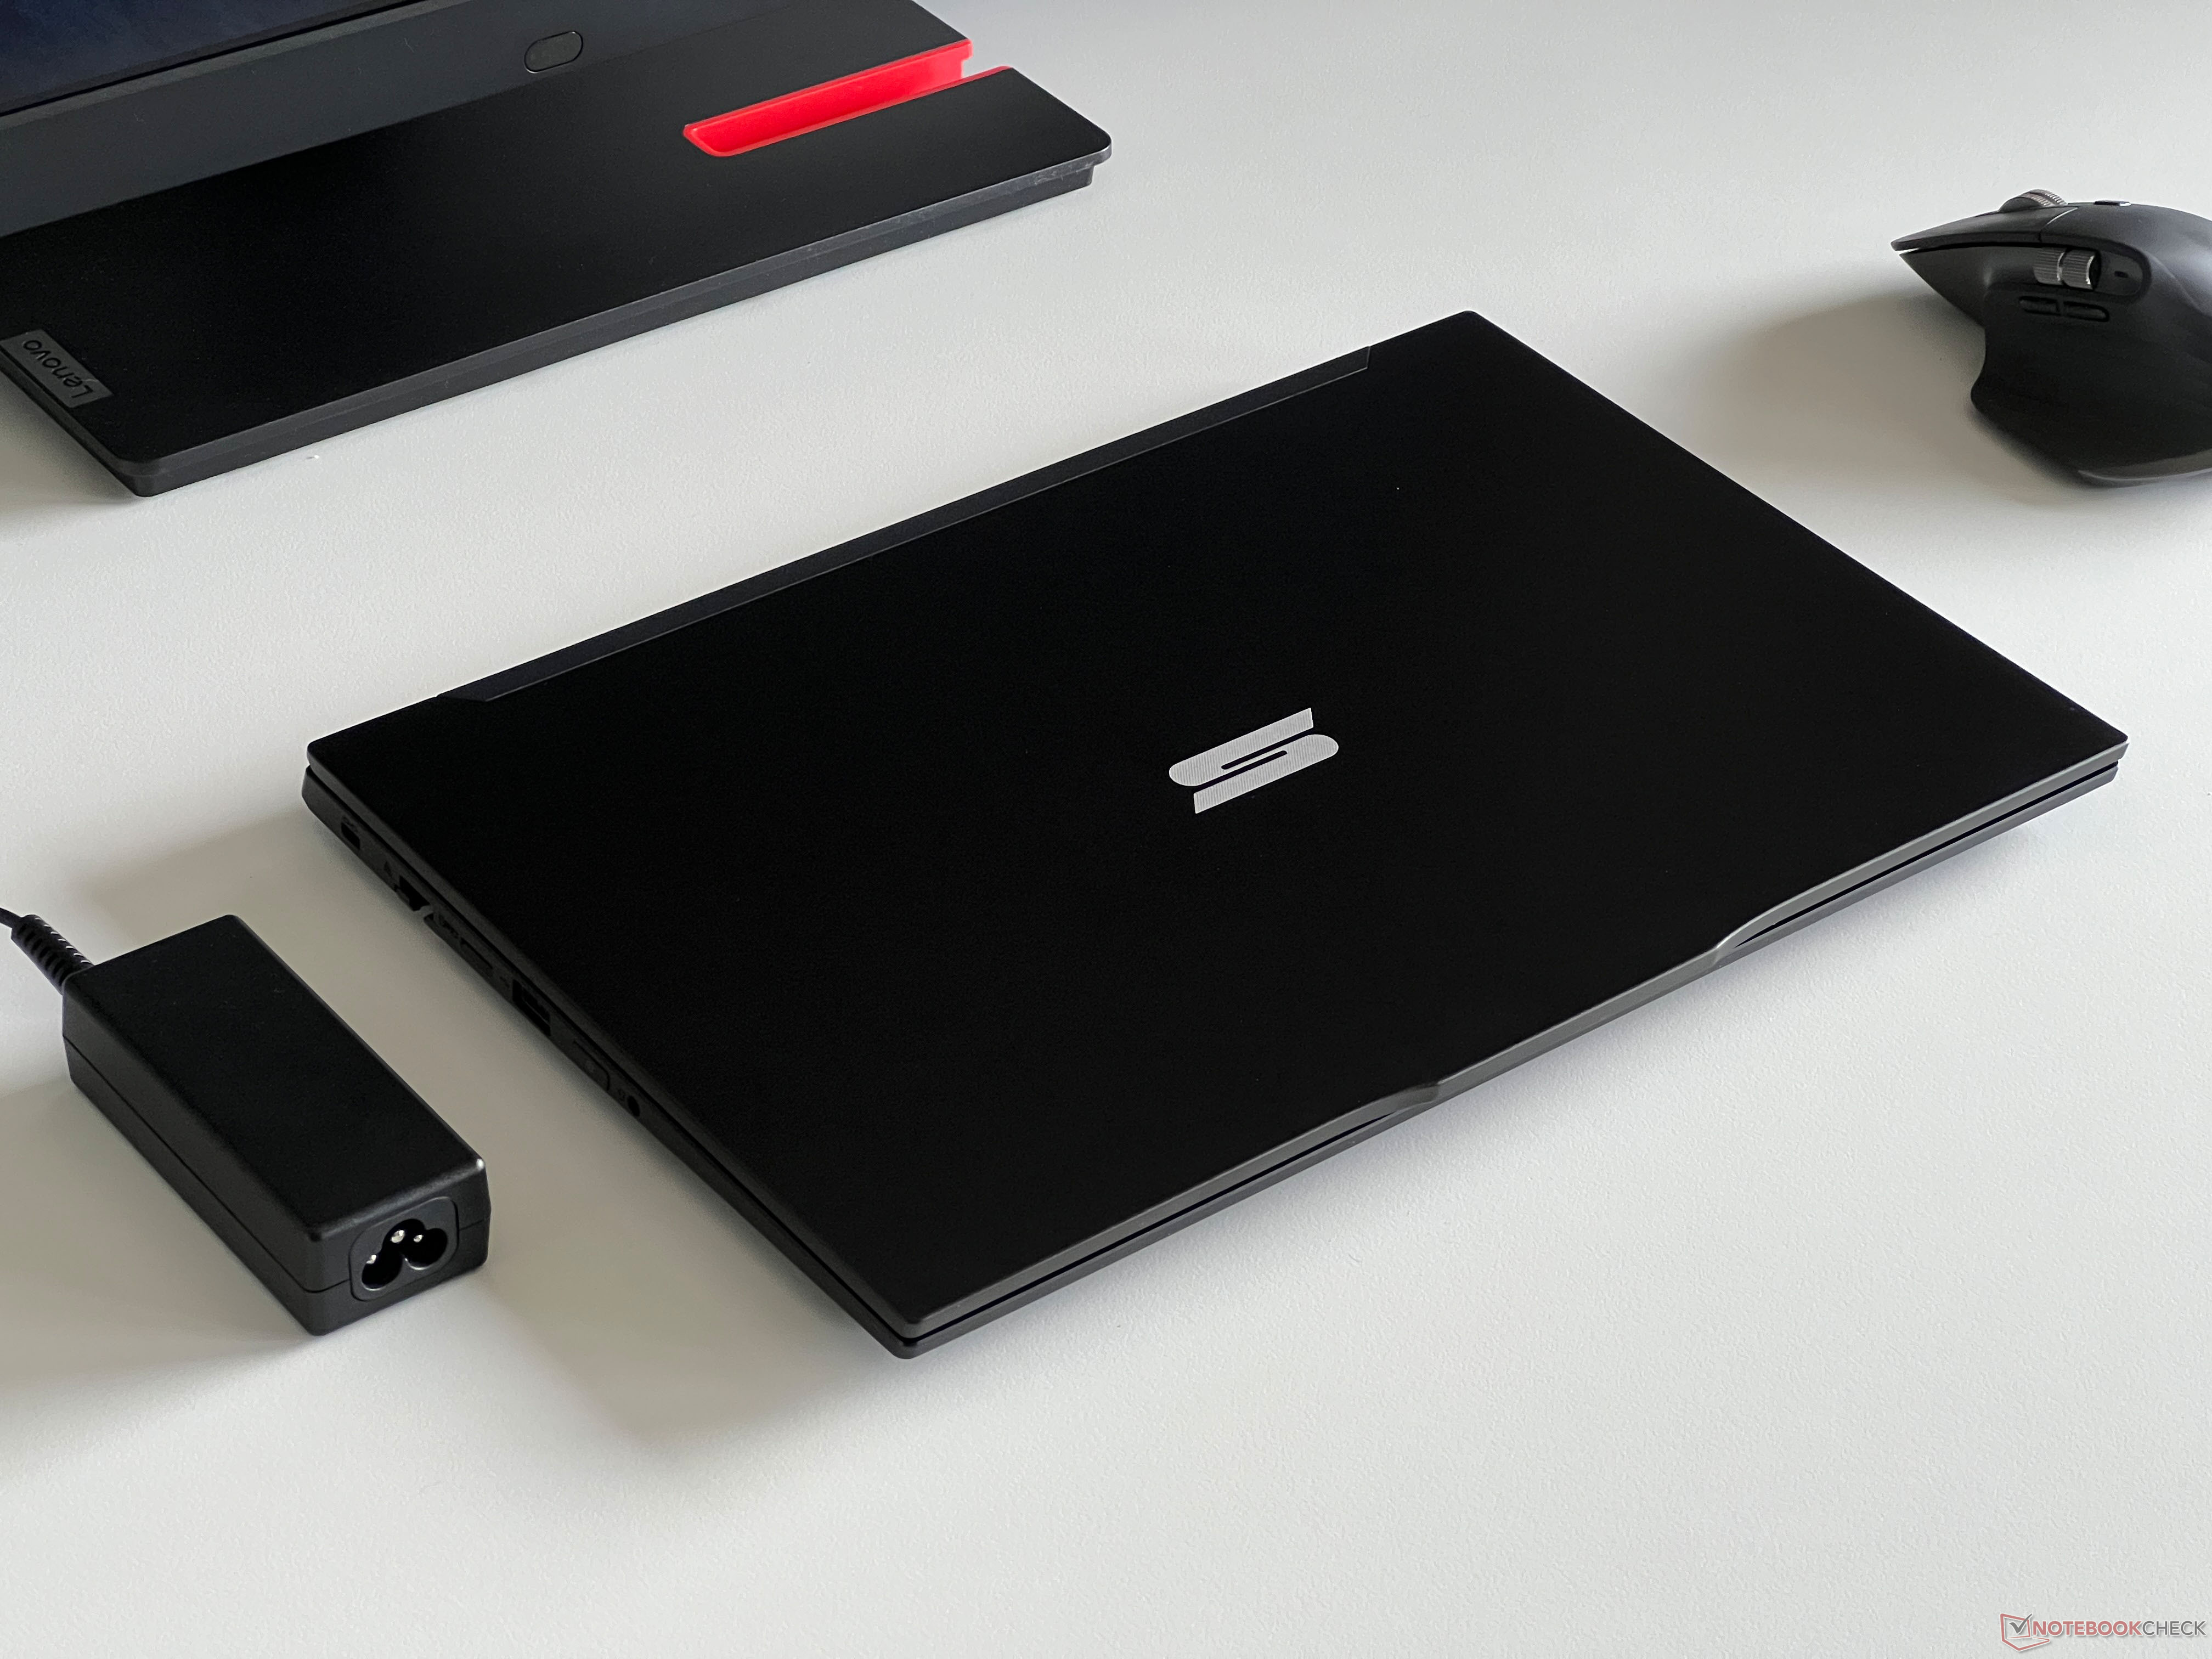
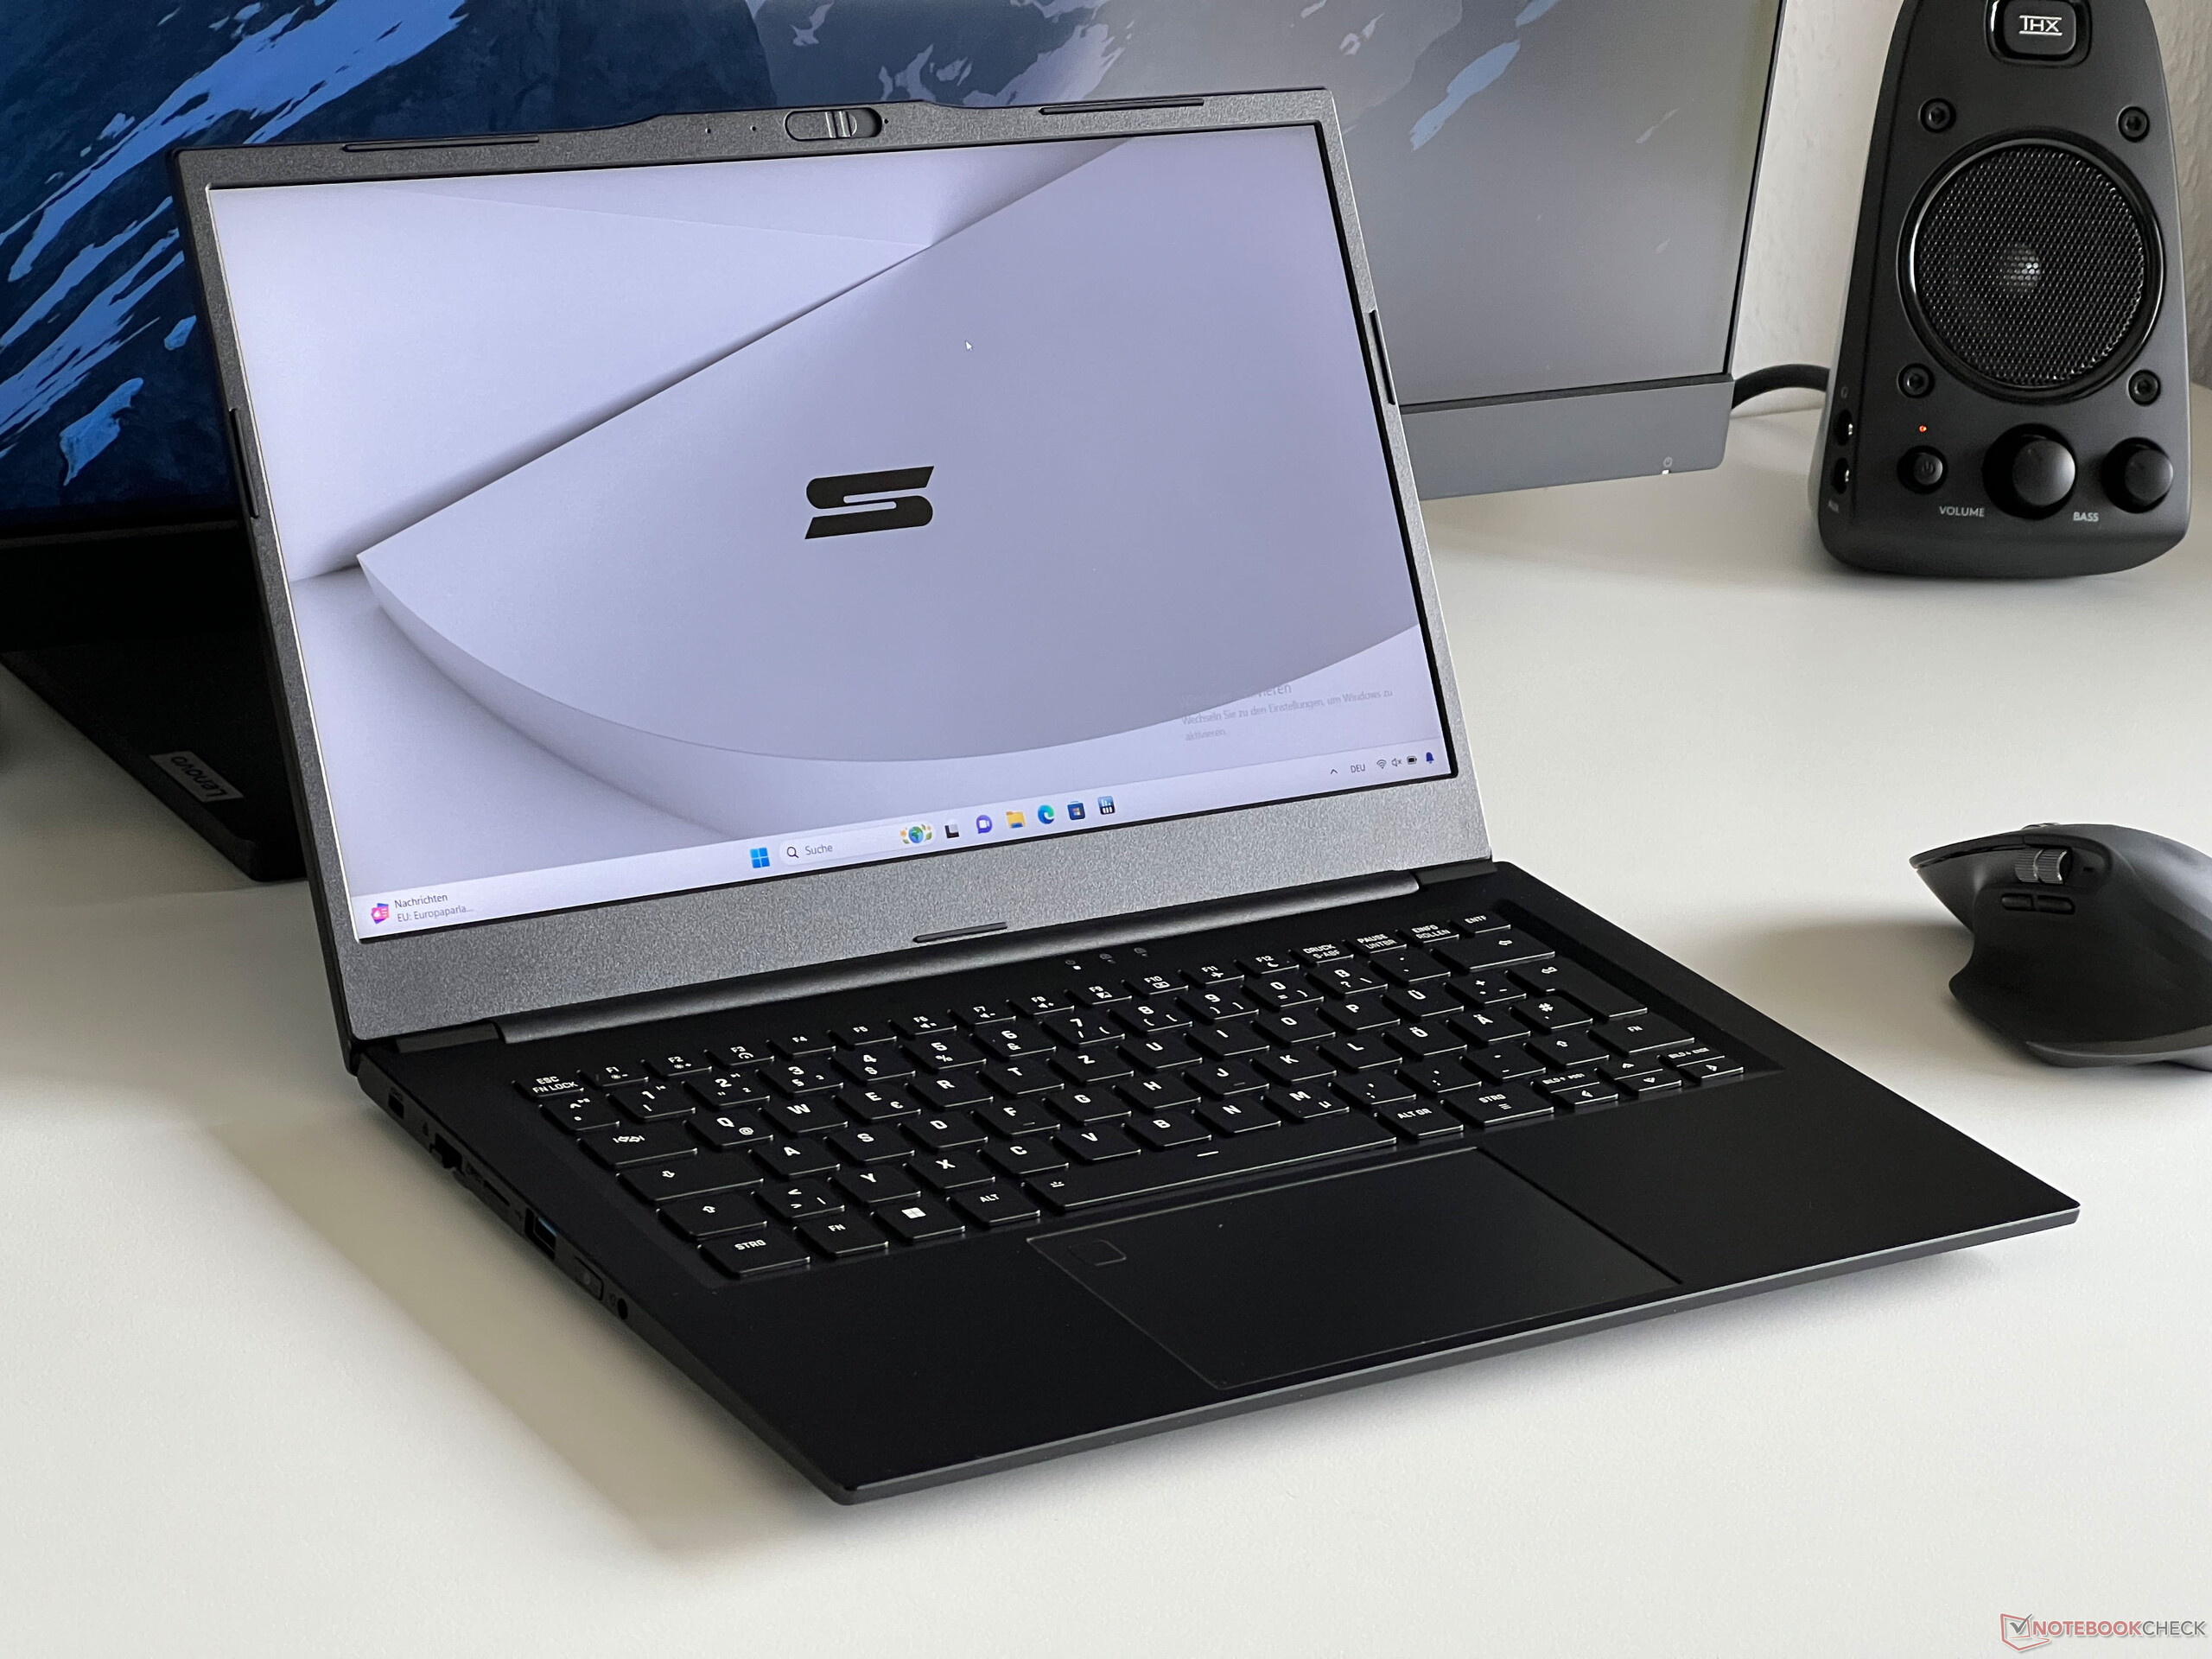
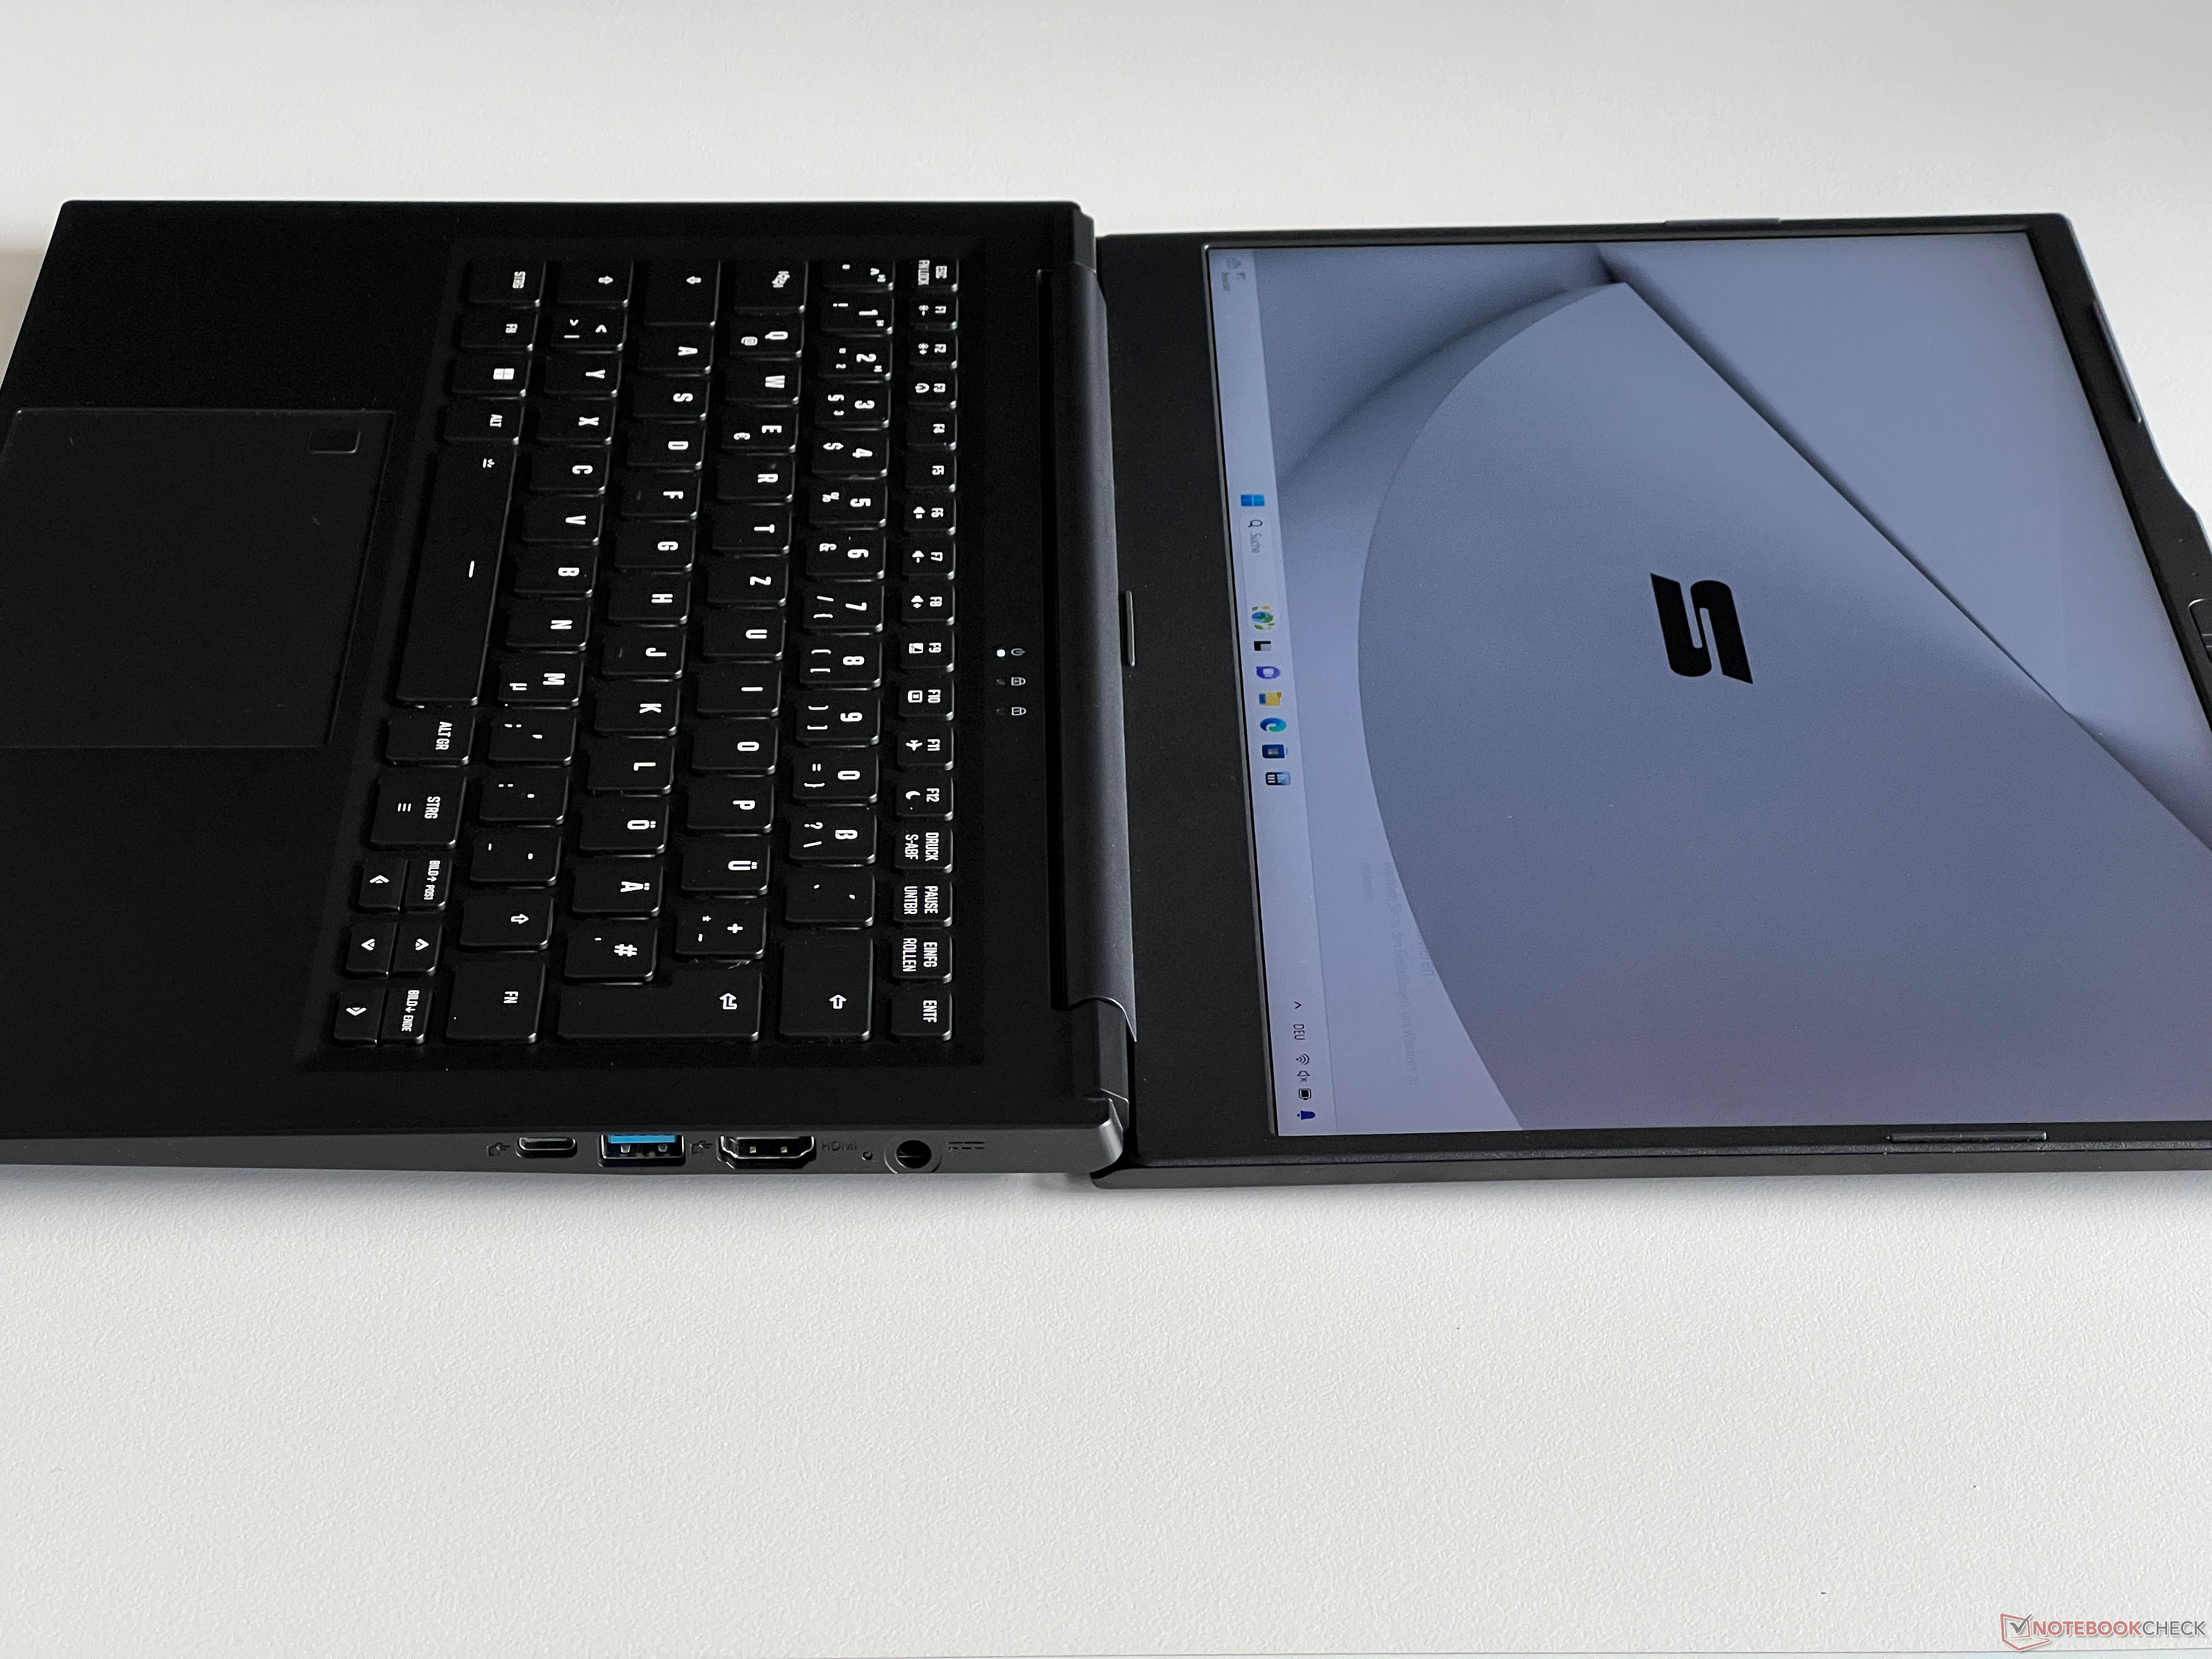
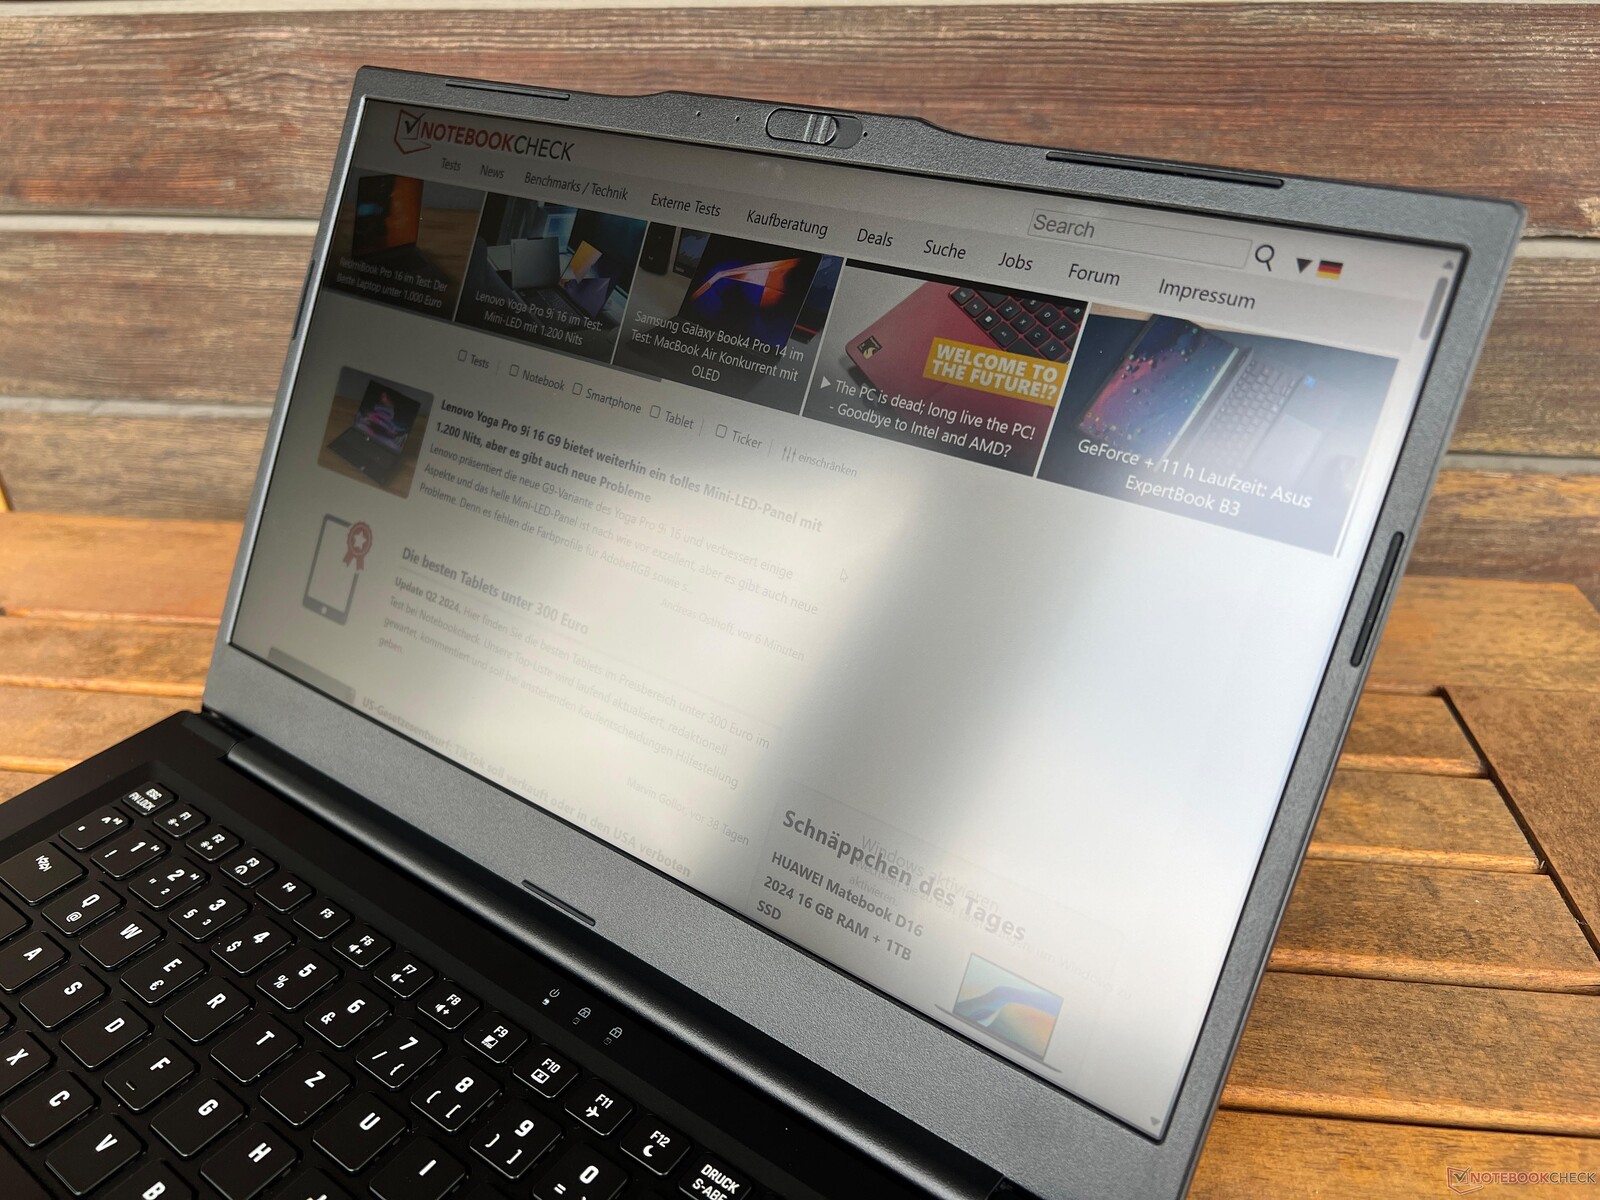
Work 14 Base 采用黑色铝合金外壳,乍一看给人一种相当高品质的印象。不过,光滑的表面极易沾染指纹,需要经常清洁。如果需要额外付费,您可以买到盖子上没有申克标志的笔记本电脑。打开盖子后,迎面而来的是一块 16:9 的面板,底部有一个用粗糙塑料制成的宽框。这看起来不再那么现代了。它的稳定性尚可,但我们注意到在扭转笔记本电脑时,尤其是在打开显示屏(最大打开角度为 180 度)时,会发出轻微的吱吱声。
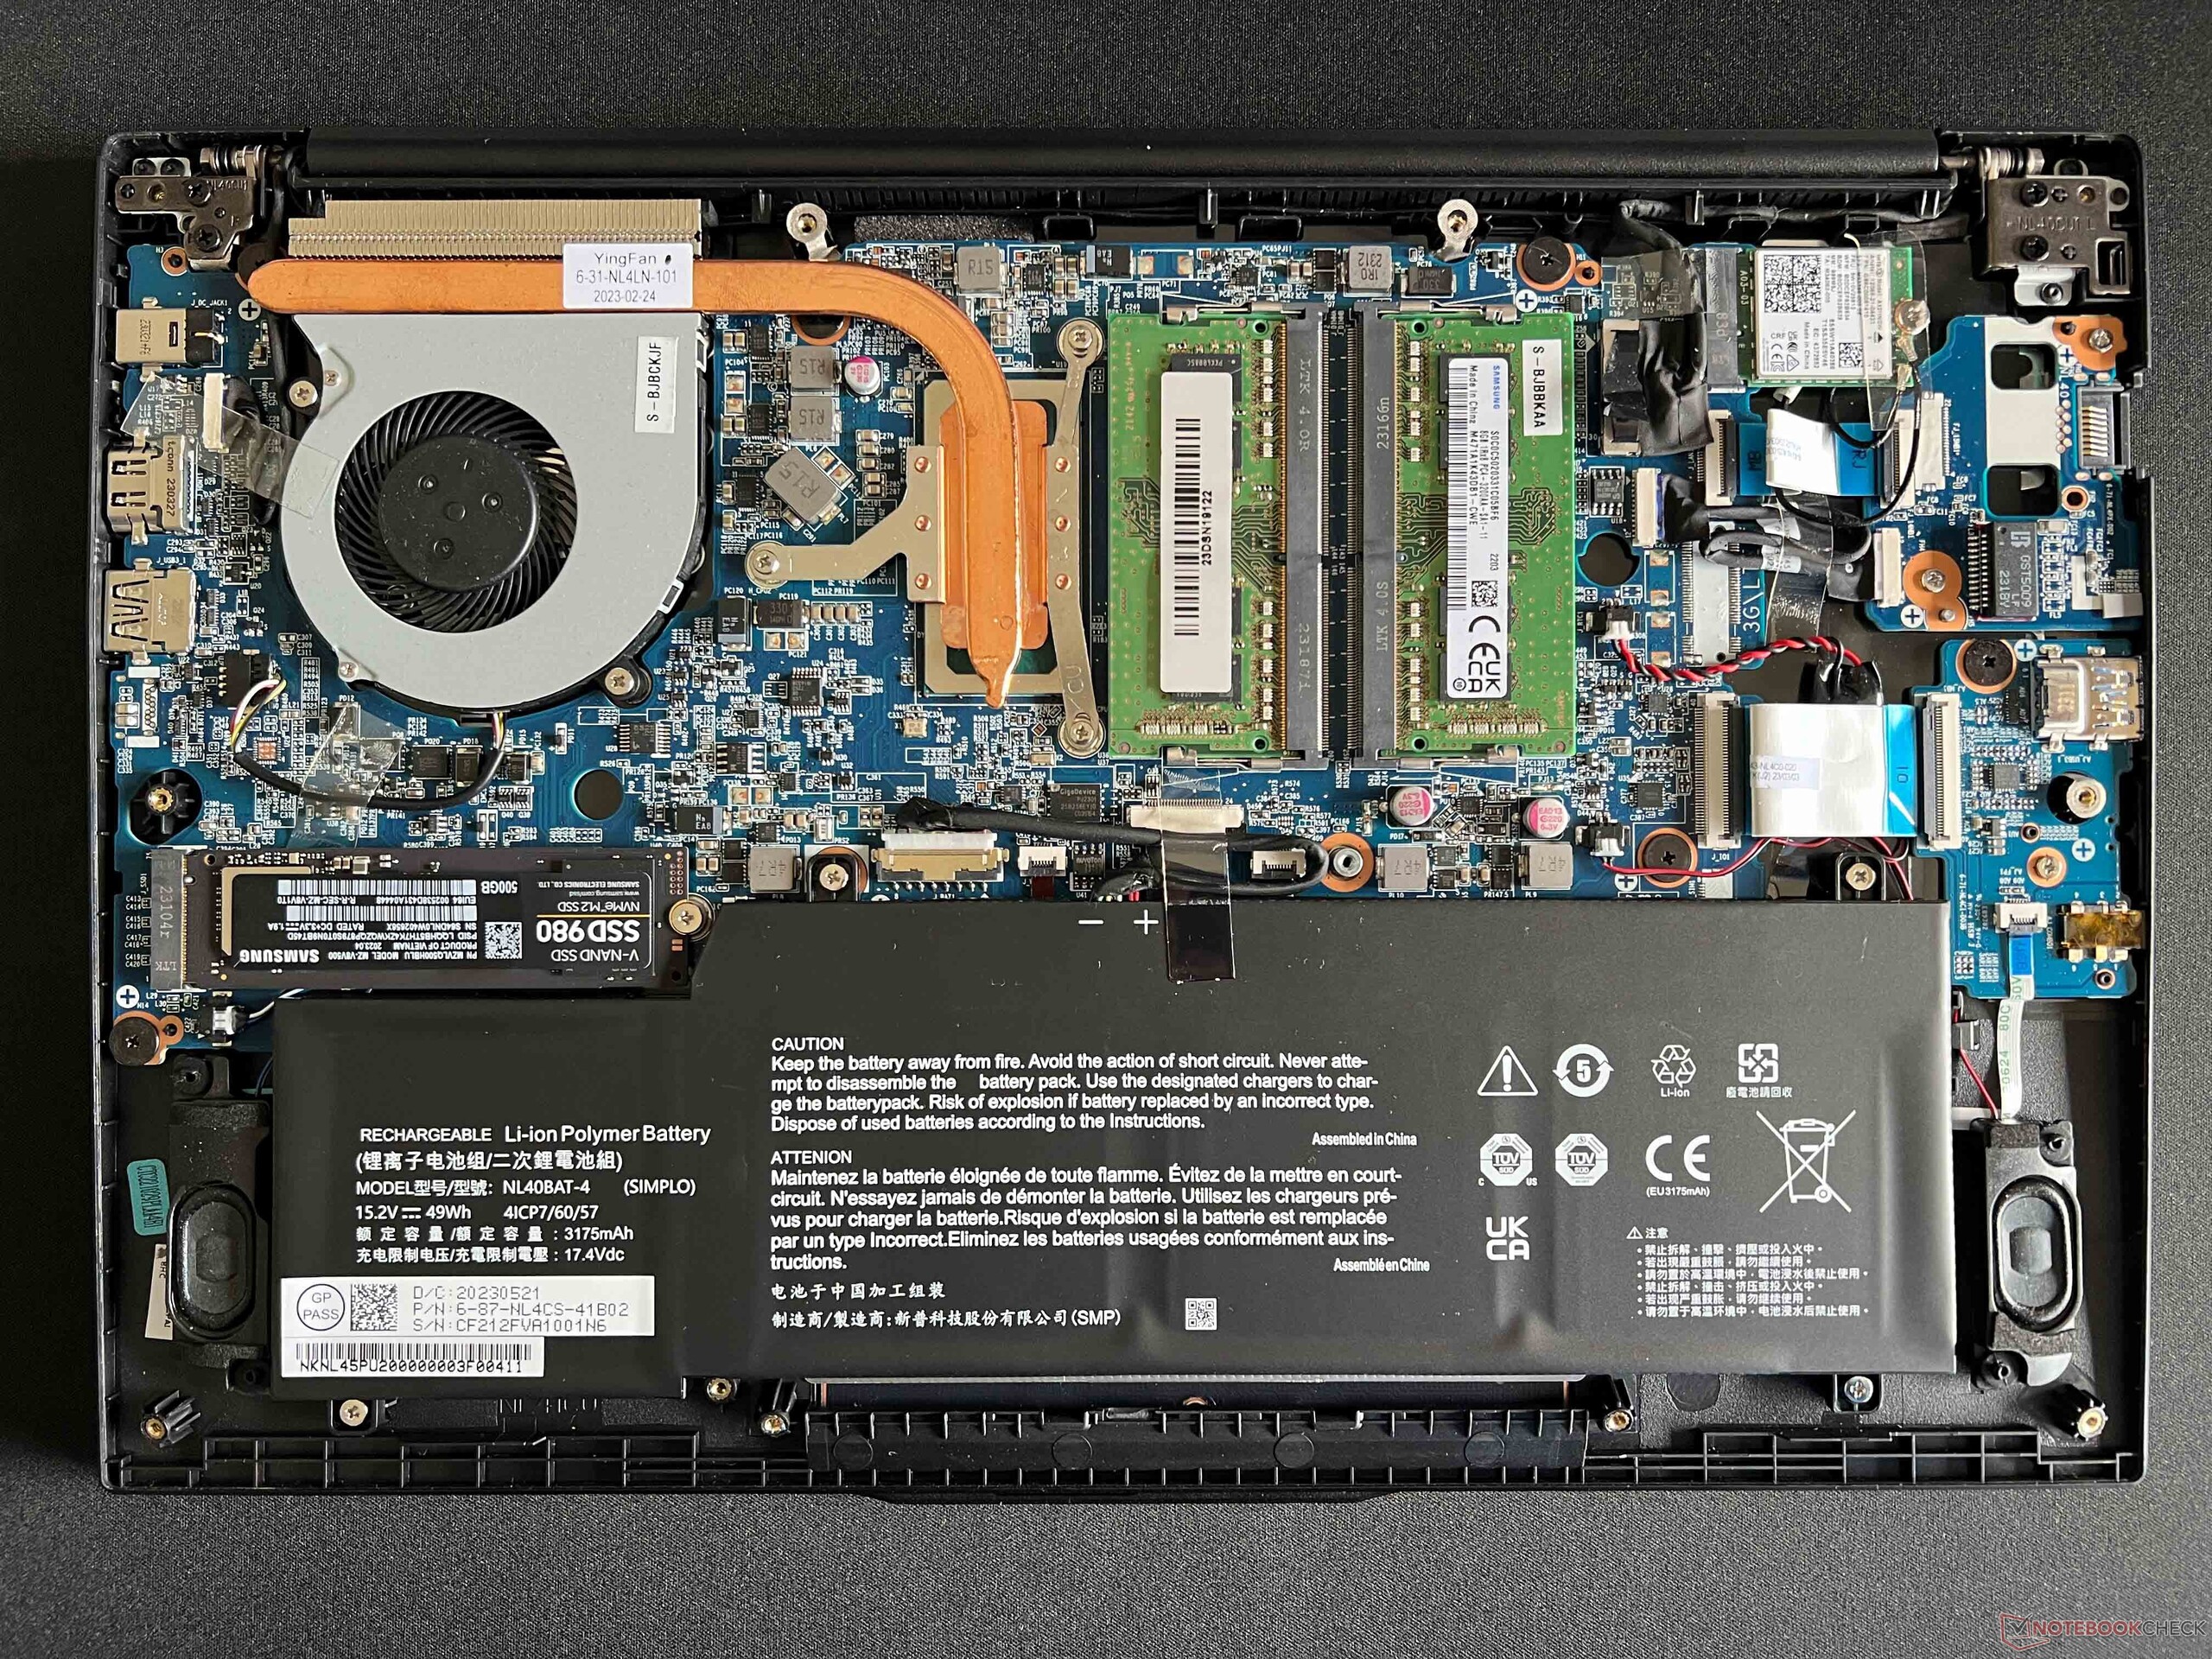
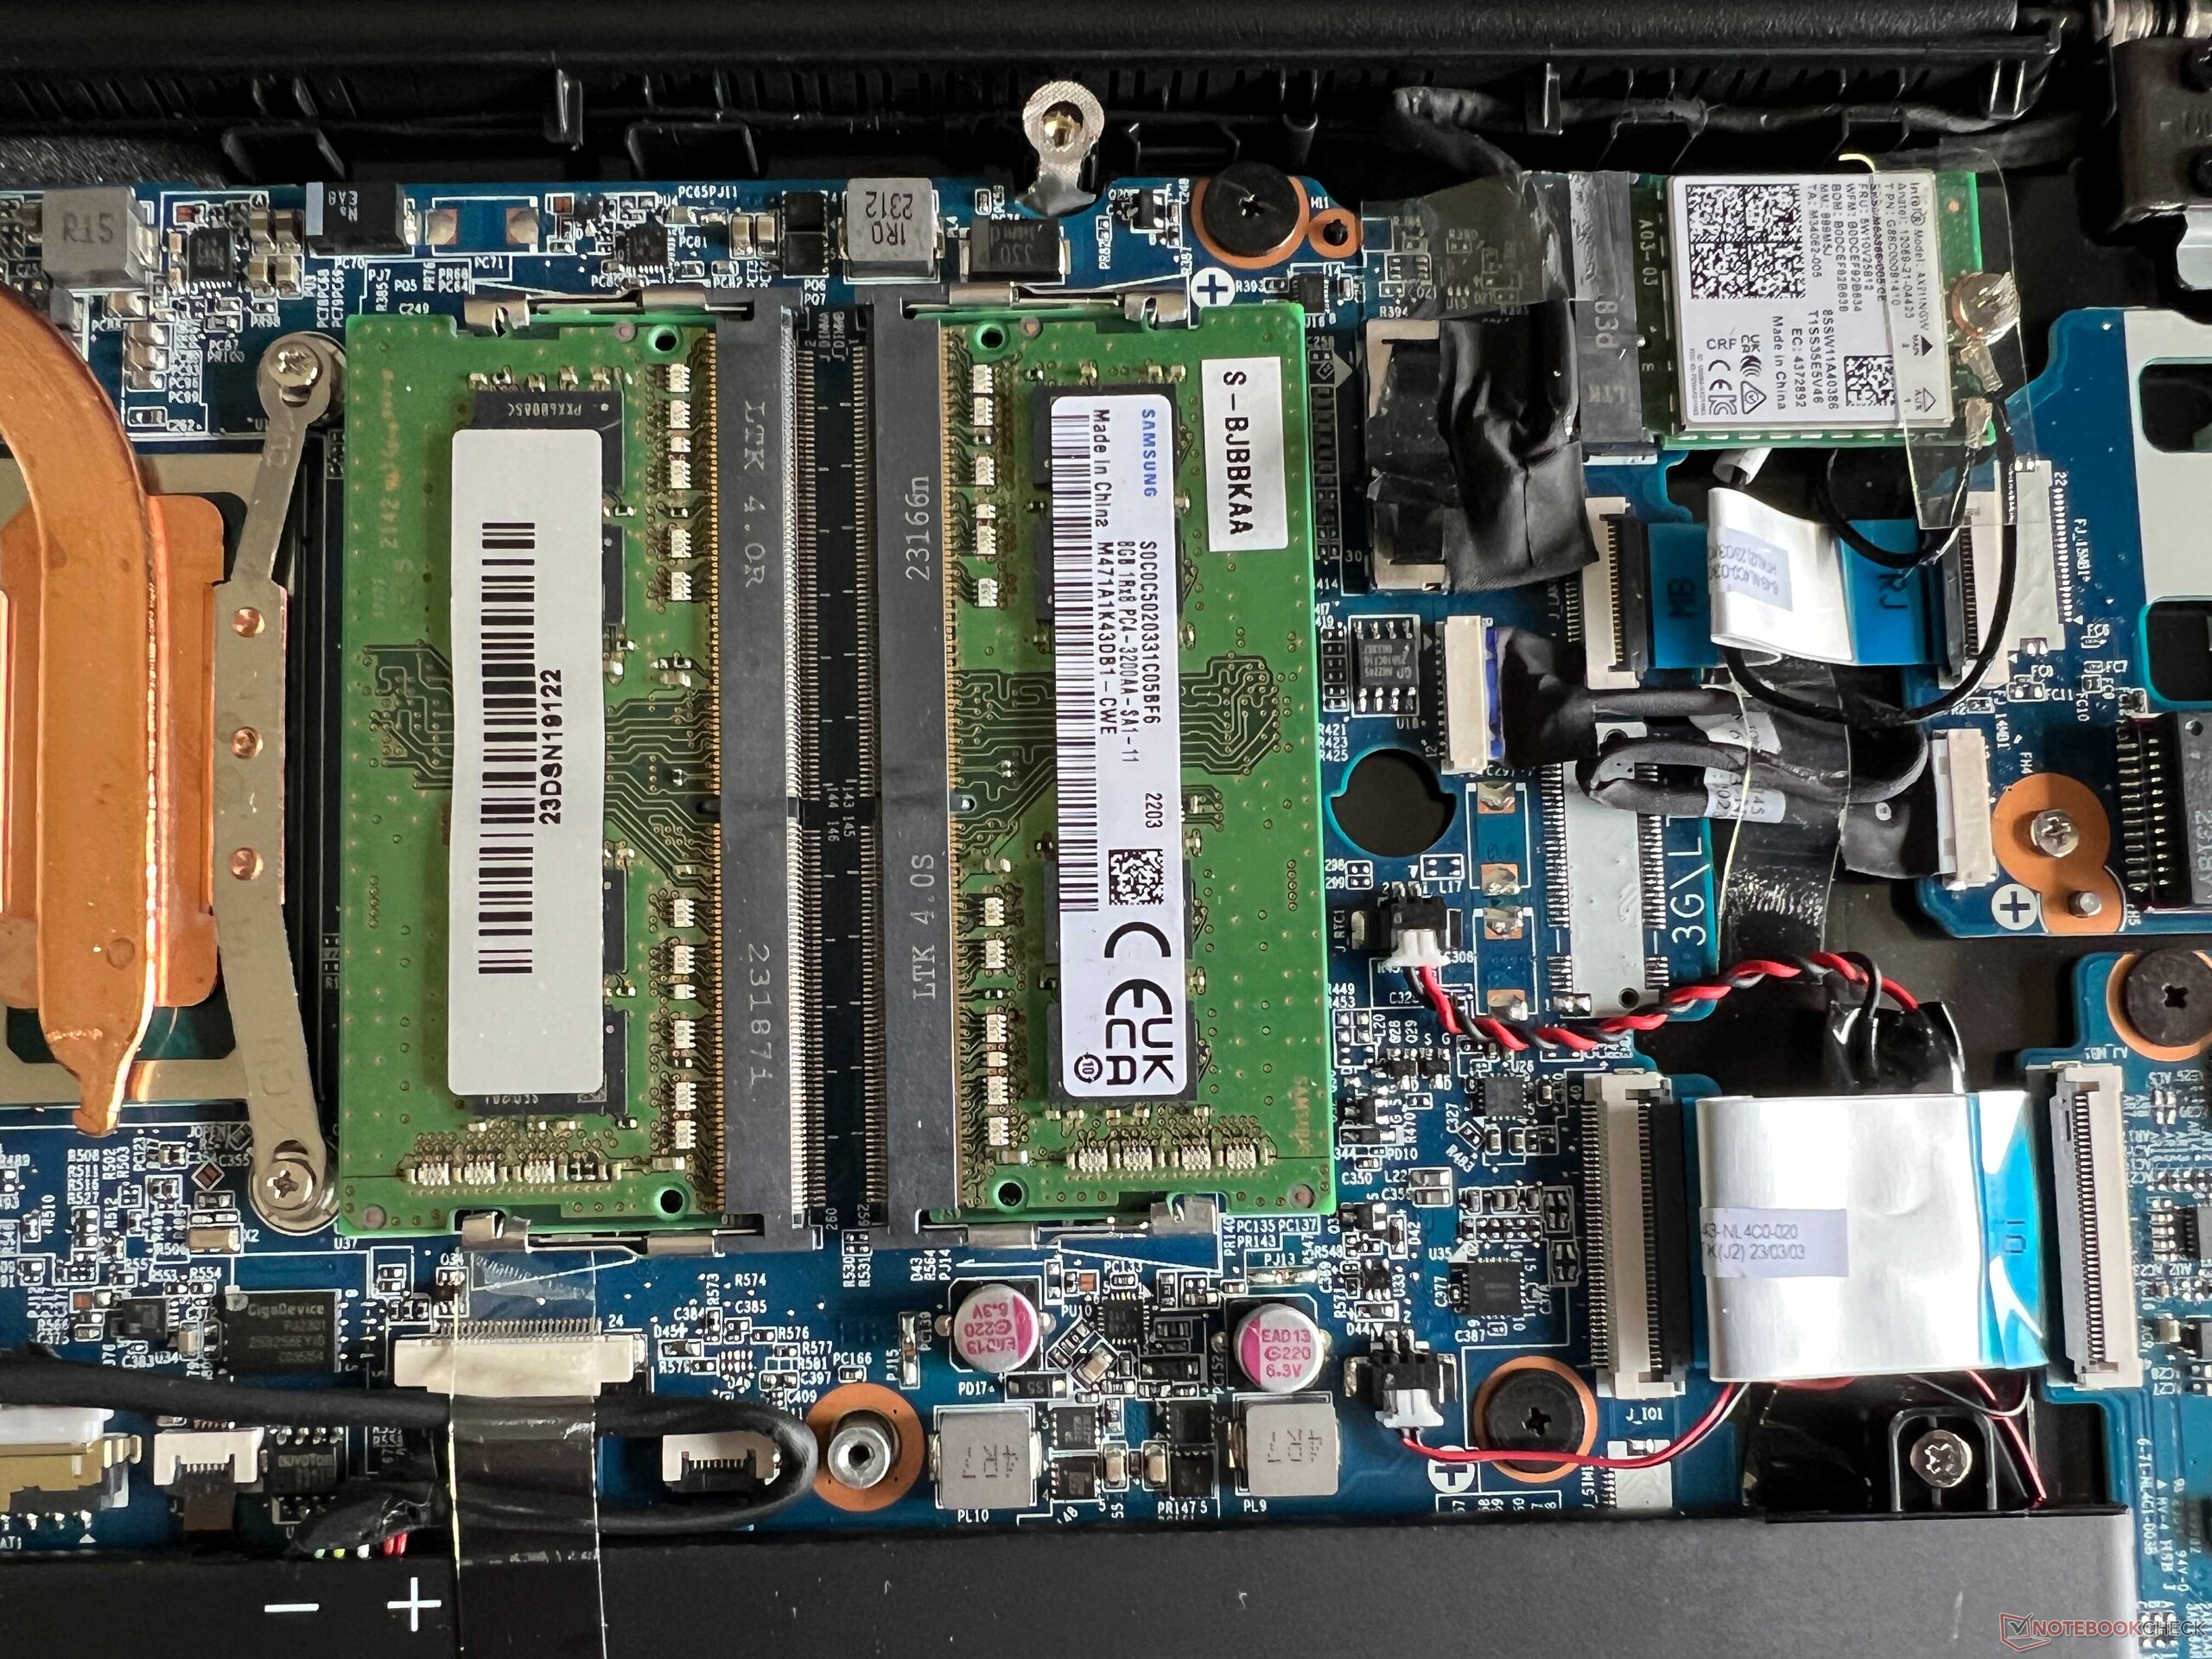
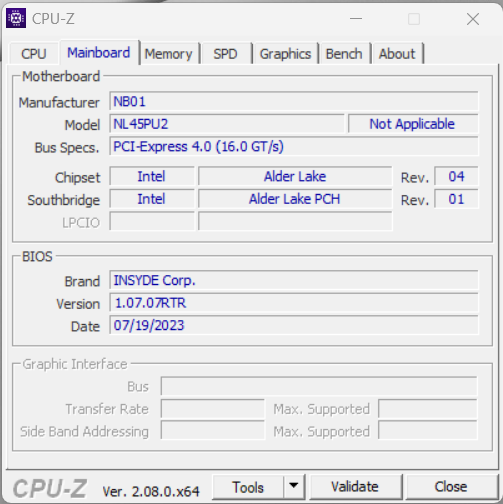
底盖由普通的飞利浦螺钉固定,可以轻松拆卸。这款笔记本电脑的升级选项非常丰富,有两个内存插槽可供选择,当然,固态硬盘和 WLAN 型号也可以升级。实际上,这款设备已经配备了英特尔公司生产的相当先进的 WLAN 模块(AX211),其传输速率也非常高。
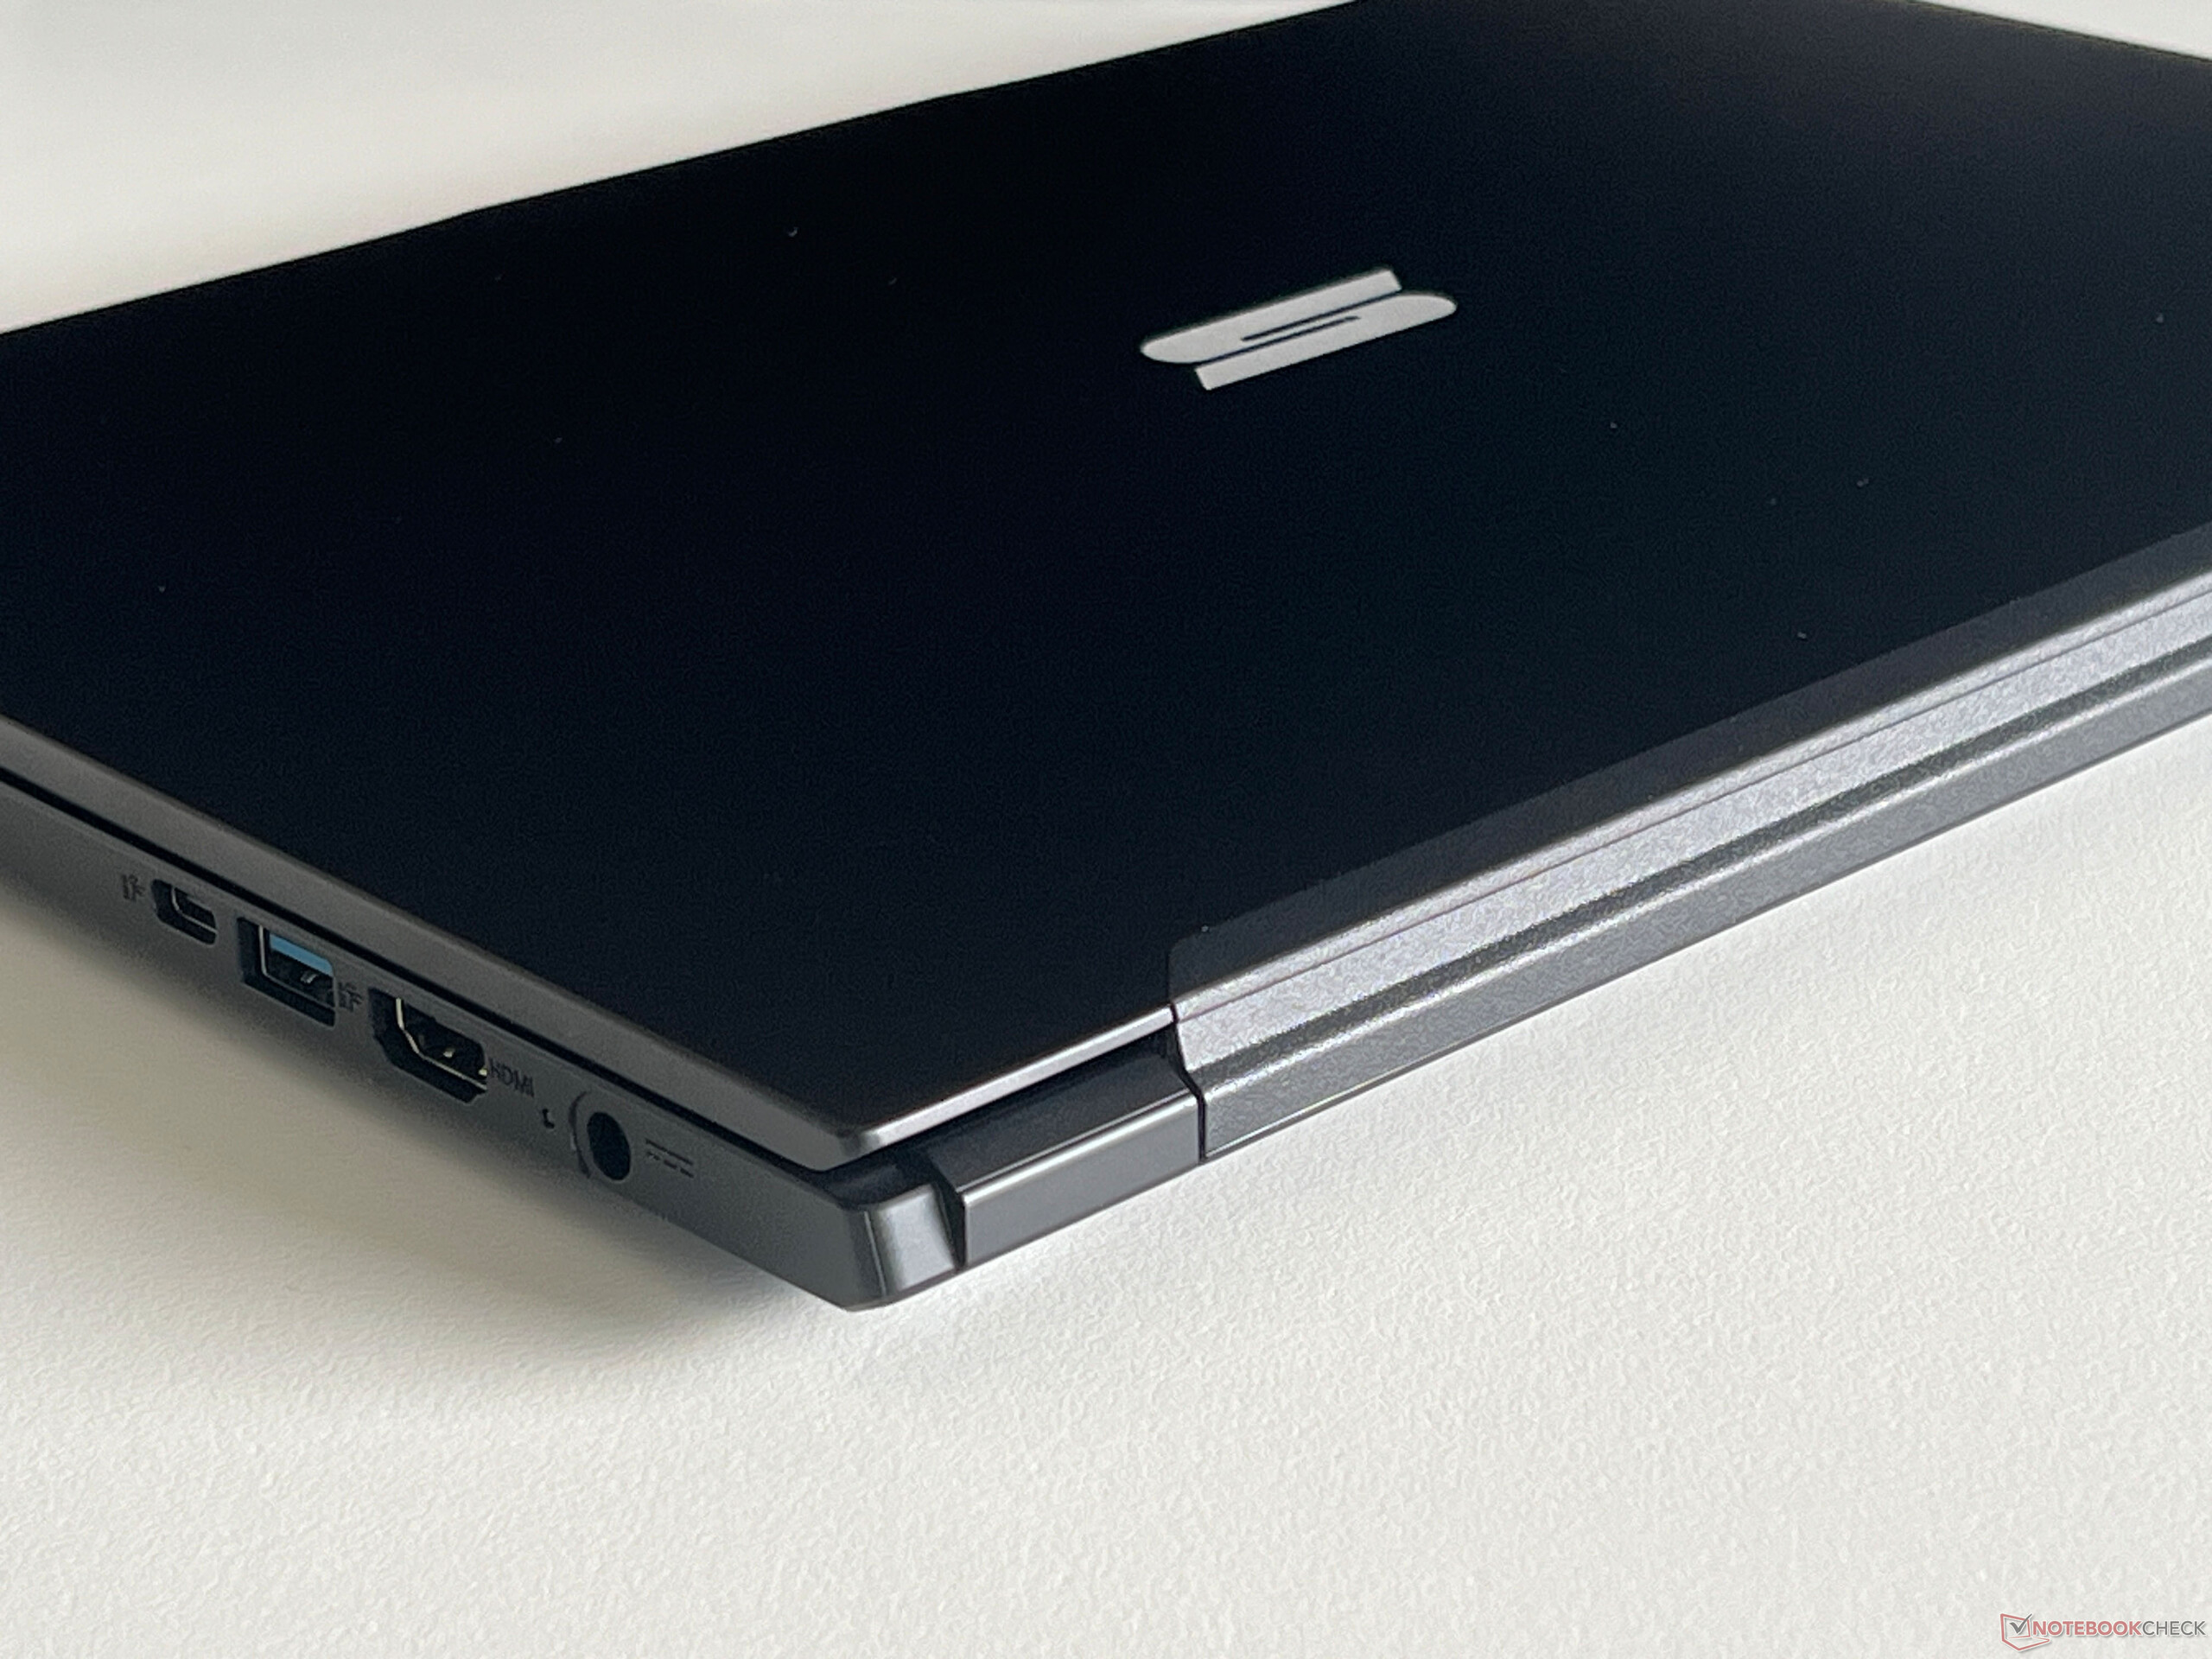
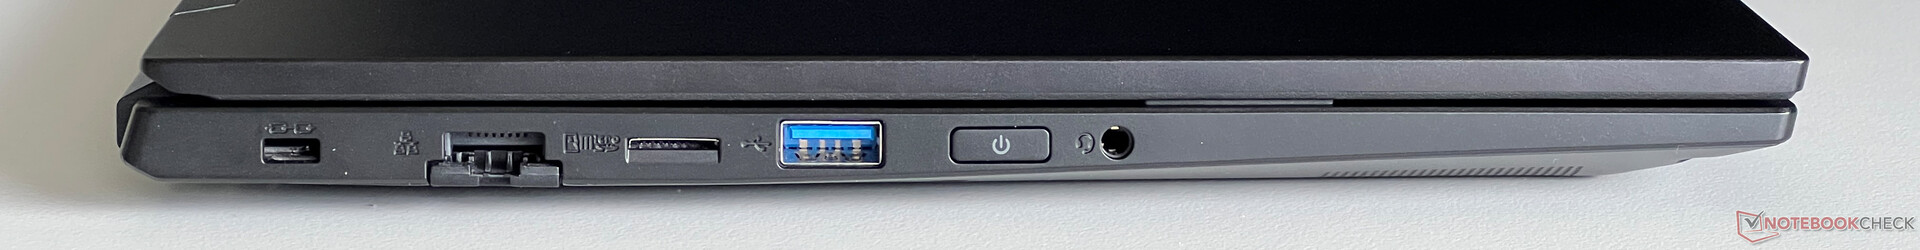
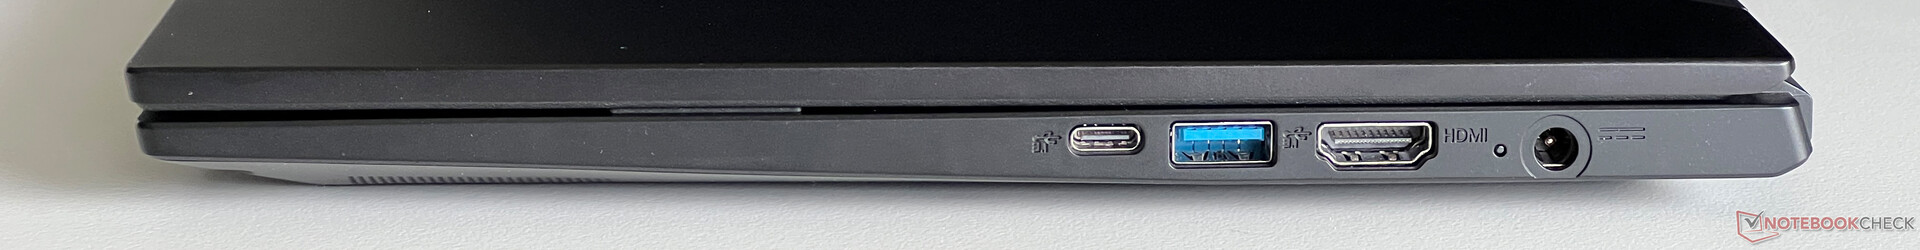
连接选项是 Work 14 的另一个优势。虽然没有 USB 4.0 和 Thunderbolt,但它配备了足够多的 USB 接口,而且还可以使用 USB-C 扩展坞。此外,它还配备了千兆以太网端口。它的 1080p 网络摄像头包括一个机械盖,拍摄的照片效果一般。

| SD Card Reader | |
| average JPG Copy Test (av. of 3 runs) | |
| SCHENKER Work 14 Base (Angelbird AV Pro V60) | |
| Lenovo ThinkPad L14 G4 21H6S00900 | |
| Average of class Office (22.7 - 198.5, n=35, last 2 years) | |
| Acer Swift Go 14 SFG14-71 | |
| maximum AS SSD Seq Read Test (1GB) | |
| Lenovo ThinkPad L14 G4 21H6S00900 (AV Pro V60) | |
| SCHENKER Work 14 Base (Angelbird AV Pro V60) | |
| Average of class Office (25 - 249, n=31, last 2 years) | |
| Acer Swift Go 14 SFG14-71 (AV Pro SD microSD 128 GB V60) | |
| Networking | |
| SCHENKER Work 14 Base | |
| iperf3 transmit AXE11000 | |
| iperf3 receive AXE11000 | |
| Acer Swift Go 14 SFG14-71 | |
| iperf3 transmit AXE11000 | |
| iperf3 receive AXE11000 | |
| iperf3 transmit AXE11000 6GHz | |
| iperf3 receive AXE11000 6GHz | |
| HP ProBook 445 G10 | |
| iperf3 transmit AXE11000 | |
| iperf3 receive AXE11000 | |
| Dell Latitude 3440 | |
| iperf3 transmit AXE11000 | |
| iperf3 receive AXE11000 | |
| iperf3 transmit AXE11000 6GHz | |
| iperf3 receive AXE11000 6GHz | |
| Lenovo ThinkPad L14 G4 21H6S00900 | |
| iperf3 transmit AXE11000 | |
| iperf3 receive AXE11000 | |
| iperf3 transmit AXE11000 6GHz | |
| iperf3 receive AXE11000 6GHz | |

")
")
输入设备
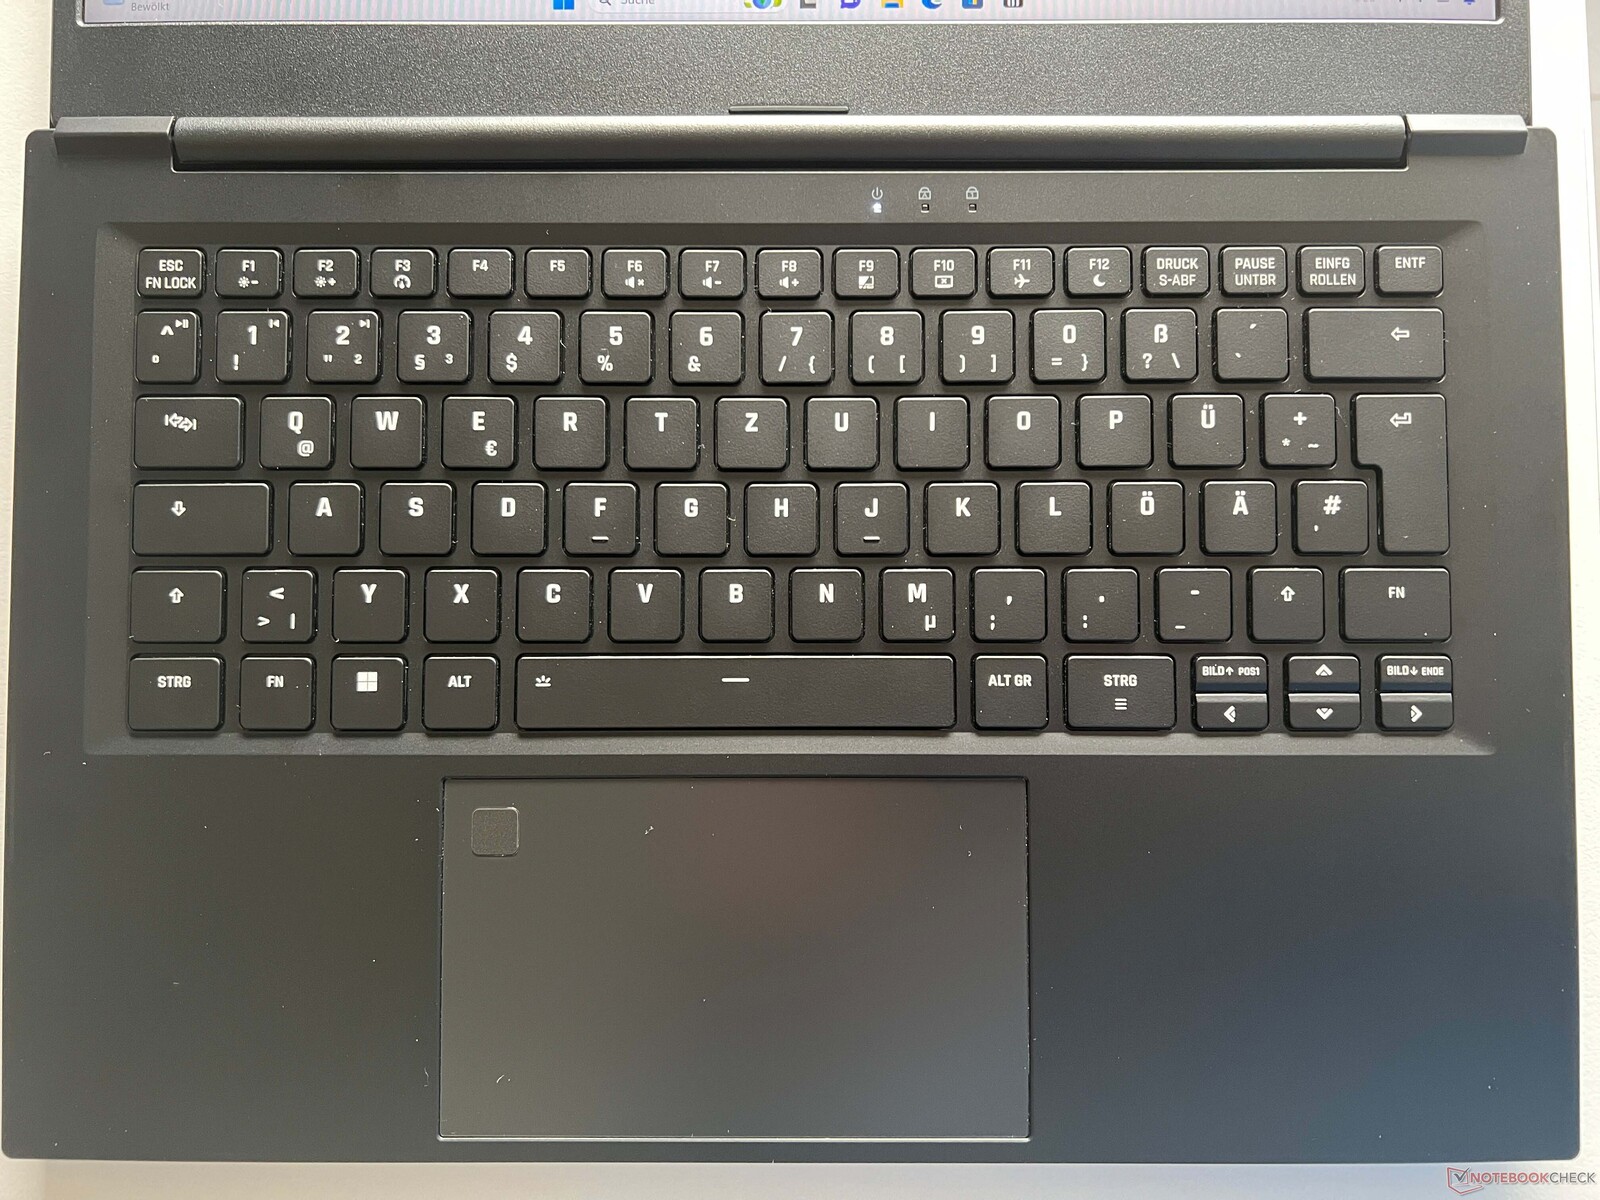
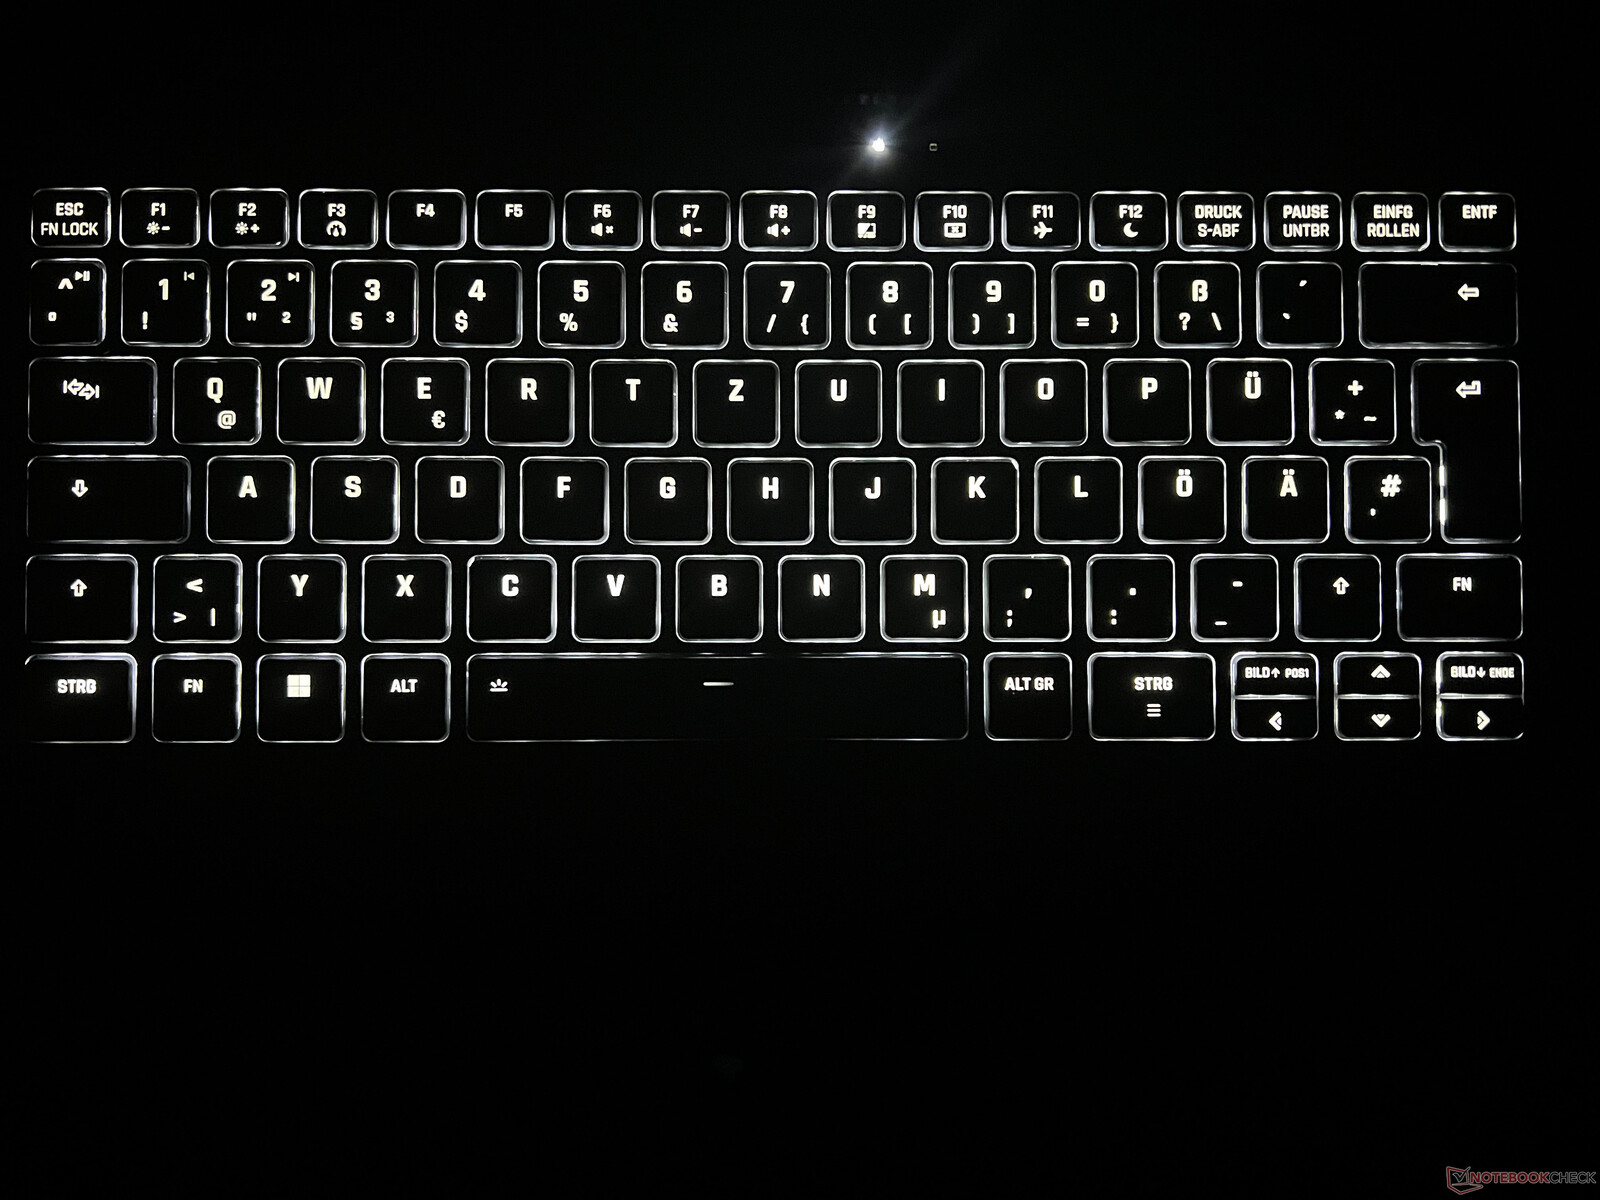
笔记本电脑的黑色 Chiclet 键盘是背光的,打字时感觉很舒适,但按键比一般的键盘要纤细一些,总的来说相当小。方向键实际上更小,但至少有专门的上/下图片键。微软Precision 触摸板足够大,使用起来很舒适(12.1 x 7.3 厘米),左上角配有指纹扫描仪。不过,触摸板并不完全平滑,使用时会感到有些阻力。此外,它的咔哒声听起来非常响亮和廉价,这意味着我们建议在输入时只敲击键盘而不是按压键盘。
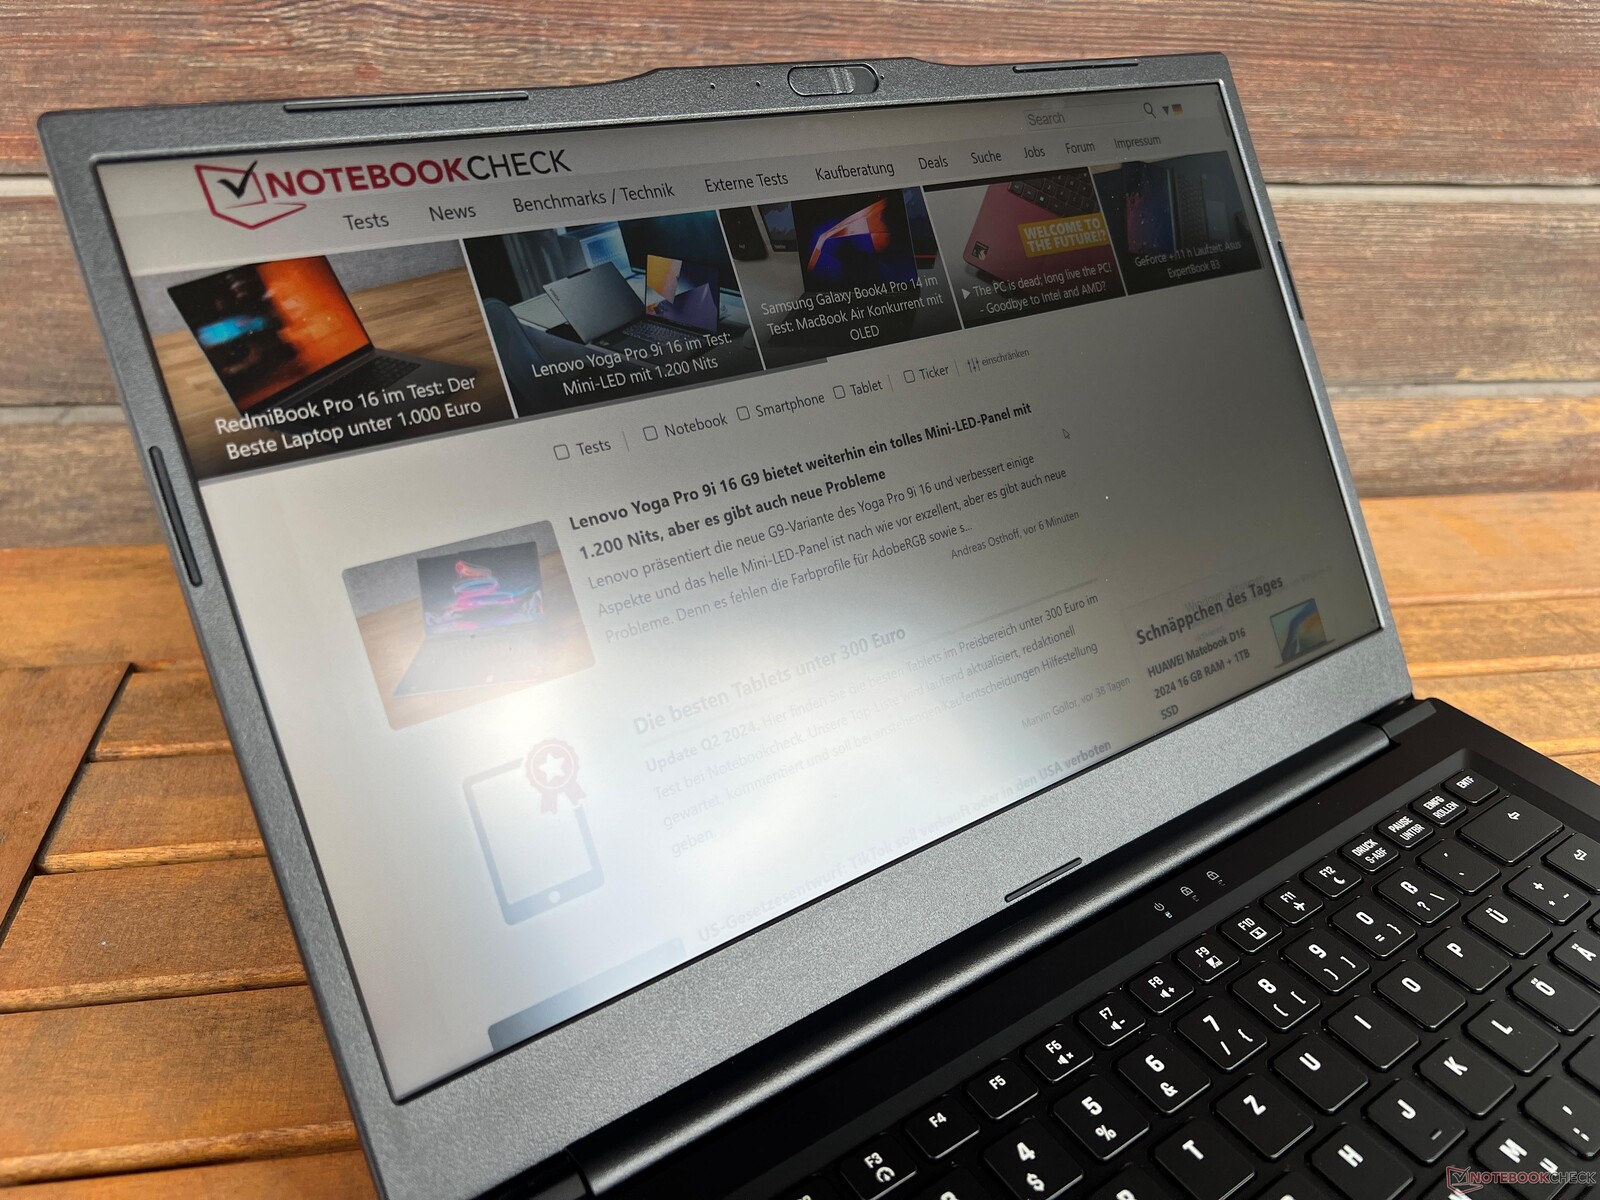
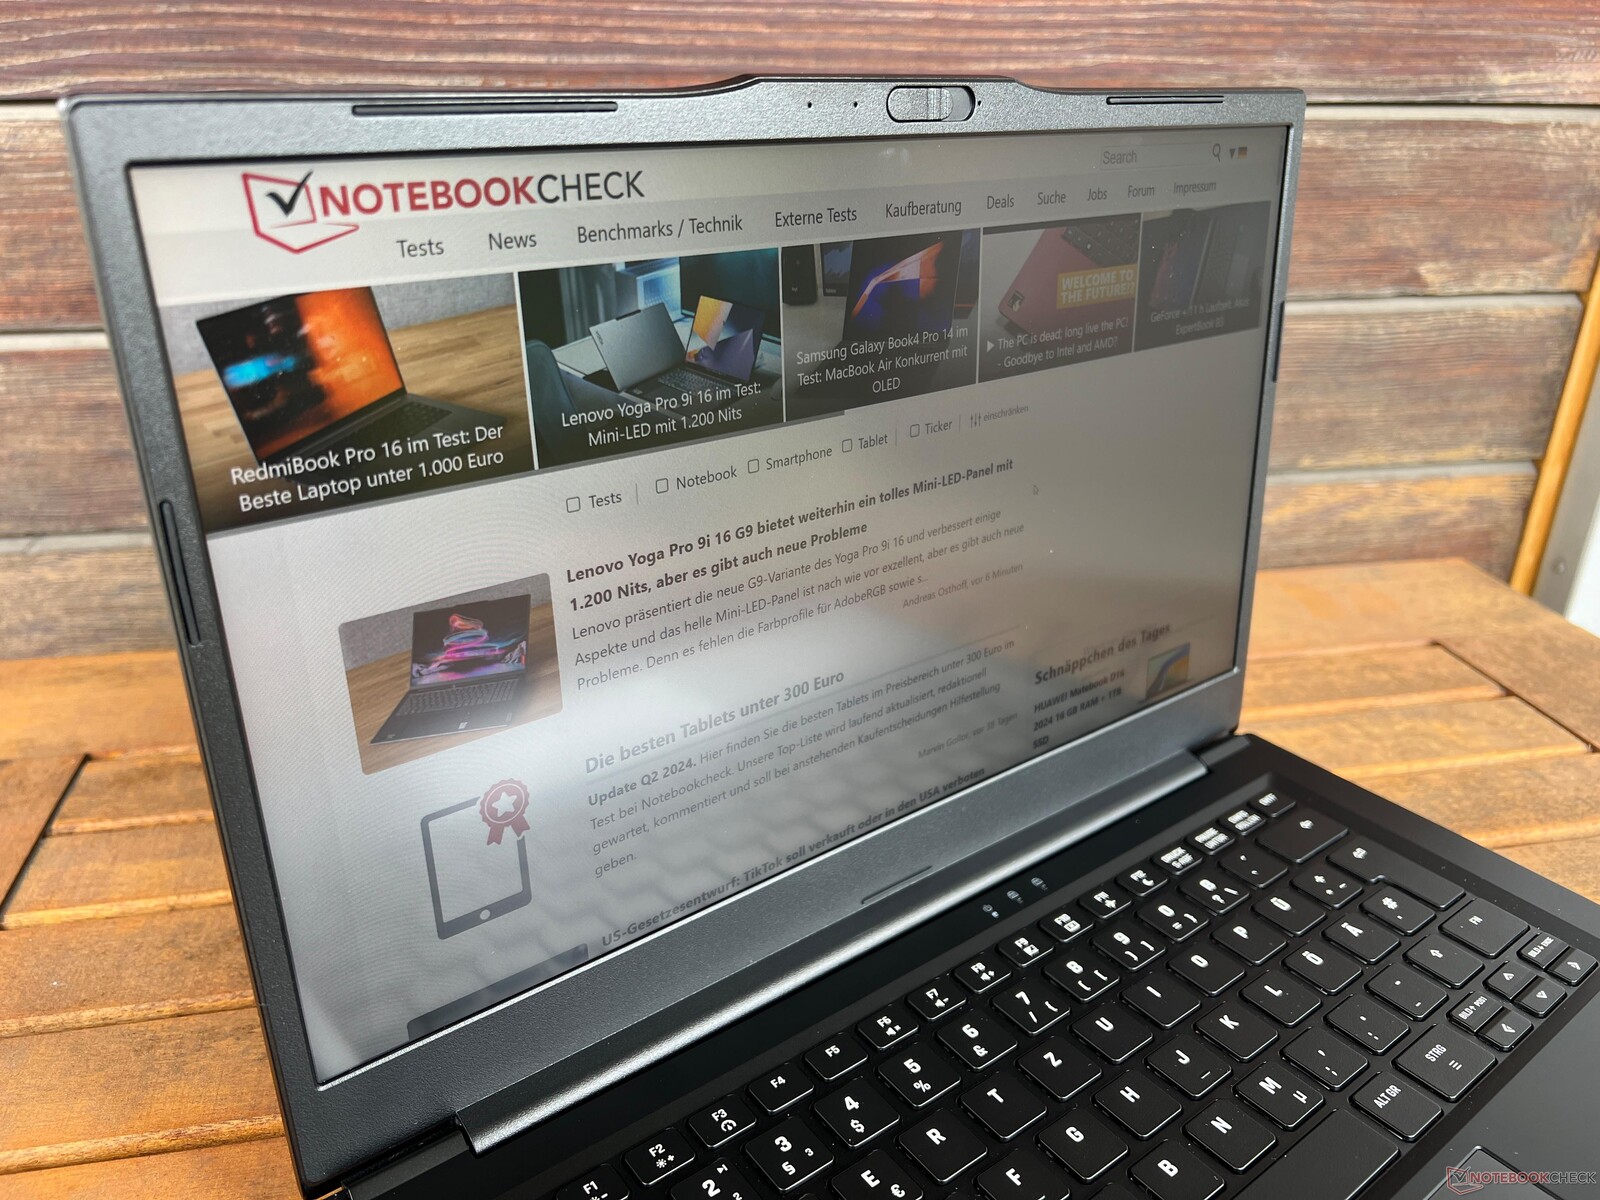
显示屏 - 雾面 IPS 面板
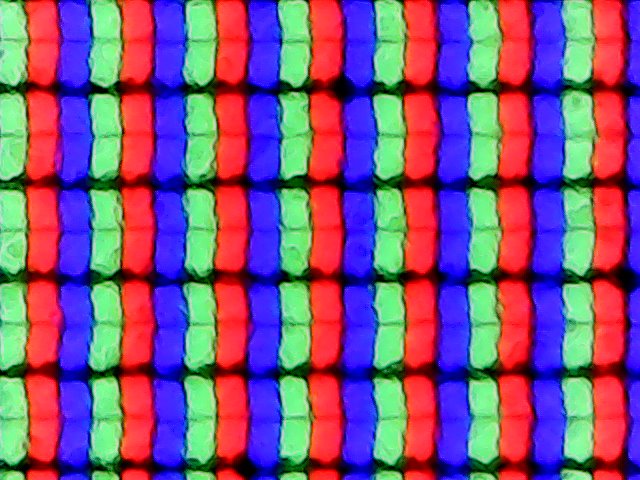
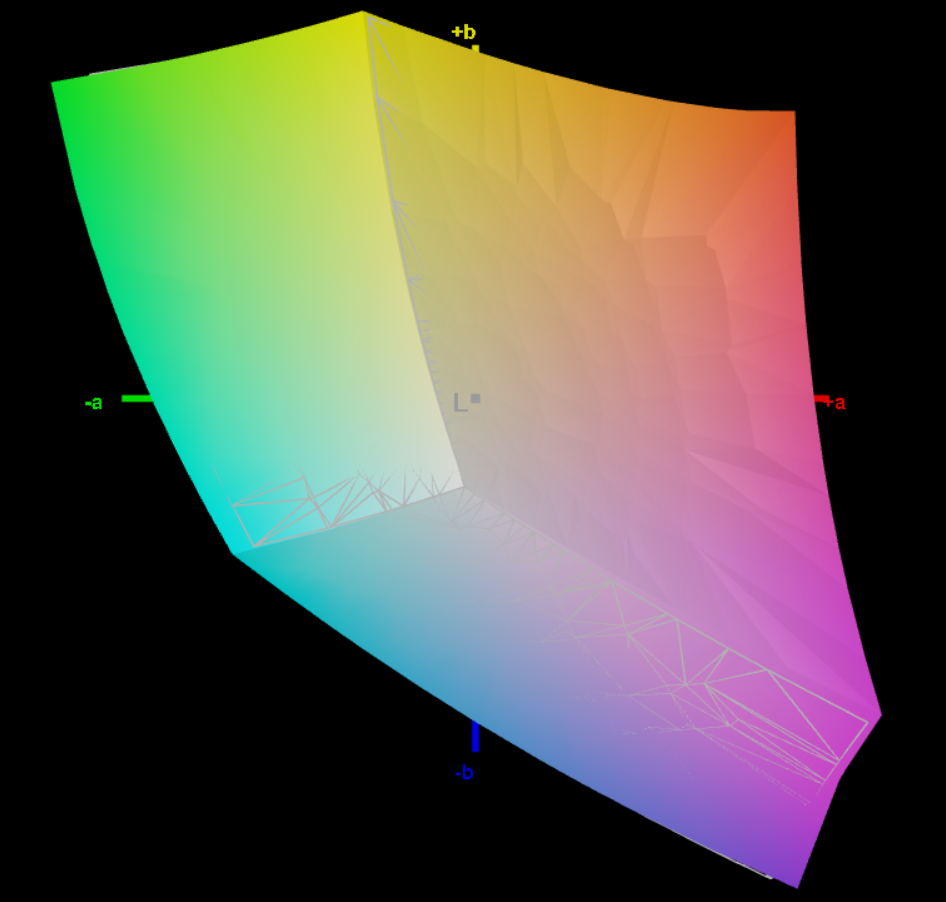
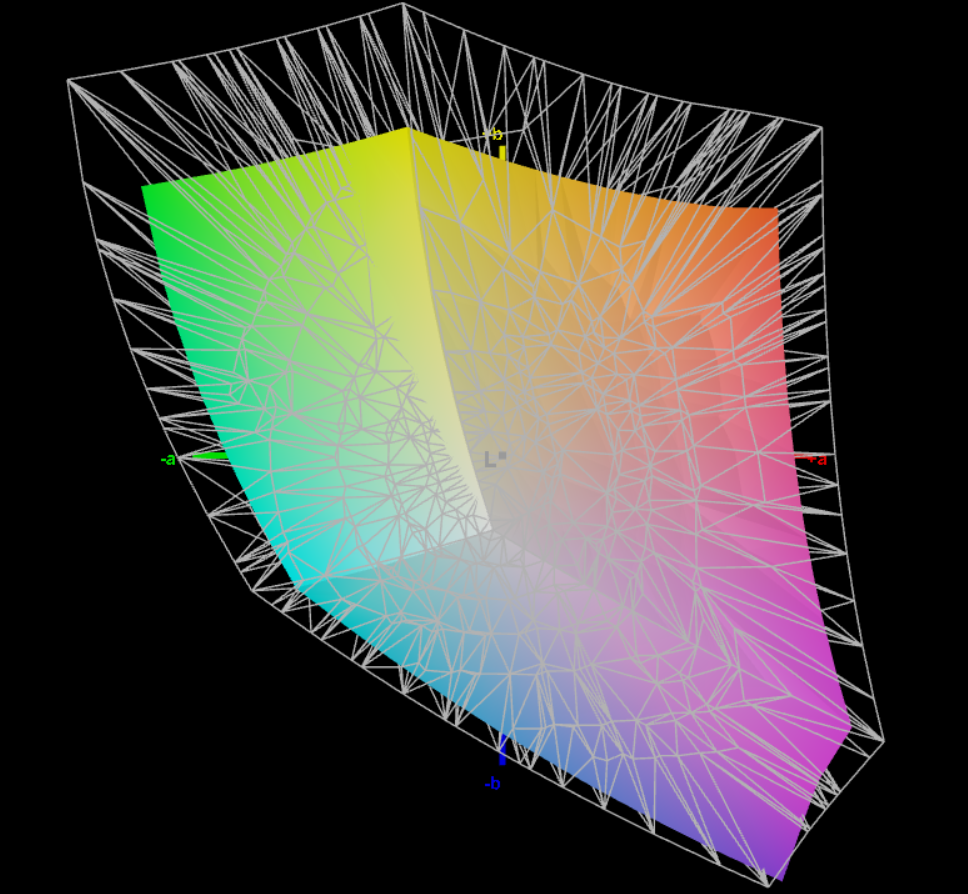
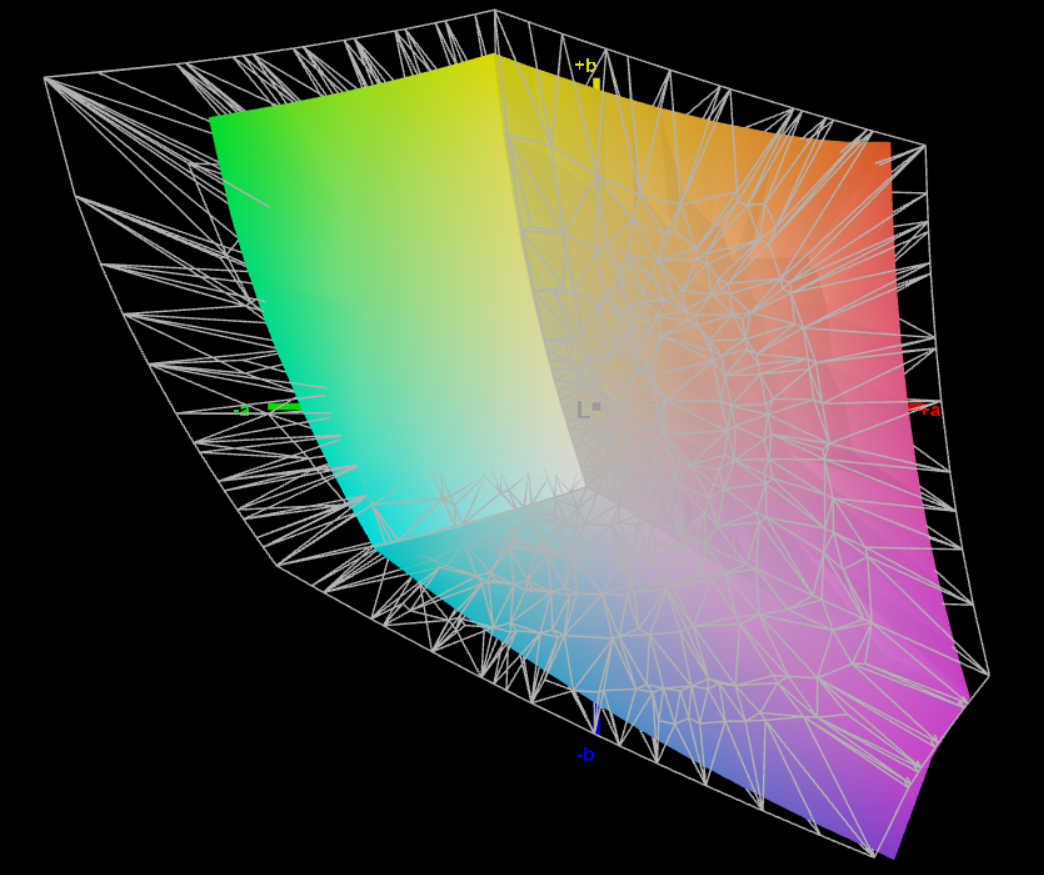
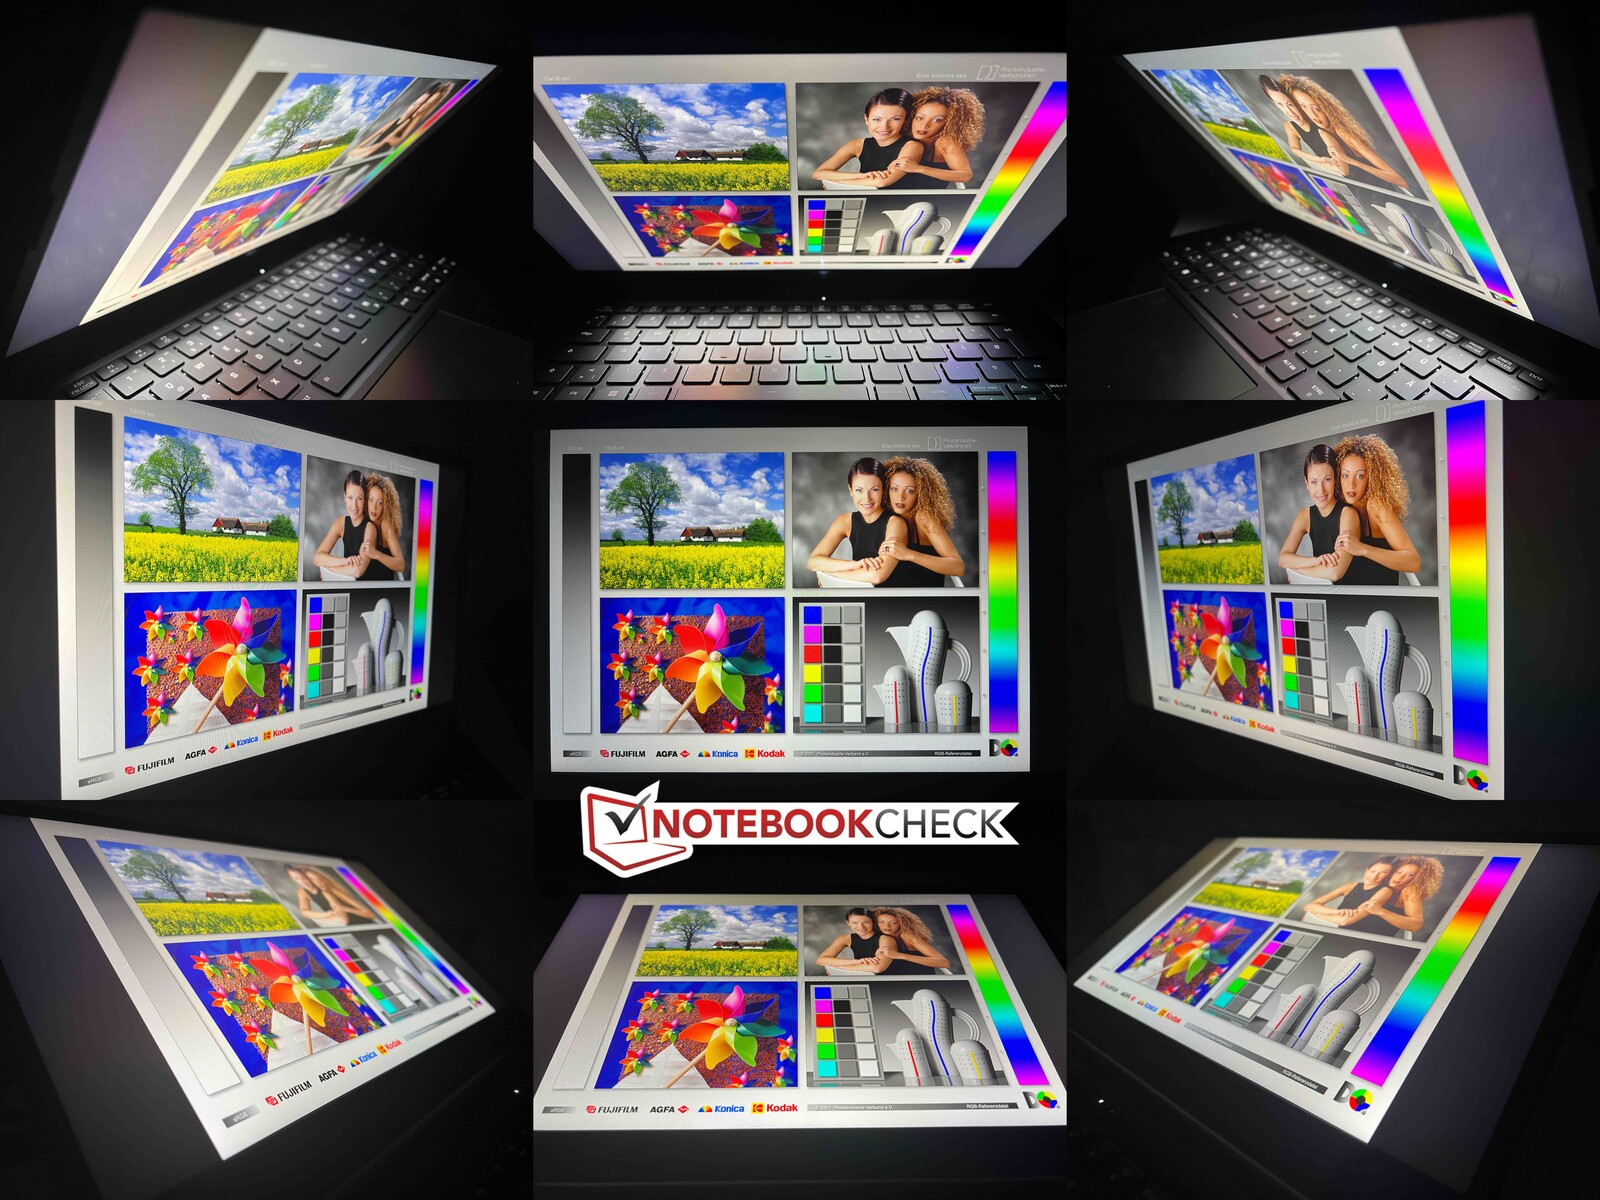
Work 14 配备了友达光电的哑光 IPS 面板(60 Hz),分辨率为 1,920 x 1,080 像素。这意味着它仍然是一块 16:9 的面板,但大多数竞争对手的屏幕都采用了相同的宽高比。从主观上看,画质因其颗粒感而略有下降,但内容足够清晰,而且屏幕没有使用 PWM。背光出血不是问题,但其响应时间非常慢,而且我们注意到有相当多的重影。相比之下,宏碁 Swift Go 的 OLED 面板提供了更好的主观画质,但用户却不得不面对持续的 PWM 闪烁。
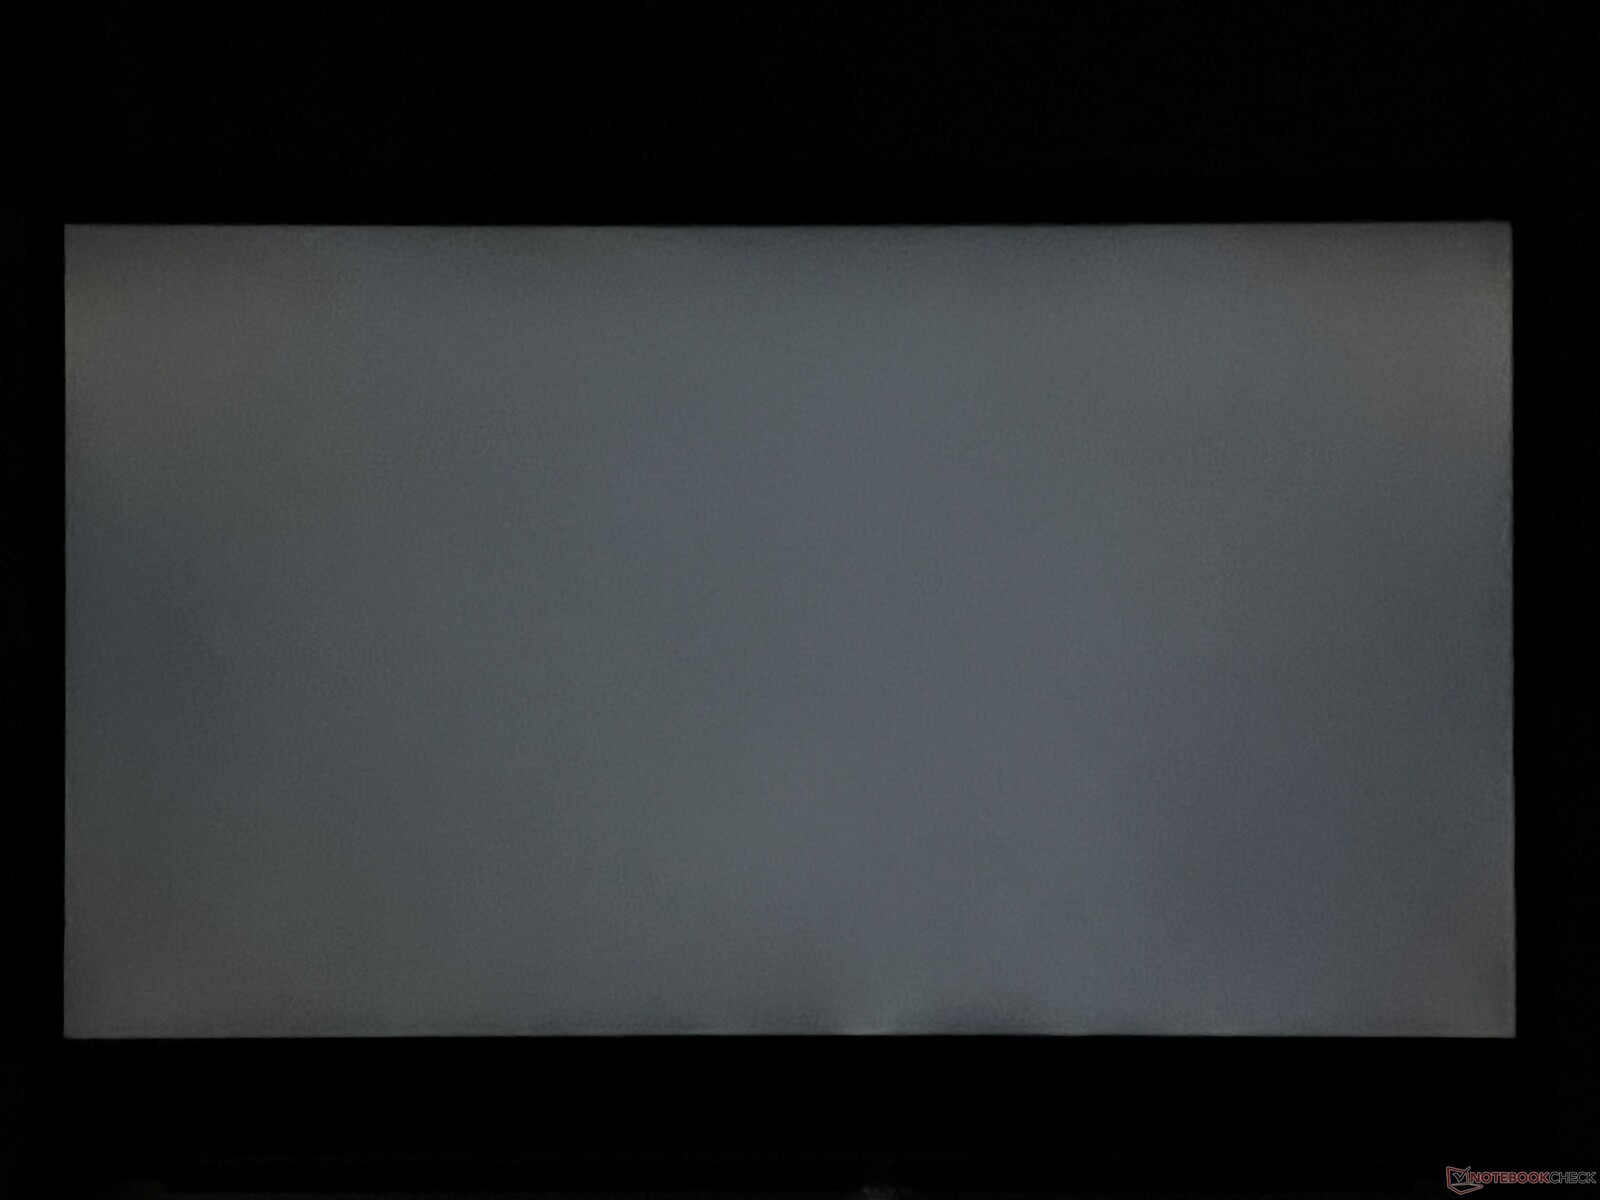
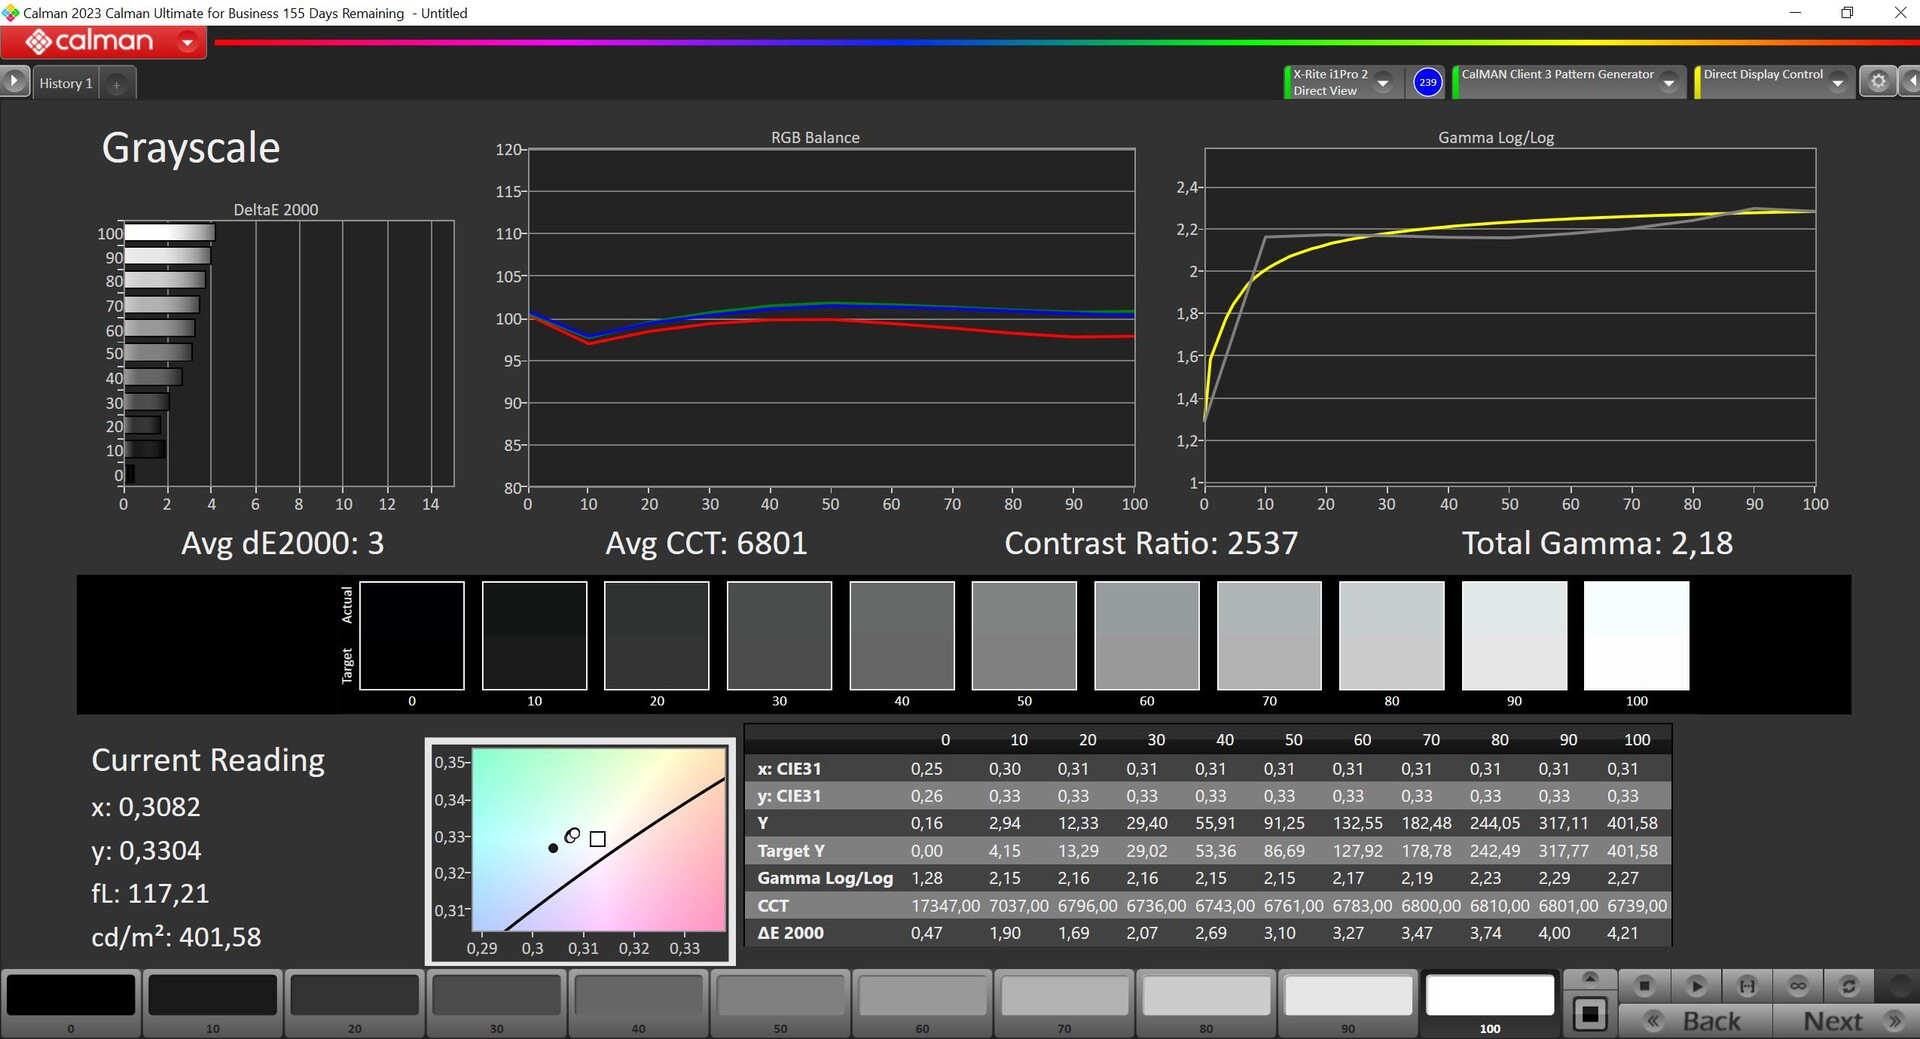
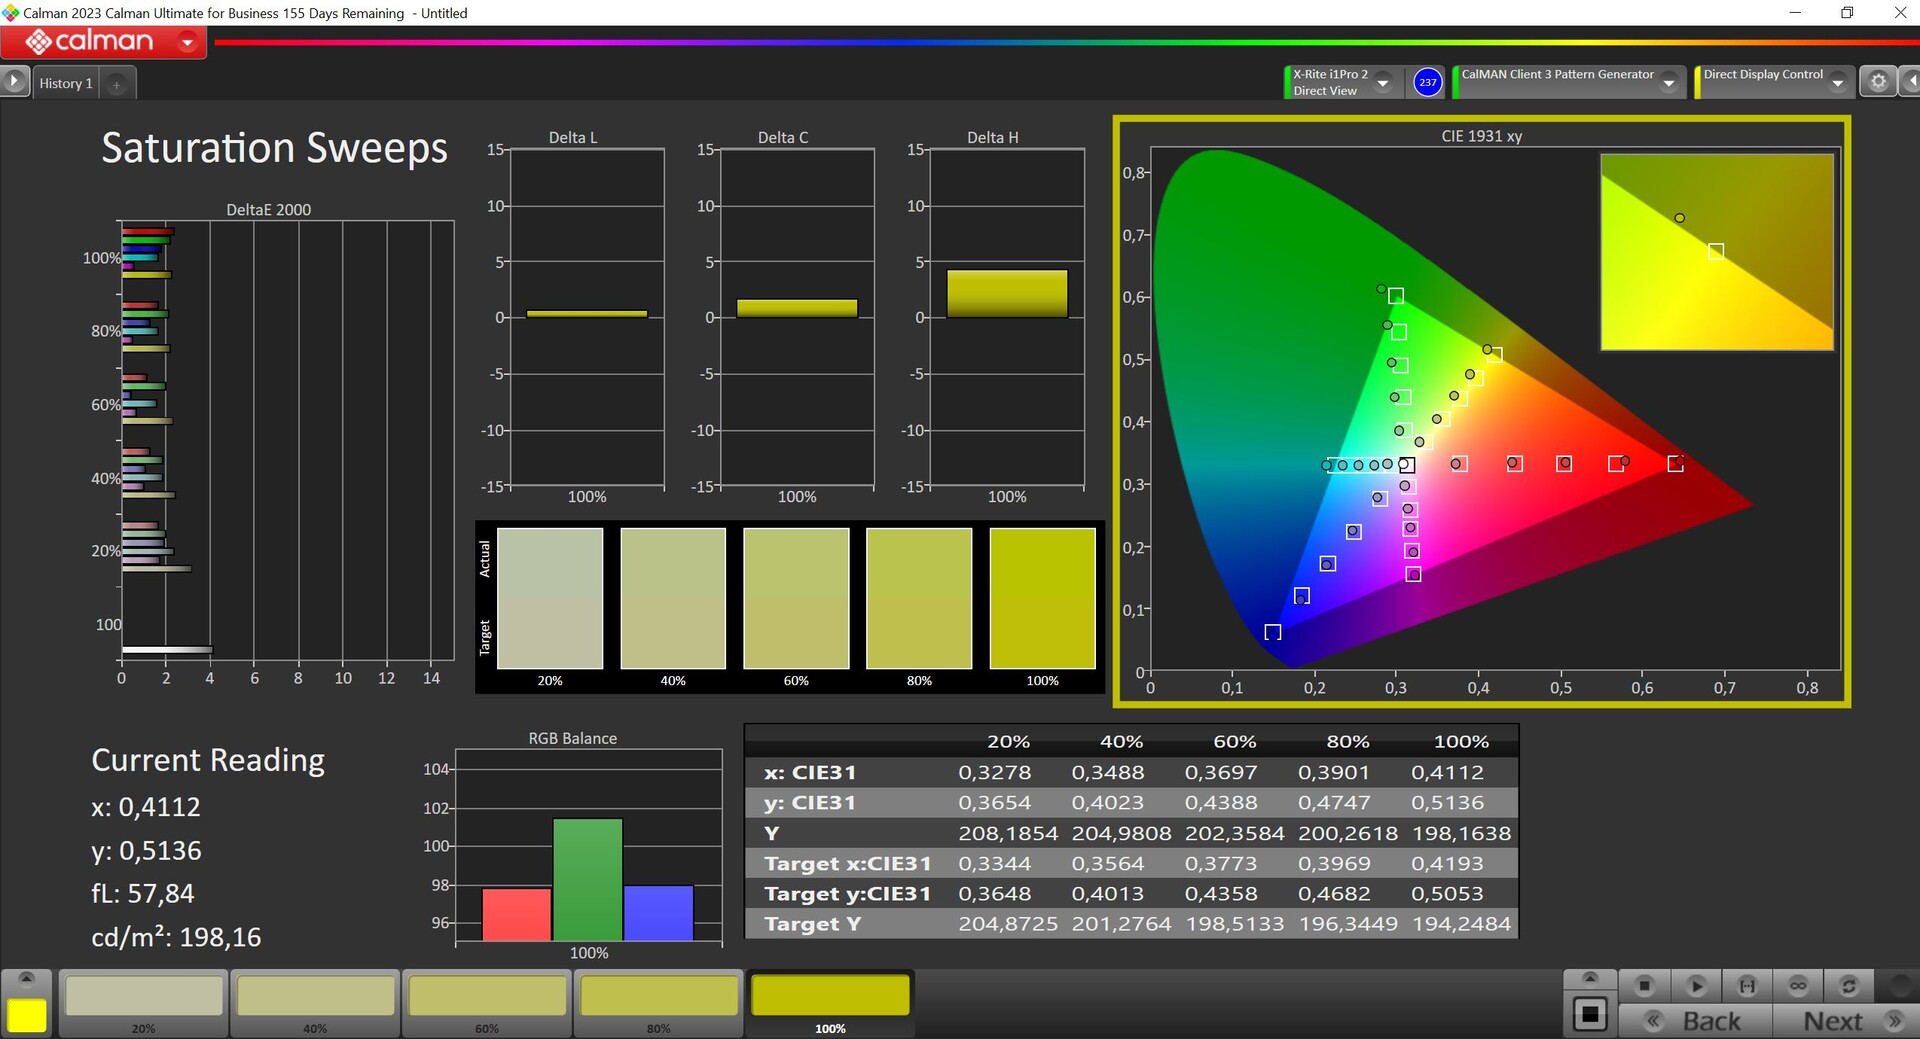
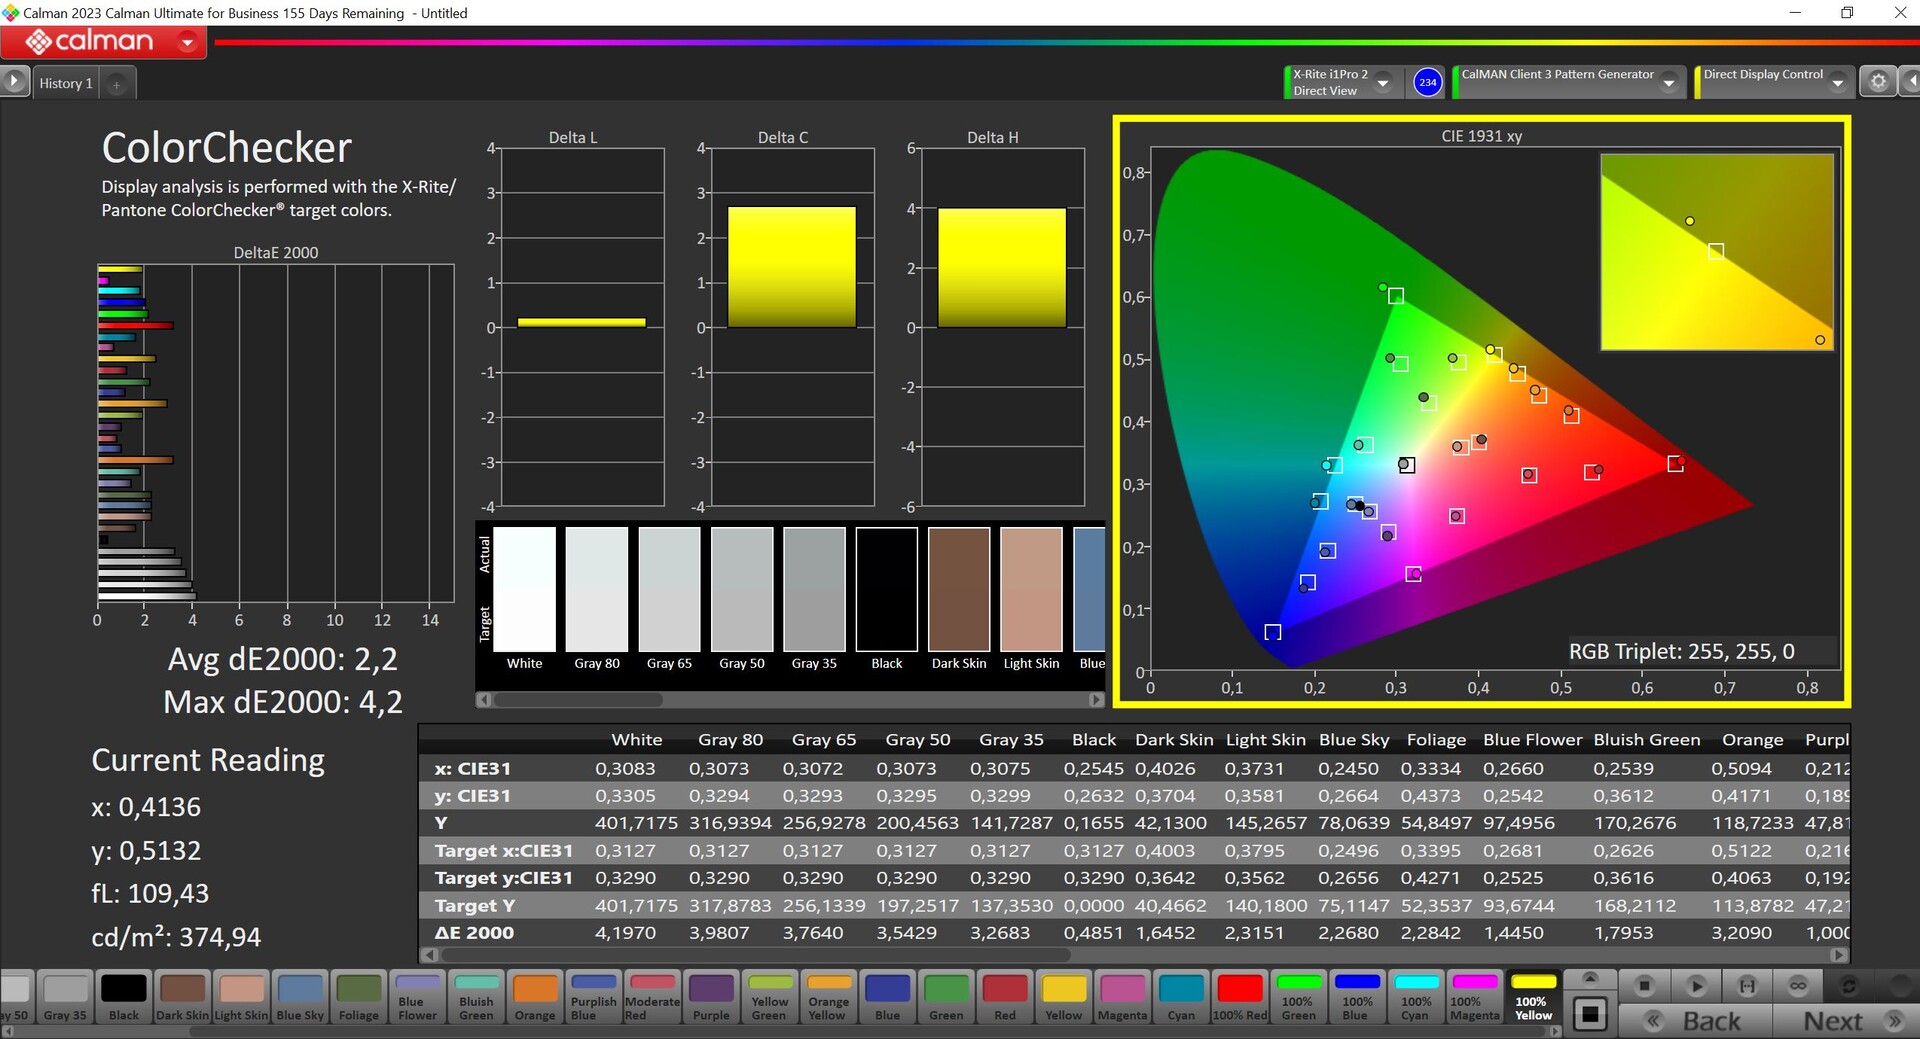
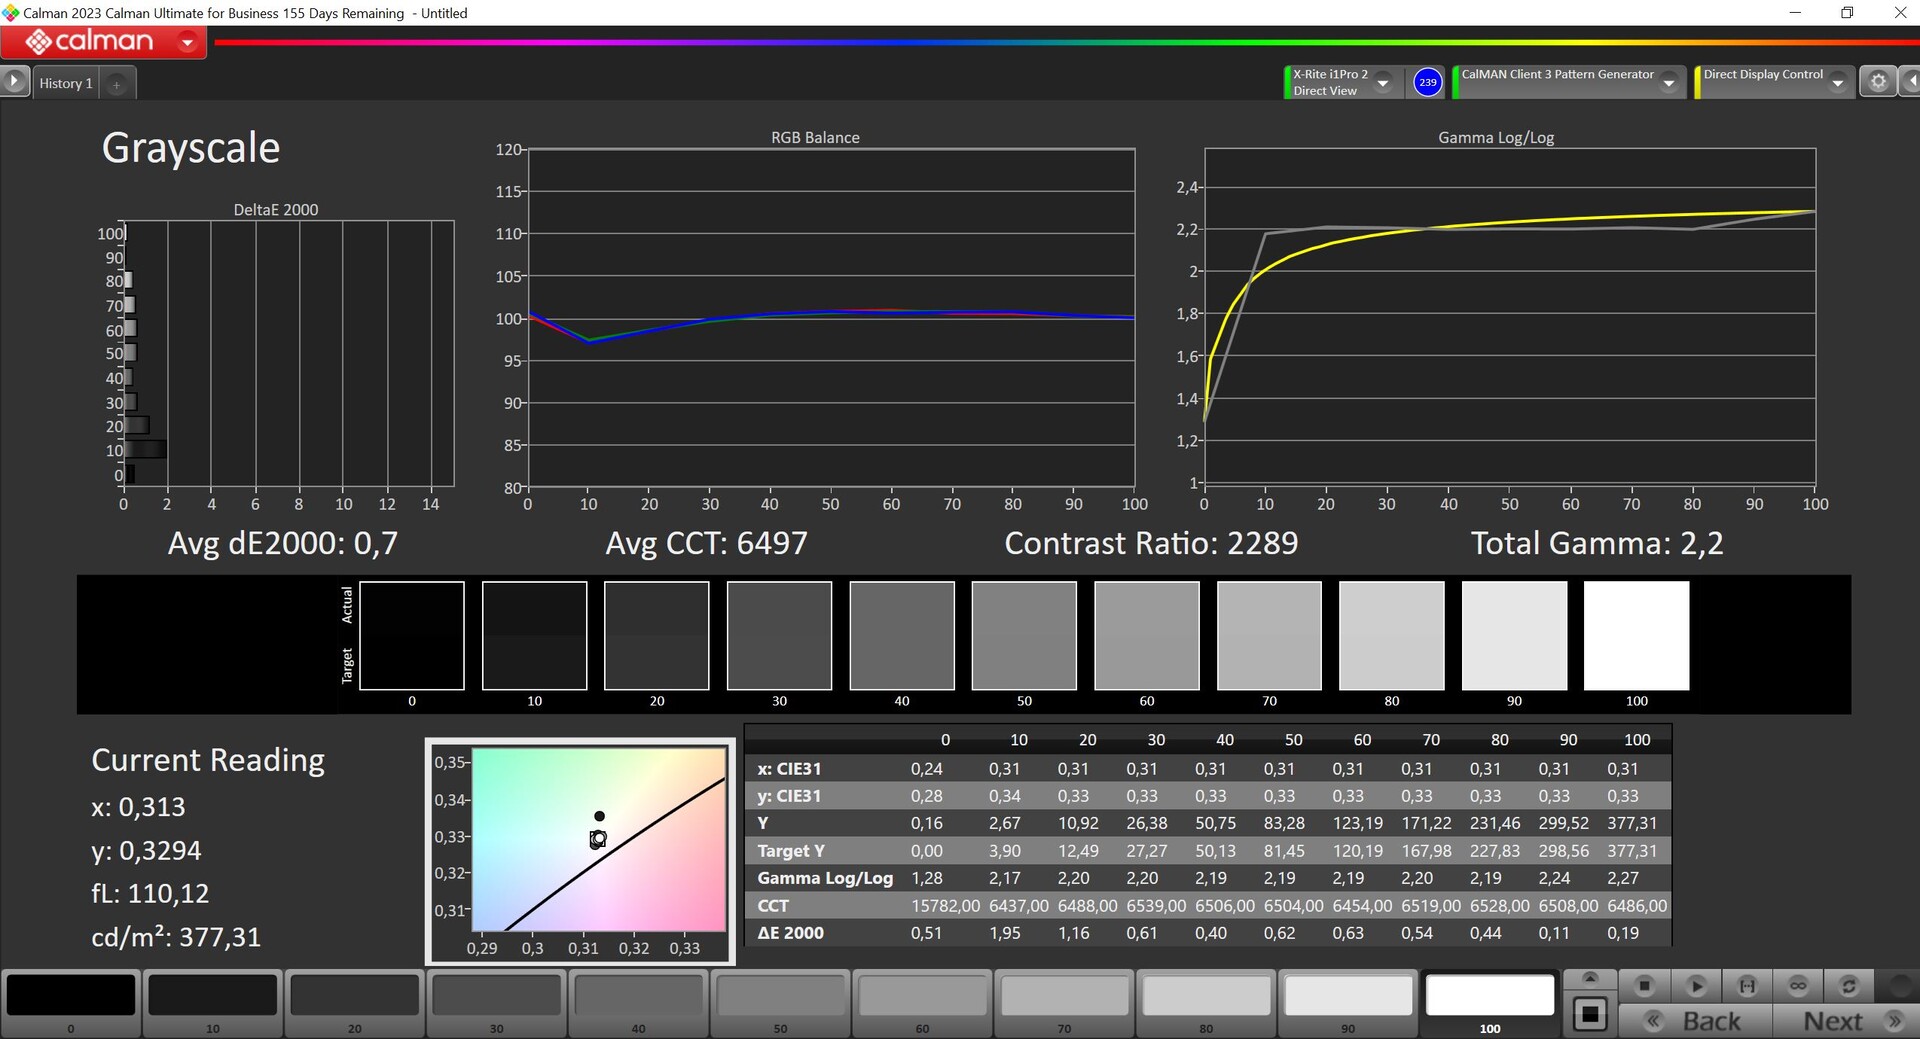
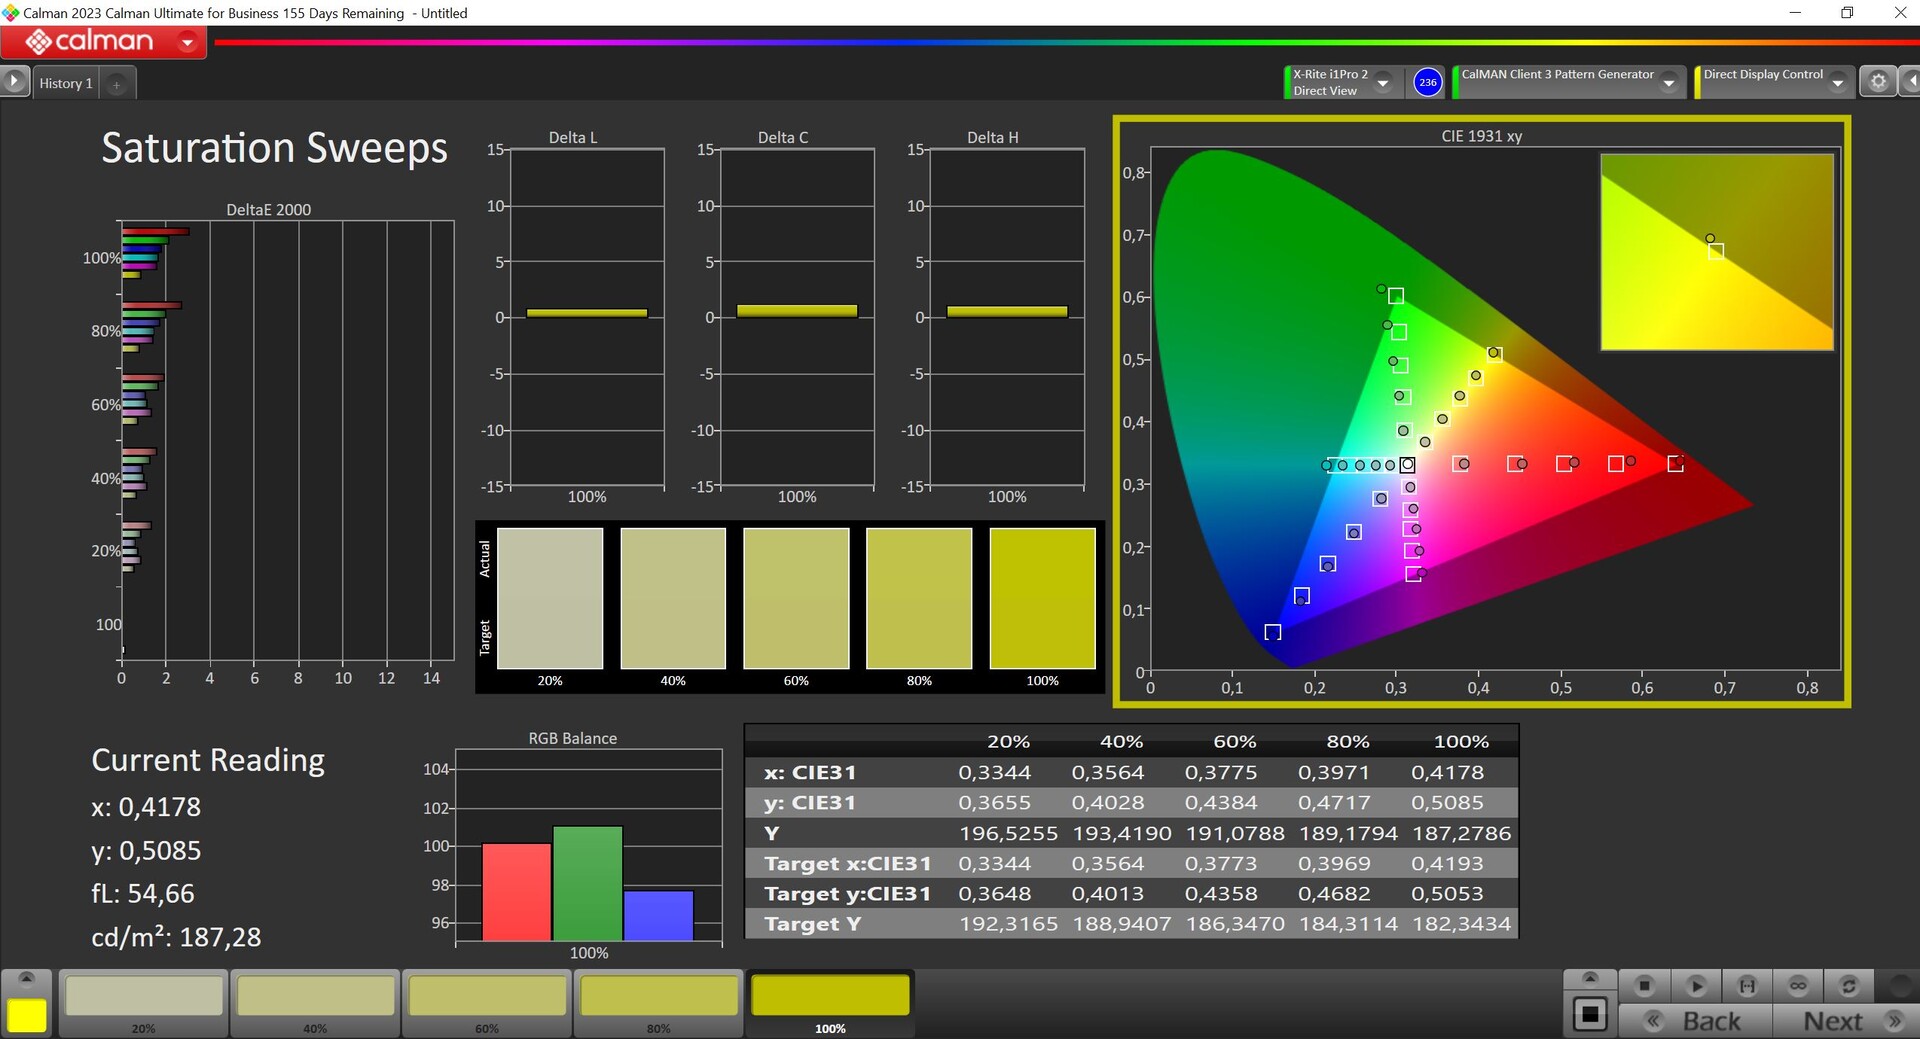
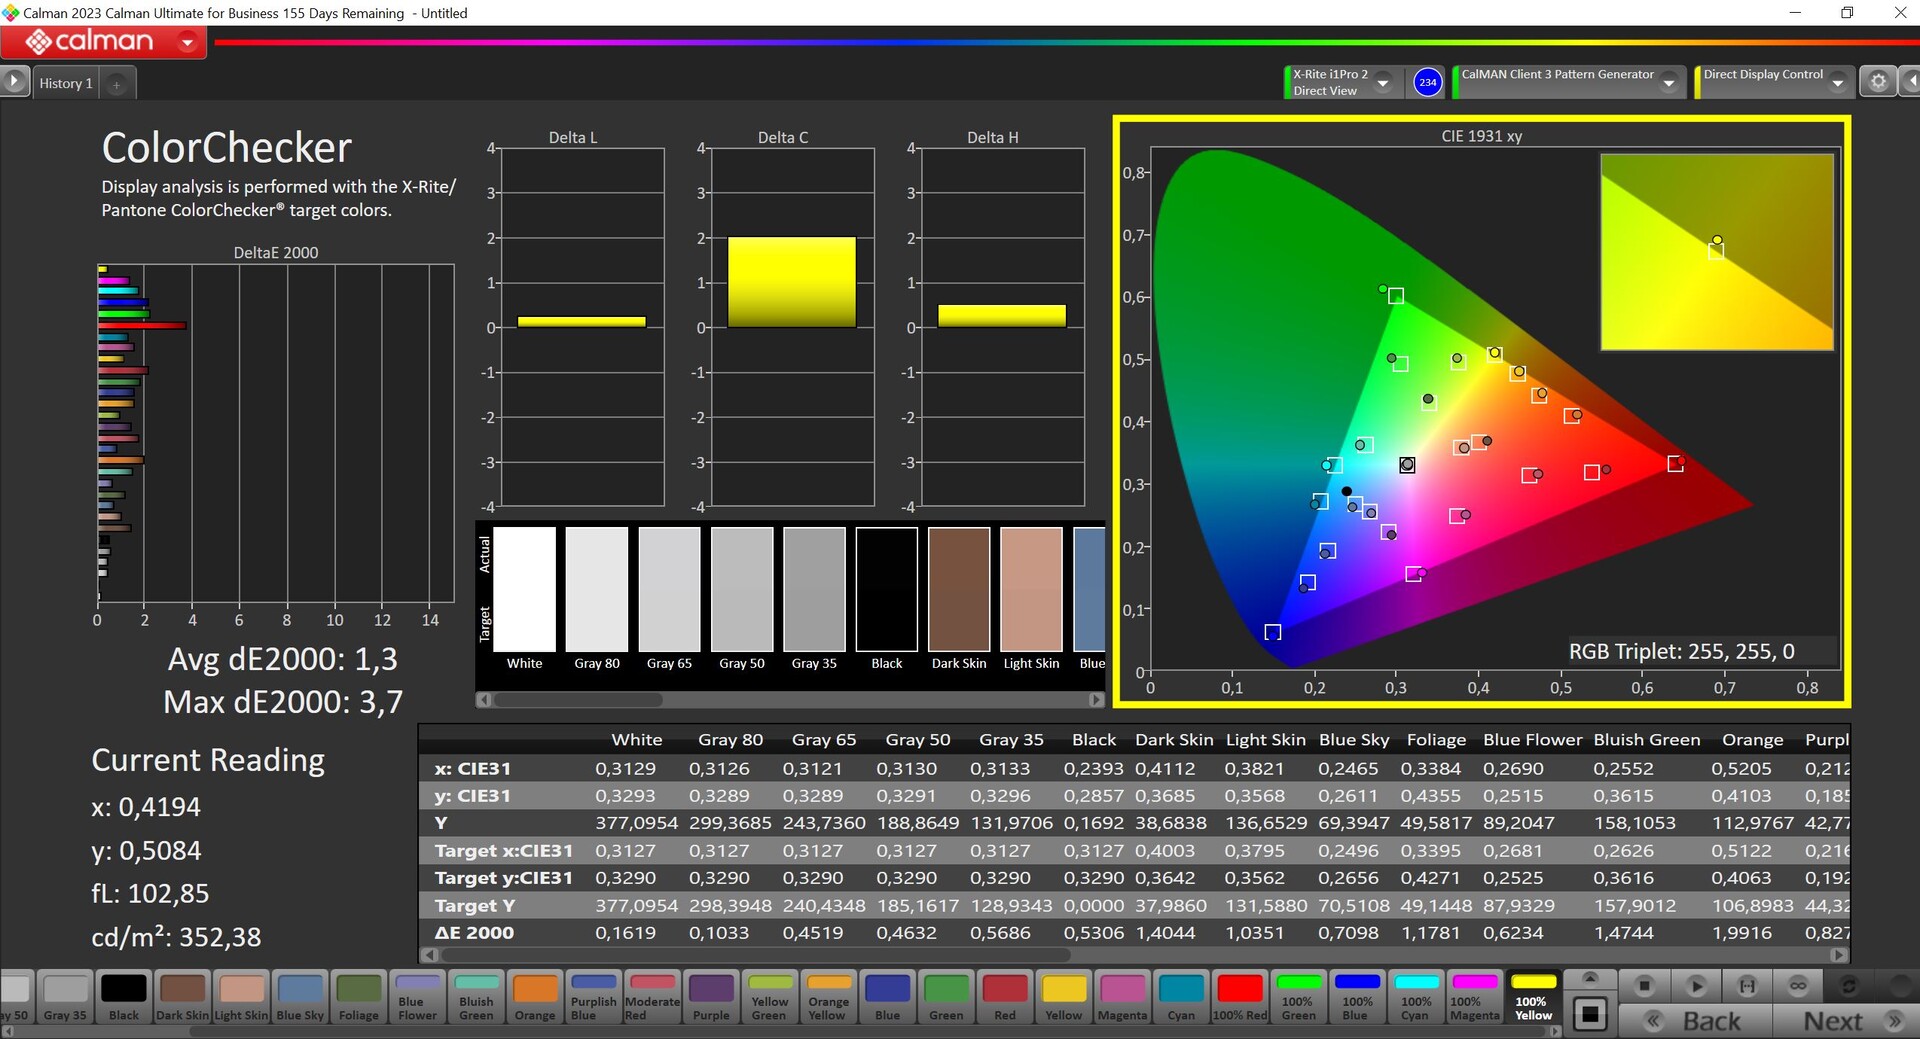
制造商称典型亮度为 300 cd/m²,而我们的测试设备甚至显示出更好的平均亮度,即超过 400 cd/m²。此外,它的黑色值很低,仅为 0.16 cd/m²,因此最大对比度很高。开箱即用的校准功能很不错,在日常使用中不会出现任何问题。如果你自己校准屏幕,可以略微改善其显示效果,但这是以牺牲一些亮度为代价的。它几乎完全覆盖了较小的 sRGB 色彩空间。从外观上看,该面板给人的印象相当不错,视角稳定性也很好。
| |||||||||||||||||||||||||
Brightness Distribution: 89 %
Center on Battery: 402 cd/m²
Contrast: 2513:1 (Black: 0.16 cd/m²)
ΔE Color 2.2 | 0.5-29.43 Ø4.87, calibrated: 1.3
ΔE Greyscale 3 | 0.5-98 Ø5.1
73.8% AdobeRGB 1998 (Argyll 2.2.0 3D)
99.8% sRGB (Argyll 2.2.0 3D)
72.4% Display P3 (Argyll 2.2.0 3D)
Gamma: 2.18
| SCHENKER Work 14 Base B140HAN06.8, IPS, 1920x1080, 14" | Acer Swift Go 14 SFG14-71 Samsung ATNA40YK11-0, OLED, 2880x1800, 14" | HP ProBook 445 G10 AUO2FA6, IPS, 1920x1080, 14" | Dell Latitude 3440 BOE NE140FH, IPS, 1920x1080, 14" | Lenovo ThinkPad L14 G4 21H6S00900 B140HAN06.9, IPS LED, 1920x1080, 14" | |
|---|---|---|---|---|---|
| Display | 22% | -5% | -42% | 0% | |
| Display P3 Coverage | 72.4 | 99.9 38% | 68.4 -6% | 40.4 -44% | 73.2 1% |
| sRGB Coverage | 99.8 | 100 0% | 95.2 -5% | 60.7 -39% | 98.9 -1% |
| AdobeRGB 1998 Coverage | 73.8 | 95.4 29% | 70.6 -4% | 41.8 -43% | 73.9 0% |
| Response Times | 96% | 24% | 28% | 5% | |
| Response Time Grey 50% / Grey 80% * | 60 ? | 1.85 ? 97% | 53.4 ? 11% | 35.3 ? 41% | 58.1 ? 3% |
| Response Time Black / White * | 34.7 ? | 2 ? 94% | 21.8 ? 37% | 29.8 ? 14% | 32.7 ? 6% |
| PWM Frequency | 357 ? | ||||
| Screen | -8% | -15% | -67% | -18% | |
| Brightness middle | 402 | 278 -31% | 501 25% | 292.6 -27% | 430 7% |
| Brightness | 404 | 279 -31% | 464 15% | 270 -33% | 409 1% |
| Brightness Distribution | 89 | 96 8% | 87 -2% | 88 -1% | 88 -1% |
| Black Level * | 0.16 | 0.04 75% | 0.26 -63% | 0.19 -19% | 0.31 -94% |
| Contrast | 2513 | 6950 177% | 1927 -23% | 1540 -39% | 1387 -45% |
| Colorchecker dE 2000 * | 2.2 | 3.01 -37% | 2.64 -20% | 4.63 -110% | 2.4 -9% |
| Colorchecker dE 2000 max. * | 4.2 | 4.43 -5% | 5.06 -20% | 17.1 -307% | 4.7 -12% |
| Colorchecker dE 2000 calibrated * | 1.3 | 4.14 -218% | 1.57 -21% | 2.13 -64% | 1.4 -8% |
| Greyscale dE 2000 * | 3 | 3.2 -7% | 3.8 -27% | 3.2 -7% | 3 -0% |
| Gamma | 2.18 101% | 2.194 100% | 2.103 105% | 2.34 94% | 2.3 96% |
| CCT | 6801 96% | 6126 106% | 6562 99% | 7184 90% | 6489 100% |
| Total Average (Program / Settings) | 37% /
14% | 1% /
-7% | -27% /
-48% | -4% /
-11% |
* ... smaller is better
Display Response Times
| ↔ Response Time Black to White | ||
|---|---|---|
| 34.7 ms ... rise ↗ and fall ↘ combined | ↗ 17 ms rise | 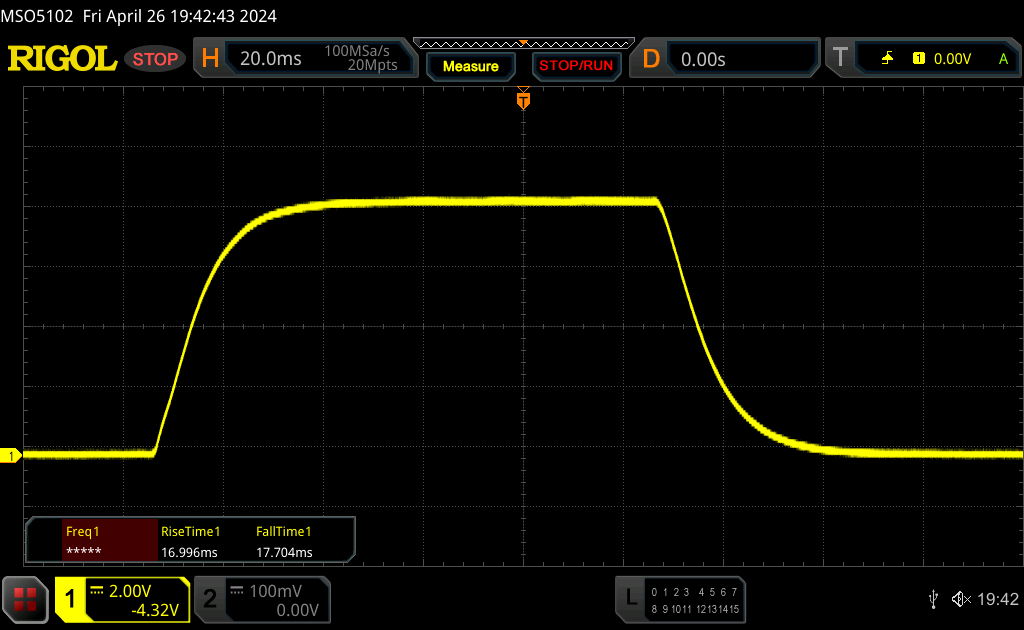 |
| ↘ 17.7 ms fall | ||
| The screen shows slow response rates in our tests and will be unsatisfactory for gamers. In comparison, all tested devices range from 0.1 (minimum) to 240 (maximum) ms. » 92 % of all devices are better. This means that the measured response time is worse than the average of all tested devices (20.8 ms). | ||
| ↔ Response Time 50% Grey to 80% Grey | ||
| 60 ms ... rise ↗ and fall ↘ combined | ↗ 27.5 ms rise | 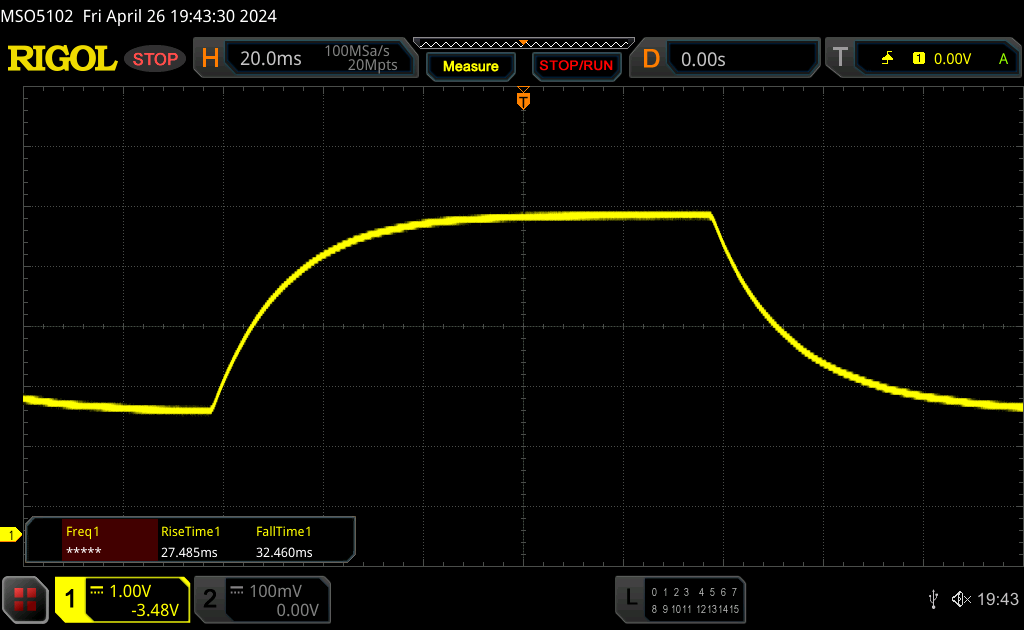 |
| ↘ 32.5 ms fall | ||
| The screen shows slow response rates in our tests and will be unsatisfactory for gamers. In comparison, all tested devices range from 0.165 (minimum) to 636 (maximum) ms. » 95 % of all devices are better. This means that the measured response time is worse than the average of all tested devices (32.5 ms). | ||
Screen Flickering / PWM (Pulse-Width Modulation)
| Screen flickering / PWM not detected | 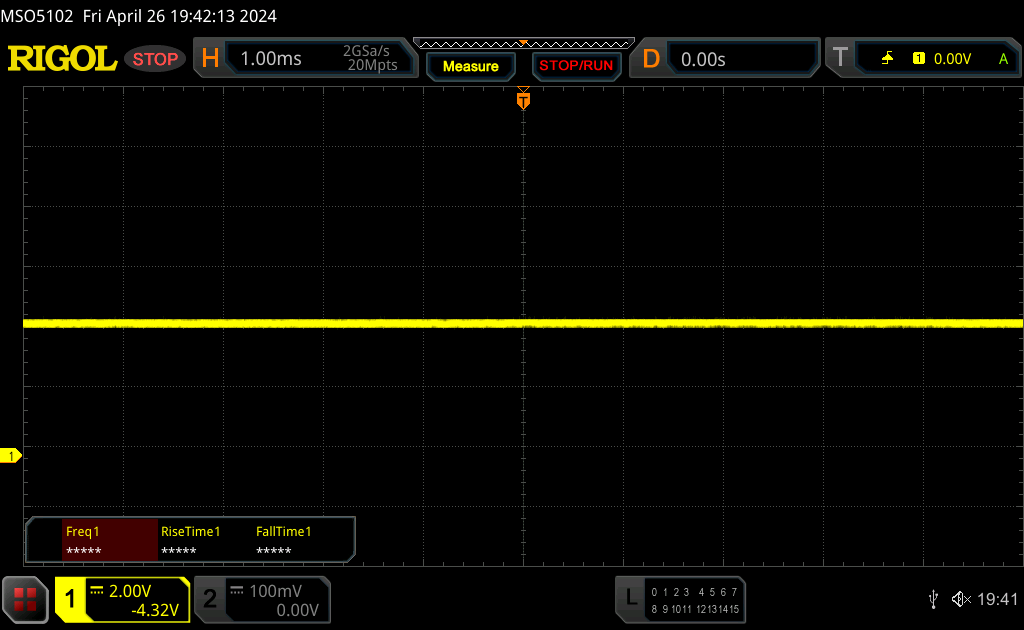 | ||
In comparison: 53 % of all tested devices do not use PWM to dim the display. If PWM was detected, an average of 8516 (minimum: 5 - maximum: 343500) Hz was measured. | |||
表演 - 与 Alder Lake 合作的 14 号作品
测试条件
申克公司提供各种性能配置文件。我们使用默认激活的娱乐模式进行了以下基准测试和测量。
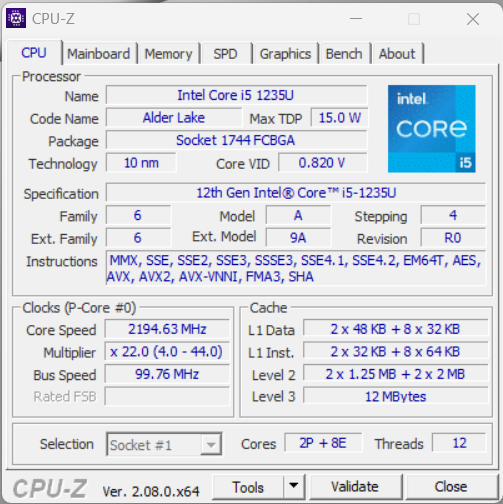
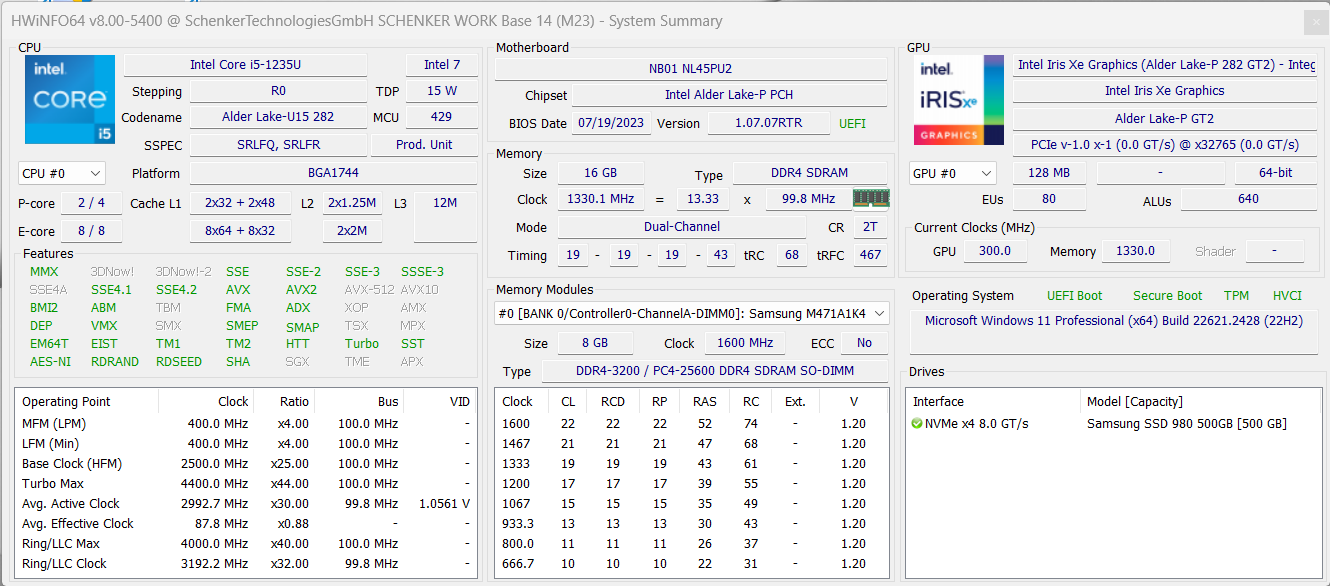
处理器 - 酷睿 i5-1235U
酷睿 i5-1235U 酷睿 i5-1235U是英特尔 Alder Lake 系列产品,具有 10 个内核(2 倍性能、8 倍效率),Work 14 的运行功耗为 25/20 瓦。当然,你不应该期待任何性能奇迹,但其整体性能与 酷睿 i5-1345U内的 戴尔Latitude 14.在家里或办公室工作时,CPU 性能绝对足以胜任简单的日常任务,此外,笔记本电脑的运行速度也不会太慢。反过来,在 AI 应用程序中,你就得忍受没有 NPU 的痛苦了。在电池使用情况下,处理器的最大功耗为 15 瓦,这也是其性能降低 20% 的原因。更多 CPU 基准测试 这里。
Cinebench R15 Multi continuous test
Cinebench R23: Multi Core | Single Core
Cinebench R20: CPU (Multi Core) | CPU (Single Core)
Cinebench R15: CPU Multi 64Bit | CPU Single 64Bit
Blender: v2.79 BMW27 CPU
7-Zip 18.03: 7z b 4 | 7z b 4 -mmt1
Geekbench 6.4: Multi-Core | Single-Core
Geekbench 5.5: Multi-Core | Single-Core
HWBOT x265 Benchmark v2.2: 4k Preset
LibreOffice : 20 Documents To PDF
R Benchmark 2.5: Overall mean
| CPU Performance Rating | |
| Average of class Office | |
| Acer Swift Go 14 SFG14-71 | |
| Dell Latitude 3440 -2! | |
| Lenovo ThinkPad L14 G4 21H6S00900 -2! | |
| HP ProBook 445 G10 | |
| SCHENKER Work 14 Base | |
| Average Intel Core i5-1235U | |
| Cinebench R23 / Multi Core | |
| Average of class Office (1577 - 20399, n=90, last 2 years) | |
| Lenovo ThinkPad L14 G4 21H6S00900 | |
| HP ProBook 445 G10 | |
| Acer Swift Go 14 SFG14-71 | |
| Dell Latitude 3440 | |
| SCHENKER Work 14 Base | |
| Average Intel Core i5-1235U (2485 - 9208, n=8) | |
| Cinebench R23 / Single Core | |
| Dell Latitude 3440 | |
| Average of class Office (618 - 1995, n=90, last 2 years) | |
| Average Intel Core i5-1235U (1444 - 1698, n=8) | |
| SCHENKER Work 14 Base | |
| Acer Swift Go 14 SFG14-71 | |
| HP ProBook 445 G10 | |
| Lenovo ThinkPad L14 G4 21H6S00900 | |
| Cinebench R20 / CPU (Multi Core) | |
| Average of class Office (590 - 8086, n=88, last 2 years) | |
| Lenovo ThinkPad L14 G4 21H6S00900 | |
| HP ProBook 445 G10 | |
| Acer Swift Go 14 SFG14-71 | |
| Dell Latitude 3440 | |
| SCHENKER Work 14 Base | |
| Average Intel Core i5-1235U (1783 - 3537, n=8) | |
| Cinebench R20 / CPU (Single Core) | |
| Dell Latitude 3440 | |
| Average of class Office (229 - 766, n=88, last 2 years) | |
| SCHENKER Work 14 Base | |
| Average Intel Core i5-1235U (566 - 651, n=8) | |
| Acer Swift Go 14 SFG14-71 | |
| HP ProBook 445 G10 | |
| Lenovo ThinkPad L14 G4 21H6S00900 | |
| Cinebench R15 / CPU Multi 64Bit | |
| Average of class Office (246 - 3132, n=92, last 2 years) | |
| Lenovo ThinkPad L14 G4 21H6S00900 | |
| Acer Swift Go 14 SFG14-71 | |
| HP ProBook 445 G10 | |
| Dell Latitude 3440 | |
| Average Intel Core i5-1235U (785 - 1587, n=8) | |
| SCHENKER Work 14 Base | |
| Cinebench R15 / CPU Single 64Bit | |
| Average of class Office (98 - 294, n=90, last 2 years) | |
| Dell Latitude 3440 | |
| Acer Swift Go 14 SFG14-71 | |
| HP ProBook 445 G10 | |
| Lenovo ThinkPad L14 G4 21H6S00900 | |
| SCHENKER Work 14 Base | |
| Average Intel Core i5-1235U (151.5 - 242, n=8) | |
| Blender / v2.79 BMW27 CPU | |
| SCHENKER Work 14 Base | |
| Average Intel Core i5-1235U (366 - 662, n=8) | |
| Dell Latitude 3440 | |
| Acer Swift Go 14 SFG14-71 | |
| Average of class Office (163 - 1956, n=91, last 2 years) | |
| Lenovo ThinkPad L14 G4 21H6S00900 | |
| HP ProBook 445 G10 | |
| 7-Zip 18.03 / 7z b 4 | |
| Average of class Office (7532 - 76886, n=92, last 2 years) | |
| HP ProBook 445 G10 | |
| Lenovo ThinkPad L14 G4 21H6S00900 | |
| Dell Latitude 3440 | |
| Acer Swift Go 14 SFG14-71 | |
| Average Intel Core i5-1235U (20166 - 38643, n=8) | |
| SCHENKER Work 14 Base | |
| 7-Zip 18.03 / 7z b 4 -mmt1 | |
| Dell Latitude 3440 | |
| HP ProBook 445 G10 | |
| Average of class Office (2972 - 6687, n=91, last 2 years) | |
| Lenovo ThinkPad L14 G4 21H6S00900 | |
| SCHENKER Work 14 Base | |
| Acer Swift Go 14 SFG14-71 | |
| Average Intel Core i5-1235U (4371 - 5233, n=8) | |
| Geekbench 6.4 / Multi-Core | |
| Average of class Office (662 - 14767, n=85, last 2 years) | |
| Acer Swift Go 14 SFG14-71 | |
| Average Intel Core i5-1235U (6703 - 7046, n=2) | |
| SCHENKER Work 14 Base | |
| HP ProBook 445 G10 | |
| Geekbench 6.4 / Single-Core | |
| Acer Swift Go 14 SFG14-71 | |
| Average of class Office (457 - 2871, n=84, last 2 years) | |
| Average Intel Core i5-1235U (1981 - 2208, n=2) | |
| SCHENKER Work 14 Base | |
| HP ProBook 445 G10 | |
| Geekbench 5.5 / Multi-Core | |
| Average of class Office (1018 - 14192, n=91, last 2 years) | |
| Acer Swift Go 14 SFG14-71 | |
| Average Intel Core i5-1235U (5528 - 8571, n=10) | |
| Dell Latitude 3440 | |
| SCHENKER Work 14 Base | |
| HP ProBook 445 G10 | |
| Lenovo ThinkPad L14 G4 21H6S00900 | |
| Geekbench 5.5 / Single-Core | |
| Dell Latitude 3440 | |
| Acer Swift Go 14 SFG14-71 | |
| Average of class Office (510 - 2096, n=92, last 2 years) | |
| SCHENKER Work 14 Base | |
| Average Intel Core i5-1235U (1426 - 1643, n=10) | |
| HP ProBook 445 G10 | |
| Lenovo ThinkPad L14 G4 21H6S00900 | |
| HWBOT x265 Benchmark v2.2 / 4k Preset | |
| Average of class Office (1.72 - 22.4, n=89, last 2 years) | |
| Lenovo ThinkPad L14 G4 21H6S00900 | |
| HP ProBook 445 G10 | |
| Acer Swift Go 14 SFG14-71 | |
| Dell Latitude 3440 | |
| SCHENKER Work 14 Base | |
| Average Intel Core i5-1235U (4.99 - 9.43, n=8) | |
| LibreOffice / 20 Documents To PDF | |
| Acer Swift Go 14 SFG14-71 | |
| HP ProBook 445 G10 | |
| Average of class Office (31.3 - 129.6, n=89, last 2 years) | |
| Average Intel Core i5-1235U (42.4 - 65.5, n=8) | |
| Dell Latitude 3440 | |
| SCHENKER Work 14 Base | |
| Lenovo ThinkPad L14 G4 21H6S00900 | |
| R Benchmark 2.5 / Overall mean | |
| Lenovo ThinkPad L14 G4 21H6S00900 | |
| Average of class Office (0.4098 - 1.135, n=88, last 2 years) | |
| HP ProBook 445 G10 | |
| Average Intel Core i5-1235U (0.4986 - 0.603, n=8) | |
| Acer Swift Go 14 SFG14-71 | |
| SCHENKER Work 14 Base | |
| Dell Latitude 3440 | |
* ... smaller is better
AIDA64: FP32 Ray-Trace | FPU Julia | CPU SHA3 | CPU Queen | FPU SinJulia | FPU Mandel | CPU AES | CPU ZLib | FP64 Ray-Trace | CPU PhotoWorxx
| Performance Rating | |
| Average of class Office | |
| Lenovo ThinkPad L14 G4 21H6S00900 | |
| HP ProBook 445 G10 | |
| Dell Latitude 3440 | |
| Acer Swift Go 14 SFG14-71 | |
| Average Intel Core i5-1235U | |
| SCHENKER Work 14 Base | |
| AIDA64 / FP32 Ray-Trace | |
| Average of class Office (763 - 31245, n=90, last 2 years) | |
| HP ProBook 445 G10 | |
| Lenovo ThinkPad L14 G4 21H6S00900 | |
| Dell Latitude 3440 | |
| Acer Swift Go 14 SFG14-71 | |
| SCHENKER Work 14 Base | |
| Average Intel Core i5-1235U (3078 - 7457, n=8) | |
| AIDA64 / FPU Julia | |
| Lenovo ThinkPad L14 G4 21H6S00900 | |
| HP ProBook 445 G10 | |
| Average of class Office (4113 - 125394, n=90, last 2 years) | |
| Dell Latitude 3440 | |
| Acer Swift Go 14 SFG14-71 | |
| SCHENKER Work 14 Base | |
| Average Intel Core i5-1235U (15838 - 37760, n=8) | |
| AIDA64 / CPU SHA3 | |
| Average of class Office (287 - 5398, n=90, last 2 years) | |
| Lenovo ThinkPad L14 G4 21H6S00900 | |
| HP ProBook 445 G10 | |
| Dell Latitude 3440 | |
| SCHENKER Work 14 Base | |
| Acer Swift Go 14 SFG14-71 | |
| Average Intel Core i5-1235U (978 - 2072, n=8) | |
| AIDA64 / CPU Queen | |
| Lenovo ThinkPad L14 G4 21H6S00900 | |
| Average of class Office (8185 - 115197, n=90, last 2 years) | |
| HP ProBook 445 G10 | |
| Dell Latitude 3440 | |
| Average Intel Core i5-1235U (45680 - 62404, n=8) | |
| Acer Swift Go 14 SFG14-71 | |
| SCHENKER Work 14 Base | |
| AIDA64 / FPU SinJulia | |
| HP ProBook 445 G10 | |
| Lenovo ThinkPad L14 G4 21H6S00900 | |
| Average of class Office (404 - 18321, n=90, last 2 years) | |
| Dell Latitude 3440 | |
| Average Intel Core i5-1235U (3099 - 4644, n=8) | |
| Acer Swift Go 14 SFG14-71 | |
| SCHENKER Work 14 Base | |
| AIDA64 / FPU Mandel | |
| Lenovo ThinkPad L14 G4 21H6S00900 | |
| HP ProBook 445 G10 | |
| Average of class Office (2075 - 66922, n=90, last 2 years) | |
| Dell Latitude 3440 | |
| Acer Swift Go 14 SFG14-71 | |
| SCHENKER Work 14 Base | |
| Average Intel Core i5-1235U (8046 - 18819, n=8) | |
| AIDA64 / CPU AES | |
| Lenovo ThinkPad L14 G4 21H6S00900 | |
| Average of class Office (7254 - 155900, n=90, last 2 years) | |
| Dell Latitude 3440 | |
| Average Intel Core i5-1235U (23386 - 67140, n=8) | |
| Acer Swift Go 14 SFG14-71 | |
| HP ProBook 445 G10 | |
| SCHENKER Work 14 Base | |
| AIDA64 / CPU ZLib | |
| Average of class Office (78 - 1366, n=90, last 2 years) | |
| Dell Latitude 3440 | |
| HP ProBook 445 G10 | |
| Lenovo ThinkPad L14 G4 21H6S00900 | |
| SCHENKER Work 14 Base | |
| Average Intel Core i5-1235U (329 - 633, n=8) | |
| Acer Swift Go 14 SFG14-71 | |
| AIDA64 / FP64 Ray-Trace | |
| Average of class Office (432 - 17834, n=90, last 2 years) | |
| HP ProBook 445 G10 | |
| Lenovo ThinkPad L14 G4 21H6S00900 | |
| Dell Latitude 3440 | |
| SCHENKER Work 14 Base | |
| Acer Swift Go 14 SFG14-71 | |
| Average Intel Core i5-1235U (1670 - 3928, n=8) | |
| AIDA64 / CPU PhotoWorxx | |
| Acer Swift Go 14 SFG14-71 | |
| Average Intel Core i5-1235U (15933 - 41909, n=8) | |
| Average of class Office (4814 - 54971, n=90, last 2 years) | |
| SCHENKER Work 14 Base | |
| Dell Latitude 3440 | |
| HP ProBook 445 G10 | |
| Lenovo ThinkPad L14 G4 21H6S00900 | |
系统性能
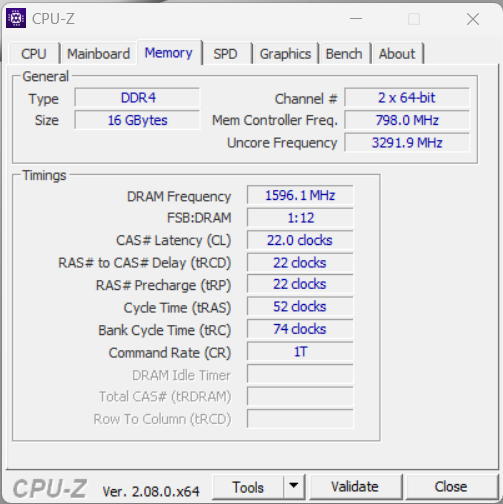
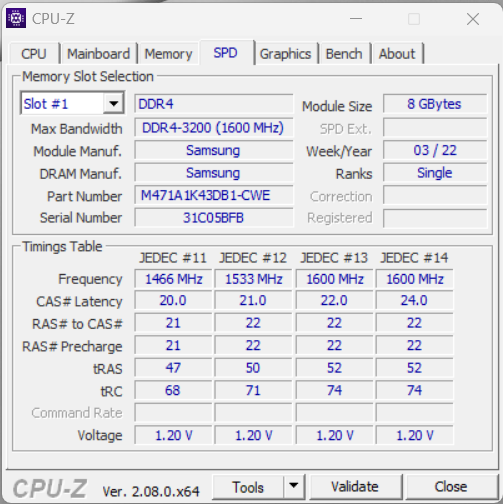
在日常使用中,这款笔记本电脑的性能还算不错,不过它的 PCIe 固态硬盘也起到了一定的作用。在测试过程中,我们没有发现任何系统稳定性问题,如果需要,该设备的内存最高可扩展至 64 GB。
CrossMark: Overall | Productivity | Creativity | Responsiveness
WebXPRT 3: Overall
WebXPRT 4: Overall
Mozilla Kraken 1.1: Total
| PCMark 10 / Score | |
| Average of class Office (2463 - 7578, n=82, last 2 years) | |
| Lenovo ThinkPad L14 G4 21H6S00900 | |
| HP ProBook 445 G10 | |
| Acer Swift Go 14 SFG14-71 | |
| Dell Latitude 3440 | |
| Average Intel Core i5-1235U, Intel Iris Xe Graphics G7 80EUs (4528 - 5543, n=8) | |
| SCHENKER Work 14 Base | |
| PCMark 10 / Essentials | |
| Lenovo ThinkPad L14 G4 21H6S00900 | |
| Dell Latitude 3440 | |
| HP ProBook 445 G10 | |
| Average of class Office (5575 - 20841, n=82, last 2 years) | |
| Acer Swift Go 14 SFG14-71 | |
| Average Intel Core i5-1235U, Intel Iris Xe Graphics G7 80EUs (9143 - 11273, n=8) | |
| SCHENKER Work 14 Base | |
| PCMark 10 / Productivity | |
| HP ProBook 445 G10 | |
| Lenovo ThinkPad L14 G4 21H6S00900 | |
| Average of class Office (3041 - 10415, n=82, last 2 years) | |
| Acer Swift Go 14 SFG14-71 | |
| Dell Latitude 3440 | |
| Average Intel Core i5-1235U, Intel Iris Xe Graphics G7 80EUs (6440 - 7354, n=8) | |
| SCHENKER Work 14 Base | |
| PCMark 10 / Digital Content Creation | |
| Average of class Office (2049 - 11108, n=82, last 2 years) | |
| Acer Swift Go 14 SFG14-71 | |
| Dell Latitude 3440 | |
| SCHENKER Work 14 Base | |
| Lenovo ThinkPad L14 G4 21H6S00900 | |
| Average Intel Core i5-1235U, Intel Iris Xe Graphics G7 80EUs (4220 - 5839, n=8) | |
| HP ProBook 445 G10 | |
| CrossMark / Overall | |
| Acer Swift Go 14 SFG14-71 | |
| Average of class Office (348 - 1891, n=84, last 2 years) | |
| Dell Latitude 3440 | |
| Average Intel Core i5-1235U, Intel Iris Xe Graphics G7 80EUs (983 - 1644, n=8) | |
| SCHENKER Work 14 Base | |
| Lenovo ThinkPad L14 G4 21H6S00900 | |
| CrossMark / Productivity | |
| Acer Swift Go 14 SFG14-71 | |
| Average of class Office (393 - 1870, n=84, last 2 years) | |
| Dell Latitude 3440 | |
| Average Intel Core i5-1235U, Intel Iris Xe Graphics G7 80EUs (1026 - 1676, n=8) | |
| SCHENKER Work 14 Base | |
| Lenovo ThinkPad L14 G4 21H6S00900 | |
| CrossMark / Creativity | |
| Average of class Office (340 - 2155, n=84, last 2 years) | |
| Dell Latitude 3440 | |
| Acer Swift Go 14 SFG14-71 | |
| Average Intel Core i5-1235U, Intel Iris Xe Graphics G7 80EUs (1032 - 1618, n=8) | |
| SCHENKER Work 14 Base | |
| Lenovo ThinkPad L14 G4 21H6S00900 | |
| CrossMark / Responsiveness | |
| Acer Swift Go 14 SFG14-71 | |
| Average of class Office (258 - 2017, n=84, last 2 years) | |
| Average Intel Core i5-1235U, Intel Iris Xe Graphics G7 80EUs (746 - 1867, n=8) | |
| Dell Latitude 3440 | |
| SCHENKER Work 14 Base | |
| Lenovo ThinkPad L14 G4 21H6S00900 | |
| WebXPRT 3 / Overall | |
| Dell Latitude 3440 | |
| Average of class Office (121 - 455, n=84, last 2 years) | |
| Average Intel Core i5-1235U, Intel Iris Xe Graphics G7 80EUs (233 - 305, n=11) | |
| Lenovo ThinkPad L14 G4 21H6S00900 | |
| Acer Swift Go 14 SFG14-71 | |
| SCHENKER Work 14 Base | |
| WebXPRT 4 / Overall | |
| Dell Latitude 3440 | |
| Average of class Office (80 - 328, n=84, last 2 years) | |
| Average Intel Core i5-1235U, Intel Iris Xe Graphics G7 80EUs (206 - 236, n=10) | |
| SCHENKER Work 14 Base | |
| Lenovo ThinkPad L14 G4 21H6S00900 | |
| Mozilla Kraken 1.1 / Total | |
| Lenovo ThinkPad L14 G4 21H6S00900 | |
| Average of class Office (399 - 1966, n=92, last 2 years) | |
| SCHENKER Work 14 Base | |
| Average Intel Core i5-1235U, Intel Iris Xe Graphics G7 80EUs (486 - 634, n=11) | |
| Acer Swift Go 14 SFG14-71 | |
| Acer Swift Go 14 SFG14-71 | |
| Dell Latitude 3440 | |
* ... smaller is better
| PCMark 10 Score | 4873 points | |
Help | ||
| AIDA64 / Memory Copy | |
| Average of class Office (7158 - 108783, n=91, last 2 years) | |
| Acer Swift Go 14 SFG14-71 | |
| Average Intel Core i5-1235U (24653 - 61921, n=8) | |
| SCHENKER Work 14 Base | |
| Dell Latitude 3440 | |
| HP ProBook 445 G10 | |
| Lenovo ThinkPad L14 G4 21H6S00900 | |
| AIDA64 / Memory Read | |
| Average of class Office (7325 - 127282, n=91, last 2 years) | |
| Average Intel Core i5-1235U (24441 - 66108, n=8) | |
| SCHENKER Work 14 Base | |
| Acer Swift Go 14 SFG14-71 | |
| Dell Latitude 3440 | |
| HP ProBook 445 G10 | |
| Lenovo ThinkPad L14 G4 21H6S00900 | |
| AIDA64 / Memory Write | |
| Acer Swift Go 14 SFG14-71 | |
| Average of class Office (7579 - 117935, n=91, last 2 years) | |
| Average Intel Core i5-1235U (25156 - 75808, n=8) | |
| SCHENKER Work 14 Base | |
| Dell Latitude 3440 | |
| HP ProBook 445 G10 | |
| Lenovo ThinkPad L14 G4 21H6S00900 | |
| AIDA64 / Memory Latency | |
| Acer Swift Go 14 SFG14-71 | |
| Lenovo ThinkPad L14 G4 21H6S00900 | |
| Average of class Office (7.6 - 185.2, n=89, last 2 years) | |
| HP ProBook 445 G10 | |
| Average Intel Core i5-1235U (76.3 - 119, n=8) | |
| SCHENKER Work 14 Base | |
| Dell Latitude 3440 | |
* ... smaller is better
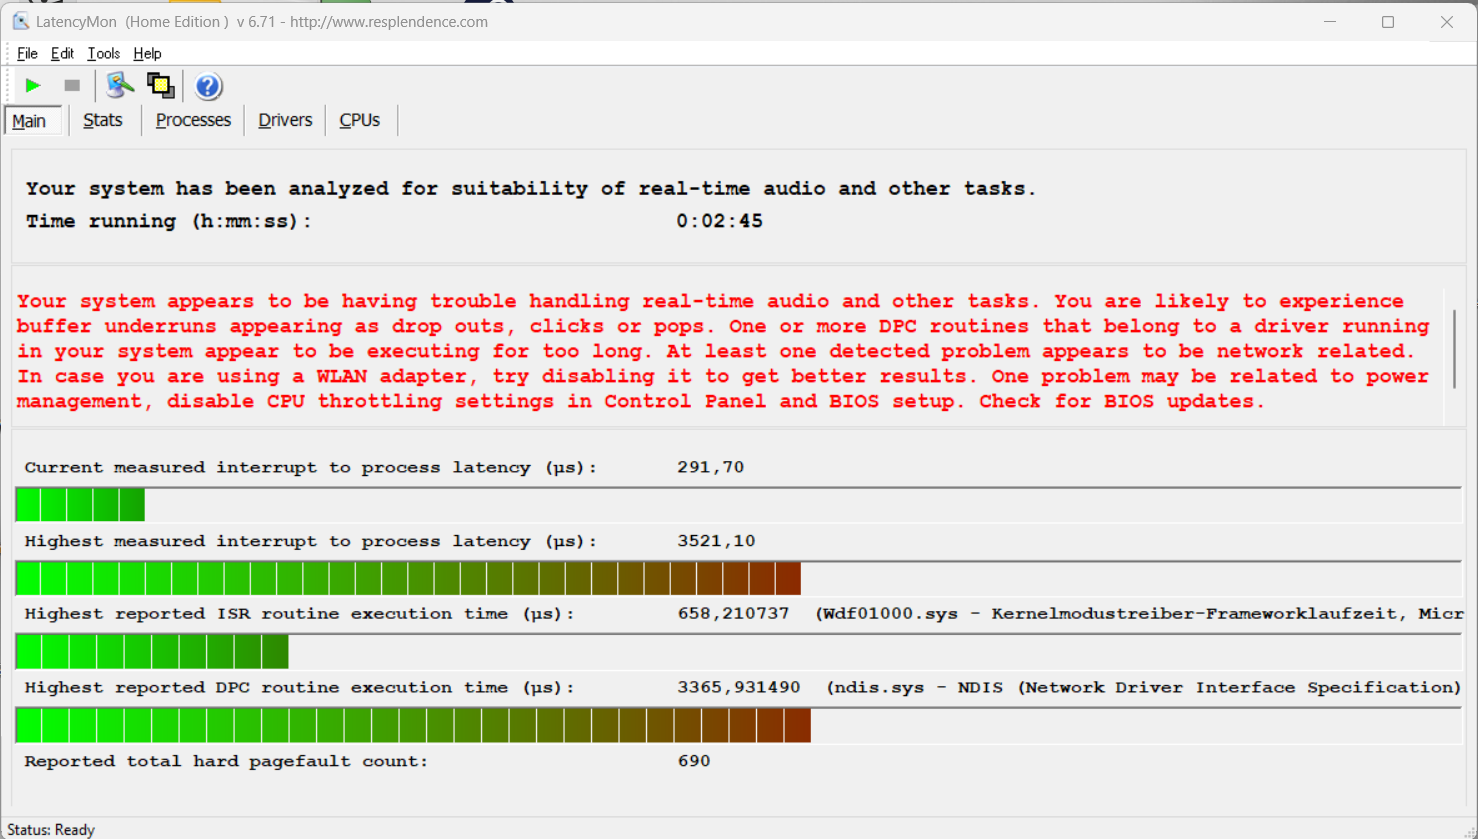
DPC 延迟
在我们的标准化延迟测试中,使用当前 BIOS 版本的测试设备在使用实时音频应用程序时表现出了局限性。
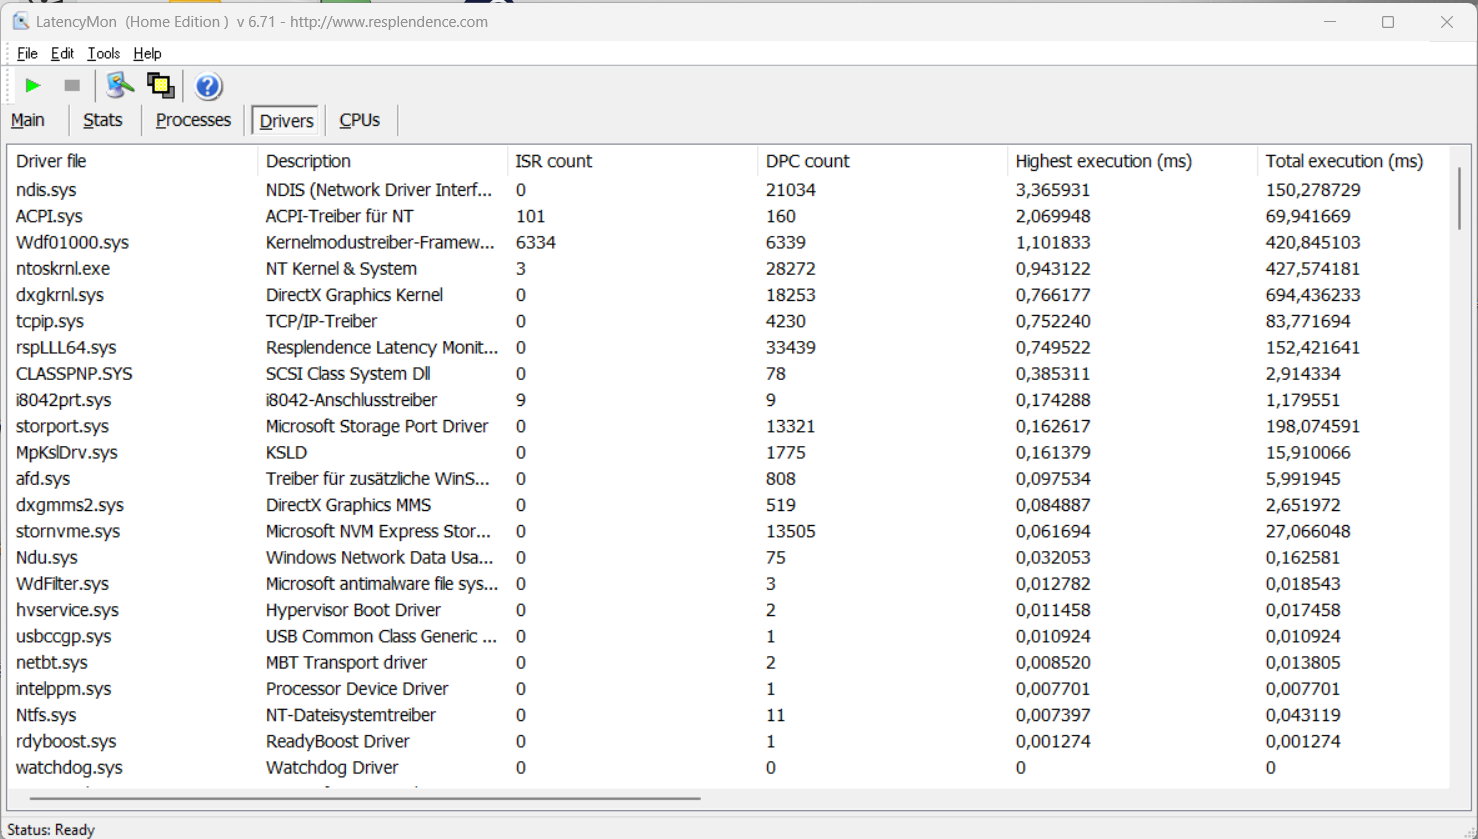
| DPC Latencies / LatencyMon - interrupt to process latency (max), Web, Youtube, Prime95 | |
| SCHENKER Work 14 Base | |
| Dell Latitude 3440 | |
| Lenovo ThinkPad L14 G4 21H6S00900 | |
| HP ProBook 445 G10 | |
| Acer Swift Go 14 SFG14-71 | |
* ... smaller is better
存储设备
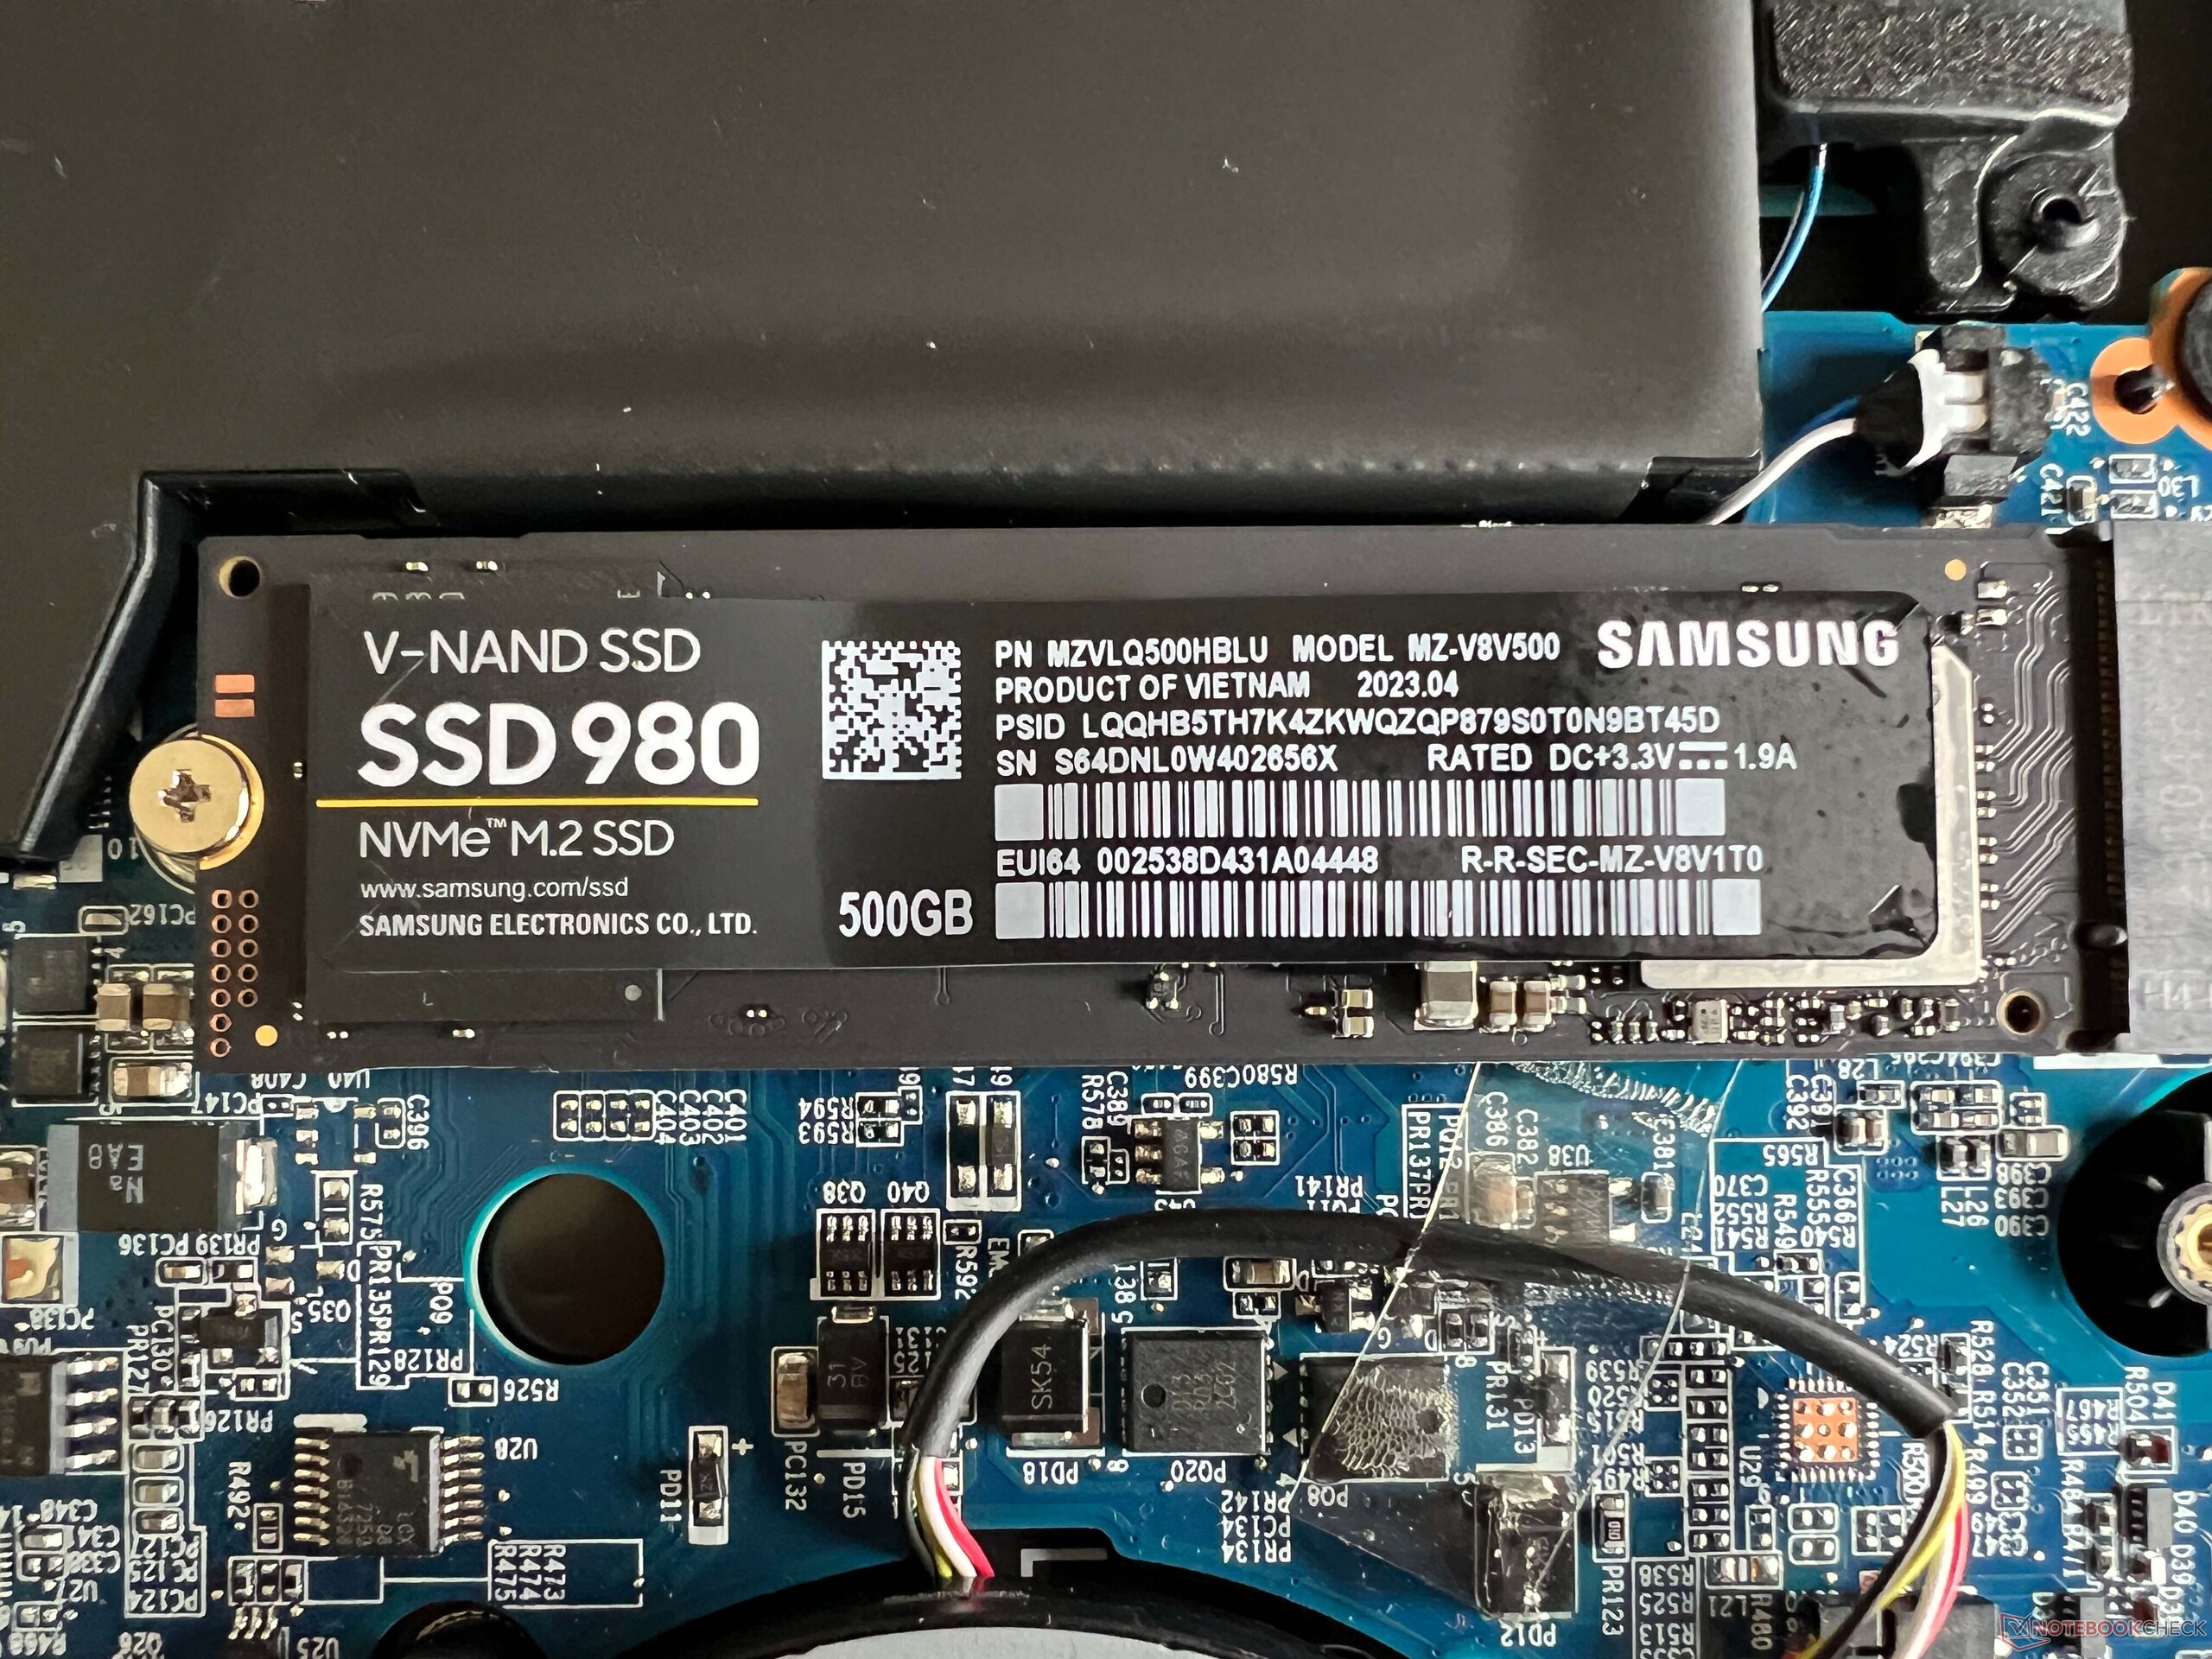
Work 14 配备了用于 M.2-2280 固态硬盘的快速 PCIe 4.0 插槽。我们的测试设备配备的是 500GB 版本的三星 980,它能提供稳定的传输速率。首次启动笔记本电脑后,用户可以使用 422 GB 的容量。更多固态硬盘基准测试 这里。

* ... smaller is better
Reading continuous performance: DiskSpd Read Loop, Queue Depth 8
图形卡
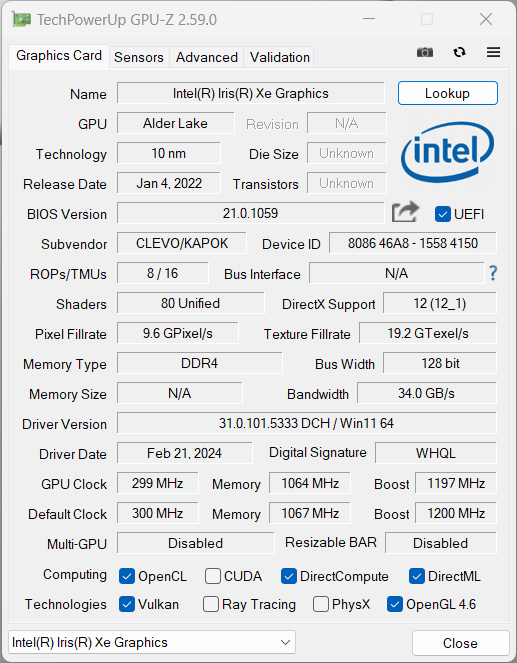
图形计算由集成的 Iris Xe Graphics G7(80 欧)。iGPU 可以很好地处理日常任务,包括播放高分辨率视频,但你不应该对它有更高的期望。不过,同样配备了 Iris GPU 的竞争对手也是如此。 惠普 ProBook 445过时的 AMD RX Vega 7.
我们的游戏基准测试清楚地表明,Work 14 Base 几乎不适合玩游戏。即使在运行较老或要求不高的游戏时,一般也只能达到较低的细节水平。
在长期负载的情况下,其图形性能并不能完全保持稳定,反而会下降约 10%。在电池使用期间,我们注意到性能没有进一步下降。更多 GPU 基准测试请访问。
| 3DMark 11 Performance | 5431 points | |
| 3DMark Fire Strike Score | 3537 points | |
| 3DMark Time Spy Score | 1331 points | |
Help | ||
| Blender / v3.3 Classroom HIP/AMD | |
| Lenovo ThinkPad L14 G4 21H6S00900 | |
| HP ProBook 445 G10 | |
| Average of class Office (296 - 1133, n=13, last 2 years) | |
| Blender / v3.3 Classroom CPU | |
| SCHENKER Work 14 Base | |
| Average Intel Iris Xe Graphics G7 80EUs (463 - 3047, n=51) | |
| Dell Latitude 3440 | |
| Lenovo ThinkPad L14 G4 21H6S00900 | |
| Acer Swift Go 14 SFG14-71 | |
| Average of class Office (245 - 3964, n=87, last 2 years) | |
| HP ProBook 445 G10 | |
* ... smaller is better
| Performance Rating - Percent | |
| Average of class Office | |
| Acer Swift Go 14 SFG14-71 | |
| Dell Latitude 3440 | |
| SCHENKER Work 14 Base | |
| HP ProBook 445 G10 | |
| Lenovo ThinkPad L14 G4 21H6S00900 | |
| The Witcher 3 - 1920x1080 Ultra Graphics & Postprocessing (HBAO+) | |
| Average of class Office (3.8 - 34, n=58, last 2 years) | |
| Acer Swift Go 14 SFG14-71 | |
| HP ProBook 445 G10 | |
| Dell Latitude 3440 | |
| SCHENKER Work 14 Base | |
| Lenovo ThinkPad L14 G4 21H6S00900 | |
| GTA V - 1920x1080 Highest Settings possible AA:4xMSAA + FX AF:16x | |
| Average of class Office (3.98 - 47.8, n=78, last 2 years) | |
| Acer Swift Go 14 SFG14-71 | |
| Lenovo ThinkPad L14 G4 21H6S00900 | |
| SCHENKER Work 14 Base | |
| HP ProBook 445 G10 | |
| Dell Latitude 3440 | |
| Final Fantasy XV Benchmark - 1920x1080 High Quality | |
| Average of class Office (4.18 - 36.4, n=86, last 2 years) | |
| Acer Swift Go 14 SFG14-71 | |
| Dell Latitude 3440 | |
| SCHENKER Work 14 Base | |
| HP ProBook 445 G10 | |
| Lenovo ThinkPad L14 G4 21H6S00900 | |
| Strange Brigade - 1920x1080 ultra AA:ultra AF:16 | |
| Average of class Office (12.8 - 61.7, n=69, last 2 years) | |
| Acer Swift Go 14 SFG14-71 | |
| Dell Latitude 3440 | |
| SCHENKER Work 14 Base | |
| HP ProBook 445 G10 | |
| Lenovo ThinkPad L14 G4 21H6S00900 | |
| Dota 2 Reborn - 1920x1080 ultra (3/3) best looking | |
| Acer Swift Go 14 SFG14-71 | |
| Average of class Office (13.4 - 121.2, n=92, last 2 years) | |
| Dell Latitude 3440 | |
| SCHENKER Work 14 Base | |
| HP ProBook 445 G10 | |
| Lenovo ThinkPad L14 G4 21H6S00900 | |
| X-Plane 11.11 - 1920x1080 high (fps_test=3) | |
| Average of class Office (8.88 - 92.6, n=84, last 2 years) | |
| Dell Latitude 3440 | |
| HP ProBook 445 G10 | |
| Lenovo ThinkPad L14 G4 21H6S00900 | |
| SCHENKER Work 14 Base | |
| Acer Swift Go 14 SFG14-71 | |
Witcher 3 FPS diagram
| low | med. | high | ultra | |
|---|---|---|---|---|
| GTA V (2015) | 76.2 | 66.4 | 15.8 | 6.87 |
| The Witcher 3 (2015) | 66 | 43 | 23 | 9.6 |
| Dota 2 Reborn (2015) | 82.5 | 60 | 46.6 | 41.9 |
| Final Fantasy XV Benchmark (2018) | 30.2 | 17.4 | 12.1 | |
| X-Plane 11.11 (2018) | 30.2 | 23.7 | 21.8 | |
| Far Cry 5 (2018) | 36 | 20 | 19 | 17 |
| Strange Brigade (2018) | 64.6 | 28.3 | 22.4 | 17.6 |
| F1 23 (2023) | 29.3 | 26.7 | 18.3 |
排放与动力
噪音排放
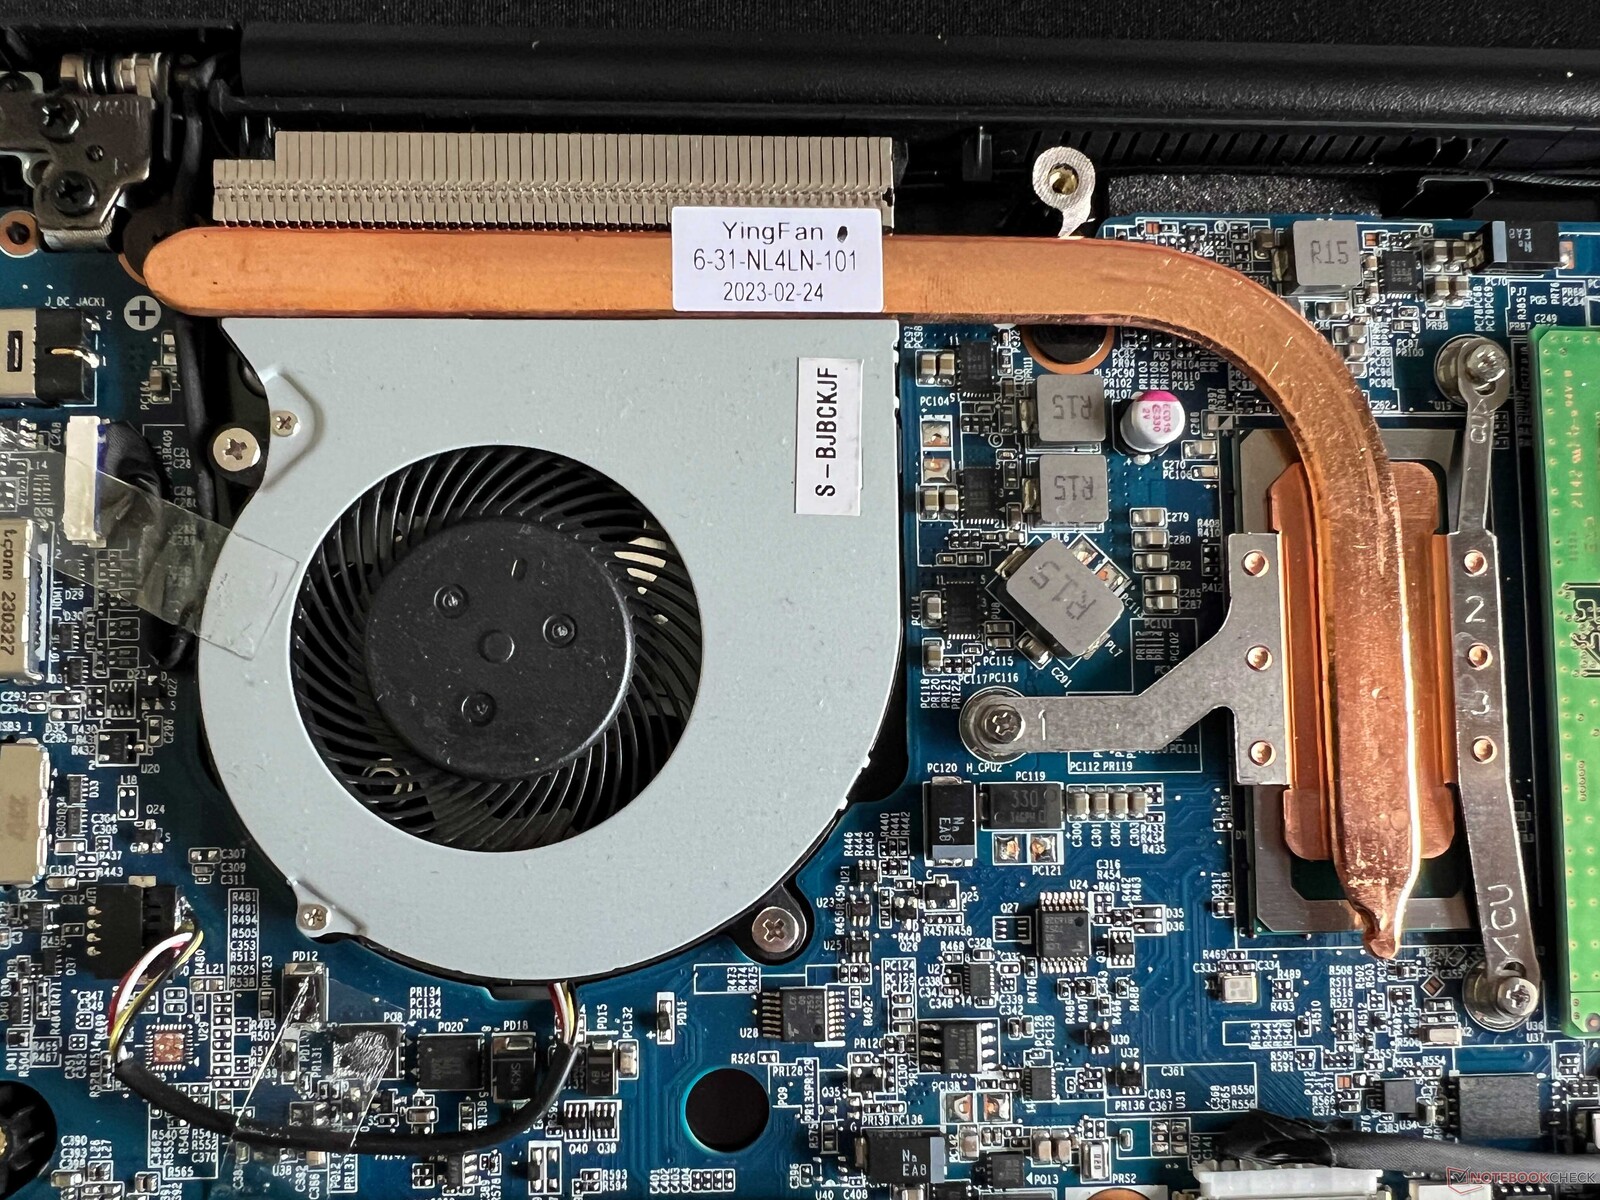
笔记本电脑采用单风扇散热。在空转和低负载情况下,风扇会保持相当安静,但如果对系统提出更高的要求,风扇就会变得相当响亮(35 dB(A)),此外还会发出高频噪音。在压力测试中,43 分贝(A)的噪音实在太大,尤其是考虑到笔记本电脑的低性能。我们没有注意到测试设备发出任何其他电子噪音。
Noise Level
| Idle |
| 23.6 / 23.6 / 24.8 dB(A) |
| Load |
| 34.2 / 42.9 dB(A) |
 | ||
30 dB silent 40 dB(A) audible 50 dB(A) loud |
||
min: | ||
| SCHENKER Work 14 Base Iris Xe G7 80EUs, i5-1235U, Samsung SSD 980 500GB (MZ-V8V500BW) | Acer Swift Go 14 SFG14-71 Iris Xe G7 80EUs, i5-1335U, WD PC SN740 SDDQNQD-512G-1014 | HP ProBook 445 G10 Vega 7, R5 7530U, Kioxia BG5 KBG50ZNS512G | Dell Latitude 3440 Iris Xe G7 80EUs, i5-1345U, Samsung PM9A1 MZVL2512HCJQ | Lenovo ThinkPad L14 G4 21H6S00900 Vega 7, R5 7530U, Kioxia BG5 KBG5AZNT512G | |
|---|---|---|---|---|---|
| Noise | -5% | -1% | -3% | -3% | |
| off / environment * | 23.6 | 24.9 -6% | 24 -2% | 23.9 -1% | 25.2 -7% |
| Idle Minimum * | 23.6 | 24.9 -6% | 24 -2% | 24.4 -3% | 25.2 -7% |
| Idle Average * | 23.6 | 24.9 -6% | 25 -6% | 24.4 -3% | 25.2 -7% |
| Idle Maximum * | 24.8 | 24.9 -0% | 28 -13% | 24.4 2% | 27.3 -10% |
| Load Average * | 34.2 | 31.9 7% | 33 4% | 37.1 -8% | 32.1 6% |
| Witcher 3 ultra * | 34.2 | 43.2 -26% | 36 -5% | 38.2 -12% | 35.7 -4% |
| Load Maximum * | 42.9 | 43.2 -1% | 36 16% | 40.2 6% | 38.3 11% |
* ... smaller is better
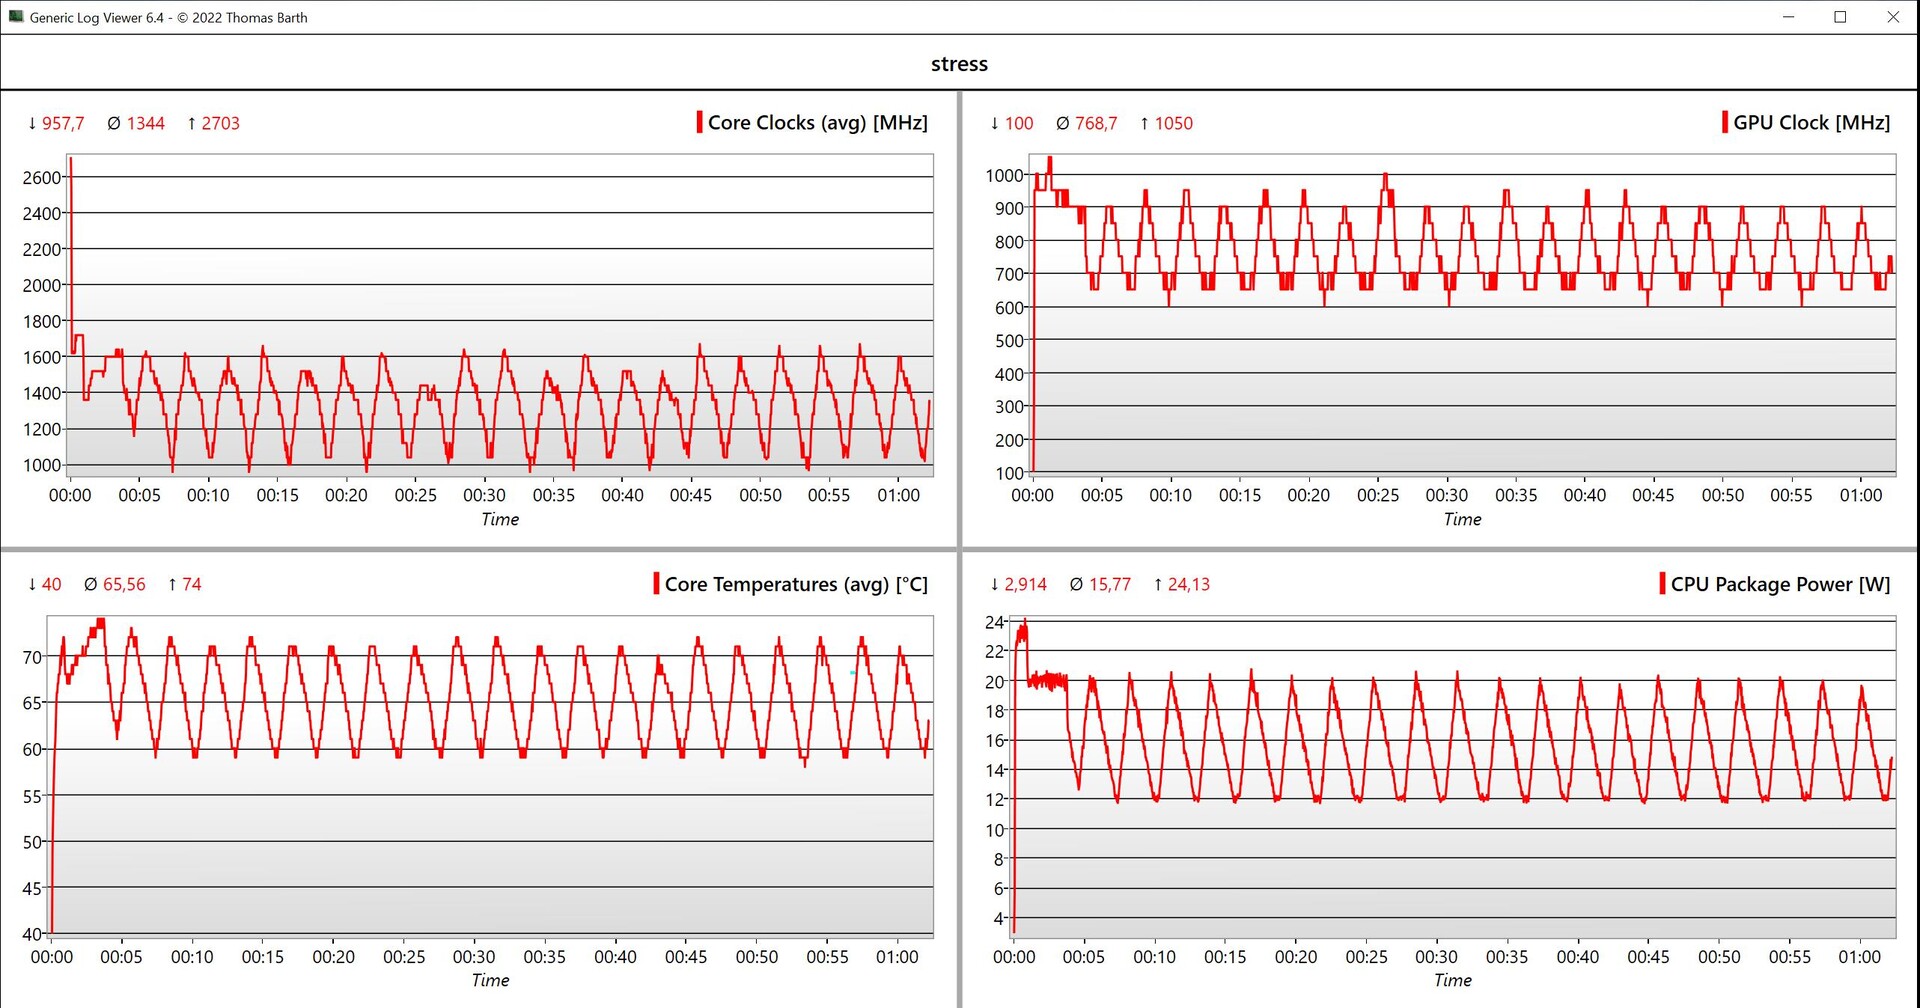
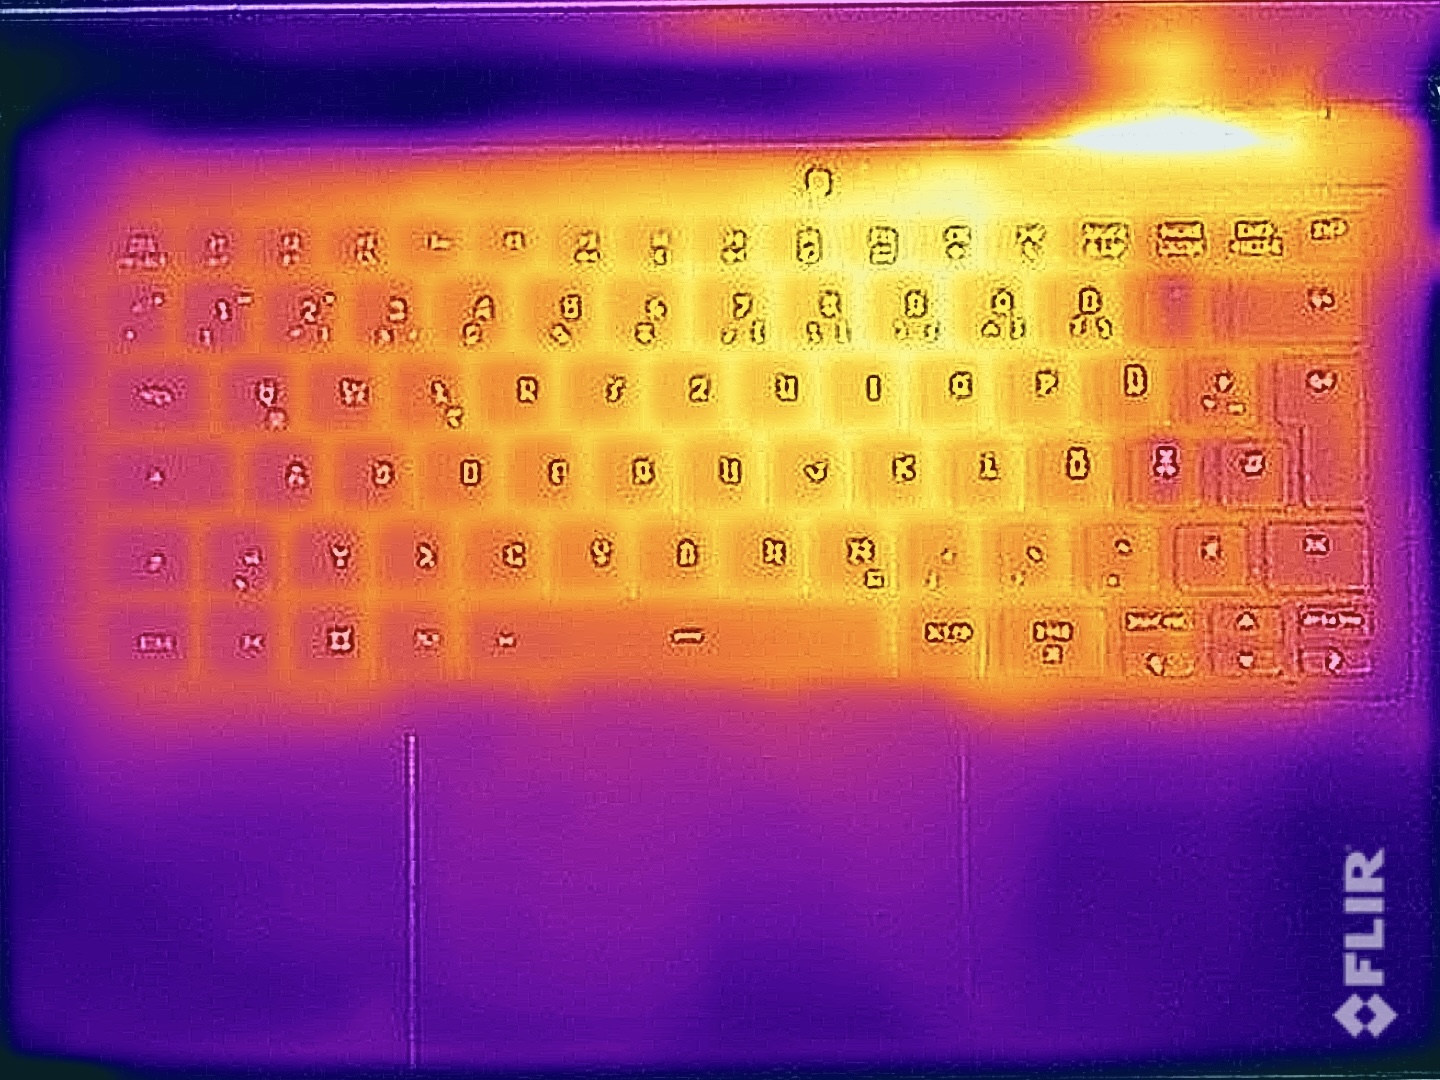
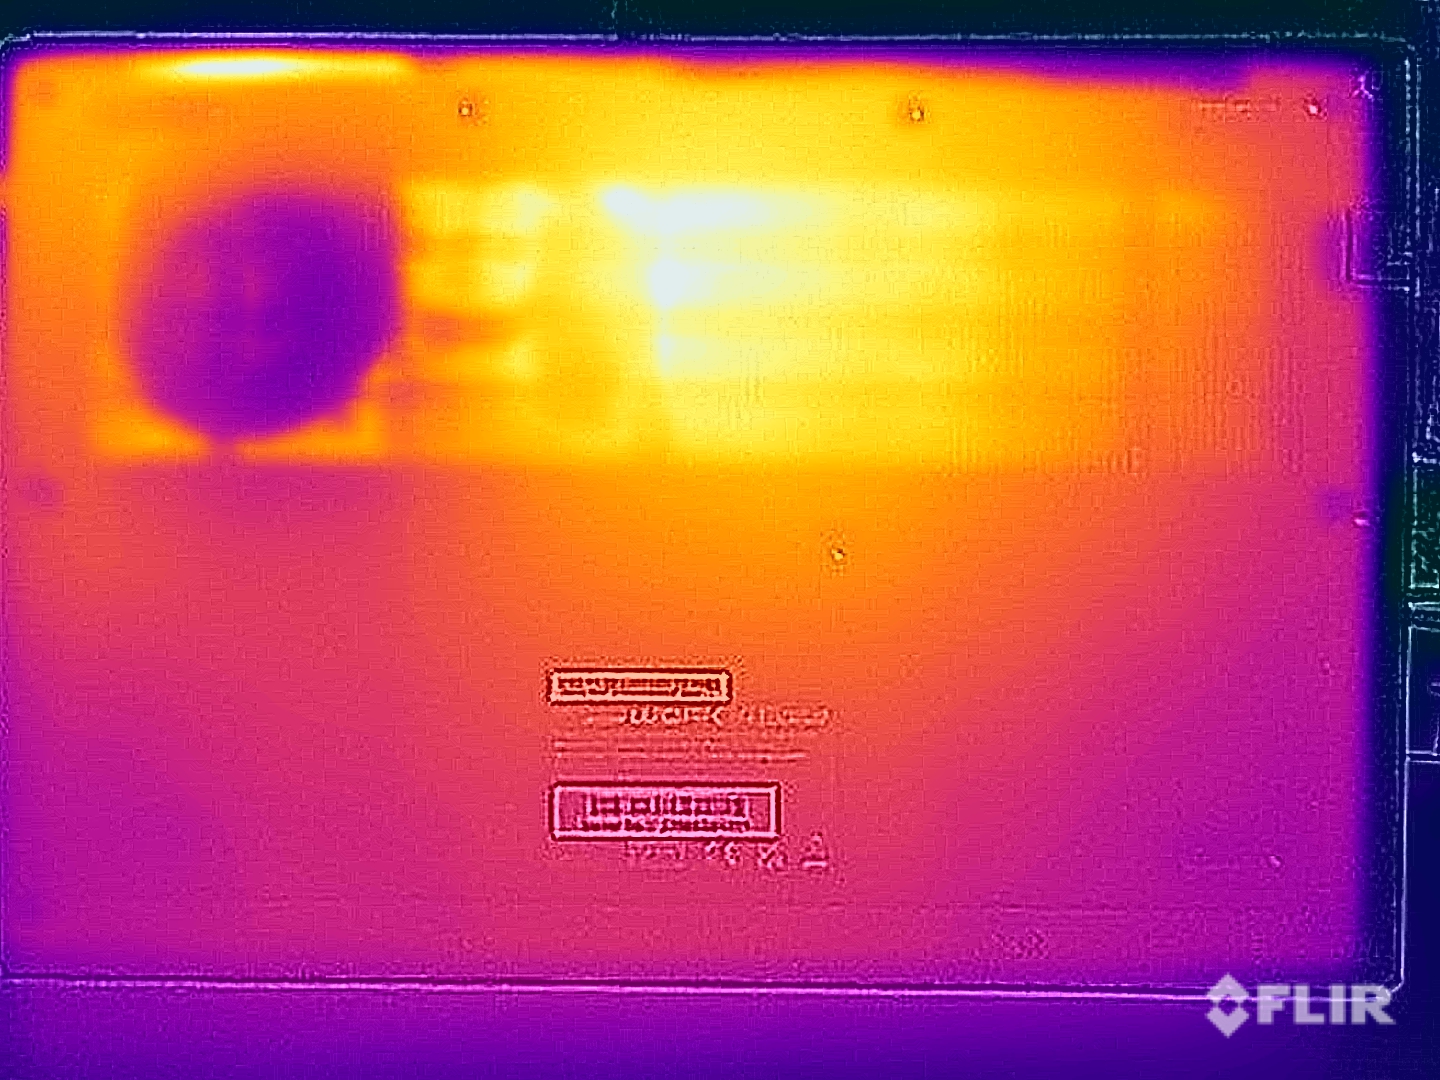
温度
它的表面温度不高,即使在满载情况下,你也可以把 Work 14 放在大腿上,而且打字时手指也不会发烫。在压力测试中,处理器的耗电量在 20 瓦的情况下持续了好几分钟,而在进一步的测试过程中,它的耗电量在 12 至 20 瓦之间保持平衡。
(+) The maximum temperature on the upper side is 39.2 °C / 103 F, compared to the average of 34.3 °C / 94 F, ranging from 21.2 to 62.5 °C for the class Office.
(±) The bottom heats up to a maximum of 40.4 °C / 105 F, compared to the average of 36.8 °C / 98 F
(+) In idle usage, the average temperature for the upper side is 24.4 °C / 76 F, compared to the device average of 29.5 °C / 85 F.
(±) Playing The Witcher 3, the average temperature for the upper side is 33.3 °C / 92 F, compared to the device average of 29.5 °C / 85 F.
(+) The palmrests and touchpad are cooler than skin temperature with a maximum of 27 °C / 80.6 F and are therefore cool to the touch.
(±) The average temperature of the palmrest area of similar devices was 27.6 °C / 81.7 F (+0.6 °C / 1.1 F).
| SCHENKER Work 14 Base Intel Core i5-1235U, Intel Iris Xe Graphics G7 80EUs | Acer Swift Go 14 SFG14-71 Intel Core i5-1335U, Intel Iris Xe Graphics G7 80EUs | HP ProBook 445 G10 AMD Ryzen 5 7530U, AMD Radeon RX Vega 7 | Dell Latitude 3440 Intel Core i5-1345U, Intel Iris Xe Graphics G7 80EUs | Lenovo ThinkPad L14 G4 21H6S00900 AMD Ryzen 5 7530U, AMD Radeon RX Vega 7 | |
|---|---|---|---|---|---|
| Heat | -12% | -15% | -8% | -16% | |
| Maximum Upper Side * | 39.2 | 44.8 -14% | 43 -10% | 35.2 10% | 39 1% |
| Maximum Bottom * | 40.4 | 34.8 14% | 51 -26% | 41 -1% | 46.3 -15% |
| Idle Upper Side * | 25.3 | 30.7 -21% | 27 -7% | 29.8 -18% | 26.3 -4% |
| Idle Bottom * | 25.8 | 32.5 -26% | 30 -16% | 32 -24% | 37.5 -45% |
* ... smaller is better
发言人
这台笔记本电脑的两个立体声扬声器可以达到很高的最大音量,但整体音质却非常弱,这也是 Work 14 的主要弱点之一。虽然价格低廉的办公笔记本电脑从来都不是以令人印象深刻的音效而闻名,但戴尔的 Latitude 14显示出可以做得更多。其他竞争对手在这方面也有优势。
SCHENKER Work 14 Base audio analysis
(+) | speakers can play relatively loud (84.4 dB)
Bass 100 - 315 Hz
(-) | nearly no bass - on average 22.8% lower than median
(±) | linearity of bass is average (8.6% delta to prev. frequency)
Mids 400 - 2000 Hz
(±) | higher mids - on average 9.7% higher than median
(±) | linearity of mids is average (11.7% delta to prev. frequency)
Highs 2 - 16 kHz
(+) | balanced highs - only 4.6% away from median
(±) | linearity of highs is average (8.5% delta to prev. frequency)
Overall 100 - 16.000 Hz
(±) | linearity of overall sound is average (25.9% difference to median)
Compared to same class
» 78% of all tested devices in this class were better, 7% similar, 15% worse
» The best had a delta of 7%, average was 21%, worst was 53%
Compared to all devices tested
» 78% of all tested devices were better, 4% similar, 18% worse
» The best had a delta of 4%, average was 24%, worst was 134%
Dell Latitude 3440 audio analysis
(+) | speakers can play relatively loud (85.8 dB)
Bass 100 - 315 Hz
(±) | reduced bass - on average 14.6% lower than median
(±) | linearity of bass is average (9.8% delta to prev. frequency)
Mids 400 - 2000 Hz
(+) | balanced mids - only 3% away from median
(+) | mids are linear (3.5% delta to prev. frequency)
Highs 2 - 16 kHz
(+) | balanced highs - only 4.2% away from median
(+) | highs are linear (5.9% delta to prev. frequency)
Overall 100 - 16.000 Hz
(+) | overall sound is linear (11.6% difference to median)
Compared to same class
» 2% of all tested devices in this class were better, 2% similar, 96% worse
» The best had a delta of 7%, average was 21%, worst was 53%
Compared to all devices tested
» 7% of all tested devices were better, 2% similar, 91% worse
» The best had a delta of 4%, average was 24%, worst was 134%
耗电量
在设备功耗值方面,我们没有发现任何意外,45 瓦的电源绰绰有余。
| Off / Standby | |
| Idle | |
| Load |
|
Key:
min: | |
Power consumption Witcher 3 / stress test
Power consumption with external monitor
运行时间
Work 14 配备 49 瓦时电池,在 150 cd/m²(测试设备最大亮度的 38%)条件下实际运行时间为 7:38 小时,在 WLAN 测试中最大亮度下实际运行时间为 5:33 小时。因此,这款设备落后于大多数竞争对手,Work 14 无法在不需要充电器的情况下工作一整天。在开机状态下,为设备完全充电大约需要 2.5 小时。
| Battery Runtime | |
| WiFi Websurfing | |
| Lenovo ThinkPad L14 G4 21H6S00900 | |
| Average of class Office (230 - 1614, n=91, last 2 years) | |
| HP ProBook 445 G10 | |
| Dell Latitude 3440 | |
| SCHENKER Work 14 Base | |
| Acer Swift Go 14 SFG14-71 | |
| WiFi Websurfing max. Brightness | |
| Lenovo ThinkPad L14 G4 21H6S00900 | |
| Average of class Office (291 - 720, n=43, last 2 years) | |
| SCHENKER Work 14 Base | |
Pros
Cons
结论 - 可提供良好维护选项的办公笔记本电脑
申克 Work 14 Base 是一款入门级办公笔记本电脑,除了铝制外壳外,还配备了非常好的维护选项和多种端口选择。遗憾的是,它没有采用 USB4 和 Thunderbolt 等现代标准,但它拥有足够的 USB 端口和千兆以太网连接--这在如今的办公笔记本电脑中并不常见。与竞争对手的塑料外壳相比,它的铝制外壳看起来更有质感,但其表面会留下很多指纹印,我们在测试过程中还注意到了一些轻微的吱吱声。
这款笔记本电脑配备了过时的酷睿 i5-1235U,使用低功耗限制,因此其性能完全可以满足简单的日常任务。PCIe固态硬盘也是造成这种良好主观印象的部分原因。另一方面,它的小风扇在负载情况下会发出高亢的噪音,整体声音过大,让人很不舒服。笔记本电脑的全高清分辨率雾面 IPS 显示屏亮度高达 400 cd/m²。
申克 Work 14 Base 是一款简单的办公笔记本电脑,采用铝制外壳、良好的维护选项和哑光 IPS 显示屏。不过,你必须忍受画面颗粒感和普遍较低的性能标准。
Work 14 Base 与竞争对手的竞争也并不轻松,因为后者的性能、运行时间和扬声器都略胜一筹。不过,16:9 显示屏仍然是这一价格档次的标准配置,一般来说,在这一档次中,你必须在性能方面做出一些妥协。
价格和供应情况
目前,Schenker Work 14 Base 的售价约为 750 美元,但在美国还没有销售。
SCHENKER Work 14 Base
- 05/01/2024 v7 (old)
Andreas Osthoff
Transparency
The selection of devices to be reviewed is made by our editorial team. The test sample was provided to the author as a loan by the manufacturer or retailer for the purpose of this review. The lender had no influence on this review, nor did the manufacturer receive a copy of this review before publication. There was no obligation to publish this review. We never accept compensation or payment in return for our reviews. As an independent media company, Notebookcheck is not subjected to the authority of manufacturers, retailers or publishers.
This is how Notebookcheck is testing
Every year, Notebookcheck independently reviews hundreds of laptops and smartphones using standardized procedures to ensure that all results are comparable. We have continuously developed our test methods for around 20 years and set industry standards in the process. In our test labs, high-quality measuring equipment is utilized by experienced technicians and editors. These tests involve a multi-stage validation process. Our complex rating system is based on hundreds of well-founded measurements and benchmarks, which maintains objectivity. Further information on our test methods can be found here.
Price comparison

