

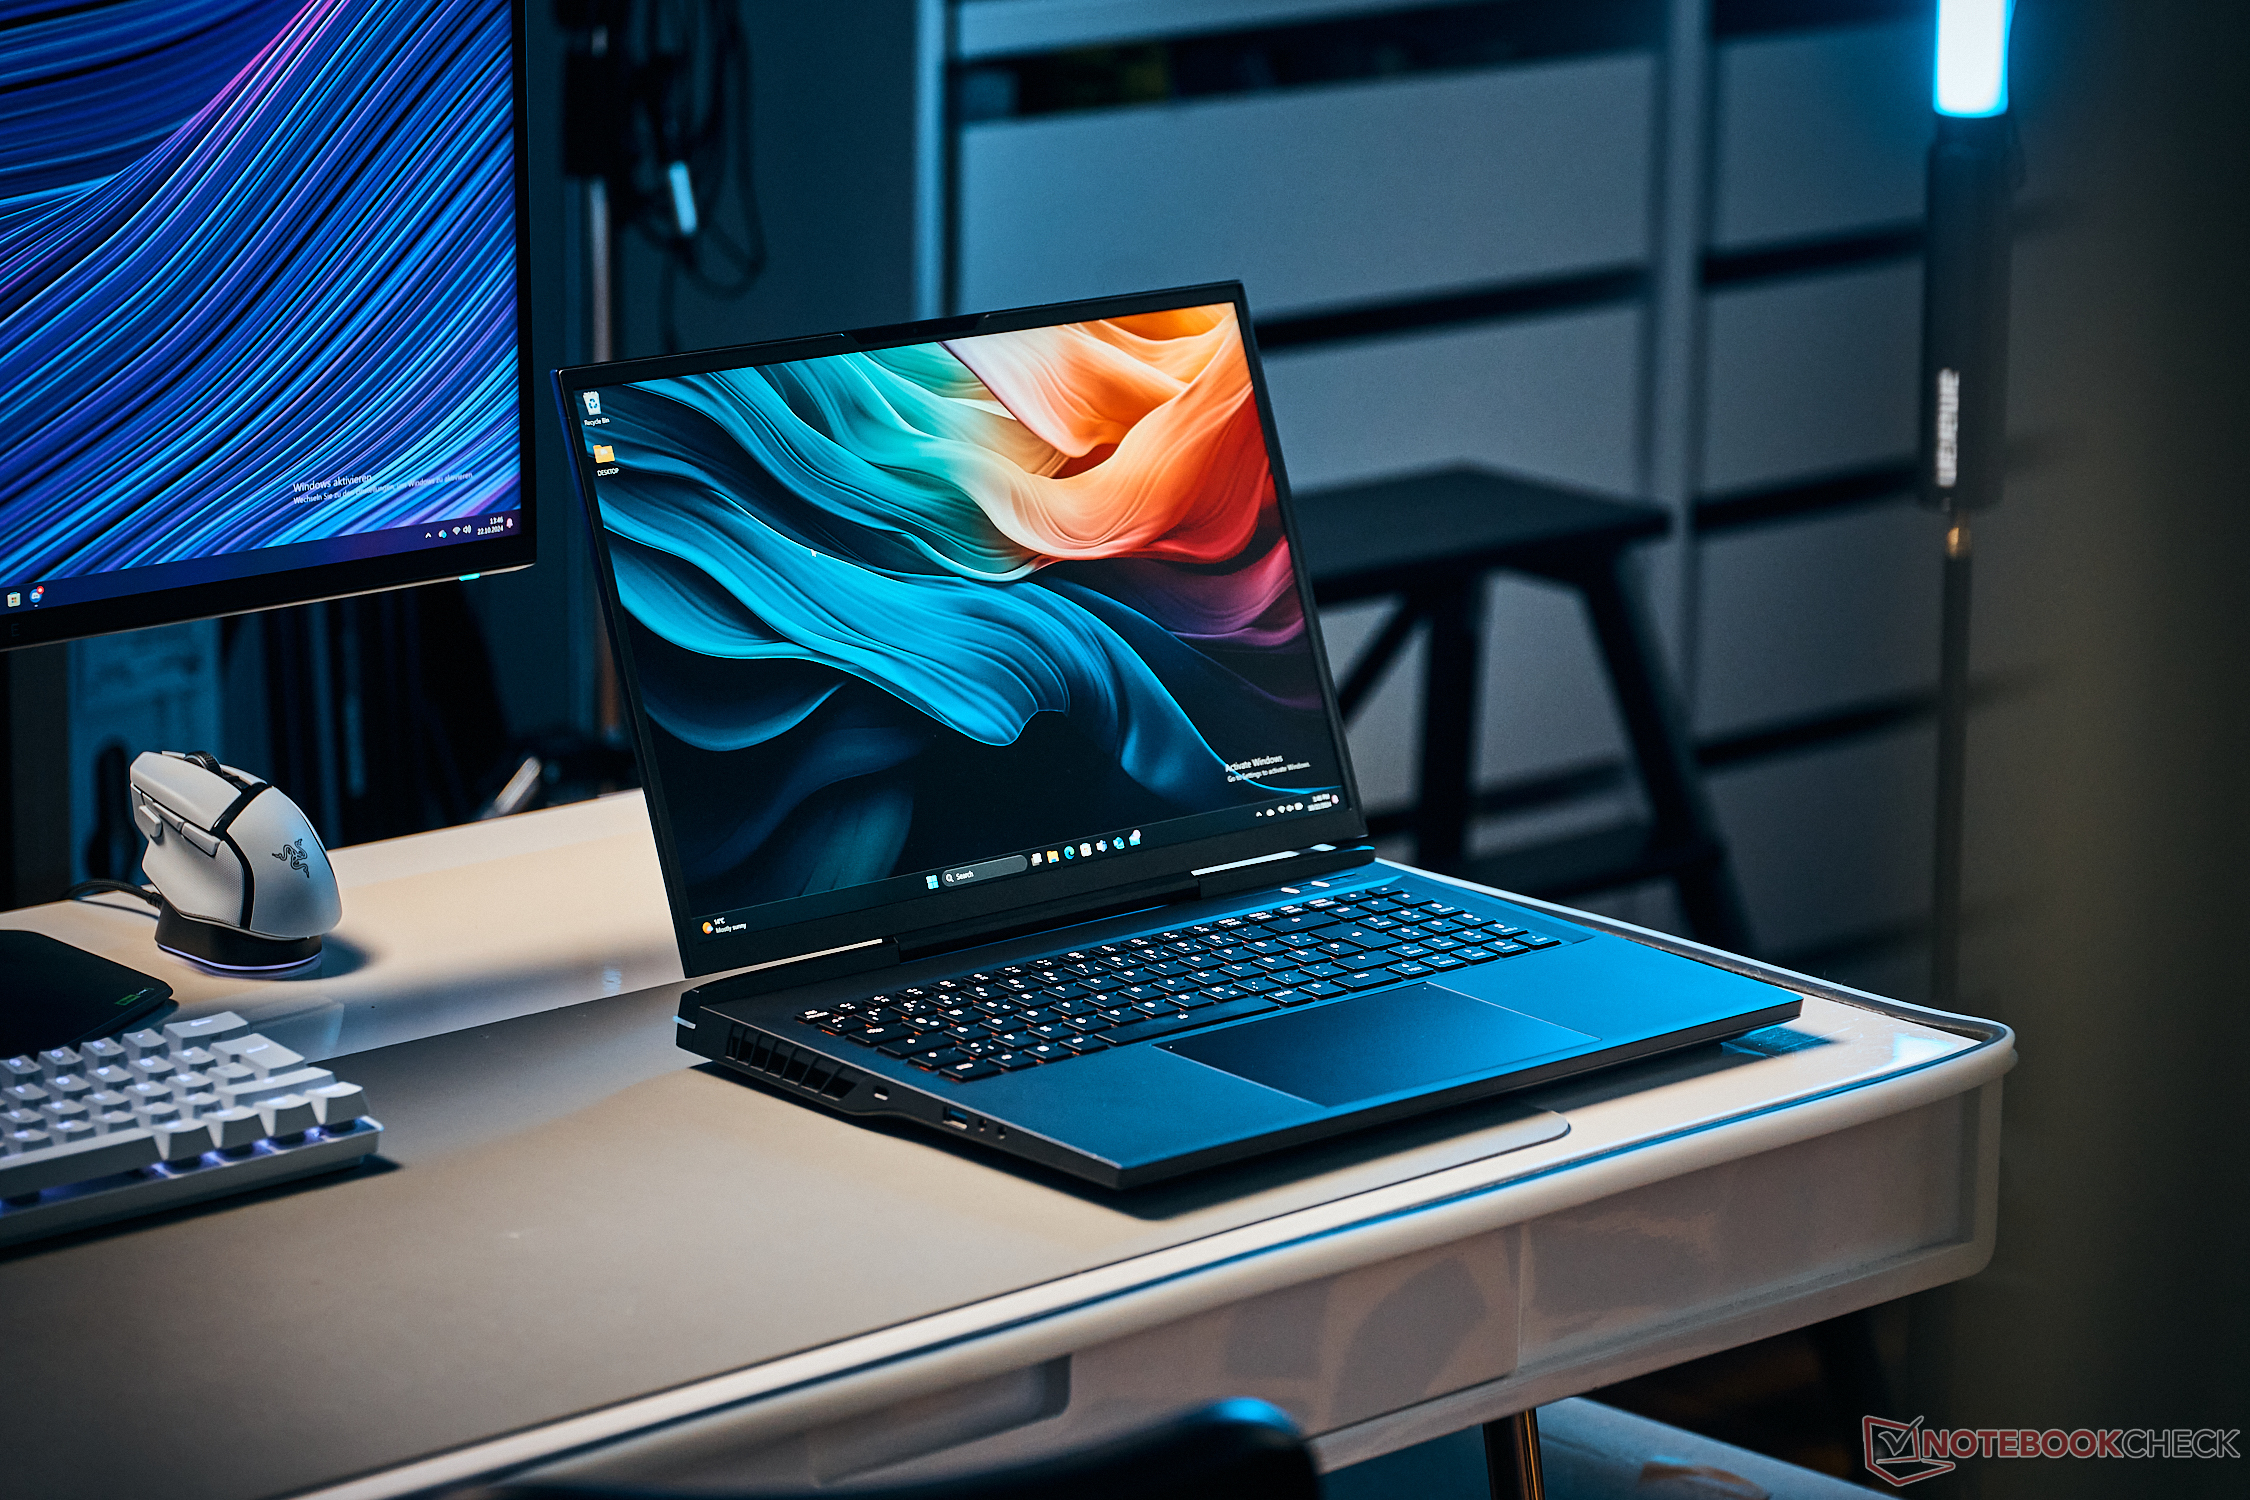
XMG Neo 17 E24 评测--可选配水冷系统的快速游戏笔记本电脑
RTX 4080 笔记本电脑和机械键盘。
XMG Neo 17 是一款纯种游戏机,可配备市场上最快的组件。此外,还可选配 Cherry 机械键盘和外置水冷系统,不仅能降低温度,还能减少背景噪音。Andreas Osthoff, 👁 Andreas Osthoff (translated by DeepL / Ninh Duy) Published 🇺🇸 🇩🇪 ...
结论 - XMG Neo 17 专注于游戏性能
在测试中,XMG Neo 17 作为一款功能强大的游戏笔记本电脑,明显注重组件的最大性能。英特尔酷睿 i9-14900HX 在所有配置中都被用作处理器,而专用的 Nvidia GPU 则可以超频。因此,它是我们迄今测试过的速度最快的 RTX 4080 笔记本电脑之一。这为快速的 240 Hz QHD 面板提供了足够的性能,也非常适合游戏。可选的外置 Oasis 水冷系统的电路得到了改进,现在也覆盖了处理器。因此,温度大大降低,游戏时的噪音也更小。
这款游戏机在其他方面也很出色:有足够的端口可用,机箱质量上乘,可选的 Cherry 机械键盘非常出色,但声音也很大。内存/SSD 容量也可以配置,日后升级也不成问题。17 英寸笔记本相对较大,重量也不轻,只有不到 3 千克。即使不使用 Oasis 水冷散热装置,散热装置的散热效果也不错,但在游戏时风扇的声音会非常大,你应该使用耳机。
就价格而言,3000 多欧元当然不便宜,但这主要是由于GeForce GPU 的缘故。如果您正在寻找一款纯正的游戏机,并且还想利用水冷技术,XMG Neo 17 绝对是一个不错的选择。
Pros
Cons
价格和供应情况
可能的替代品比较
Image | Model / Review | Geizhals | Weight | Height | Display |
|---|---|---|---|---|---|
1. 84.6%  | SCHENKER XMG Neo 17 E24 Intel Core i9-14900HX ⎘ NVIDIA GeForce RTX 4080 Laptop GPU ⎘ 32 GB Memory, 1024 GB SSD | Listenpreis 3189€ | 2.9 kg | 27 mm | 17.00" 2560x1600 178 PPI IPS |
2. 89.2% v7 (old)  | Medion Erazer Beast X40 2024 Intel Core i9-14900HX ⎘ NVIDIA GeForce RTX 4090 Laptop GPU ⎘ 32 GB Memory, 1024 GB SSD | Listenpreis 4000 Euro | 2.9 kg | 36 mm | 17.00" 2560x1600 178 PPI IPS |
3. 80.4%  | HP Omen 17-db0079ng AMD Ryzen 7 8845HS ⎘ NVIDIA GeForce RTX 4070 Laptop GPU ⎘ 32 GB Memory, 1024 GB SSD | Listenpreis 1900€ | 2.8 kg | 30.1 mm | 17.30" 2560x1440 170 PPI IPS |
4. 85.2% v7 (old)  | Eurocom Raptor X17 Core i9-14900HX Intel Core i9-14900HX ⎘ NVIDIA GeForce RTX 4090 Laptop GPU ⎘ 32 GB Memory, 2048 GB SSD | Listenpreis 4500 USD | 3.4 kg | 24.9 mm | 17.30" 3840x2160 255 PPI IPS |
5. 88.3% v7 (old)  | MSI GE78HX 13VH-070US Intel Core i9-13950HX ⎘ NVIDIA GeForce RTX 4080 Laptop GPU ⎘ 32 GB Memory, 2048 GB SSD | Listenpreis 3600 USD | 3 kg | 23 mm | 17.00" 2560x1600 178 PPI IPS |
申克公司推出的 XMG Neo 17 E24 是一款功能强大的 17 英寸游戏笔记本,配备 240 Hz QHD 面板(G-Sync)。处理器始终采用英特尔酷睿 i9-14900HX,显卡则有以下两种选择 英伟达GeForce RTX 4060 笔记本电脑和其他所有型号,直至 GeForce RTX 4090 笔记本电脑.RAM/SSD 内存可进行广泛配置,除了机械键盘外,还可选配外置 Oasis 水冷系统,该系统可显著提高笔记本电脑的散热能力。
我们的测试设备配备了专用的 GeForce RTX 4080 笔记本电脑GPU、32 GB 内存和来自三星的 1 TB 固态硬盘,包括机械式 Cherry 键盘在内,价格增至 3,182 欧元(基础价格为 1,948 欧元)。此外,我们还将对配备 RTX 4090 笔记本电脑和 Oasis 水冷系统(199 欧元)的 Neo 17 进行一些基准测试。
规格
箱子和设备
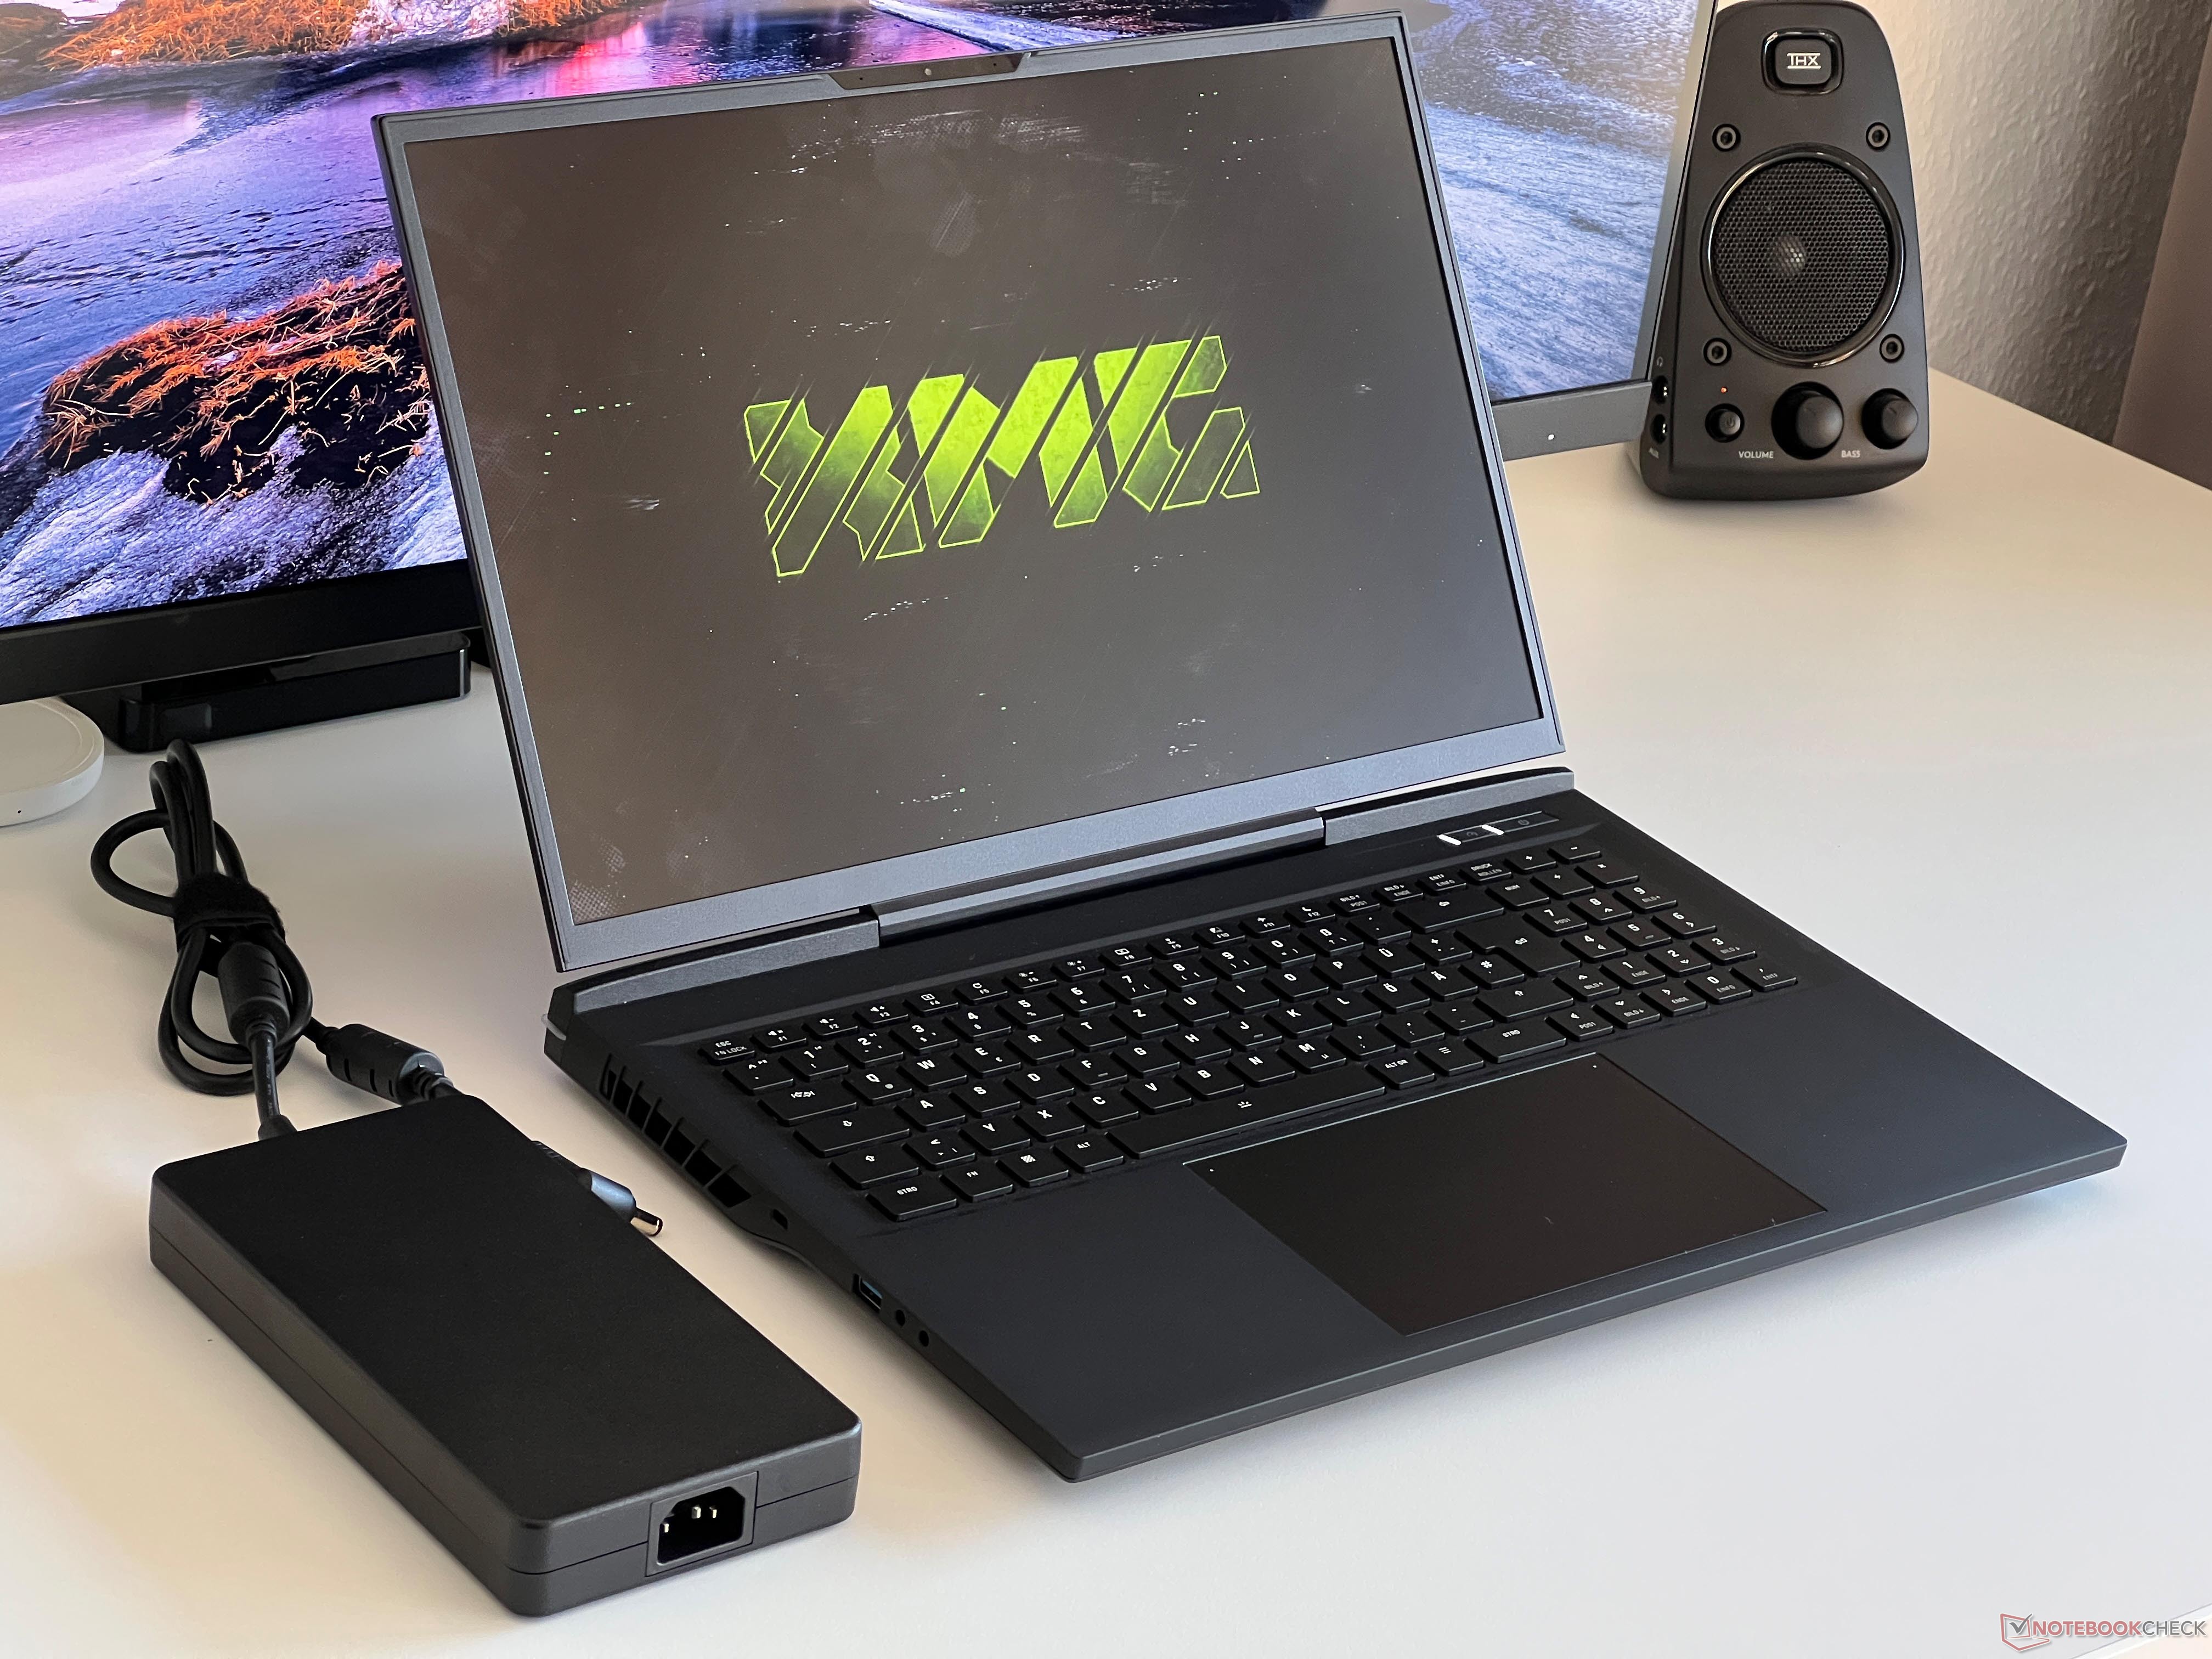
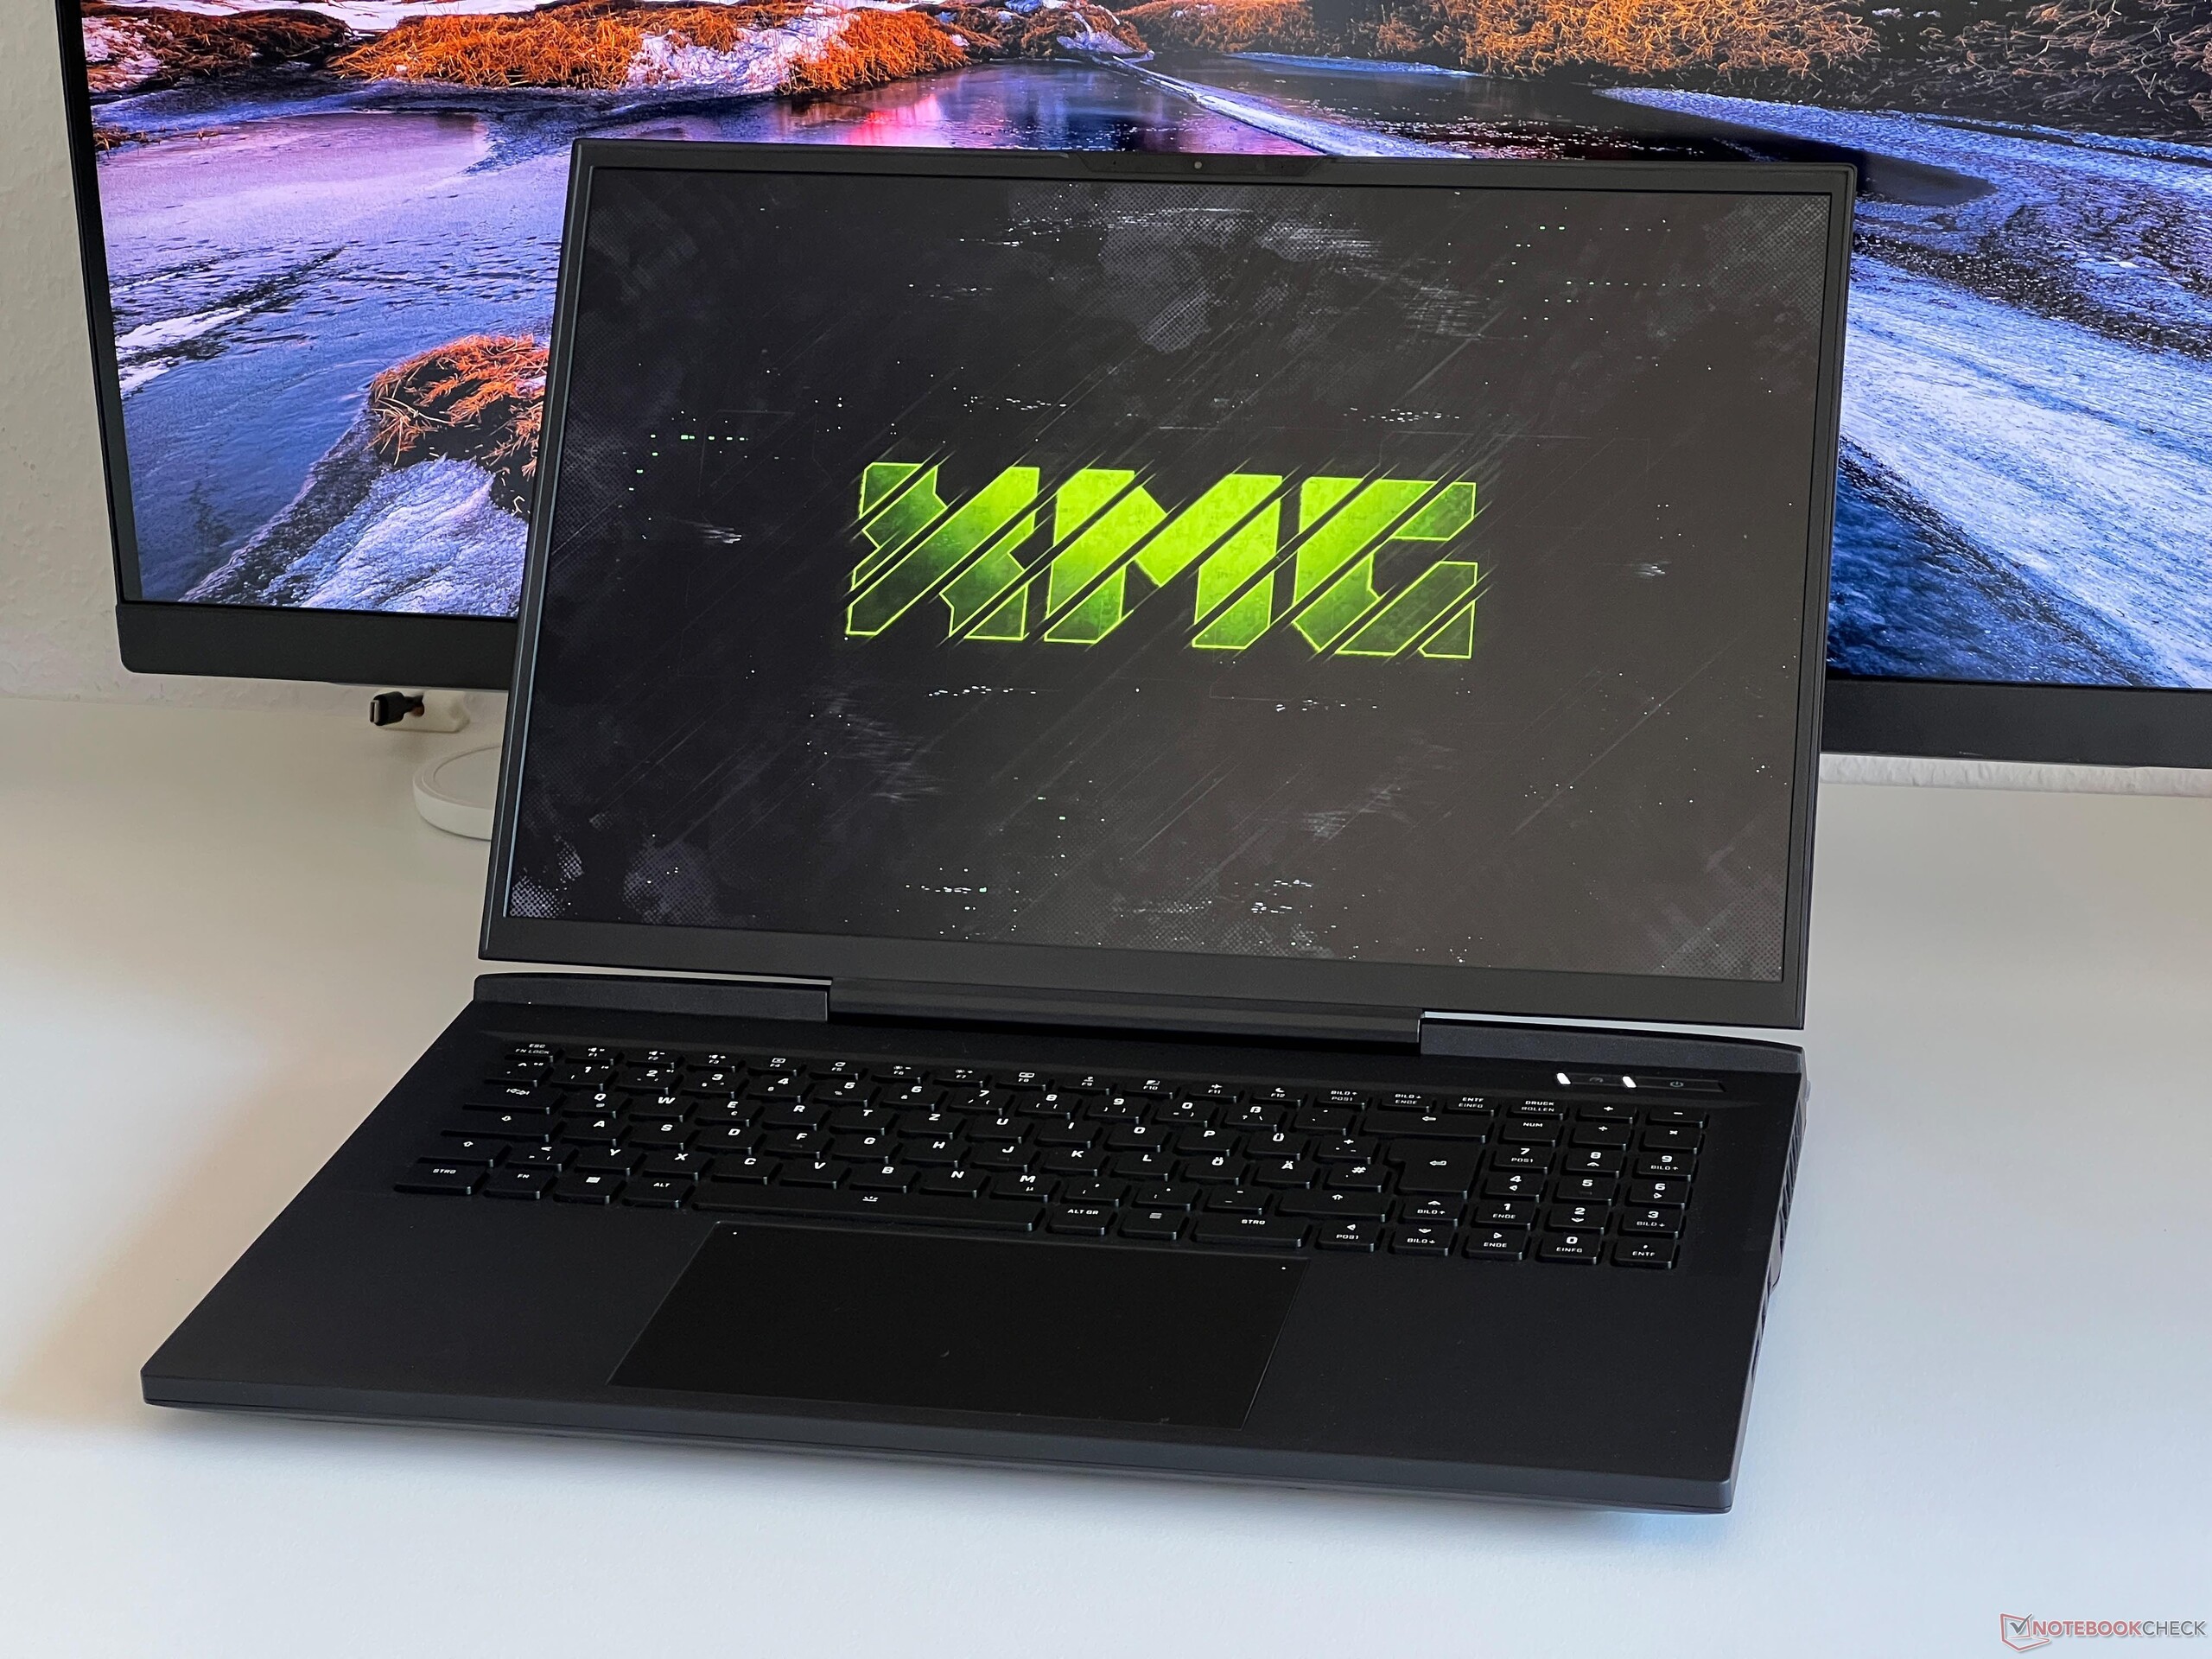
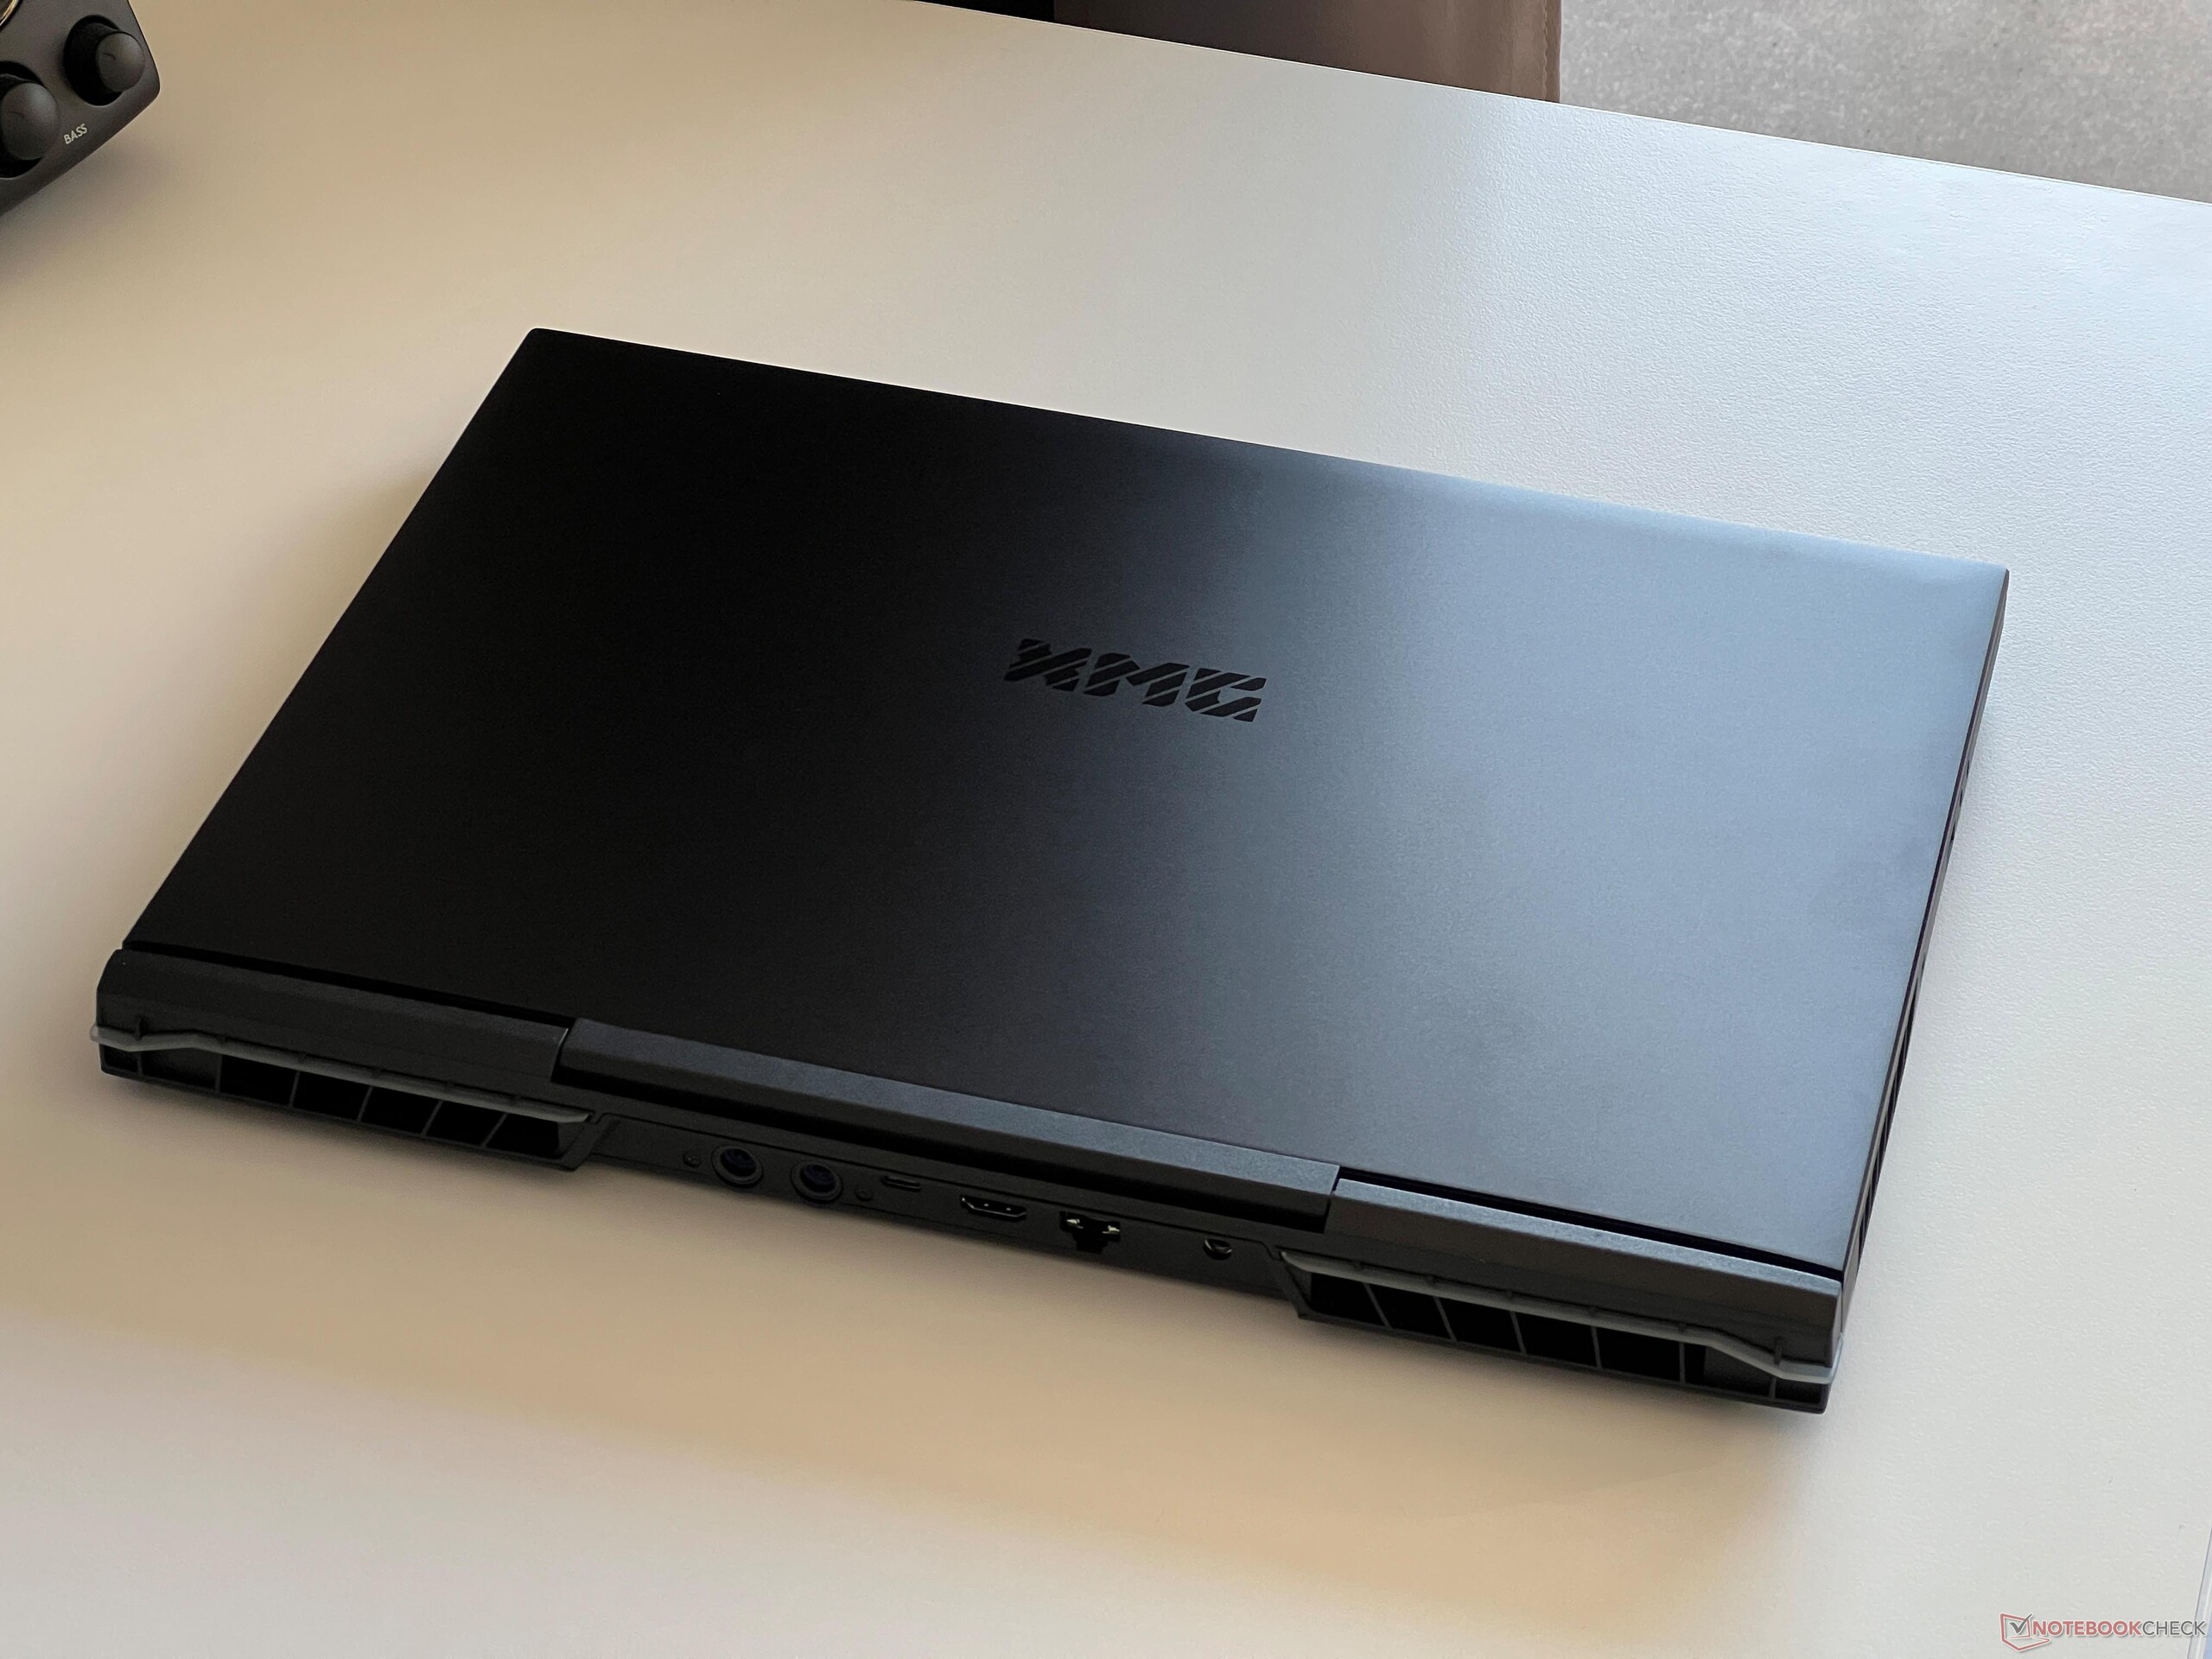
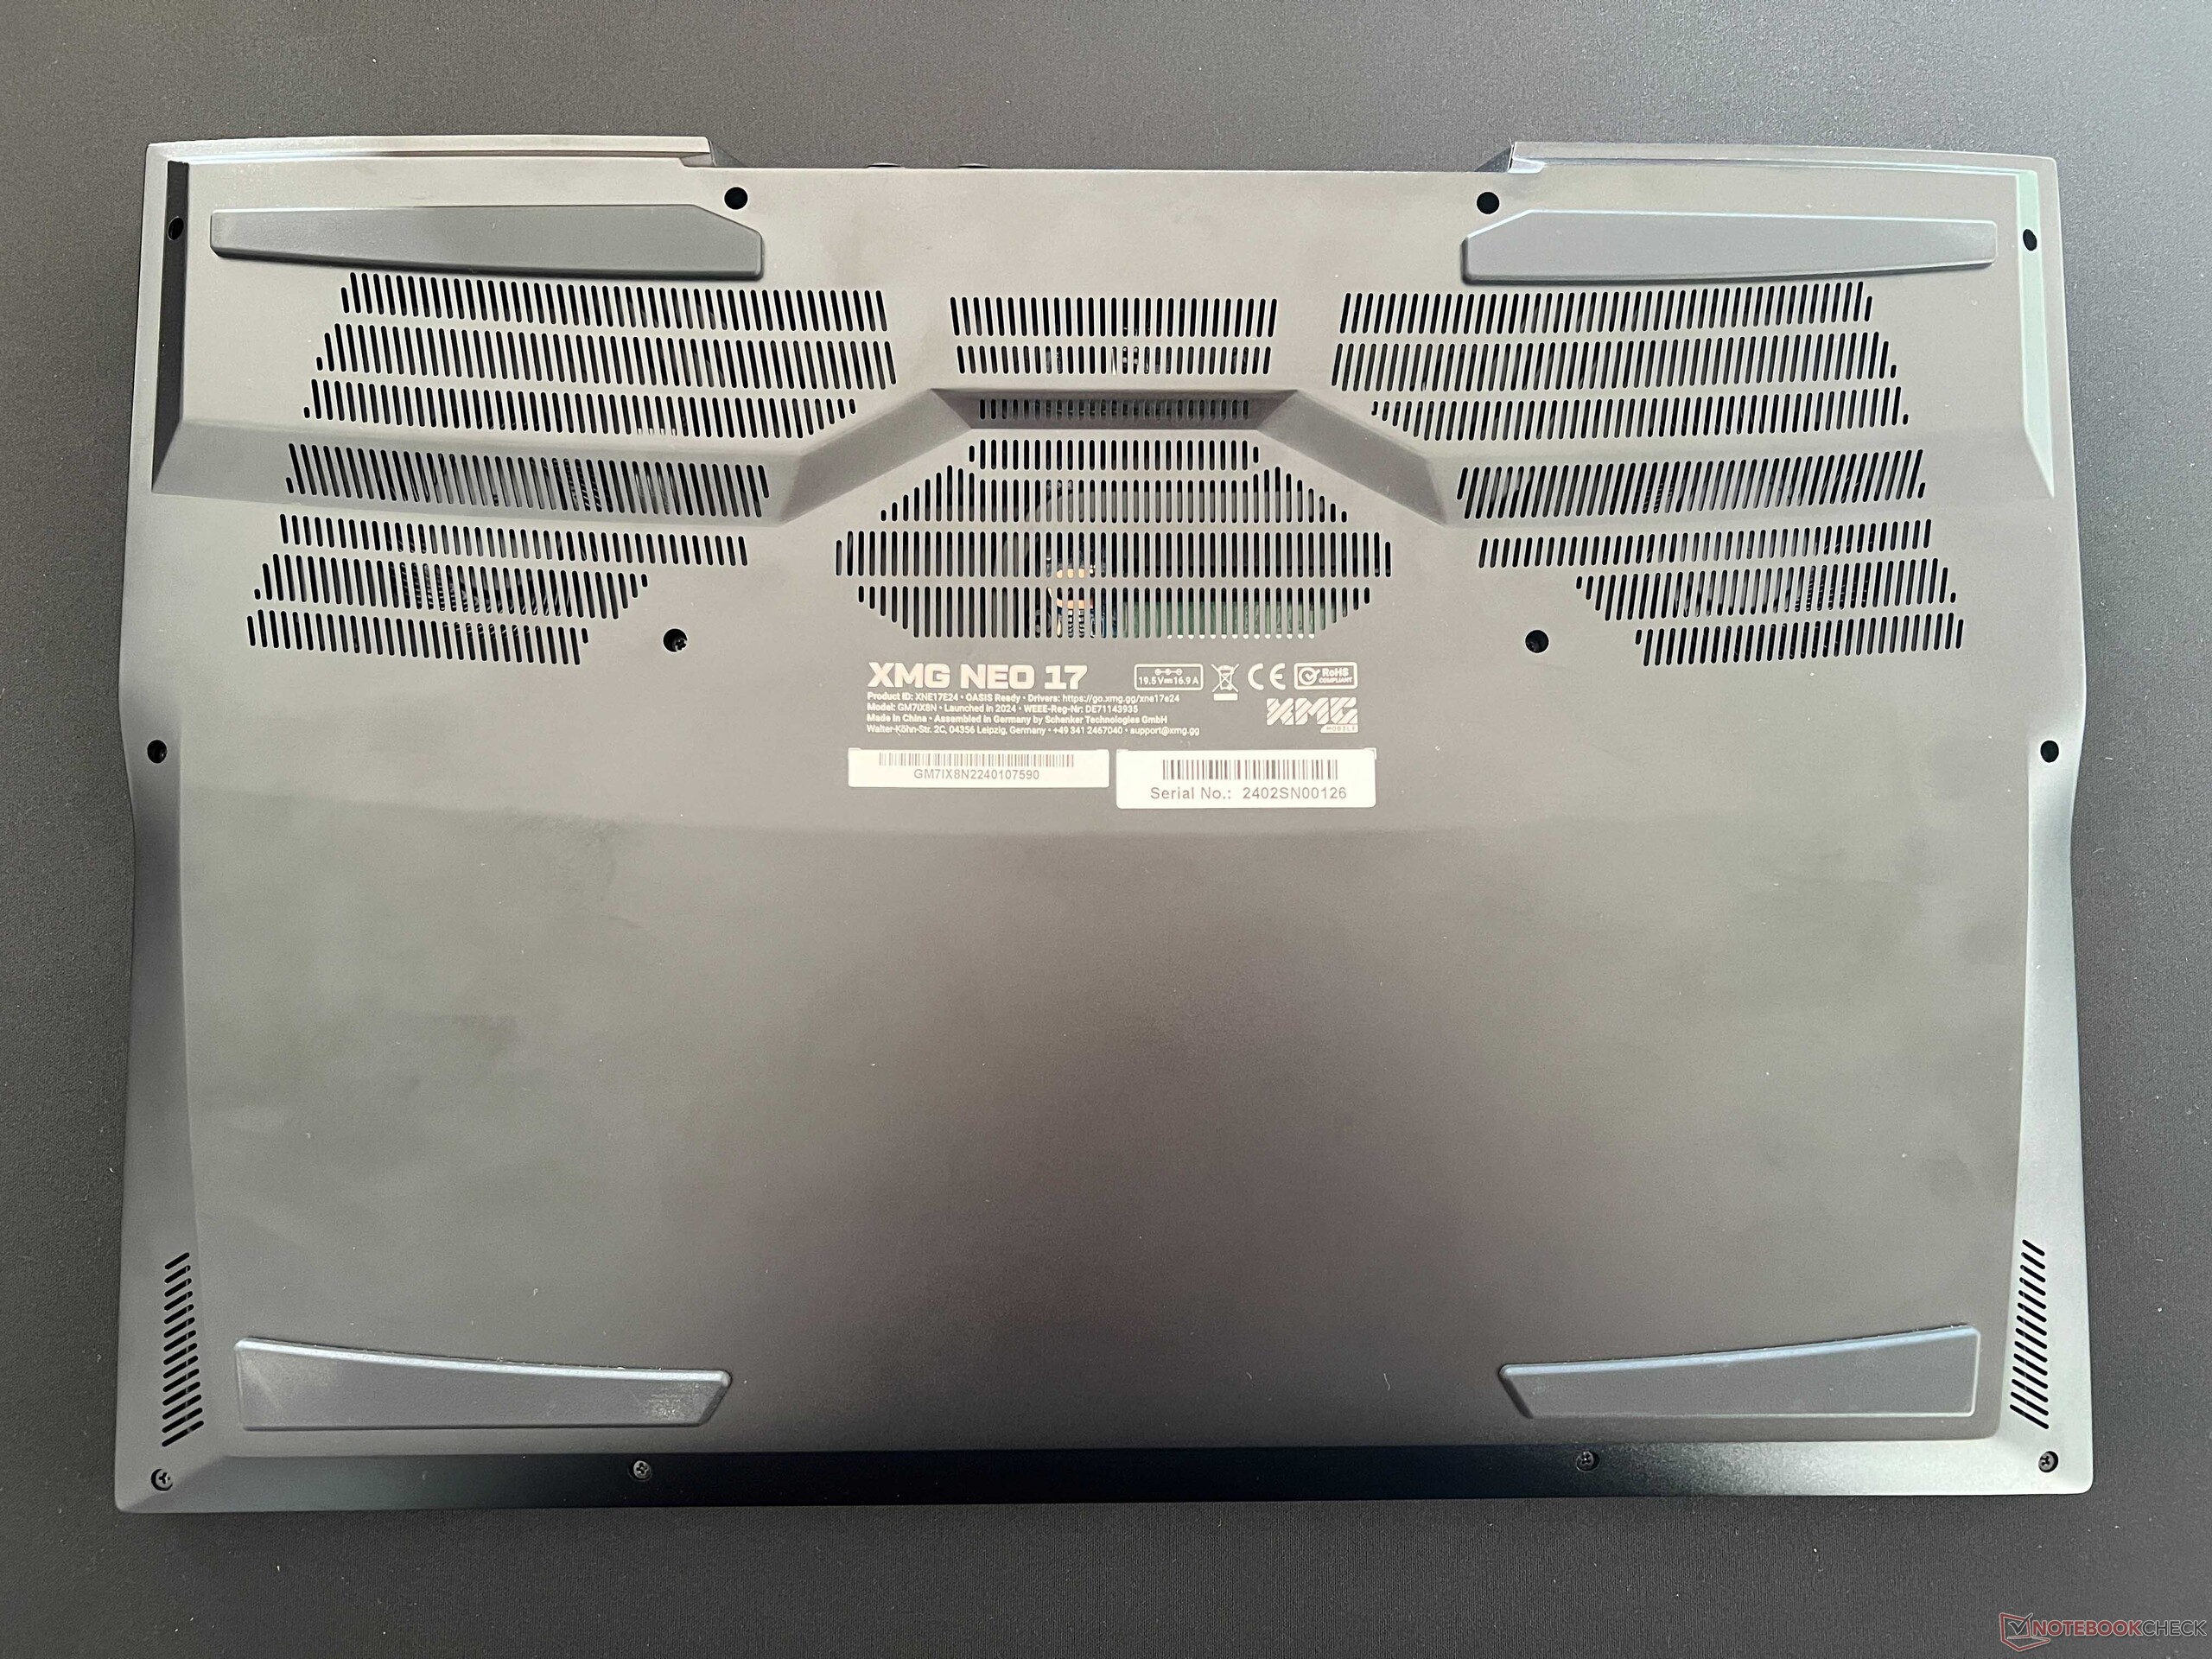
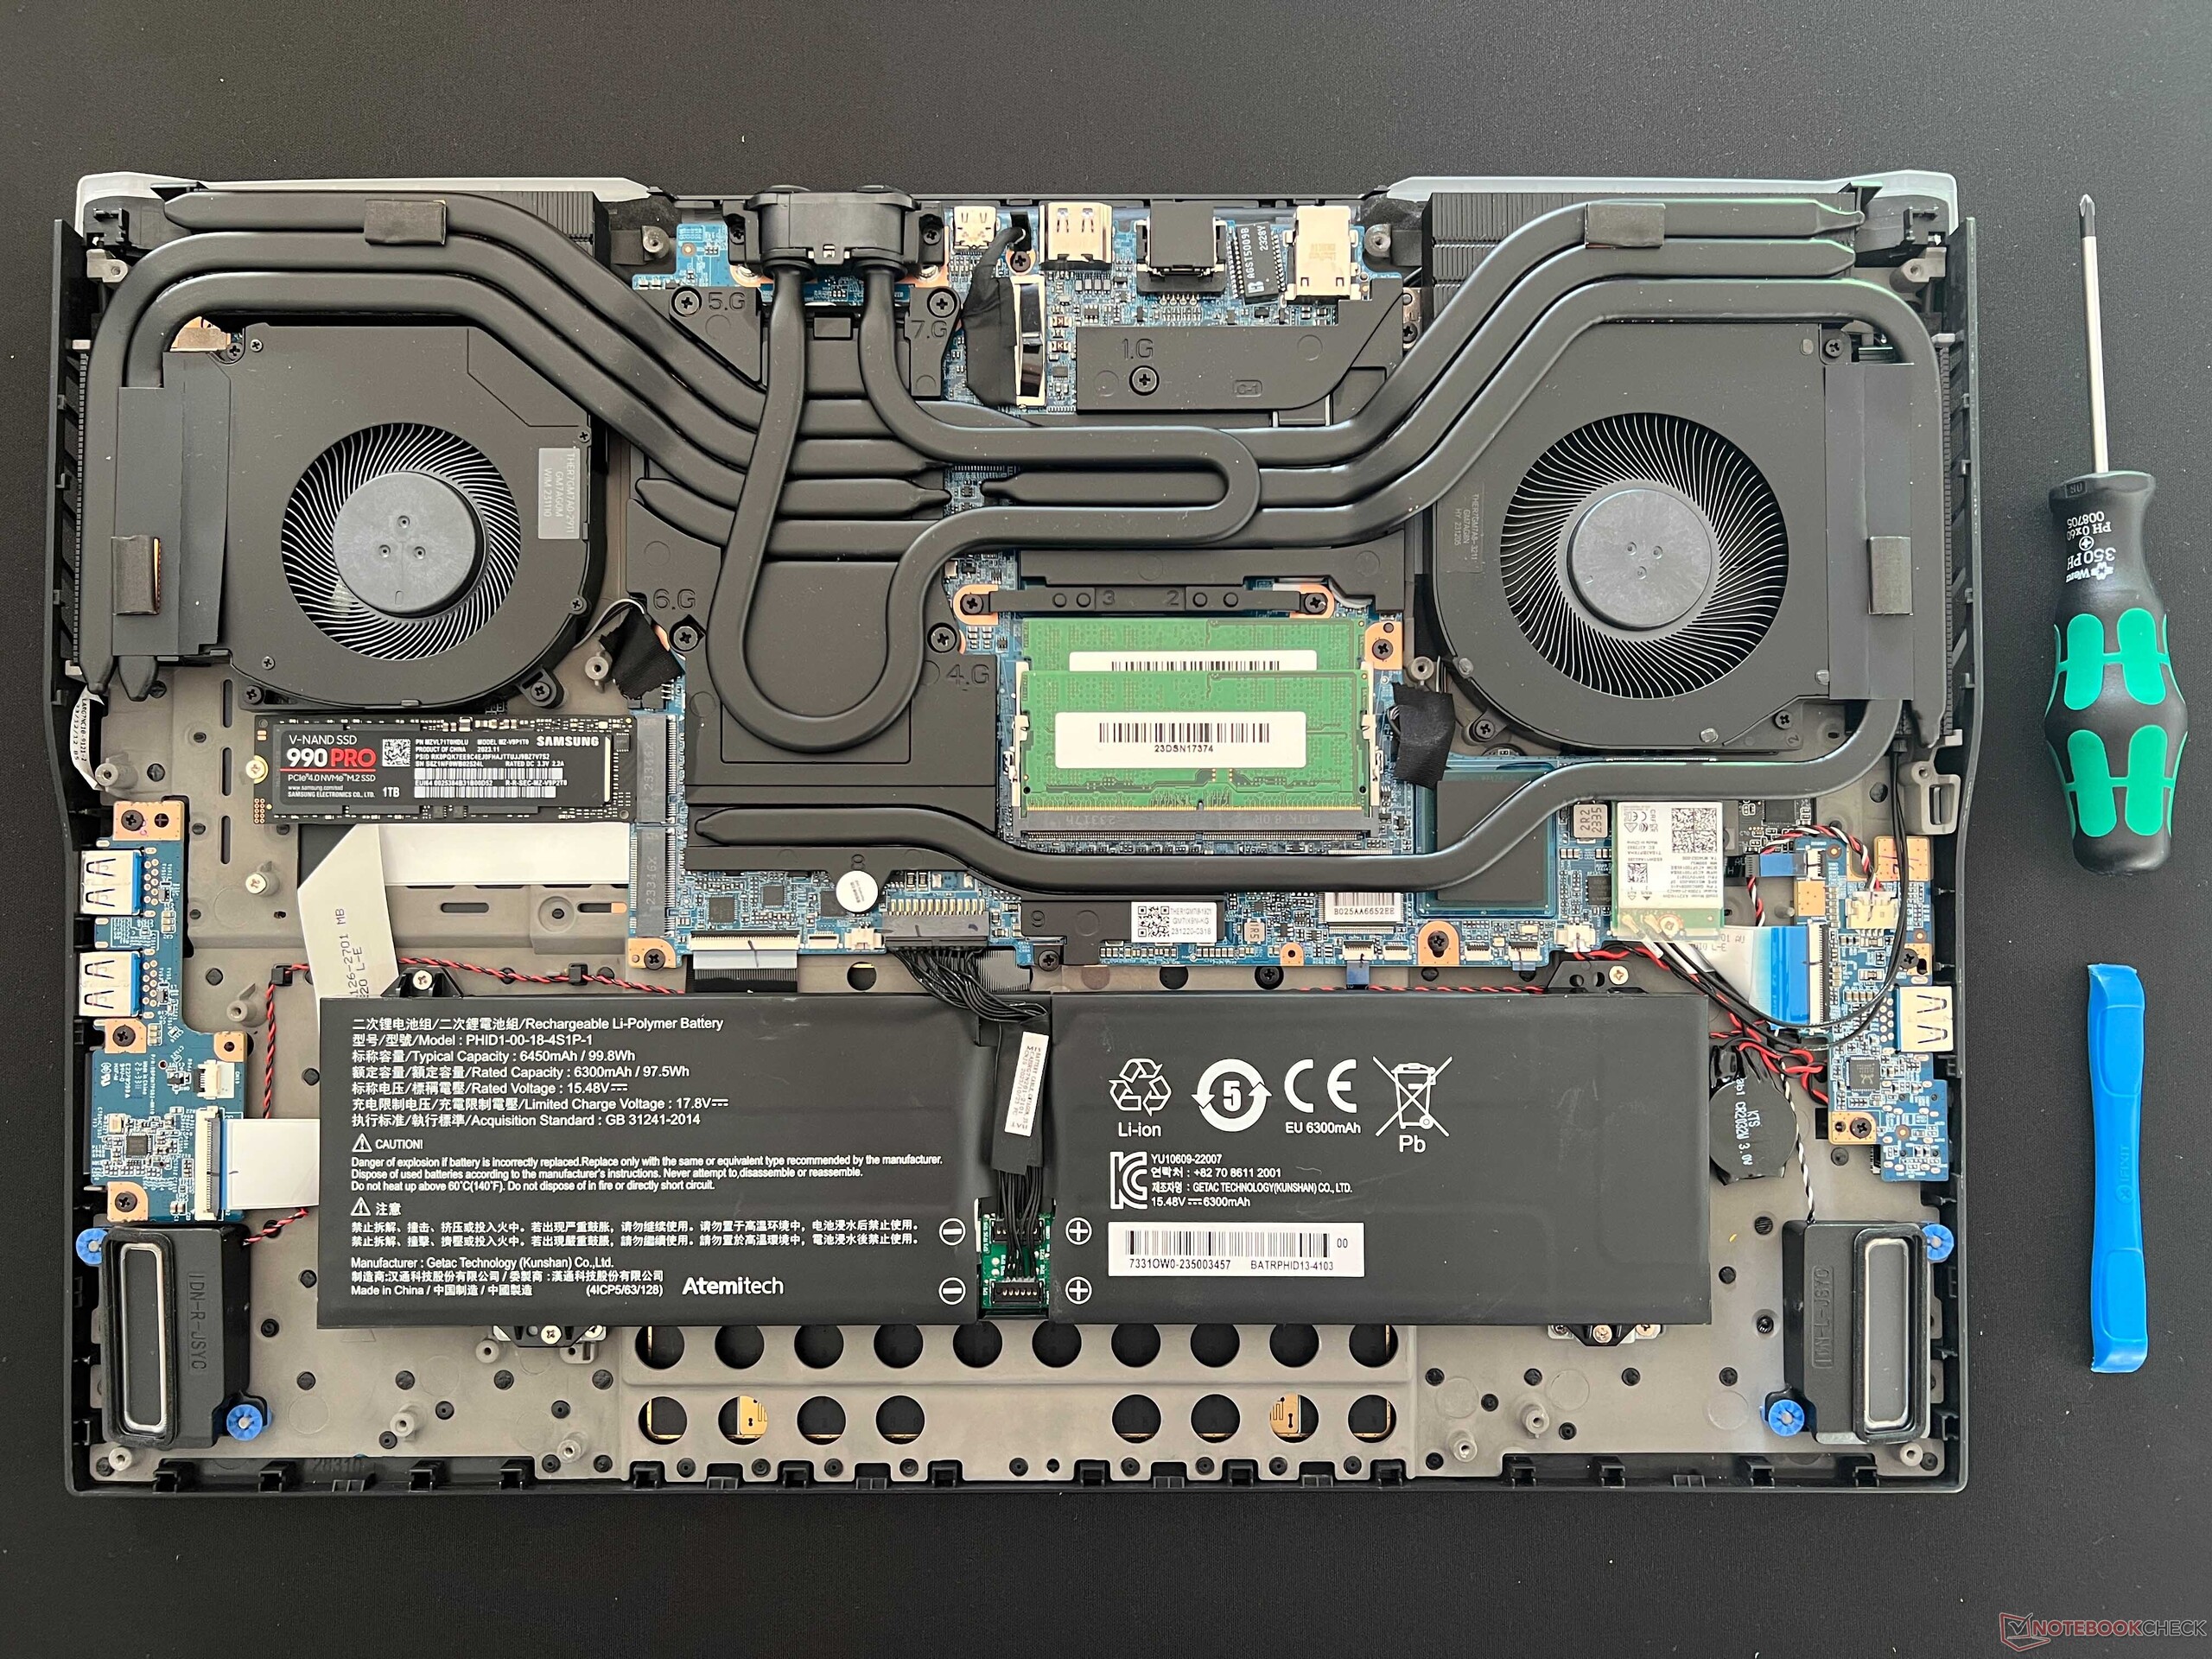
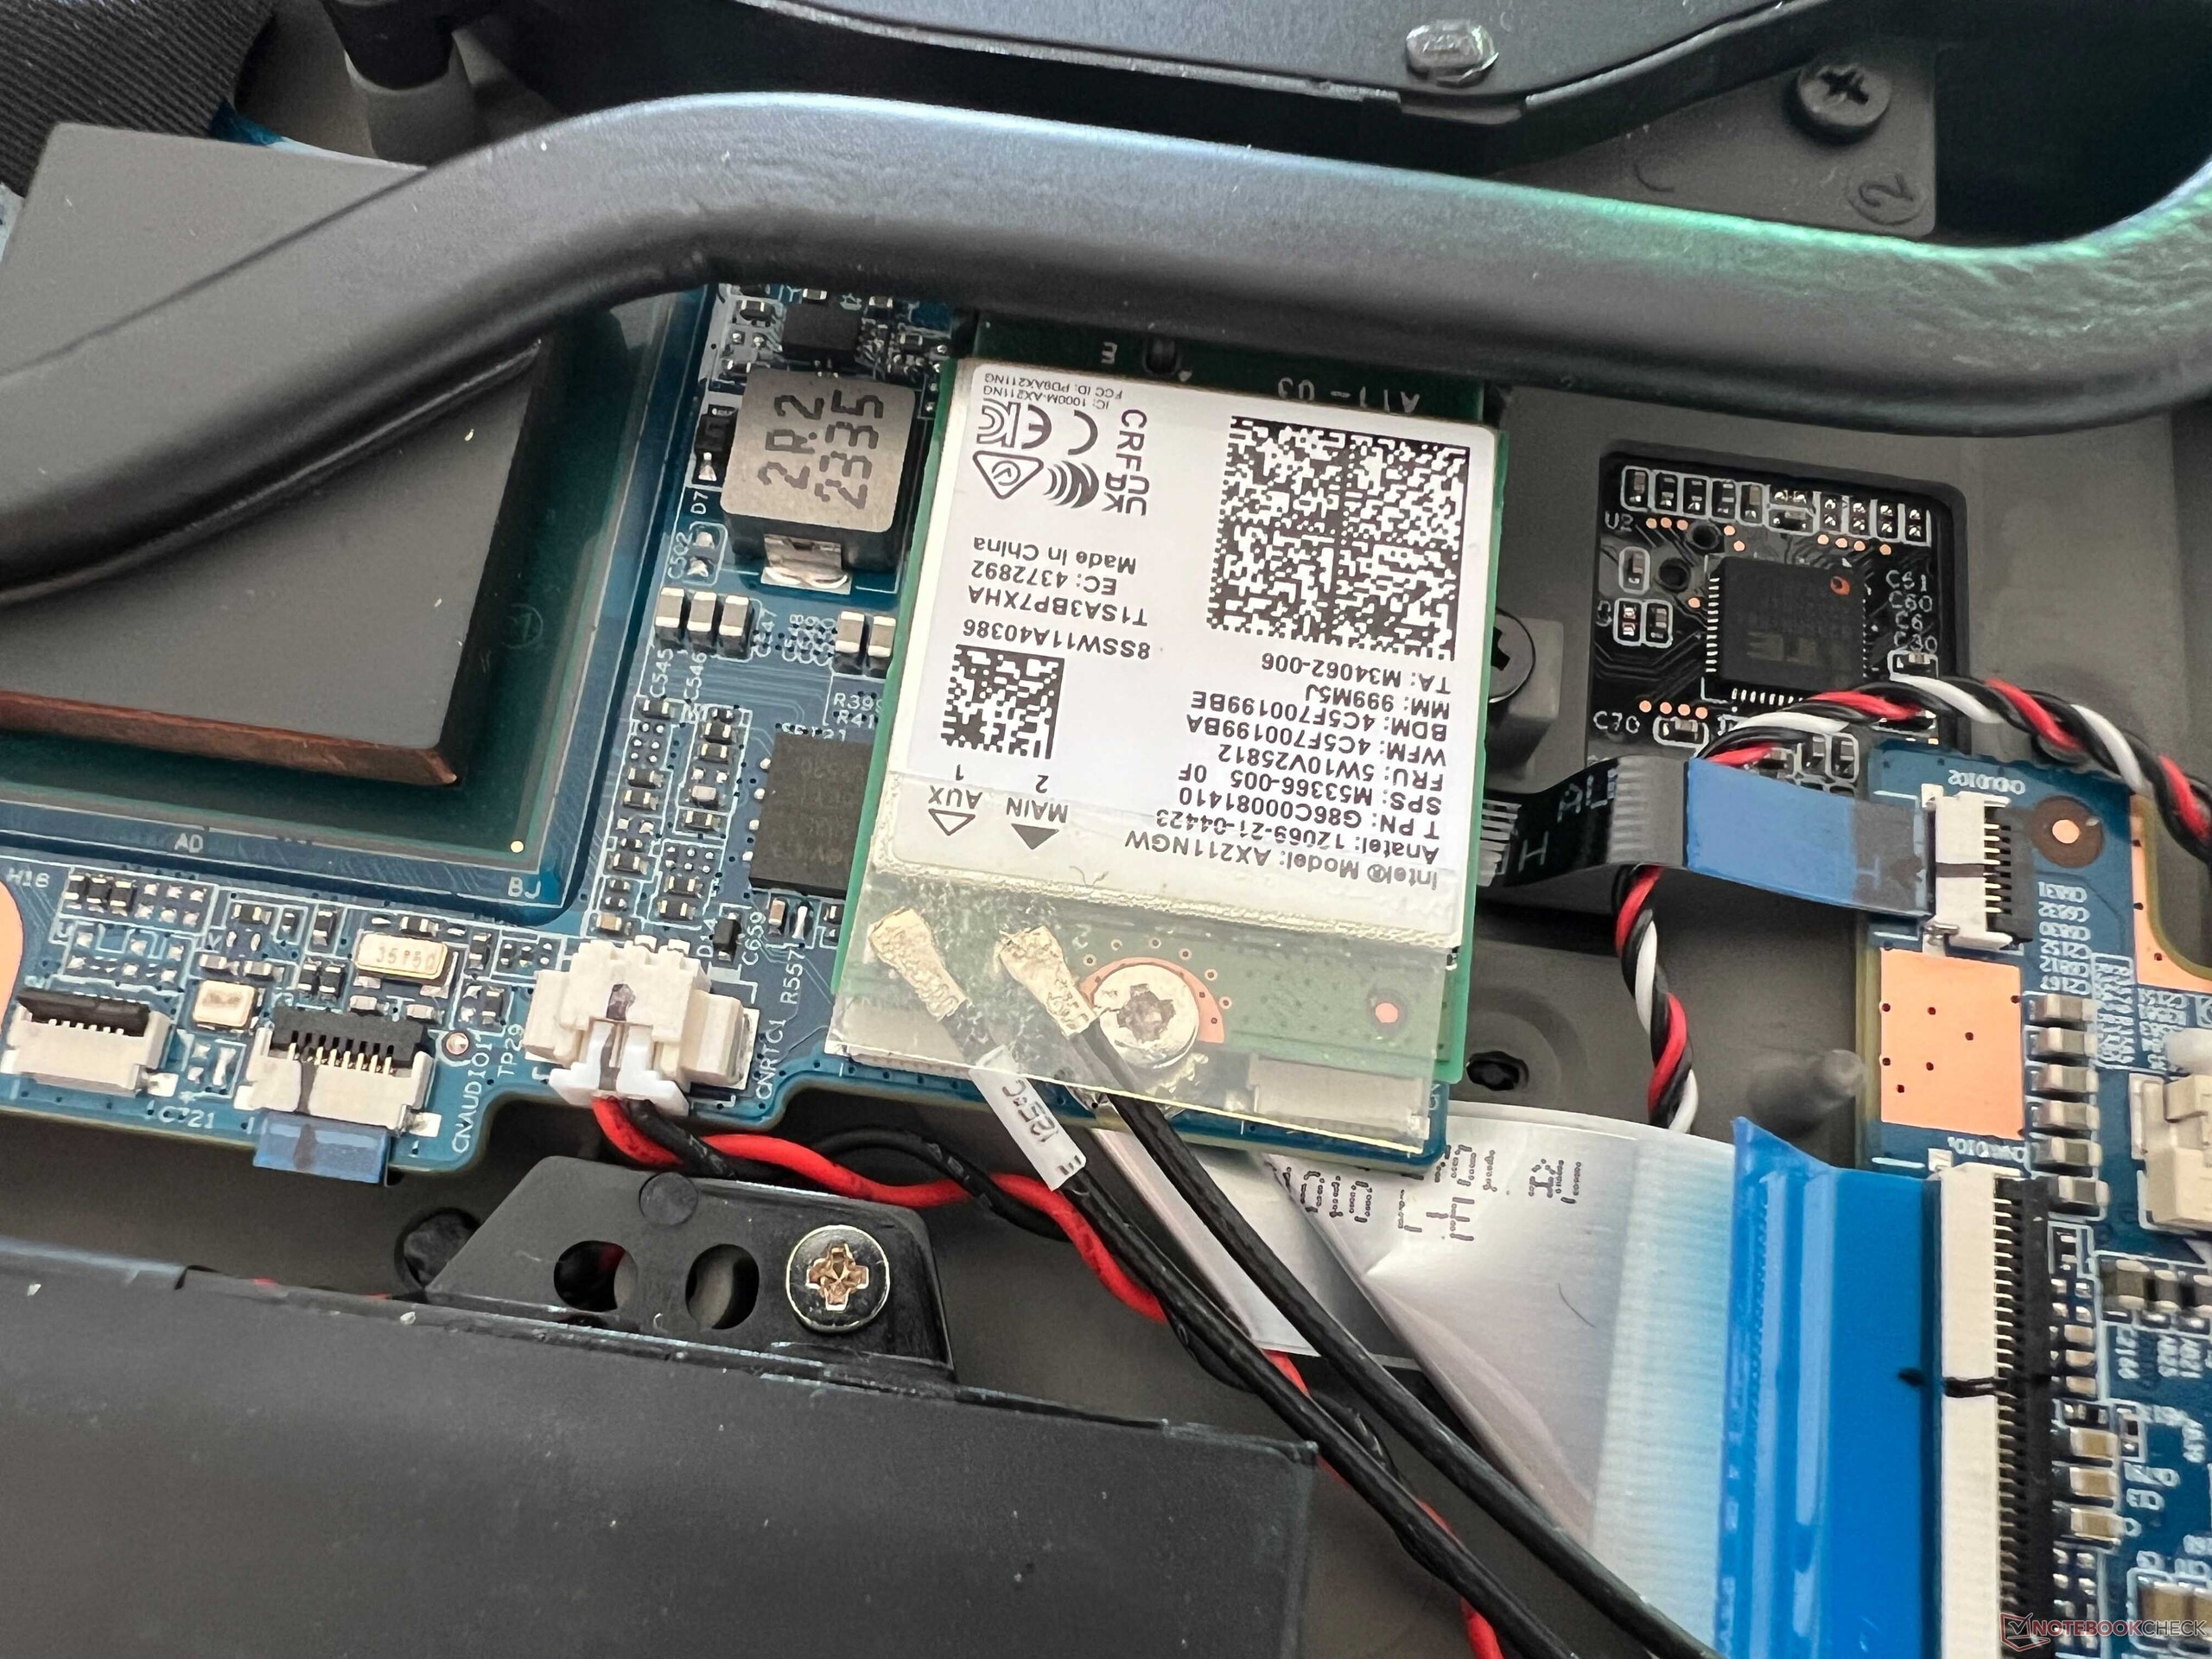
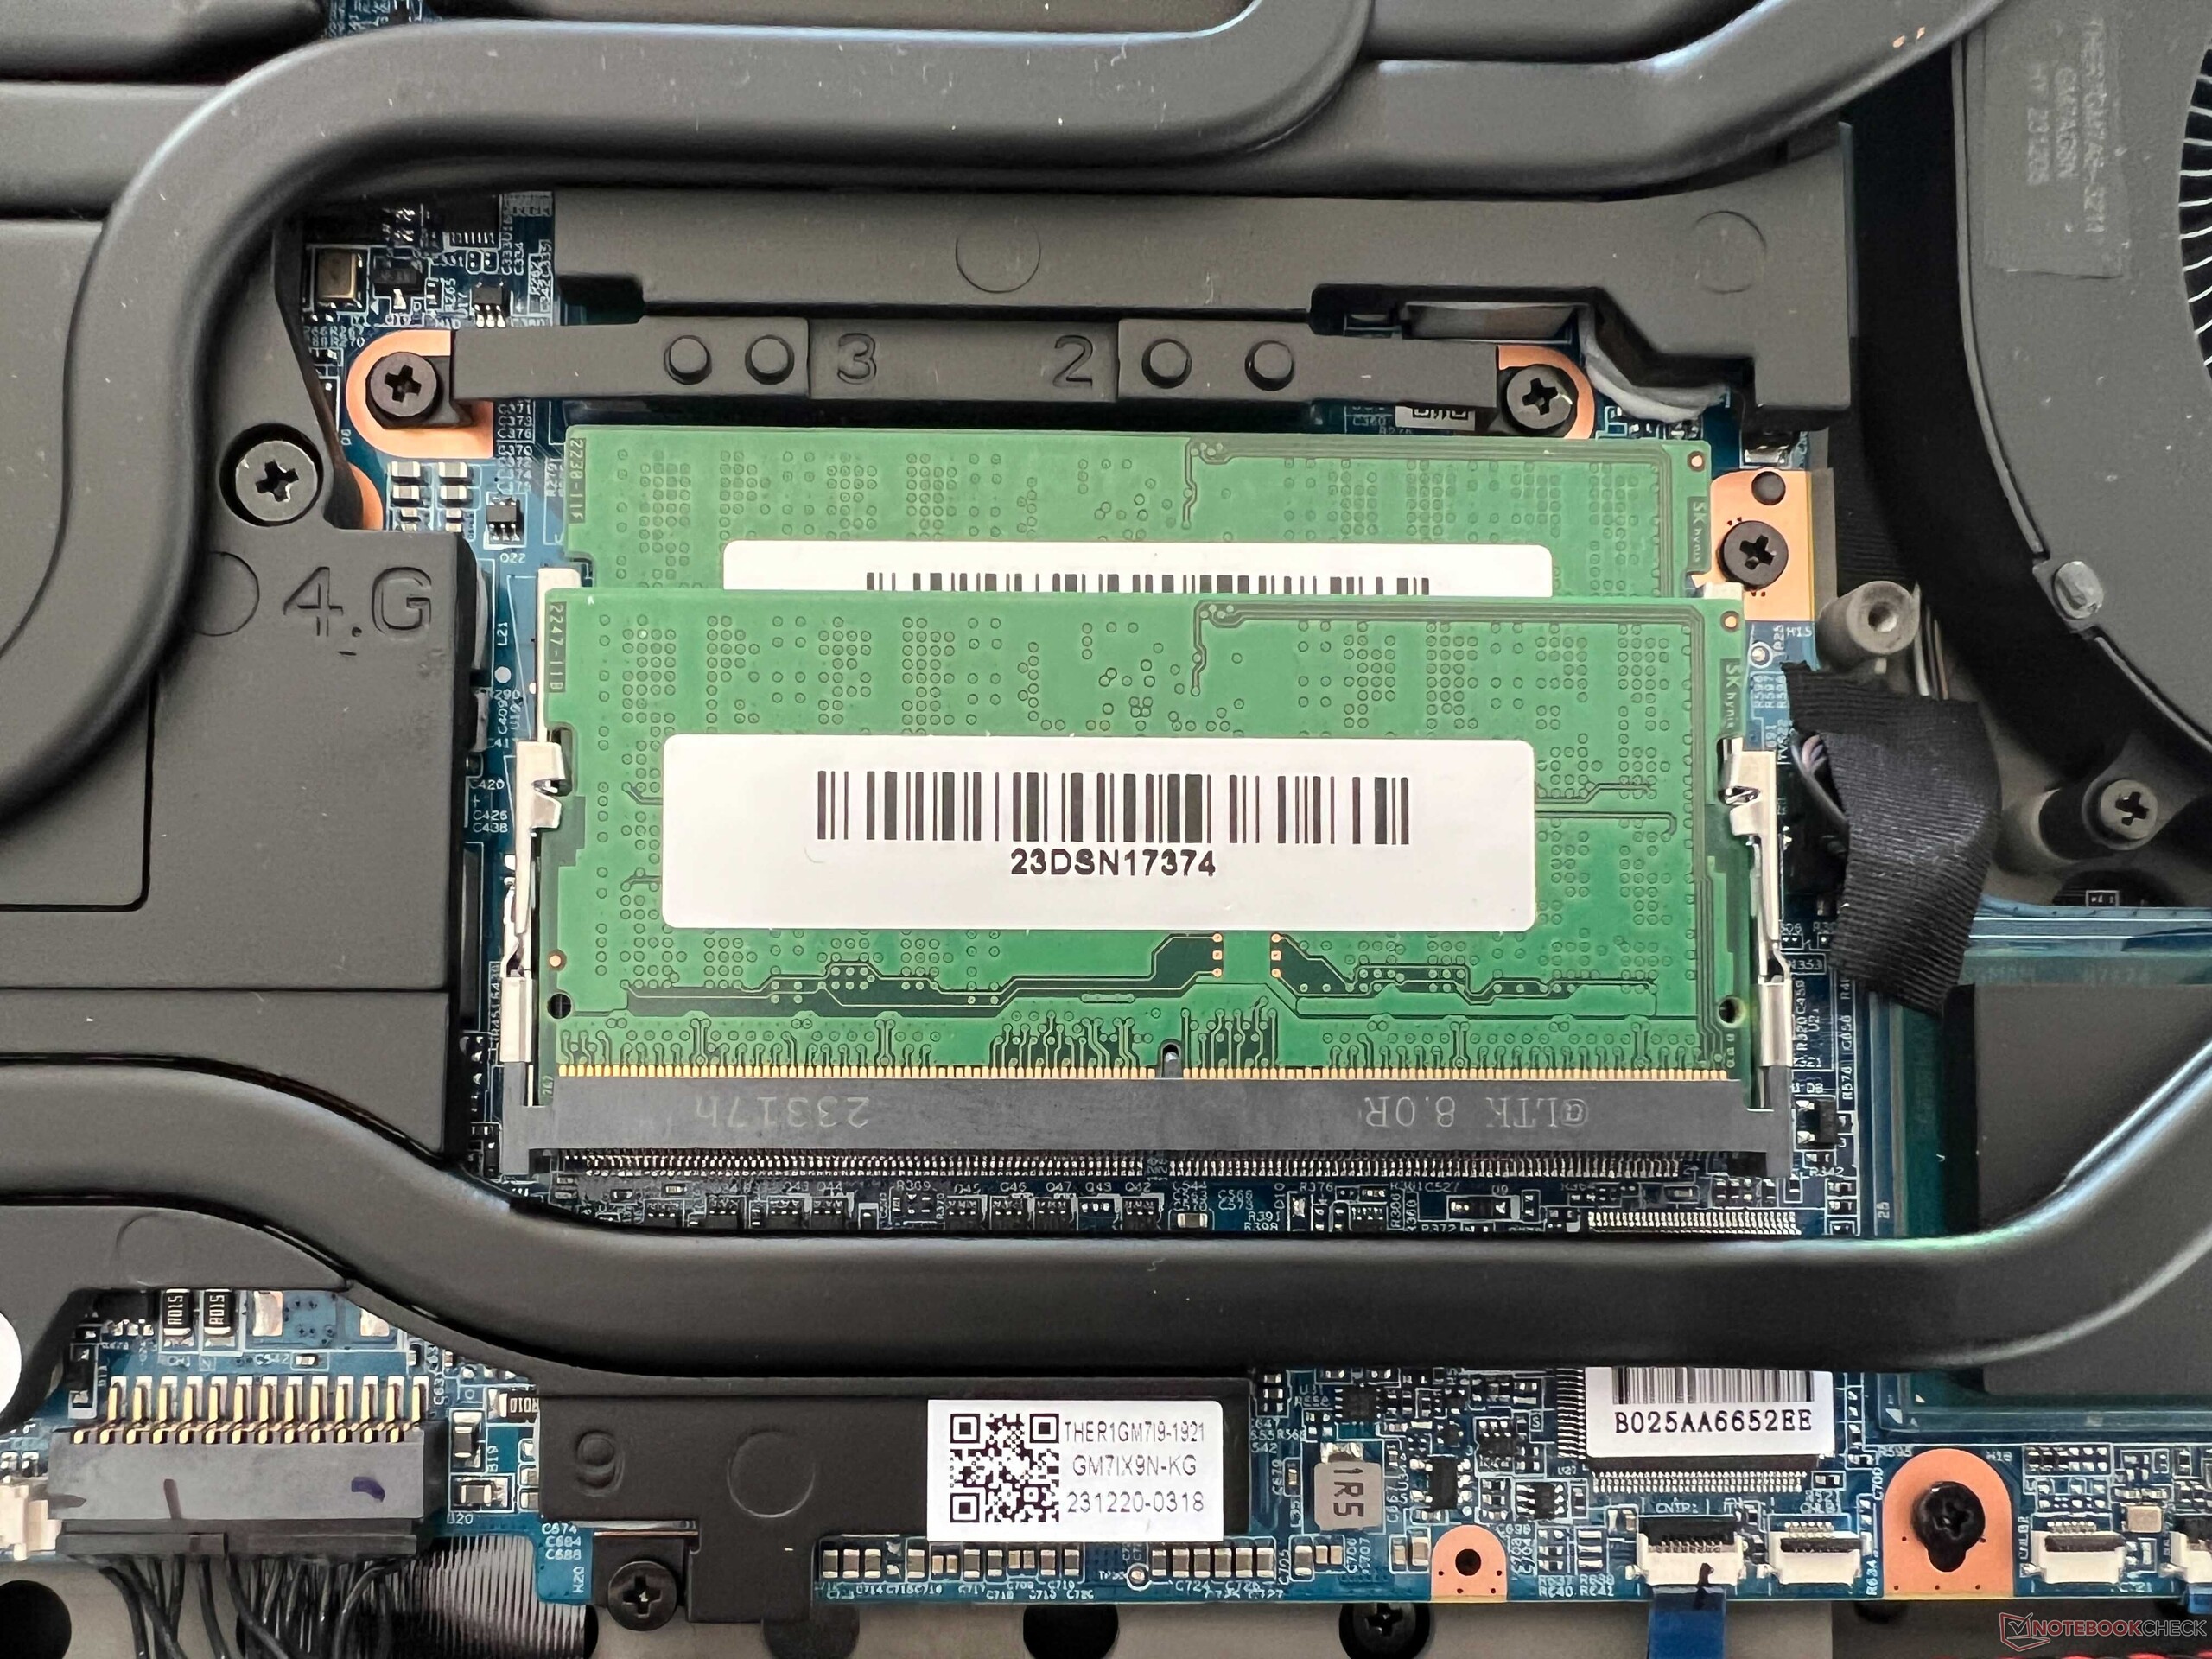
我们已经熟悉了 Medion Erazer Beast 的黑色金属底盘和橡胶底座。 Medion Erazer Beast的黑色金属机箱和橡胶底座已经非常熟悉了。机身后部有一个 LED 灯带,机盖上有一个 XMG 徽标,除此之外,没有任何恼人的制造商贴纸。Neo 17 的整体稳定性非常好,但重量略低于 2.9 千克,高度为 2.7 厘米,重量也不轻。机箱下盖可以比较容易地卸下(水冷连接处的两颗螺丝也必须拧松),你可以接触到所有重要组件,包括内存、2x M.2-2280 固态硬盘或 WLAN 模块。
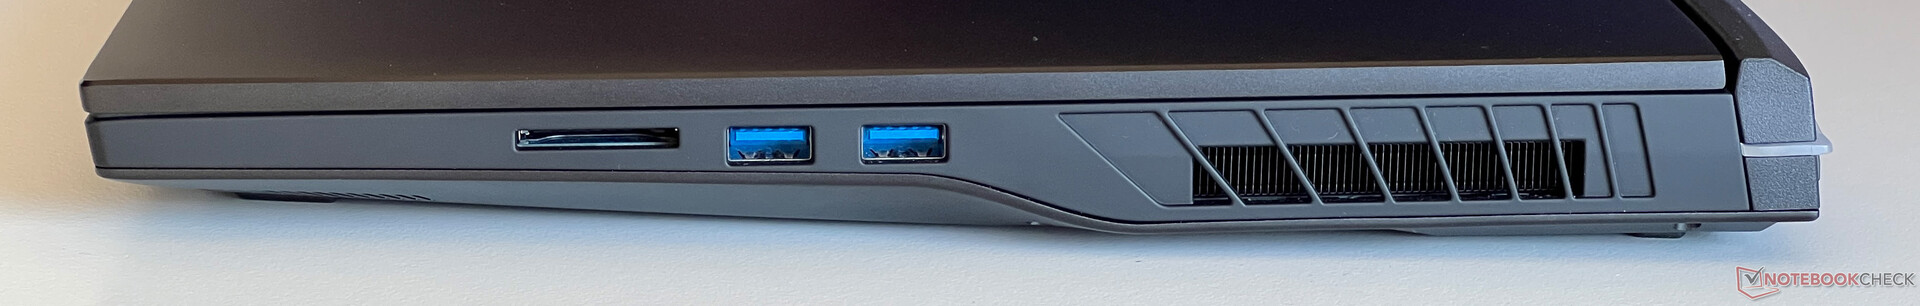
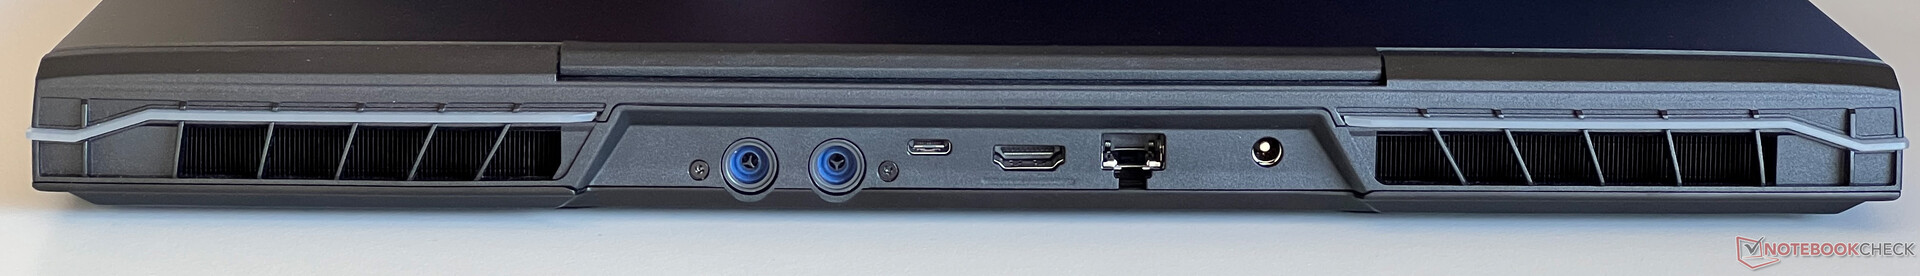
连接范围非常广泛,除了充足的 USB 端口外,还提供 Thunderbolt 4 和 HDMI 接口。读卡器与我们的参考卡(Angelbird AV Pro V60)配合可实现平均传输速率,1080p 网络摄像头可拍摄足够清晰的照片。英特尔的 Wi-Fi 6E 模块(AX211)与我们的参考路由器配合使用时,传输速率非常高,但还不支持最新的 Wi-Fi 7 标准。

| SD Card Reader | |
| average JPG Copy Test (av. of 3 runs) | |
| Average of class Gaming (19 - 197.3, n=68, last 2 years) | |
| SCHENKER XMG Neo 17 E24 (Angelbird AV Pro V60) | |
| Medion Erazer Beast X40 2024 (AV PRO microSD 128 GB V60) | |
| MSI GE78HX 13VH-070US (Angelibird AV Pro V60) | |
| maximum AS SSD Seq Read Test (1GB) | |
| Average of class Gaming (25.8 - 263, n=67, last 2 years) | |
| Medion Erazer Beast X40 2024 (AV PRO microSD 128 GB V60) | |
| MSI GE78HX 13VH-070US (Angelibird AV Pro V60) | |
| SCHENKER XMG Neo 17 E24 (Angelbird AV Pro V60) | |
| Networking | |
| SCHENKER XMG Neo 17 E24 | |
| iperf3 transmit AXE11000 | |
| iperf3 receive AXE11000 | |
| Medion Erazer Beast X40 2024 | |
| iperf3 transmit AXE11000 | |
| iperf3 receive AXE11000 | |
| HP Omen 17-db0079ng | |
| iperf3 transmit AXE11000 | |
| iperf3 receive AXE11000 | |
| Eurocom Raptor X17 Core i9-14900HX | |
| iperf3 transmit AXE11000 | |
| iperf3 receive AXE11000 | |
| iperf3 transmit AXE11000 6GHz | |
| iperf3 receive AXE11000 6GHz | |
| MSI GE78HX 13VH-070US | |
| iperf3 transmit AXE11000 | |
| iperf3 receive AXE11000 | |
| iperf3 transmit AXE11000 6GHz | |
| iperf3 receive AXE11000 6GHz | |


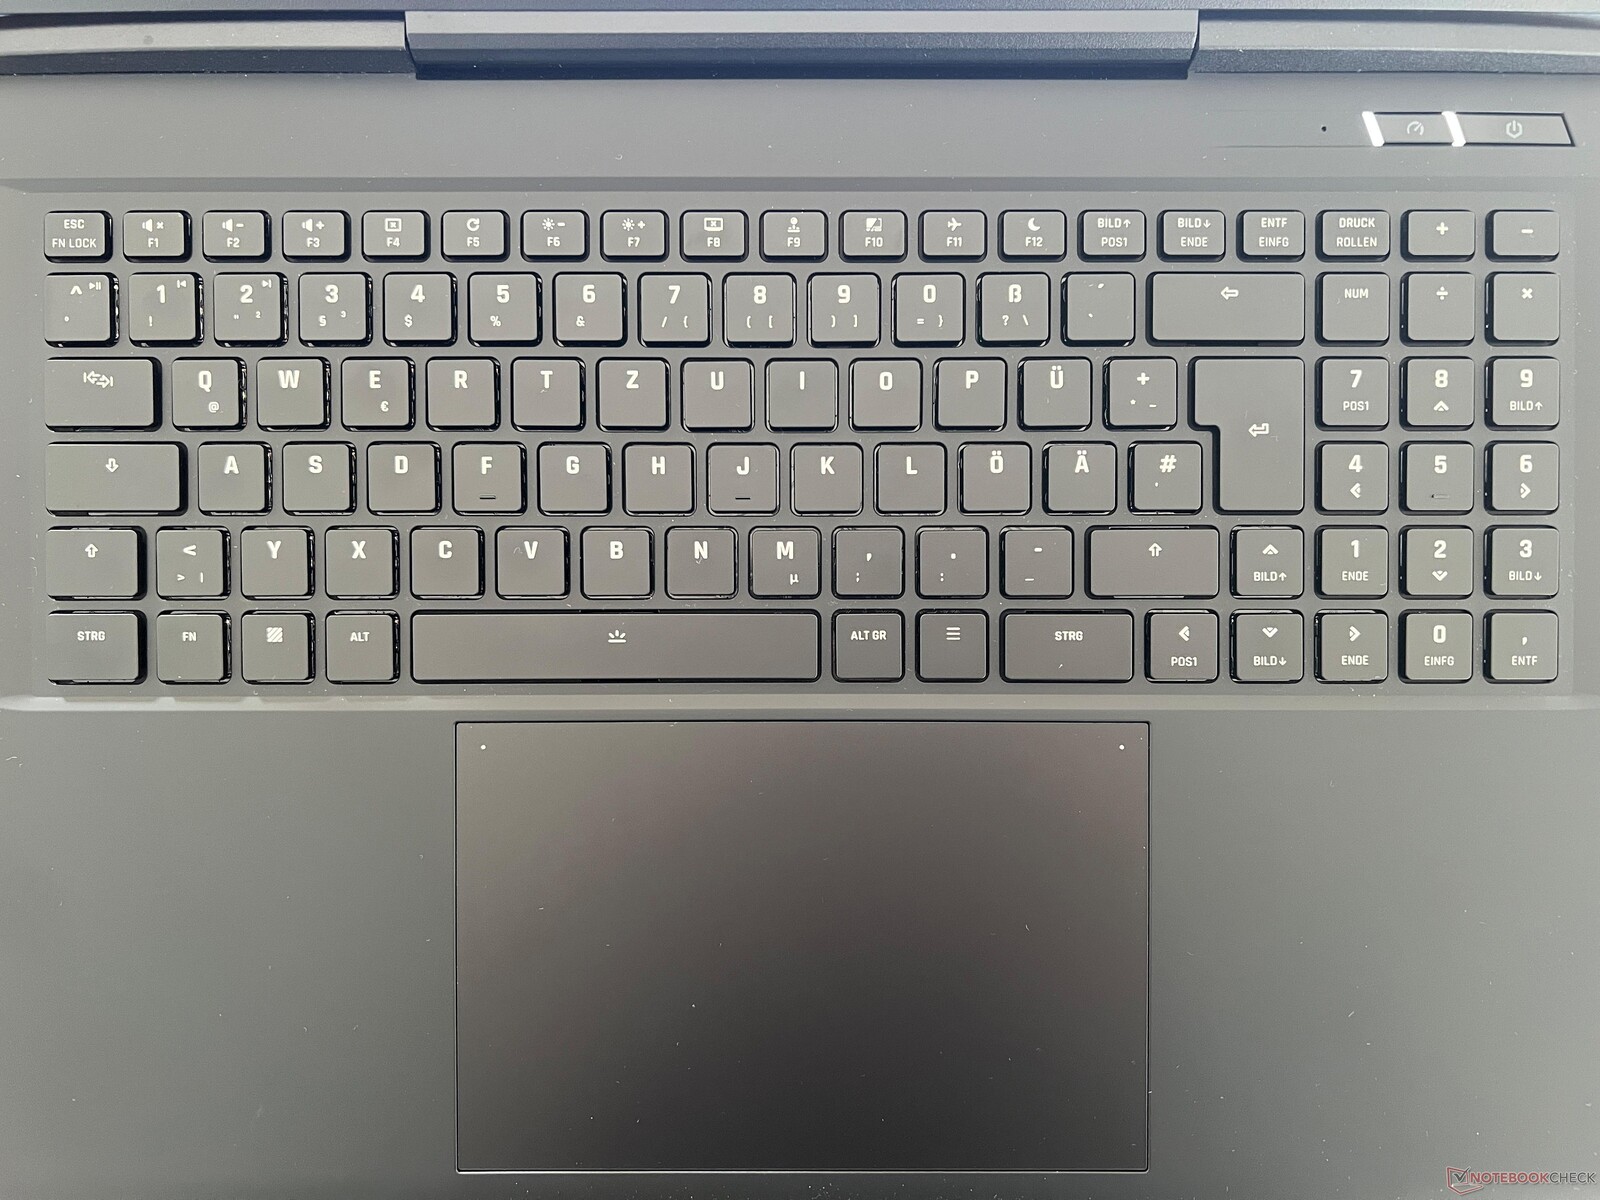
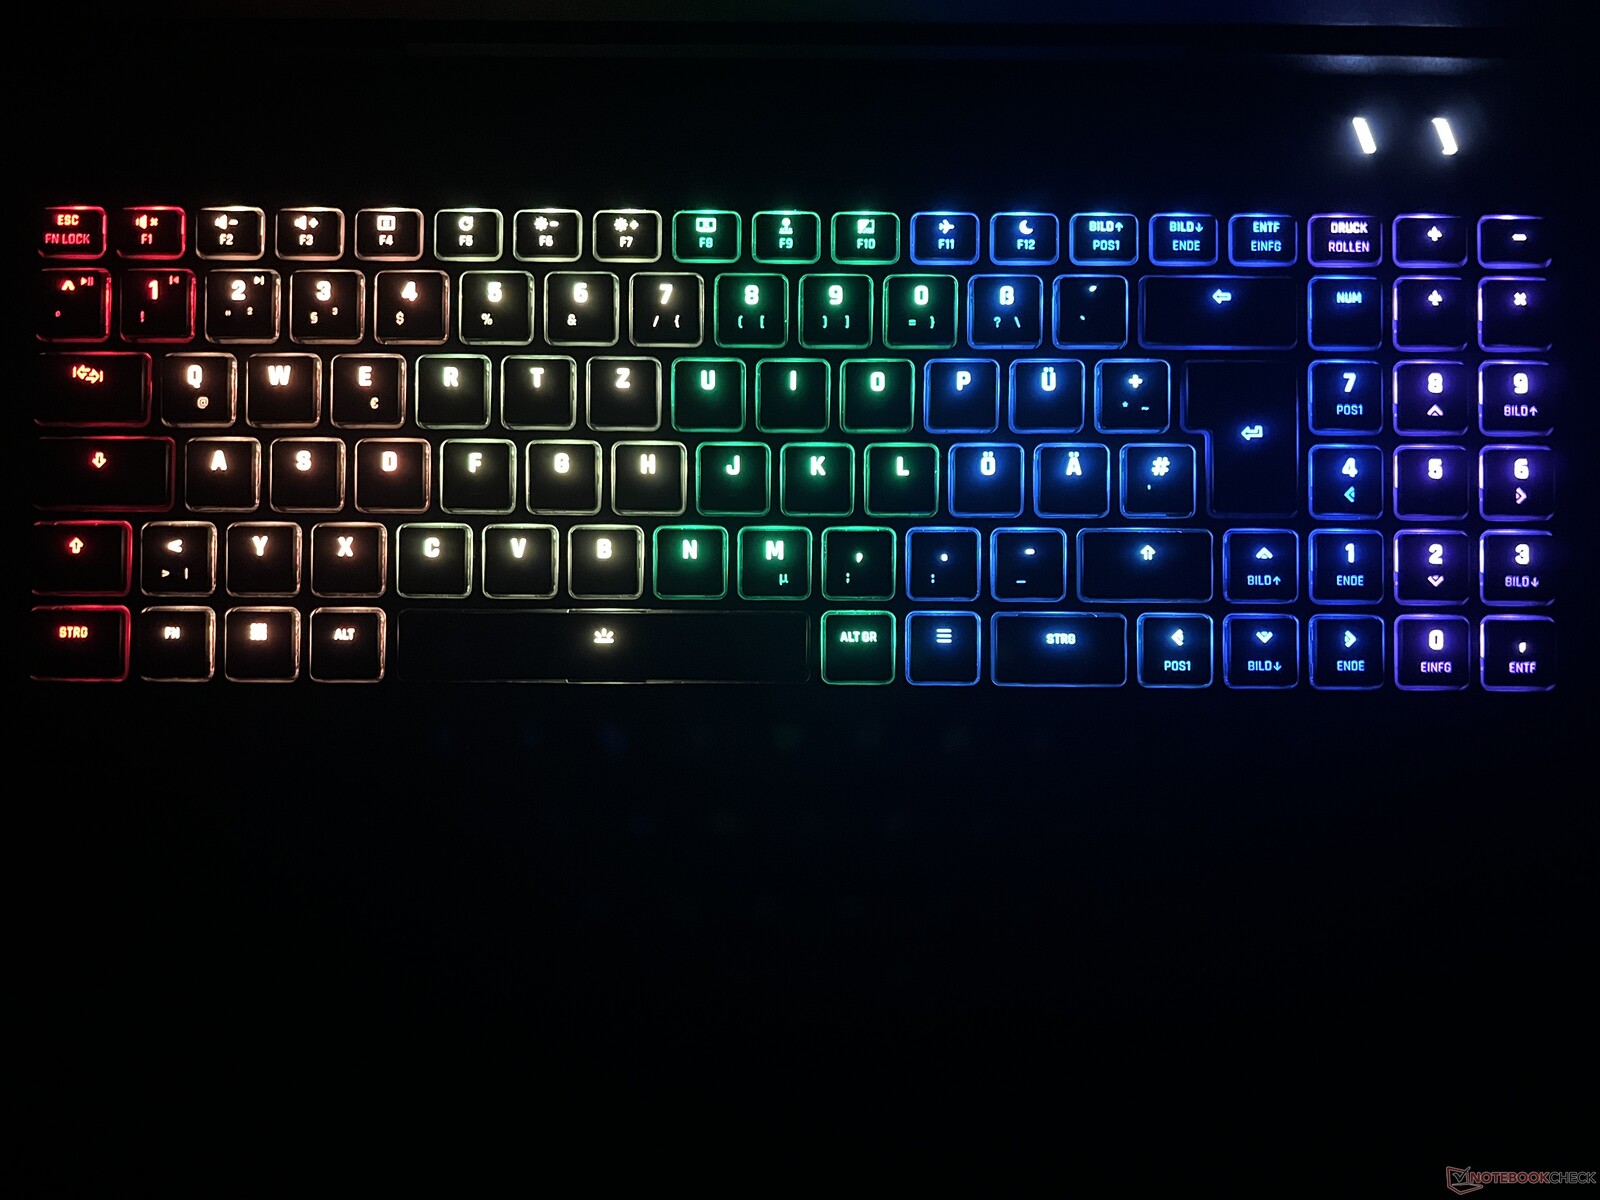
输入设备 - Cherry 机械键盘
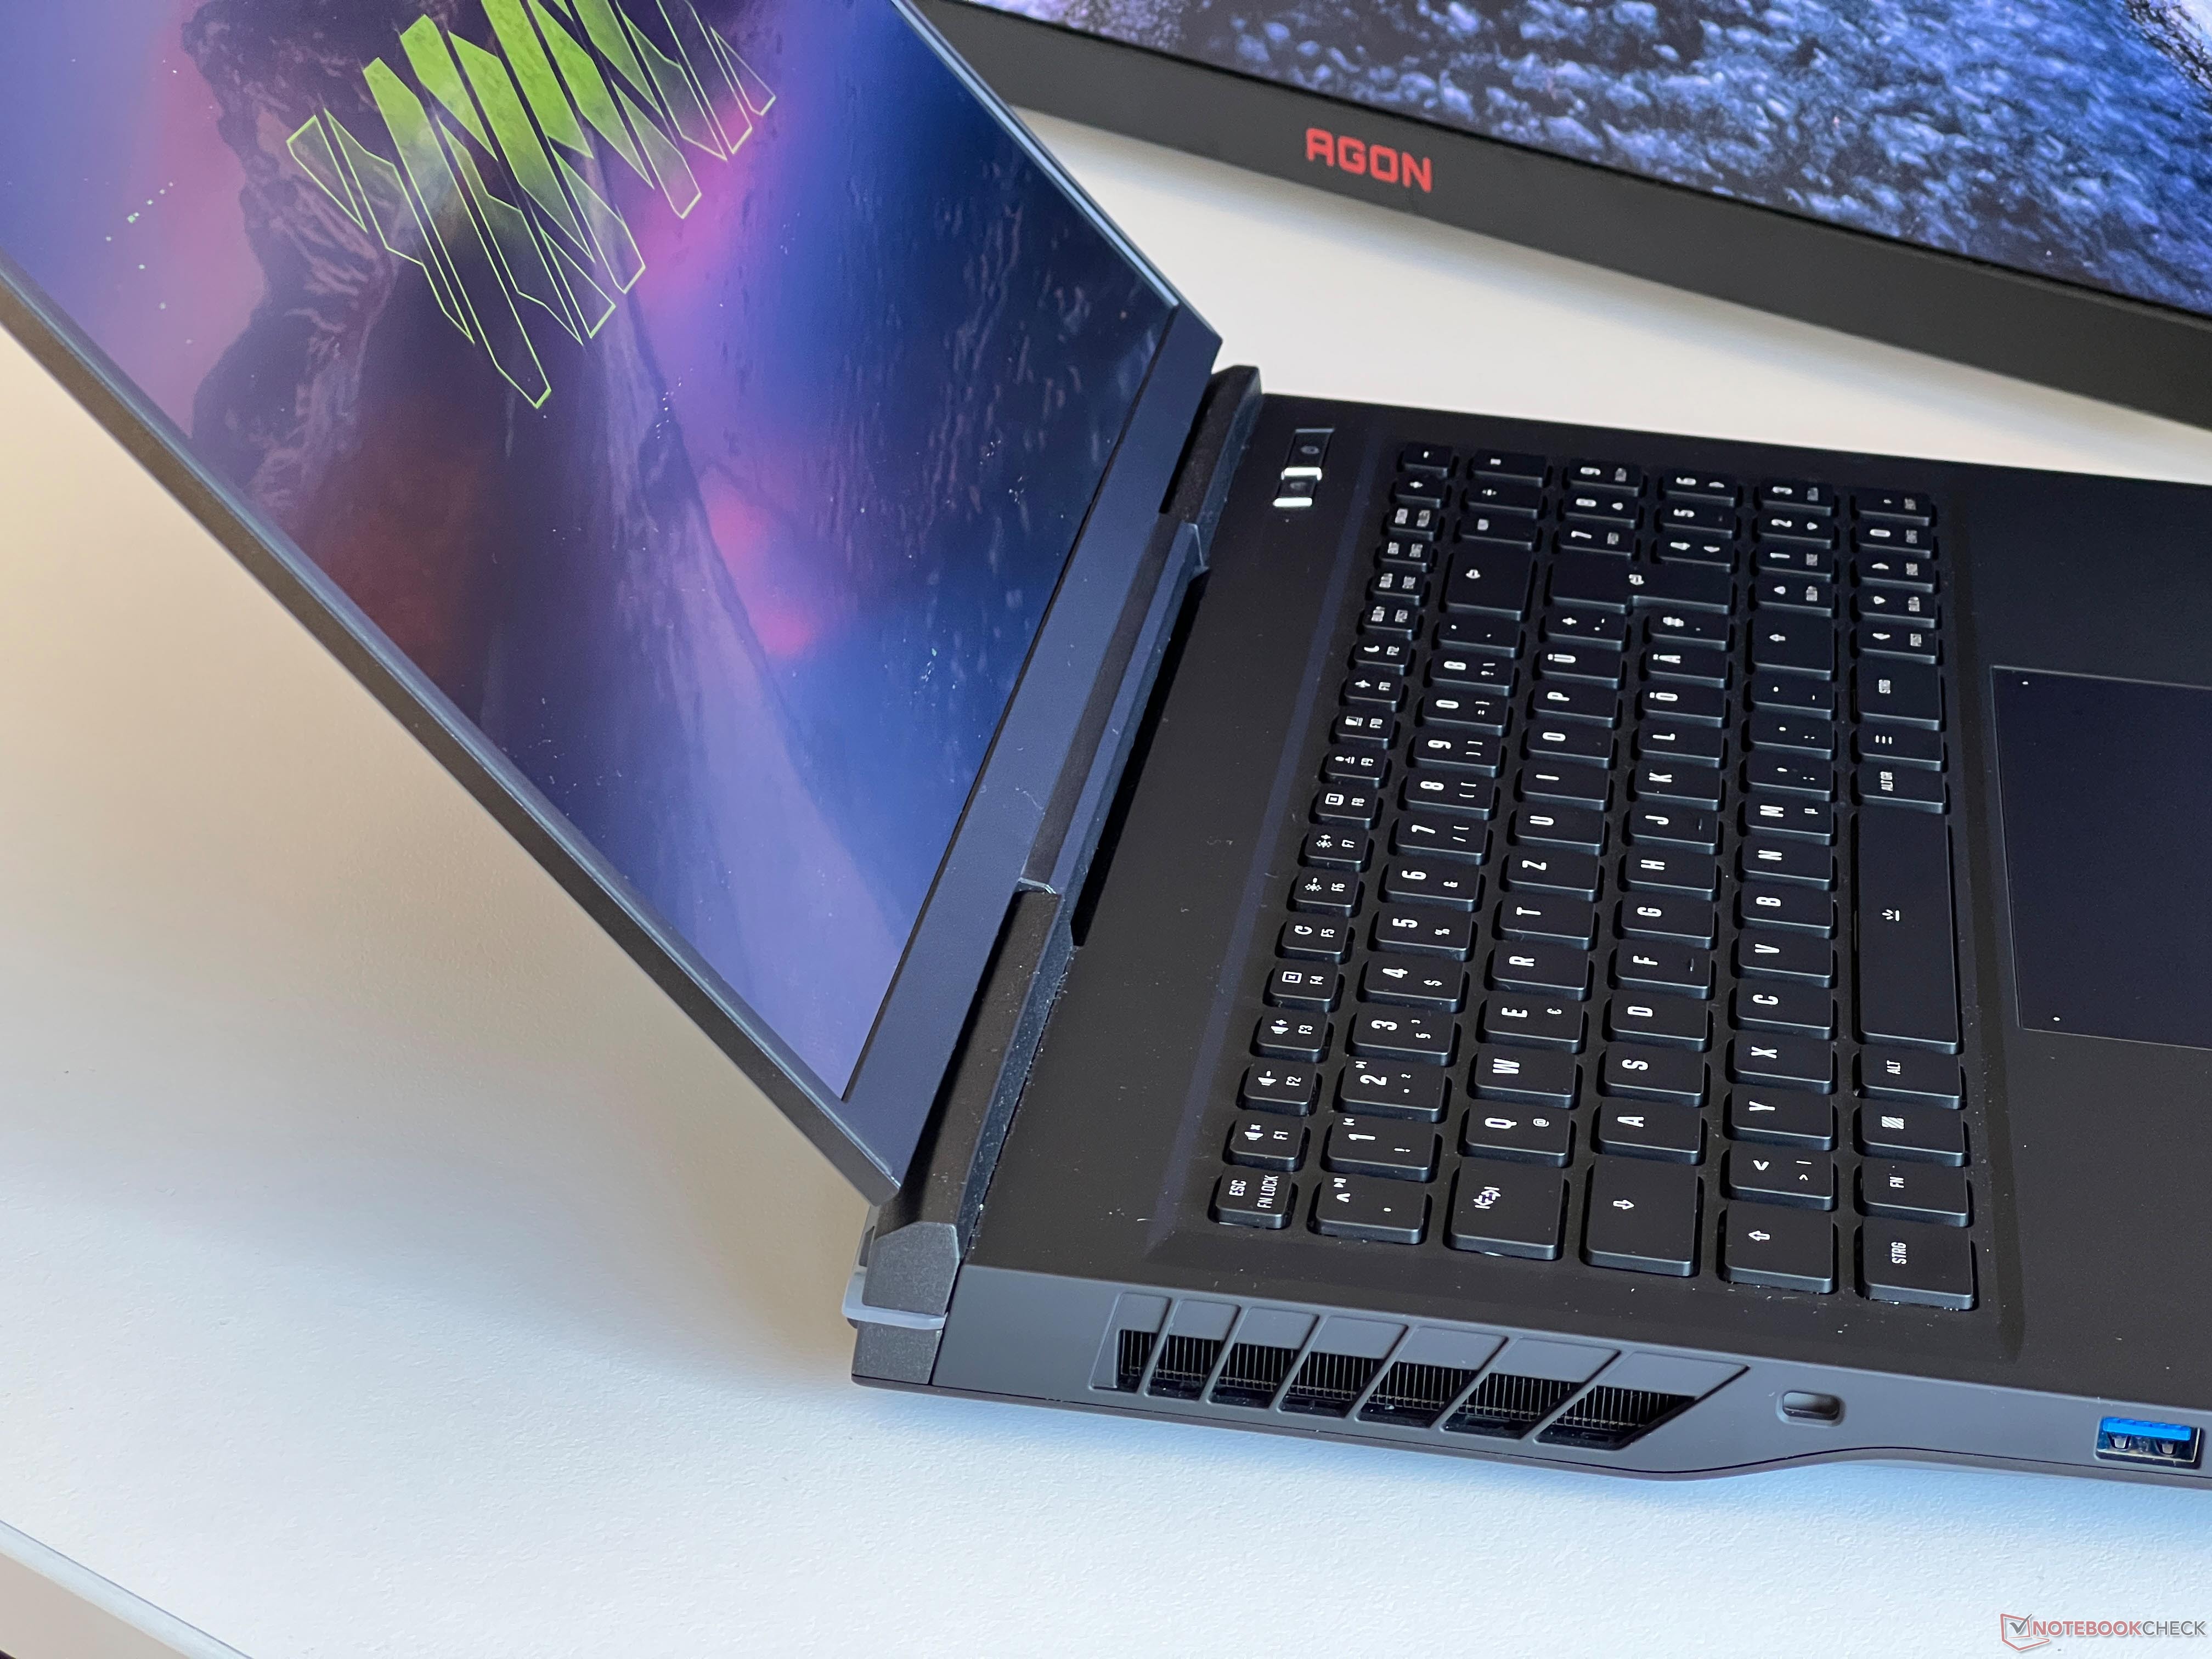
Neo 17 既可配备带 4 个照明区的传统薄膜键盘,也可配备带独立按键照明的机械键盘(额外收费 95 欧元)。我们的测试设备中也安装了这种键盘,使用的是 Cherry(MX ULP)触感开关。这些开关名副其实,具有非常好的触感和精确的键入感,但按键的声音也非常大。在选择时一定要考虑到这一点。大型玻璃 ClickPad(15 x 9.5 厘米)使用起来没有任何问题。
显示屏 - QHD,240 赫兹
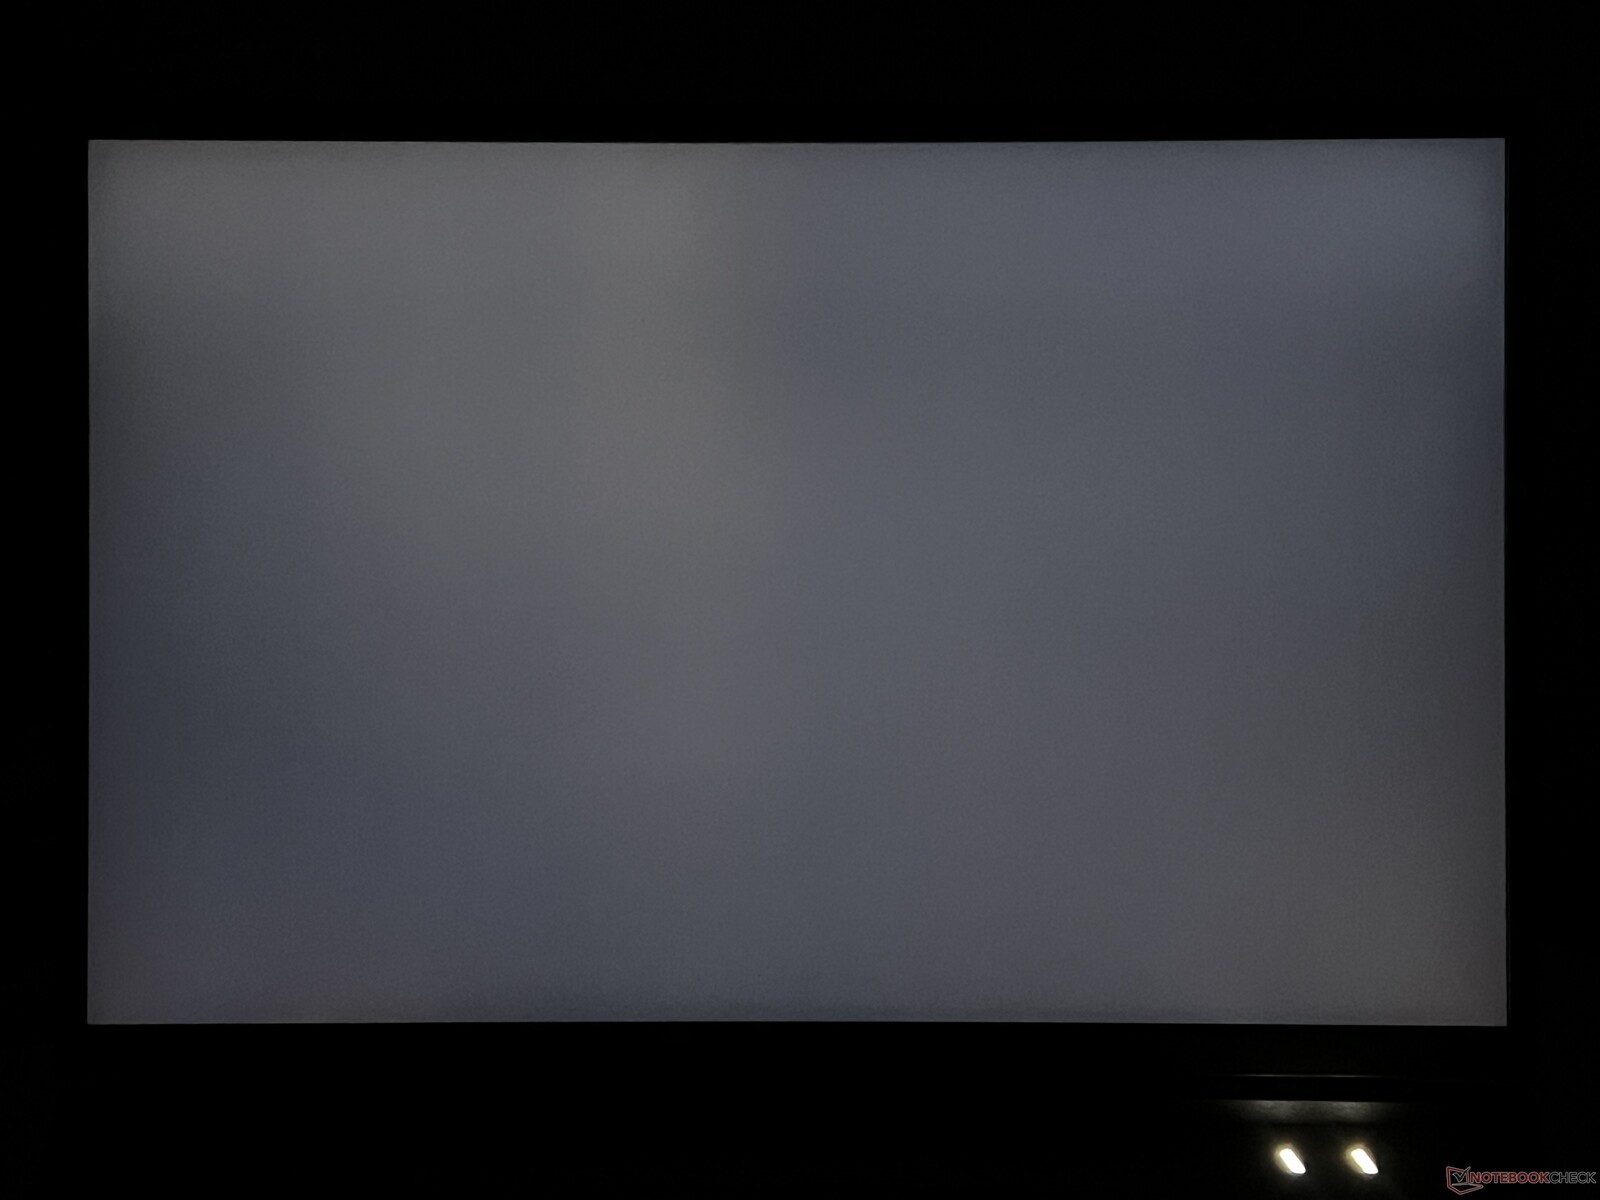
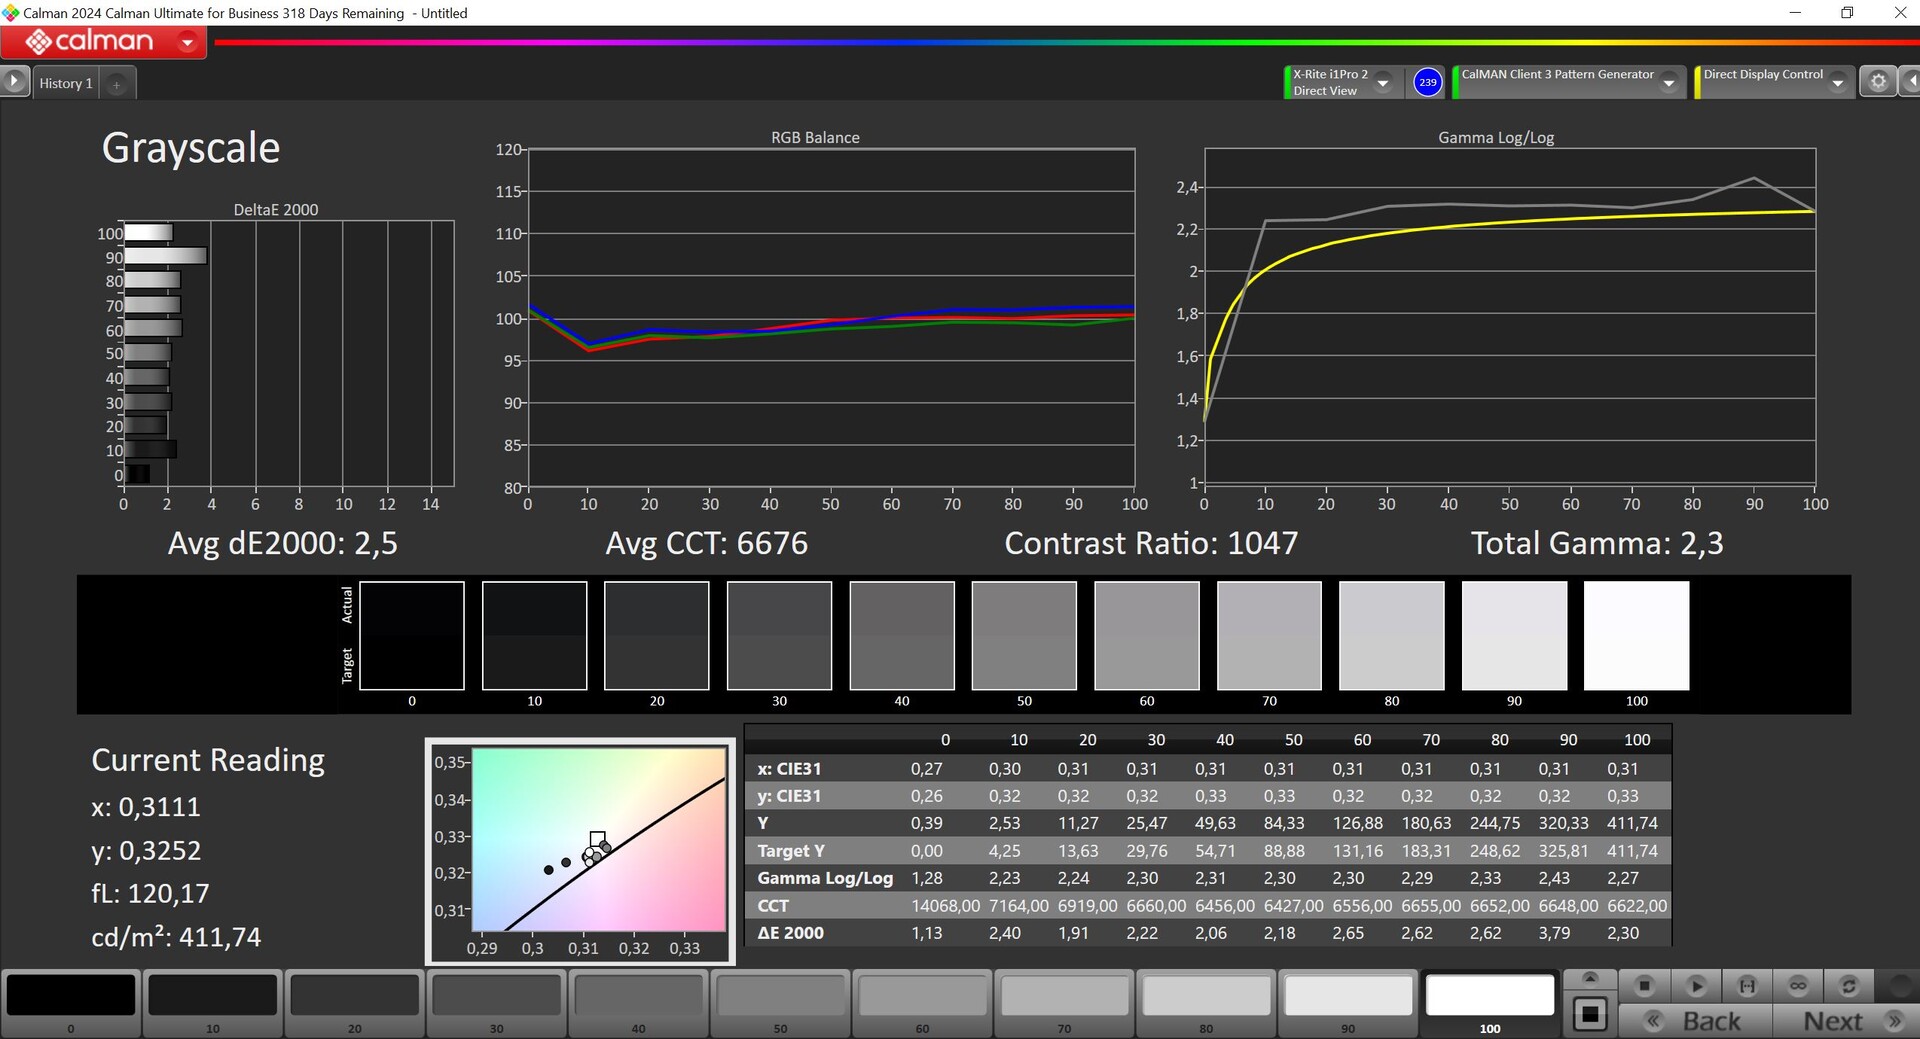
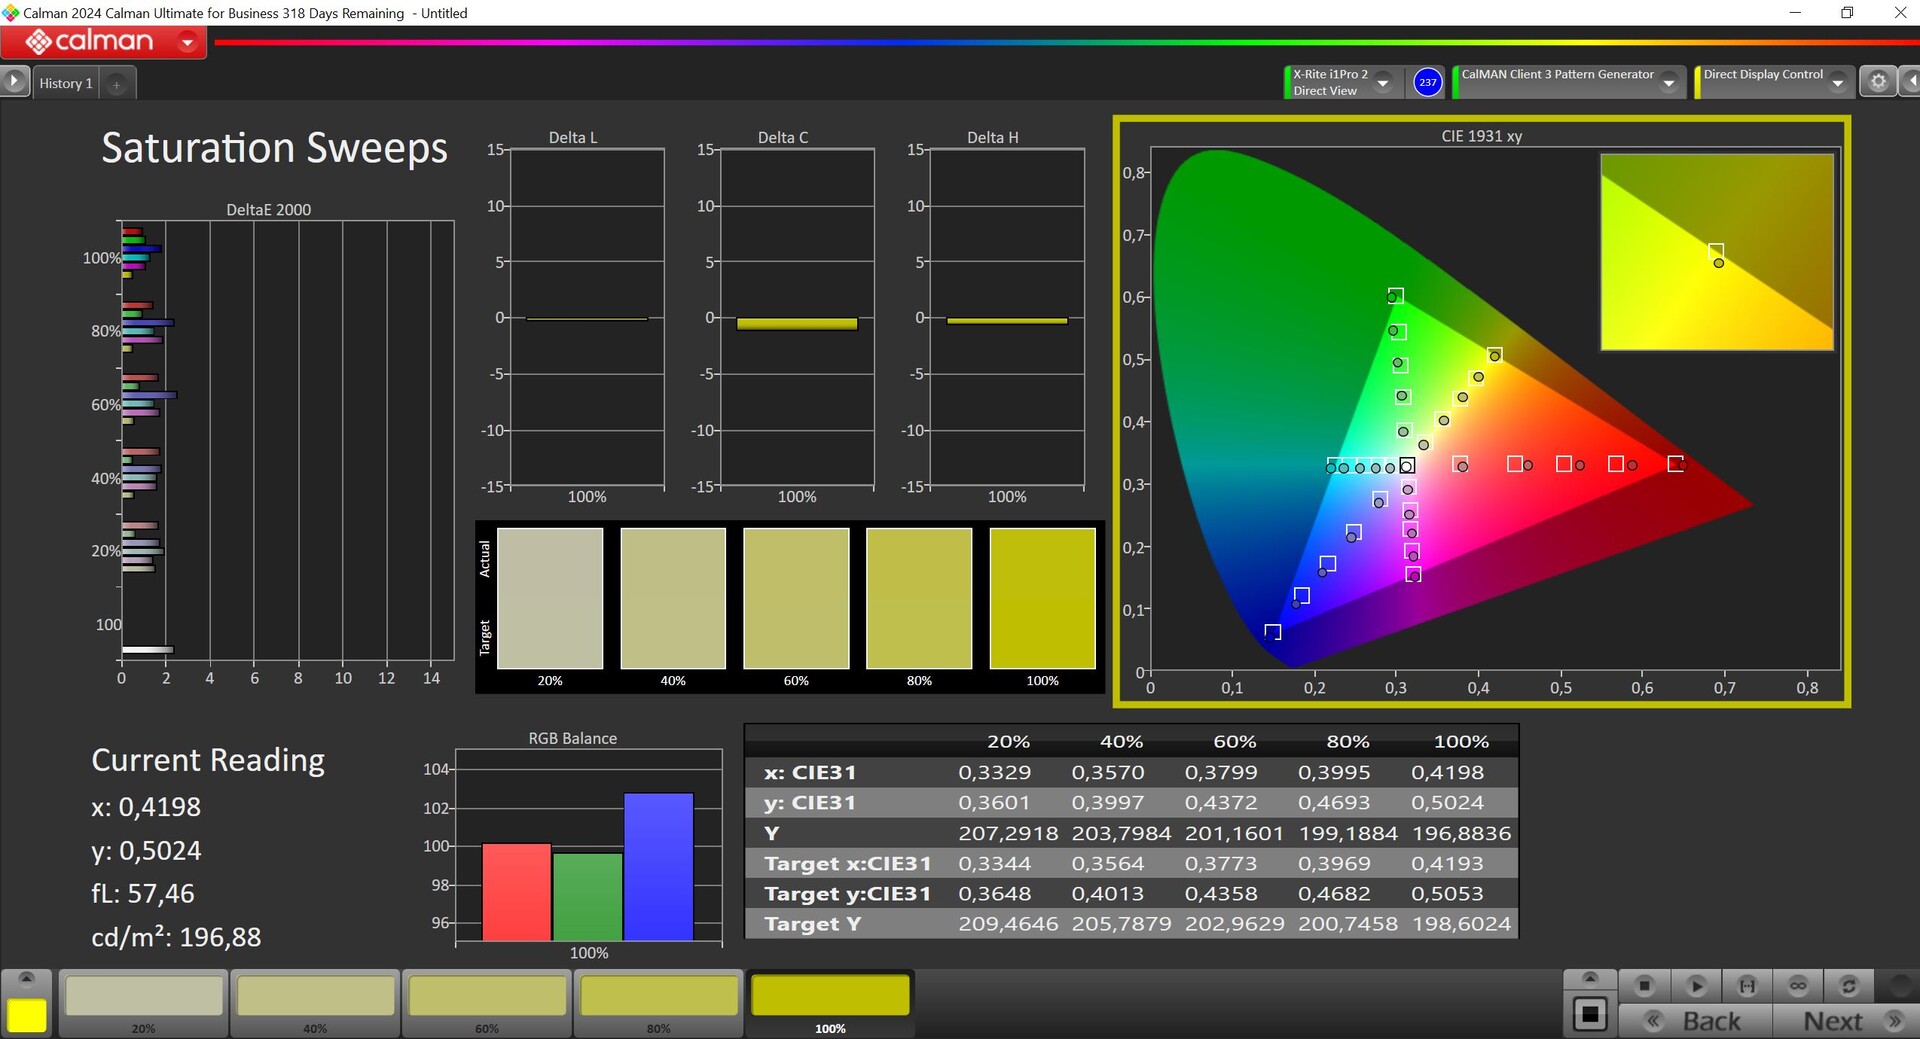
17 英寸 IPS 显示屏采用哑光表面,分辨率为 2,560 x 1,600 像素(16:10),响应时间快,频率为 240 Hz,非常适合游戏。主观画质也非常出色。没有使用 PWM,也没有光晕等重大问题。
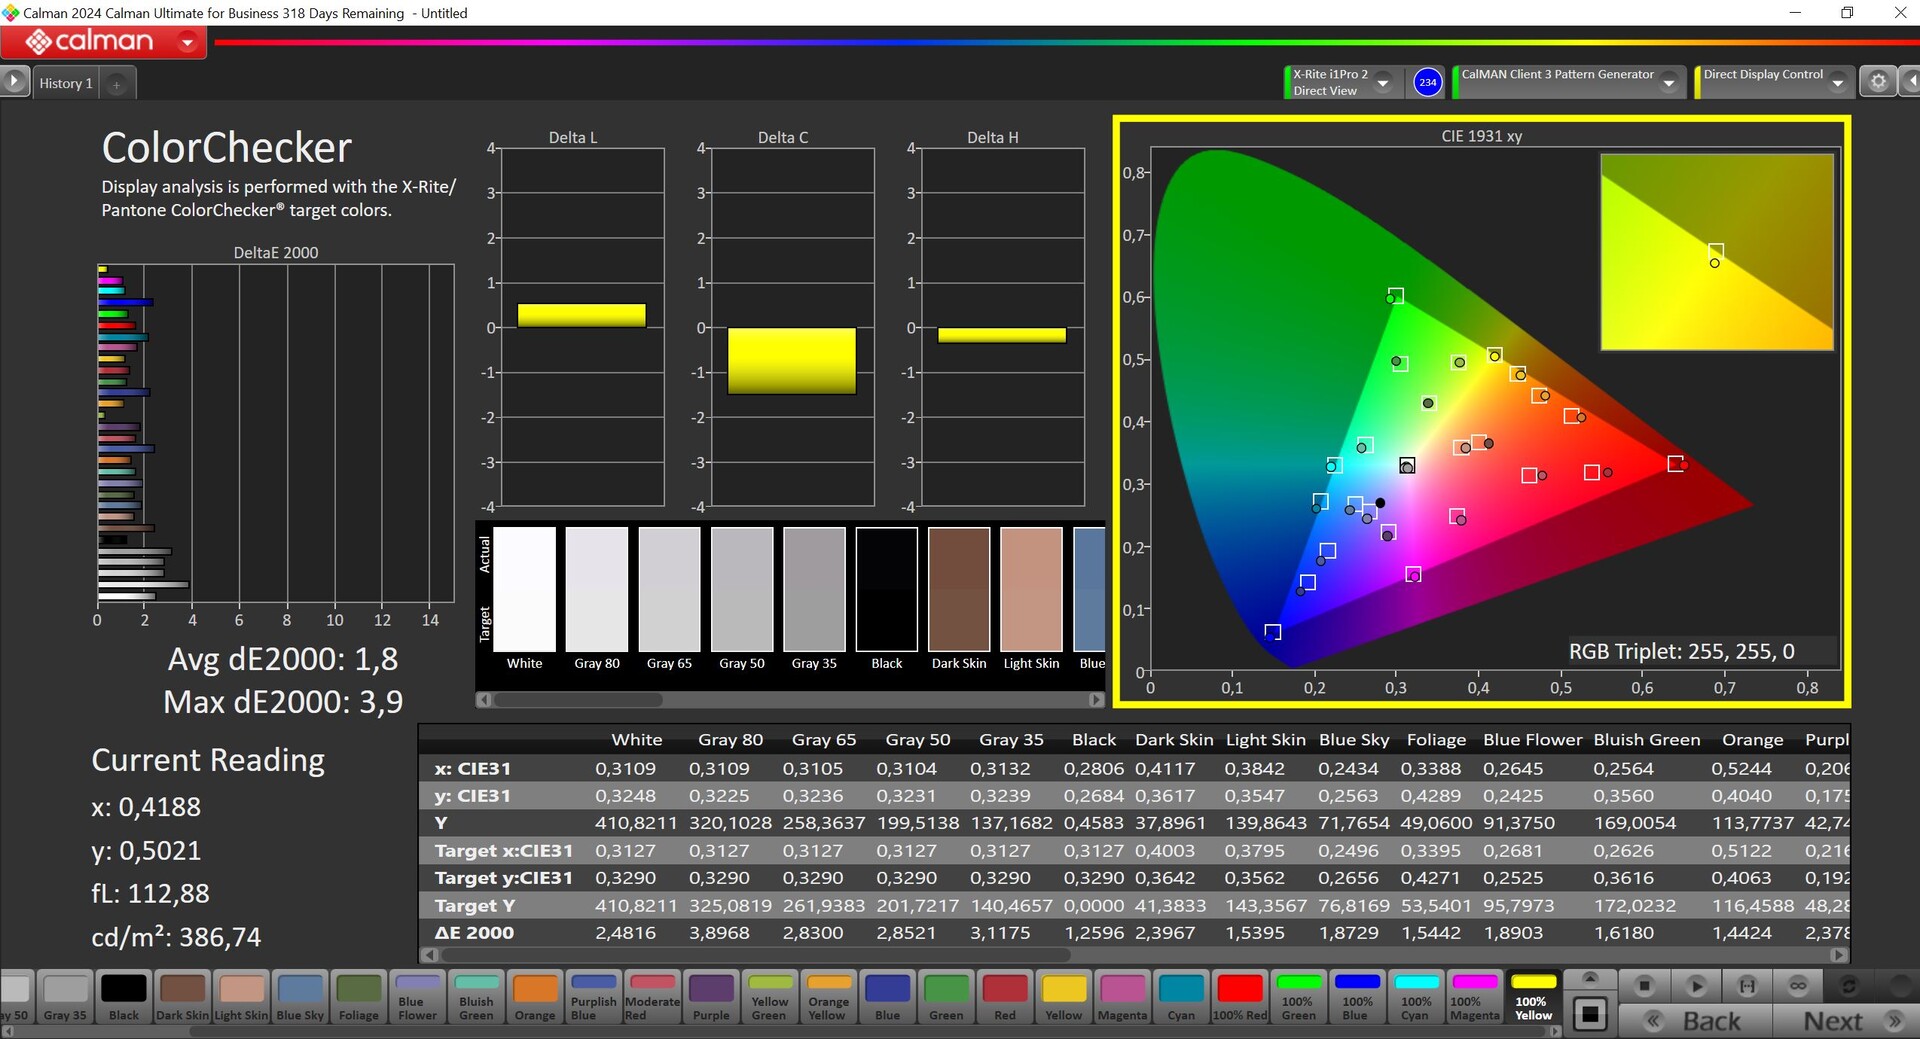
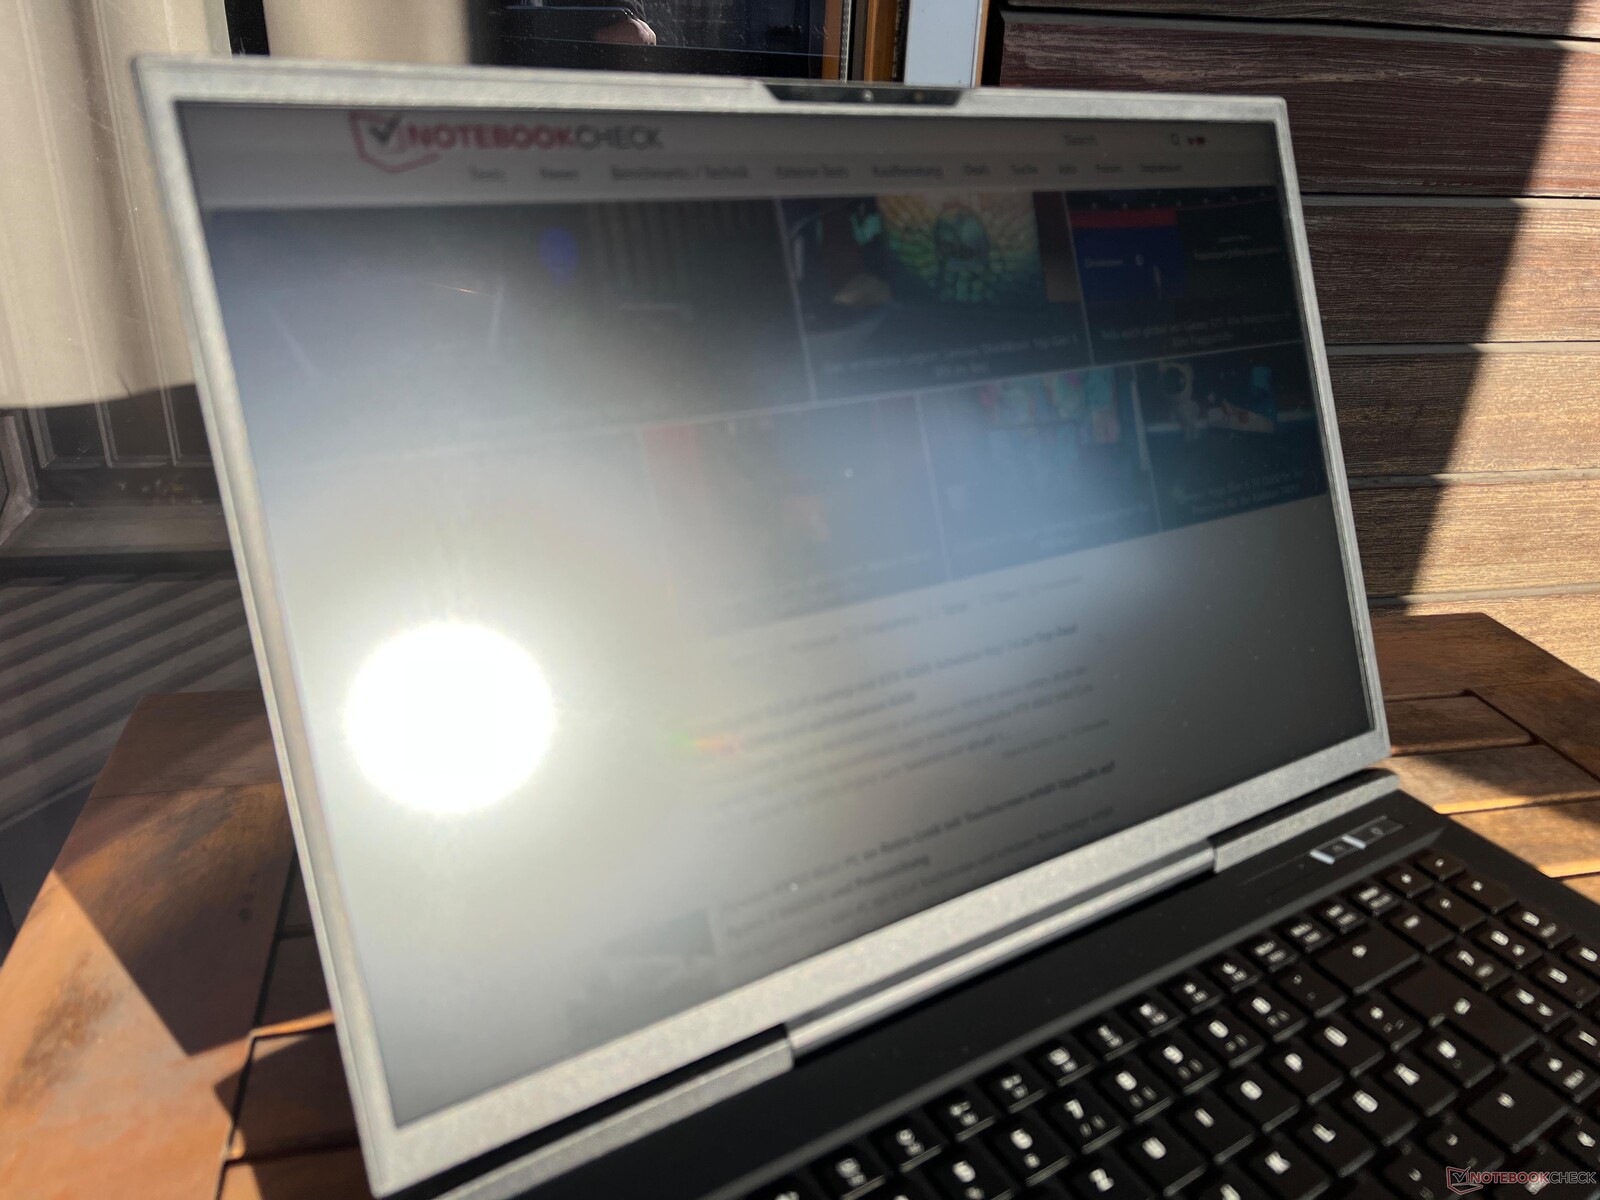
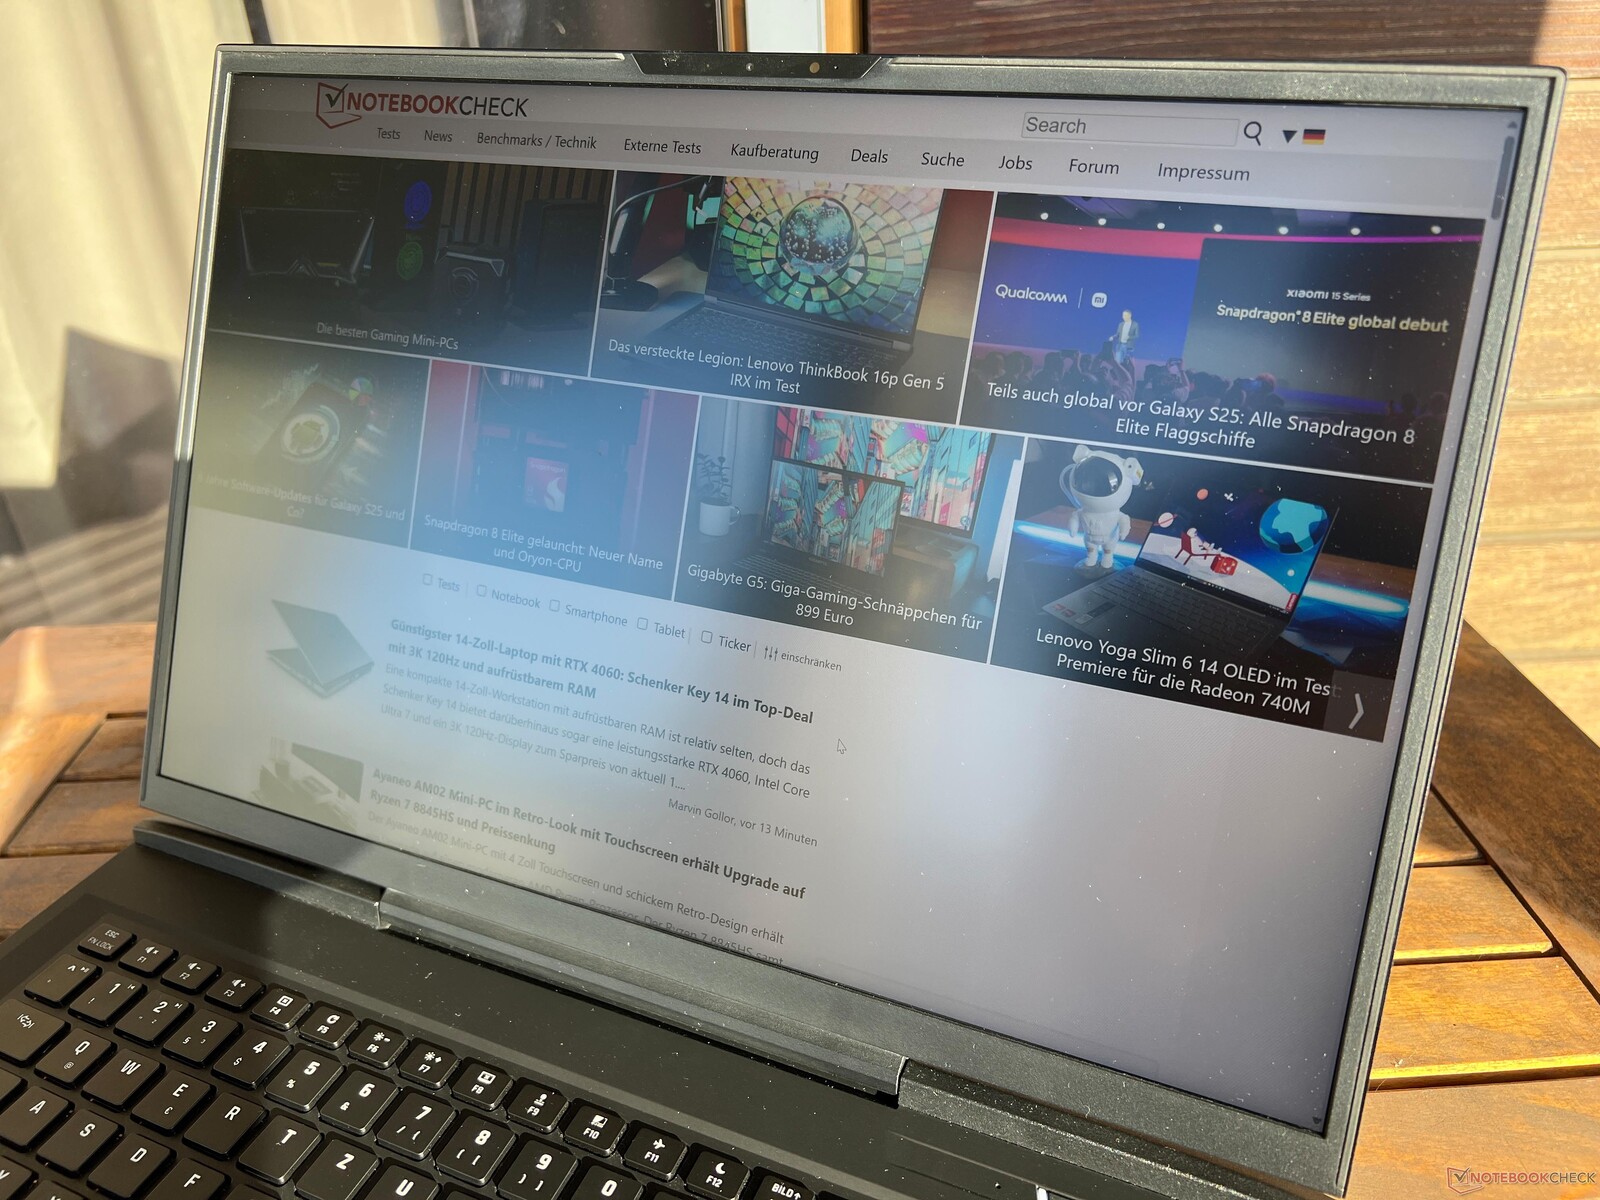
平均亮度约为 400 cd/m²,但黑阶略高,为 0.39。因此,最大对比度略高于 1,000:1,还算不错。在室外,面板的亮度应该会更高。出厂校准已经非常不错,但我们还可以通过校准进一步优化显示效果。相应的配置文件可在右侧框中免费下载。有了完整的 sRGB 覆盖范围,该面板还适用于编辑图像/视频。
| |||||||||||||||||||||||||
Brightness Distribution: 88 %
Center on Battery: 412 cd/m²
Contrast: 1056:1 (Black: 0.39 cd/m²)
ΔE Color 1.8 | 0.5-29.43 Ø4.87, calibrated: 0.9
ΔE Greyscale 2.5 | 0.5-98 Ø5.1
69.6% AdobeRGB 1998 (Argyll 2.2.0 3D)
98.4% sRGB (Argyll 2.2.0 3D)
69% Display P3 (Argyll 2.2.0 3D)
Gamma: 2.3
| SCHENKER XMG Neo 17 E24 NE170QDM-NZ1, IPS, 2560x1600, 17", 240 Hz | Medion Erazer Beast X40 2024 BOE NE170QDM-NZ1, IPS, 2560x1600, 17", 240 Hz | HP Omen 17-db0079ng BOE0B67, IPS, 2560x1440, 17.3", 240 Hz | Eurocom Raptor X17 Core i9-14900HX BOE CQ NE173QUM-NY1, IPS, 3840x2160, 17.3", 144 Hz | MSI GE78HX 13VH-070US AU Optronics B170QAN01.2, IPS, 2560x1600, 17", 240 Hz | |
|---|---|---|---|---|---|
| Display | -0% | -3% | 20% | 22% | |
| Display P3 Coverage | 69 | 68.1 -1% | 66.2 -4% | 95.9 39% | 97.6 41% |
| sRGB Coverage | 98.4 | 99.5 1% | 95.5 -3% | 99.8 1% | 99.9 2% |
| AdobeRGB 1998 Coverage | 69.6 | 69 -1% | 68.1 -2% | 84.2 21% | 86.5 24% |
| Response Times | 4% | -17% | -40% | 38% | |
| Response Time Grey 50% / Grey 80% * | 12.1 ? | 11.7 ? 3% | 14.4 ? -19% | 14.8 ? -22% | 4.2 ? 65% |
| Response Time Black / White * | 7.2 ? | 6.9 ? 4% | 8.3 ? -15% | 11.4 ? -58% | 6.4 ? 11% |
| PWM Frequency | |||||
| Screen | 14% | -9% | -25% | -51% | |
| Brightness middle | 412 | 422 2% | 363 -12% | 544.6 32% | 398.6 -3% |
| Brightness | 401 | 388 -3% | 341 -15% | 507 26% | 384 -4% |
| Brightness Distribution | 88 | 87 -1% | 84 -5% | 77 -12% | 89 1% |
| Black Level * | 0.39 | 0.42 -8% | 0.38 3% | 0.48 -23% | 0.46 -18% |
| Contrast | 1056 | 1005 -5% | 955 -10% | 1135 7% | 867 -18% |
| Colorchecker dE 2000 * | 1.8 | 1.42 21% | 1.74 3% | 3.38 -88% | 4.05 -125% |
| Colorchecker dE 2000 max. * | 3.9 | 1.97 49% | 5.39 -38% | 7.13 -83% | 8.68 -123% |
| Colorchecker dE 2000 calibrated * | 0.9 | 0.7 22% | 1.43 -59% | 1.03 -14% | 1.02 -13% |
| Greyscale dE 2000 * | 2.5 | 1.2 52% | 1.3 48% | 4.3 -72% | 6.5 -160% |
| Gamma | 2.3 96% | 2.078 106% | 2.235 98% | 2.42 91% | 2.11 104% |
| CCT | 6676 97% | 6581 99% | 6346 102% | 7356 88% | 7518 86% |
| Total Average (Program / Settings) | 6% /
10% | -10% /
-9% | -15% /
-18% | 3% /
-23% |
* ... smaller is better


Display Response Times
| ↔ Response Time Black to White | ||
|---|---|---|
| 7.2 ms ... rise ↗ and fall ↘ combined | ↗ 3 ms rise | 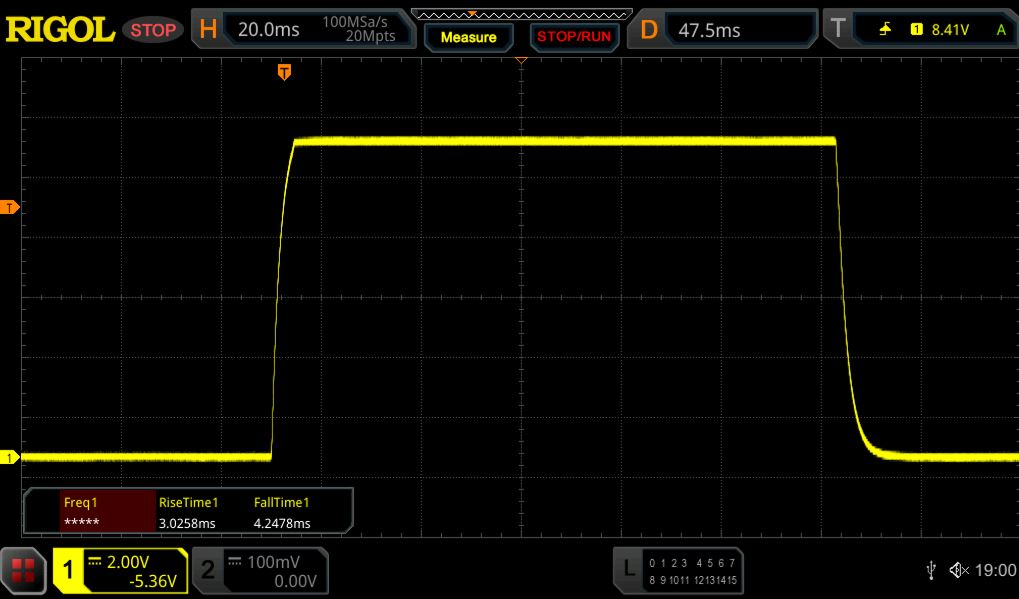 |
| ↘ 4.2 ms fall | ||
| The screen shows very fast response rates in our tests and should be very well suited for fast-paced gaming. In comparison, all tested devices range from 0.1 (minimum) to 240 (maximum) ms. » 18 % of all devices are better. This means that the measured response time is better than the average of all tested devices (20.8 ms). | ||
| ↔ Response Time 50% Grey to 80% Grey | ||
| 12.1 ms ... rise ↗ and fall ↘ combined | ↗ 5.9 ms rise | 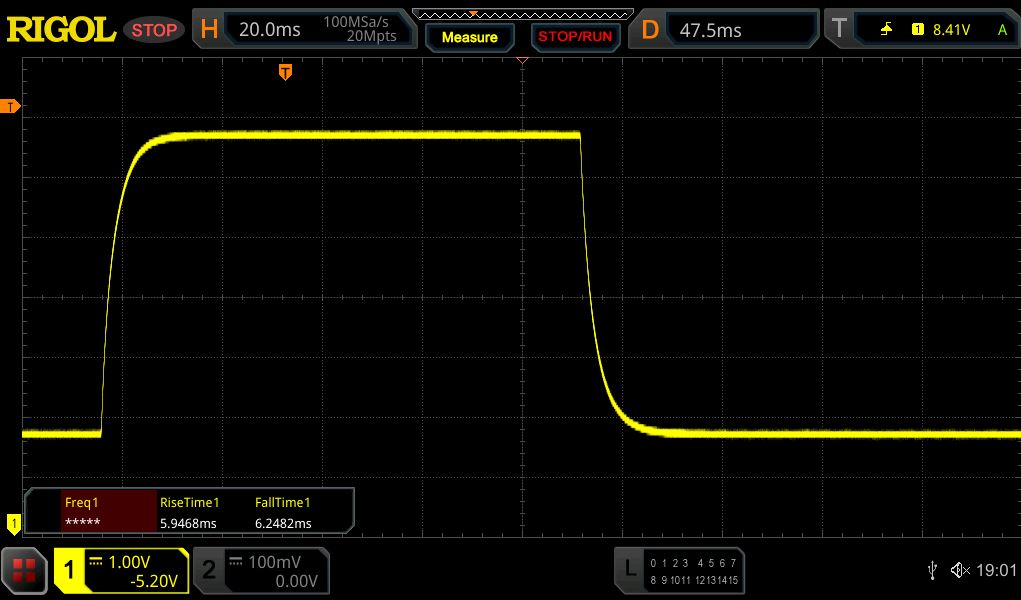 |
| ↘ 6.2 ms fall | ||
| The screen shows good response rates in our tests, but may be too slow for competitive gamers. In comparison, all tested devices range from 0.165 (minimum) to 636 (maximum) ms. » 23 % of all devices are better. This means that the measured response time is better than the average of all tested devices (32.5 ms). | ||
Screen Flickering / PWM (Pulse-Width Modulation)
| Screen flickering / PWM not detected | 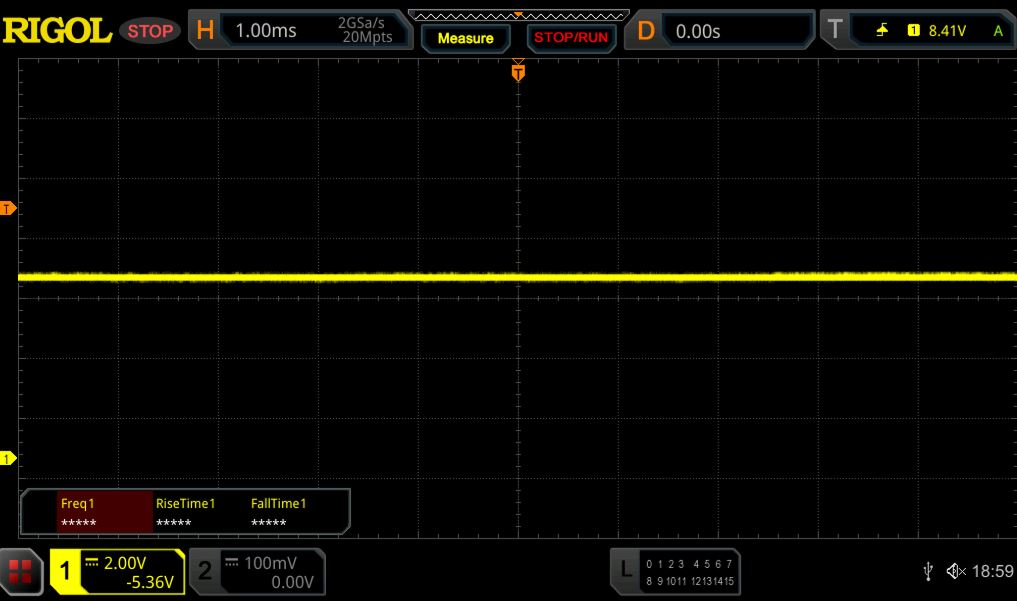 | ||
In comparison: 53 % of all tested devices do not use PWM to dim the display. If PWM was detected, an average of 8519 (minimum: 5 - maximum: 343500) Hz was measured. | |||


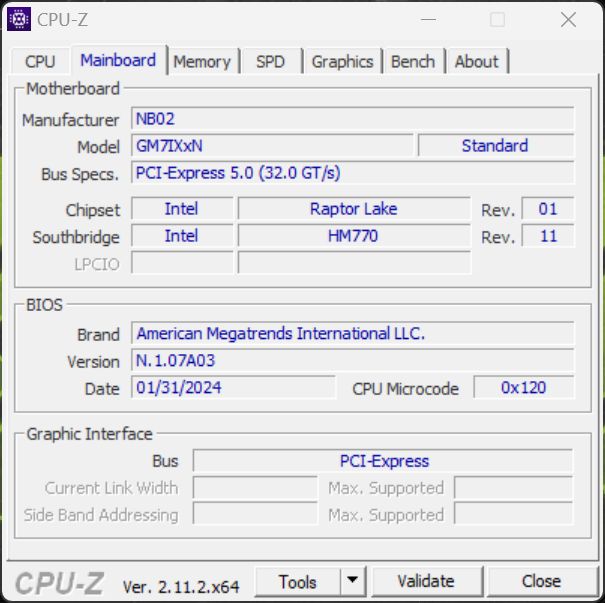
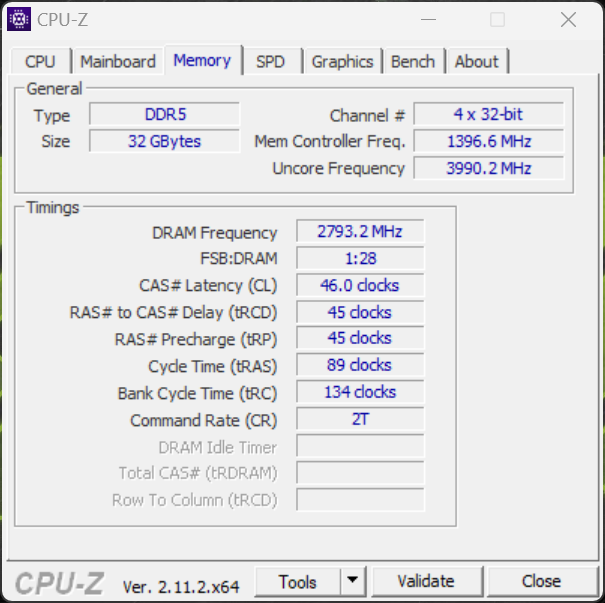
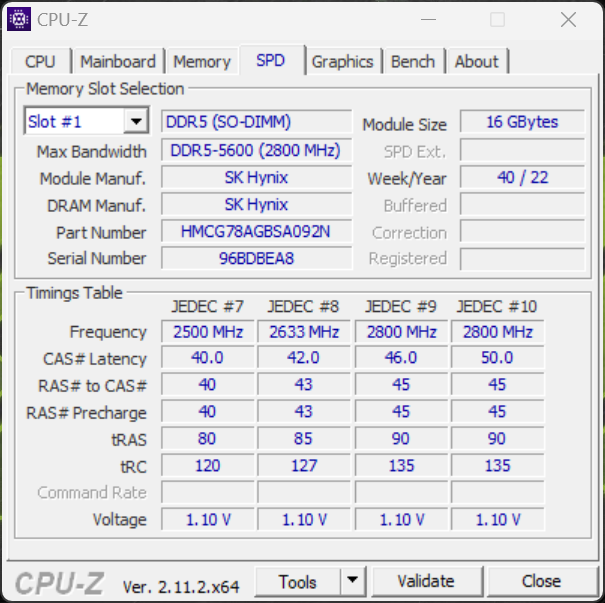
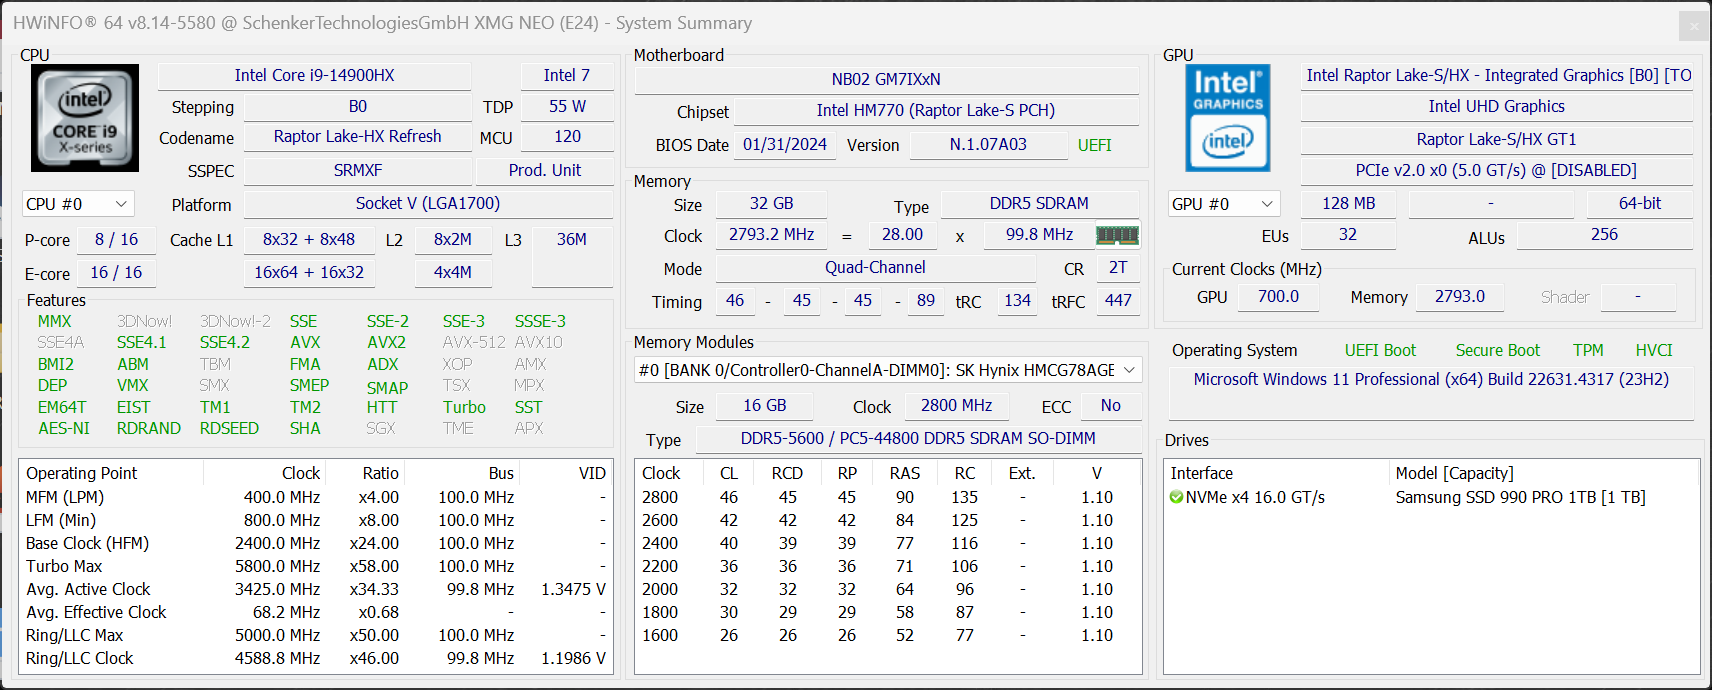
性能 - Raptor Lake-HX
Neo 17 专门配备了 英特尔酷睿 i9-14900HX.标准配置为 16 GB 内存,但由于有两个 SO-DIMM 插槽(附加费 260 欧元),内存容量可高达 96 GB。
测试条件
XMG Neo 17 提供了各种能量曲线,我们在下表中对其进行了总结。我们在基准测试和测量中使用了 "超增压 "模式,因为与"发烧友 "模式相比,噪音差异很小。制造商还提供了Deep Dive提供了有关 Neo 17 和能量曲线的更多技术背景信息。
| 能源概况 | CPU TDP | CB R23 Multi | GPU TDP | Time Spy 图形 | CP 2077 Ultra QHD | 最大风扇体积 |
|---|---|---|---|---|---|---|
| 平衡型 | 45 W | 14,899 分 | 130 W | 10,778 分 | 73.9 FPS | 43.1 dB(A) |
| 发烧级 | 75 W | 22,027 分 | 150 W | 18,021 分 | 78.6 FPS | 49.9 dB(A) |
| 超增压 | 160/140 W | 31,740 分 | 175 W | 19,155 分 | 80.7 FPS | 51.9 dB(A) |
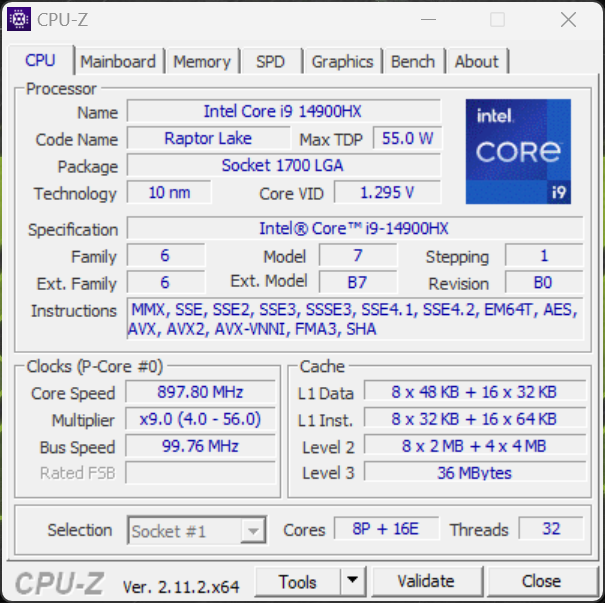
处理器 - 酷睿 i9-14900HX
英特尔 酷睿 i9-14900HX仍然是速度最快的移动处理器之一,而即将推出的箭湖芯片也不太可能改变这一点。这款处理器的功耗表现非常出色,短时功耗为 160 瓦,连续功耗为 140 瓦。对于用户来说,这意味着非常高且稳定的性能。不过,在电池模式下,CPU 的最大功耗为 35 瓦,相当于在多核测试中降低了 65% 的性能,因此在电池模式下会有明显的损耗。更多 CPU 基准测试请参见 技术部分.
Cinebench R15 Multi loop
Cinebench R23: Multi Core | Single Core
Cinebench R20: CPU (Multi Core) | CPU (Single Core)
Cinebench R15: CPU Multi 64Bit | CPU Single 64Bit
Blender: v2.79 BMW27 CPU
7-Zip 18.03: 7z b 4 | 7z b 4 -mmt1
Geekbench 6.4: Multi-Core | Single-Core
Geekbench 5.5: Multi-Core | Single-Core
HWBOT x265 Benchmark v2.2: 4k Preset
LibreOffice : 20 Documents To PDF
R Benchmark 2.5: Overall mean
| CPU Performance Rating | |
| SCHENKER XMG Neo 17 E24 | |
| MSI GE78HX 13VH-070US -2! | |
| Average Intel Core i9-14900HX | |
| Eurocom Raptor X17 Core i9-14900HX | |
| Medion Erazer Beast X40 2024 | |
| Average of class Gaming | |
| HP Omen 17-db0079ng | |
| Cinebench R23 / Multi Core | |
| MSI GE78HX 13VH-070US | |
| SCHENKER XMG Neo 17 E24 | |
| Eurocom Raptor X17 Core i9-14900HX | |
| Average Intel Core i9-14900HX (17078 - 36249, n=37) | |
| Medion Erazer Beast X40 2024 | |
| Average of class Gaming (5668 - 39652, n=151, last 2 years) | |
| HP Omen 17-db0079ng | |
| Cinebench R23 / Single Core | |
| SCHENKER XMG Neo 17 E24 | |
| Medion Erazer Beast X40 2024 | |
| Average Intel Core i9-14900HX (1720 - 2245, n=37) | |
| MSI GE78HX 13VH-070US | |
| Eurocom Raptor X17 Core i9-14900HX | |
| Average of class Gaming (1136 - 2252, n=151, last 2 years) | |
| HP Omen 17-db0079ng | |
| Cinebench R20 / CPU (Multi Core) | |
| MSI GE78HX 13VH-070US | |
| SCHENKER XMG Neo 17 E24 | |
| Eurocom Raptor X17 Core i9-14900HX | |
| Average Intel Core i9-14900HX (6579 - 13832, n=37) | |
| Medion Erazer Beast X40 2024 | |
| Average of class Gaming (2179 - 15517, n=151, last 2 years) | |
| HP Omen 17-db0079ng | |
| Cinebench R20 / CPU (Single Core) | |
| SCHENKER XMG Neo 17 E24 | |
| Medion Erazer Beast X40 2024 | |
| Average Intel Core i9-14900HX (657 - 859, n=37) | |
| Eurocom Raptor X17 Core i9-14900HX | |
| MSI GE78HX 13VH-070US | |
| Average of class Gaming (439 - 866, n=151, last 2 years) | |
| HP Omen 17-db0079ng | |
| Cinebench R15 / CPU Multi 64Bit | |
| MSI GE78HX 13VH-070US | |
| SCHENKER XMG Neo 17 E24 | |
| Eurocom Raptor X17 Core i9-14900HX | |
| Average Intel Core i9-14900HX (3263 - 5589, n=38) | |
| Average of class Gaming (905 - 6074, n=154, last 2 years) | |
| Medion Erazer Beast X40 2024 | |
| HP Omen 17-db0079ng | |
| Cinebench R15 / CPU Single 64Bit | |
| SCHENKER XMG Neo 17 E24 | |
| Medion Erazer Beast X40 2024 | |
| Average Intel Core i9-14900HX (247 - 323, n=37) | |
| MSI GE78HX 13VH-070US | |
| Eurocom Raptor X17 Core i9-14900HX | |
| Average of class Gaming (191.9 - 343, n=151, last 2 years) | |
| HP Omen 17-db0079ng | |
| Blender / v2.79 BMW27 CPU | |
| HP Omen 17-db0079ng | |
| Average of class Gaming (81 - 555, n=144, last 2 years) | |
| Medion Erazer Beast X40 2024 | |
| Average Intel Core i9-14900HX (91 - 206, n=37) | |
| Eurocom Raptor X17 Core i9-14900HX | |
| SCHENKER XMG Neo 17 E24 | |
| MSI GE78HX 13VH-070US | |
| 7-Zip 18.03 / 7z b 4 | |
| MSI GE78HX 13VH-070US | |
| SCHENKER XMG Neo 17 E24 | |
| Eurocom Raptor X17 Core i9-14900HX | |
| Average Intel Core i9-14900HX (66769 - 136645, n=37) | |
| Medion Erazer Beast X40 2024 | |
| Average of class Gaming (23795 - 144064, n=149, last 2 years) | |
| HP Omen 17-db0079ng | |
| 7-Zip 18.03 / 7z b 4 -mmt1 | |
| Medion Erazer Beast X40 2024 | |
| SCHENKER XMG Neo 17 E24 | |
| MSI GE78HX 13VH-070US | |
| Average Intel Core i9-14900HX (5452 - 7545, n=37) | |
| Eurocom Raptor X17 Core i9-14900HX | |
| Average of class Gaming (4199 - 7573, n=149, last 2 years) | |
| HP Omen 17-db0079ng | |
| Geekbench 6.4 / Multi-Core | |
| SCHENKER XMG Neo 17 E24 | |
| Eurocom Raptor X17 Core i9-14900HX | |
| Average Intel Core i9-14900HX (13158 - 19665, n=37) | |
| Medion Erazer Beast X40 2024 | |
| Average of class Gaming (5340 - 21668, n=119, last 2 years) | |
| HP Omen 17-db0079ng | |
| Geekbench 6.4 / Single-Core | |
| Medion Erazer Beast X40 2024 | |
| SCHENKER XMG Neo 17 E24 | |
| Average Intel Core i9-14900HX (2419 - 3129, n=37) | |
| Eurocom Raptor X17 Core i9-14900HX | |
| Average of class Gaming (1490 - 3219, n=119, last 2 years) | |
| HP Omen 17-db0079ng | |
| Geekbench 5.5 / Multi-Core | |
| MSI GE78HX 13VH-070US | |
| SCHENKER XMG Neo 17 E24 | |
| Average Intel Core i9-14900HX (8618 - 23194, n=37) | |
| Medion Erazer Beast X40 2024 | |
| Average of class Gaming (4557 - 25855, n=148, last 2 years) | |
| HP Omen 17-db0079ng | |
| Eurocom Raptor X17 Core i9-14900HX | |
| Geekbench 5.5 / Single-Core | |
| Medion Erazer Beast X40 2024 | |
| SCHENKER XMG Neo 17 E24 | |
| MSI GE78HX 13VH-070US | |
| Average Intel Core i9-14900HX (1669 - 2210, n=37) | |
| Average of class Gaming (986 - 2423, n=148, last 2 years) | |
| HP Omen 17-db0079ng | |
| Eurocom Raptor X17 Core i9-14900HX | |
| HWBOT x265 Benchmark v2.2 / 4k Preset | |
| MSI GE78HX 13VH-070US | |
| Eurocom Raptor X17 Core i9-14900HX | |
| SCHENKER XMG Neo 17 E24 | |
| Average Intel Core i9-14900HX (16.8 - 38.9, n=37) | |
| Medion Erazer Beast X40 2024 | |
| Average of class Gaming (6.72 - 42.9, n=148, last 2 years) | |
| HP Omen 17-db0079ng | |
| LibreOffice / 20 Documents To PDF | |
| HP Omen 17-db0079ng | |
| Average of class Gaming (19 - 96.6, n=147, last 2 years) | |
| MSI GE78HX 13VH-070US | |
| Medion Erazer Beast X40 2024 | |
| Average Intel Core i9-14900HX (19 - 85.1, n=37) | |
| SCHENKER XMG Neo 17 E24 | |
| Eurocom Raptor X17 Core i9-14900HX | |
| R Benchmark 2.5 / Overall mean | |
| HP Omen 17-db0079ng | |
| Average of class Gaming (0.3609 - 0.759, n=150, last 2 years) | |
| Average Intel Core i9-14900HX (0.3604 - 0.4859, n=37) | |
| Eurocom Raptor X17 Core i9-14900HX | |
| MSI GE78HX 13VH-070US | |
| SCHENKER XMG Neo 17 E24 | |
| Medion Erazer Beast X40 2024 | |
* ... smaller is better
AIDA64: FP32 Ray-Trace | FPU Julia | CPU SHA3 | CPU Queen | FPU SinJulia | FPU Mandel | CPU AES | CPU ZLib | FP64 Ray-Trace | CPU PhotoWorxx
| Performance Rating | |
| Eurocom Raptor X17 Core i9-14900HX | |
| SCHENKER XMG Neo 17 E24 | |
| MSI GE78HX 13VH-070US | |
| Average Intel Core i9-14900HX | |
| HP Omen 17-db0079ng | |
| Medion Erazer Beast X40 2024 | |
| Average of class Gaming | |
| AIDA64 / FP32 Ray-Trace | |
| SCHENKER XMG Neo 17 E24 | |
| MSI GE78HX 13VH-070US | |
| Eurocom Raptor X17 Core i9-14900HX | |
| HP Omen 17-db0079ng | |
| Average Intel Core i9-14900HX (13098 - 33474, n=36) | |
| Average of class Gaming (4986 - 81639, n=147, last 2 years) | |
| Medion Erazer Beast X40 2024 | |
| AIDA64 / FPU Julia | |
| SCHENKER XMG Neo 17 E24 | |
| MSI GE78HX 13VH-070US | |
| Eurocom Raptor X17 Core i9-14900HX | |
| Average Intel Core i9-14900HX (67573 - 166040, n=36) | |
| HP Omen 17-db0079ng | |
| Average of class Gaming (25360 - 252486, n=147, last 2 years) | |
| Medion Erazer Beast X40 2024 | |
| AIDA64 / CPU SHA3 | |
| Eurocom Raptor X17 Core i9-14900HX | |
| SCHENKER XMG Neo 17 E24 | |
| MSI GE78HX 13VH-070US | |
| Average Intel Core i9-14900HX (3589 - 7979, n=36) | |
| Medion Erazer Beast X40 2024 | |
| Average of class Gaming (1339 - 10389, n=147, last 2 years) | |
| HP Omen 17-db0079ng | |
| AIDA64 / CPU Queen | |
| Eurocom Raptor X17 Core i9-14900HX | |
| SCHENKER XMG Neo 17 E24 | |
| MSI GE78HX 13VH-070US | |
| Average Intel Core i9-14900HX (118405 - 148966, n=36) | |
| Medion Erazer Beast X40 2024 | |
| HP Omen 17-db0079ng | |
| Average of class Gaming (50699 - 200651, n=147, last 2 years) | |
| AIDA64 / FPU SinJulia | |
| MSI GE78HX 13VH-070US | |
| SCHENKER XMG Neo 17 E24 | |
| Eurocom Raptor X17 Core i9-14900HX | |
| Average Intel Core i9-14900HX (10475 - 18517, n=36) | |
| HP Omen 17-db0079ng | |
| Medion Erazer Beast X40 2024 | |
| Average of class Gaming (4800 - 32988, n=147, last 2 years) | |
| AIDA64 / FPU Mandel | |
| SCHENKER XMG Neo 17 E24 | |
| MSI GE78HX 13VH-070US | |
| Eurocom Raptor X17 Core i9-14900HX | |
| Average Intel Core i9-14900HX (32543 - 83662, n=36) | |
| HP Omen 17-db0079ng | |
| Average of class Gaming (12321 - 134044, n=147, last 2 years) | |
| Medion Erazer Beast X40 2024 | |
| AIDA64 / CPU AES | |
| Eurocom Raptor X17 Core i9-14900HX | |
| Average Intel Core i9-14900HX (86964 - 241777, n=36) | |
| SCHENKER XMG Neo 17 E24 | |
| MSI GE78HX 13VH-070US | |
| Average of class Gaming (19065 - 328679, n=147, last 2 years) | |
| Medion Erazer Beast X40 2024 | |
| HP Omen 17-db0079ng | |
| AIDA64 / CPU ZLib | |
| MSI GE78HX 13VH-070US | |
| Eurocom Raptor X17 Core i9-14900HX | |
| SCHENKER XMG Neo 17 E24 | |
| Average Intel Core i9-14900HX (1054 - 2292, n=36) | |
| Medion Erazer Beast X40 2024 | |
| Average of class Gaming (373 - 2531, n=147, last 2 years) | |
| HP Omen 17-db0079ng | |
| AIDA64 / FP64 Ray-Trace | |
| MSI GE78HX 13VH-070US | |
| SCHENKER XMG Neo 17 E24 | |
| Eurocom Raptor X17 Core i9-14900HX | |
| HP Omen 17-db0079ng | |
| Average Intel Core i9-14900HX (6809 - 18349, n=36) | |
| Average of class Gaming (2540 - 43430, n=147, last 2 years) | |
| Medion Erazer Beast X40 2024 | |
| AIDA64 / CPU PhotoWorxx | |
| Eurocom Raptor X17 Core i9-14900HX | |
| MSI GE78HX 13VH-070US | |
| SCHENKER XMG Neo 17 E24 | |
| Medion Erazer Beast X40 2024 | |
| Average Intel Core i9-14900HX (23903 - 54702, n=36) | |
| HP Omen 17-db0079ng | |
| Average of class Gaming (10805 - 60161, n=147, last 2 years) | |
系统性能
在合成系统基准测试中,Neo 17 也给人留下了深刻印象,尽管竞争对手在这方面通常非常接近。在日常使用中,这意味着系统反应极为灵敏,尽管在切换显卡时会出现短暂的卡顿。不过,这完全是正常现象,完全关闭 iGPU 即可避免。
CrossMark: Overall | Productivity | Creativity | Responsiveness
WebXPRT 3: Overall
WebXPRT 4: Overall
Mozilla Kraken 1.1: Total
| PCMark 10 / Score | |
| Medion Erazer Beast X40 2024 | |
| MSI GE78HX 13VH-070US | |
| Average Intel Core i9-14900HX, NVIDIA GeForce RTX 4080 Laptop GPU (7703 - 9223, n=7) | |
| SCHENKER XMG Neo 17 E24 | |
| Average of class Gaming (5776 - 9852, n=133, last 2 years) | |
| HP Omen 17-db0079ng | |
| PCMark 10 / Essentials | |
| Average Intel Core i9-14900HX, NVIDIA GeForce RTX 4080 Laptop GPU (11255 - 12600, n=7) | |
| MSI GE78HX 13VH-070US | |
| SCHENKER XMG Neo 17 E24 | |
| Medion Erazer Beast X40 2024 | |
| Average of class Gaming (9057 - 12600, n=133, last 2 years) | |
| HP Omen 17-db0079ng | |
| PCMark 10 / Productivity | |
| Medion Erazer Beast X40 2024 | |
| SCHENKER XMG Neo 17 E24 | |
| MSI GE78HX 13VH-070US | |
| Average Intel Core i9-14900HX, NVIDIA GeForce RTX 4080 Laptop GPU (6662 - 11410, n=7) | |
| HP Omen 17-db0079ng | |
| Average of class Gaming (6662 - 14612, n=133, last 2 years) | |
| PCMark 10 / Digital Content Creation | |
| Medion Erazer Beast X40 2024 | |
| MSI GE78HX 13VH-070US | |
| Average Intel Core i9-14900HX, NVIDIA GeForce RTX 4080 Laptop GPU (14211 - 16246, n=7) | |
| SCHENKER XMG Neo 17 E24 | |
| Average of class Gaming (6807 - 18475, n=133, last 2 years) | |
| HP Omen 17-db0079ng | |
| CrossMark / Overall | |
| Eurocom Raptor X17 Core i9-14900HX | |
| Average Intel Core i9-14900HX, NVIDIA GeForce RTX 4080 Laptop GPU (1992 - 2334, n=7) | |
| Medion Erazer Beast X40 2024 | |
| SCHENKER XMG Neo 17 E24 | |
| MSI GE78HX 13VH-070US | |
| Average of class Gaming (1247 - 2344, n=114, last 2 years) | |
| HP Omen 17-db0079ng | |
| CrossMark / Productivity | |
| Eurocom Raptor X17 Core i9-14900HX | |
| Medion Erazer Beast X40 2024 | |
| Average Intel Core i9-14900HX, NVIDIA GeForce RTX 4080 Laptop GPU (1812 - 2204, n=7) | |
| MSI GE78HX 13VH-070US | |
| SCHENKER XMG Neo 17 E24 | |
| Average of class Gaming (1299 - 2204, n=114, last 2 years) | |
| HP Omen 17-db0079ng | |
| CrossMark / Creativity | |
| Average Intel Core i9-14900HX, NVIDIA GeForce RTX 4080 Laptop GPU (2327 - 2500, n=7) | |
| SCHENKER XMG Neo 17 E24 | |
| Eurocom Raptor X17 Core i9-14900HX | |
| Medion Erazer Beast X40 2024 | |
| Average of class Gaming (1275 - 2660, n=114, last 2 years) | |
| MSI GE78HX 13VH-070US | |
| HP Omen 17-db0079ng | |
| CrossMark / Responsiveness | |
| Eurocom Raptor X17 Core i9-14900HX | |
| Average Intel Core i9-14900HX, NVIDIA GeForce RTX 4080 Laptop GPU (1520 - 2254, n=7) | |
| Medion Erazer Beast X40 2024 | |
| Average of class Gaming (1030 - 2330, n=114, last 2 years) | |
| MSI GE78HX 13VH-070US | |
| SCHENKER XMG Neo 17 E24 | |
| HP Omen 17-db0079ng | |
| WebXPRT 3 / Overall | |
| Eurocom Raptor X17 Core i9-14900HX | |
| SCHENKER XMG Neo 17 E24 | |
| Average Intel Core i9-14900HX, NVIDIA GeForce RTX 4080 Laptop GPU (310 - 345, n=7) | |
| Medion Erazer Beast X40 2024 | |
| MSI GE78HX 13VH-070US | |
| Average of class Gaming (215 - 480, n=127, last 2 years) | |
| HP Omen 17-db0079ng | |
| WebXPRT 4 / Overall | |
| SCHENKER XMG Neo 17 E24 | |
| Average Intel Core i9-14900HX, NVIDIA GeForce RTX 4080 Laptop GPU (300 - 321, n=7) | |
| Eurocom Raptor X17 Core i9-14900HX | |
| Medion Erazer Beast X40 2024 | |
| MSI GE78HX 13VH-070US | |
| Average of class Gaming (176.4 - 335, n=115, last 2 years) | |
| Mozilla Kraken 1.1 / Total | |
| HP Omen 17-db0079ng | |
| Average of class Gaming (409 - 674, n=139, last 2 years) | |
| MSI GE78HX 13VH-070US | |
| Eurocom Raptor X17 Core i9-14900HX | |
| Average Intel Core i9-14900HX, NVIDIA GeForce RTX 4080 Laptop GPU (437 - 446, n=7) | |
| SCHENKER XMG Neo 17 E24 | |
| Medion Erazer Beast X40 2024 | |
* ... smaller is better
| PCMark 10 Score | 8694 points | |
Help | ||
| AIDA64 / Memory Copy | |
| Medion Erazer Beast X40 2024 | |
| SCHENKER XMG Neo 17 E24 | |
| MSI GE78HX 13VH-070US | |
| Eurocom Raptor X17 Core i9-14900HX | |
| Average Intel Core i9-14900HX (38028 - 83392, n=36) | |
| HP Omen 17-db0079ng | |
| Average of class Gaming (21750 - 97515, n=147, last 2 years) | |
| AIDA64 / Memory Read | |
| SCHENKER XMG Neo 17 E24 | |
| MSI GE78HX 13VH-070US | |
| Medion Erazer Beast X40 2024 | |
| Average Intel Core i9-14900HX (43306 - 87568, n=36) | |
| Eurocom Raptor X17 Core i9-14900HX | |
| Average of class Gaming (22956 - 102937, n=147, last 2 years) | |
| HP Omen 17-db0079ng | |
| AIDA64 / Memory Write | |
| HP Omen 17-db0079ng | |
| Medion Erazer Beast X40 2024 | |
| SCHENKER XMG Neo 17 E24 | |
| MSI GE78HX 13VH-070US | |
| Eurocom Raptor X17 Core i9-14900HX | |
| Average Intel Core i9-14900HX (37146 - 80589, n=36) | |
| Average of class Gaming (22297 - 108954, n=147, last 2 years) | |
| AIDA64 / Memory Latency | |
| HP Omen 17-db0079ng | |
| Average of class Gaming (59.5 - 259, n=147, last 2 years) | |
| Eurocom Raptor X17 Core i9-14900HX | |
| Average Intel Core i9-14900HX (76.1 - 105, n=36) | |
| MSI GE78HX 13VH-070US | |
| SCHENKER XMG Neo 17 E24 | |
| Medion Erazer Beast X40 2024 | |
* ... smaller is better
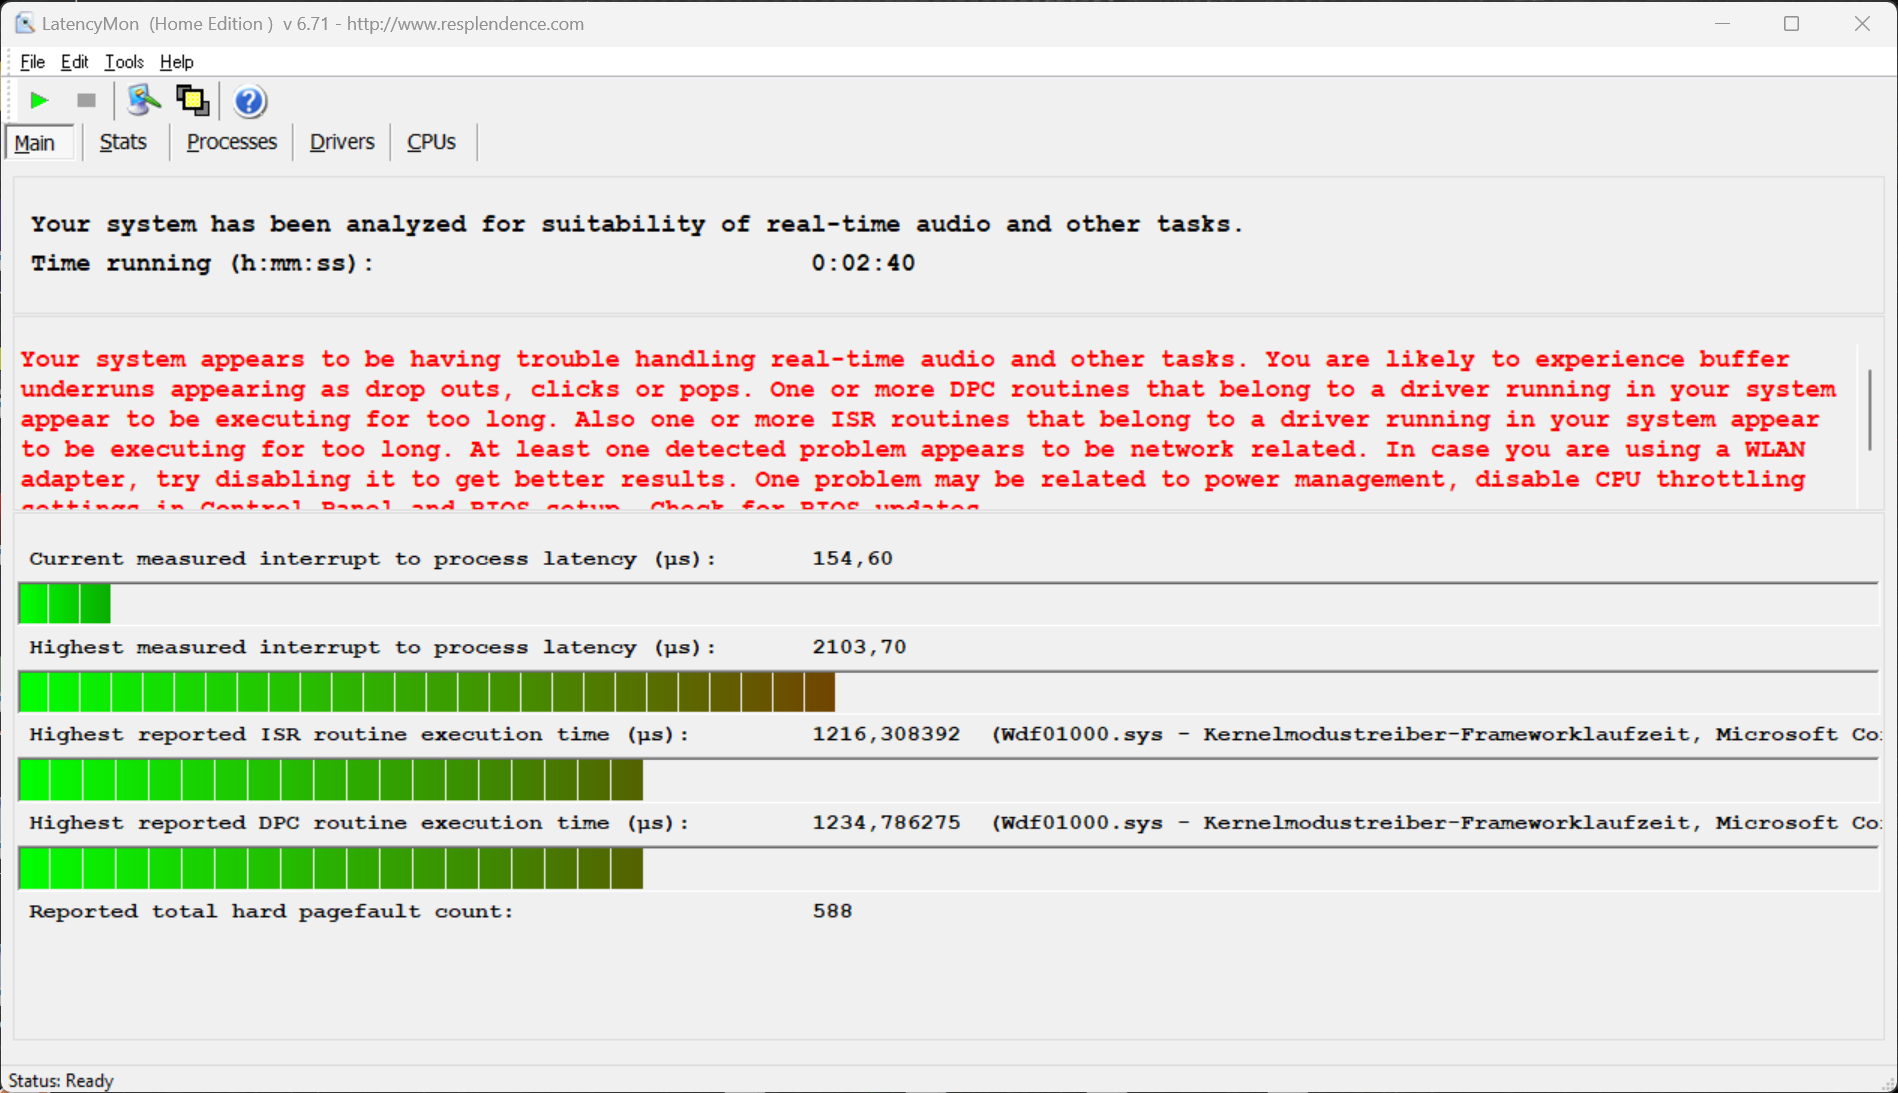
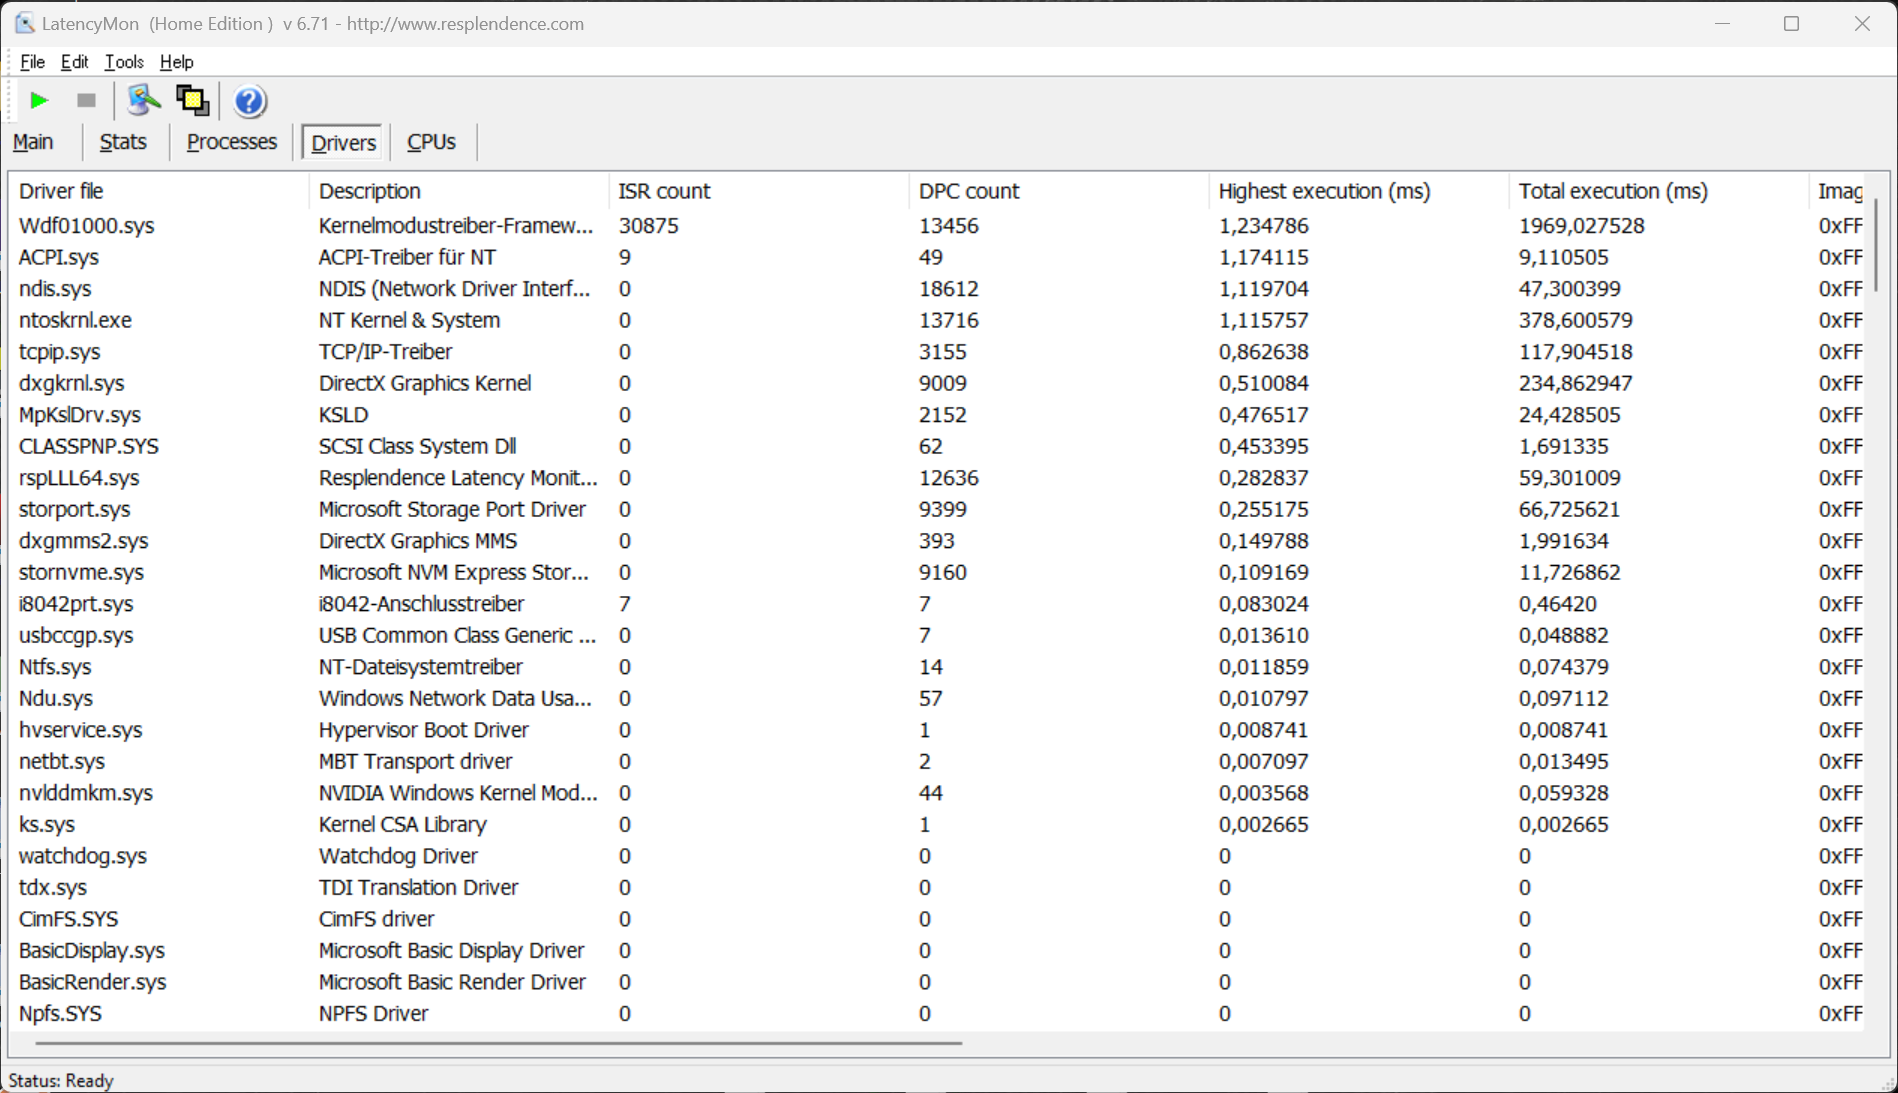
DPC 延迟
在我们的标准化延迟测试(上网、4K YouTube 播放、CPU 负载)中,采用测试 BIOS 版本的系统在使用实时音频应用程序时表现出了局限性。
| DPC Latencies / LatencyMon - interrupt to process latency (max), Web, Youtube, Prime95 | |
| MSI GE78HX 13VH-070US | |
| SCHENKER XMG Neo 17 E24 | |
| HP Omen 17-db0079ng | |
| Medion Erazer Beast X40 2024 | |
| Eurocom Raptor X17 Core i9-14900HX | |
* ... smaller is better
大容量存储器
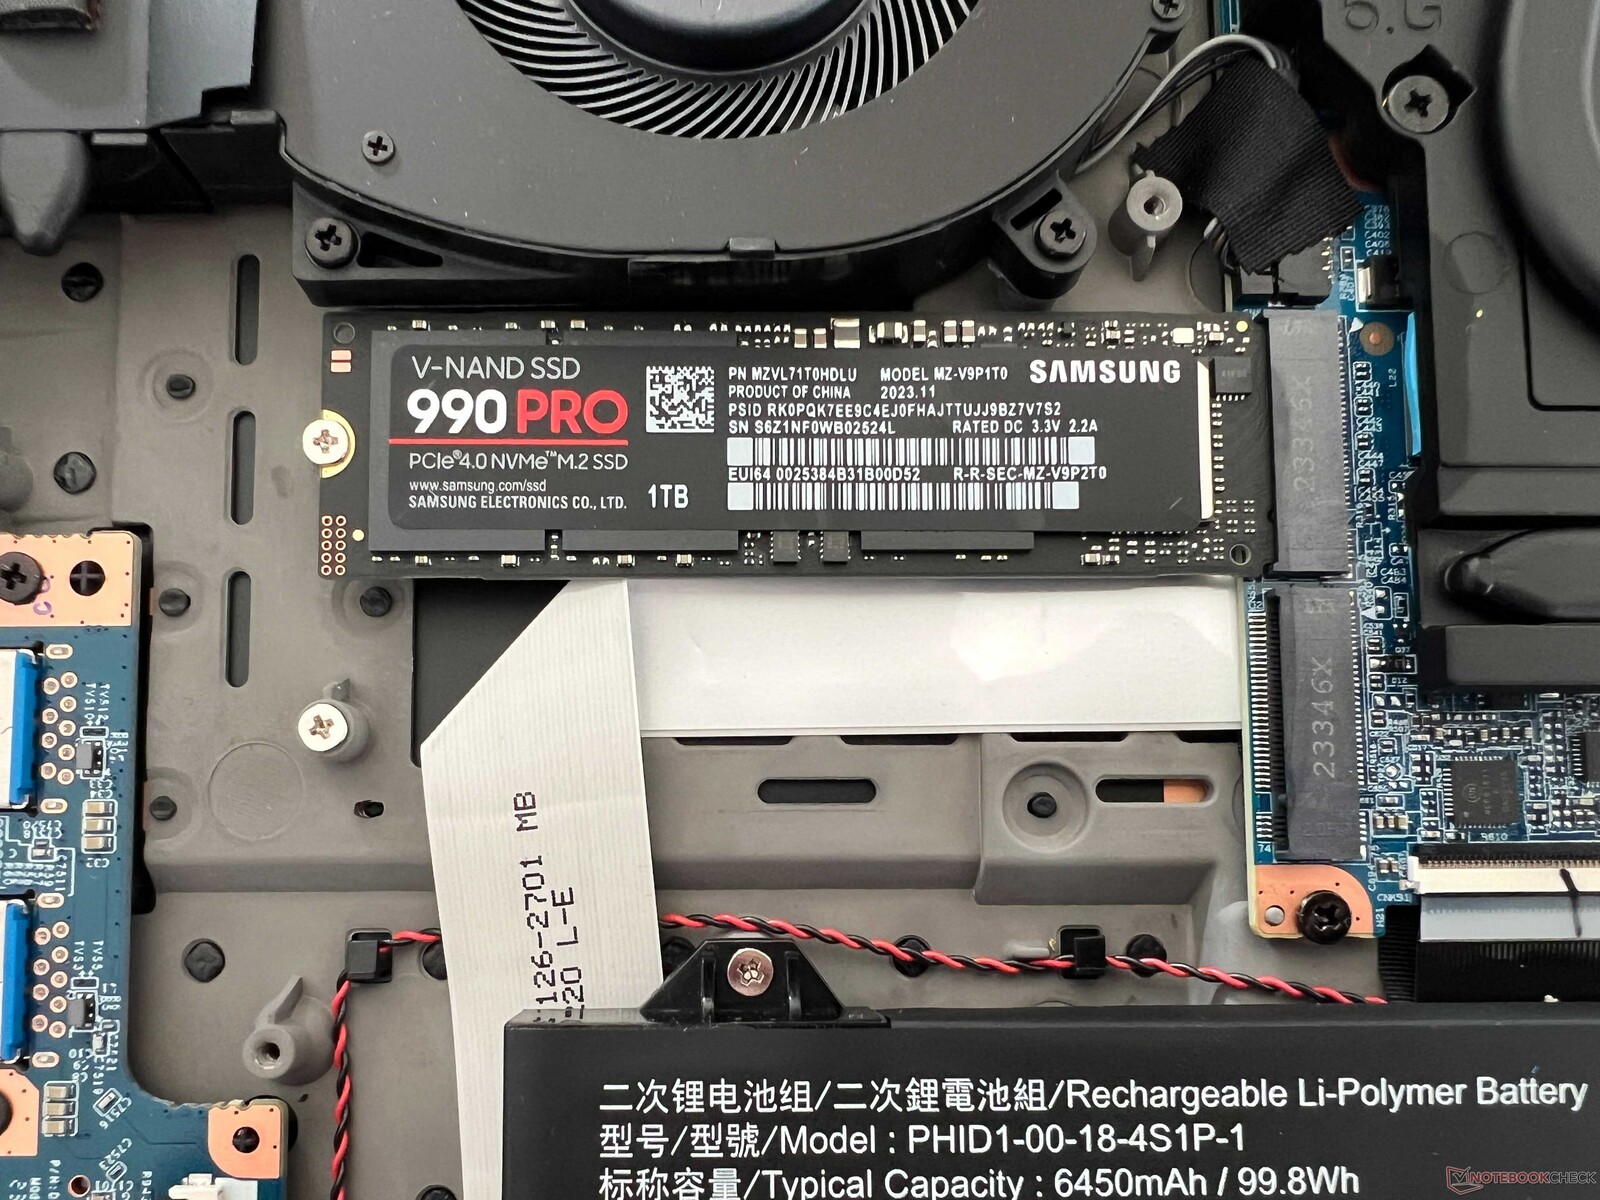
Neo 17 提供两个通过 PCIe 4.0 x4 连接的快速 M.2-2280 插槽。测试设备中安装的是 1 TB 版本的三星 990 Pro,可实现快速传输速率,是市场上速度最快的固态硬盘之一。此外,即使在持续负载的情况下,性能也能保持完全稳定。初始启动后,用户可使用 864 GB。更多固态硬盘基准测试 这里.

* ... smaller is better
Continuous read: DiskSpd Read Loop, Queue Depth 8
图形卡
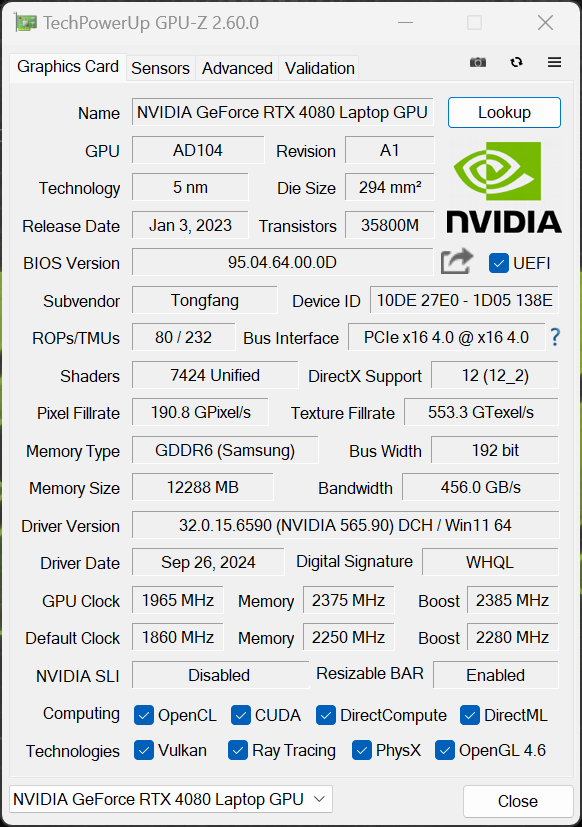
在我们的测试设备中,专用 NvidiaGeForce RTX 4080 笔记本电脑安装了 12GB VRAM。显卡的最大功耗为 175 瓦(150 瓦 TGP + 25 瓦 Dynamic Boost),因此 Neo 17 可以充分利用 GPU。得益于高级 Optimus 图形切换功能,RTX 4080 笔记本电脑的游戏性能非常出色,完全可以满足原生 QHD 分辨率的要求。此外,即使在持续负载的情况下,性能也能保持完全稳定。
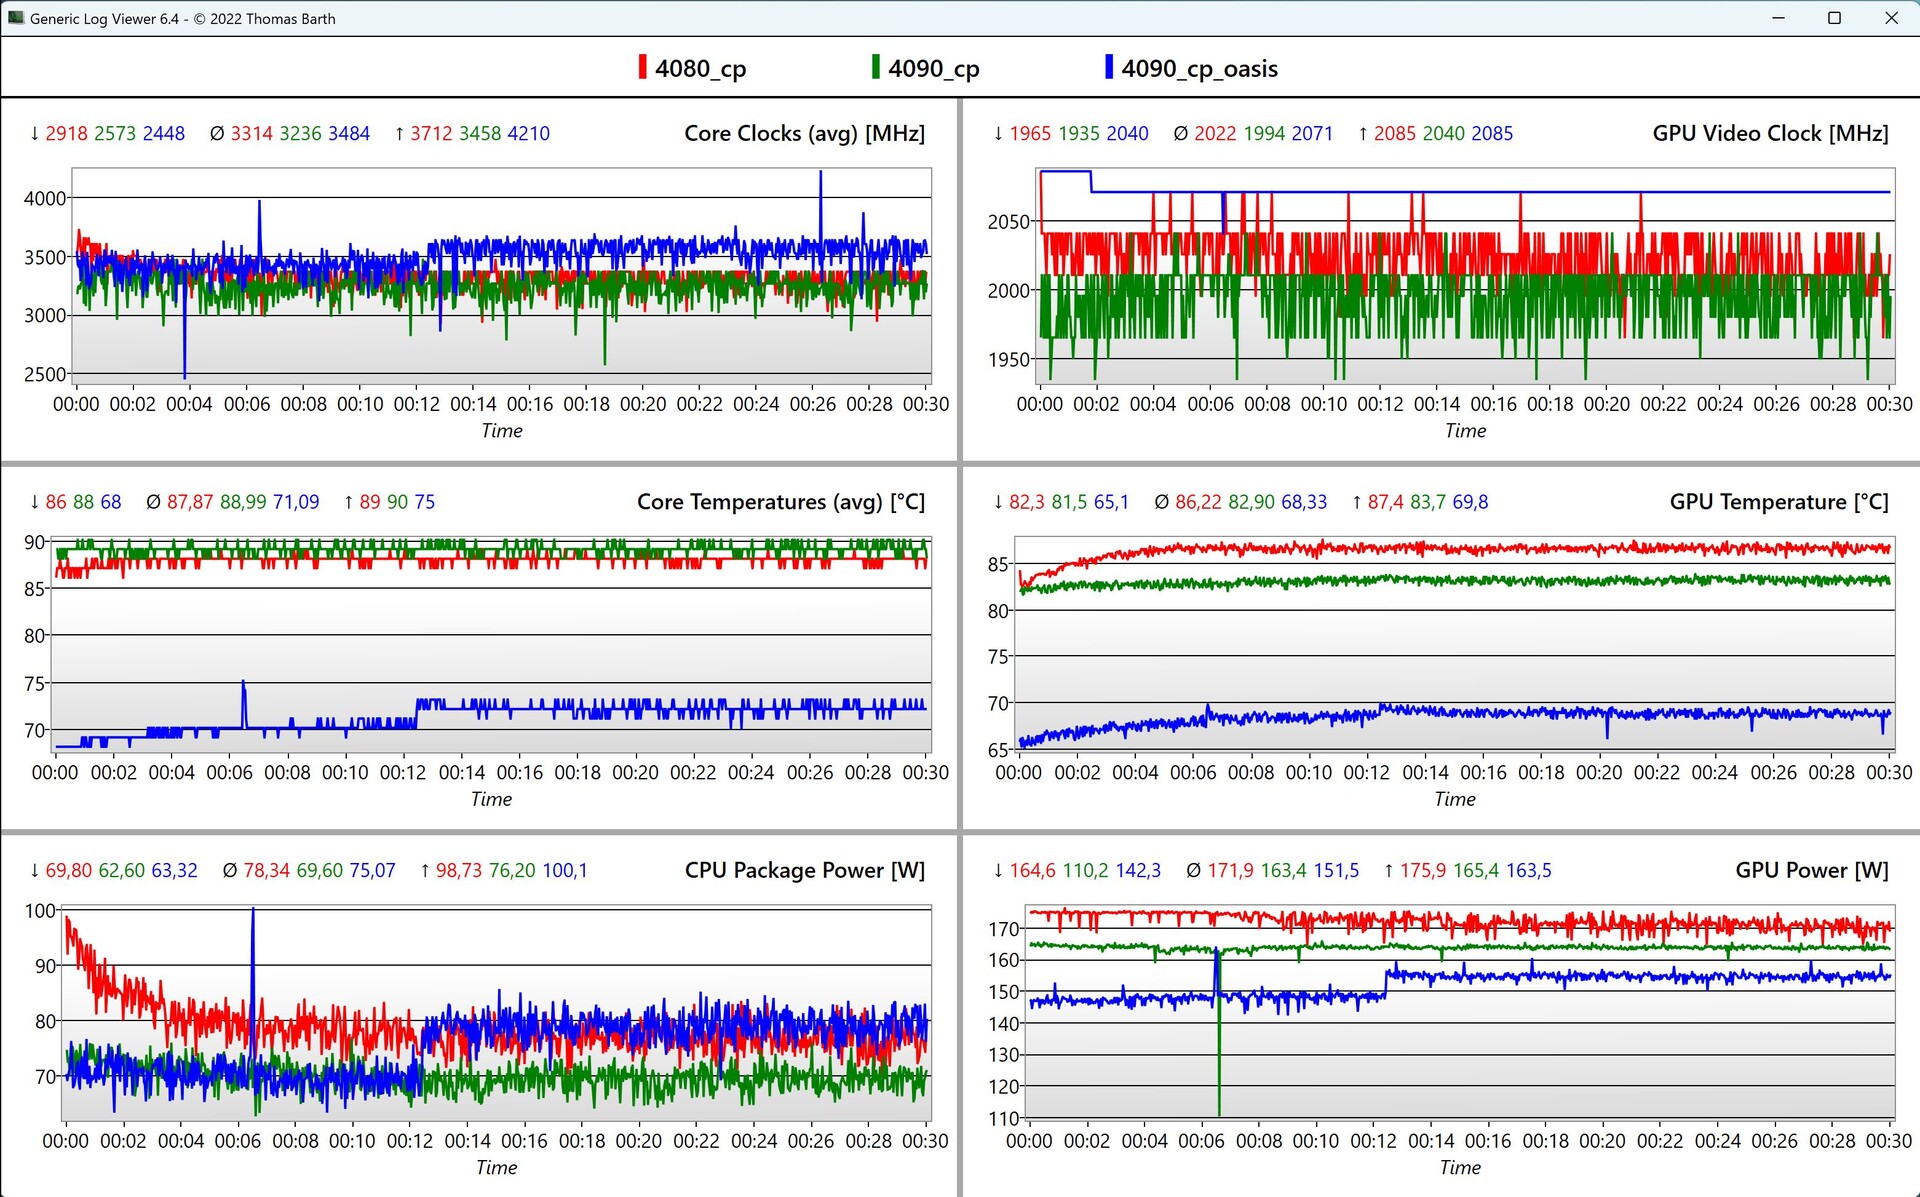
在我们的《赛博朋克 2077》环路中比较 CPU/GPU 数据时,外部水冷的优势非常明显,因为 CPU/GPU 温度降低了约 20 °C,这也是风扇工作更少的原因。
在电池模式下,GPU 的功耗限制在 52 瓦,因此 GPU 性能降低了约 53%。更多 GPU 基准测试 这里.
| 3DMark Performance Rating - Percent | |
| Eurocom Raptor X17 Core i9-14900HX | |
| SCHENKER Neo 17 2024 Engineering Sample -1! | |
| Medion Erazer Beast X40 2024 | |
| SCHENKER XMG Neo 17 E24 | |
| MSI GE78HX 13VH-070US | |
| Average NVIDIA GeForce RTX 4080 Laptop GPU | |
| HP Omen 17-db0079ng | |
| Average of class Gaming | |
| 3DMark 11 - 1280x720 Performance GPU | |
| SCHENKER Neo 17 2024 Engineering Sample | |
| Medion Erazer Beast X40 2024 | |
| Eurocom Raptor X17 Core i9-14900HX | |
| SCHENKER XMG Neo 17 E24 | |
| MSI GE78HX 13VH-070US | |
| Average NVIDIA GeForce RTX 4080 Laptop GPU (45199 - 63128, n=24) | |
| HP Omen 17-db0079ng | |
| Average of class Gaming (10741 - 72178, n=143, last 2 years) | |
| 3DMark 11 Performance | 45722 points | |
| 3DMark Fire Strike Score | 34851 points | |
| 3DMark Time Spy Score | 18980 points | |
Help | ||
| Blender / v3.3 Classroom OPTIX/RTX | |
| HP Omen 17-db0079ng | |
| Average of class Gaming (10 - 95, n=143, last 2 years) | |
| Average NVIDIA GeForce RTX 4080 Laptop GPU (13 - 20, n=22) | |
| MSI GE78HX 13VH-070US | |
| SCHENKER XMG Neo 17 E24 | |
| Eurocom Raptor X17 Core i9-14900HX | |
| Medion Erazer Beast X40 2024 | |
| Blender / v3.3 Classroom CUDA | |
| Average of class Gaming (16 - 175, n=145, last 2 years) | |
| HP Omen 17-db0079ng | |
| Average NVIDIA GeForce RTX 4080 Laptop GPU (21 - 28, n=23) | |
| MSI GE78HX 13VH-070US | |
| SCHENKER XMG Neo 17 E24 | |
| Eurocom Raptor X17 Core i9-14900HX | |
| Medion Erazer Beast X40 2024 | |
| Blender / v3.3 Classroom CPU | |
| HP Omen 17-db0079ng | |
| Average of class Gaming (123 - 962, n=150, last 2 years) | |
| Medion Erazer Beast X40 2024 | |
| Average NVIDIA GeForce RTX 4080 Laptop GPU (177 - 337, n=23) | |
| Eurocom Raptor X17 Core i9-14900HX | |
| SCHENKER XMG Neo 17 E24 | |
| MSI GE78HX 13VH-070US | |
* ... smaller is better
| Performance Rating - Percent | |
| Eurocom Raptor X17 Core i9-14900HX -1! | |
| SCHENKER Neo 17 2024 Engineering Sample -2! | |
| Medion Erazer Beast X40 2024 -1! | |
| SCHENKER XMG Neo 17 E24 | |
| MSI GE78HX 13VH-070US -2! | |
| Average of class Gaming | |
| HP Omen 17-db0079ng -1! | |
| Cyberpunk 2077 2.2 Phantom Liberty - 1920x1080 Ultra Preset (FSR off) | |
| Eurocom Raptor X17 Core i9-14900HX | |
| SCHENKER XMG Neo 17 E24 | |
| Medion Erazer Beast X40 2024 | |
| HP Omen 17-db0079ng | |
| Average of class Gaming (6.76 - 158, n=90, last 2 years) | |
| Baldur's Gate 3 - 1920x1080 Ultra Preset | |
| Eurocom Raptor X17 Core i9-14900HX | |
| Average of class Gaming (34.5 - 208, n=57, last 2 years) | |
| SCHENKER XMG Neo 17 E24 | |
| GTA V - 1920x1080 Highest Settings possible AA:4xMSAA + FX AF:16x | |
| Eurocom Raptor X17 Core i9-14900HX | |
| SCHENKER XMG Neo 17 E24 | |
| SCHENKER Neo 17 2024 Engineering Sample | |
| Medion Erazer Beast X40 2024 | |
| Average of class Gaming (12.1 - 168.2, n=132, last 2 years) | |
| HP Omen 17-db0079ng | |
| MSI GE78HX 13VH-070US | |
| Final Fantasy XV Benchmark - 1920x1080 High Quality | |
| SCHENKER Neo 17 2024 Engineering Sample | |
| Medion Erazer Beast X40 2024 | |
| SCHENKER XMG Neo 17 E24 | |
| MSI GE78HX 13VH-070US | |
| HP Omen 17-db0079ng | |
| Average of class Gaming (19.2 - 201, n=144, last 2 years) | |
| Strange Brigade - 1920x1080 ultra AA:ultra AF:16 | |
| Eurocom Raptor X17 Core i9-14900HX | |
| SCHENKER Neo 17 2024 Engineering Sample | |
| Medion Erazer Beast X40 2024 | |
| SCHENKER XMG Neo 17 E24 | |
| MSI GE78HX 13VH-070US | |
| Average of class Gaming (38.9 - 420, n=140, last 2 years) | |
| HP Omen 17-db0079ng | |
| Dota 2 Reborn - 1920x1080 ultra (3/3) best looking | |
| Eurocom Raptor X17 Core i9-14900HX | |
| Medion Erazer Beast X40 2024 | |
| SCHENKER Neo 17 2024 Engineering Sample | |
| SCHENKER XMG Neo 17 E24 | |
| Average of class Gaming (65.1 - 220, n=148, last 2 years) | |
| MSI GE78HX 13VH-070US | |
| HP Omen 17-db0079ng | |
| X-Plane 11.11 - 1920x1080 high (fps_test=3) | |
| Eurocom Raptor X17 Core i9-14900HX | |
| Medion Erazer Beast X40 2024 | |
| SCHENKER XMG Neo 17 E24 | |
| MSI GE78HX 13VH-070US | |
| SCHENKER Neo 17 2024 Engineering Sample | |
| Average of class Gaming (32.8 - 166.2, n=151, last 2 years) | |
| HP Omen 17-db0079ng | |
Cyberpunk 2077 Ultra FPS chart
| low | med. | high | ultra | QHD DLSS | QHD | 4K | |
|---|---|---|---|---|---|---|---|
| GTA V (2015) | 181.7 | 143.4 | 135.1 | 163.7 | |||
| Dota 2 Reborn (2015) | 220 | 197.1 | 194 | 179.7 | |||
| Final Fantasy XV Benchmark (2018) | 226 | 215 | 173.9 | 134.4 | |||
| X-Plane 11.11 (2018) | 202 | 176.8 | 138.9 | ||||
| Far Cry 5 (2018) | 179 | 162 | 157 | ||||
| Strange Brigade (2018) | 381 | 347 | 239 | 122 | |||
| Shadow of the Tomb Raider (2018) | 212 | 176 | |||||
| Far Cry 6 (2021) | 156 | 141 | |||||
| F1 23 (2023) | 321 | 111.6 | 70.7 | 35.5 | |||
| Baldur's Gate 3 (2023) | 231 | 143 | 122.2 | 111.8 | 88.3 | ||
| Cyberpunk 2077 2.2 Phantom Liberty (2023) | 101.1 | 146.9 | 133.8 | 121.3 | 110.1 | 80.7 | |
| Assassin's Creed Mirage (2023) | 197 | 153 | 129 | ||||
| Call of Duty Modern Warfare 3 2023 (2023) | 180 | 171 | 123 | ||||
| Avatar Frontiers of Pandora (2023) | 125 | 97 | 66 | ||||
| F1 24 (2024) | 304 | 323 | 289 | 112.2 | 71.2 |
排放与能源
噪音排放
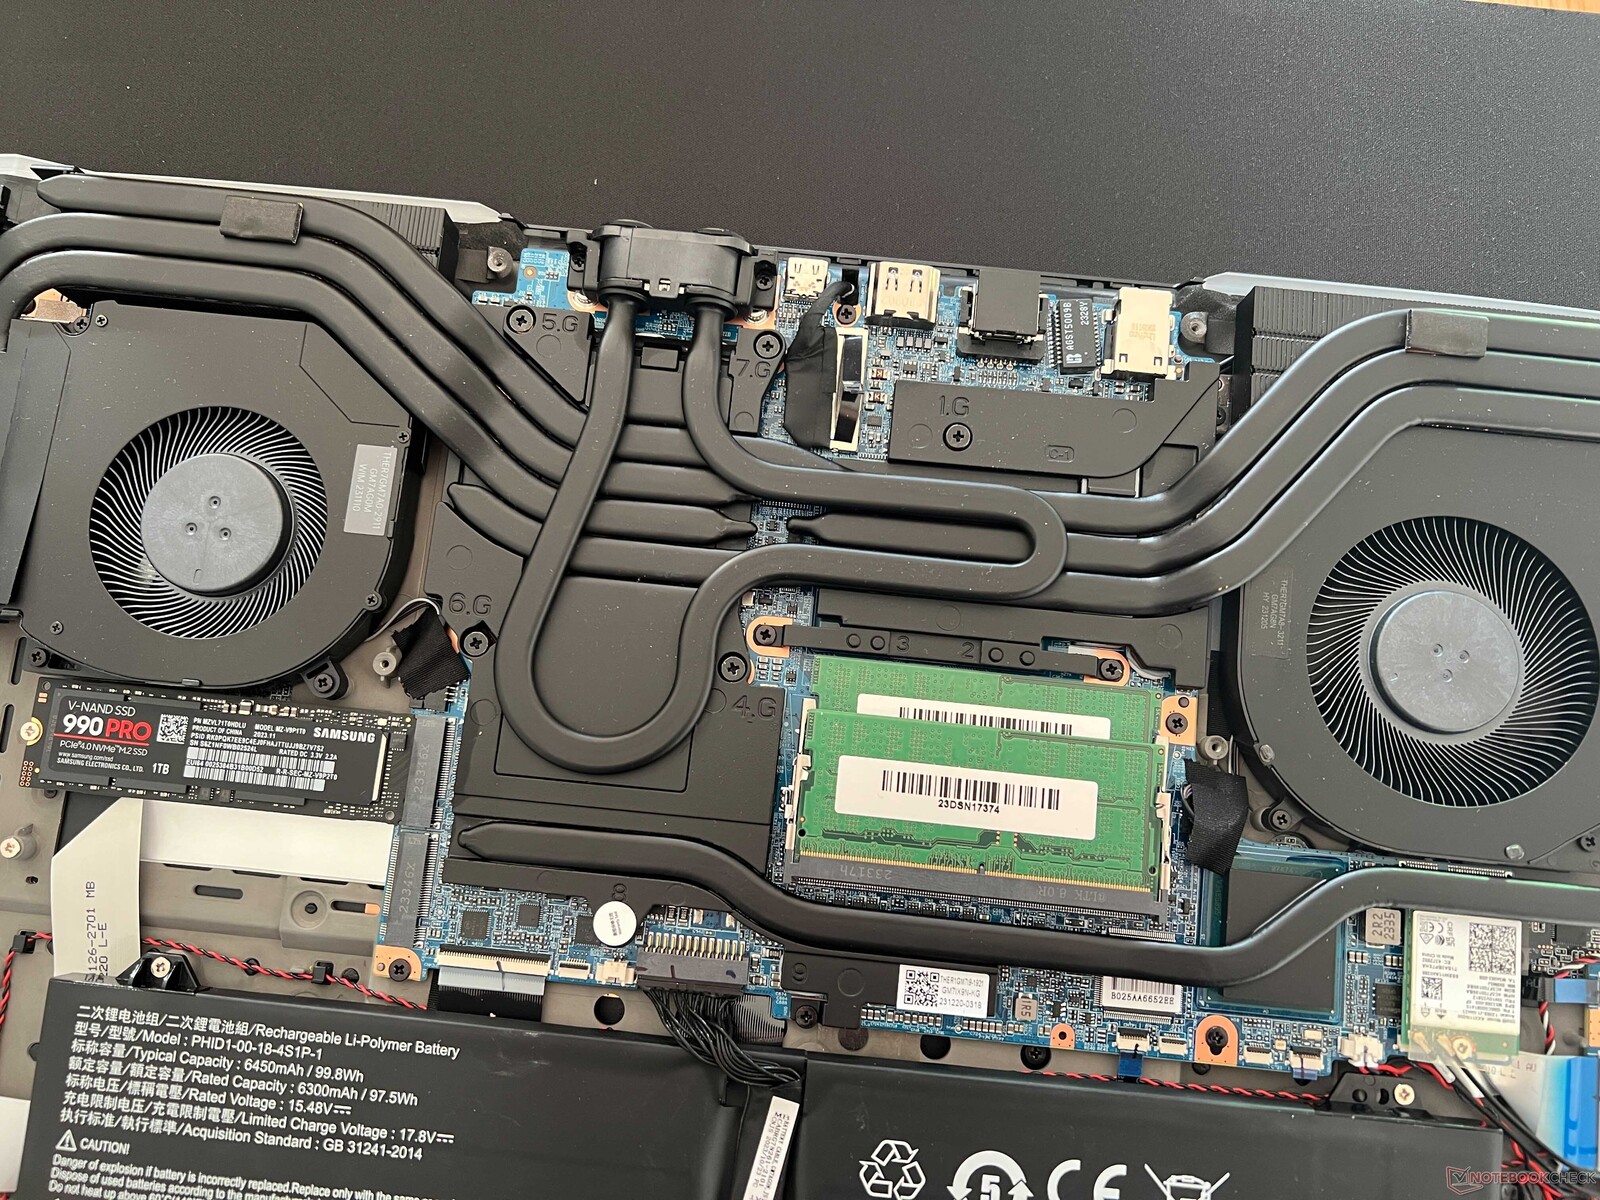
带有两个风扇的散热系统与去年的型号基本相同,但配备 RTX 4080/4090 的 Neo 17 笔记本电脑提供了一个改进的水冷通道,现在还可以直接在 CPU 上运行。风扇一直在运转,但在执行非常简单的任务(上网、收发电子邮件、观看视频)时,只能听到非常小的噪音。但在游戏时,噪音会明显增大,达到 52 分贝(A)。虽然有更大音量的竞争对手,但在游戏时还是应该使用耳机。在基准测试/游戏过程中,还能听到一些轻微的线圈啸叫声。
Noise Level
| Idle |
| 28.1 / 28.1 / 28.1 dB(A) |
| HDD |
| 0 dB(A) |
| Load |
| 43.1 / 51.9 dB(A) |
 | ||
30 dB silent 40 dB(A) audible 50 dB(A) loud |
||
min: | ||
| SCHENKER XMG Neo 17 E24 NVIDIA GeForce RTX 4080 Laptop GPU, i9-14900HX, Samsung 990 Pro 1 TB | Medion Erazer Beast X40 2024 NVIDIA GeForce RTX 4090 Laptop GPU, i9-14900HX, Phison E18-1TB-PHISON-SSD-BICS5 | HP Omen 17-db0079ng NVIDIA GeForce RTX 4070 Laptop GPU, R7 8845HS, WD PC SN560 SDDPNQE-1T00 | Eurocom Raptor X17 Core i9-14900HX NVIDIA GeForce RTX 4090 Laptop GPU, i9-14900HX, Corsair MP700 Pro 2TB | MSI GE78HX 13VH-070US NVIDIA GeForce RTX 4080 Laptop GPU, i9-13950HX, Samsung PM9A1 MZVL22T0HBLB | |
|---|---|---|---|---|---|
| Noise | -6% | -2% | -7% | -0% | |
| off / environment * | 23.3 | 25 -7% | 25 -7% | 23.7 -2% | 23.4 -0% |
| Idle Minimum * | 28.1 | 28 -0% | 25 11% | 31.7 -13% | 24.2 14% |
| Idle Average * | 28.1 | 29 -3% | 29 -3% | 31.7 -13% | 25.6 9% |
| Idle Maximum * | 28.1 | 32 -14% | 33 -17% | 32.9 -17% | 31 -10% |
| Load Average * | 43.1 | 48 -11% | 45 -4% | 34 21% | 43.3 -0% |
| Cyberpunk 2077 ultra * | 51.9 | 48 8% | |||
| Load Maximum * | 51.9 | 52 -0% | 52 -0% | 61.6 -19% | 59.1 -14% |
| Witcher 3 ultra * | 50 | 61.6 | 56.3 |
* ... smaller is better
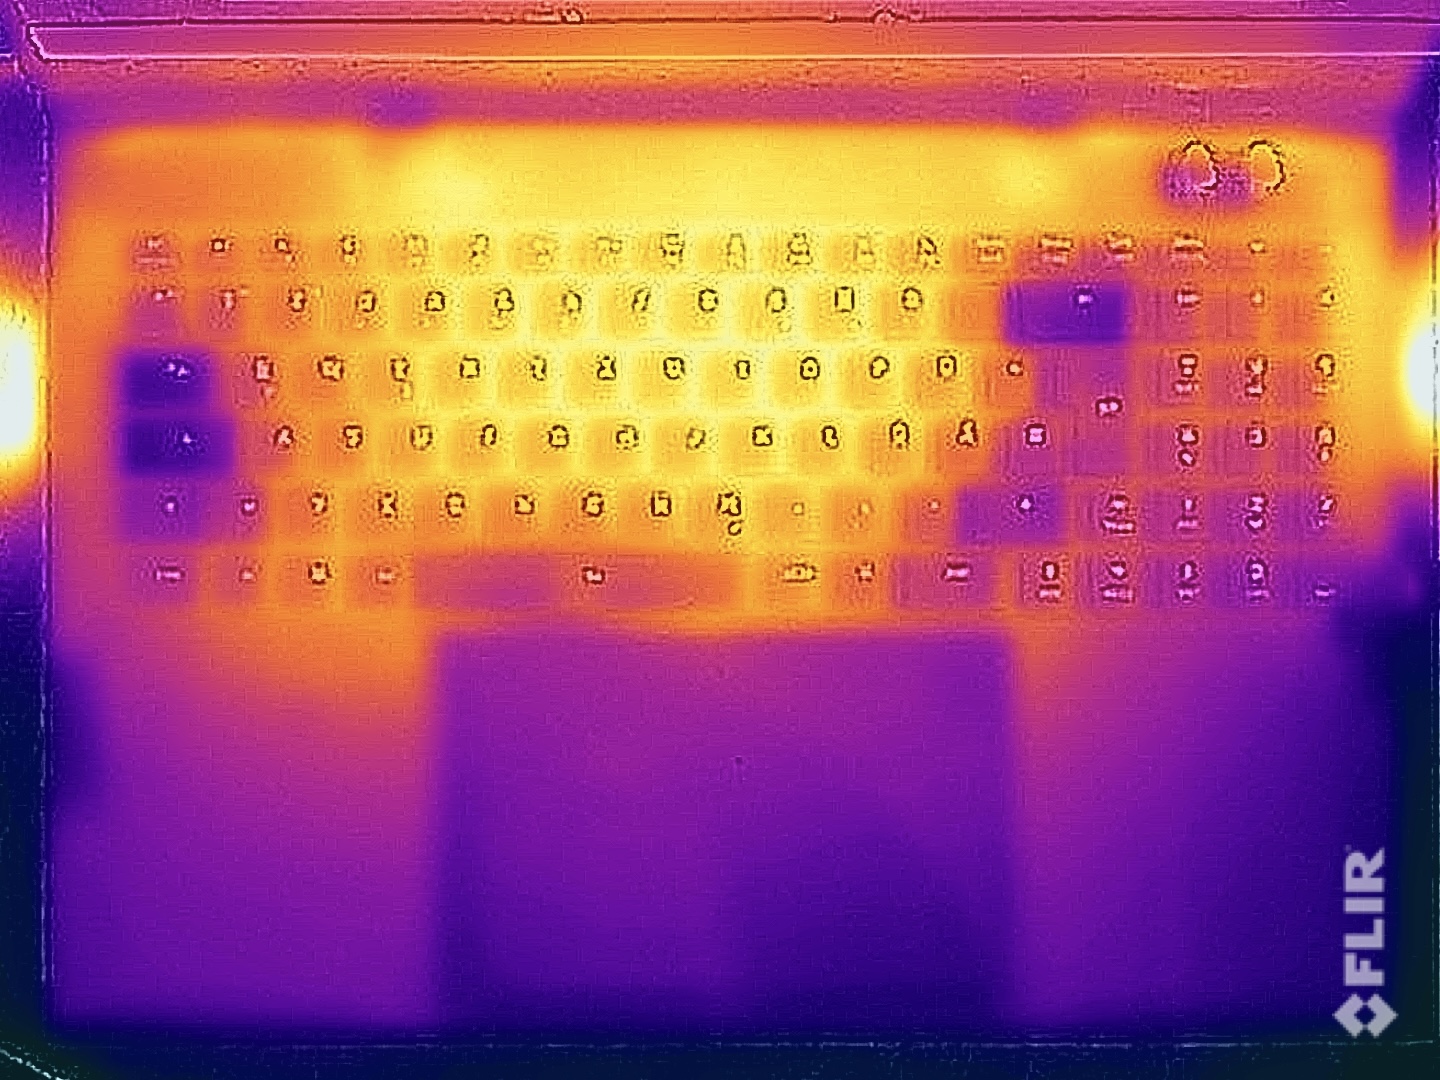
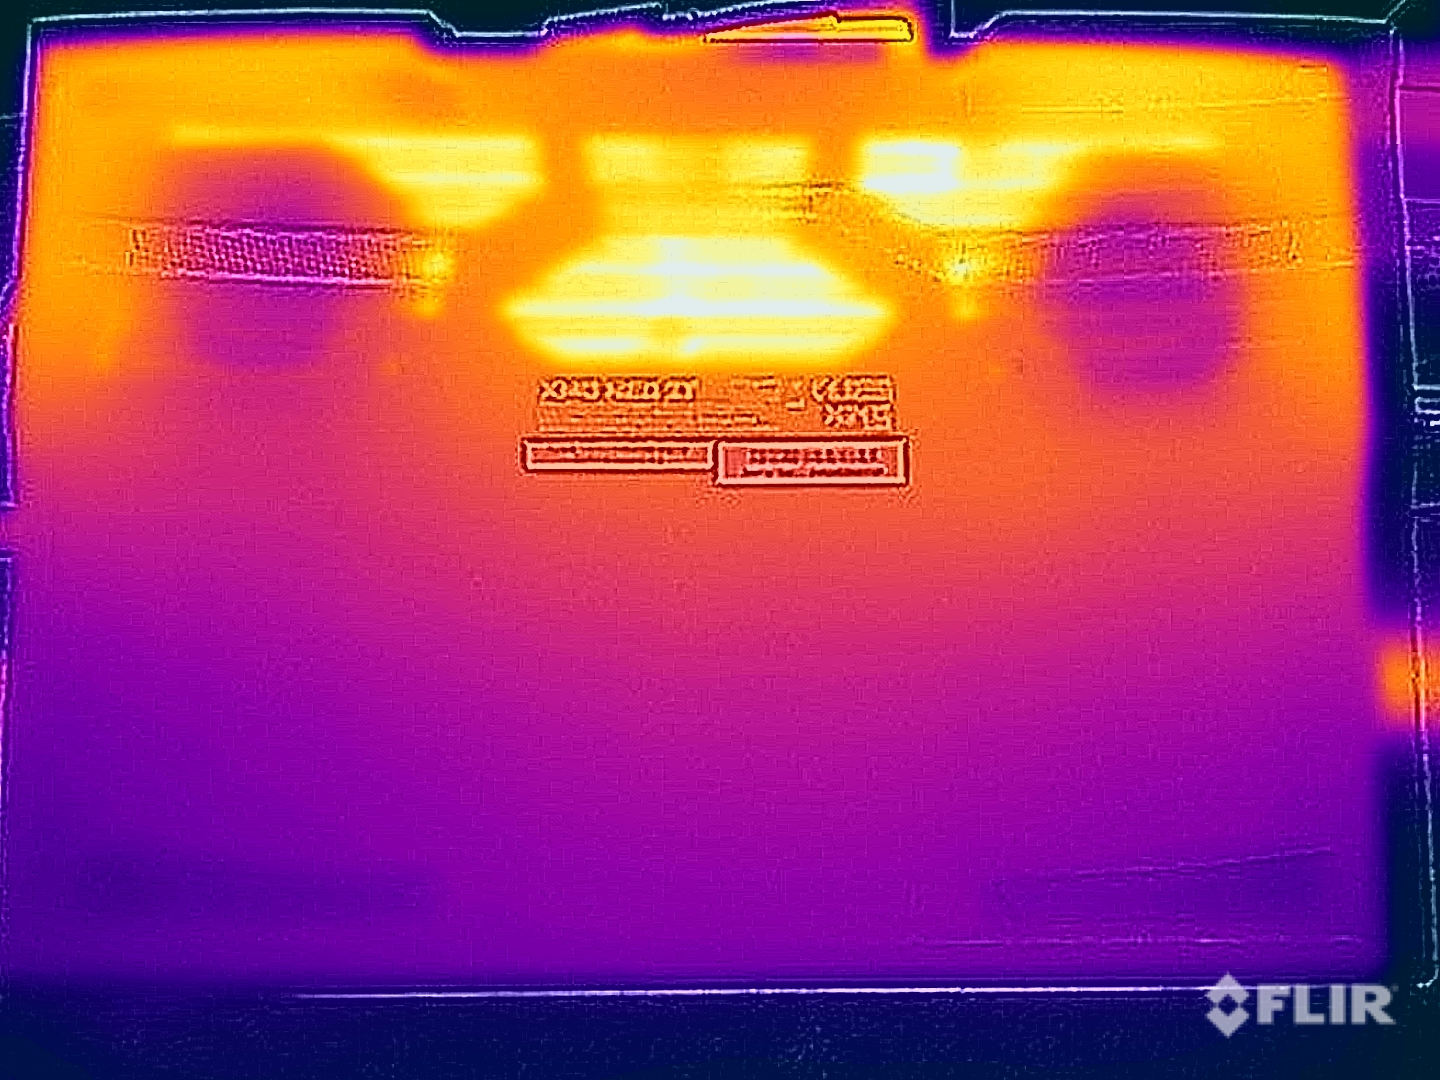
温度
从 RTX 4080 笔记本电脑开始,申克为 CPU 和 GPU 配置了液态金属散热接口。在执行简单任务时,机箱温度保持低温,但在负载情况下,我们在某些位置测得机箱底部温度超过 50 °C。不过,由于 Neo 17 的尺寸,它不会放在你的大腿上,所以这些数值不成问题。键盘区域的发热也很明显,但没有任何限制。在压力测试中,显卡稳定在 160 瓦,处理器稳定在 70 瓦左右。

(-) The maximum temperature on the upper side is 46.2 °C / 115 F, compared to the average of 40.4 °C / 105 F, ranging from 21.2 to 68.8 °C for the class Gaming.
(-) The bottom heats up to a maximum of 56.7 °C / 134 F, compared to the average of 43.2 °C / 110 F
(+) In idle usage, the average temperature for the upper side is 28.2 °C / 83 F, compared to the device average of 33.9 °C / 93 F.
(-) 3: The average temperature for the upper side is 39.8 °C / 104 F, compared to the average of 33.9 °C / 93 F for the class Gaming.
(+) The palmrests and touchpad are reaching skin temperature as a maximum (33.5 °C / 92.3 F) and are therefore not hot.
(-) The average temperature of the palmrest area of similar devices was 28.9 °C / 84 F (-4.6 °C / -8.3 F).
| SCHENKER XMG Neo 17 E24 Intel Core i9-14900HX, NVIDIA GeForce RTX 4080 Laptop GPU | Medion Erazer Beast X40 2024 Intel Core i9-14900HX, NVIDIA GeForce RTX 4090 Laptop GPU | HP Omen 17-db0079ng AMD Ryzen 7 8845HS, NVIDIA GeForce RTX 4070 Laptop GPU | Eurocom Raptor X17 Core i9-14900HX Intel Core i9-14900HX, NVIDIA GeForce RTX 4090 Laptop GPU | MSI GE78HX 13VH-070US Intel Core i9-13950HX, NVIDIA GeForce RTX 4080 Laptop GPU | |
|---|---|---|---|---|---|
| Heat | 1% | 14% | 1% | 10% | |
| Maximum Upper Side * | 46.2 | 47 -2% | 44 5% | 52.2 -13% | 37.4 19% |
| Maximum Bottom * | 56.7 | 54 5% | 45 21% | 53.2 6% | 45 21% |
| Idle Upper Side * | 29.8 | 30 -1% | 26 13% | 28.6 4% | 29.8 -0% |
| Idle Bottom * | 32 | 32 -0% | 27 16% | 29.8 7% | 32.4 -1% |
* ... smaller is better
发言人
立体声扬声器的效果不是特别好,但偶尔播放 YouTube 视频还是足够的。不过,由于风扇声音较大,扬声器在游戏中并不实用。
SCHENKER XMG Neo 17 E24 audio analysis
(+) | speakers can play relatively loud (83.7 dB)
Bass 100 - 315 Hz
(-) | nearly no bass - on average 19% lower than median
(+) | bass is linear (6% delta to prev. frequency)
Mids 400 - 2000 Hz
(±) | higher mids - on average 6.6% higher than median
(±) | linearity of mids is average (9.4% delta to prev. frequency)
Highs 2 - 16 kHz
(+) | balanced highs - only 3.6% away from median
(±) | linearity of highs is average (7.1% delta to prev. frequency)
Overall 100 - 16.000 Hz
(±) | linearity of overall sound is average (18.3% difference to median)
Compared to same class
» 56% of all tested devices in this class were better, 8% similar, 35% worse
» The best had a delta of 6%, average was 18%, worst was 132%
Compared to all devices tested
» 37% of all tested devices were better, 7% similar, 55% worse
» The best had a delta of 4%, average was 24%, worst was 134%
Medion Erazer Beast X40 2024 audio analysis
(+) | speakers can play relatively loud (88 dB)
Bass 100 - 315 Hz
(±) | reduced bass - on average 14.7% lower than median
(±) | linearity of bass is average (7.2% delta to prev. frequency)
Mids 400 - 2000 Hz
(+) | balanced mids - only 3.7% away from median
(+) | mids are linear (5.8% delta to prev. frequency)
Highs 2 - 16 kHz
(+) | balanced highs - only 2.8% away from median
(+) | highs are linear (6.4% delta to prev. frequency)
Overall 100 - 16.000 Hz
(+) | overall sound is linear (12.1% difference to median)
Compared to same class
» 11% of all tested devices in this class were better, 4% similar, 85% worse
» The best had a delta of 6%, average was 18%, worst was 132%
Compared to all devices tested
» 8% of all tested devices were better, 2% similar, 90% worse
» The best had a delta of 4%, average was 24%, worst was 134%
HP Omen 17-db0079ng audio analysis
(±) | speaker loudness is average but good (80 dB)
Bass 100 - 315 Hz
(-) | nearly no bass - on average 19.1% lower than median
(±) | linearity of bass is average (10.3% delta to prev. frequency)
Mids 400 - 2000 Hz
(+) | balanced mids - only 1.9% away from median
(+) | mids are linear (4.4% delta to prev. frequency)
Highs 2 - 16 kHz
(+) | balanced highs - only 3.8% away from median
(±) | linearity of highs is average (7.8% delta to prev. frequency)
Overall 100 - 16.000 Hz
(+) | overall sound is linear (14.3% difference to median)
Compared to same class
» 25% of all tested devices in this class were better, 7% similar, 69% worse
» The best had a delta of 6%, average was 18%, worst was 132%
Compared to all devices tested
» 16% of all tested devices were better, 4% similar, 80% worse
» The best had a delta of 4%, average was 24%, worst was 134%
Eurocom Raptor X17 Core i9-14900HX audio analysis
(±) | speaker loudness is average but good (74.2 dB)
Bass 100 - 315 Hz
(±) | reduced bass - on average 13.4% lower than median
(±) | linearity of bass is average (10.1% delta to prev. frequency)
Mids 400 - 2000 Hz
(±) | higher mids - on average 6.6% higher than median
(±) | linearity of mids is average (8.6% delta to prev. frequency)
Highs 2 - 16 kHz
(+) | balanced highs - only 2% away from median
(±) | linearity of highs is average (8.5% delta to prev. frequency)
Overall 100 - 16.000 Hz
(±) | linearity of overall sound is average (24% difference to median)
Compared to same class
» 85% of all tested devices in this class were better, 5% similar, 10% worse
» The best had a delta of 6%, average was 18%, worst was 132%
Compared to all devices tested
» 70% of all tested devices were better, 7% similar, 23% worse
» The best had a delta of 4%, average was 24%, worst was 134%
MSI GE78HX 13VH-070US audio analysis
(+) | speakers can play relatively loud (84.4 dB)
Bass 100 - 315 Hz
(±) | reduced bass - on average 8.3% lower than median
(±) | linearity of bass is average (9.3% delta to prev. frequency)
Mids 400 - 2000 Hz
(±) | higher mids - on average 6.8% higher than median
(+) | mids are linear (3.4% delta to prev. frequency)
Highs 2 - 16 kHz
(+) | balanced highs - only 2% away from median
(+) | highs are linear (2.6% delta to prev. frequency)
Overall 100 - 16.000 Hz
(+) | overall sound is linear (12% difference to median)
Compared to same class
» 11% of all tested devices in this class were better, 4% similar, 85% worse
» The best had a delta of 6%, average was 18%, worst was 132%
Compared to all devices tested
» 8% of all tested devices were better, 2% similar, 90% worse
» The best had a delta of 4%, average was 24%, worst was 134%
耗电量
对于一款大型 17 英寸笔记本电脑来说,13 瓦的最大闲置功耗是非常低的。但在游戏时,功耗约为 300 瓦,考虑到较高的 TDP/TGP 值,这也不足为奇。提供的 330 瓦电源装置尺寸适中。不过,2.1 瓦的待机功耗过高。
| Off / Standby | |
| Idle | |
| Load |
|
Key:
min: | |
Power consumption Cyberpunk / Stresstest
Power consumption with external monitor
电池寿命
Neo 17 配备了 99 Wh 电池,在 150 cd/m²(测试设备最大亮度的 58%)的 WLAN 模式下,可实现约 6 小时的正常运行时间。与同类产品相比,这款大型游戏机的续航时间处于中游水平。在设备开启的情况下,充满电需要 107 分钟,大约 45 分钟后,80% 的电池电量即可恢复。
Notebookcheck 总体评分
XMG Neo 17 显然专注于游戏性能,而且性能非常出色。得益于可选的水冷系统,温度和风扇噪音再次大幅降低。亚光 QHD 面板的 240 Hz 和快速响应时间也非常适合游戏。
SCHENKER XMG Neo 17 E24
- 11/27/2024 v8
Andreas Osthoff
 Total Sustainability Score:
 Transparency
The selection of devices to be reviewed is made by our editorial team. The test sample was provided to the author as a loan by the manufacturer or retailer for the purpose of this review. The lender had no influence on this review, nor did the manufacturer receive a copy of this review before publication. There was no obligation to publish this review. We never accept compensation or payment in return for our reviews. As an independent media company, Notebookcheck is not subjected to the authority of manufacturers, retailers or publishers.
This is how Notebookcheck is testing
Every year, Notebookcheck independently reviews hundreds of laptops and smartphones using standardized procedures to ensure that all results are comparable. We have continuously developed our test methods for around 20 years and set industry standards in the process. In our test labs, high-quality measuring equipment is utilized by experienced technicians and editors. These tests involve a multi-stage validation process. Our complex rating system is based on hundreds of well-founded measurements and benchmarks, which maintains objectivity. Further information on our test methods can be found here.
