

Apple MacBook Air 15 M4 评测--无风扇 M4 SoC 领先竞争对手多年
功率更大,价格更低。
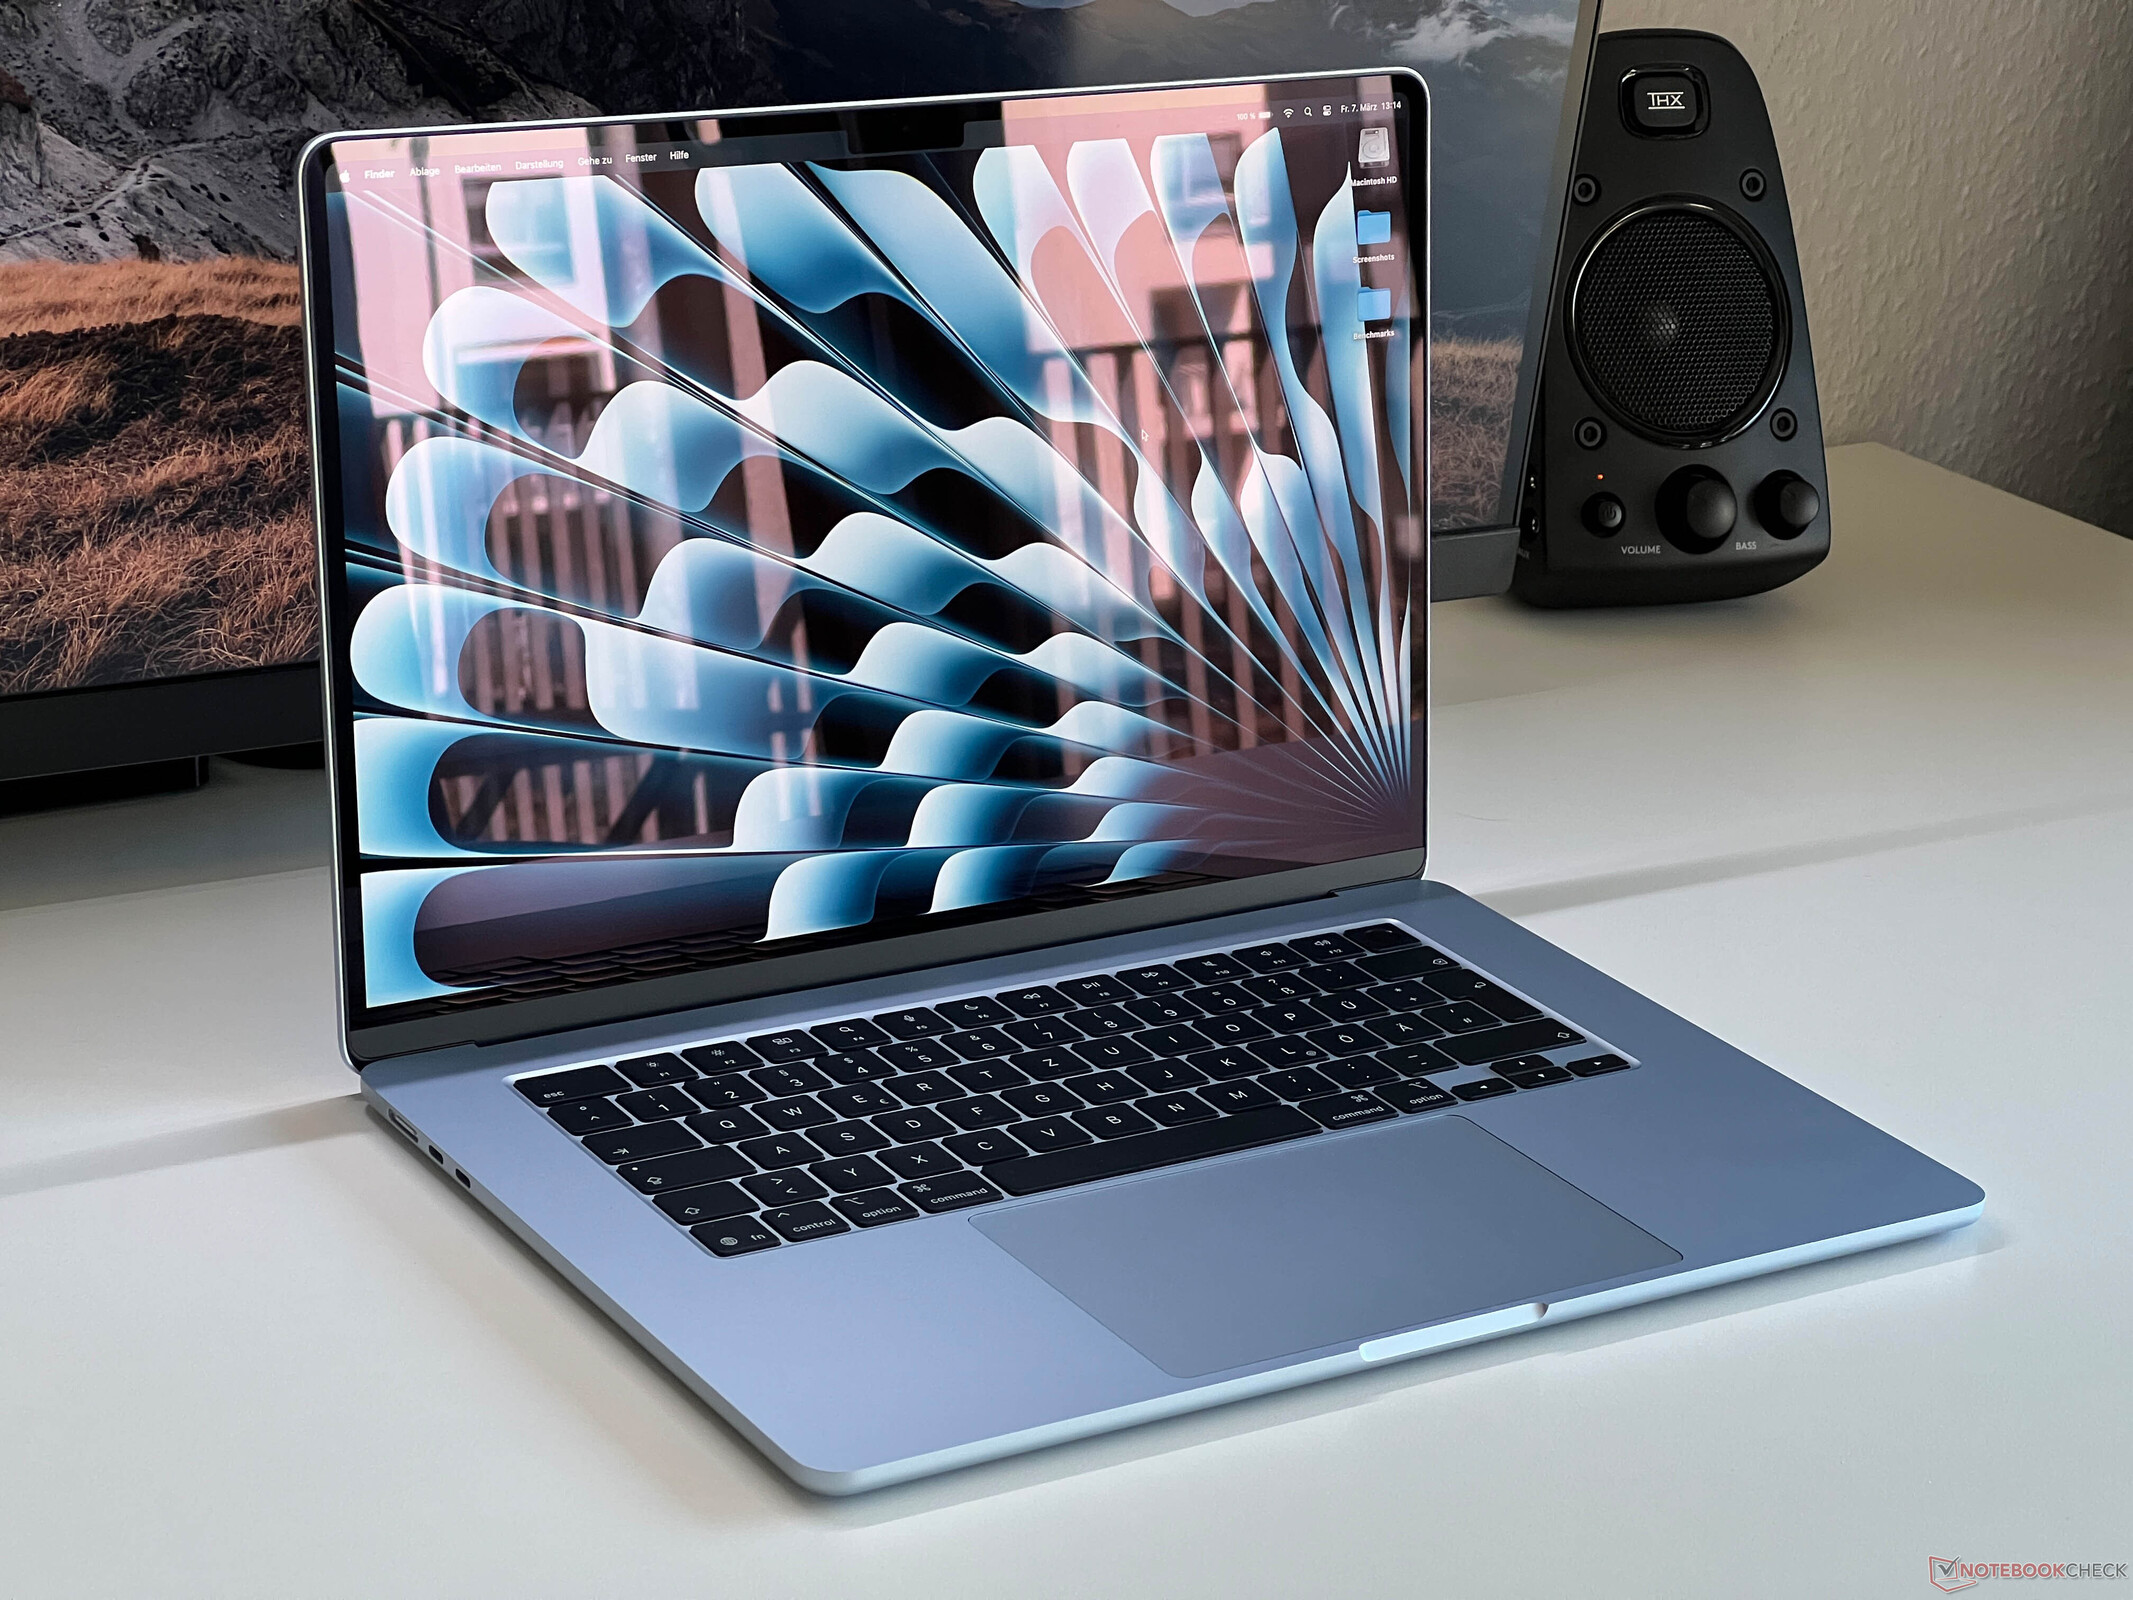
Apple MacBook Air 15 配备了快如闪电的 M4 SoC,但仍采用被动散热方式。它还配备了新的 1200 万像素网络摄像头和新的配色。不过,它的 60 Hz 显示屏没有变化,也没有哑光选项,但 Air 现在便宜了 100 美元。Andreas Osthoff, 👁 Andreas Osthoff (translated by DeepL / Ninh Duy) Published 🇺🇸 🇩🇪 ...
结论:MacBook Air 15 M4 以更低的价格提供更强的性能
即使采用了全新的 M4 处理器,MacBook Air 15 在日常使用中仍然是一款整体性能非常出色的产品,它的高 CPU 性能与被动散热相结合,尤其令人印象深刻。即使在持续负载的情况下,该处理器仍然比英特尔的 Lunar Lake 芯片更快,例如,在单核性能方面,M4 处理器至少领先竞争对手两代。在没有风扇的情况下,Windows 世界中根本没有其他设备能达到如此快的速度。
Apple 还将入门级产品的价格降低了 100 美元,但内存和固态硬盘存储的高额附加费以及缺乏可用的维护选项等问题依然没有改变。
它的显示屏也没有任何变化,这可能会让一些消费者失望。如果你想要哑光屏或 120 Hz,你还是得换成更笨重、更昂贵的 MacBook Pro。即便如此,它的 IPS 显示屏在没有 PWM 的情况下仍能提供出色的图像质量。IPS 屏幕需要消耗大量电能,尤其是在高亮度情况下,但总体而言,这款笔记本电脑的电池续航时间仍然一如既往地出色。不过,一些竞争对手,如 ThinkPad X9等竞争对手在图像质量和电池续航时间方面都占据了上风。
MacBook Air 当然可以做得更好,但你也必须考虑到它在产品系列中的地位,因为它是Apple 价格最实惠的系列。此外,配备哑光显示屏和 120 Hz 频率的 MacBook Air 15 自然会影响 MacBook Pro 14 M4 的销售数字。 MacBook Pro 14 M4.
Pros
Cons
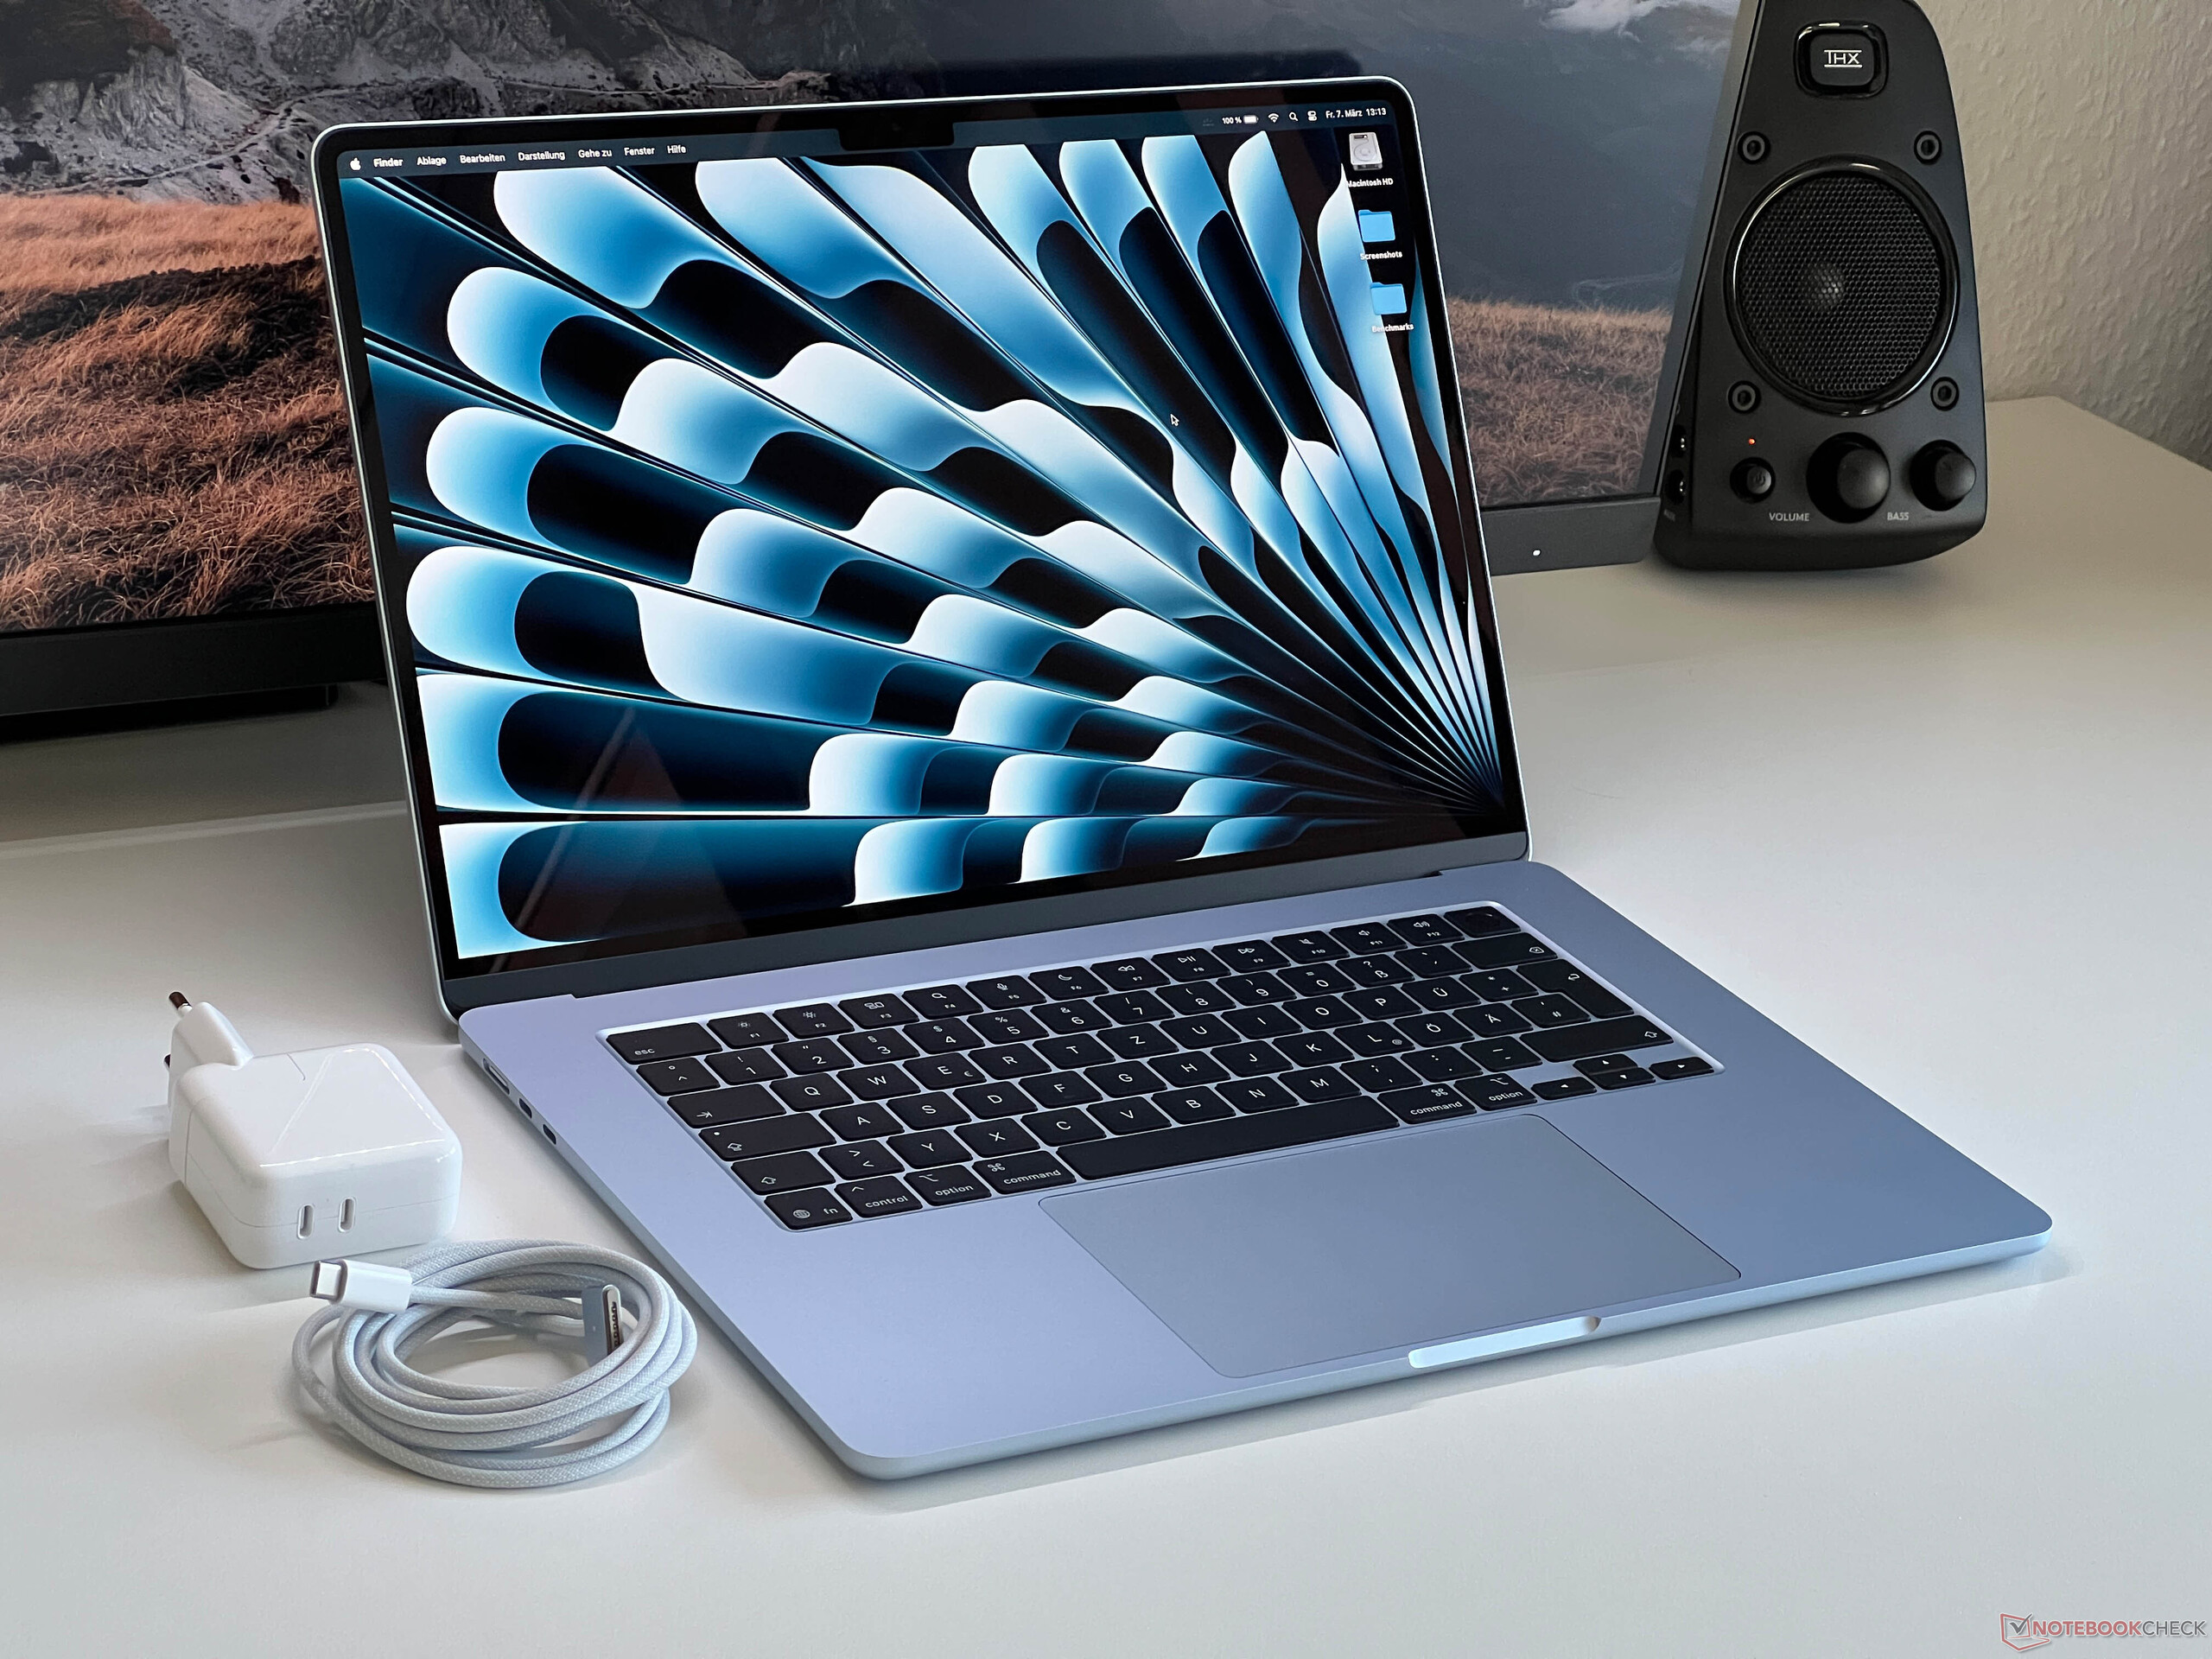
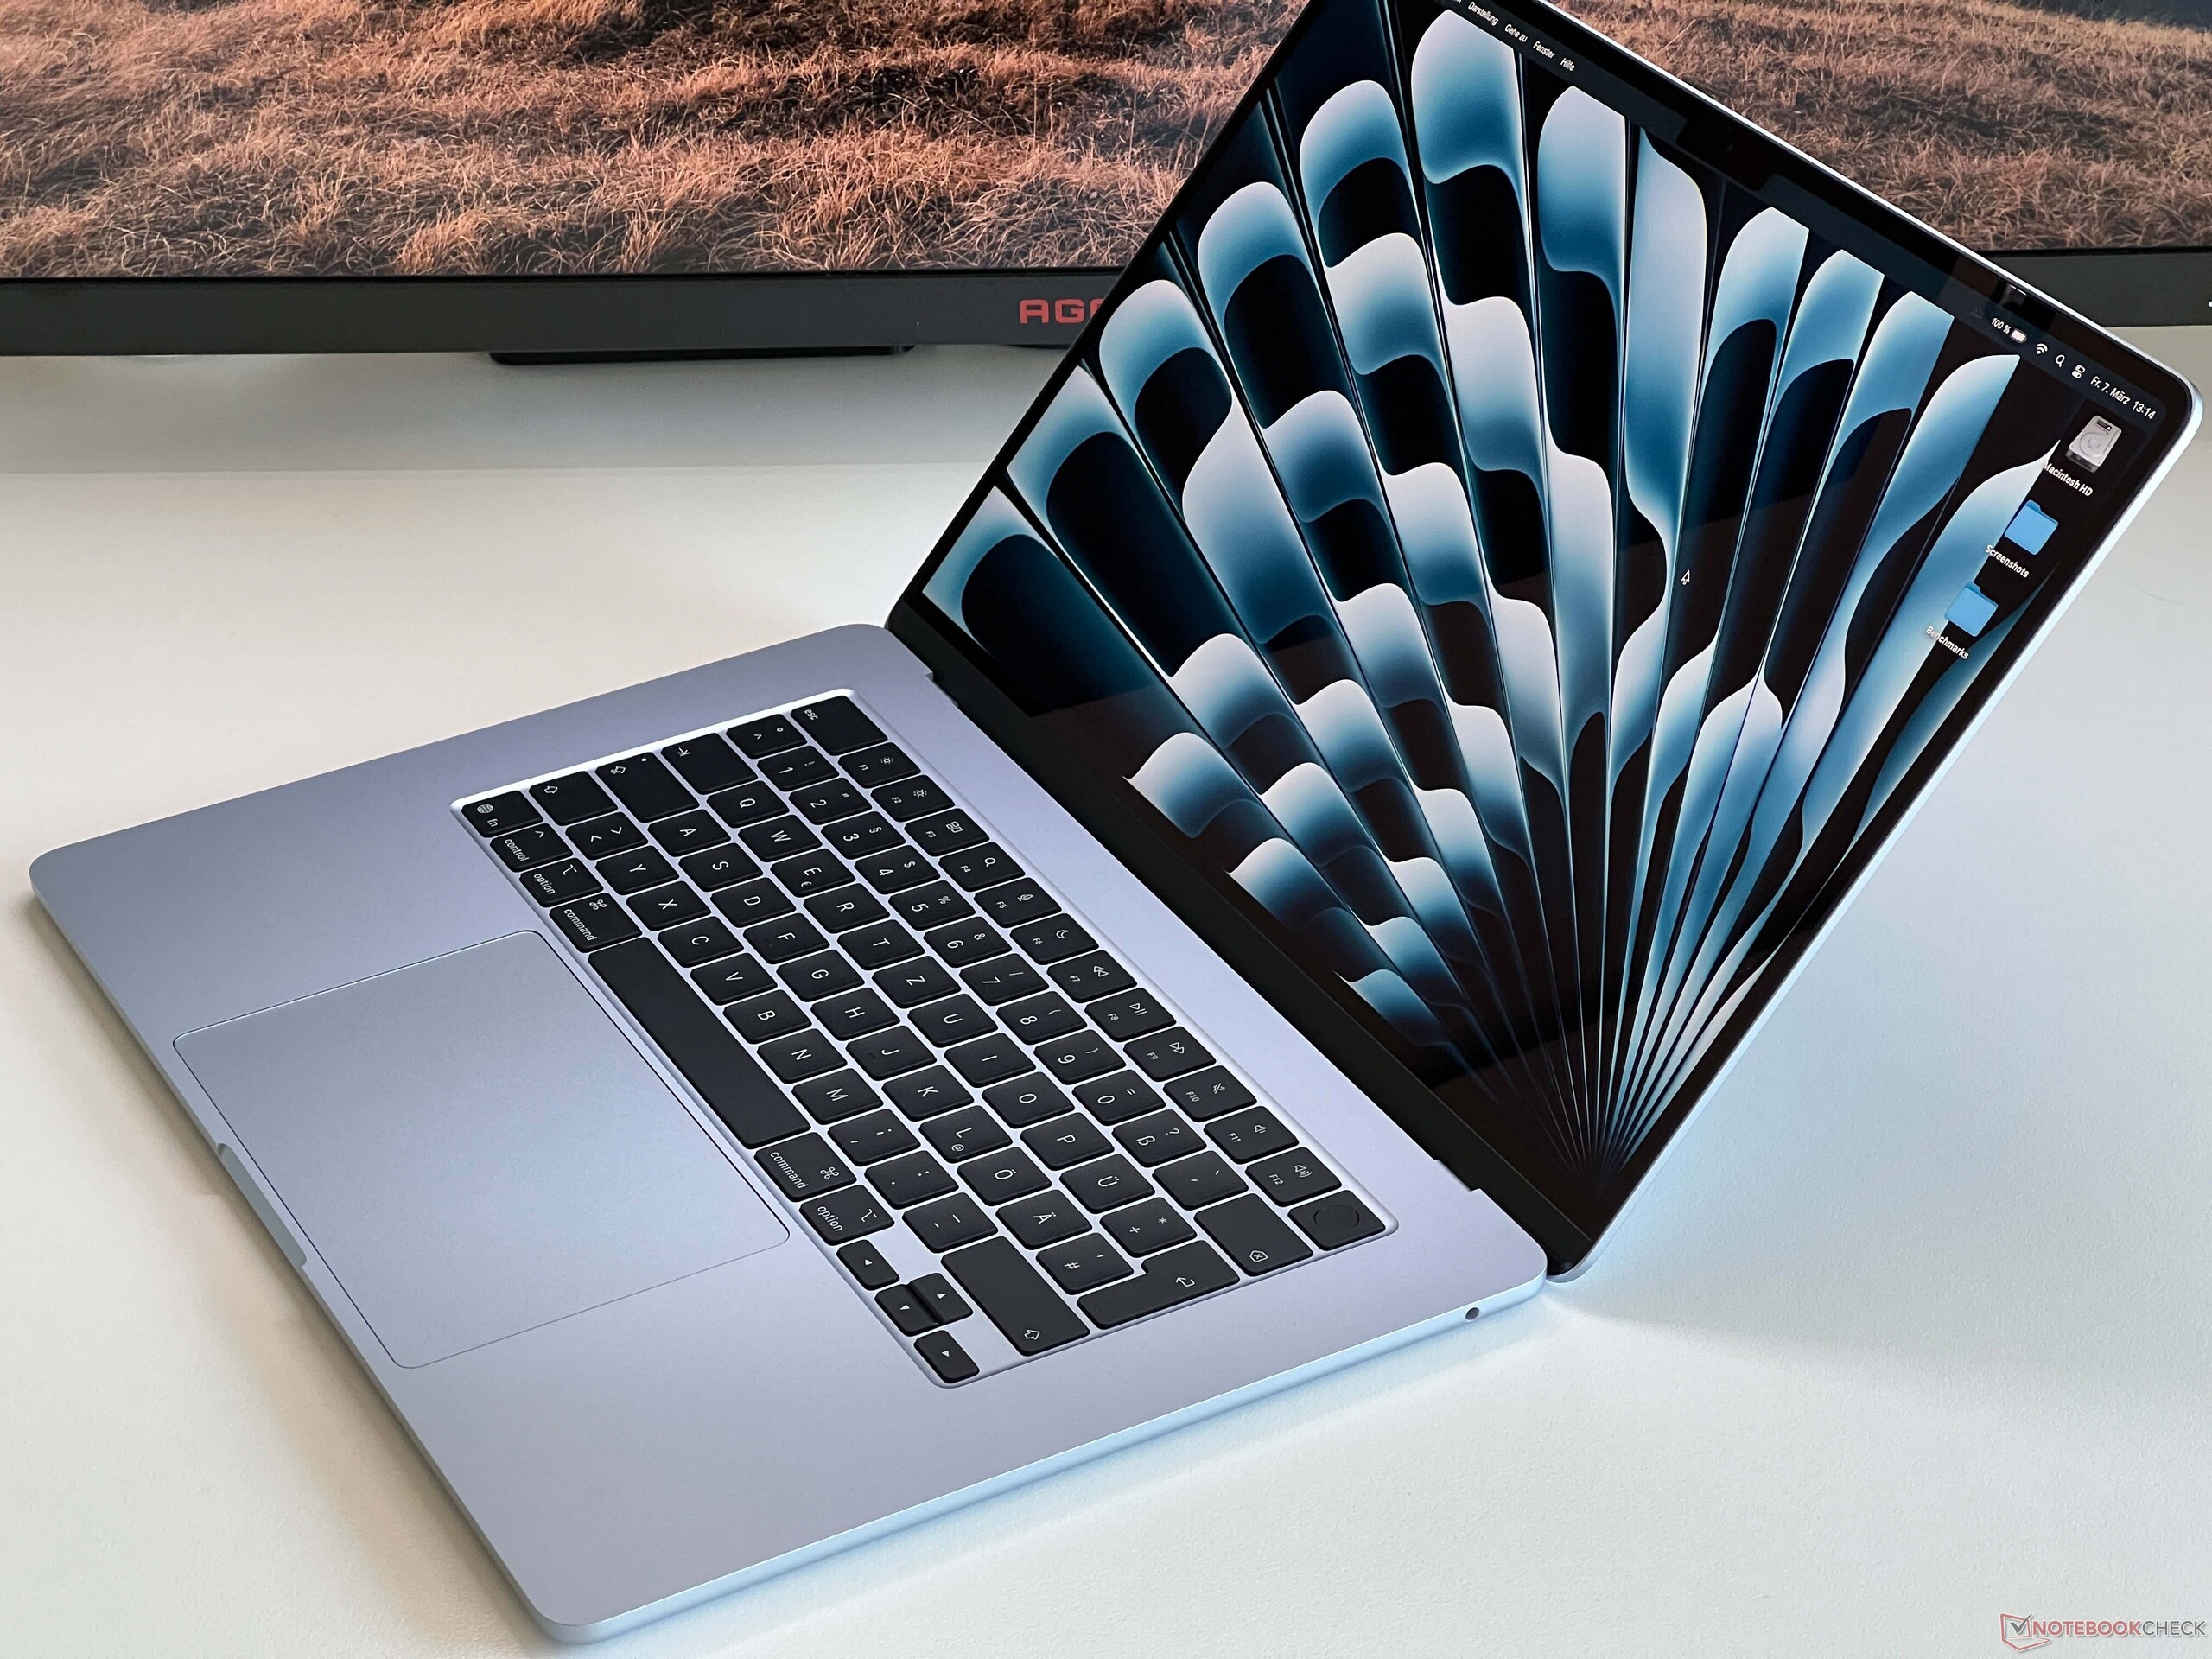
Apple 更新了 MacBook Air 产品线,在笔记本电脑中安装了 M4 处理器。旧的 M3 代的内存已在去年增加到至少 16 GB,但现在 M4 MacBook Air 的内存已增加到 32 GB。令人有些意外的是,Apple ,这两款产品的入门级价格分别降低了 100 美元;配备 16GB 内存和 256GB 固态硬盘的 MacBook Air 15 现在的起价为 1199 美元。我们的测试机配备 1 TB 固态硬盘和 16 GB 内存,MRSP 为 1599 美元。
规格
外壳和连接
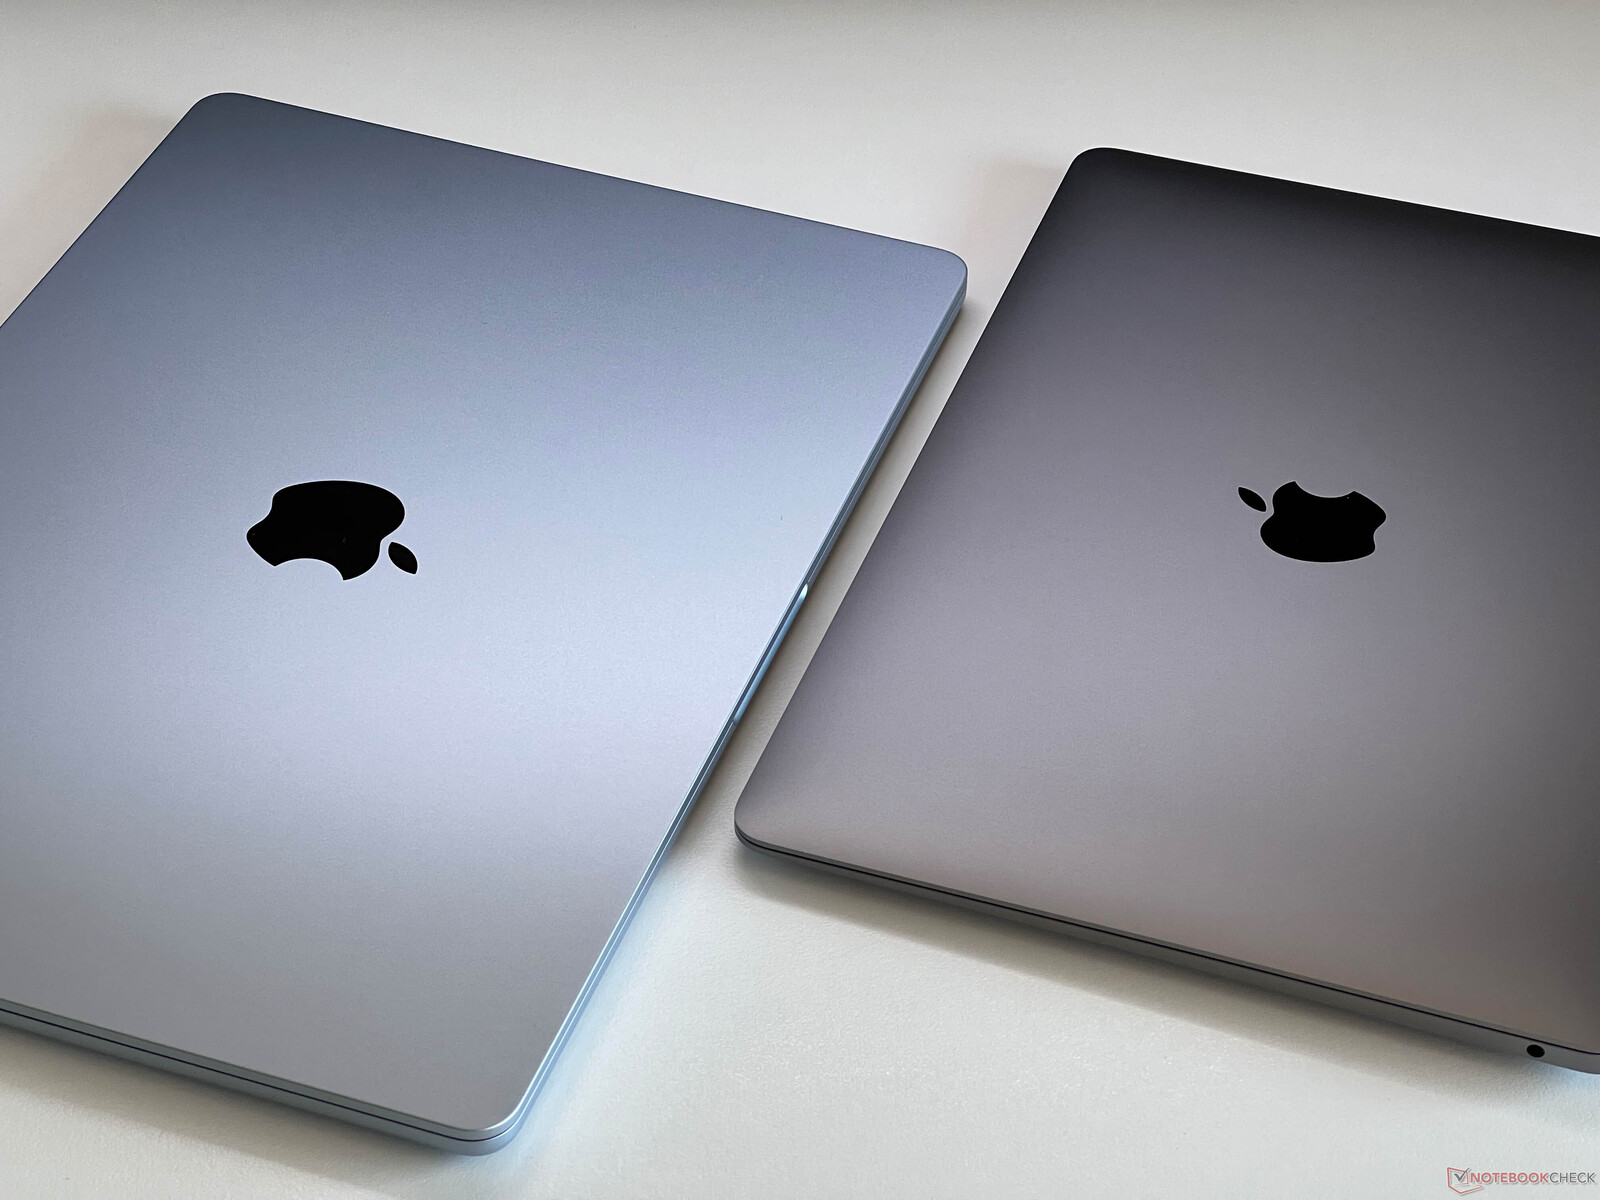
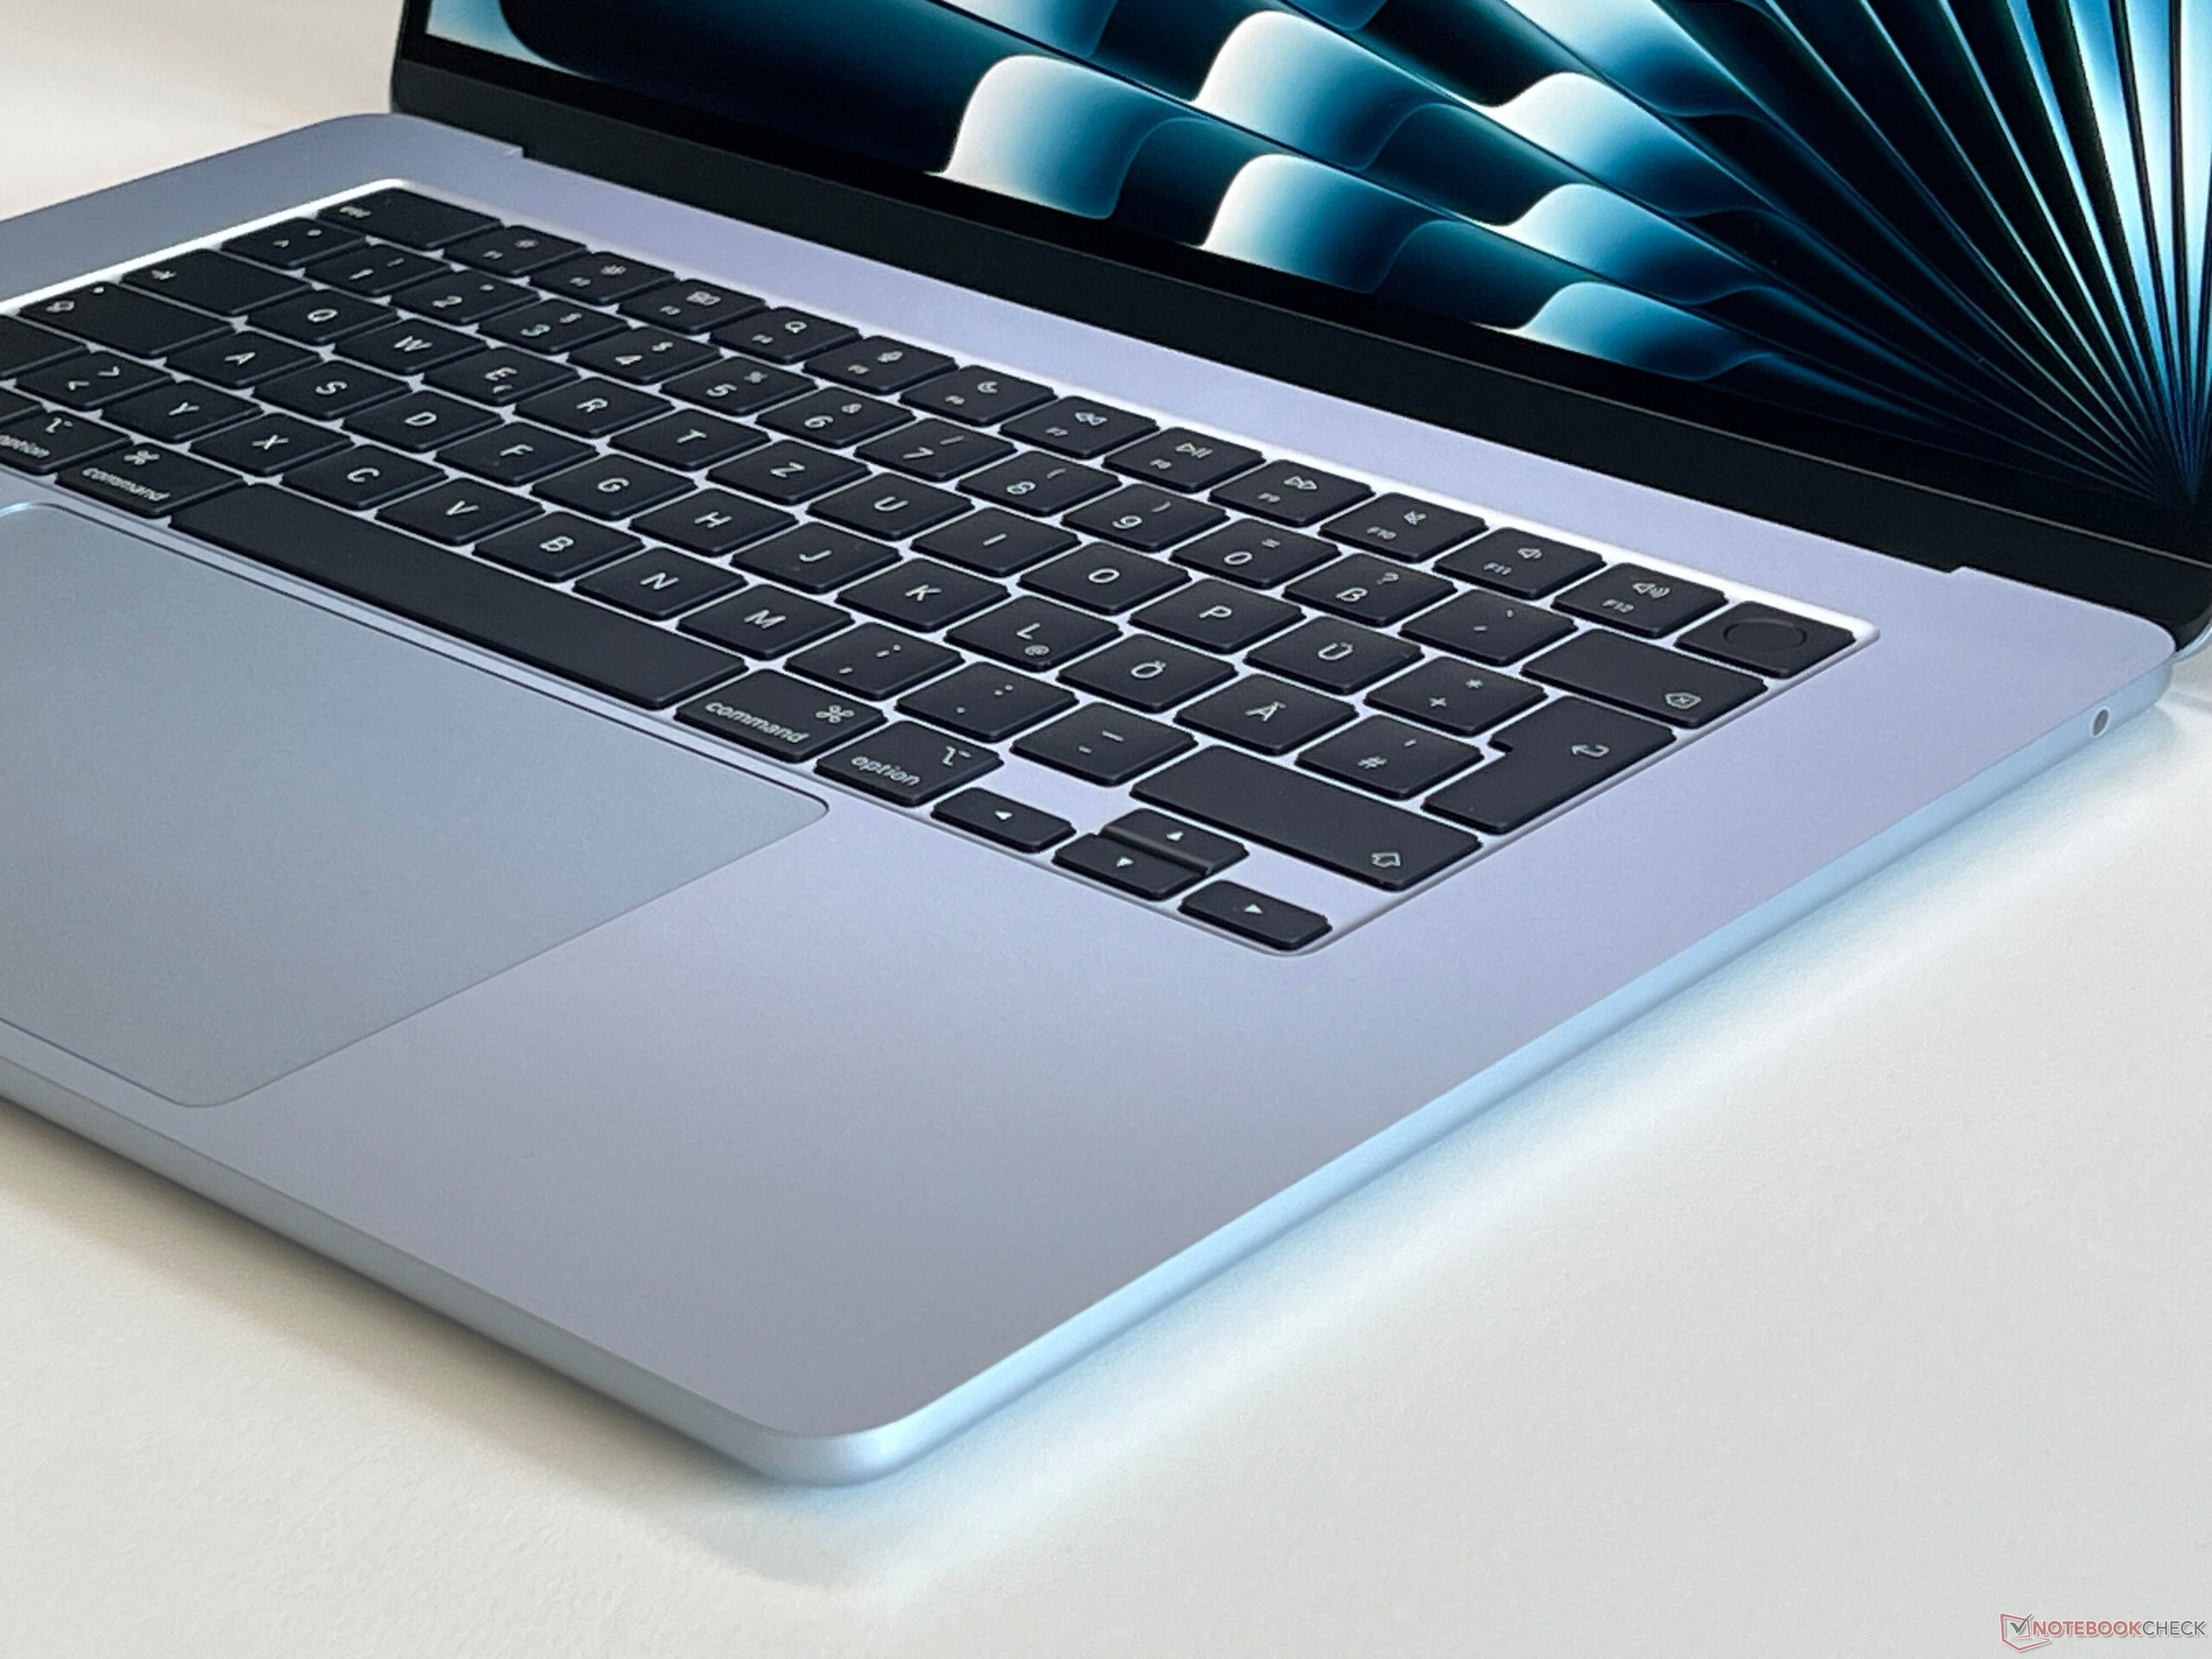
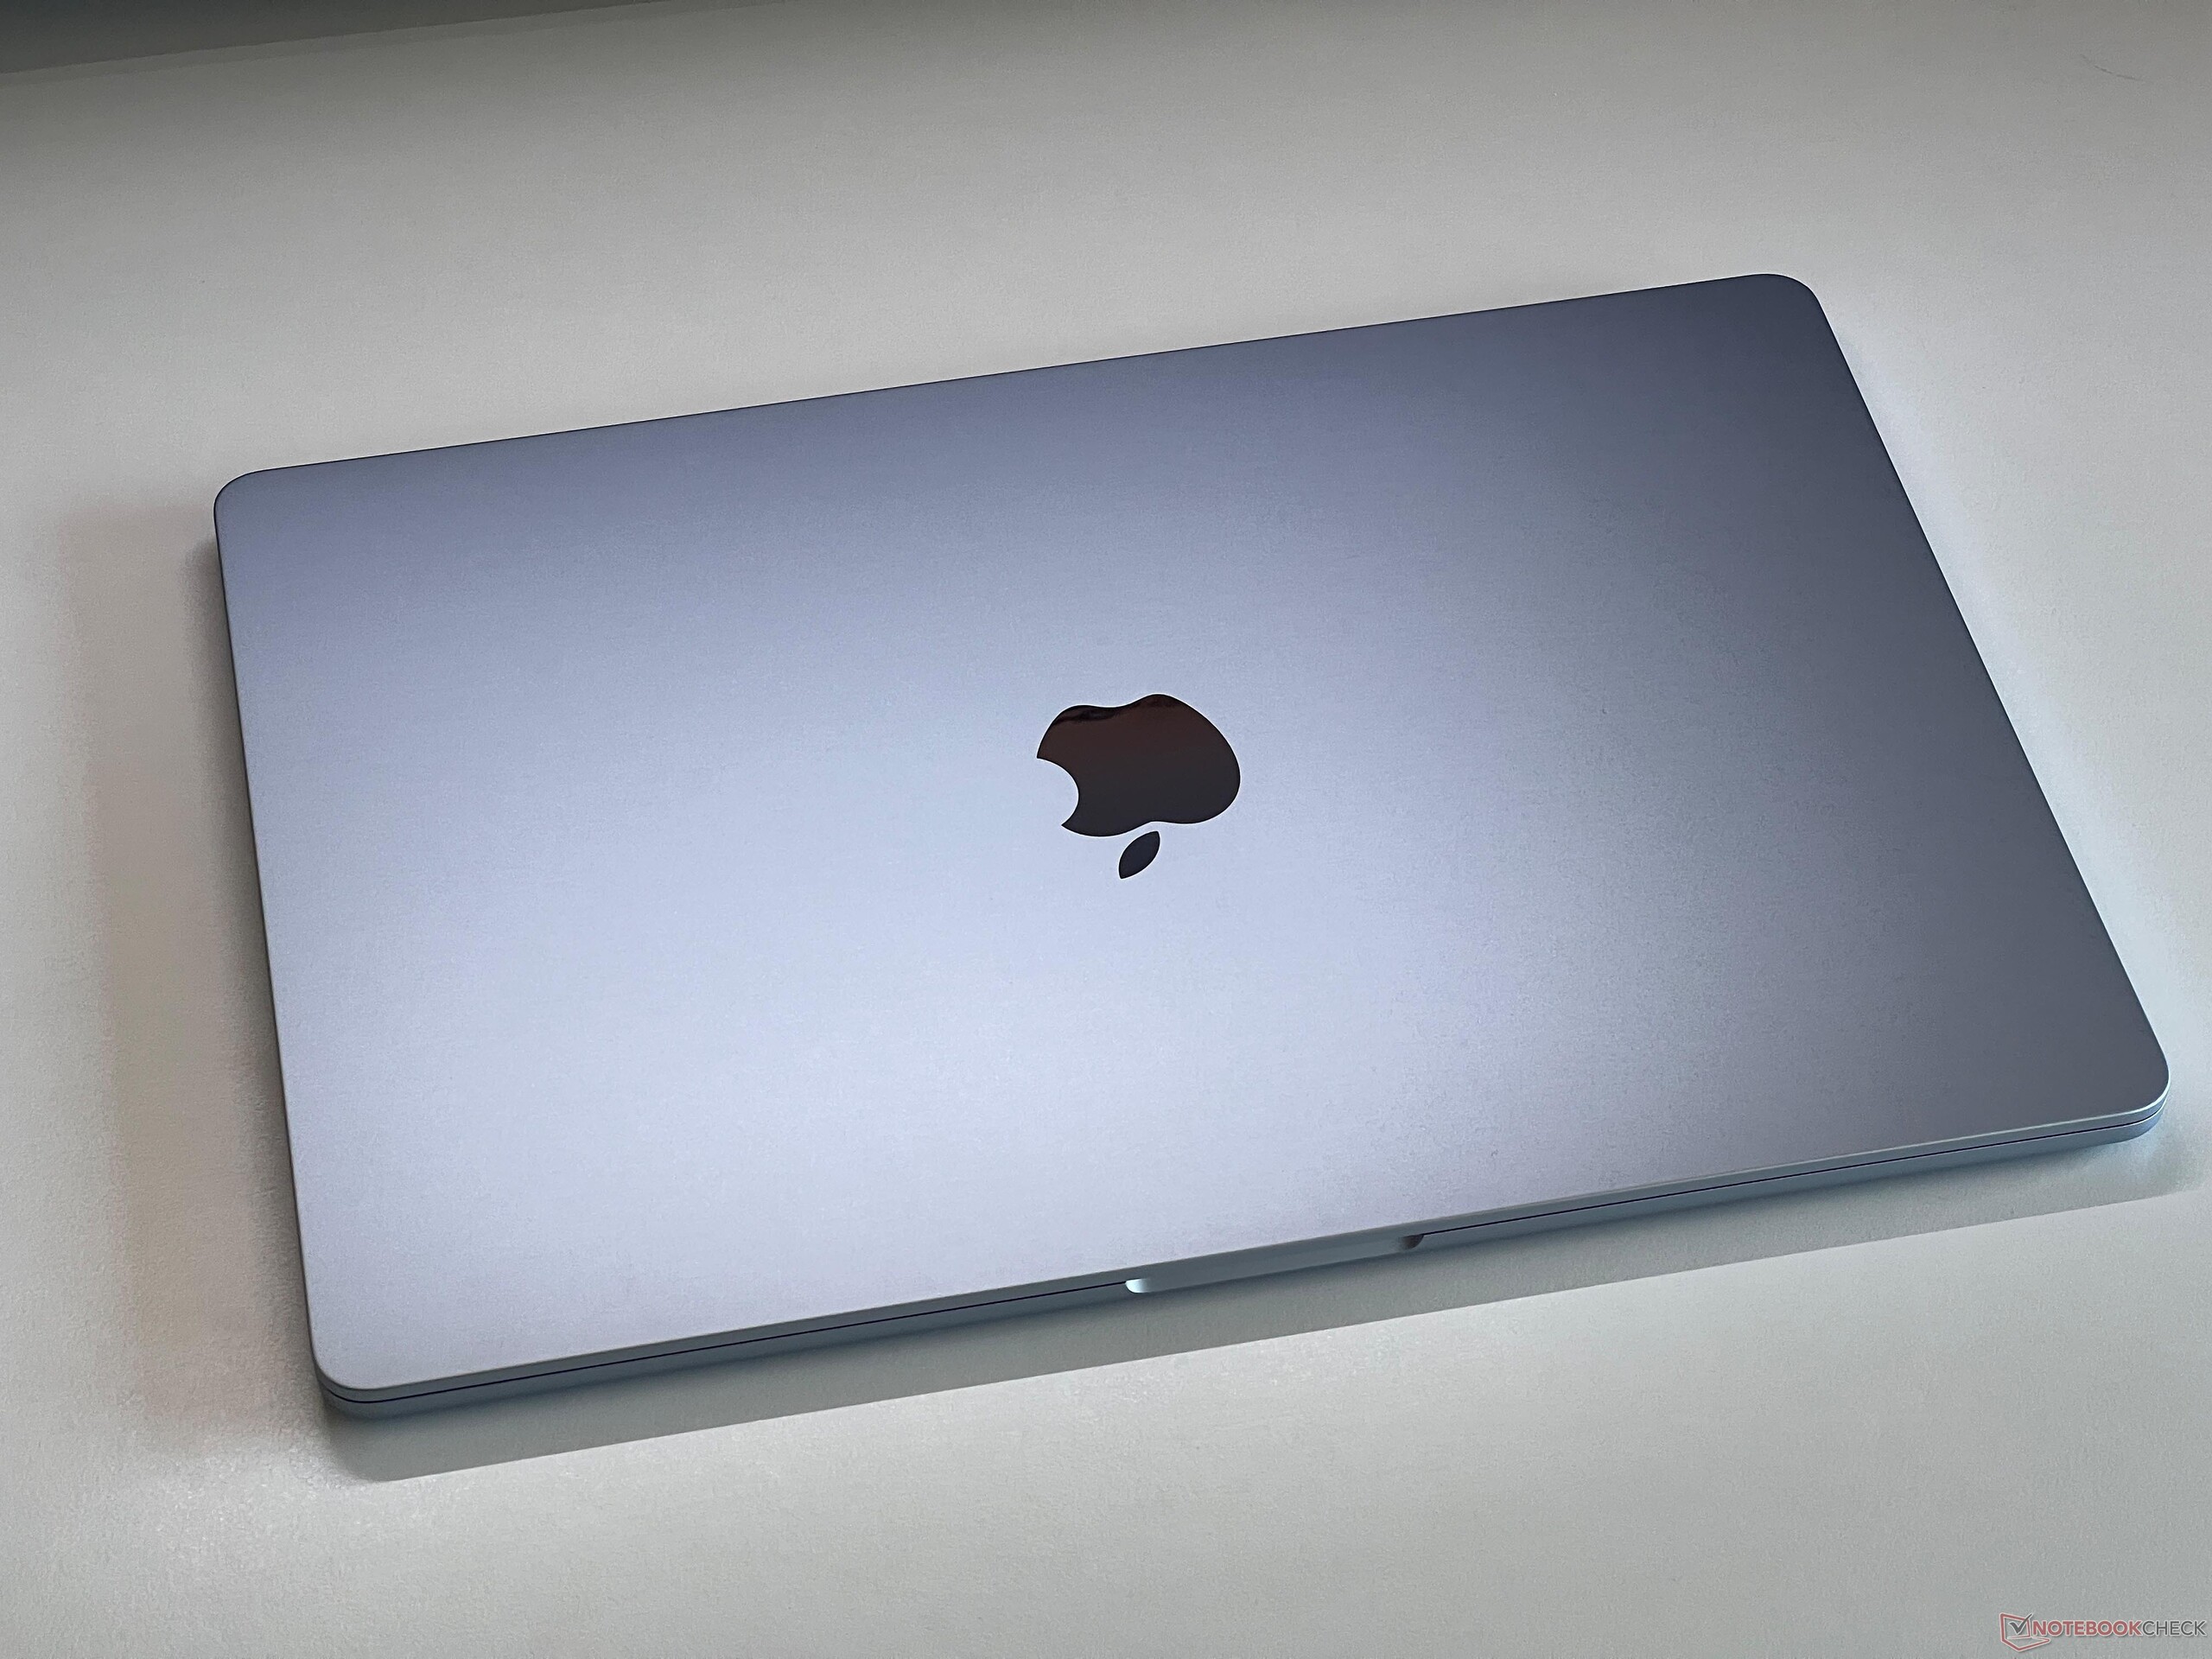
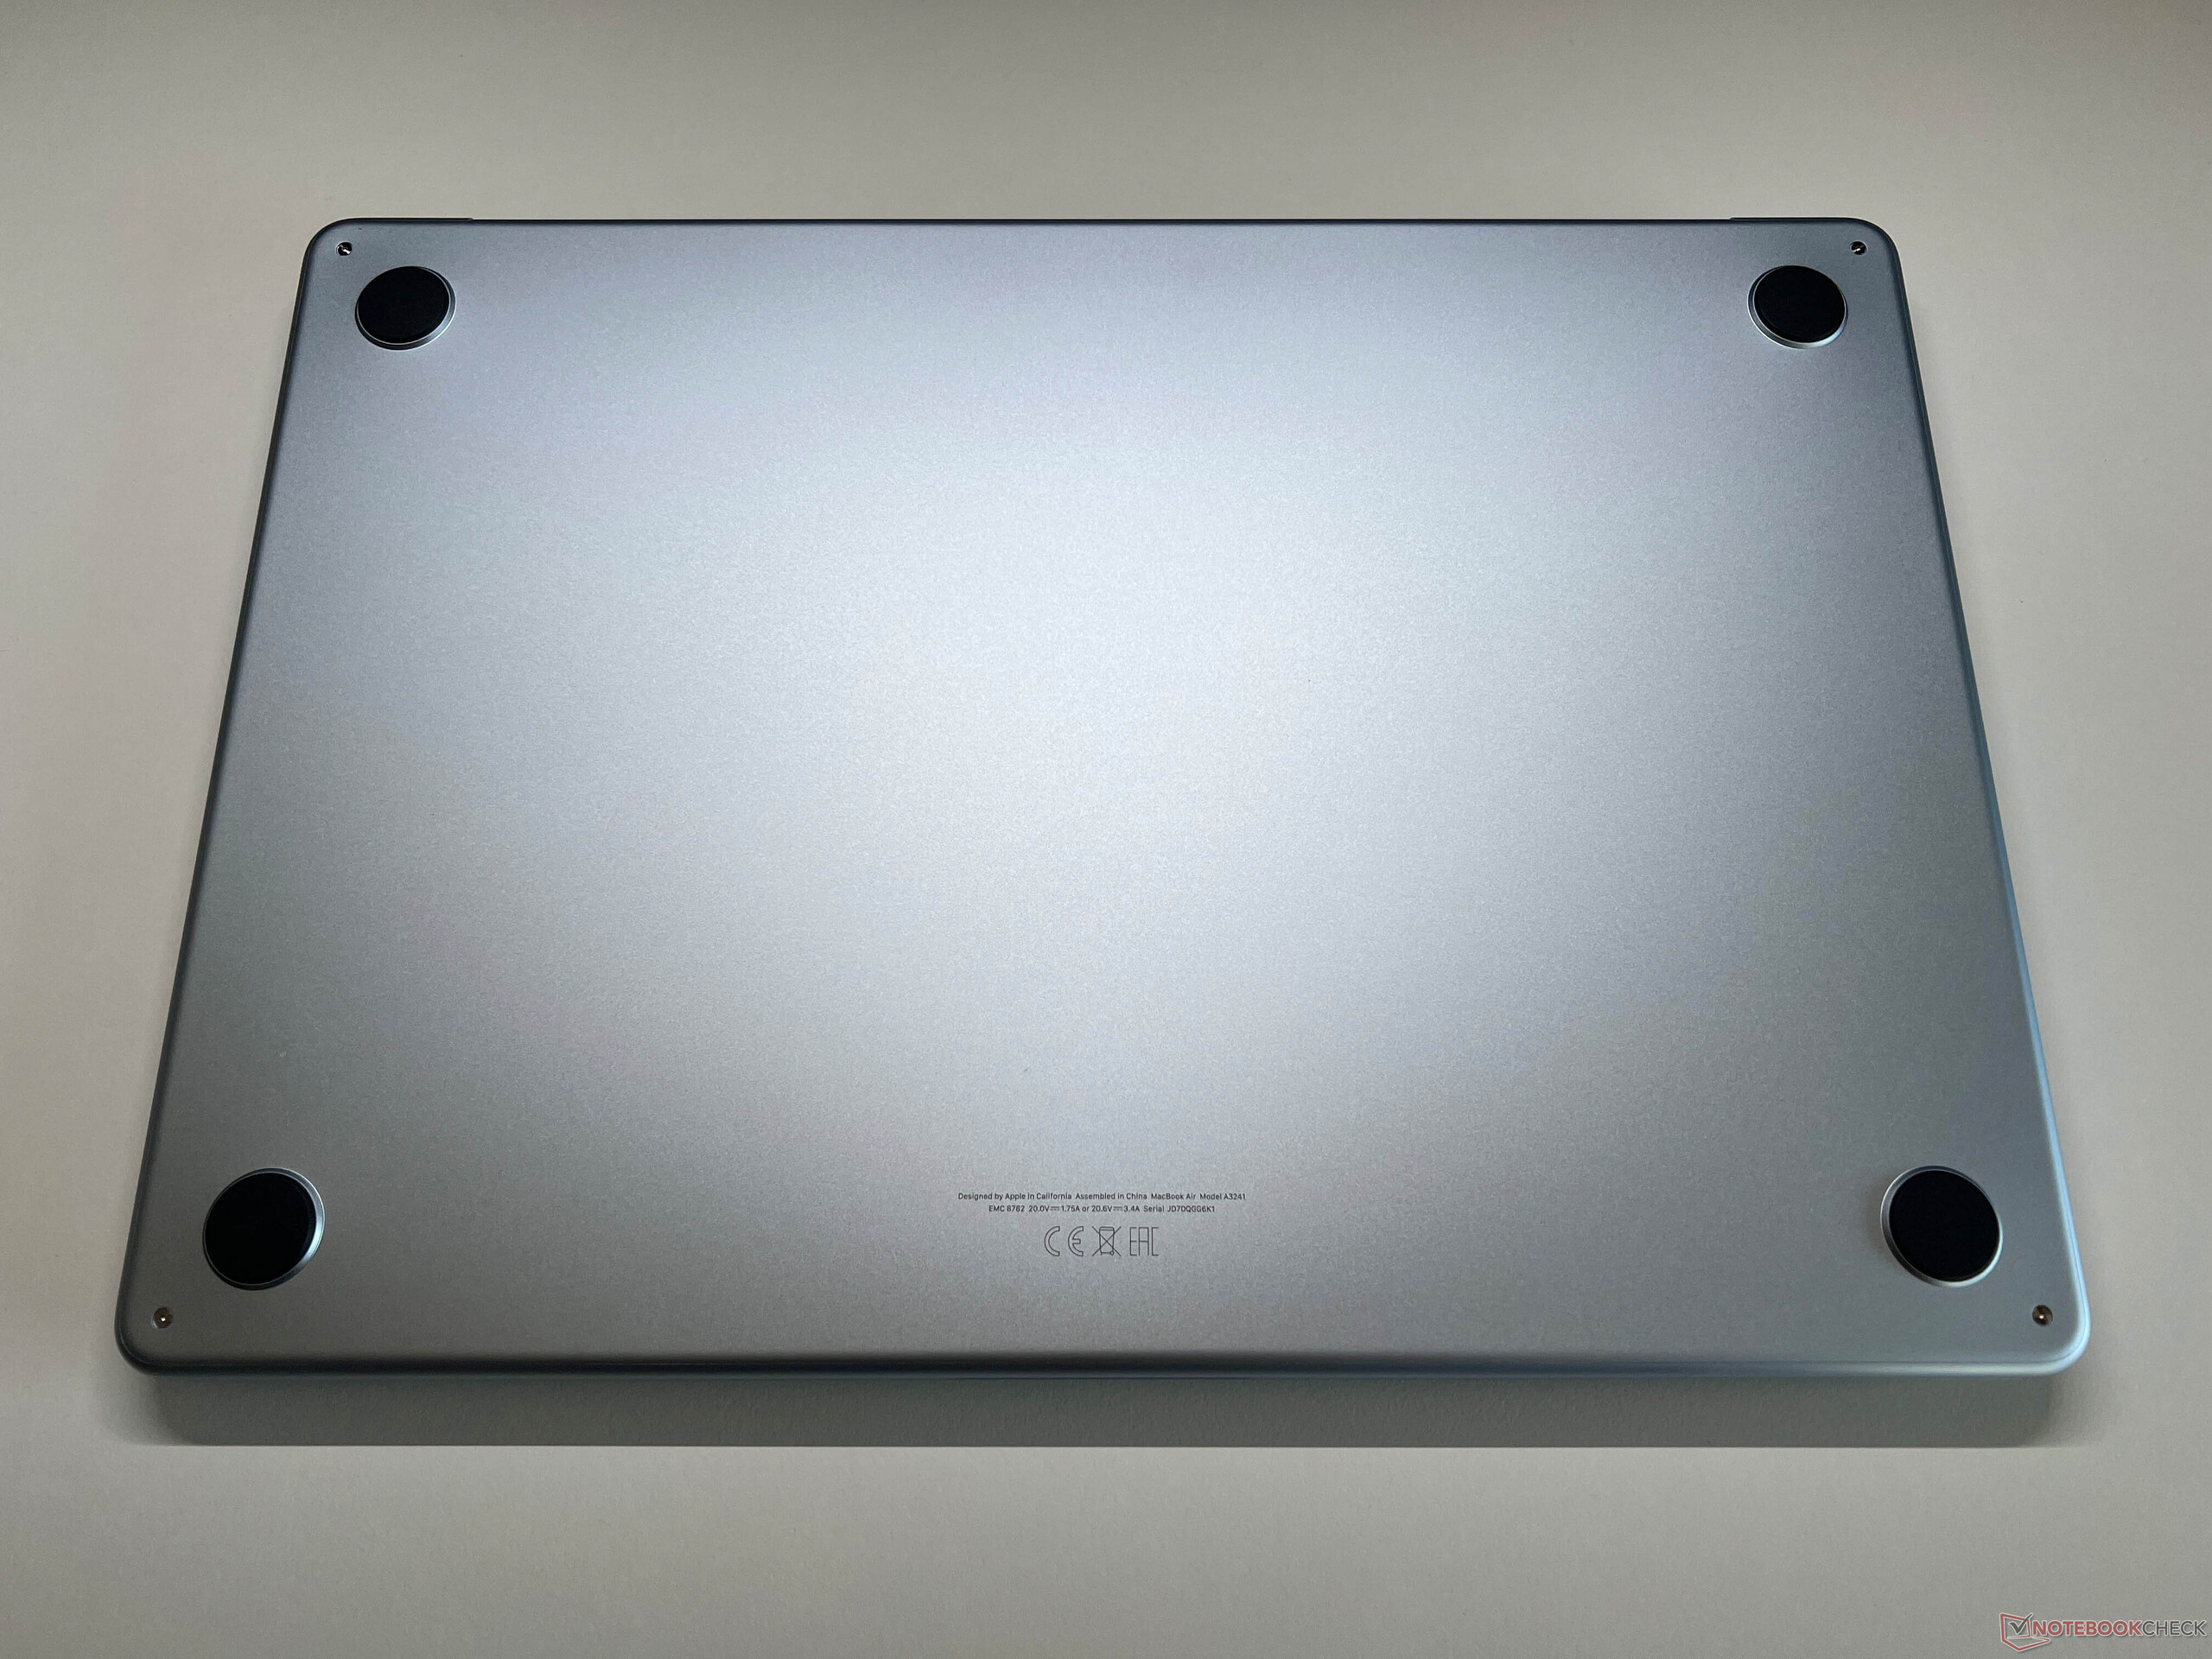
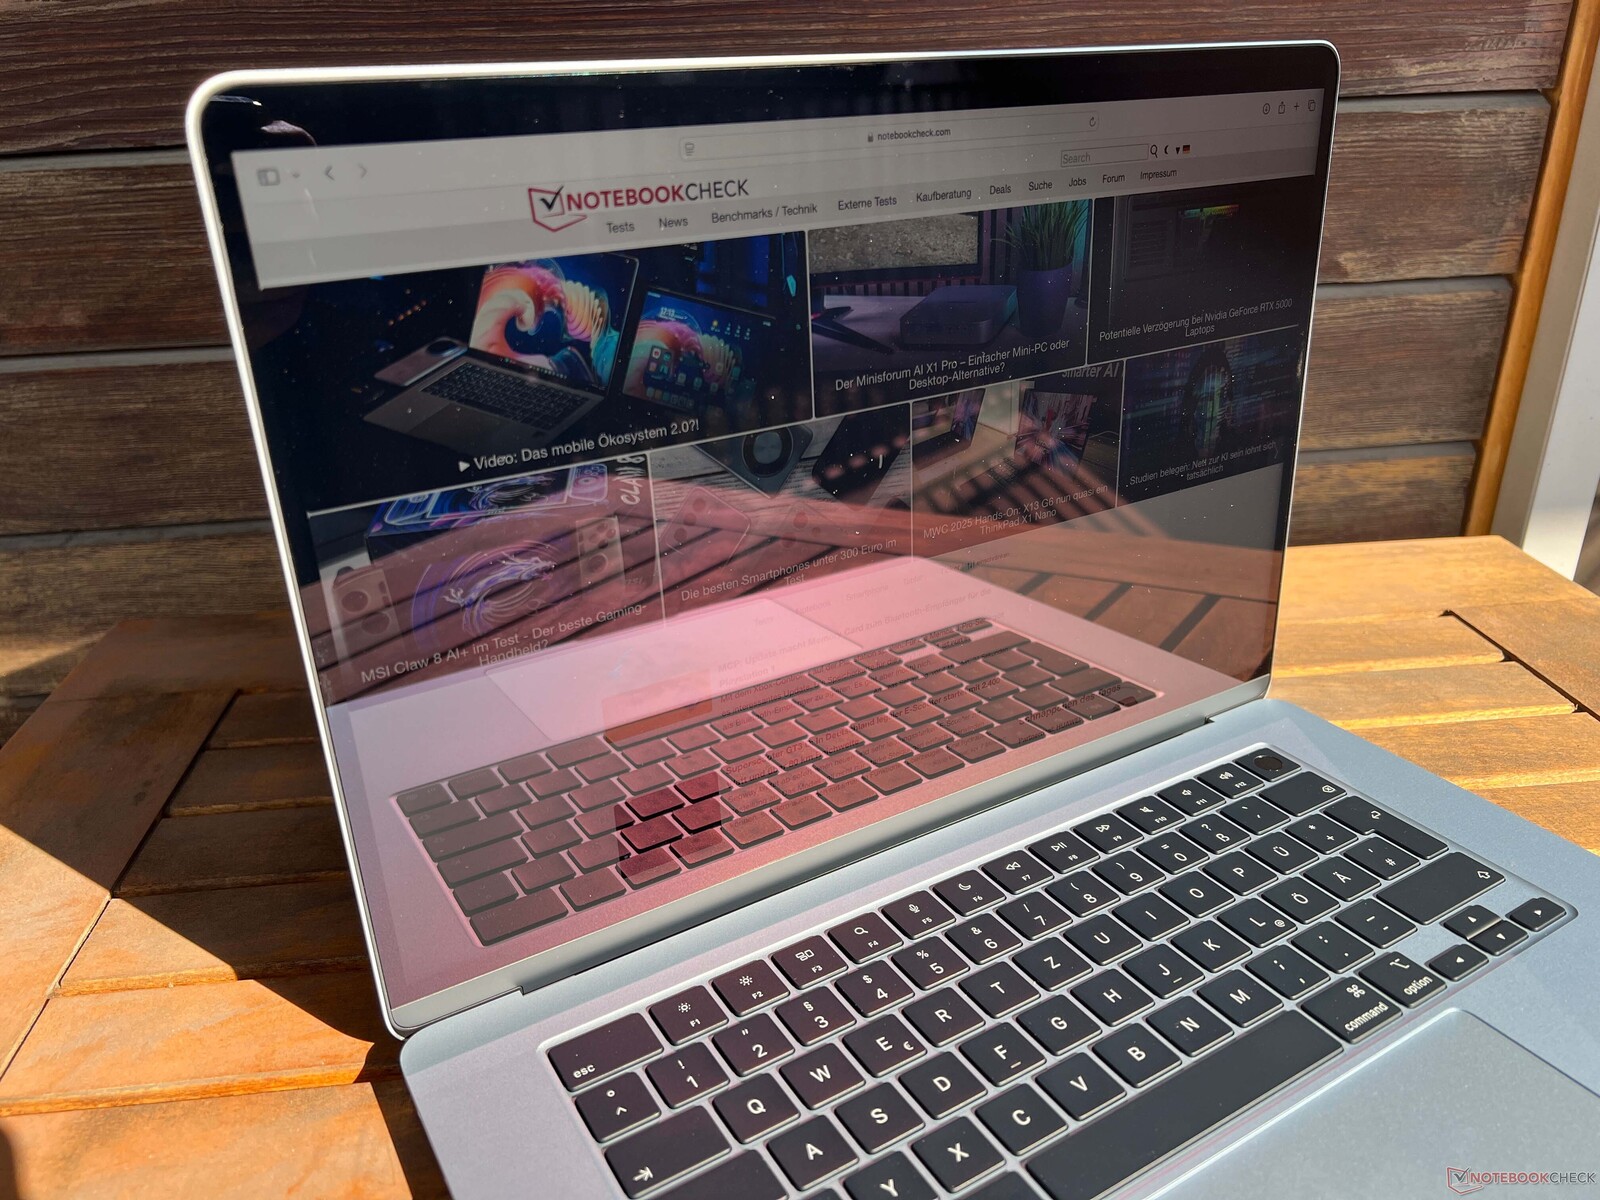
Apple MacBook 的外壳设计没有任何改变,其 11.5 毫米的纤薄设计依然令人印象深刻。铝合金一体成型机身的质量依然很好,但 Air 15 1.52 千克的重量也不轻。可选颜色有所变化,太空灰被取消,取而代之的是天蓝色。
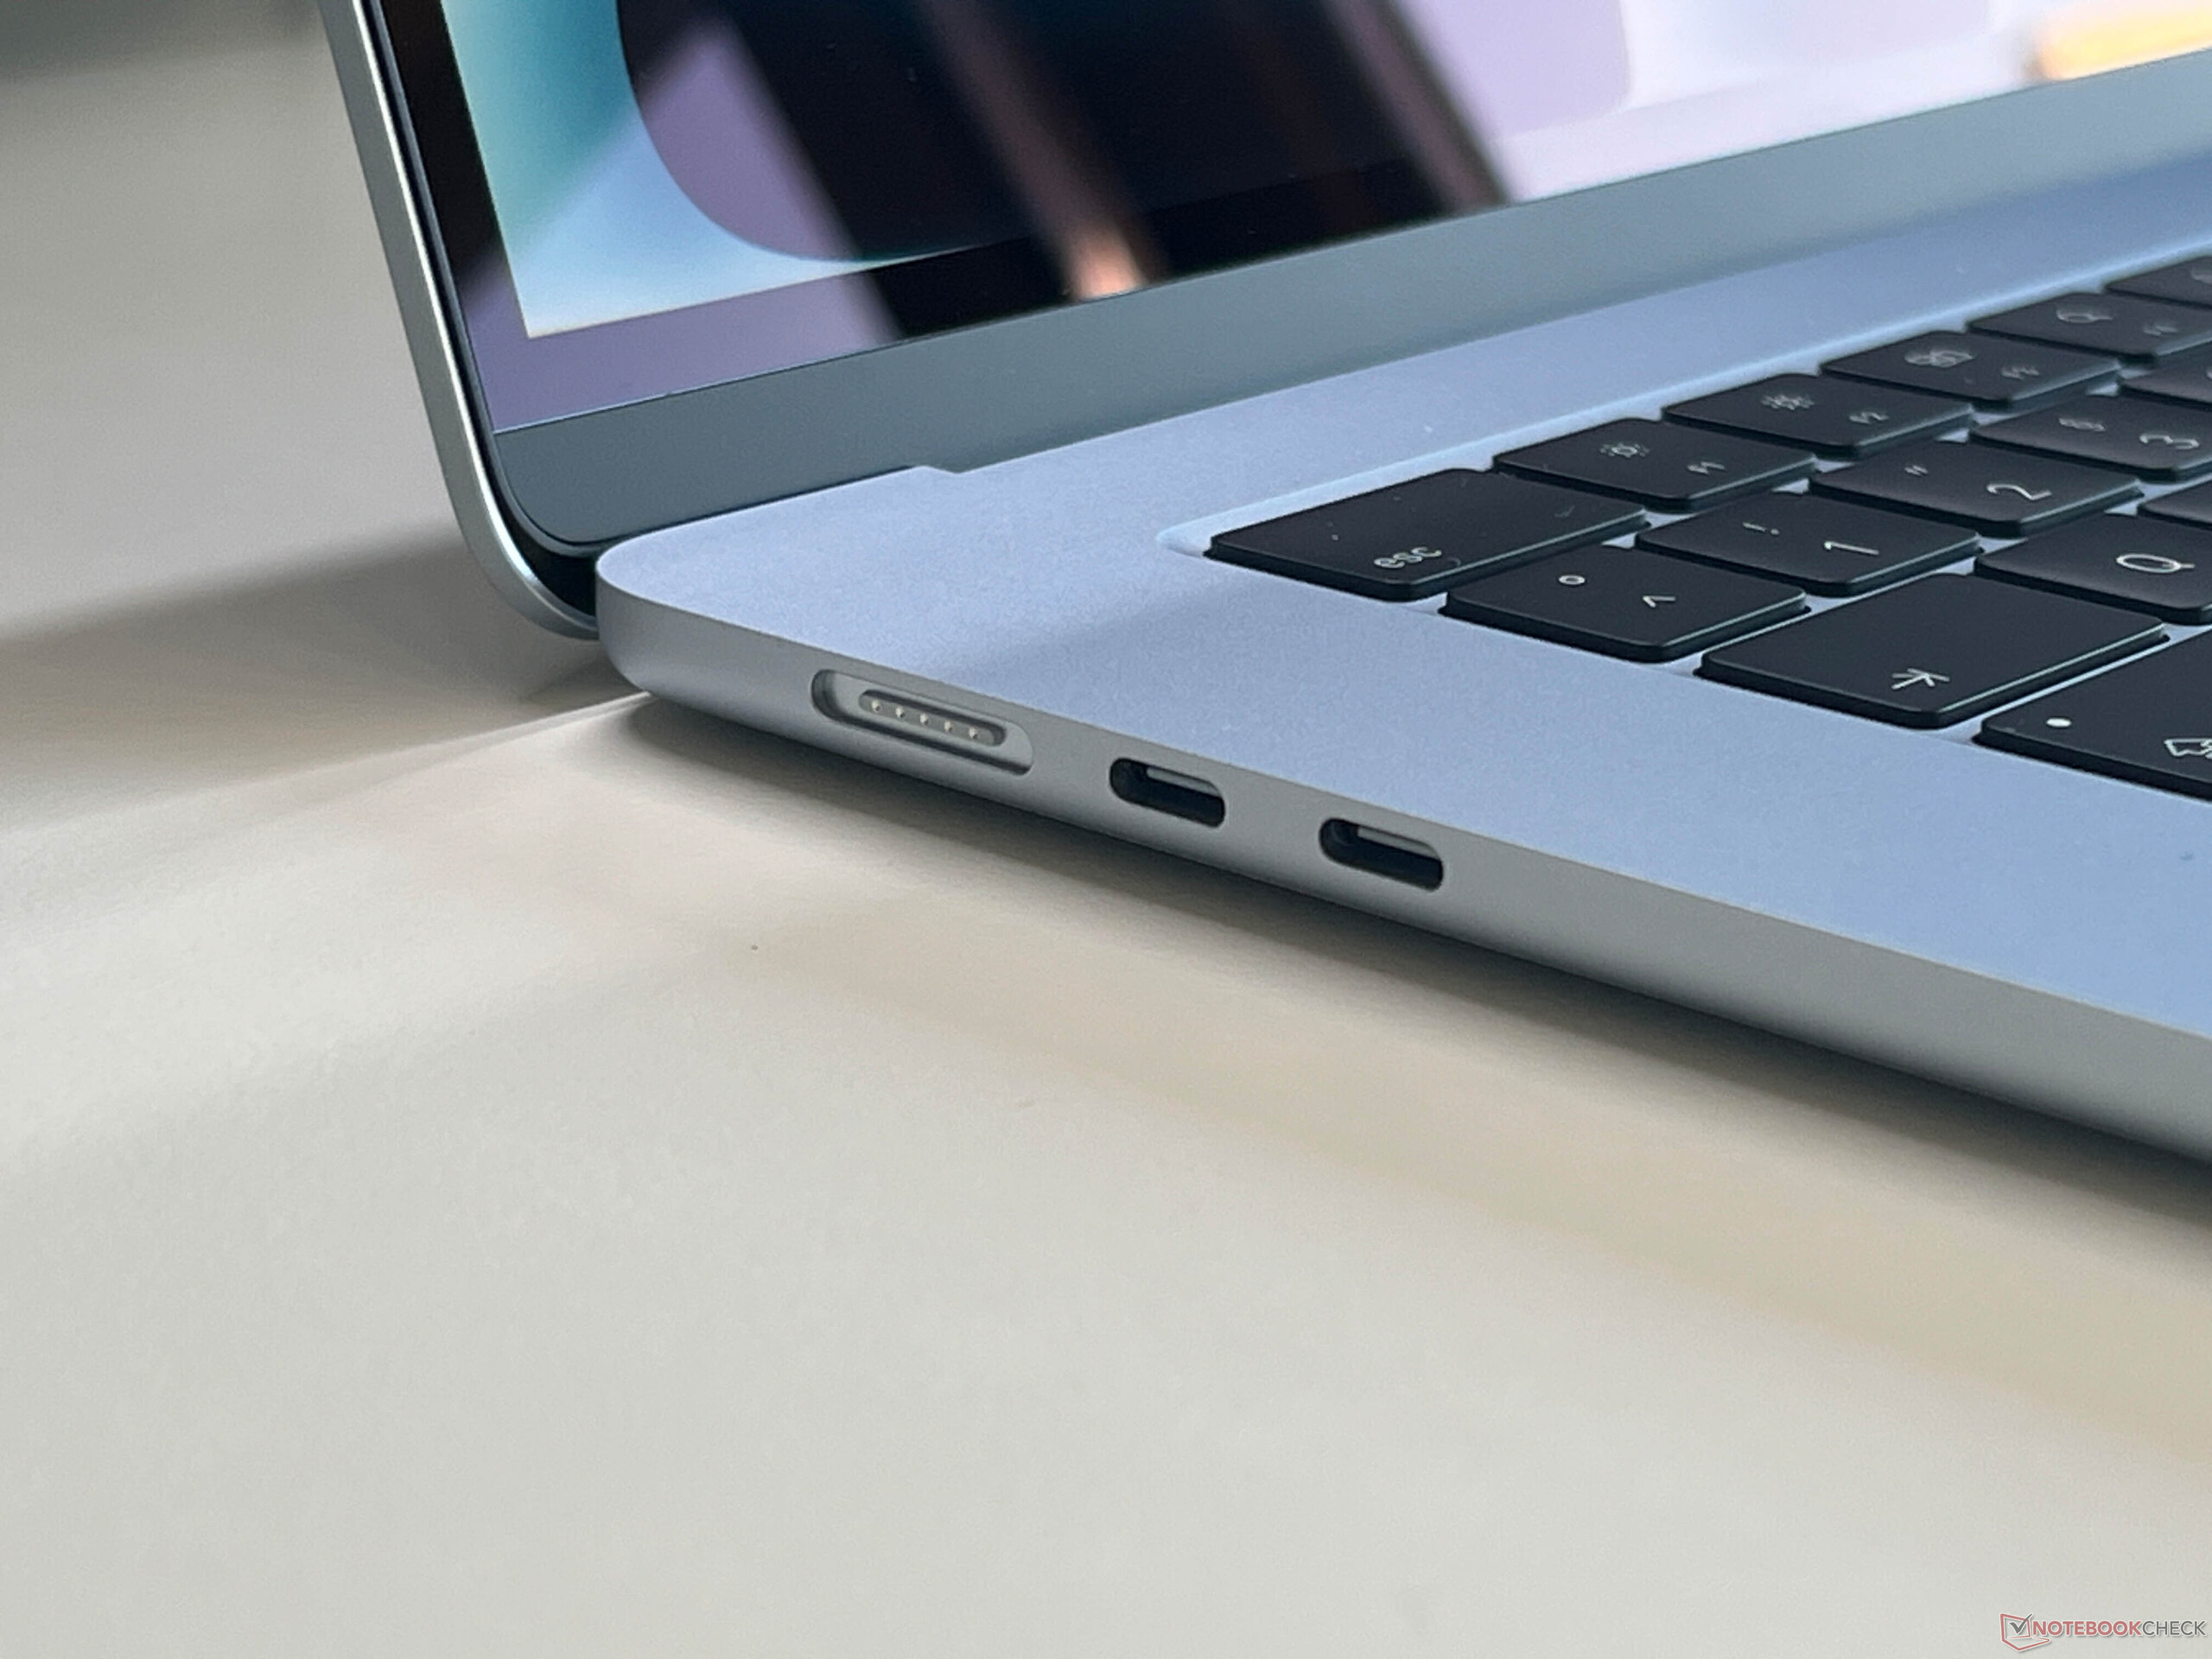
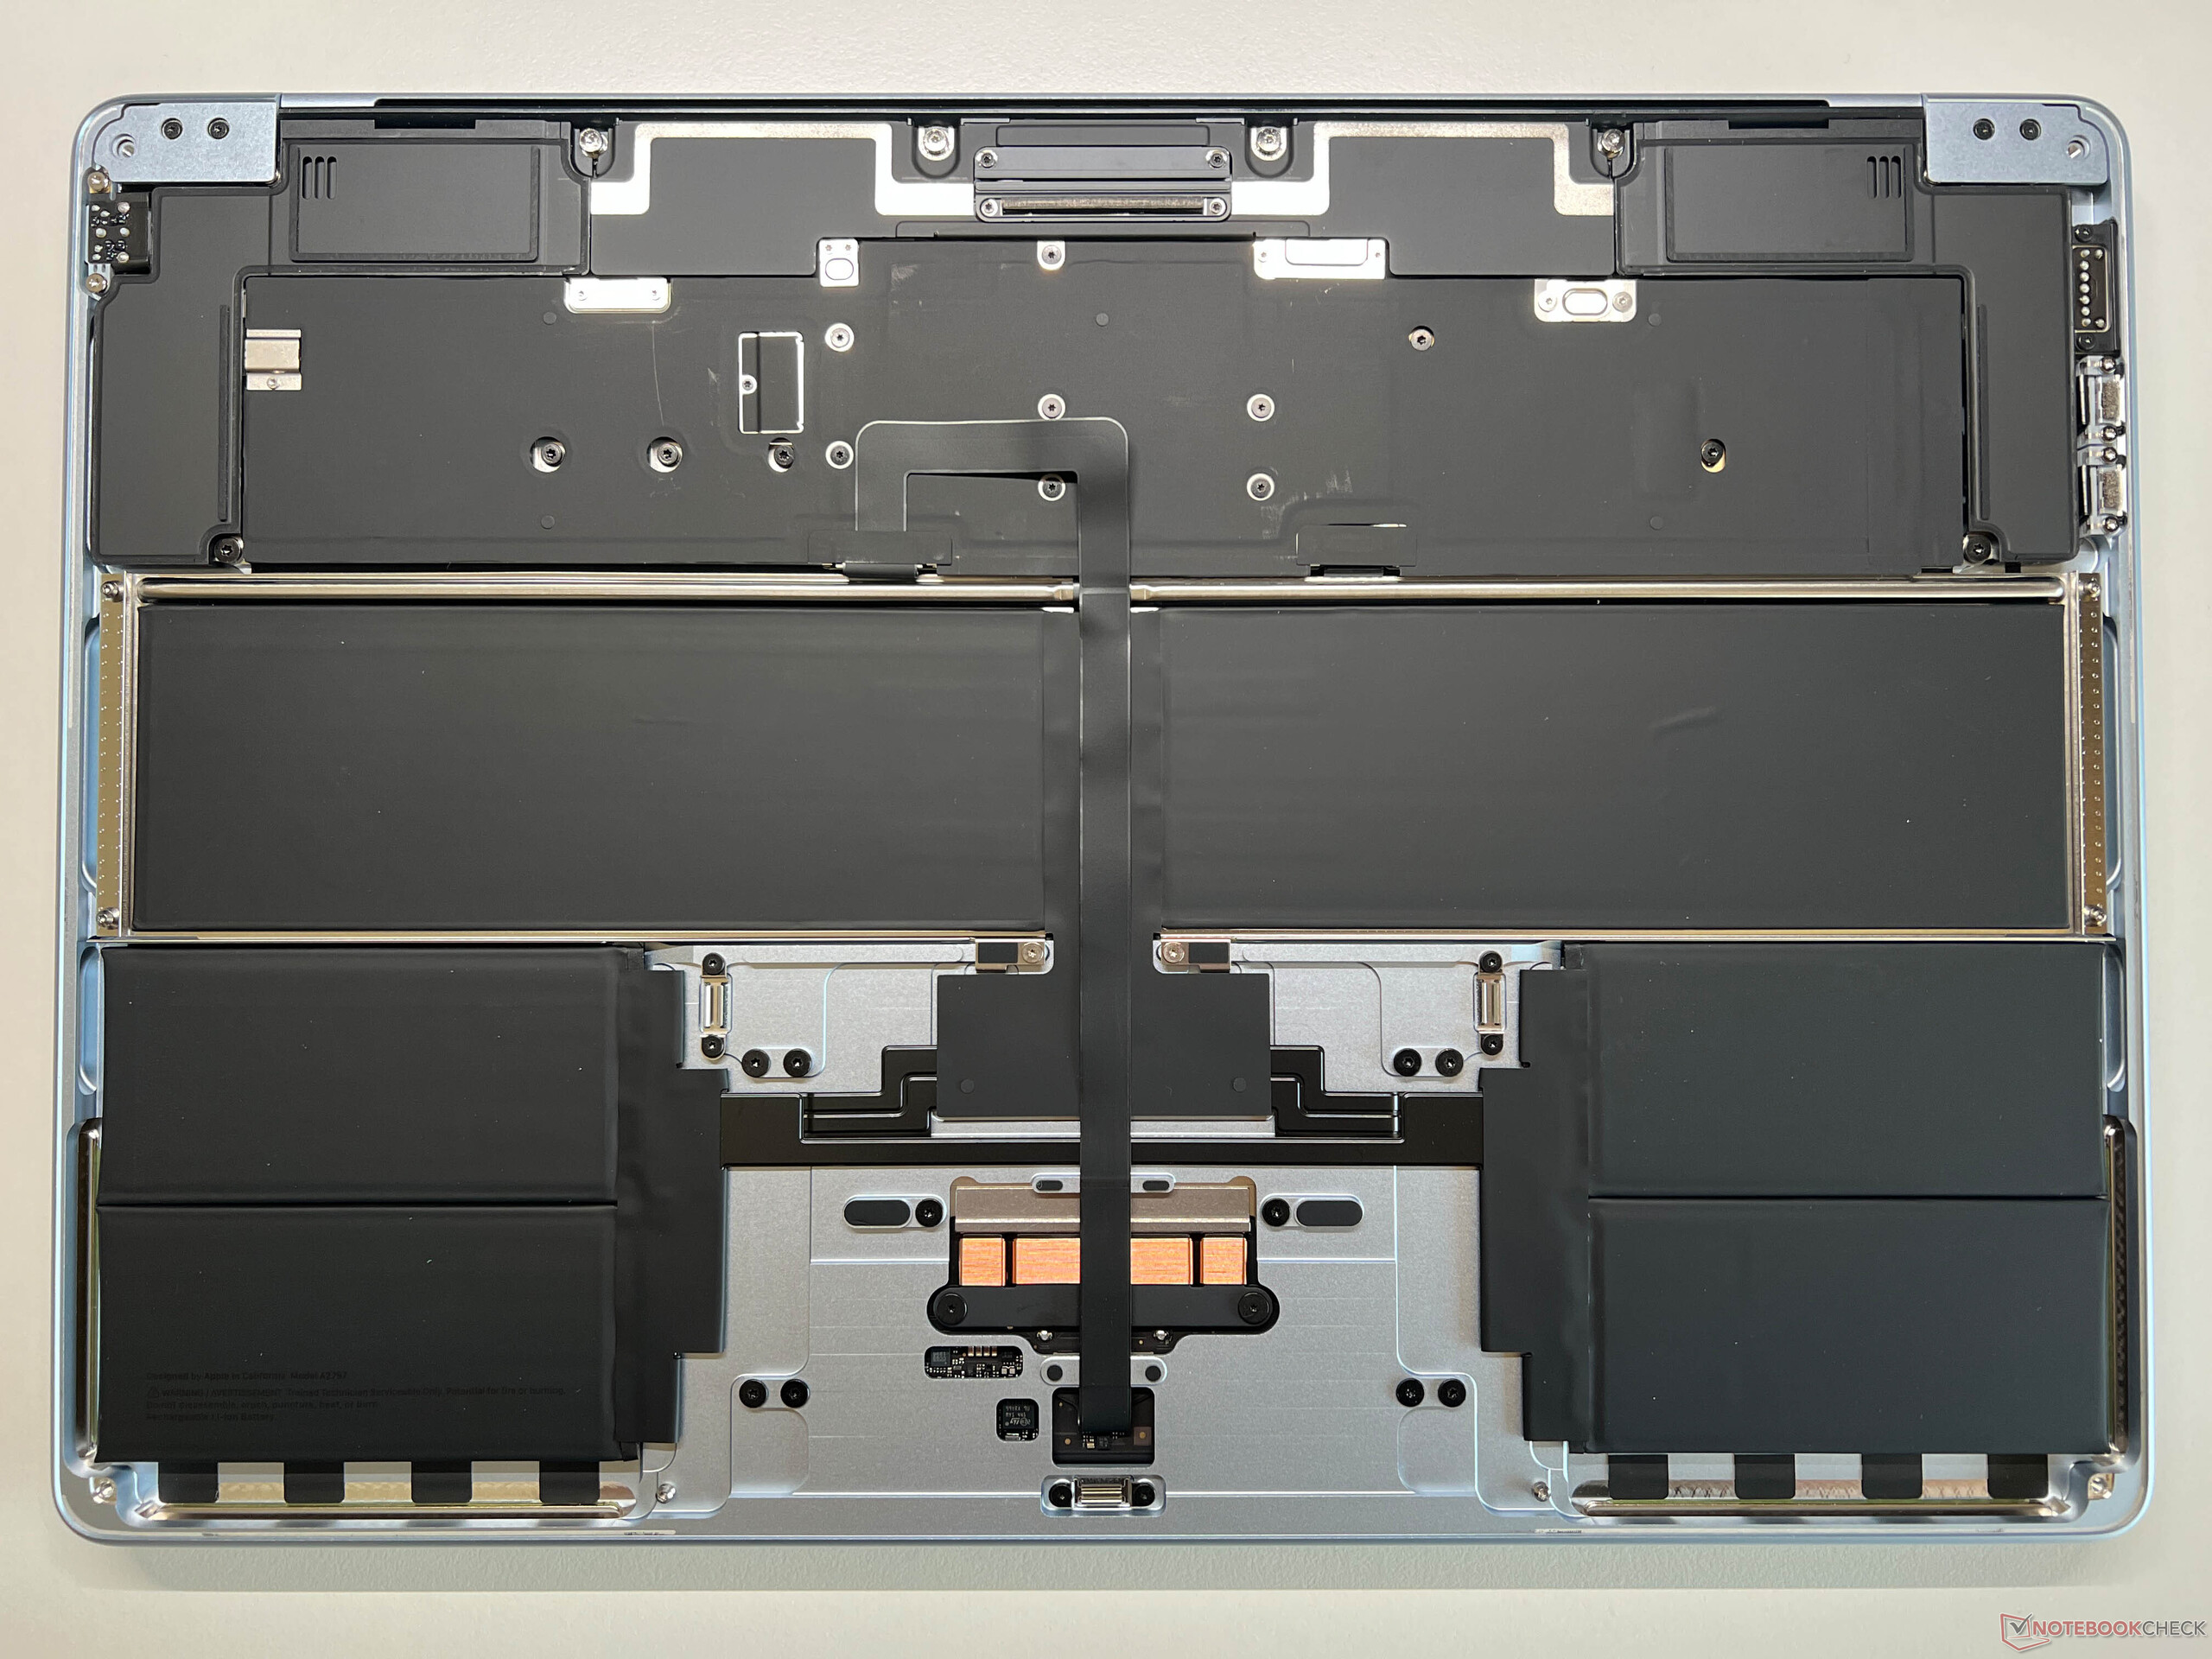
我们对其制造质量和稳定性仍然没有什么可抱怨的,但其连接情况仍然仅限于 MagSafe 和 2x USB-C。不过值得庆幸的是,这些连接现在都支持 Thunderbolt 4,M4 SoC 除了内部面板外,还可以控制两个外部显示器。维护选项不可用。
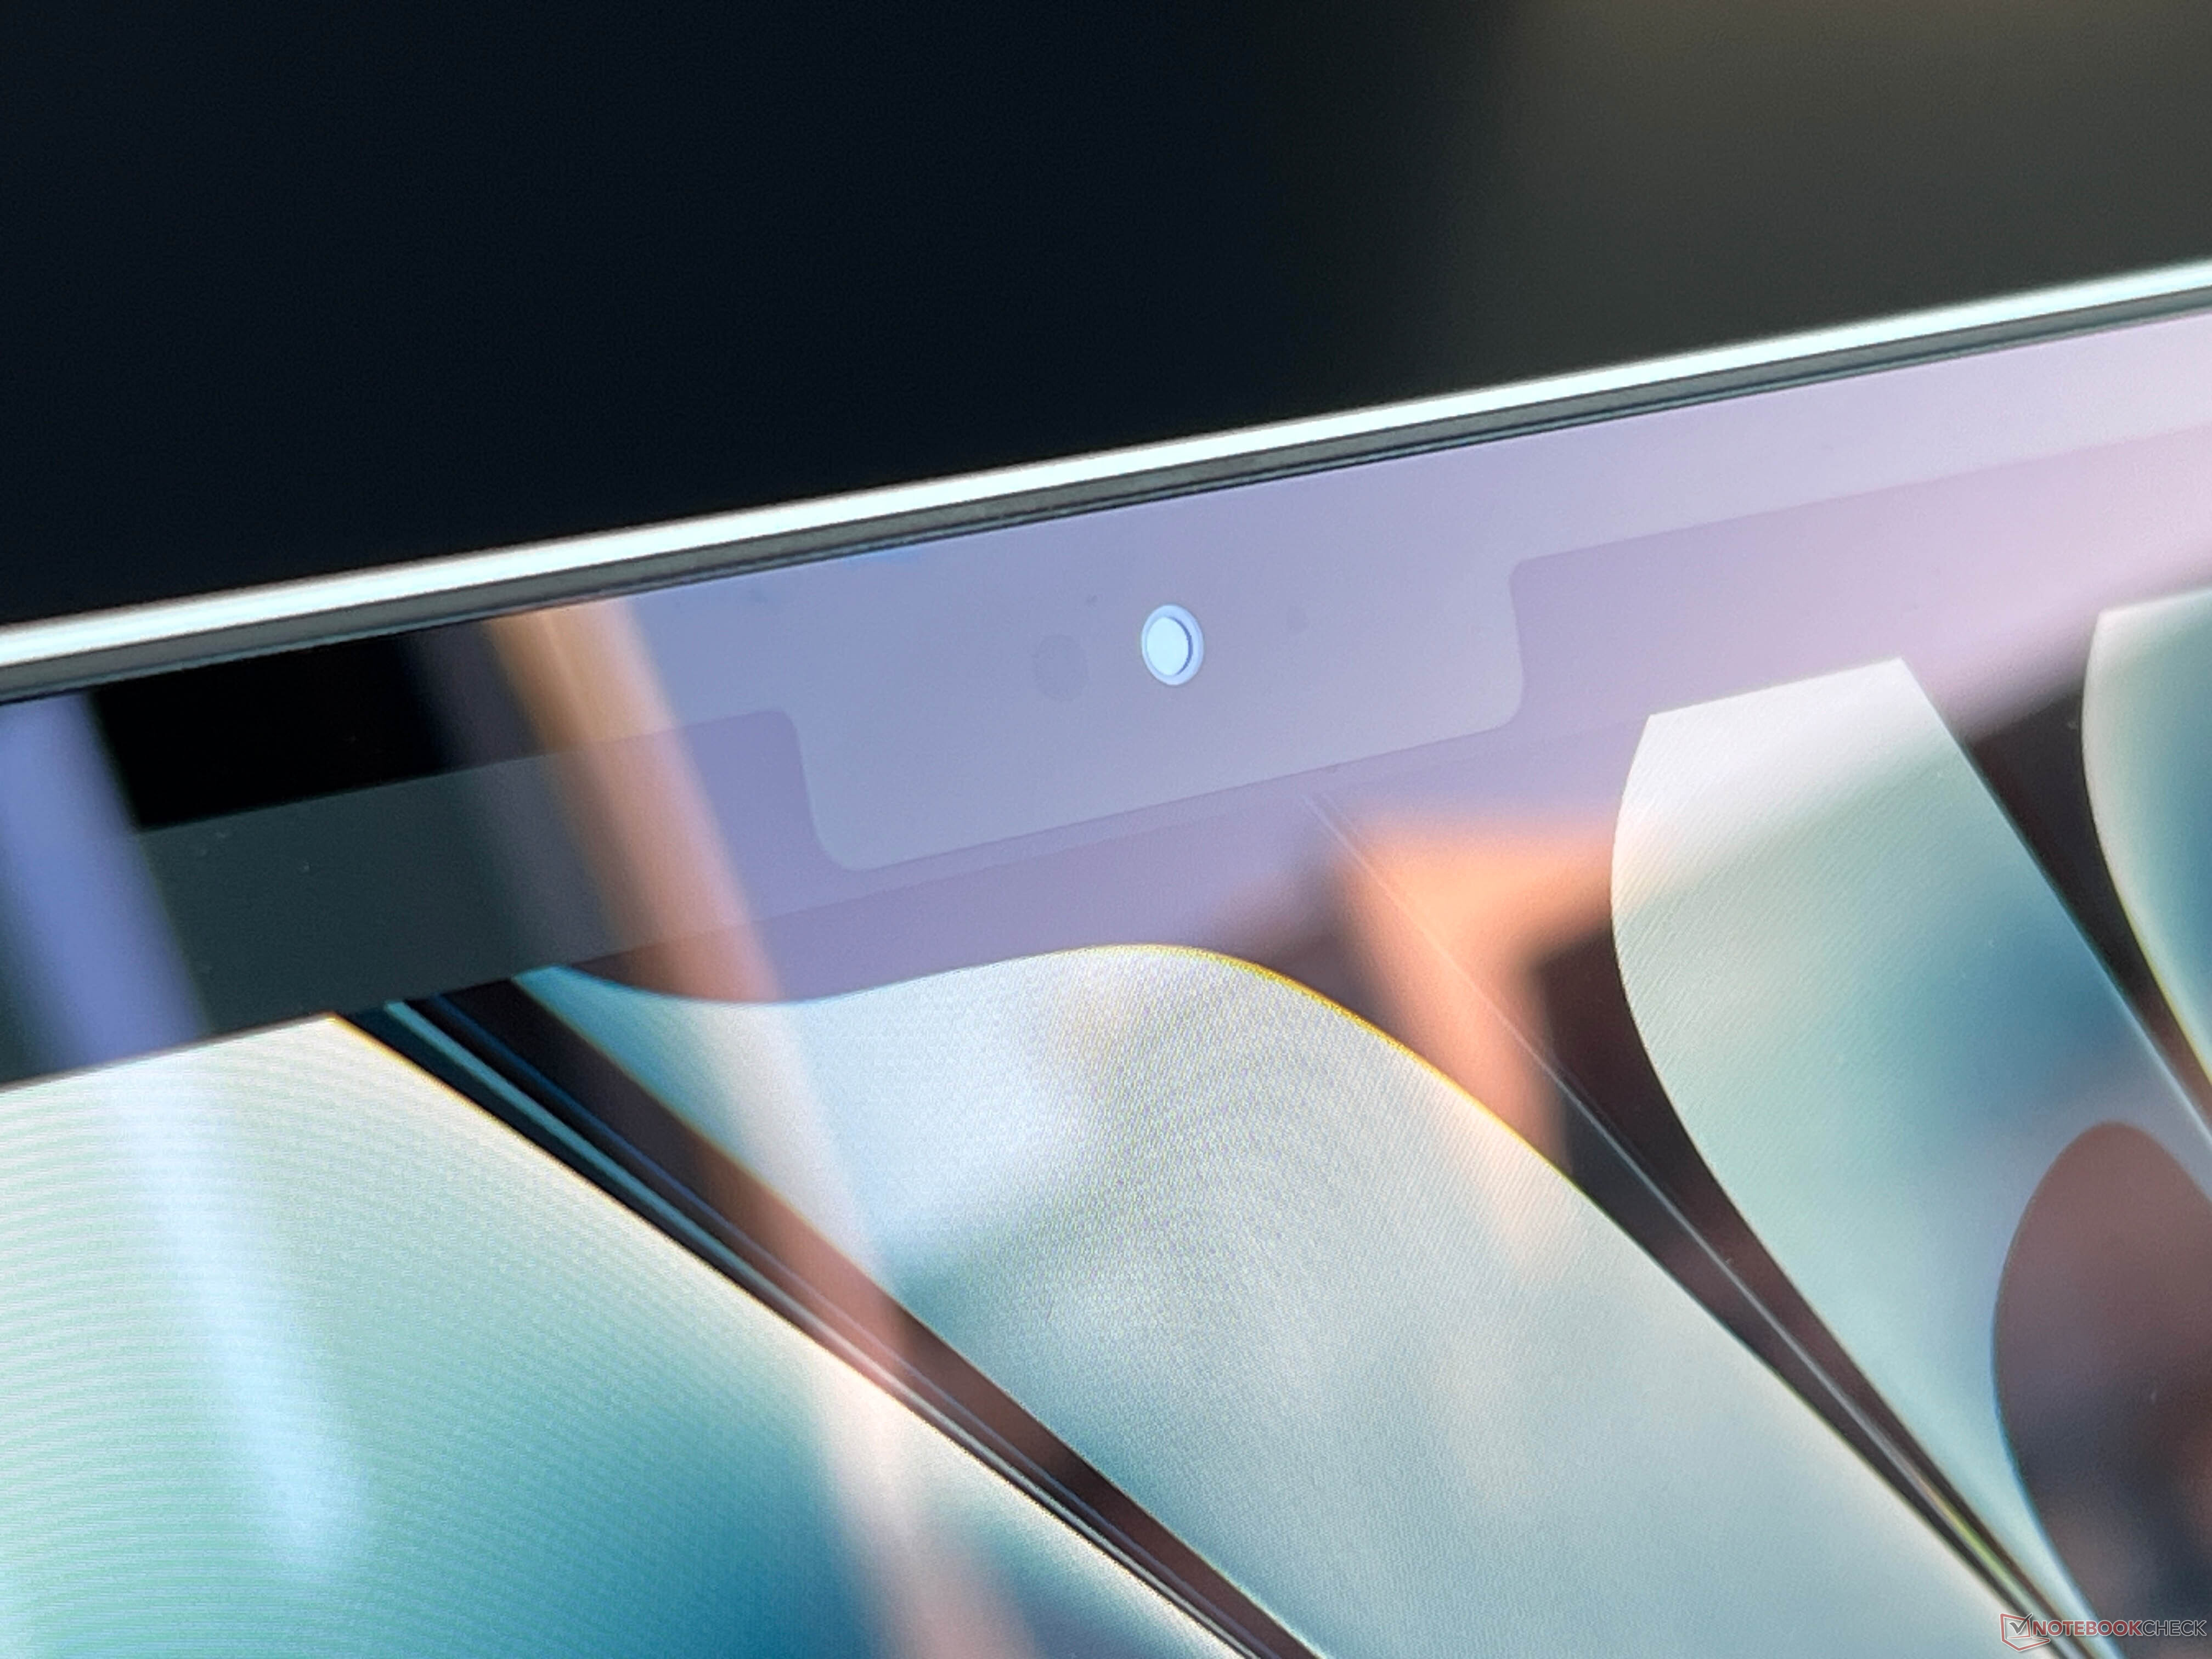
Mac 的 Wi-Fi 模块仍然支持包括蓝牙 5.3 在内的 Wi-Fi 6E,在我们使用华硕参考路由器进行的测试中,其传输速率非常稳定。网络摄像头有了重大升级,现在安装了一个 1200 万像素的传感器,除了图像跟踪(Center Stage)外,还支持桌面视图。


| Networking | |
| Apple MacBook Air 15 M4 | |
| iperf3 transmit AXE11000 | |
| iperf3 receive AXE11000 | |
| Lenovo ThinkPad X9-15 Aura Edition | |
| iperf3 transmit AXE11000 | |
| iperf3 receive AXE11000 | |
| Microsoft Surface Laptop 15 Snapdragon X Elite | |
| iperf3 transmit AXE11000 | |
| iperf3 receive AXE11000 | |
| iperf3 transmit AXE11000 6GHz | |
| iperf3 receive AXE11000 6GHz | |
| Lenovo Yoga Slim 7 15ILL9 Aura | |
| iperf3 transmit AXE11000 | |
| iperf3 receive AXE11000 | |
| iperf3 transmit AXE11000 6GHz | |
| iperf3 receive AXE11000 6GHz | |
| Asus Vivobook S 15 OLED Snapdragon | |
| iperf3 transmit AXE11000 | |
| iperf3 receive AXE11000 | |
| Apple MacBook Air 15 M3 | |
| iperf3 transmit AXE11000 | |
| iperf3 receive AXE11000 | |

, Apple SSD AP1024Z")
, Apple SSD AP1024Z")
可持续性
Apple 在其网站上提供了一份详细的环境报告。该设备由 55% 的可回收材料制成。
输入设备
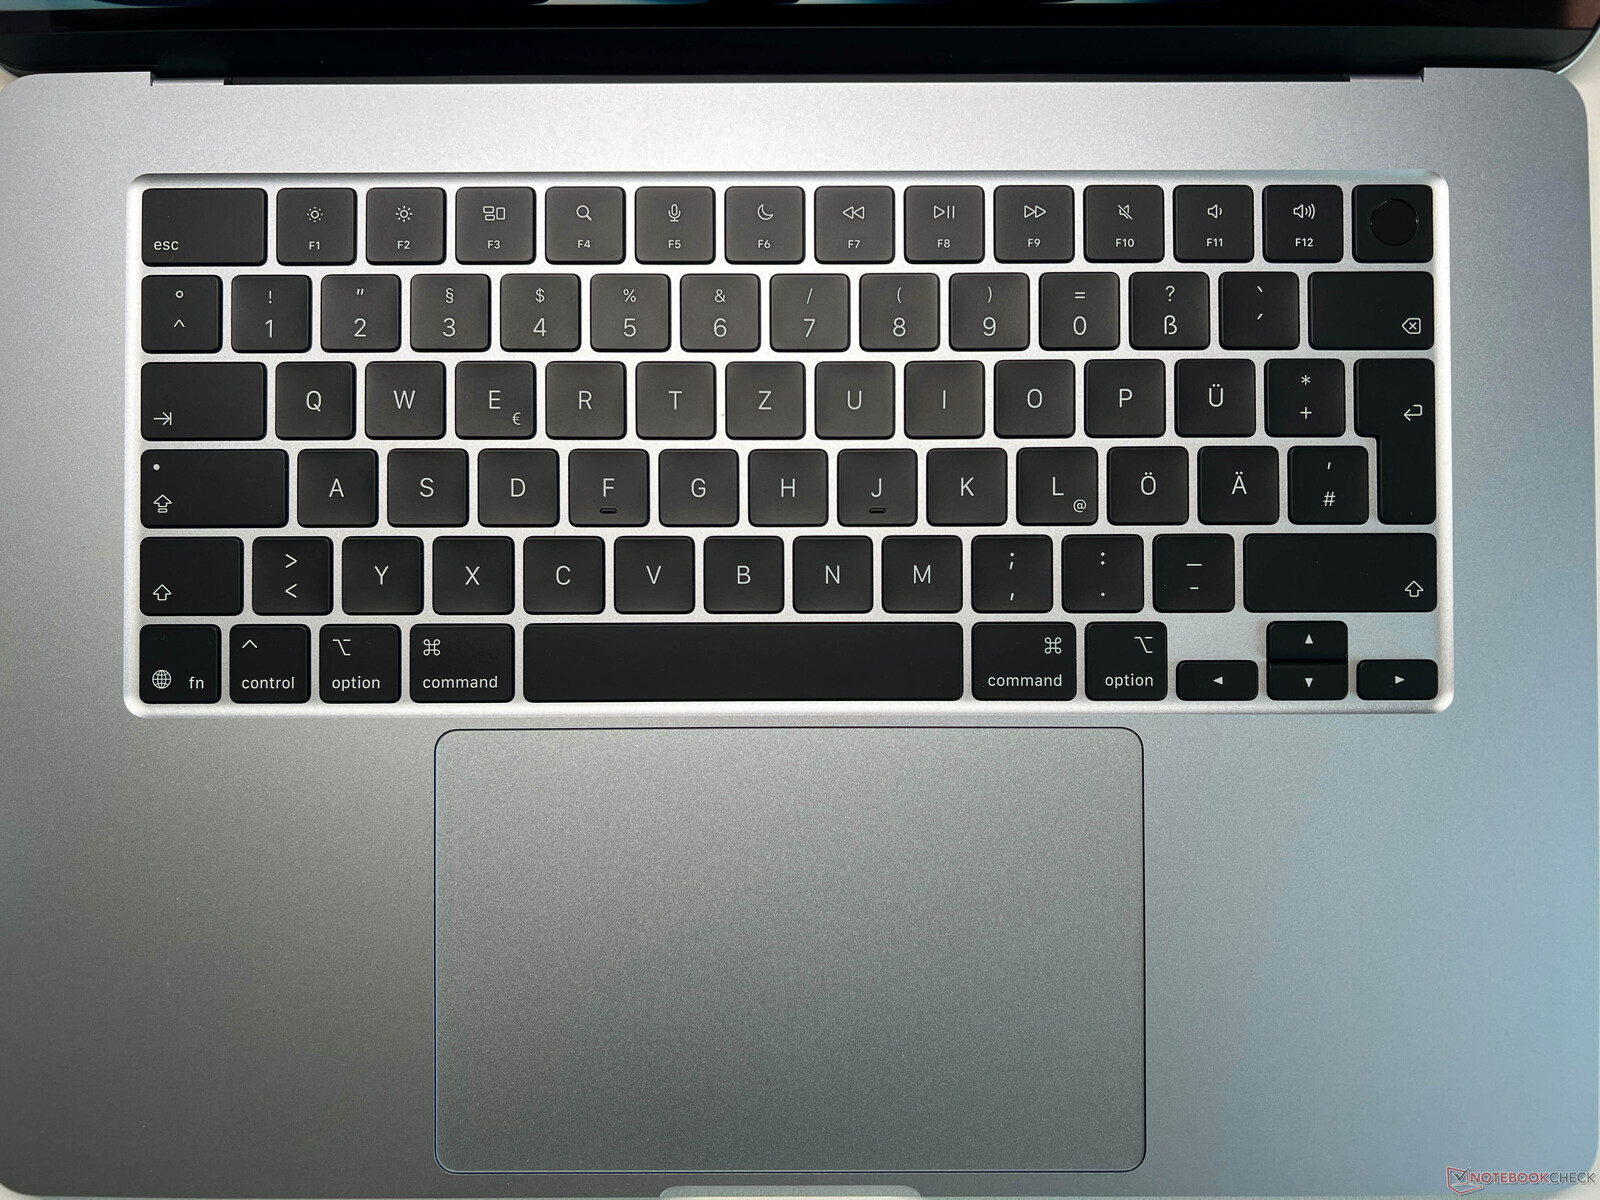
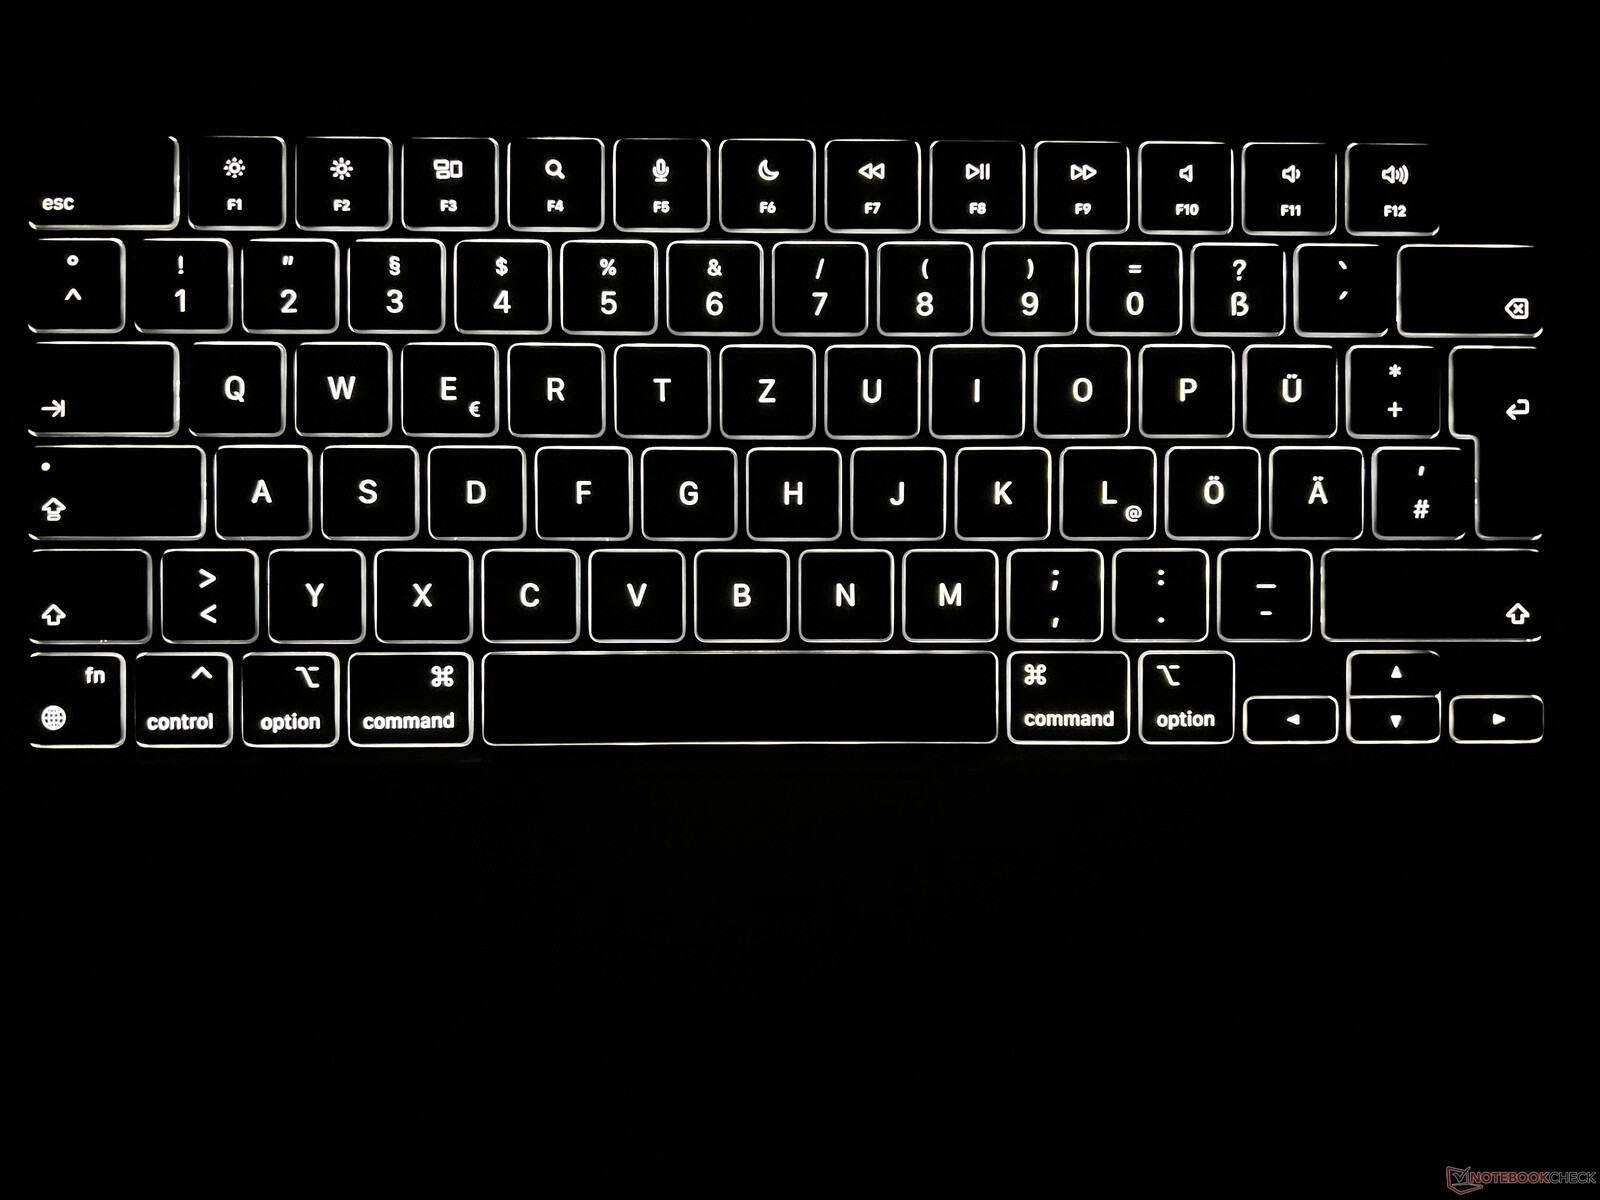
与前代机型相比,它的输入设备没有任何变化。这款笔记本电脑的键盘很舒适,但如果能增加一些键程就更好了。例如,ThinkPad X9 在这方面就有明显的优势。触觉触摸板依然运行出色,但Honor 或华为的竞争对手也在跟进,例如在边缘提供了额外的手势,这些手势由振动电机支持。因此,Apple 在这方面不再具有优势。
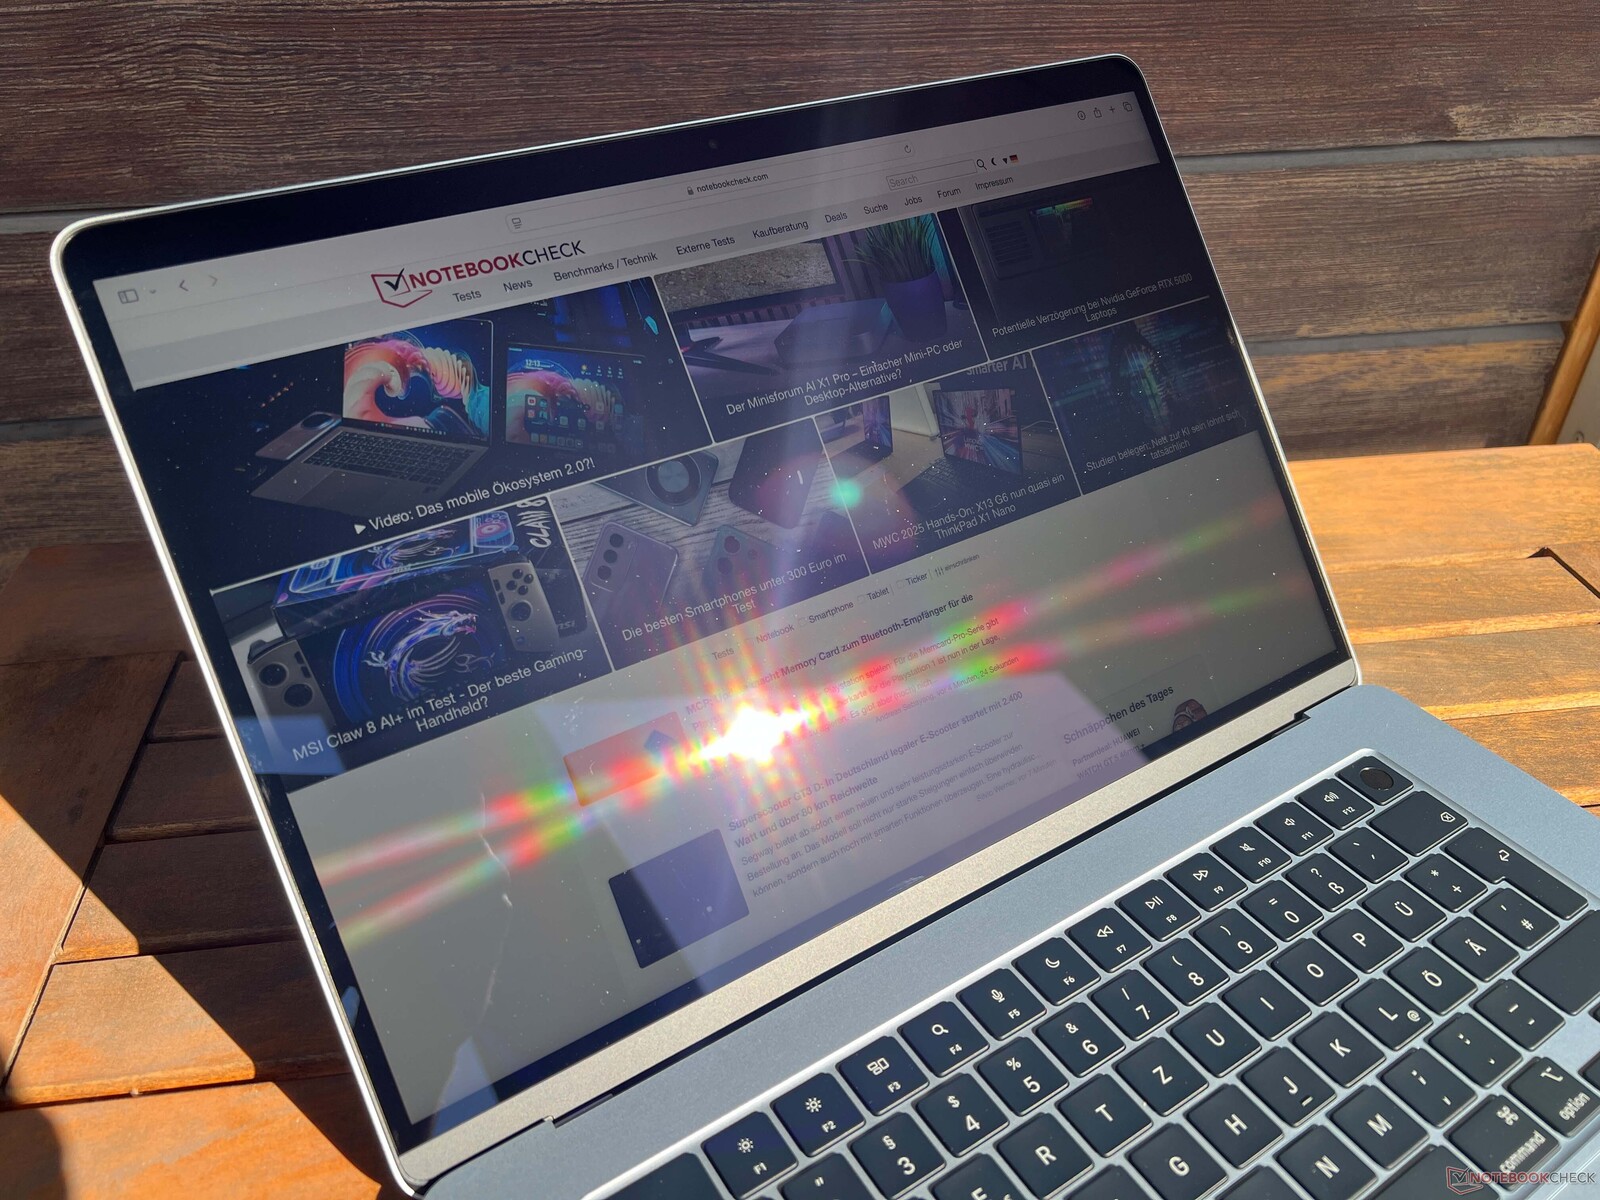
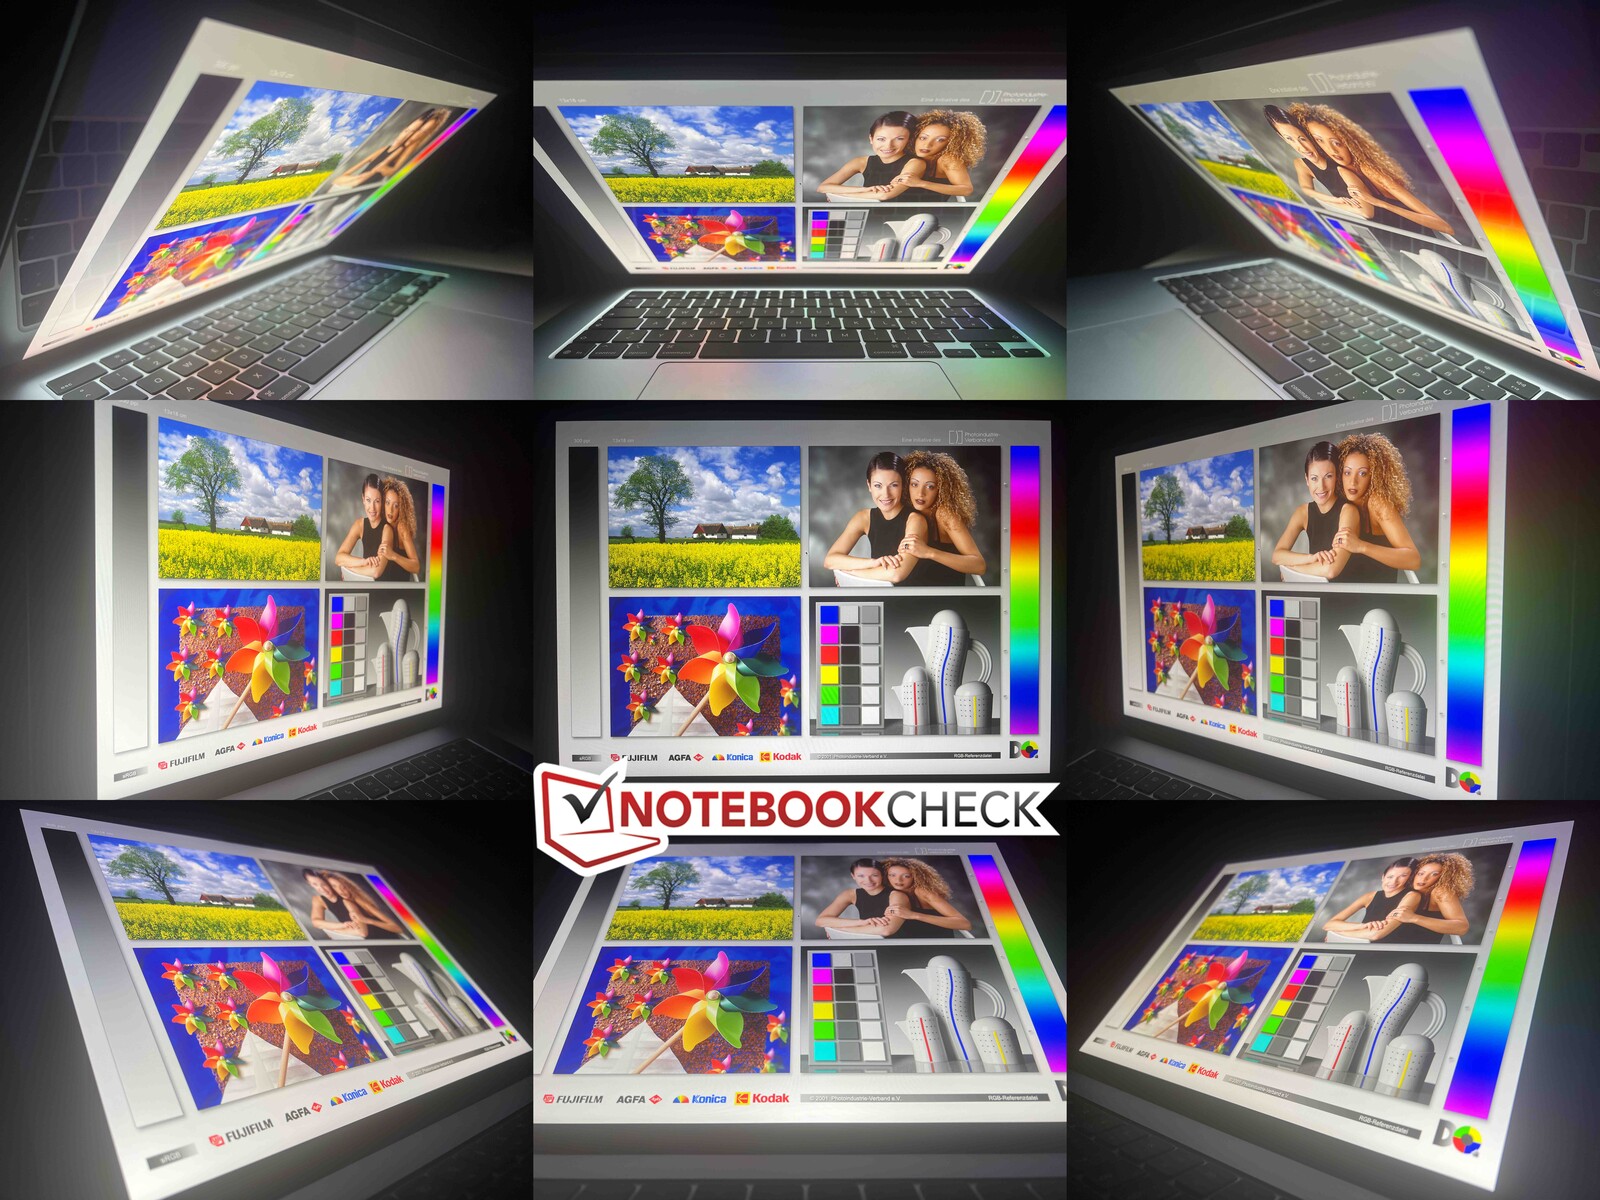
显示屏 - IPS,60 赫兹
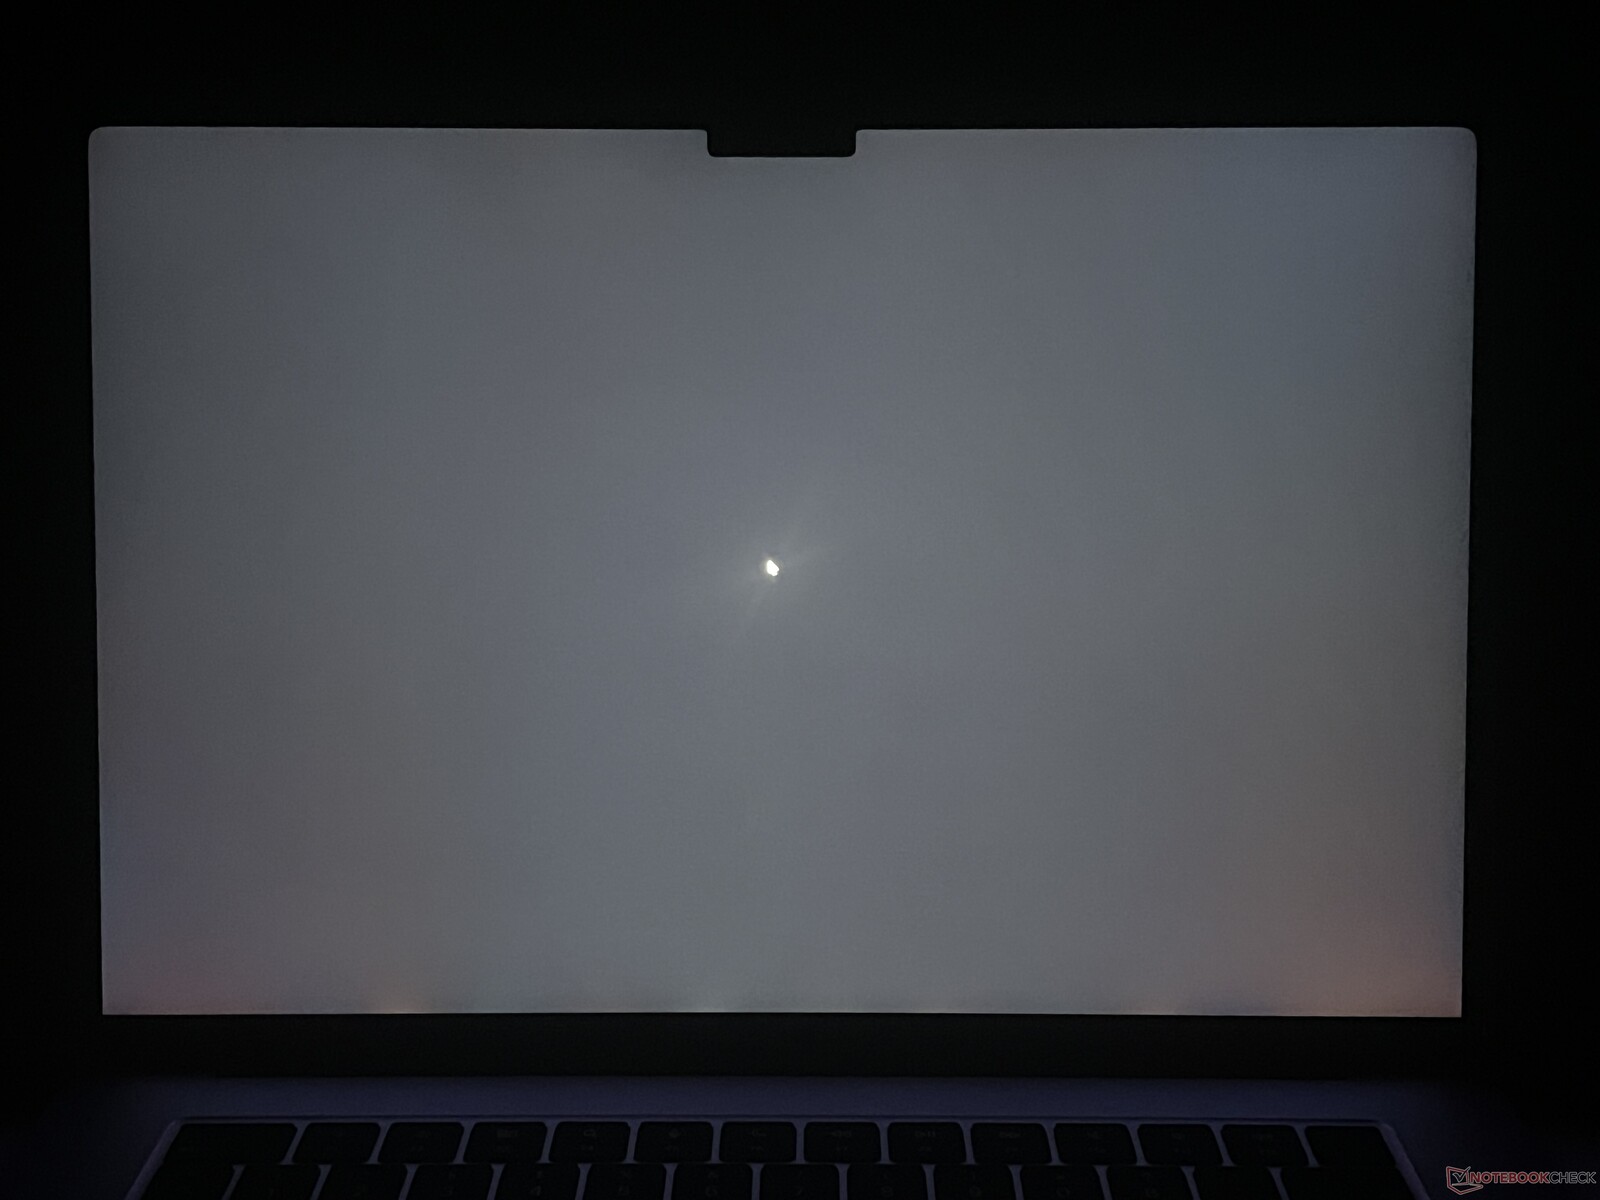
现在,MacBook Pro 配备了哑光显示屏,许多用户肯定希望 MacBook Air 能有更新,但遗憾的是,情况并非如此。但遗憾的是,MacBook Air 并没有这样做。它仍然使用我们熟悉的 IPS 屏幕,画质依然非常出色,没有任何 PWM 闪烁现象。亮度和色温都可以自动调节。它的频率也仍然是 60 赫兹,这在运动时会很明显。一些竞争对手在这方面做得更好。
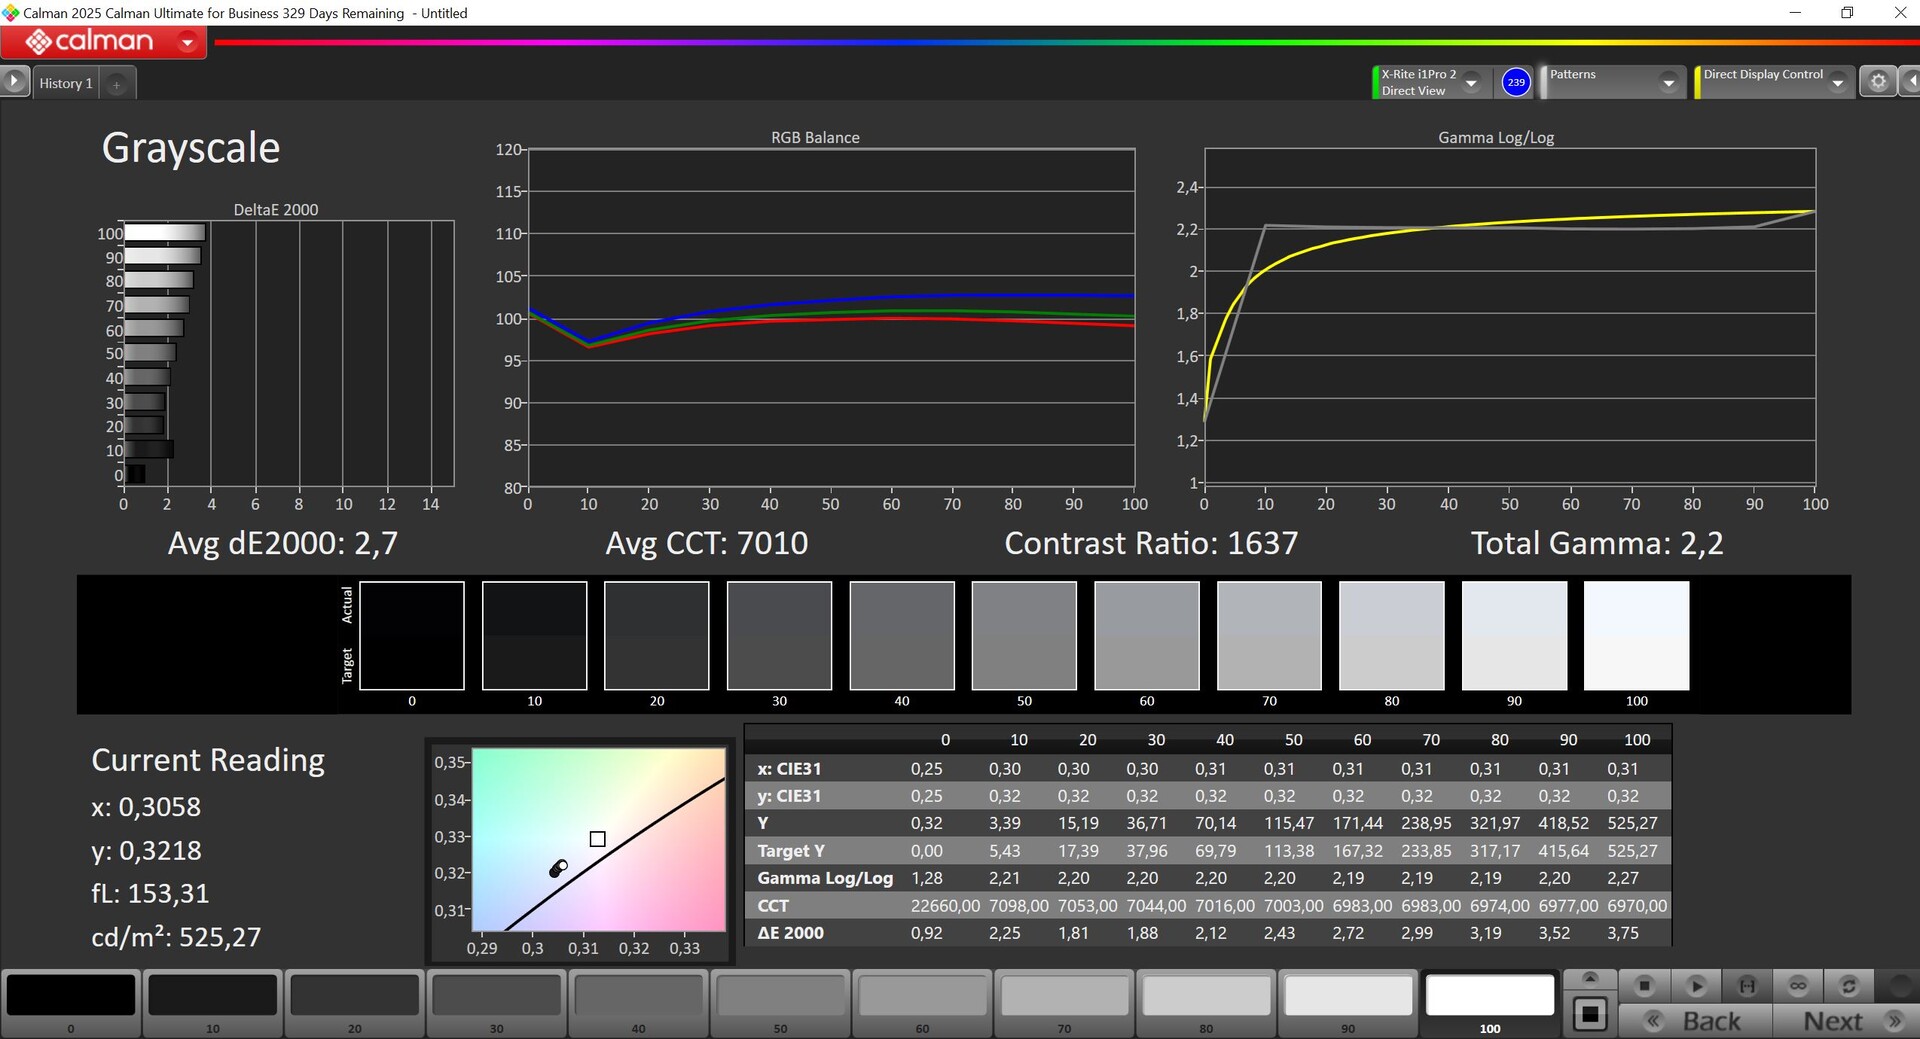
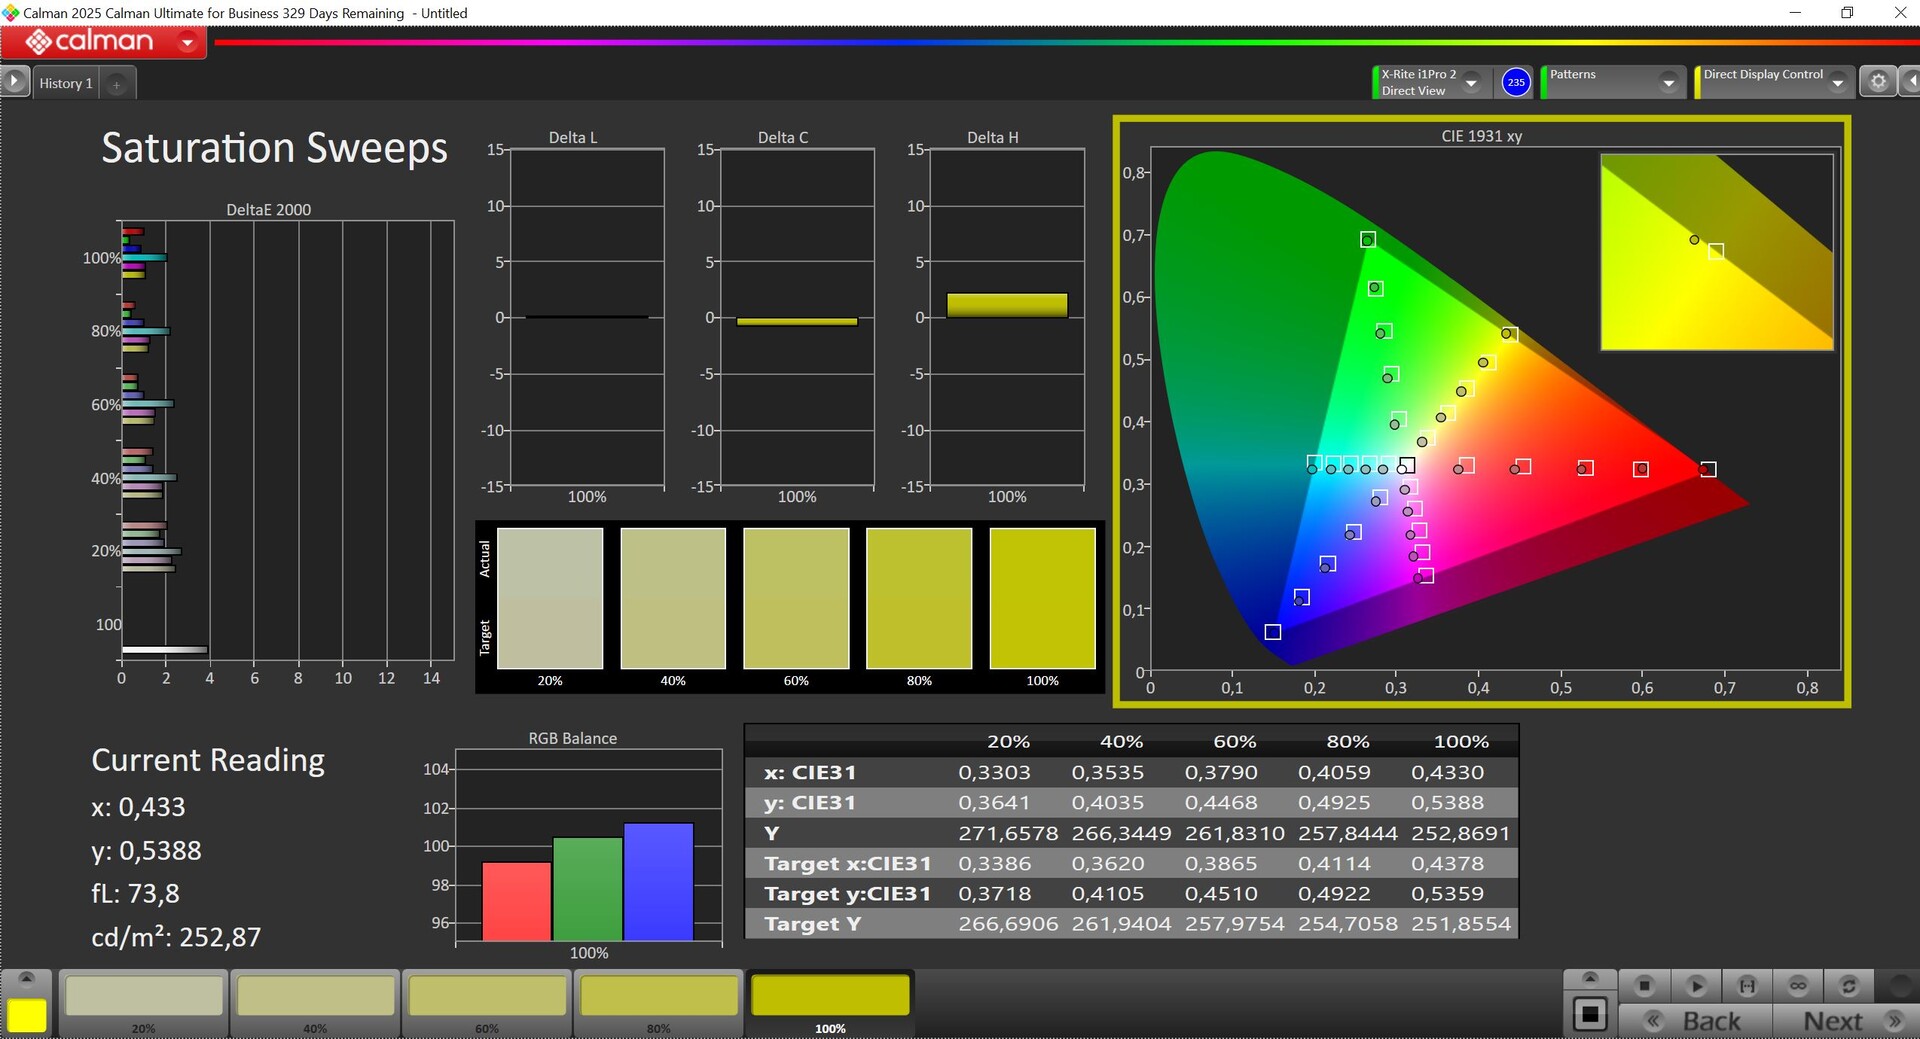
它的亮度超过 500 cd/m²,我们对它的黑阶或对比度没有太多的批评。它的出厂校准非常好,完全覆盖了 P3 色彩空间。即使在最大亮度下,背光也几乎没有出血现象,响应时间也很好。
| |||||||||||||||||||||||||
Brightness Distribution: 87 %
Center on Battery: 525 cd/m²
Contrast: 1641:1 (Black: 0.32 cd/m²)
ΔE Color 1.7 | 0.5-29.43 Ø4.87
ΔE Greyscale 2.7 | 0.5-98 Ø5.1
88.3% AdobeRGB 1998 (Argyll 2.2.0 3D)
100% sRGB (Argyll 2.2.0 3D)
98.7% Display P3 (Argyll 2.2.0 3D)
Gamma: 2.2
| Apple MacBook Air 15 M4 IPS, 2880x1864, 15.3", 60 Hz | Apple MacBook Air 15 M3 IPS, 2880x1664, 15.6", 60 Hz | Lenovo ThinkPad X9-15 Aura Edition ATNA53JB01-0, OLED, 2880x1800, 15.3", 120 Hz | Microsoft Surface Laptop 15 Snapdragon X Elite Sharp LQ150P1JX61, IPS, 2496x1664, 15", 120 Hz | Lenovo Yoga Slim 7 15ILL9 Aura CSOT T3 MNF307ZB1-1, IPS, 2880x1800, 15.3", 120 Hz | Asus Vivobook S 15 OLED Snapdragon ATNA56AC03-0, OLED, 2880x1620, 15.6", 120 Hz | |
|---|---|---|---|---|---|---|
| Display | -0% | 3% | -0% | |||
| Display P3 Coverage | 98.7 | 98.7 0% | 100 1% | 98.8 0% | ||
| sRGB Coverage | 100 | 99.9 0% | 100 0% | 100 0% | ||
| AdobeRGB 1998 Coverage | 88.3 | 87.8 -1% | 94.6 7% | 87.5 -1% | ||
| Response Times | -6% | 97% | -70% | -2% | 97% | |
| Response Time Grey 50% / Grey 80% * | 33.2 ? | 35.3 ? -6% | 1.46 ? 96% | 44.4 ? -34% | 27 ? 19% | 0.61 ? 98% |
| Response Time Black / White * | 14.7 ? | 15.6 ? -6% | 0.44 ? 97% | 30.3 ? -106% | 17.9 ? -22% | 0.67 ? 95% |
| PWM Frequency | 1200 ? | 240 ? | ||||
| Screen | 8% | 403% | 20% | -4% | 155% | |
| Brightness middle | 525 | 526 0% | 509 -3% | 579.9 10% | 509 -3% | 378 -28% |
| Brightness | 513 | 506 -1% | 508 -1% | 576 12% | 479 -7% | 379 -26% |
| Brightness Distribution | 87 | 92 6% | 97 11% | 92 6% | 90 3% | 98 13% |
| Black Level * | 0.32 | 0.37 -16% | 0.01 97% | 0.34 -6% | 0.32 -0% | 0.02 94% |
| Contrast | 1641 | 1422 -13% | 50900 3002% | 1706 4% | 1591 -3% | 18900 1052% |
| Colorchecker dE 2000 * | 1.7 | 1.4 18% | 1.1 35% | 0.96 44% | 2.47 -45% | 1 41% |
| Colorchecker dE 2000 max. * | 4 | 2 50% | 2.5 37% | 2.39 40% | 4.73 -18% | 2.6 35% |
| Greyscale dE 2000 * | 2.7 | 2.1 22% | 1.5 44% | 1.4 48% | 1.5 44% | 1.2 56% |
| Gamma | 2.2 100% | 2.23 99% | 2.28 96% | 2.13 103% | 2.19 100% | 2.19 100% |
| CCT | 7010 93% | 6865 95% | 6294 103% | 6407 101% | 6790 96% | 6460 101% |
| Colorchecker dE 2000 calibrated * | 0.6 | 1.06 | ||||
| Total Average (Program / Settings) | 1% /
4% | 168% /
263% | -25% /
2% | -2% /
-3% | 126% /
143% |
* ... smaller is better

Display Response Times
| ↔ Response Time Black to White | ||
|---|---|---|
| 14.7 ms ... rise ↗ and fall ↘ combined | ↗ 4.6 ms rise | 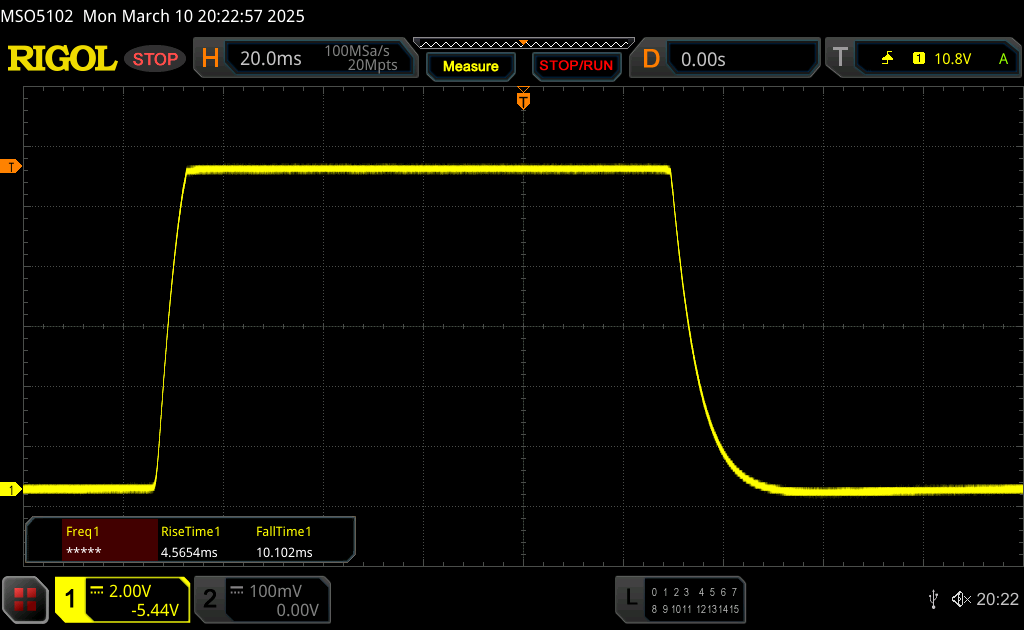 |
| ↘ 10.1 ms fall | ||
| The screen shows good response rates in our tests, but may be too slow for competitive gamers. In comparison, all tested devices range from 0.1 (minimum) to 240 (maximum) ms. » 33 % of all devices are better. This means that the measured response time is better than the average of all tested devices (20.8 ms). | ||
| ↔ Response Time 50% Grey to 80% Grey | ||
| 33.2 ms ... rise ↗ and fall ↘ combined | ↗ 10.5 ms rise | 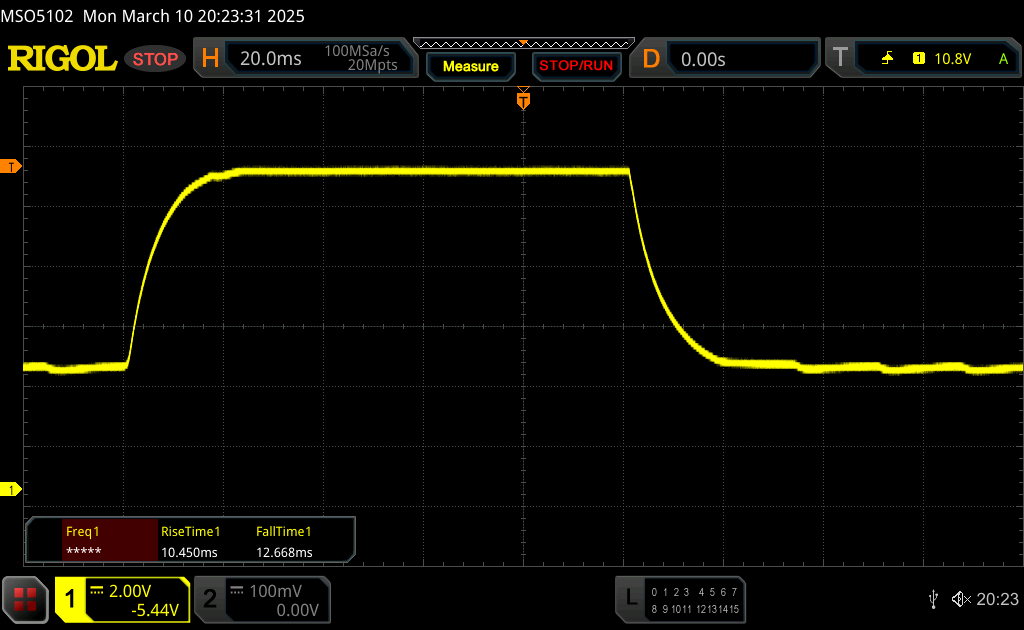 |
| ↘ 12.7 ms fall | ||
| The screen shows slow response rates in our tests and will be unsatisfactory for gamers. In comparison, all tested devices range from 0.165 (minimum) to 636 (maximum) ms. » 42 % of all devices are better. This means that the measured response time is similar to the average of all tested devices (32.5 ms). | ||
Screen Flickering / PWM (Pulse-Width Modulation)
| Screen flickering / PWM not detected |  | ||
In comparison: 53 % of all tested devices do not use PWM to dim the display. If PWM was detected, an average of 8523 (minimum: 5 - maximum: 343500) Hz was measured. | |||
性能 - MacBook Air 现配备高达 32GB 内存


处理器 - M4 SoC
我们已经熟悉了 M4 SoC它的整体性能再次非常出色。M4 在测试设备内的最大功耗为 20.5 瓦,但在我们的测试过程中,功耗迅速降低,并在连续负载 20 分钟后最终稳定在 9 瓦(1 分钟后约为 15.5 瓦;5 分钟后为 12 瓦)。因此,它的多核性能略低于 MacBook Pro,但总体上仍然非常出色,特别是考虑到它运行 Cinebench 2024 多核测试的时间(几分钟)。30 分钟后,它的性能为 776 分,仅比 Lunar Lake 竞争对手低 11%,因此仍优于 Lunar Lake 竞争对手。在更短的 Geekbench 测试中,它的表现甚至更好。
不过,M4 的真正亮点是其巨大的单核性能,它不必躲避其较大的同胞兄弟 M4 Pro/Max。根据不同的基准测试,M4 的性能比目前的 Lunar Lake 或快速 Snapdragon 双核 Turbo 机型高出 30-45%。一如既往,它在电池模式下的性能绝对稳定。
Cinebench 2024: CPU Multi Core | CPU Single Core
Geekbench 6.4: Multi-Core | Single-Core
| Cinebench 2024 / CPU Multi Core | |
| Apple MacBook Pro 14 2024 M4 | |
| Asus Vivobook S 15 OLED Snapdragon | |
| Average Apple M4 (10 cores) (874 - 986, n=4) | |
| Microsoft Surface Laptop 15 Snapdragon X Elite | |
| Apple MacBook Air 15 M4 | |
| Lenovo Yoga Slim 7 15ILL9 Aura | |
| Apple MacBook Air 15 M3 | |
| Lenovo ThinkPad X9-15 Aura Edition | |
| Cinebench 2024 / CPU Single Core | |
| Average Apple M4 (10 cores) (173 - 177, n=4) | |
| Apple MacBook Pro 14 2024 M4 | |
| Apple MacBook Air 15 M4 | |
| Apple MacBook Air 15 M3 | |
| Microsoft Surface Laptop 15 Snapdragon X Elite | |
| Lenovo Yoga Slim 7 15ILL9 Aura | |
| Lenovo ThinkPad X9-15 Aura Edition | |
| Asus Vivobook S 15 OLED Snapdragon | |
| Power Consumption / Cinebench 2024 Single Power Efficiency - external Monitor | |
| Apple MacBook Pro 14 2024 M4 | |
| Apple MacBook Air 15 M4 | |
| Apple MacBook Air 13 M3 8C GPU | |
| Asus ZenBook A14 UX3407QA | |
| Asus Vivobook S 14 OLED S5406SA | |
| Microsoft Surface Laptop 7 13.8 Copilot+ | |
| Honor MagicBook Art 14 Snapdragon | |
| Lenovo ThinkPad X9-15 Aura Edition | |
| Asus ZenBook Duo OLED UX8406CA | |
| Xiaomi RedmiBook 14 2025 | |
| Asus Zenbook S 16 UM5606-RK333W | |
| Asus ROG Flow Z13 GZ302EA-RU073W | |
| Power Consumption / Cinebench 2024 Multi Power Efficiency - external Monitor | |
| Apple MacBook Air 15 M4 | |
| Apple MacBook Air 13 M3 8C GPU | |
| Apple MacBook Pro 14 2024 M4 | |
| Microsoft Surface Laptop 7 13.8 Copilot+ | |
| Asus Zenbook S 16 UM5606-RK333W | |
| Asus ZenBook Duo OLED UX8406CA | |
| Asus ZenBook A14 UX3407QA | |
| Honor MagicBook Art 14 Snapdragon | |
| Asus ROG Flow Z13 GZ302EA-RU073W | |
| Lenovo ThinkPad X9-15 Aura Edition | |
| Xiaomi RedmiBook 14 2025 | |
| Asus Vivobook S 14 OLED S5406SA | |
系统性能
全新 MacBook Air 15 M4 是一款速度极快的笔记本电脑,其合成基准测试结果令人印象深刻。在跨平台的 CrossMark 测试中,MacBook 的性能超过了整个 Windows 竞争产品。标准配置为 16GB 内存,现在可以选择最大 32GB 内存(需额外支付 400 美元)。
WebXPRT 3: Overall
WebXPRT 4: Overall
Mozilla Kraken 1.1: Total
| CrossMark / Overall | |
| Average Apple M4 (10 cores), Apple M4 10-core GPU (1944 - 2066, n=4) | |
| Apple MacBook Air 15 M4 | |
| Apple MacBook Air 15 M3 | |
| Lenovo ThinkPad X9-15 Aura Edition | |
| Lenovo Yoga Slim 7 15ILL9 Aura | |
| Average of class Subnotebook (365 - 2018, n=68, last 2 years) | |
| Microsoft Surface Laptop 15 Snapdragon X Elite | |
| Asus Vivobook S 15 OLED Snapdragon | |
| CrossMark / Productivity | |
| Average Apple M4 (10 cores), Apple M4 10-core GPU (1797 - 1933, n=4) | |
| Apple MacBook Air 15 M4 | |
| Apple MacBook Air 15 M3 | |
| Lenovo ThinkPad X9-15 Aura Edition | |
| Lenovo Yoga Slim 7 15ILL9 Aura | |
| Average of class Subnotebook (364 - 1875, n=68, last 2 years) | |
| Microsoft Surface Laptop 15 Snapdragon X Elite | |
| Asus Vivobook S 15 OLED Snapdragon | |
| CrossMark / Creativity | |
| Average Apple M4 (10 cores), Apple M4 10-core GPU (2298 - 2420, n=4) | |
| Apple MacBook Air 15 M4 | |
| Apple MacBook Air 15 M3 | |
| Lenovo ThinkPad X9-15 Aura Edition | |
| Lenovo Yoga Slim 7 15ILL9 Aura | |
| Average of class Subnotebook (372 - 2396, n=68, last 2 years) | |
| Microsoft Surface Laptop 15 Snapdragon X Elite | |
| Asus Vivobook S 15 OLED Snapdragon | |
| CrossMark / Responsiveness | |
| Average Apple M4 (10 cores), Apple M4 10-core GPU (1393 - 1569, n=4) | |
| Apple MacBook Air 15 M4 | |
| Apple MacBook Air 15 M3 | |
| Average of class Subnotebook (312 - 1899, n=68, last 2 years) | |
| Lenovo ThinkPad X9-15 Aura Edition | |
| Microsoft Surface Laptop 15 Snapdragon X Elite | |
| Lenovo Yoga Slim 7 15ILL9 Aura | |
| Asus Vivobook S 15 OLED Snapdragon | |
| WebXPRT 3 / Overall | |
| Apple MacBook Air 15 M4 | |
| Average Apple M4 (10 cores), Apple M4 10-core GPU (430 - 479, n=4) | |
| Apple MacBook Air 15 M3 | |
| Microsoft Surface Laptop 15 Snapdragon X Elite | |
| Asus Vivobook S 15 OLED Snapdragon | |
| Average of class Subnotebook (156 - 479, n=67, last 2 years) | |
| Lenovo Yoga Slim 7 15ILL9 Aura | |
| Lenovo ThinkPad X9-15 Aura Edition | |
| WebXPRT 4 / Overall | |
| Apple MacBook Air 15 M4 | |
| Average Apple M4 (10 cores), Apple M4 10-core GPU (315 - 348, n=4) | |
| Apple MacBook Air 15 M3 | |
| Microsoft Surface Laptop 15 Snapdragon X Elite | |
| Asus Vivobook S 15 OLED Snapdragon | |
| Lenovo Yoga Slim 7 15ILL9 Aura | |
| Lenovo ThinkPad X9-15 Aura Edition | |
| Average of class Subnotebook (132 - 348, n=68, last 2 years) | |
| Mozilla Kraken 1.1 / Total | |
| Average of class Subnotebook (278 - 1104, n=76, last 2 years) | |
| Lenovo Yoga Slim 7 15ILL9 Aura | |
| Lenovo ThinkPad X9-15 Aura Edition | |
| Asus Vivobook S 15 OLED Snapdragon | |
| Microsoft Surface Laptop 15 Snapdragon X Elite | |
| Apple MacBook Air 15 M3 | |
| Average Apple M4 (10 cores), Apple M4 10-core GPU (262 - 319, n=4) | |
| Apple MacBook Air 15 M4 | |
* ... smaller is better
存储设备
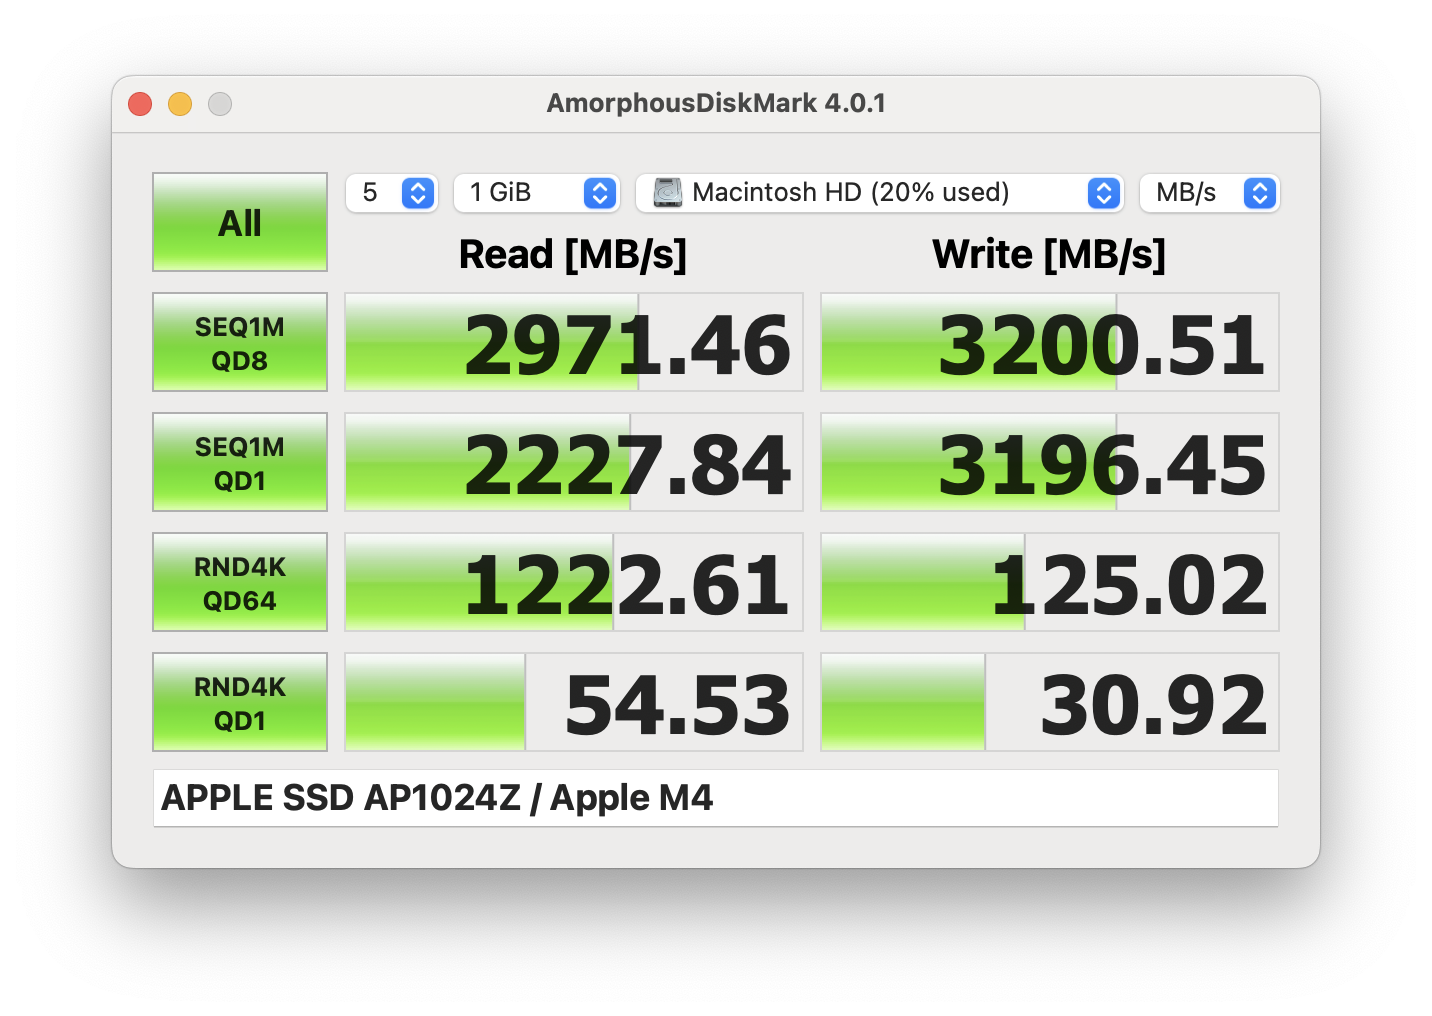
现在它的内存至少是 16GB,但 MacBook 的固态硬盘容量仍然是 256GB。我们测试设备中的 1TB SSD(板载)使其总价提高了 600 美元之多。它的传输速度不是特别快,最高只有 3GB/s,但对于日常使用来说已经足够了。首次启动设备后,用户可以使用 955 GB 的容量。
| Blackmagic Disk Speed Test / 5GB Read | |
| Apple MacBook Pro 16 2024 M4 Pro | |
| Apple MacBook Pro 14 2024 M4 Pro Entry | |
| Apple MacBook Pro 16 M4 Max | |
| Average Apple SSD AP1024Z (2797 - 5175, n=8) | |
| Apple MacBook Pro 14 2024 M4 | |
| Apple MacBook Air 15 M3 | |
| Apple MacBook Air 15 M4 | |
| Average of class Subnotebook (2848 - 2948, n=4, last 2 years) | |
| Apple Mac Mini M4 | |
| Blackmagic Disk Speed Test / 5GB Write | |
| Apple MacBook Pro 16 2024 M4 Pro | |
| Apple MacBook Pro 14 2024 M4 Pro Entry | |
| Apple MacBook Pro 16 M4 Max | |
| Average Apple SSD AP1024Z (2873 - 6431, n=8) | |
| Apple MacBook Pro 14 2024 M4 | |
| Apple MacBook Air 15 M3 | |
| Average of class Subnotebook (2873 - 3243, n=4, last 2 years) | |
| Apple MacBook Air 15 M4 | |
| Apple Mac Mini M4 | |
图形卡
在我们的测试中,配备 10 个内核的 M4 GPU 性能非常出色,尤其是在与 Lunar Lake iGPU 直接比较时。它的性能也与 M4 MacBook Pro 相当--至少在短期基准测试中是如此。在较长的负载情况下,图形处理器的性能下降了约 22%。它的游戏性能也相当不错,尽管原生游戏(如本例中的《博德之门 3》)的可用性仍然是限制因素。
GFXBench: 3840x2160 4K Aztec Ruins High Tier Offscreen | 2560x1440 Aztec Ruins High Tier Offscreen
Geekbench 6.4: GPU Metal | GPU OpenCL
| 3DMark / Steel Nomad Light Score | |
| Apple MacBook Pro 14 2024 M4 | |
| Apple MacBook Air 15 M4 | |
| Average Apple M4 10-core GPU (3583 - 3989, n=5) | |
| Lenovo ThinkPad X9-15 Aura Edition | |
| Average of class Subnotebook (1034 - 3839, n=19, last 2 years) | |
| Asus Vivobook S 15 OLED Snapdragon | |
| 3DMark / Wild Life Extreme | |
| Apple MacBook Pro 14 2024 M4 | |
| Apple MacBook Air 15 M4 | |
| Average Apple M4 10-core GPU (7335 - 9162, n=4) | |
| Lenovo ThinkPad X9-15 Aura Edition | |
| Microsoft Surface Laptop 15 Snapdragon X Elite | |
| Average of class Subnotebook (659 - 8735, n=20, last 2 years) | |
| 3DMark / Wild Life Extreme Unlimited | |
| Apple MacBook Pro 14 2024 M4 | |
| Average Apple M4 10-core GPU (8457 - 9636, n=5) | |
| Apple MacBook Air 15 M4 | |
| Apple MacBook Air 15 M3 | |
| Lenovo ThinkPad X9-15 Aura Edition | |
| Asus Vivobook S 15 OLED Snapdragon | |
| Average of class Subnotebook (2798 - 9092, n=31, last 2 years) | |
| GFXBench / 4K Aztec Ruins High Tier Offscreen | |
| Apple MacBook Pro 14 2024 M4 | |
| Average Apple M4 10-core GPU (48.6 - 63.1, n=5) | |
| Apple MacBook Air 15 M4 | |
| Apple MacBook Air 15 M3 | |
| Asus Vivobook S 15 OLED Snapdragon | |
| Average of class Subnotebook (16.3 - 88.9, n=16, last 2 years) | |
| GFXBench / Aztec Ruins High Tier Offscreen | |
| Apple MacBook Pro 14 2024 M4 | |
| Average Apple M4 10-core GPU (105.4 - 144, n=5) | |
| Apple MacBook Air 15 M4 | |
| Apple MacBook Air 15 M3 | |
| Asus Vivobook S 15 OLED Snapdragon | |
| Average of class Subnotebook (37.4 - 123.3, n=15, last 2 years) | |
| Geekbench 6.4 / GPU Metal | |
| Apple MacBook Pro 14 2024 M4 | |
| Average Apple M4 10-core GPU (53465 - 57998, n=4) | |
| Apple MacBook Air 15 M4 | |
| Average of class Subnotebook (45460 - 54887, n=4, last 2 years) | |
| Apple MacBook Air 15 M3 | |
| 3DMark Steel Nomad Light Score | 3839 points | |
| 3DMark Steel Nomad Light Unlimited Score | 3851 points | |
Help | ||
| Blender / v3.3 Classroom METAL | |
| Average of class Subnotebook (103 - 237, n=4, last 2 years) | |
| Apple MacBook Air 15 M3 | |
| Apple MacBook Air 15 M4 | |
| Average Apple M4 10-core GPU (n=1) | |
| Blender / v3.3 Classroom CPU | |
| Microsoft Surface Laptop 15 Snapdragon X Elite | |
| Lenovo ThinkPad X9-15 Aura Edition | |
| Average of class Subnotebook (241 - 1127, n=72, last 2 years) | |
| Asus Vivobook S 15 OLED Snapdragon | |
| Lenovo Yoga Slim 7 15ILL9 Aura | |
| Apple MacBook Air 15 M3 | |
| Apple MacBook Air 15 M4 | |
| Average Apple M4 10-core GPU (n=1) | |
| Blender / v3.3 Classroom oneAPI/Intel | |
| Average of class Subnotebook (210 - 368, n=7, last 2 years) | |
| Lenovo Yoga Slim 7 15ILL9 Aura | |
* ... smaller is better
| Cyberpunk 2077 2.2 Phantom Liberty - 1920x1080 Ultra Preset (FSR off) | |
| Apple MacBook Pro 14 2024 M4 Pro Entry | |
| Lenovo ThinkPad X9-15 Aura Edition | |
| Average of class Subnotebook (8.48 - 31.4, n=47, last 2 years) | |
| Apple MacBook Pro 14 2024 M4 | |
| Lenovo Yoga Slim 7 15ILL9 Aura | |
| Apple MacBook Air 15 M4 | |
| Asus Vivobook S 15 OLED Snapdragon | |
| Total War Pharaoh - 1920x1080 Ultra Preset | |
| Apple MacBook Pro 14 2024 M4 Pro Entry | |
| Apple MacBook Pro 14 2024 M4 | |
| Apple MacBook Air 15 M4 | |
| Average of class Subnotebook (16.7 - 50, n=8, last 2 years) | |
| Apple MacBook Air 13 M3 10C GPU | |
| Shadow of the Tomb Raider - 1920x1080 Highest Preset AA:T | |
| Apple MacBook Pro 14 2024 M4 Pro Entry | |
| Apple MacBook Pro 14 2024 M4 | |
| Apple MacBook Air 15 M4 | |
| Apple MacBook Air 13 M3 10C GPU | |
| Average of class Subnotebook (22.4 - 34, n=5, last 2 years) | |
Cyberpunk 2077 ultra FPS diagram
| low | med. | high | ultra | |
|---|---|---|---|---|
| Shadow of the Tomb Raider (2018) | 106 | 43 | 39 | 34 |
| Baldur's Gate 3 (2023) | 44.7 | 34.2 | 29.8 | 27.9 |
| Cyberpunk 2077 2.2 Phantom Liberty (2023) | 32.5 | 26.1 | 21.9 | 18 |
| Total War Pharaoh (2023) | 51.1 | 45.7 | 44.5 | 35.2 |
排放与能源
噪音排放
MacBook Air 15 继续采用被动散热方式,因此在任何情况下都能保持完全静音,这与其 Windows 竞争对手相比简直是巨大的优势。
| Apple MacBook Air 15 M4 M4 10-Core GPU, M4 (10 cores), Apple SSD AP1024Z | Apple MacBook Air 15 M3 M3 10-Core GPU, M3, Apple SSD AP0512Z | Lenovo ThinkPad X9-15 Aura Edition Arc 140V, Core Ultra 7 258V, WD PC SN740 SDDQMQD-1T00 | Microsoft Surface Laptop 15 Snapdragon X Elite Adreno X1-85 3.8 TFLOPS, SD X Elite X1E-80-100, Samsung PM9B1 256GB MZ9L4256HCJQ | Lenovo Yoga Slim 7 15ILL9 Aura Arc 140V, Core Ultra 7 256V | Asus Vivobook S 15 OLED Snapdragon Adreno X1-85 3.8 TFLOPS, SD X Elite X1E-78-100, Micron 2400 MTFDKBA1T0QFM | |
|---|---|---|---|---|---|---|
| Noise | ||||||
| off / environment * | 24.4 | 23.3 | 23.2 | 24.3 | ||
| Idle Minimum * | 24.4 | 23.3 | 23.2 | 24.3 | ||
| Idle Average * | 24.4 | 23.3 | 23.2 | 24.3 | ||
| Idle Maximum * | 24.4 | 23.3 | 26.1 | 26.2 | ||
| Load Average * | 35.8 | 25.7 | 30.9 | 32.5 | ||
| Cyberpunk 2077 ultra * | 39.4 | 31.1 | 34.1 | 35.2 | ||
| Load Maximum * | 45 | 33.2 | 44.3 | 39.8 |
* ... smaller is better
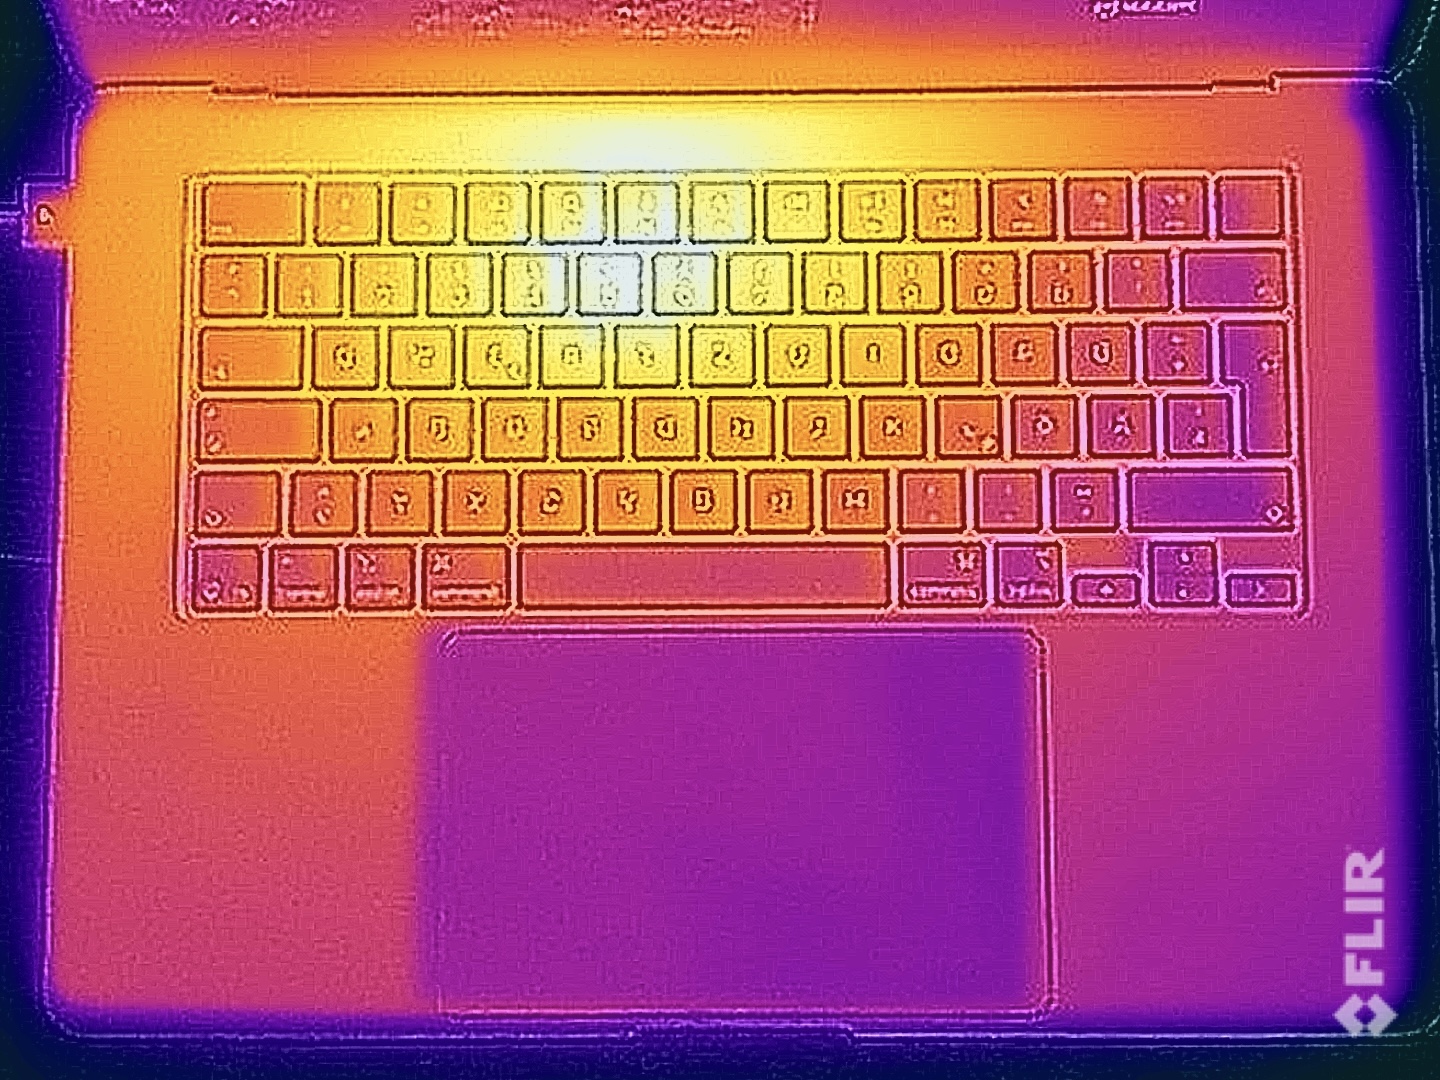
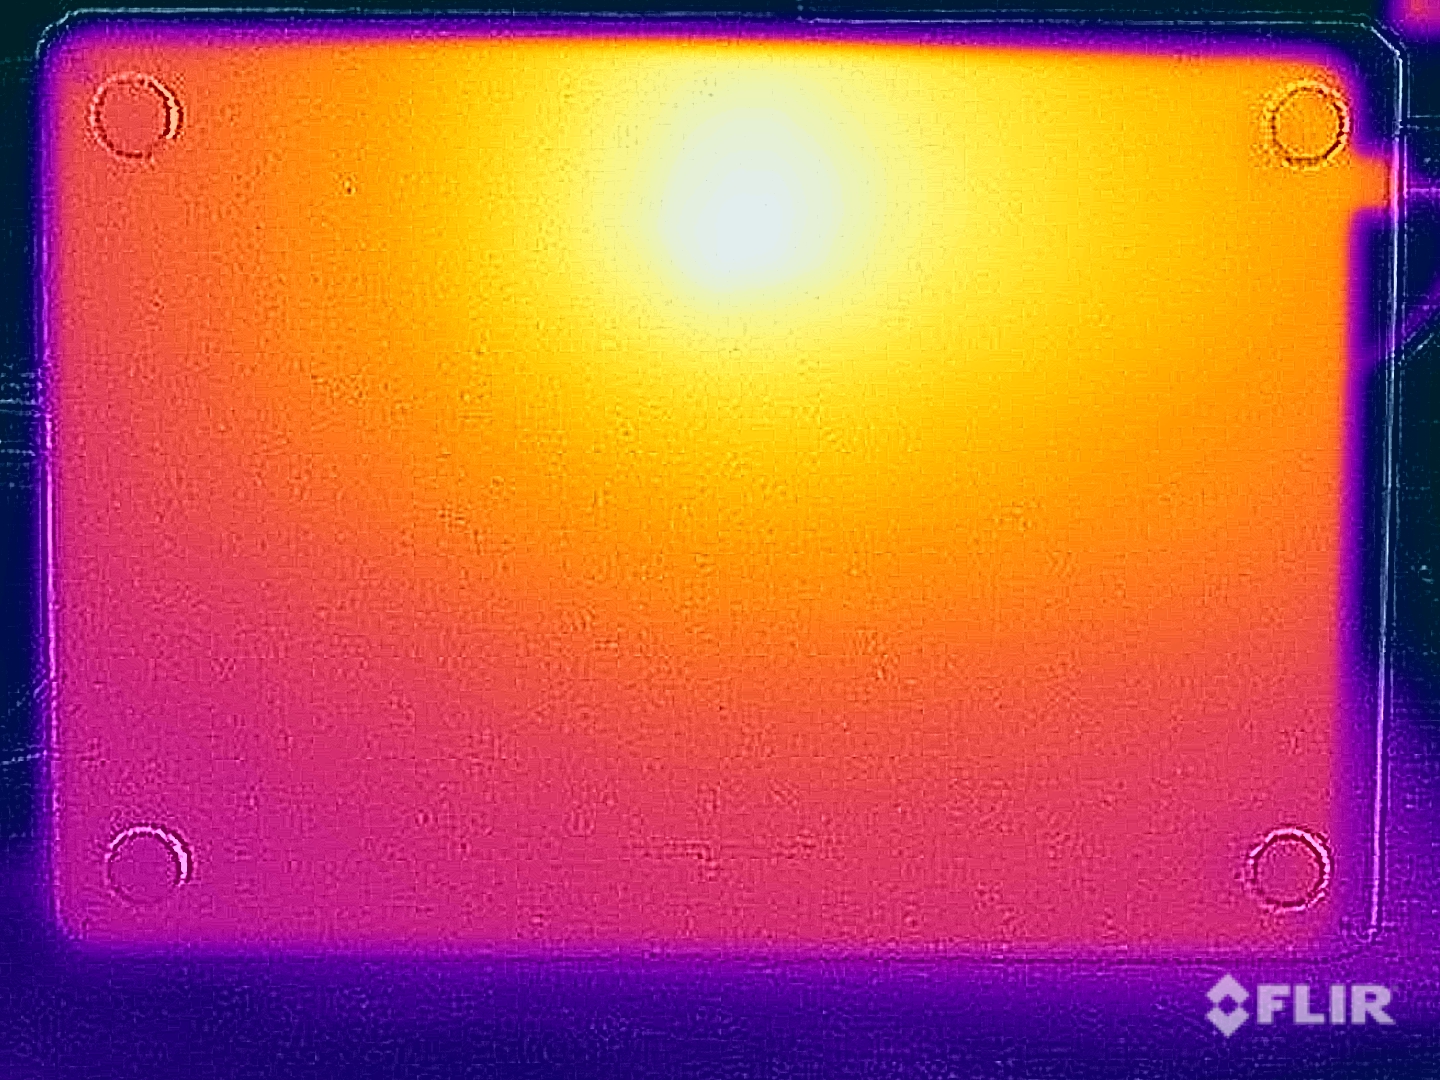
温度
尽管采用了被动散热,但在我们的测试中,笔记本电脑的表面温度并不苛刻,即使在满载的情况下,我们测得的最高温度也只有 45 °C。因此,在正常的日常使用中,MacBook Air 始终保持非常凉爽。即使是 35 瓦的电源也没有过热,最高温度为 43 °C。在综合 CPU/GPU 负载的压力测试中,SoC 的功耗最初为 29 瓦,但很快降至 9 瓦左右。
(±) The maximum temperature on the upper side is 44.9 °C / 113 F, compared to the average of 35.9 °C / 97 F, ranging from 21.4 to 59 °C for the class Subnotebook.
(±) The bottom heats up to a maximum of 43.9 °C / 111 F, compared to the average of 39.3 °C / 103 F
(+) In idle usage, the average temperature for the upper side is 23.1 °C / 74 F, compared to the device average of 30.8 °C / 87 F.
(±) 3: The average temperature for the upper side is 37.3 °C / 99 F, compared to the average of 30.8 °C / 87 F for the class Subnotebook.
(+) The palmrests and touchpad are reaching skin temperature as a maximum (35.5 °C / 95.9 F) and are therefore not hot.
(-) The average temperature of the palmrest area of similar devices was 28.2 °C / 82.8 F (-7.3 °C / -13.1 F).
| Apple MacBook Air 15 M4 Apple M4 (10 cores), Apple M4 10-core GPU | Apple MacBook Air 15 M3 Apple M3, Apple M3 10-Core GPU | Lenovo ThinkPad X9-15 Aura Edition Intel Core Ultra 7 258V, Intel Arc Graphics 140V | Microsoft Surface Laptop 15 Snapdragon X Elite Qualcomm Snapdragon X Elite X1E-80-100, Qualcomm SD X Adreno X1-85 3.8 TFLOPS | Lenovo Yoga Slim 7 15ILL9 Aura Intel Core Ultra 7 256V, Intel Arc Graphics 140V | Asus Vivobook S 15 OLED Snapdragon Qualcomm Snapdragon X Elite X1E-78-100, Qualcomm SD X Adreno X1-85 3.8 TFLOPS | |
|---|---|---|---|---|---|---|
| Heat | 1% | 2% | 6% | -21% | -12% | |
| Maximum Upper Side * | 44.9 | 44.3 1% | 42.1 6% | 45.4 -1% | 46.2 -3% | 43.6 3% |
| Maximum Bottom * | 43.9 | 43.4 1% | 39.5 10% | 37.2 15% | 41 7% | 53.1 -21% |
| Idle Upper Side * | 23.4 | 23.1 1% | 24.5 -5% | 22.4 4% | 34 -45% | 26.7 -14% |
| Idle Bottom * | 23.5 | 23.3 1% | 24.4 -4% | 22 6% | 33.8 -44% | 27.2 -16% |
* ... smaller is better
发言人
Mac 的音响系统没有变化,仍然由 6 个扬声器组成,整体质量非常好,但竞争对手已经迎头赶上,达到了相当的水平。
Apple MacBook Air 15 M4 audio analysis
(+) | speakers can play relatively loud (85.8 dB)
Bass 100 - 315 Hz
(±) | reduced bass - on average 8.2% lower than median
(±) | linearity of bass is average (9.4% delta to prev. frequency)
Mids 400 - 2000 Hz
(+) | balanced mids - only 1.6% away from median
(+) | mids are linear (2.4% delta to prev. frequency)
Highs 2 - 16 kHz
(+) | balanced highs - only 4.2% away from median
(+) | highs are linear (4.3% delta to prev. frequency)
Overall 100 - 16.000 Hz
(+) | overall sound is linear (8% difference to median)
Compared to same class
» 2% of all tested devices in this class were better, 1% similar, 98% worse
» The best had a delta of 5%, average was 19%, worst was 53%
Compared to all devices tested
» 1% of all tested devices were better, 0% similar, 98% worse
» The best had a delta of 4%, average was 24%, worst was 134%
Lenovo ThinkPad X9-15 Aura Edition audio analysis
(+) | speakers can play relatively loud (87.5 dB)
Bass 100 - 315 Hz
(±) | reduced bass - on average 12.5% lower than median
(+) | bass is linear (6.8% delta to prev. frequency)
Mids 400 - 2000 Hz
(+) | balanced mids - only 3.1% away from median
(+) | mids are linear (5.3% delta to prev. frequency)
Highs 2 - 16 kHz
(+) | balanced highs - only 2.4% away from median
(+) | highs are linear (3.3% delta to prev. frequency)
Overall 100 - 16.000 Hz
(+) | overall sound is linear (9.5% difference to median)
Compared to same class
» 0% of all tested devices in this class were better, 0% similar, 99% worse
» The best had a delta of 7%, average was 21%, worst was 53%
Compared to all devices tested
» 3% of all tested devices were better, 1% similar, 96% worse
» The best had a delta of 4%, average was 24%, worst was 134%
Microsoft Surface Laptop 15 Snapdragon X Elite audio analysis
(±) | speaker loudness is average but good (81 dB)
Bass 100 - 315 Hz
(±) | reduced bass - on average 11.7% lower than median
(±) | linearity of bass is average (9.1% delta to prev. frequency)
Mids 400 - 2000 Hz
(+) | balanced mids - only 3.3% away from median
(+) | mids are linear (3.2% delta to prev. frequency)
Highs 2 - 16 kHz
(+) | balanced highs - only 3.1% away from median
(+) | highs are linear (6.3% delta to prev. frequency)
Overall 100 - 16.000 Hz
(+) | overall sound is linear (11.4% difference to median)
Compared to same class
» 2% of all tested devices in this class were better, 2% similar, 97% worse
» The best had a delta of 7%, average was 21%, worst was 53%
Compared to all devices tested
» 6% of all tested devices were better, 2% similar, 92% worse
» The best had a delta of 4%, average was 24%, worst was 134%
Lenovo Yoga Slim 7 15ILL9 Aura audio analysis
(+) | speakers can play relatively loud (83.5 dB)
Bass 100 - 315 Hz
(+) | good bass - only 4.2% away from median
(+) | bass is linear (5.5% delta to prev. frequency)
Mids 400 - 2000 Hz
(+) | balanced mids - only 1.7% away from median
(+) | mids are linear (1.6% delta to prev. frequency)
Highs 2 - 16 kHz
(+) | balanced highs - only 2.4% away from median
(+) | highs are linear (4.9% delta to prev. frequency)
Overall 100 - 16.000 Hz
(+) | overall sound is linear (5.3% difference to median)
Compared to same class
» 1% of all tested devices in this class were better, 1% similar, 98% worse
» The best had a delta of 5%, average was 18%, worst was 45%
Compared to all devices tested
» 0% of all tested devices were better, 0% similar, 100% worse
» The best had a delta of 4%, average was 24%, worst was 134%
Asus Vivobook S 15 OLED Snapdragon audio analysis
(±) | speaker loudness is average but good (79.9 dB)
Bass 100 - 315 Hz
(±) | reduced bass - on average 8.2% lower than median
(±) | linearity of bass is average (11% delta to prev. frequency)
Mids 400 - 2000 Hz
(+) | balanced mids - only 2.7% away from median
(+) | mids are linear (4.5% delta to prev. frequency)
Highs 2 - 16 kHz
(+) | balanced highs - only 3% away from median
(+) | highs are linear (5.8% delta to prev. frequency)
Overall 100 - 16.000 Hz
(+) | overall sound is linear (9.8% difference to median)
Compared to same class
» 10% of all tested devices in this class were better, 1% similar, 89% worse
» The best had a delta of 5%, average was 18%, worst was 45%
Compared to all devices tested
» 4% of all tested devices were better, 1% similar, 96% worse
» The best had a delta of 4%, average was 24%, worst was 134%
耗电量
其功耗值与前代机型基本相同。IPS 面板在全亮度条件下仍然需要相对较高的电量,Air 的耗电量也高于同类产品。在压力测试中,35 瓦的电源仅在几秒钟内起到了限制作用,总的来说是足够的,但同时为电池充电似乎没有太多的储备。可免费选配 70 瓦电源。
| Off / Standby | |
| Idle | |
| Load |
|
Key:
min: | |
| Apple MacBook Air 15 M4 M4 (10 cores), M4 10-Core GPU, Apple SSD AP1024Z, IPS, 2880x1864, 15.3" | Apple MacBook Air 15 M3 M3, M3 10-Core GPU, Apple SSD AP0512Z, IPS, 2880x1664, 15.6" | Lenovo ThinkPad X9-15 Aura Edition Core Ultra 7 258V, Arc 140V, WD PC SN740 SDDQMQD-1T00, OLED, 2880x1800, 15.3" | Microsoft Surface Laptop 15 Snapdragon X Elite SD X Elite X1E-80-100, Adreno X1-85 3.8 TFLOPS, Samsung PM9B1 256GB MZ9L4256HCJQ, IPS, 2496x1664, 15" | Lenovo Yoga Slim 7 15ILL9 Aura Core Ultra 7 256V, Arc 140V, , IPS, 2880x1800, 15.3" | Asus Vivobook S 15 OLED Snapdragon SD X Elite X1E-78-100, Adreno X1-85 3.8 TFLOPS, Micron 2400 MTFDKBA1T0QFM, OLED, 2880x1620, 15.6" | |
|---|---|---|---|---|---|---|
| Power Consumption | 1% | -16% | -28% | -42% | -30% | |
| Idle Minimum * | 2.2 | 2.15 2% | 2.4 -9% | 3 -36% | 3.4 -55% | 4.4 -100% |
| Idle Average * | 11.5 | 11.2 3% | 3.9 66% | 8.3 28% | 8.8 23% | 6.2 46% |
| Idle Maximum * | 11.6 | 11.5 1% | 5.1 56% | 8.4 28% | 9.3 20% | 7.5 35% |
| Load Average * | 34.5 | 35.8 -4% | 42.5 -23% | 34.3 1% | 45.4 -32% | 33.6 3% |
| Cyberpunk 2077 ultra * | 24.4 | 43.5 -78% | 45.8 -88% | 49.4 -102% | 39 -60% | |
| Cyberpunk 2077 ultra external monitor * | 26.2 | 40.2 -53% | 41 -56% | 44.8 -71% | 38.9 -48% | |
| Load Maximum * | 37.5 | 37.2 1% | 64.4 -72% | 65.2 -74% | 66.3 -77% | 69.3 -85% |
| Witcher 3 ultra * | 29.6 | 29.9 |
* ... smaller is better
Power consumption Cyberpunk / stress test
Power consumption with external monitor
运行时间
与旧型号相比,它的电池续航时间变化很小。在 150 cd/m² 的 WLAN 测试中,我们注意到它的续航时间为 16.5 小时,而在全亮度条件下,它的续航时间仅为 6:45 小时--这与它的消耗值相符。在视频测试中,Air 实现了近 19 个小时的运行时间。考虑到电池容量,这些结果都不错,但 ThinkPad X9 在所有情况下(尤其是最大亮度下)的续航时间都更长。在使用 35 瓦电源的情况下,其充电时间长达 02:44小时。
| Apple MacBook Air 15 M4 M4 (10 cores), M4 10-Core GPU, 66.5 Wh | Apple MacBook Air 15 M3 M3, M3 10-Core GPU, 66.5 Wh | Lenovo ThinkPad X9-15 Aura Edition Core Ultra 7 258V, Arc 140V, 80 Wh | Microsoft Surface Laptop 15 Snapdragon X Elite SD X Elite X1E-80-100, Adreno X1-85 3.8 TFLOPS, 64 Wh | Lenovo Yoga Slim 7 15ILL9 Aura Core Ultra 7 256V, Arc 140V, 70 Wh | Asus Vivobook S 15 OLED Snapdragon SD X Elite X1E-78-100, Adreno X1-85 3.8 TFLOPS, 70 Wh | Average of class Subnotebook | |
|---|---|---|---|---|---|---|---|
| Battery Runtime | 1% | 14% | -10% | -5% | -22% | -19% | |
| H.264 | 1134 | 1116 -2% | 1378 22% | 976 -14% | 885 -22% | 961 ? -15% | |
| WiFi v1.3 | 988 | 1016 3% | 1048 6% | 889 -10% | 1025 4% | 783 -21% | 757 ? -23% |
Notebookcheck 总评分
Apple MacBook Air 15 M4
- 03/11/2025 v8
Andreas Osthoff
 Total Sustainability Score:
 Possible alternatives compared
Image | Model / Review | Price | Weight | Height | Display |
|---|---|---|---|---|---|
1. 91.2%  | Apple MacBook Air 15 M4 Apple M4 (10 cores) ⎘ Apple M4 10-core GPU ⎘ 16 GB Memory, 1024 GB SSD | Amazon: 1. $1,199.00 Apple 2025 MacBook Air 15-in... 2. $1,176.44 Apple 2025 MacBook Air 13-in... 3. $1,399.00 Apple 2024 MacBook Air 15-in... List Price: 1999€ | 1.5 kg | 11.5 mm | 15.30" 2880x1864 224 PPI IPS |
2. 90.1%  | Lenovo ThinkPad X9-15 Aura Edition Intel Core Ultra 7 258V ⎘ Intel Arc Graphics 140V ⎘ 32 GB Memory, 1024 GB SSD | Amazon: 1. $2,145.85 Lenovo ThinkPad X9-15 Gen 1 ... 2. $1,531.17 Lenovo ThinkPad X9-15 Gen 1 ... 3. $1,249.00 Lenovo ThinkPad E16 G2 16" F... List Price: 1989€ | 1.4 kg | 17.7 mm | 15.30" 2880x1800 222 PPI OLED |
3. 84.3%  | Microsoft Surface Laptop 15 Snapdragon X Elite Qualcomm Snapdragon X Elite X1E-80-100 ⎘ Qualcomm SD X Adreno X1-85 3.8 TFLOPS ⎘ 16 GB Memory, 256 GB SSD | Amazon: $1,476.51 List Price: 1100 USD | 1.7 kg | 18.29 mm | 15.00" 2496x1664 200 PPI IPS |
4. 84.3% 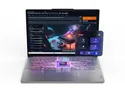 | Lenovo Yoga Slim 7 15ILL9 Aura Intel Core Ultra 7 256V ⎘ Intel Arc Graphics 140V ⎘ 16 GB Memory | Amazon: 1. $10.99 KEANBOLL 3 Pack Designed for... 2. $15.88 MUBUY-GOL Anti Blue Light Sc... 3. $1,199.99 Lenovo Slim 7i Aura Copilot+... List Price: 1380 USD | 1.5 kg | 13.9 mm | 15.30" 2880x1800 222 PPI IPS |
5. 83.3% 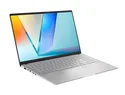 | Asus Vivobook S 15 OLED Snapdragon Qualcomm Snapdragon X Elite X1E-78-100 ⎘ Qualcomm SD X Adreno X1-85 3.8 TFLOPS ⎘ 16 GB Memory, 1024 GB SSD | Amazon: 1. $999.99 ASUS Vivobook S 15 Laptop; C... 2. $769.99 ASUS Vivobook S 15 15" 3K OL... 3. $889.00 ASUS Vivobook S 15 OLED Lapt... List Price: 1299€ | 1.4 kg | 15.9 mm | 15.60" 2880x1620 212 PPI OLED |
6. 91.6% v7 (old)  | Apple MacBook Air 15 M3 Apple M3 ⎘ Apple M3 10-Core GPU ⎘ 16 GB Memory, 512 GB SSD | Amazon: List Price: 2059€ | 1.5 kg | 11.5 mm | 15.60" 2880x1664 IPS |
Transparency
The selection of devices to be reviewed is made by our editorial team. The test sample was provided to the author as a loan by the manufacturer or retailer for the purpose of this review. The lender had no influence on this review, nor did the manufacturer receive a copy of this review before publication. There was no obligation to publish this review. We never accept compensation or payment in return for our reviews. As an independent media company, Notebookcheck is not subjected to the authority of manufacturers, retailers or publishers.
This is how Notebookcheck is testing
Every year, Notebookcheck independently reviews hundreds of laptops and smartphones using standardized procedures to ensure that all results are comparable. We have continuously developed our test methods for around 20 years and set industry standards in the process. In our test labs, high-quality measuring equipment is utilized by experienced technicians and editors. These tests involve a multi-stage validation process. Our complex rating system is based on hundreds of well-founded measurements and benchmarks, which maintains objectivity. Further information on our test methods can be found here.

