

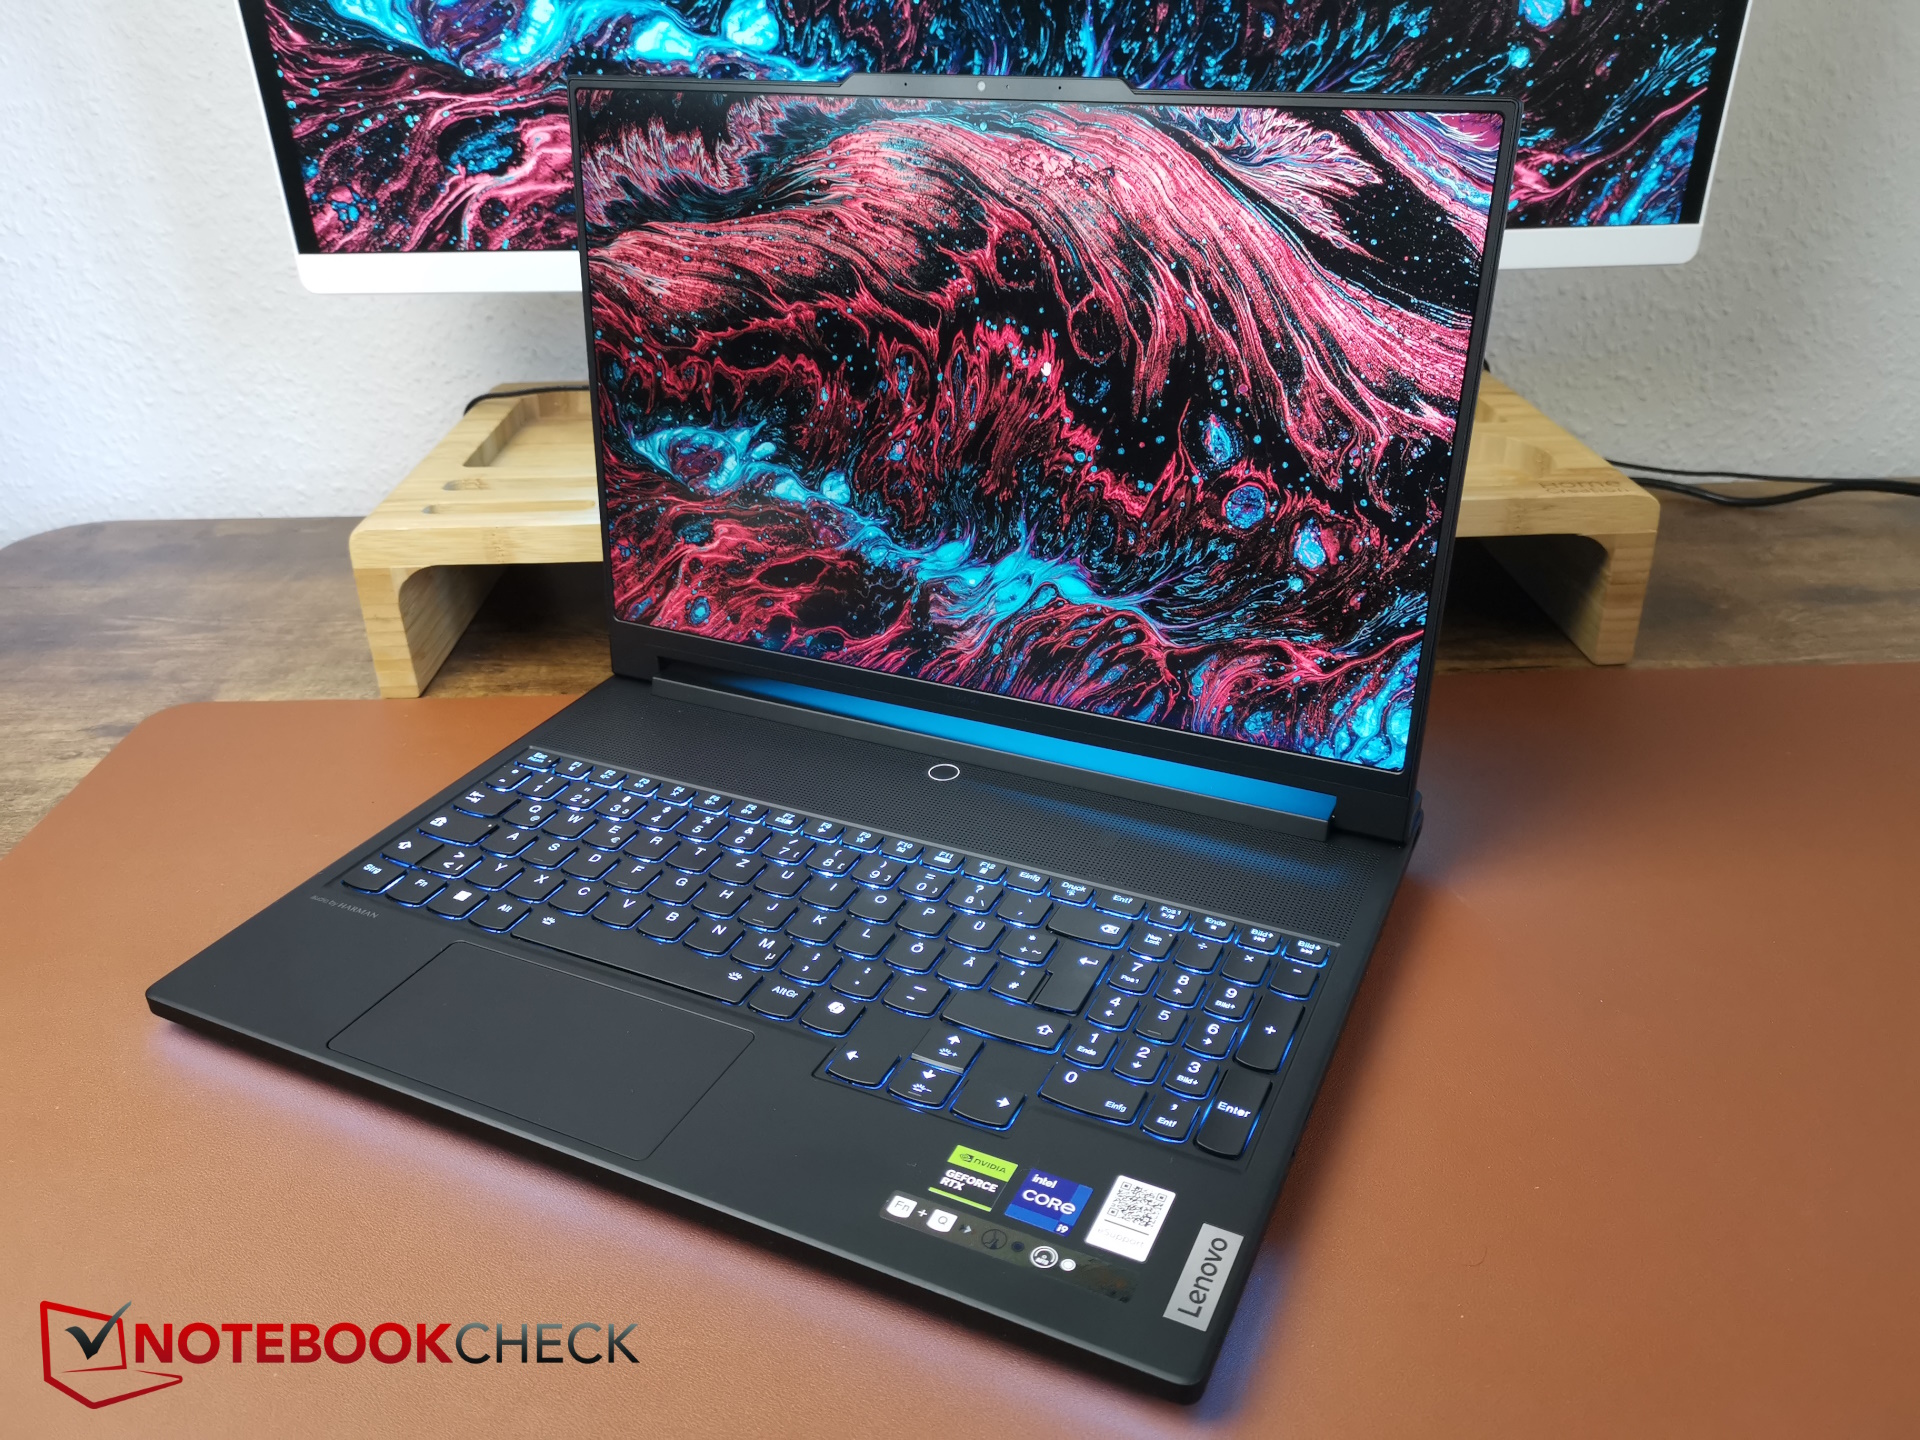
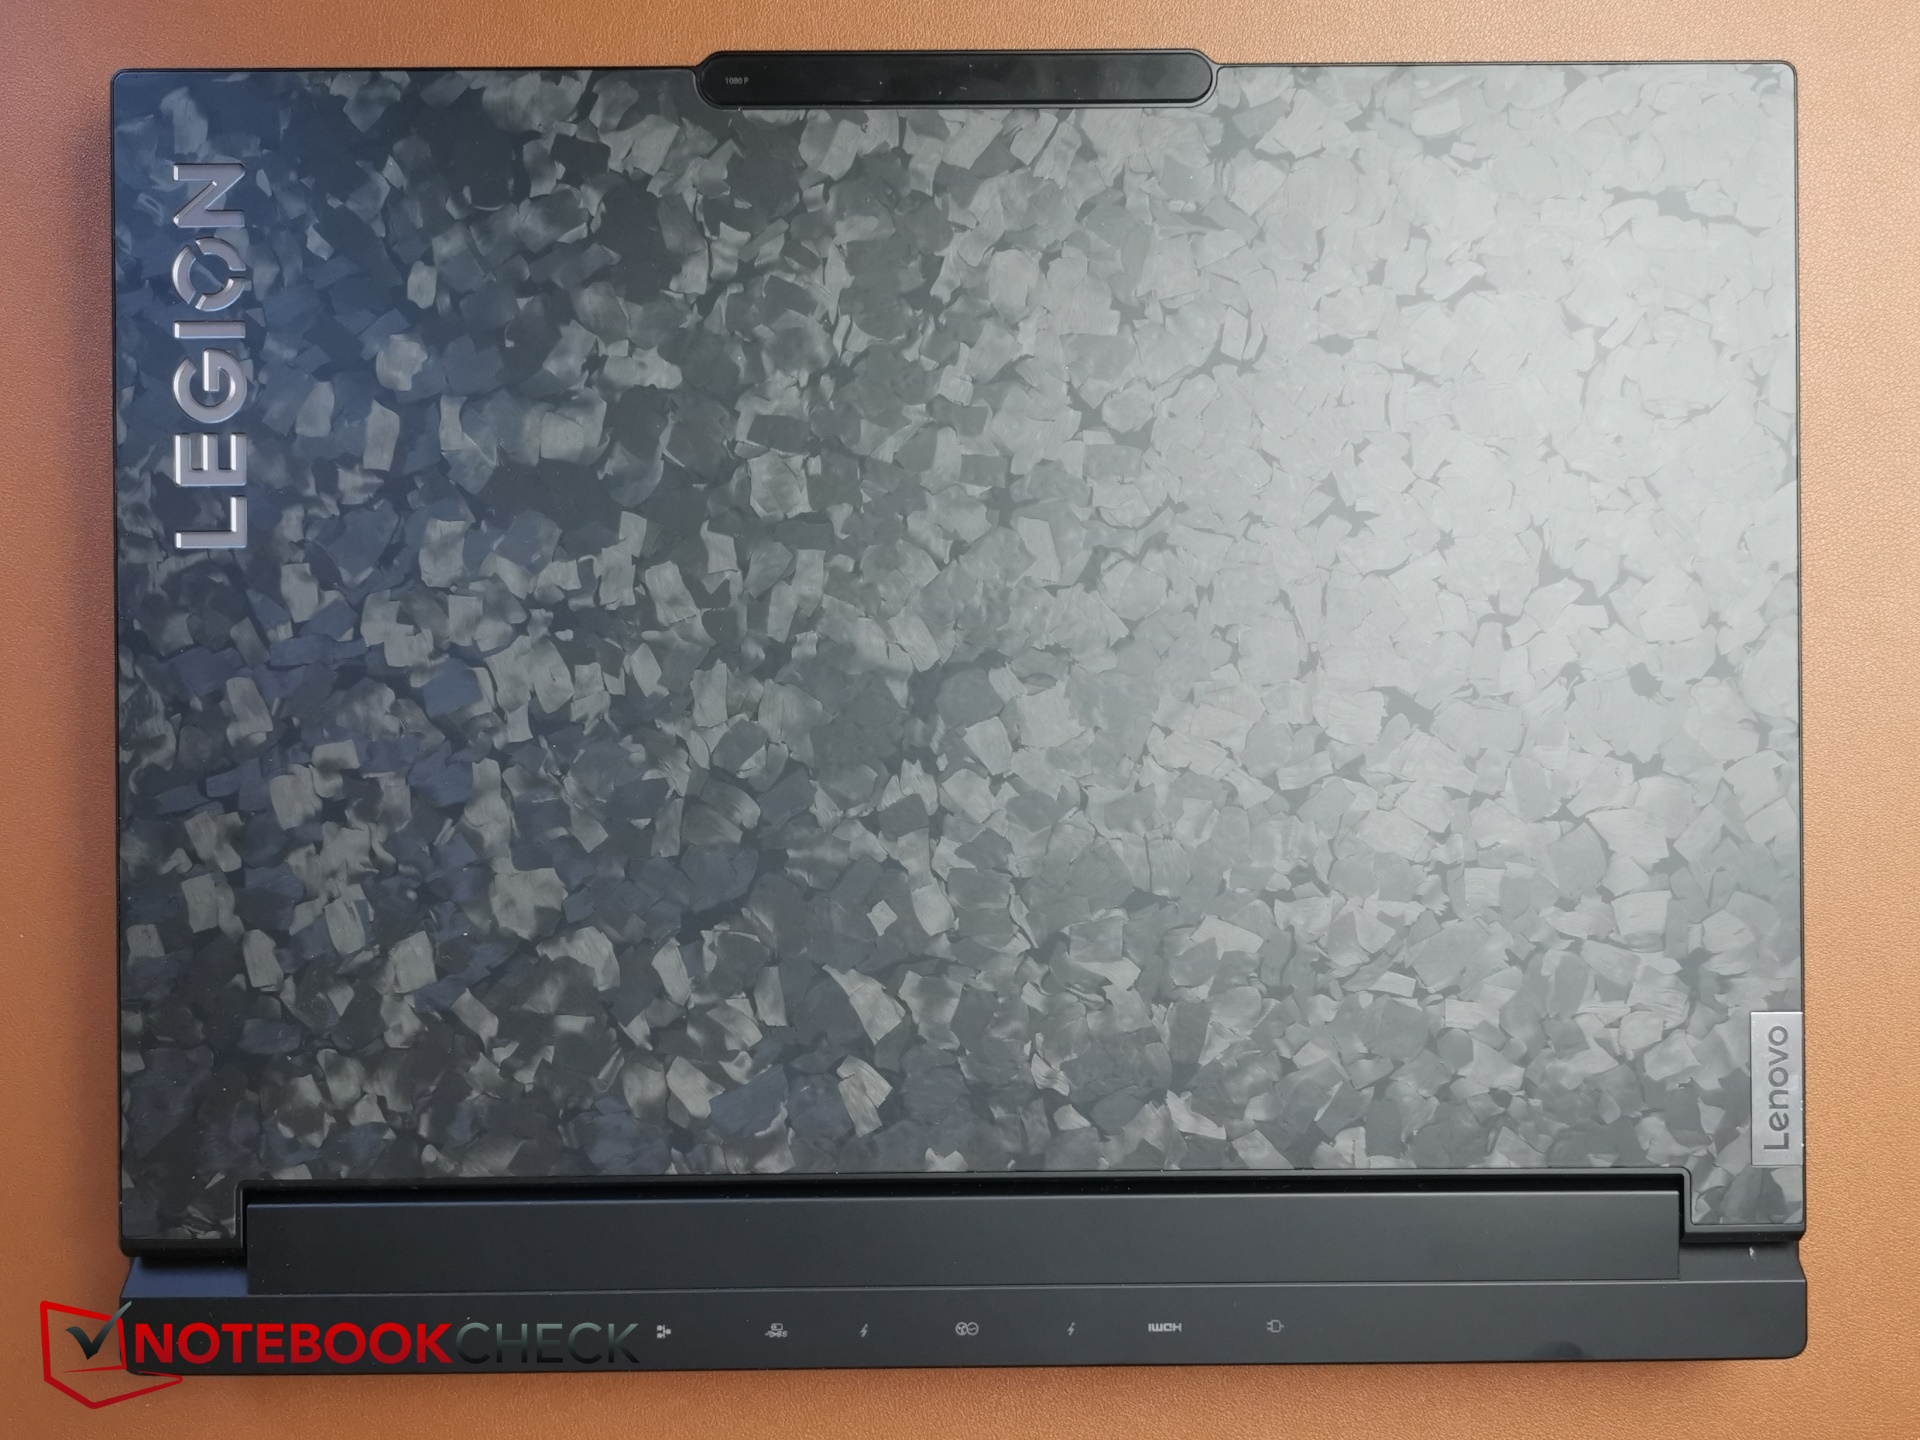
联想Legion 9 16IRX9 (Legion 9i) 评测:RTX 4090 玩家有多高端?
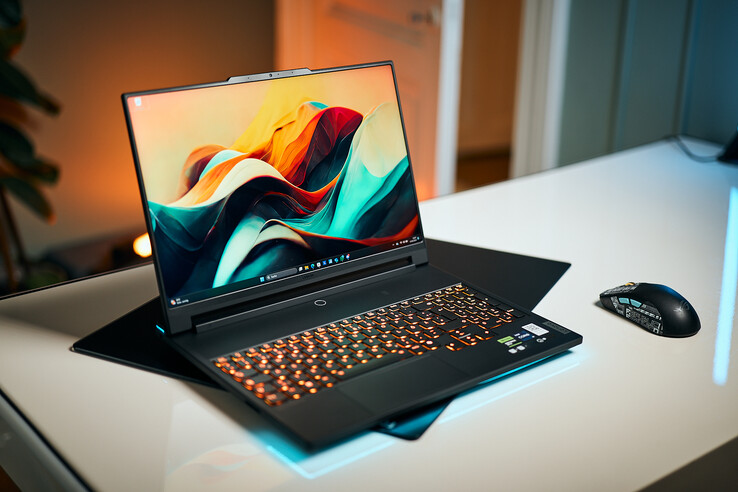
去年,我们称Legion 9i 为 "联想迄今为止最具雄心的游戏笔记本电脑"。下一代产品的野心可能不小,但对高端游戏玩家的实际改变却非常有限。只有它的 CPU 换成了最新的英特尔第 14 代处理器,这也让这款笔记本电脑具备了更强的 AI 能力。
由于 16 英寸笔记本电脑通常不会配备 RTX 4090,我们将把它与其 前代产品进行比较、的 雷蛇刀锋 16 (2024)以及 18 英寸游戏机,如 Alienware m18 R2和 华硕 ROG Strix Scar 18 (2024)以及 17 英寸 Medion Erazer Beast X40 (2024).
更新:由于本次测试中提到的问题(帧速率下降、单核分数低),我们(通过其代理商)与制造商取得了联系。可能的替代设备显示了相同的单核分数(由代理机构测量),因此至少这一点得到了确认。我们仍在就帧速率问题进行联系,并将尽快公布答复。
潜在的竞争对手比较
Rating | Version | Date | Model | Weight | Height | Size | Resolution | Price |
|---|---|---|---|---|---|---|---|---|
| 83.9 % | v8 | 06 / 2024 | Lenovo Legion 9 16IRX9, RTX 4090 i9-14900HX, NVIDIA GeForce RTX 4090 Laptop GPU | 2.5 kg | 22.7 mm | 16.00" | 3200x2000 | |
| 90.2 % v7 (old) | v7 (old) | 10 / 2023 | Lenovo Legion 9 16IRX8 i9-13980HX, NVIDIA GeForce RTX 4090 Laptop GPU | 2.6 kg | 22.7 mm | 16.00" | 3200x2000 | |
| 91.1 % v7 (old) | v7 (old) | 02 / 2024 | Razer Blade 16 2024, RTX 4090 i9-14900HX, NVIDIA GeForce RTX 4090 Laptop GPU | 2.5 kg | 22 mm | 16.00" | 2560x1600 | |
| 89.5 % v7 (old) | v7 (old) | 03 / 2024 | Alienware m18 R2 i9-14900HX, NVIDIA GeForce RTX 4090 Laptop GPU | 4 kg | 26.7 mm | 18.00" | 2560x1600 | |
| 88.3 % v7 (old) | v7 (old) | 02 / 2024 | Asus ROG Strix Scar 18 G834JYR (2024) i9-14900HX, NVIDIA GeForce RTX 4090 Laptop GPU | 3.1 kg | 30.8 mm | 18.00" | 2560x1600 | |
| 89.2 % v7 (old) | v7 (old) | 02 / 2024 | Medion Erazer Beast X40 2024 i9-14900HX, NVIDIA GeForce RTX 4090 Laptop GPU | 2.9 kg | 36 mm | 17.00" | 2560x1600 |
注:我们最近更新了评级系统,第 8 版的结果与第 7 版的结果不具可比性。更多信息 此处.
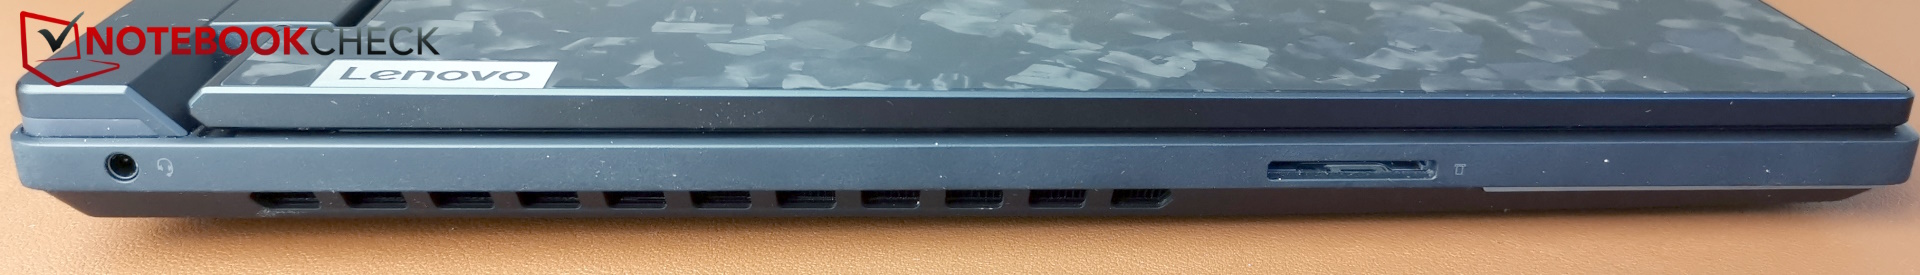
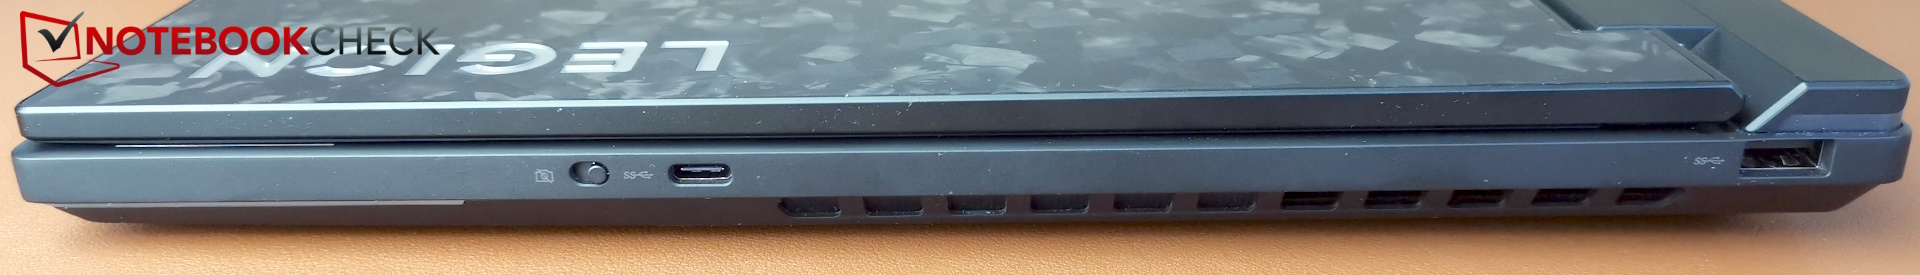

SD 读卡器
作为一款高端笔记本电脑,SD 读卡器的传输速率令人失望。它们比去年略差,与 Razer Blade 16 或 Alienware m18 R2 的传输速率相差甚远。
| SD Card Reader | |
| average JPG Copy Test (av. of 3 runs) | |
| Alienware m18 R2 (Toshiba Exceria Pro SDXC 64 GB UHS-II) | |
| Razer Blade 16 2024, RTX 4090 | |
| Average of class Gaming (19 - 197.3, n=68, last 2 years) | |
| Lenovo Legion 9 16IRX8 (Toshiba Exceria Pro SDXC 64 GB UHS-II) | |
| Medion Erazer Beast X40 2024 (AV PRO microSD 128 GB V60) | |
| Lenovo Legion 9 16IRX9, RTX 4090 | |
| maximum AS SSD Seq Read Test (1GB) | |
| Alienware m18 R2 (Toshiba Exceria Pro SDXC 64 GB UHS-II) | |
| Razer Blade 16 2024, RTX 4090 | |
| Average of class Gaming (25.8 - 263, n=67, last 2 years) | |
| Medion Erazer Beast X40 2024 (AV PRO microSD 128 GB V60) | |
| Lenovo Legion 9 16IRX9, RTX 4090 | |
| Lenovo Legion 9 16IRX8 (Toshiba Exceria Pro SDXC 64 GB UHS-II) | |
网络摄像头
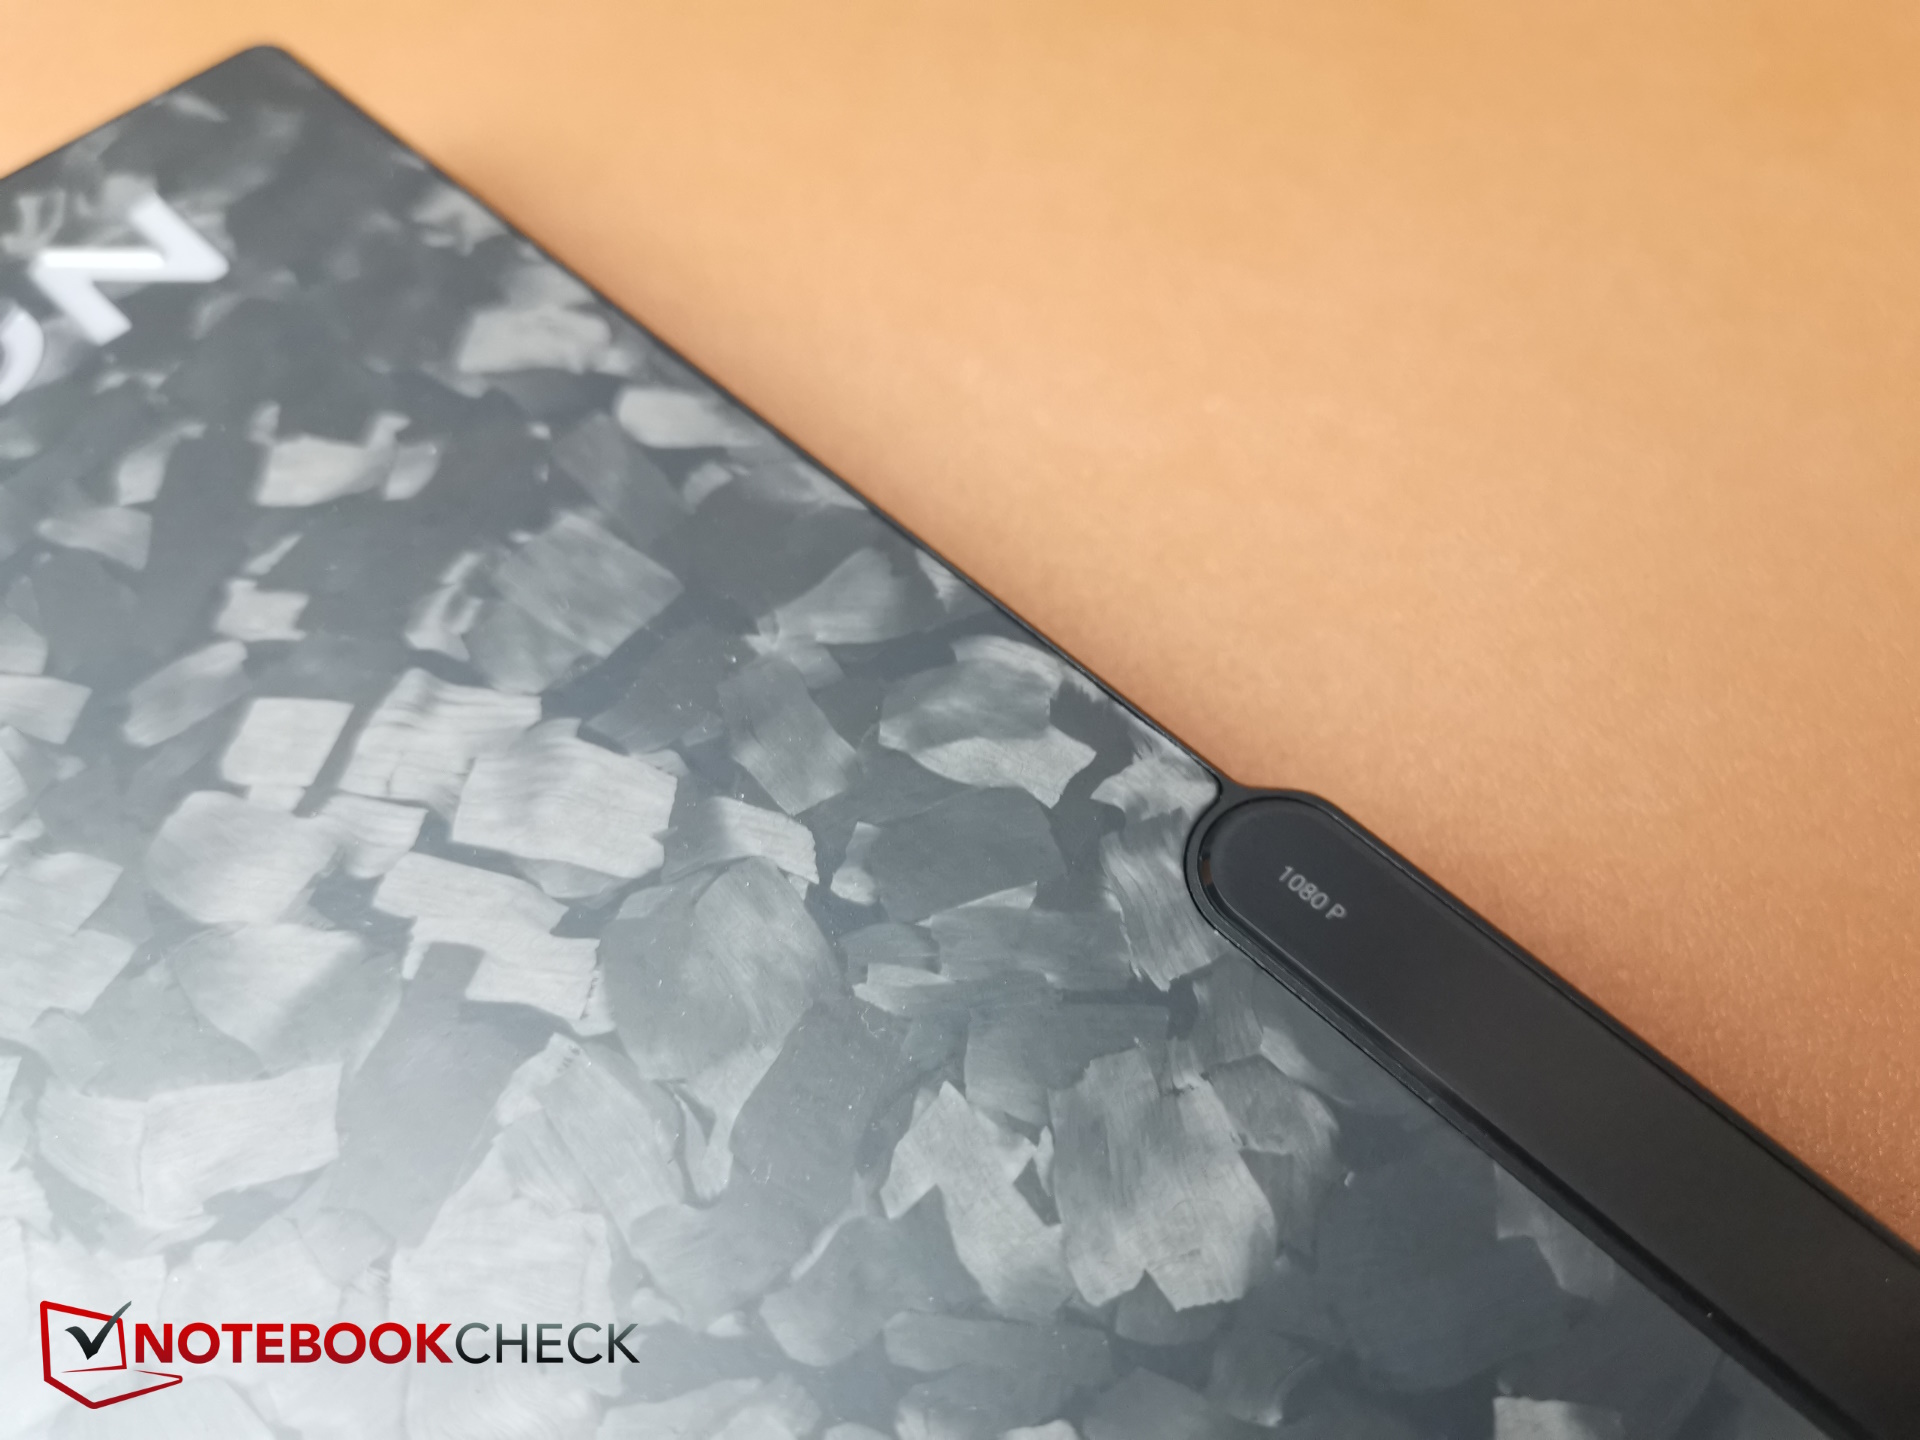
1080p 全高清网络摄像头的色彩偏差为中高水平,图像清晰度尚可。


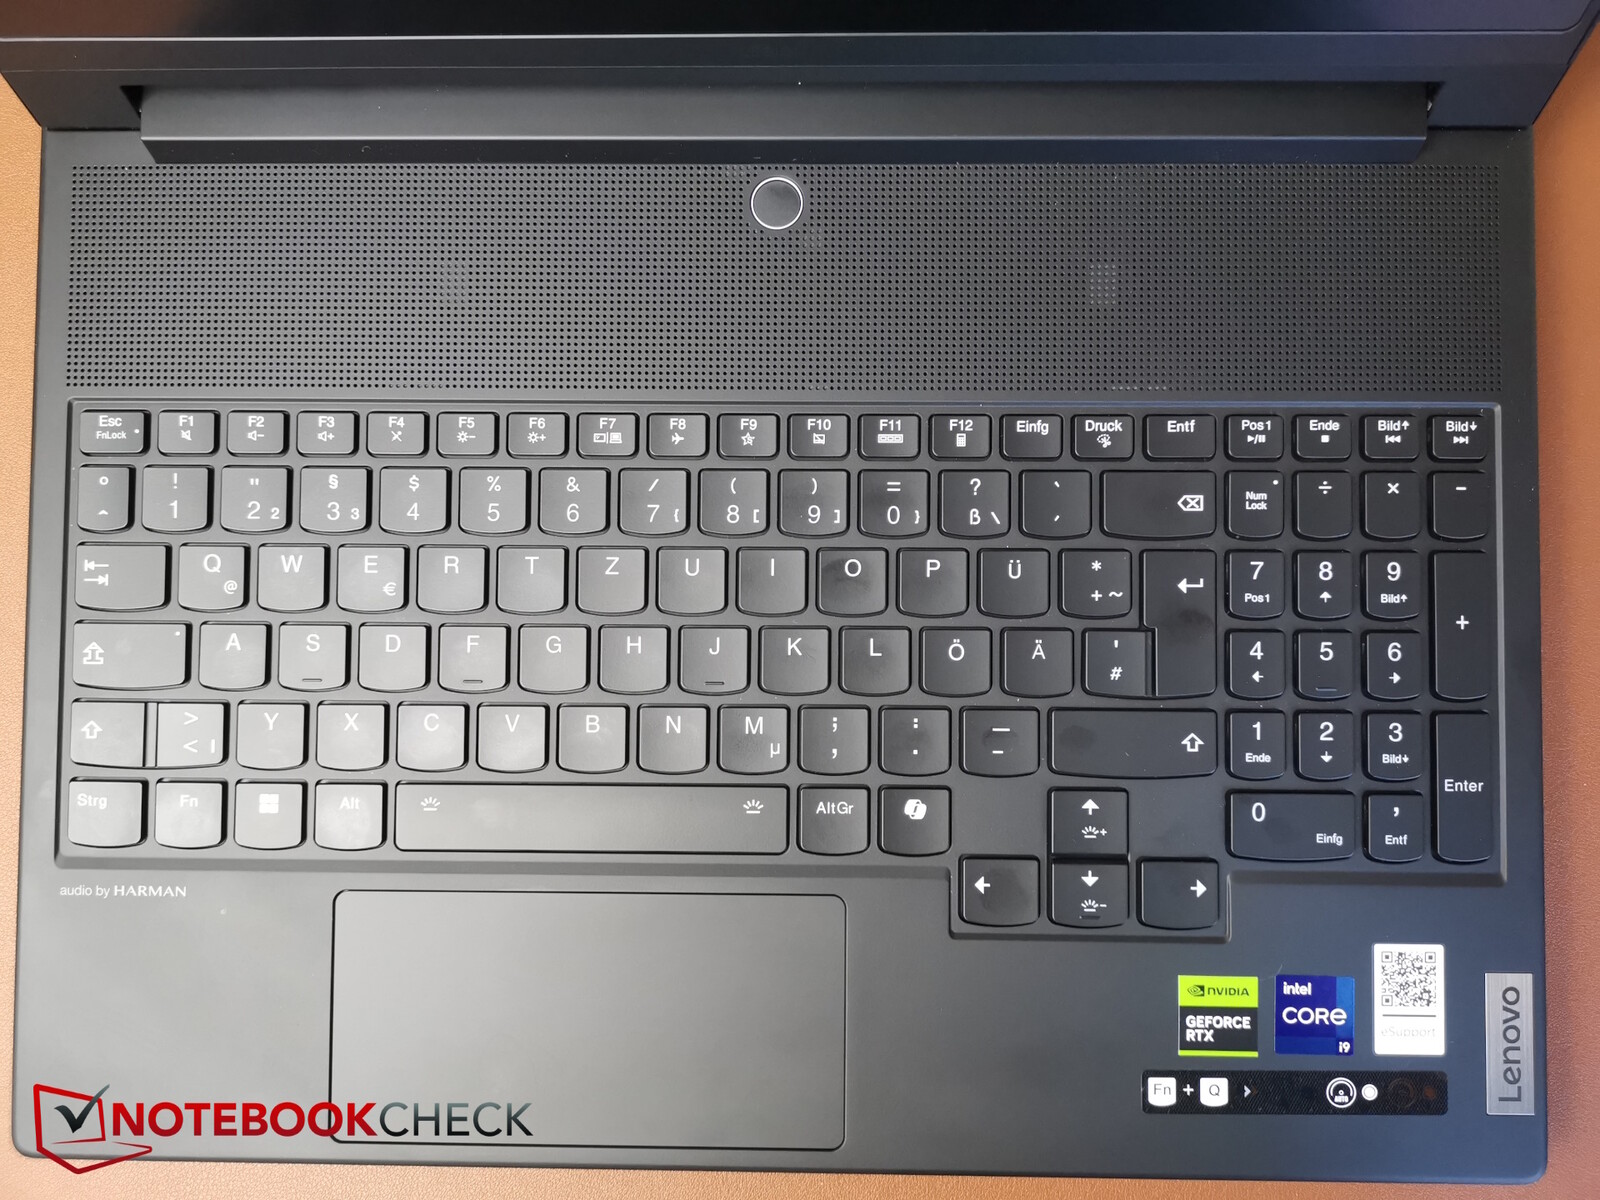
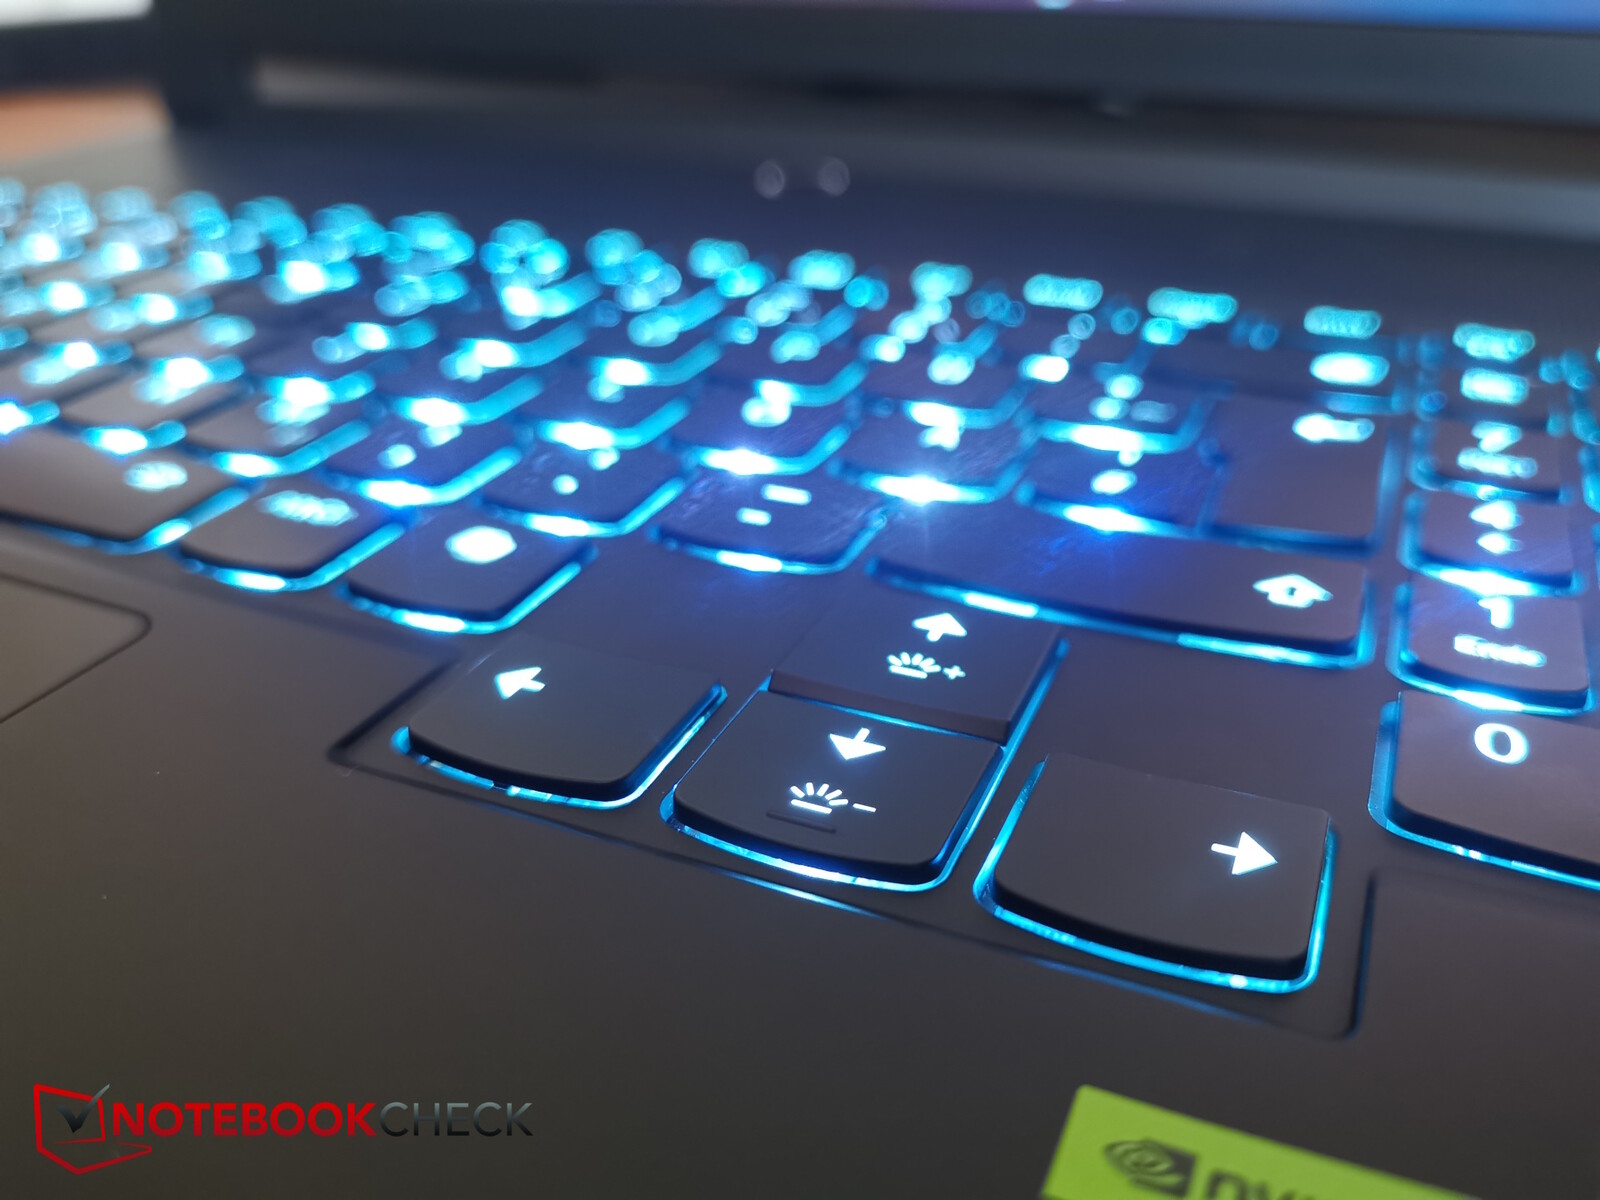
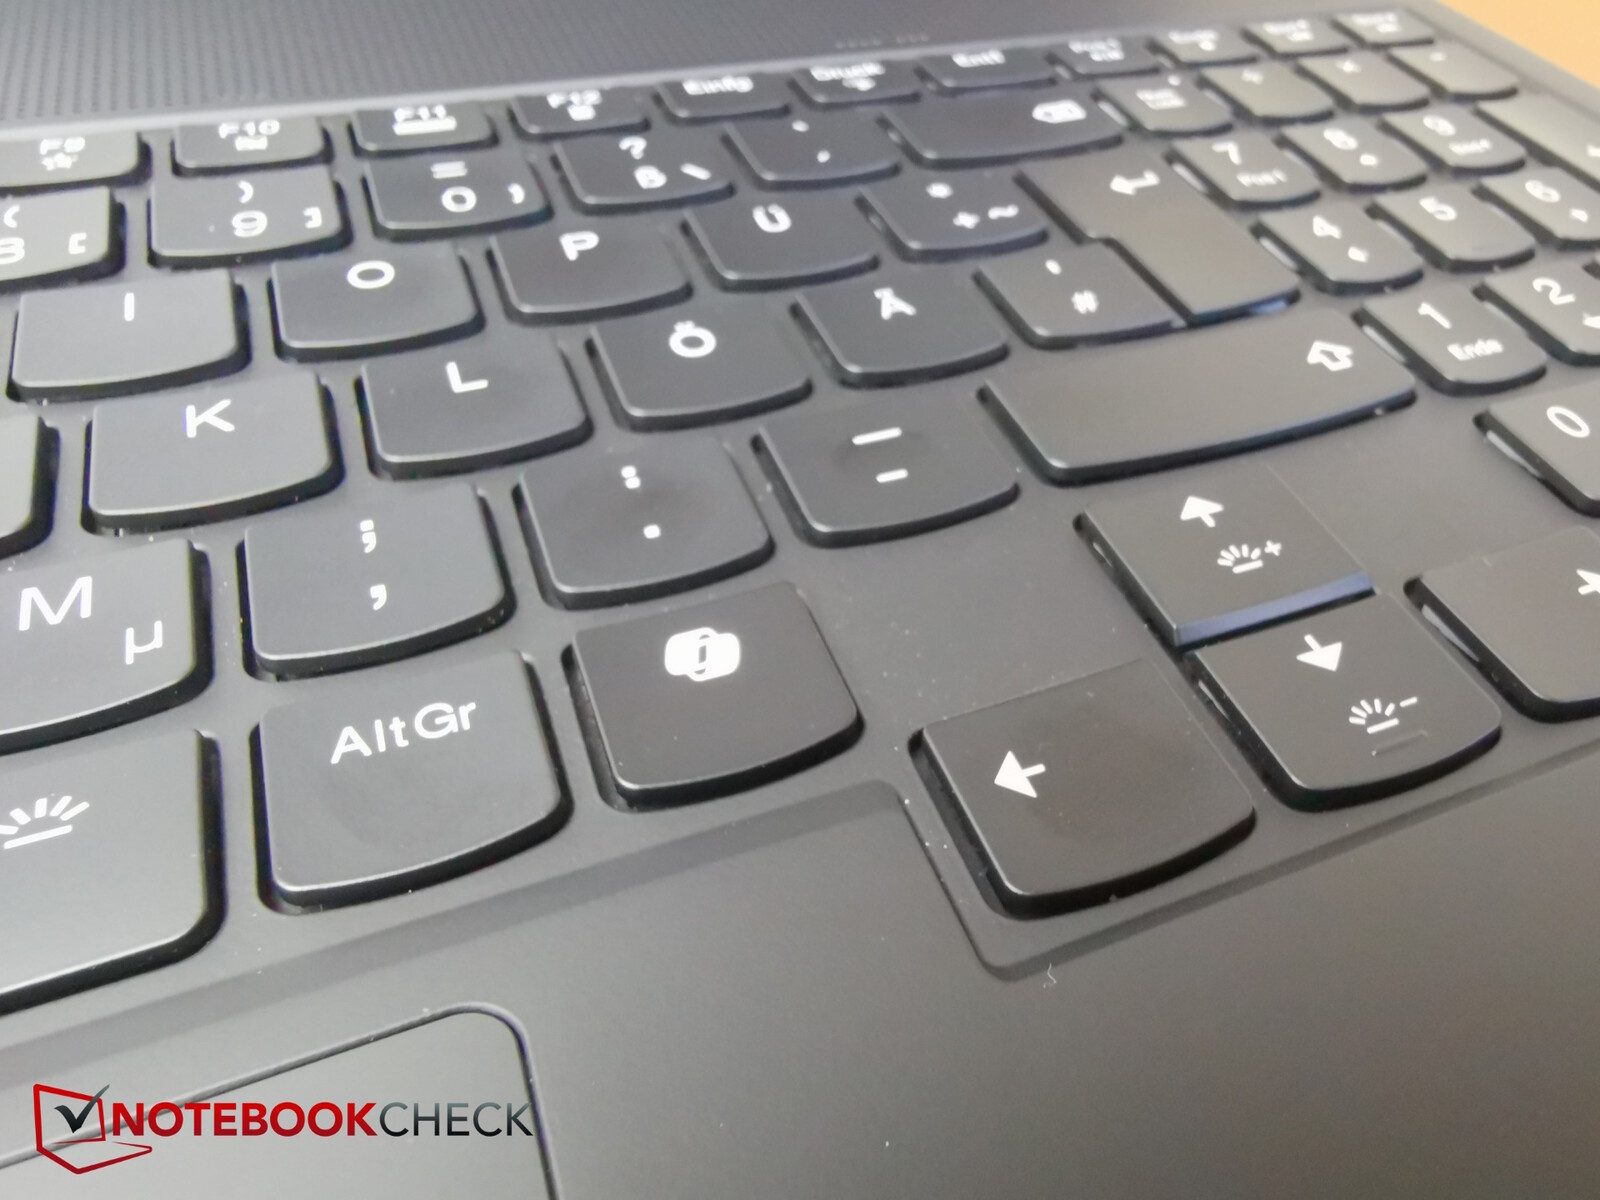
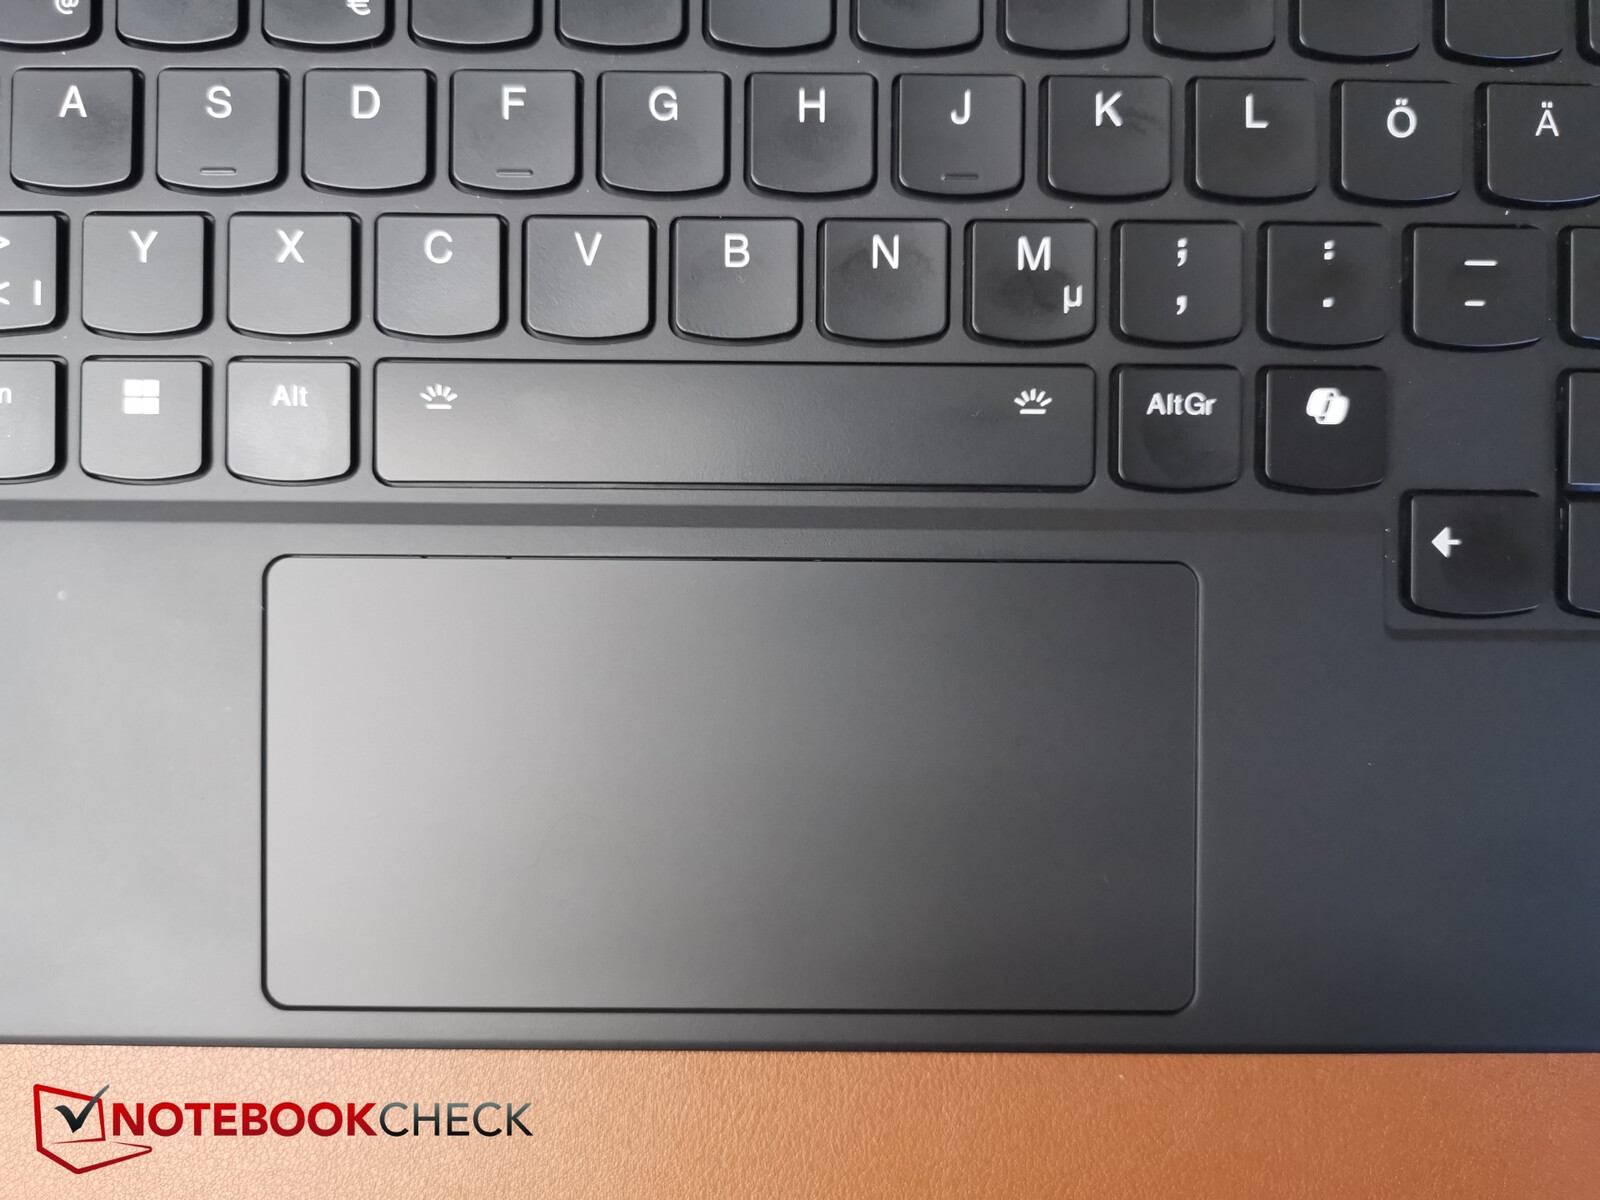
输入设备 - 现在有了副驾驶功能
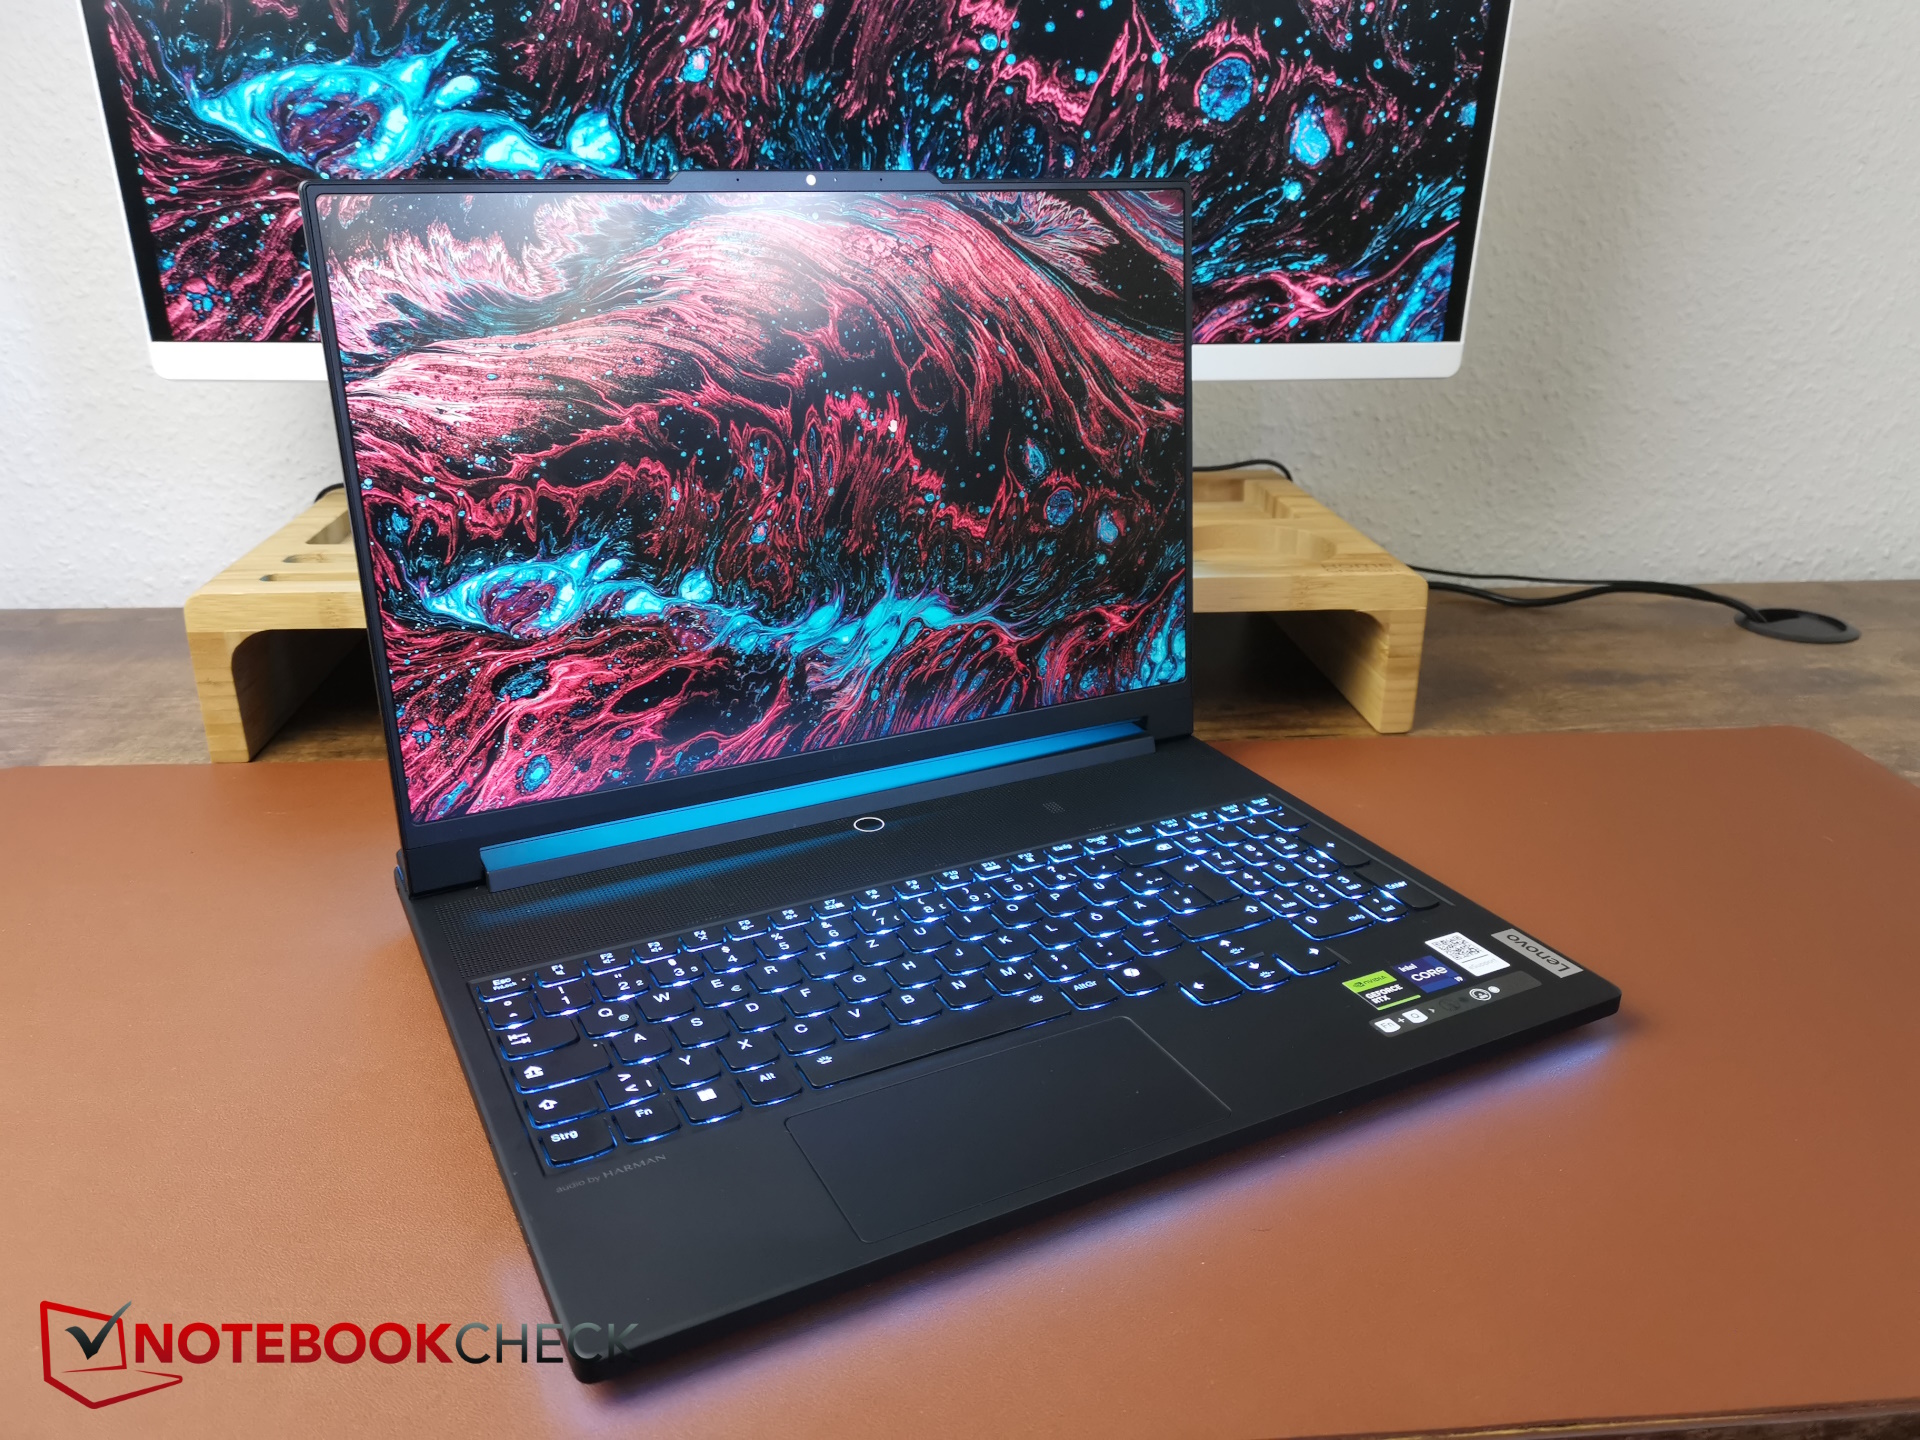
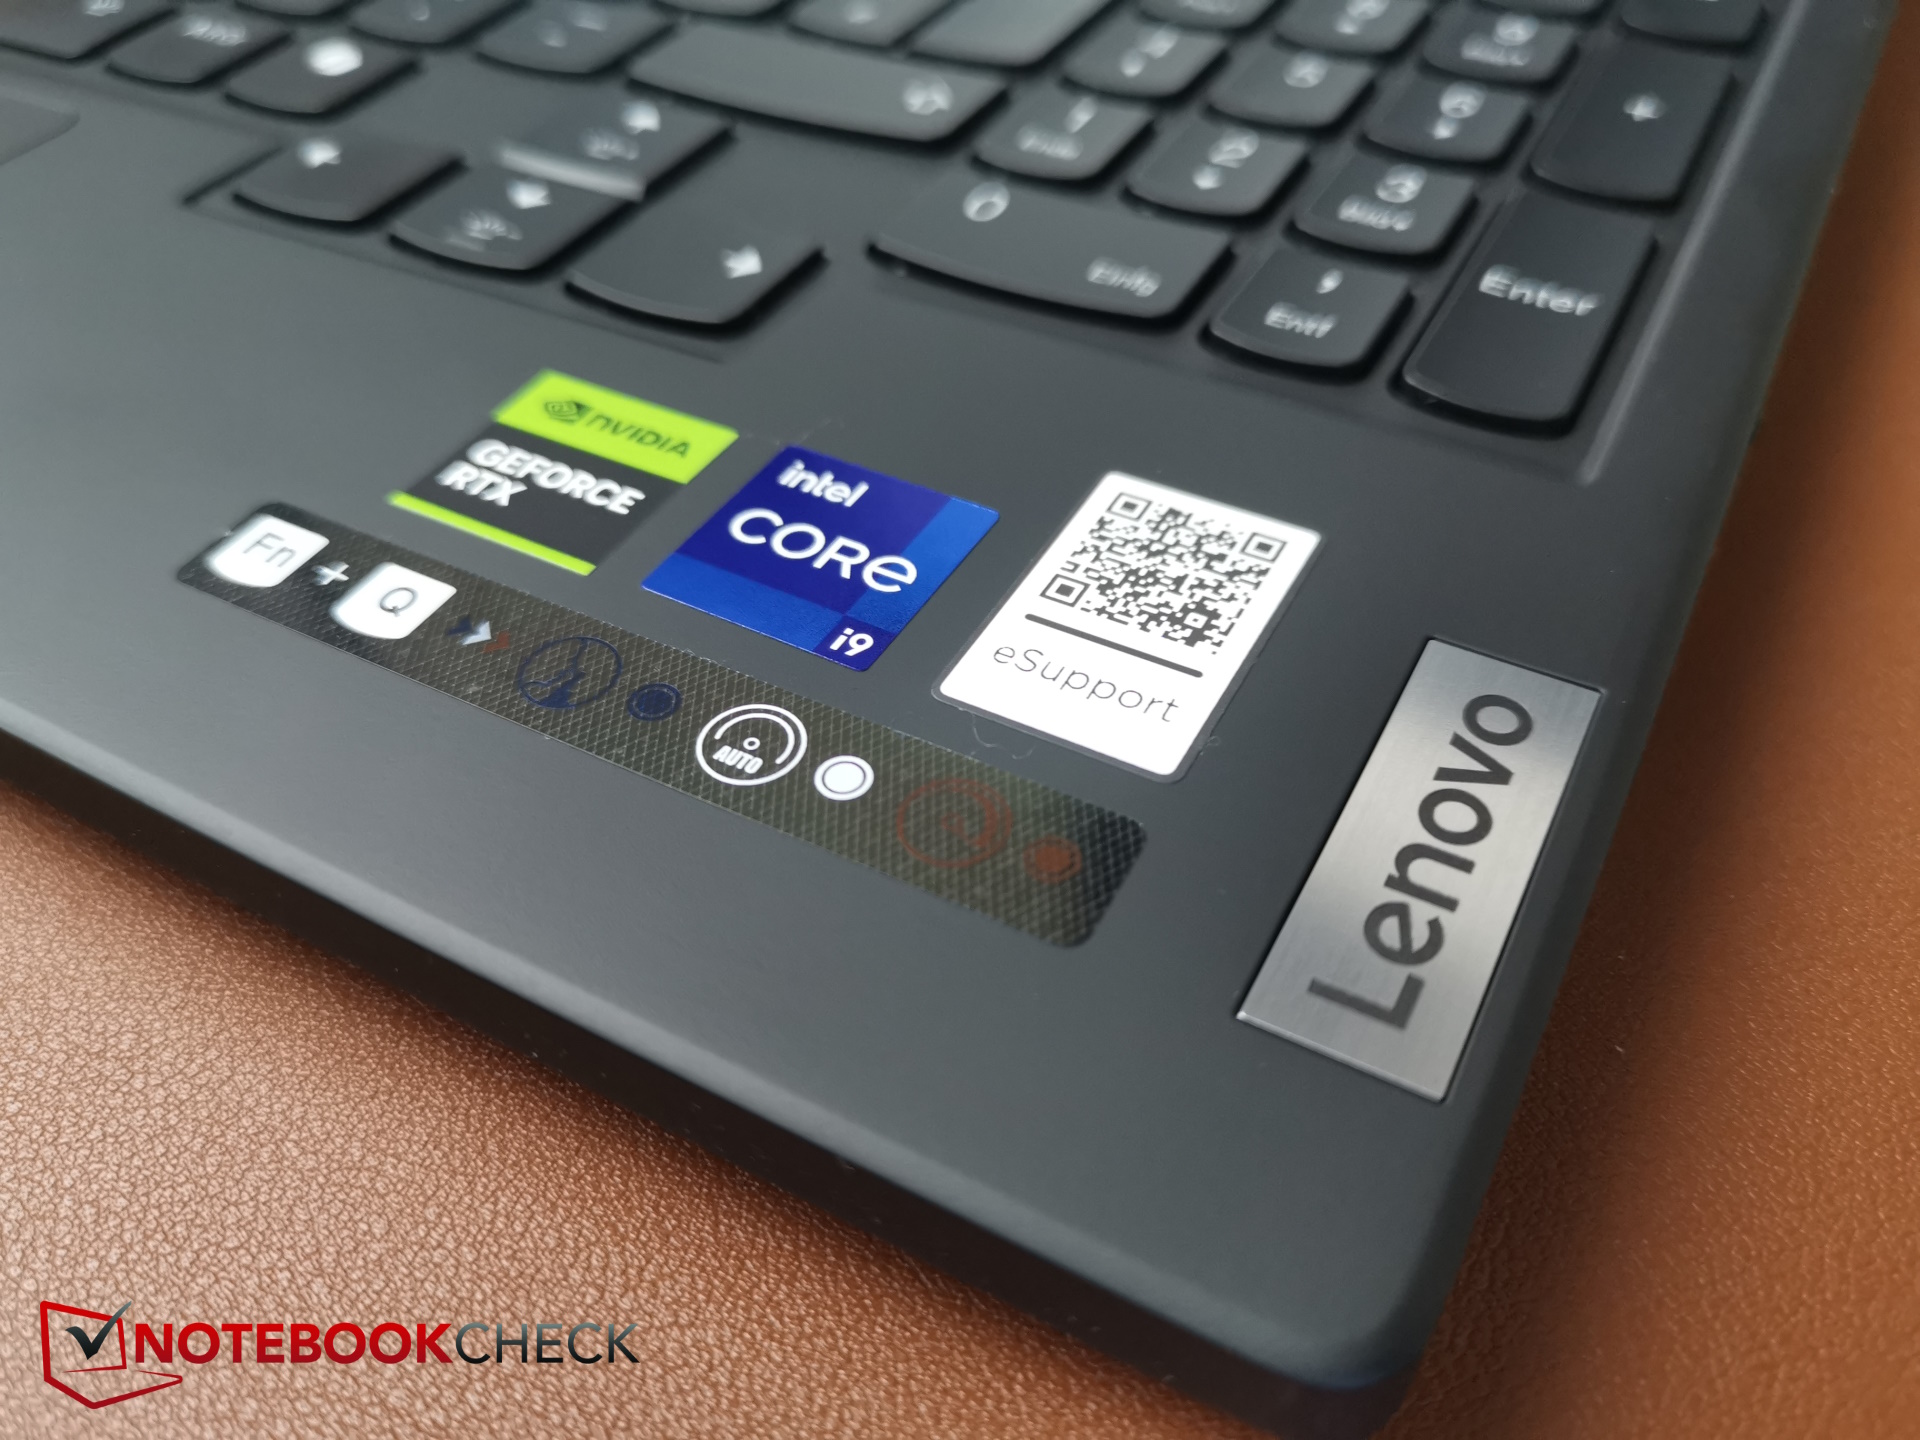
其舒适的薄膜键盘和触摸板基本保持不变。触摸板仍然非常窄,只有 5.9 厘米。键盘上现在增加了一个副驾驶键。右侧的 Ctrl 键不得不为此让路。
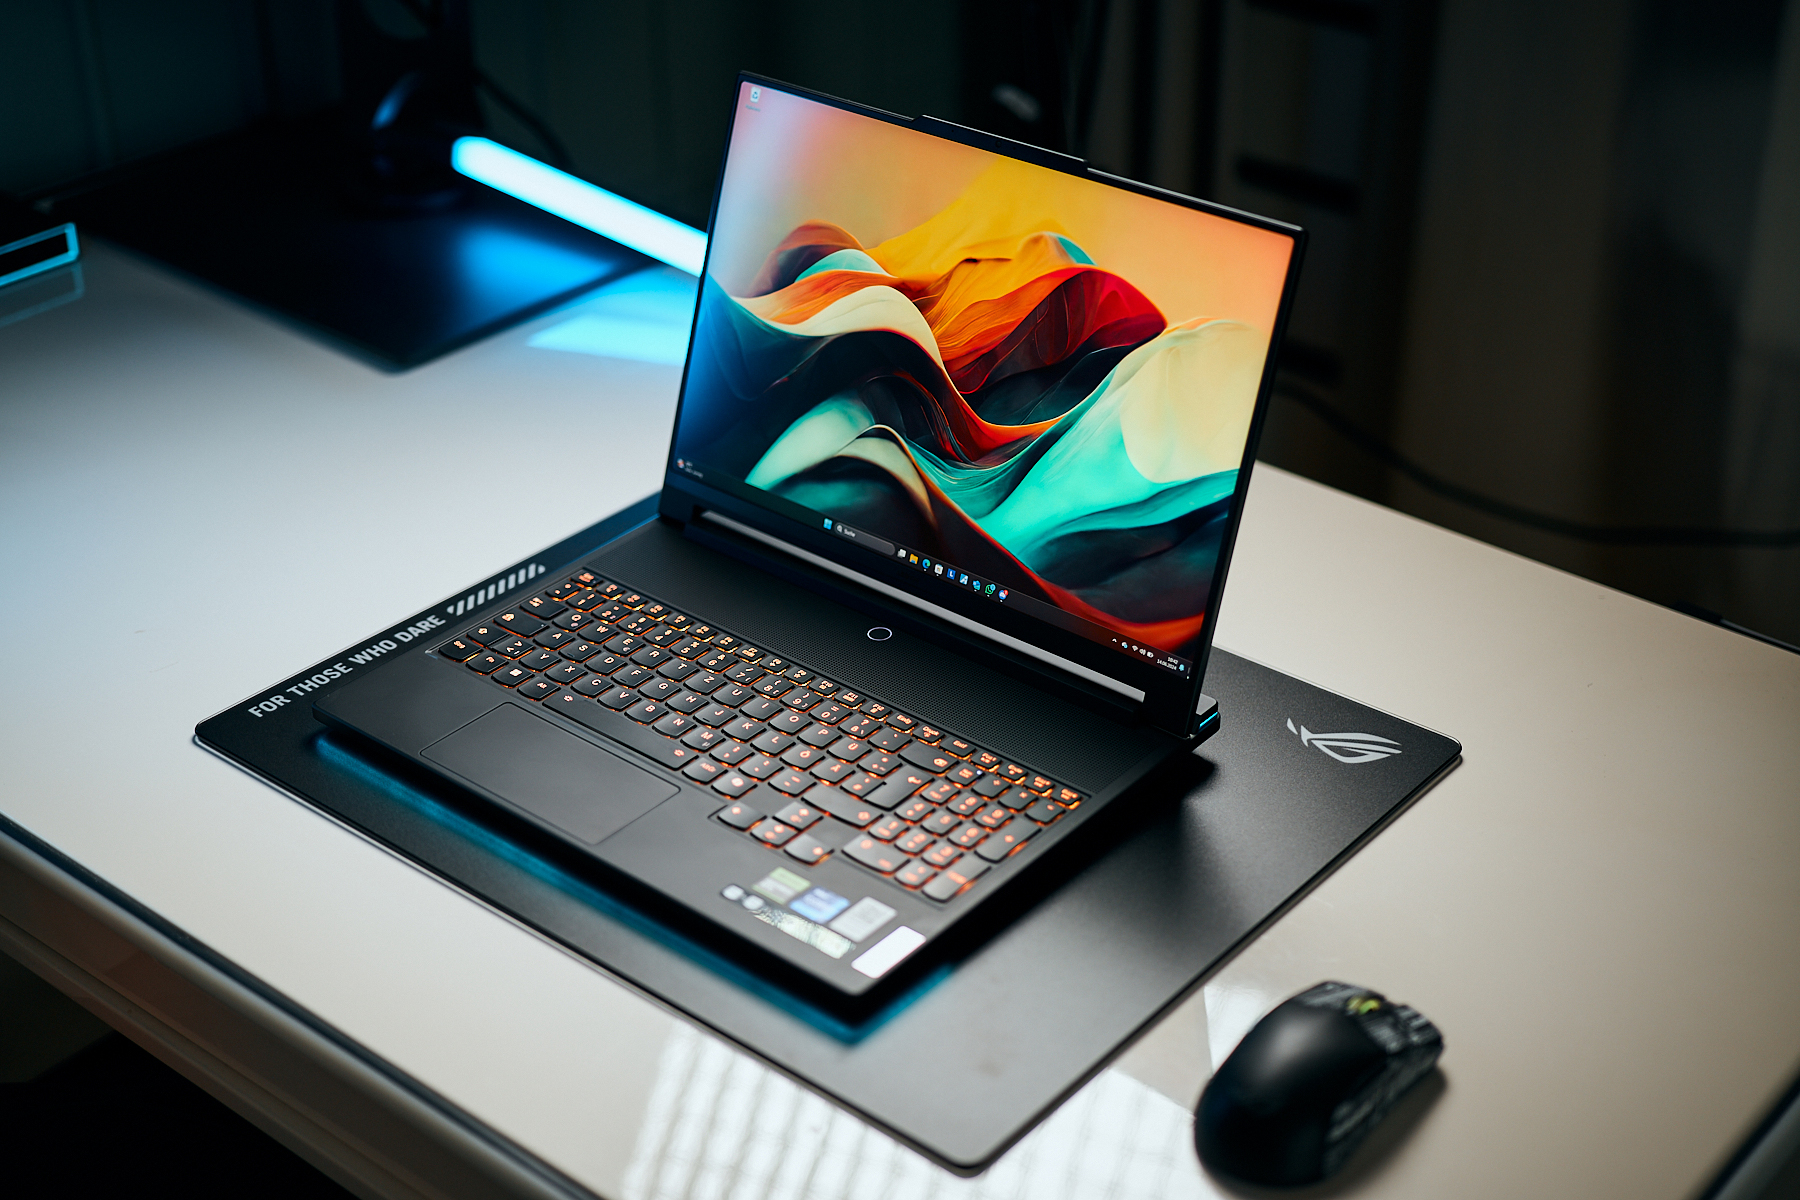
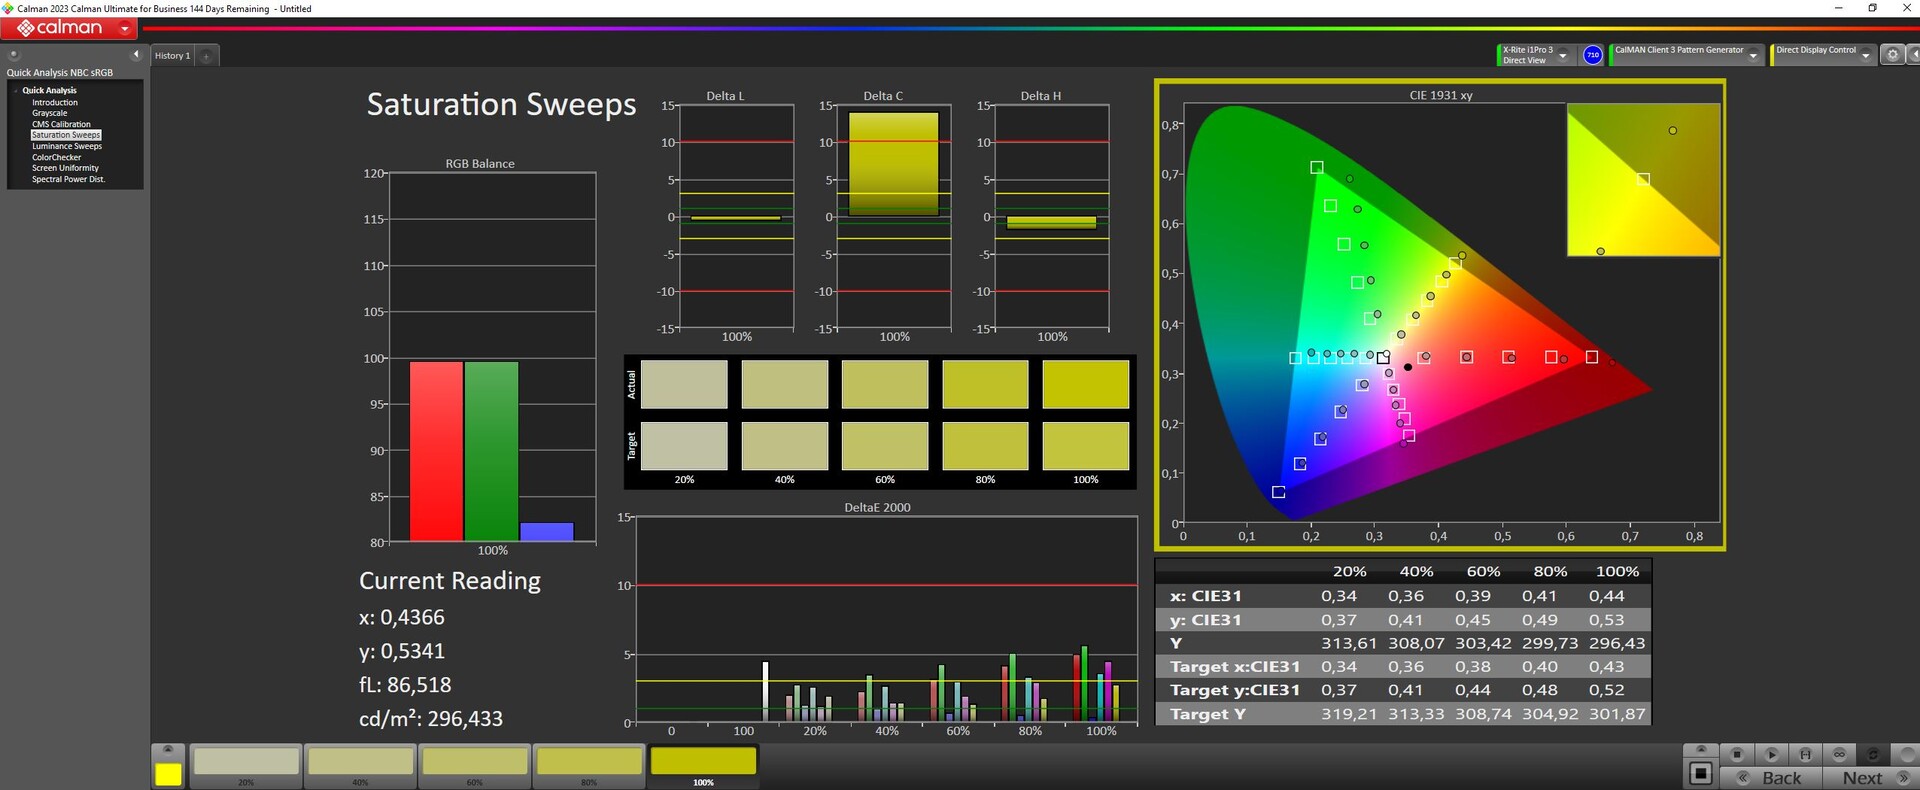
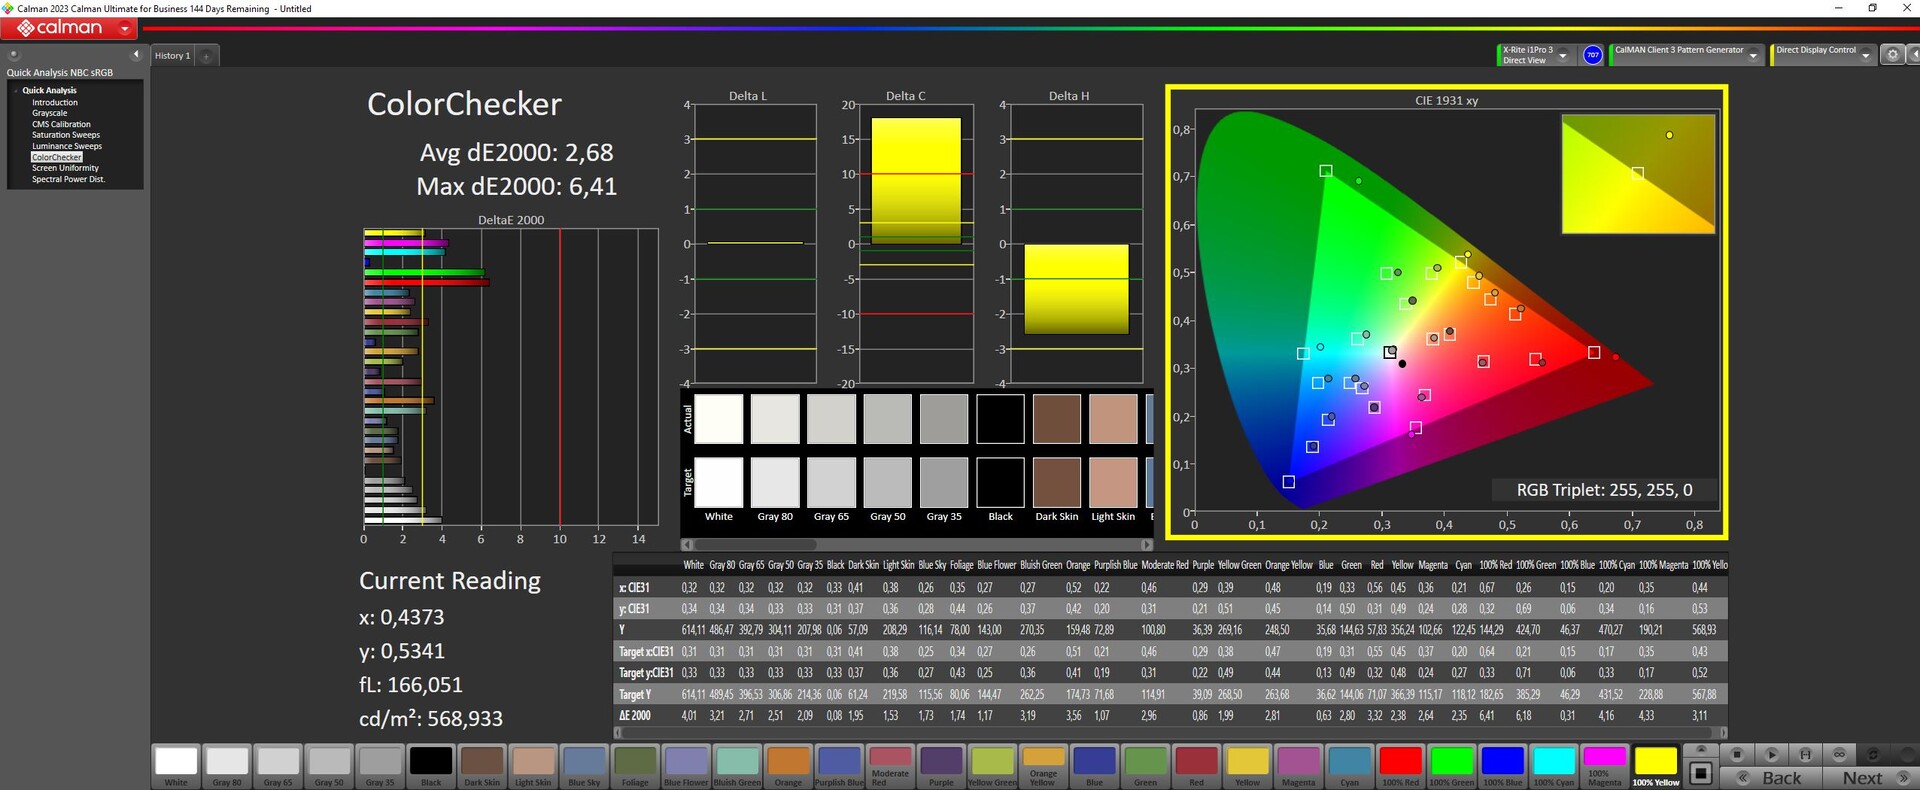
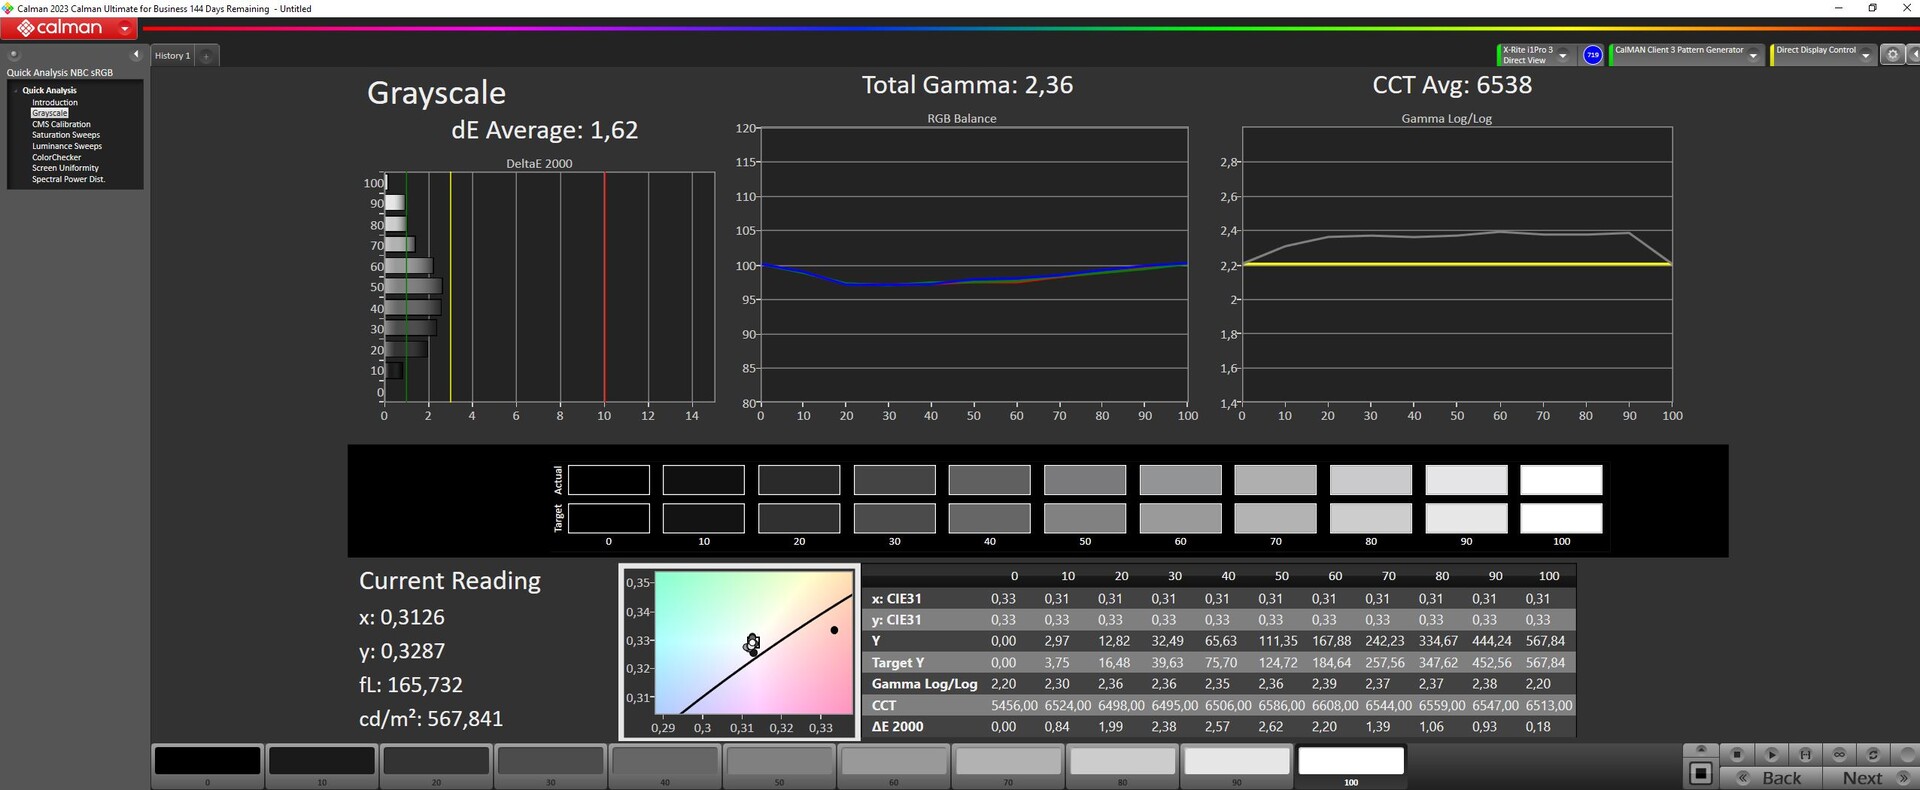
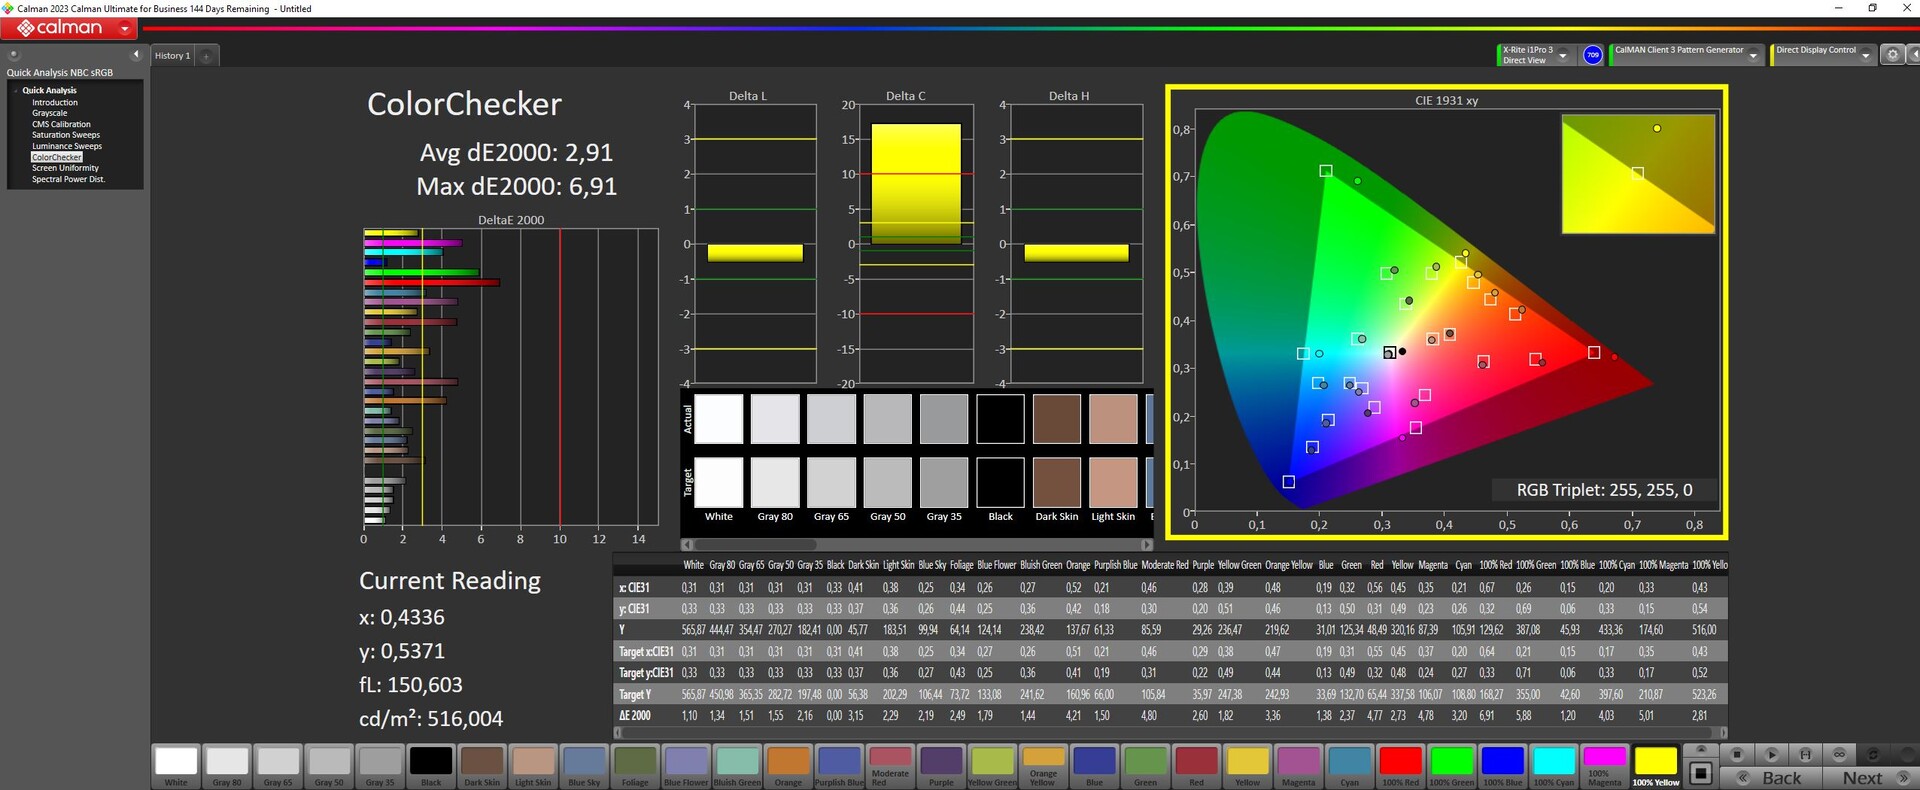
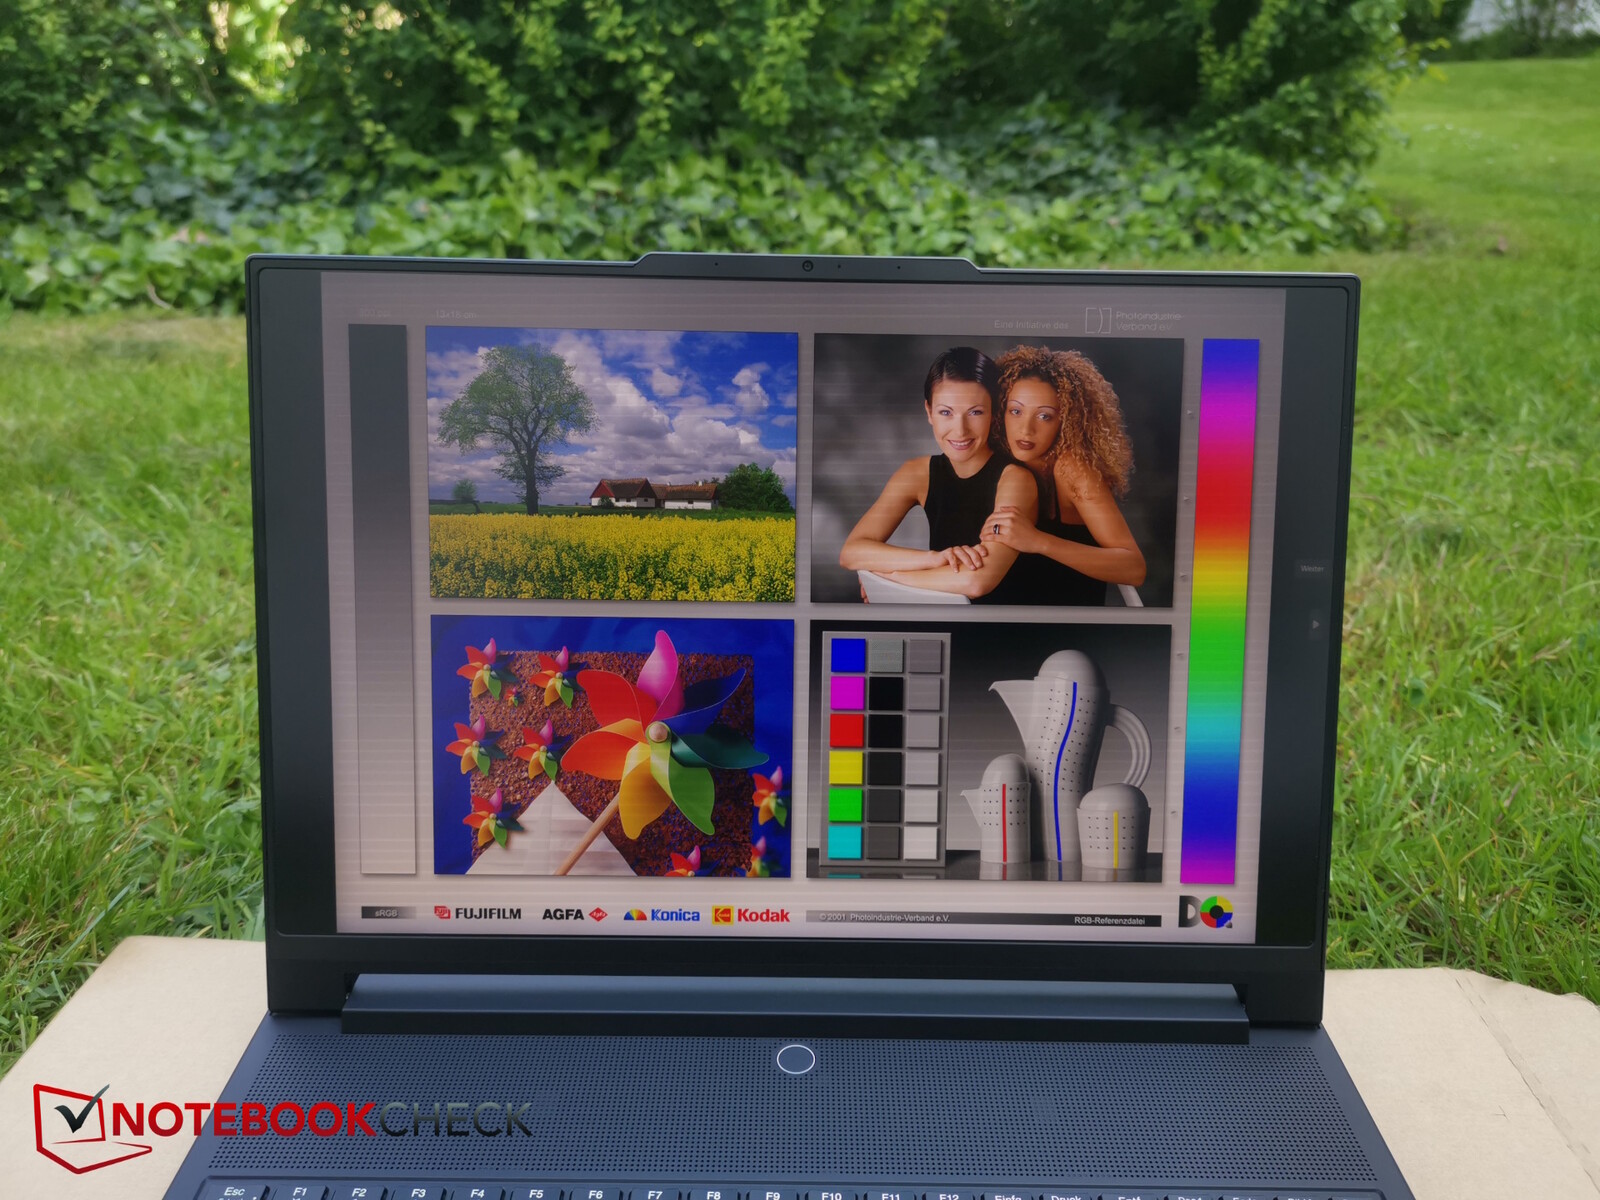
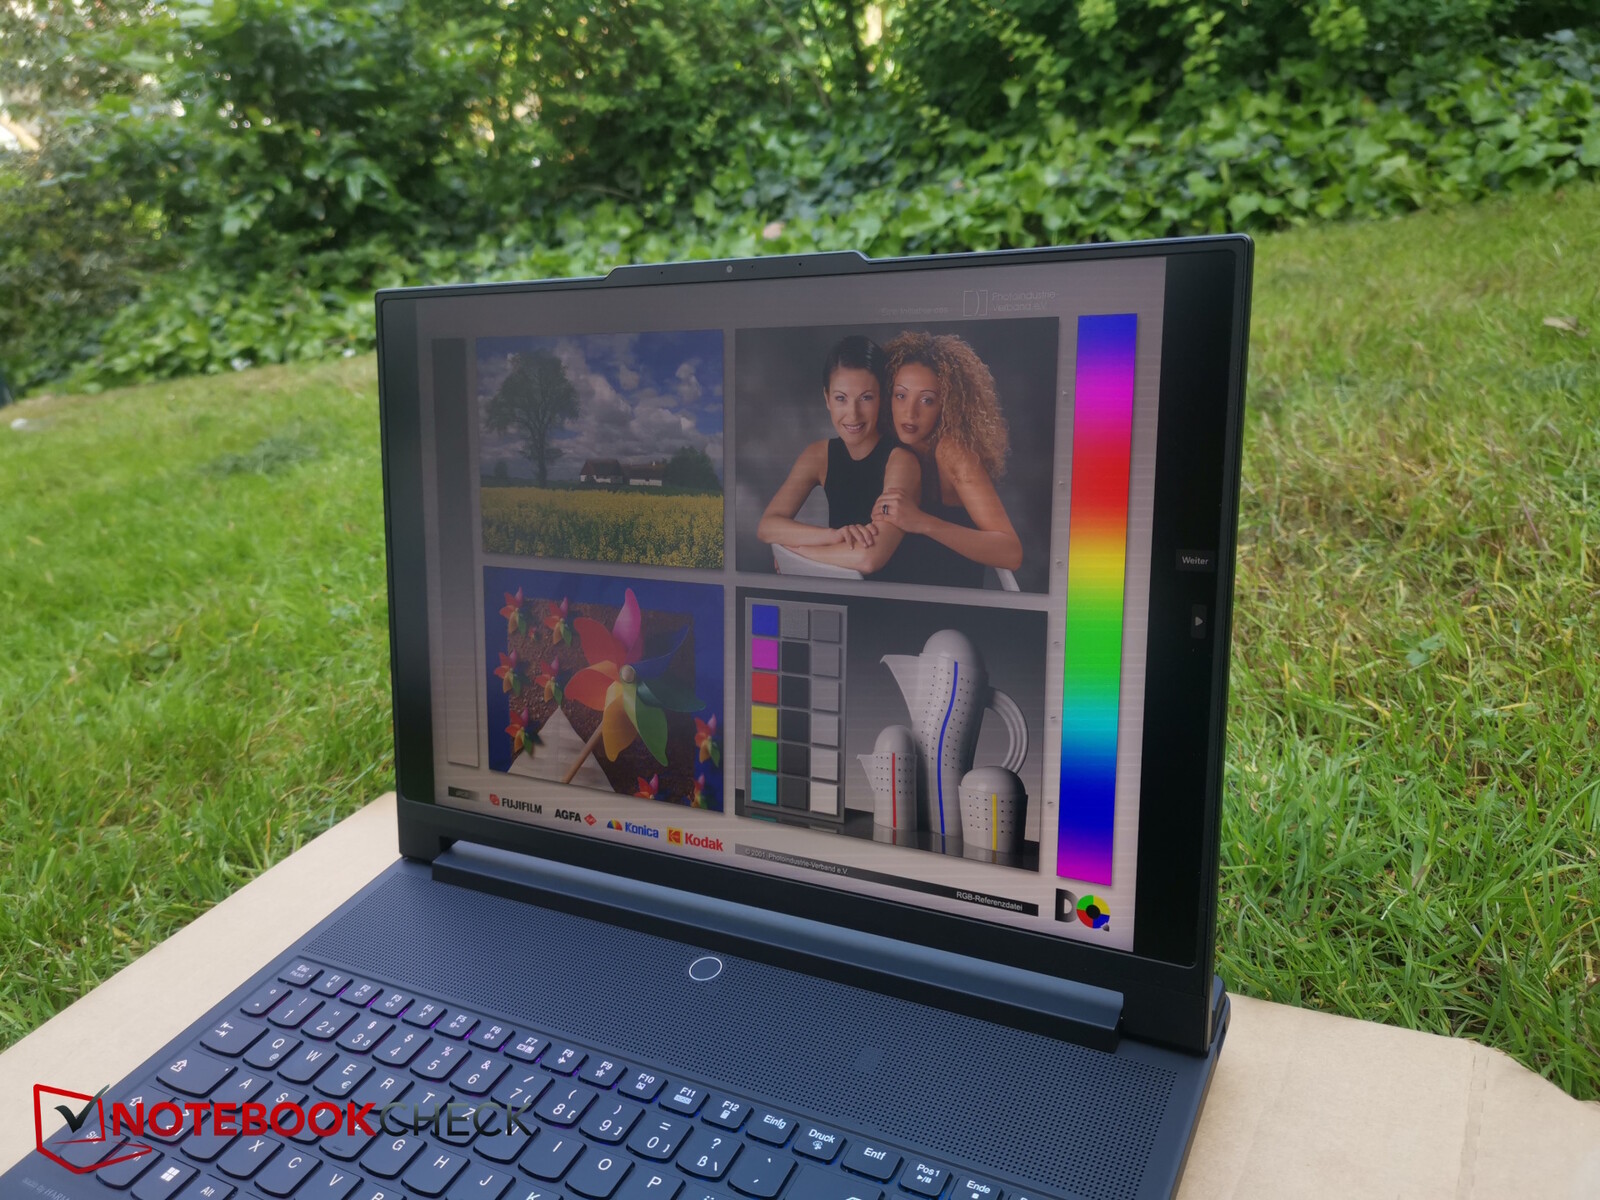
显示屏 - 1,200 nit MiniLED
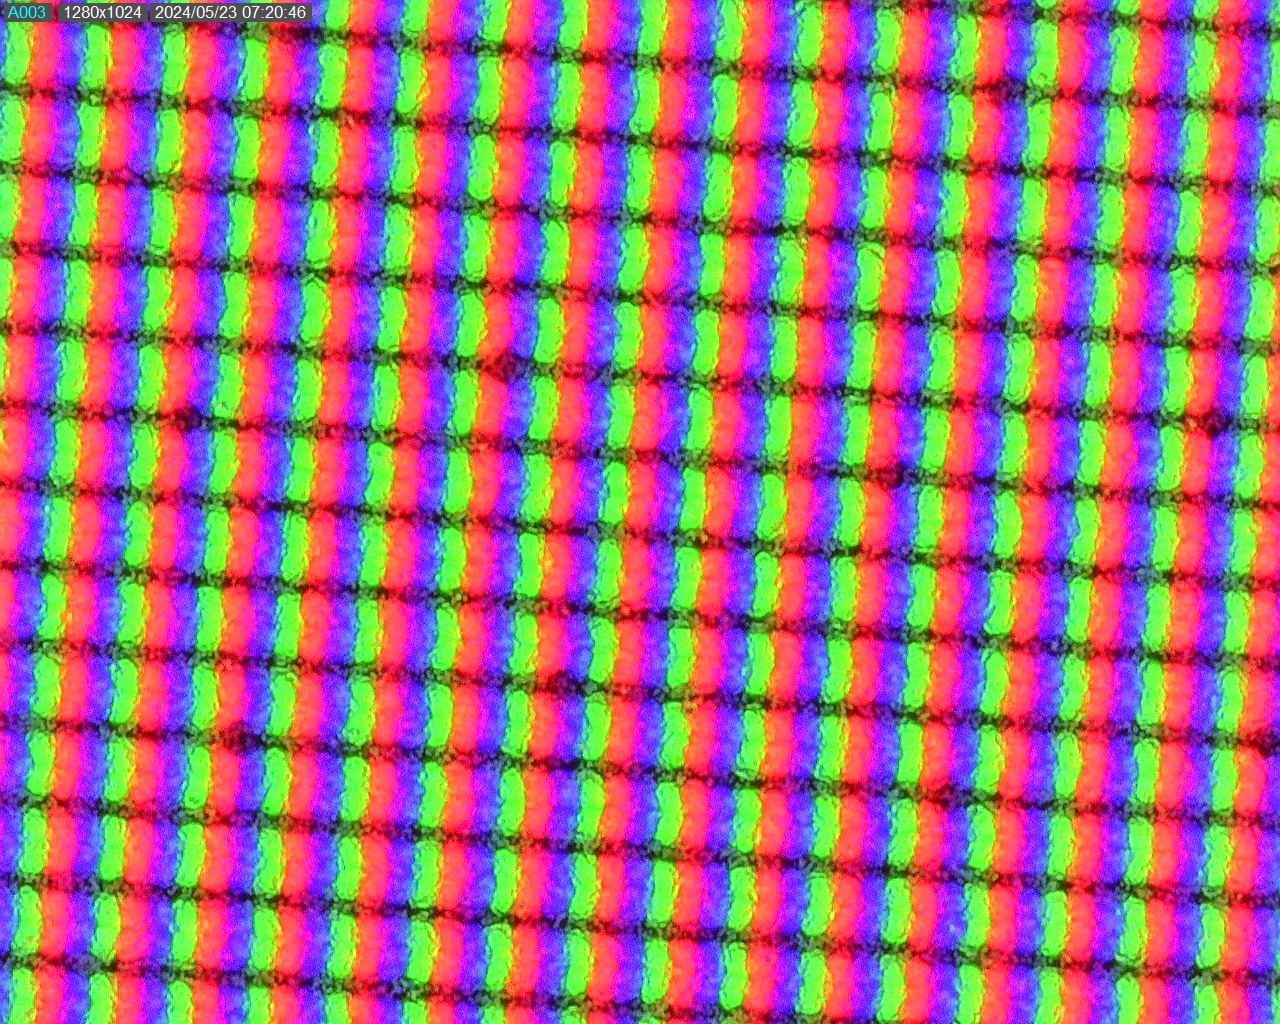
配备杜比视界和 G-Sync 技术的 16 英寸 3.2K(3,200 x 2,000)迷你 LED 显示屏仍然是Legion 9 的主要亮点之一。据说它的亮度高达 1,200 尼特,因此符合 HDR 1000 标准。实际上,我们在 HDR 模式下测得的亮度超过了 1000 尼特。
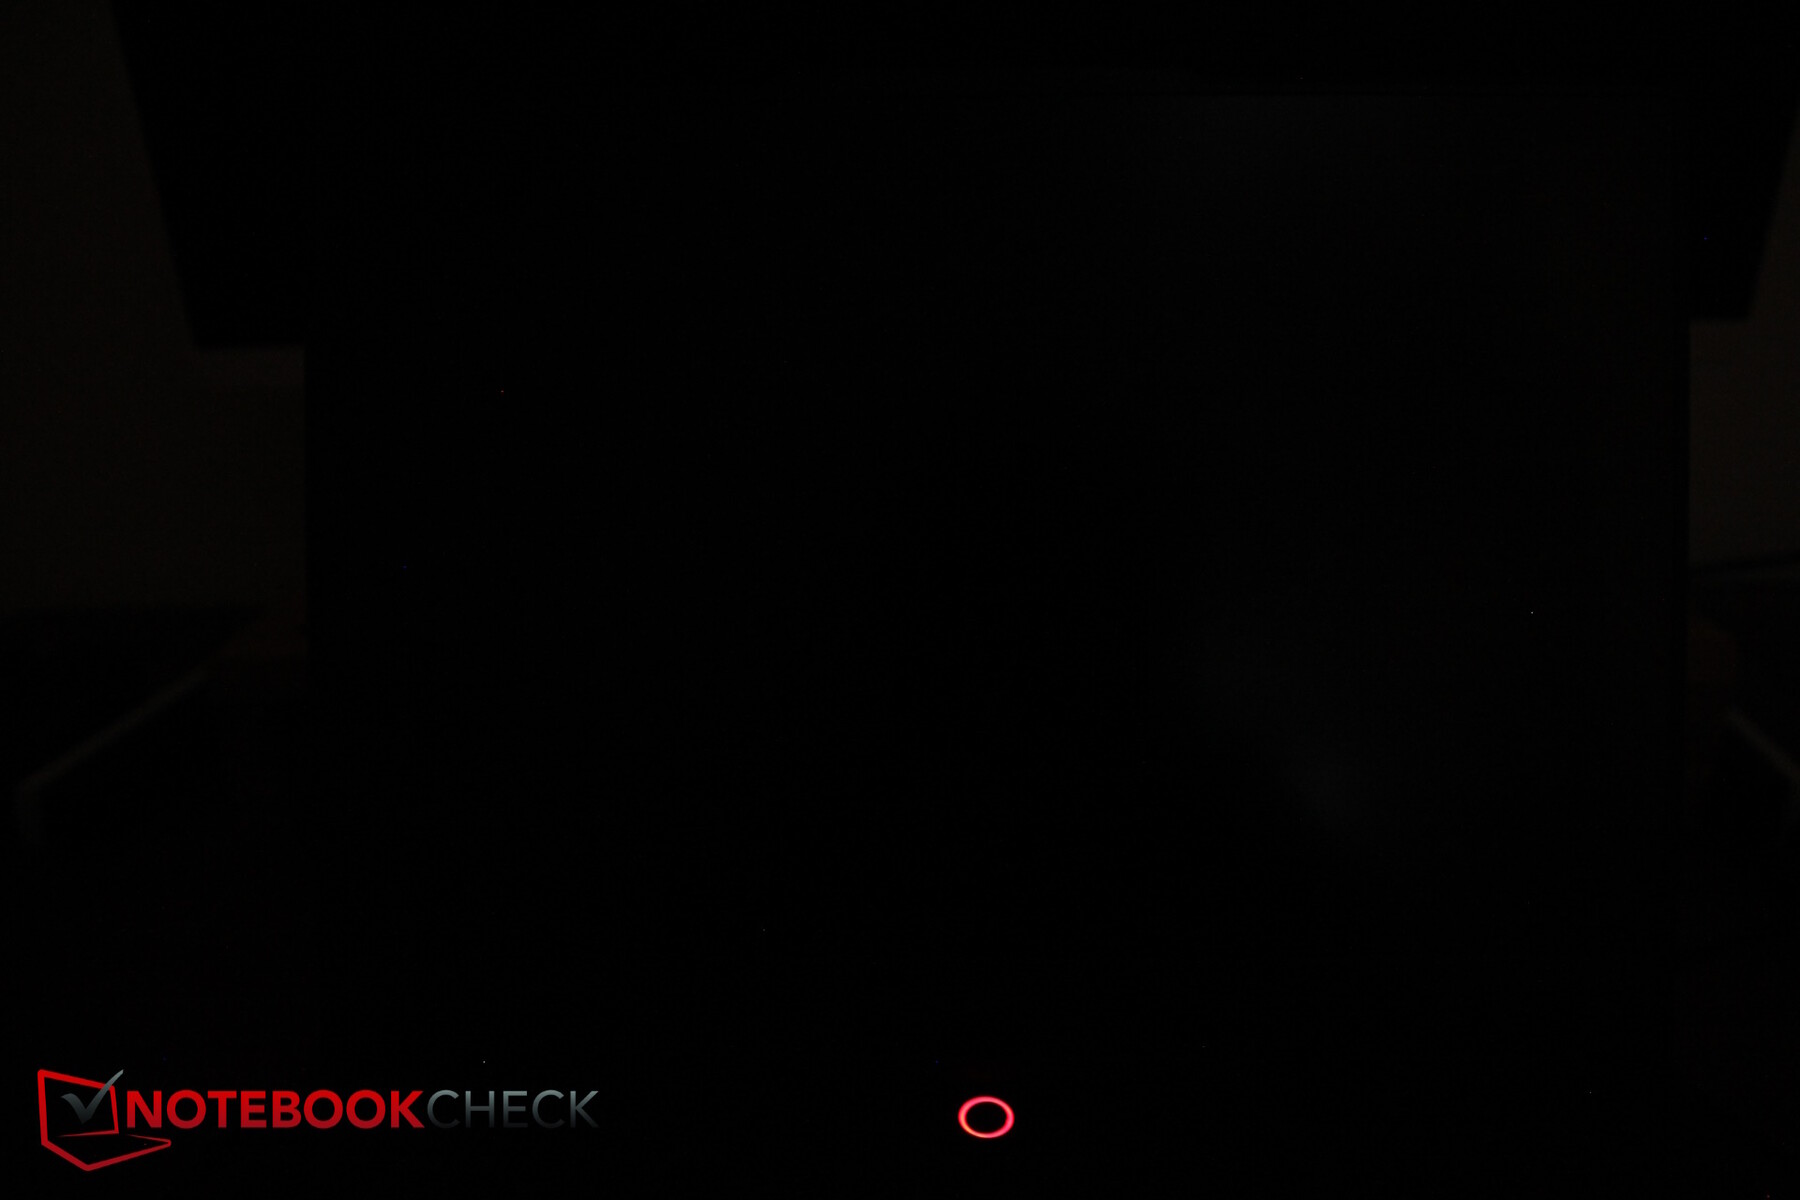
在色彩准确度更高的标清模式下,显示屏的平均亮度仍为 664 尼特!在屏幕亮度为 43% 时,亮度值约为 150 尼特,这也是我们在一些电池测试中使用的值。得益于可在多个区域关闭的微型 LED,它的黑屏效果非常出色,从而实现了极高的对比度。
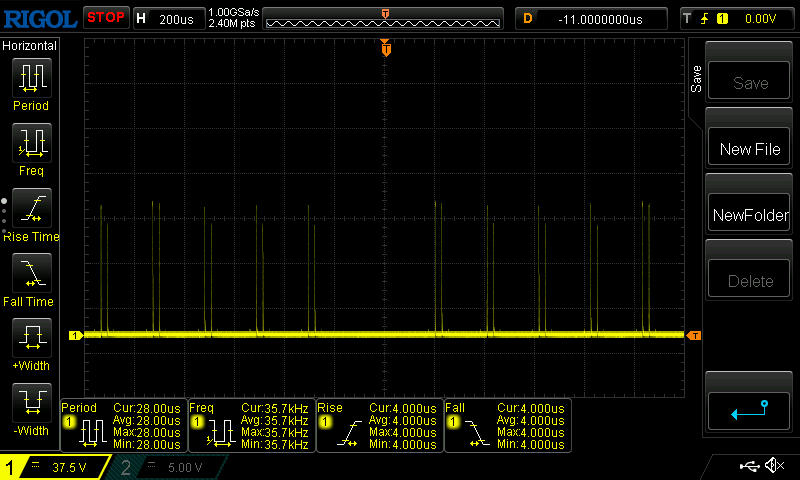
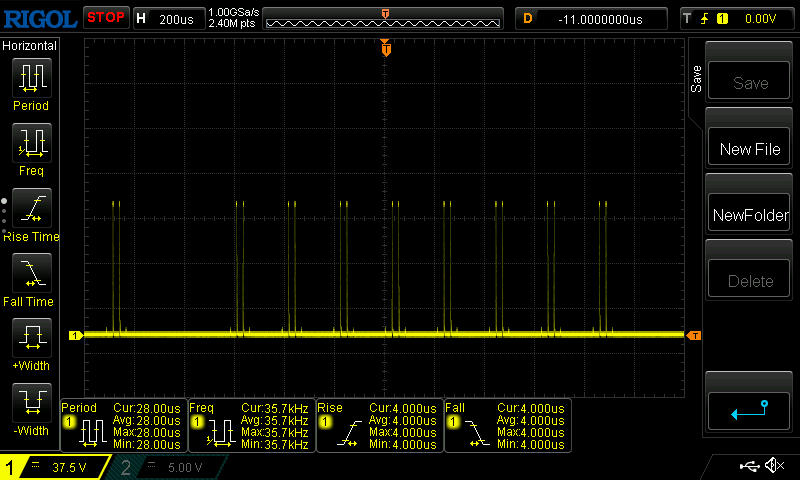
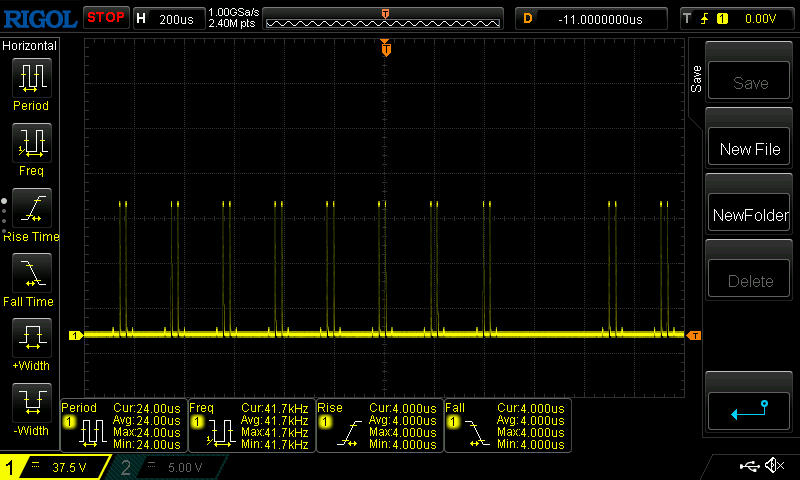
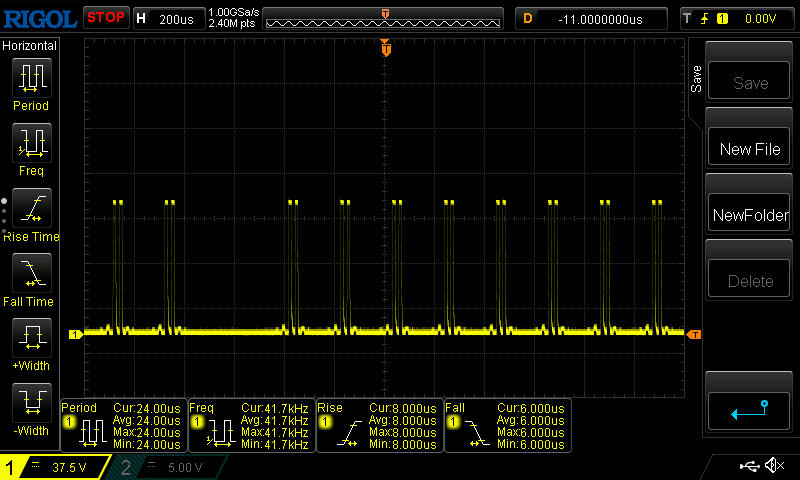
背光完全没有出血现象,响应时间也足够快,当然还没有达到 OLED 的水平。我们可以测量 PWM,尽管频率相当高,为 5 kHz 至 40 kHz,但即使对敏感的人来说也不成问题。
| |||||||||||||||||||||||||
Brightness Distribution: 91 %
Center on Battery: 630 cd/m²
Contrast: 21033:1 (Black: 0.03 cd/m²)
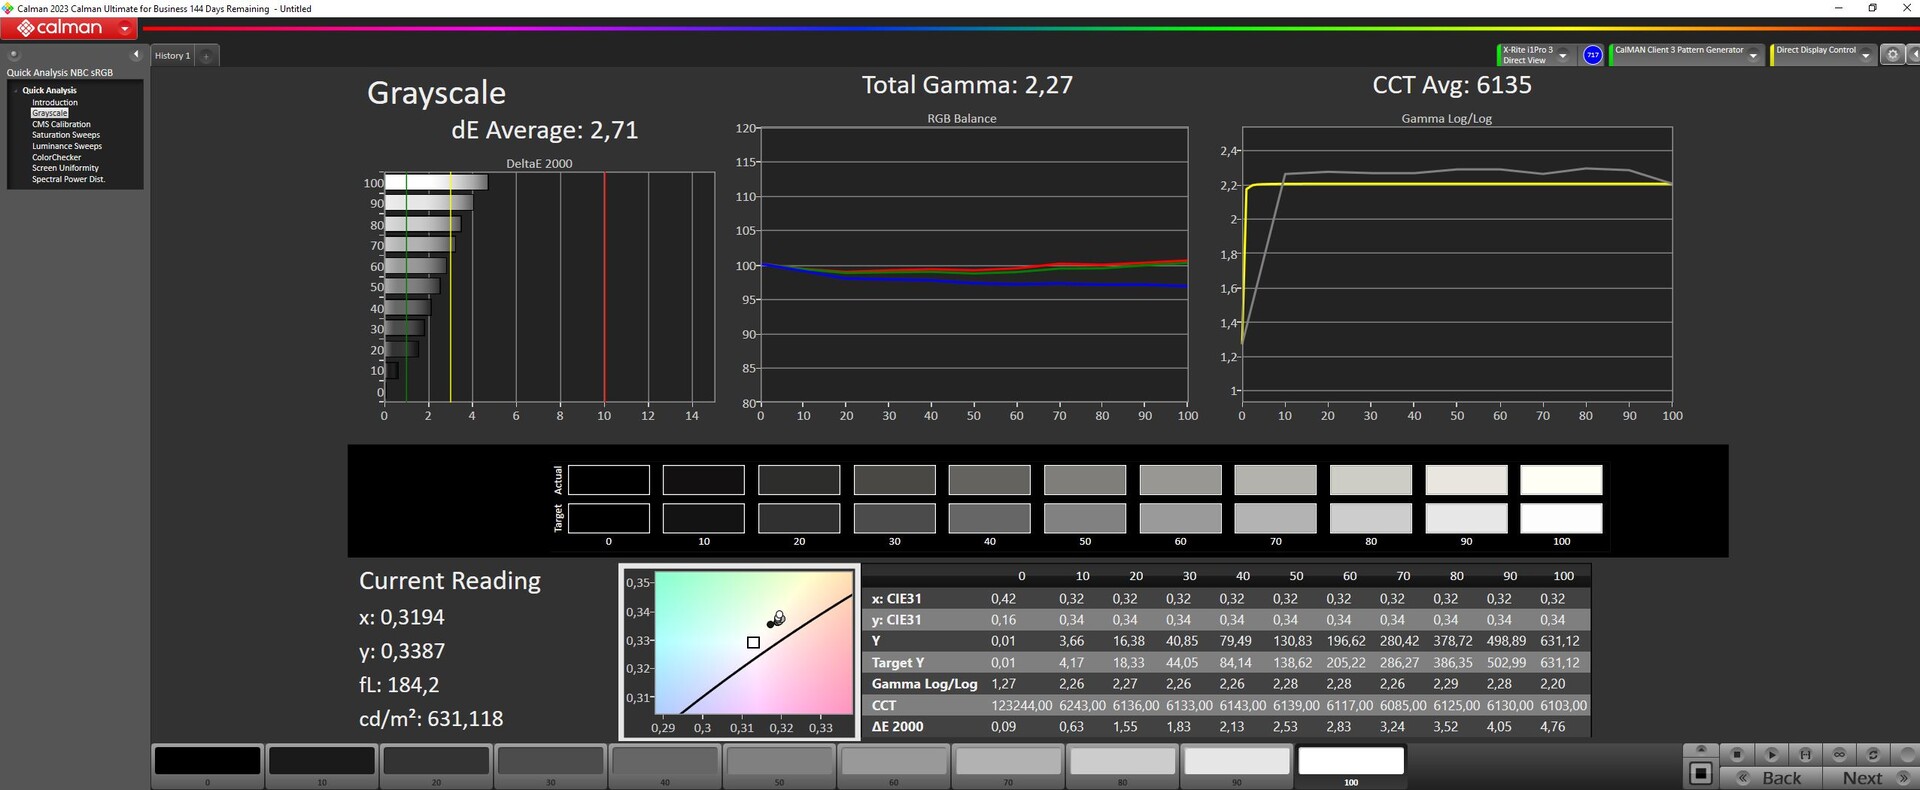
ΔE Color 2.68 | 0.5-29.43 Ø4.87, calibrated: 2.68
ΔE Greyscale 2.71 | 0.5-98 Ø5.1
86.6% AdobeRGB 1998 (Argyll 2.2.0 3D)
99.9% sRGB (Argyll 2.2.0 3D)
95.3% Display P3 (Argyll 2.2.0 3D)
Gamma: 2.27
| Lenovo Legion 9 16IRX9, RTX 4090 CSOT T3 MNG007ZA2-2, MiniLED, 3200x2000, 16" | Lenovo Legion 9 16IRX8 CSOT T3 MNG007ZA2-2, Mini-LED, 3200x2000, 16" | Razer Blade 16 2024, RTX 4090 Samsung SDC41AB (ATNA60DL03-0), OLED, 2560x1600, 16" | Alienware m18 R2 BOE NE18NZ1, IPS, 2560x1600, 18" | Asus ROG Strix Scar 18 G834JYR (2024) BOE NE180QDM-NM1, Mini LED, 2560x1600, 18" | Medion Erazer Beast X40 2024 BOE NE170QDM-NZ1, IPS, 2560x1600, 17" | |
|---|---|---|---|---|---|---|
| Display | 1% | 5% | 2% | 3% | -16% | |
| Display P3 Coverage | 95.3 | 97.2 2% | 99.1 4% | 97.8 3% | 99.9 5% | 68.1 -29% |
| sRGB Coverage | 99.9 | 99.9 0% | 99.9 0% | 99.5 0% | 100 0% | 99.5 0% |
| AdobeRGB 1998 Coverage | 86.6 | 87 0% | 95.6 10% | 88.9 3% | 90 4% | 69 -20% |
| Response Times | -12% | 37% | 27% | 1% | 19% | |
| Response Time Grey 50% / Grey 80% * | 12.6 ? | 13.3 ? -6% | 0.24 ? 98% | 5.3 ? 58% | 12 ? 5% | 11.7 ? 7% |
| Response Time Black / White * | 10 ? | 11.6 ? -16% | 0.4 ? 96% | 10.4 ? -4% | 10.7 ? -7% | 6.9 ? 31% |
| PWM Frequency | 5430 | 4742 -13% | 960 -82% | 5733 ? 6% | ||
| Screen | -0% | 21% | -107% | 14% | -136% | |
| Brightness middle | 631 | 674.9 7% | 418 -34% | 271.8 -57% | 937 48% | 422 -33% |
| Brightness | 664 | 682 3% | 420 -37% | 275 -59% | 934 41% | 388 -42% |
| Brightness Distribution | 91 | 96 5% | 98 8% | 78 -14% | 89 -2% | 87 -4% |
| Black Level * | 0.03 | 0.04 -33% | 0.02 33% | 0.27 -800% | 0.066 -120% | 0.42 -1300% |
| Contrast | 21033 | 16873 -20% | 20900 -1% | 1007 -95% | 14197 -33% | 1005 -95% |
| Colorchecker dE 2000 * | 2.68 | 2.56 4% | 1.07 60% | 2.48 7% | 1.52 43% | 1.42 47% |
| Colorchecker dE 2000 max. * | 6.41 | 4.16 35% | 4.04 37% | 5.59 13% | 2.82 56% | 1.97 69% |
| Colorchecker dE 2000 calibrated * | 2.68 | 2.47 8% | 1.07 60% | 0.56 79% | 1.21 55% | 0.7 74% |
| Greyscale dE 2000 * | 2.71 | 3 -11% | 1.12 59% | 3.7 -37% | 1.7 37% | 1.2 56% |
| Gamma | 2.27 97% | 2.38 92% | 2.29 96% | 2.2 100% | 2.042 108% | 2.078 106% |
| CCT | 6135 106% | 6799 96% | 6417 101% | 6355 102% | 6578 99% | 6581 99% |
| Total Average (Program / Settings) | -4% /
-2% | 21% /
21% | -26% /
-65% | 6% /
9% | -44% /
-89% |
* ... smaller is better
DisplayP3 的覆盖率约为 95%,sRGB 完全覆盖,AdobeRGB 覆盖率为 86% 至 87%。
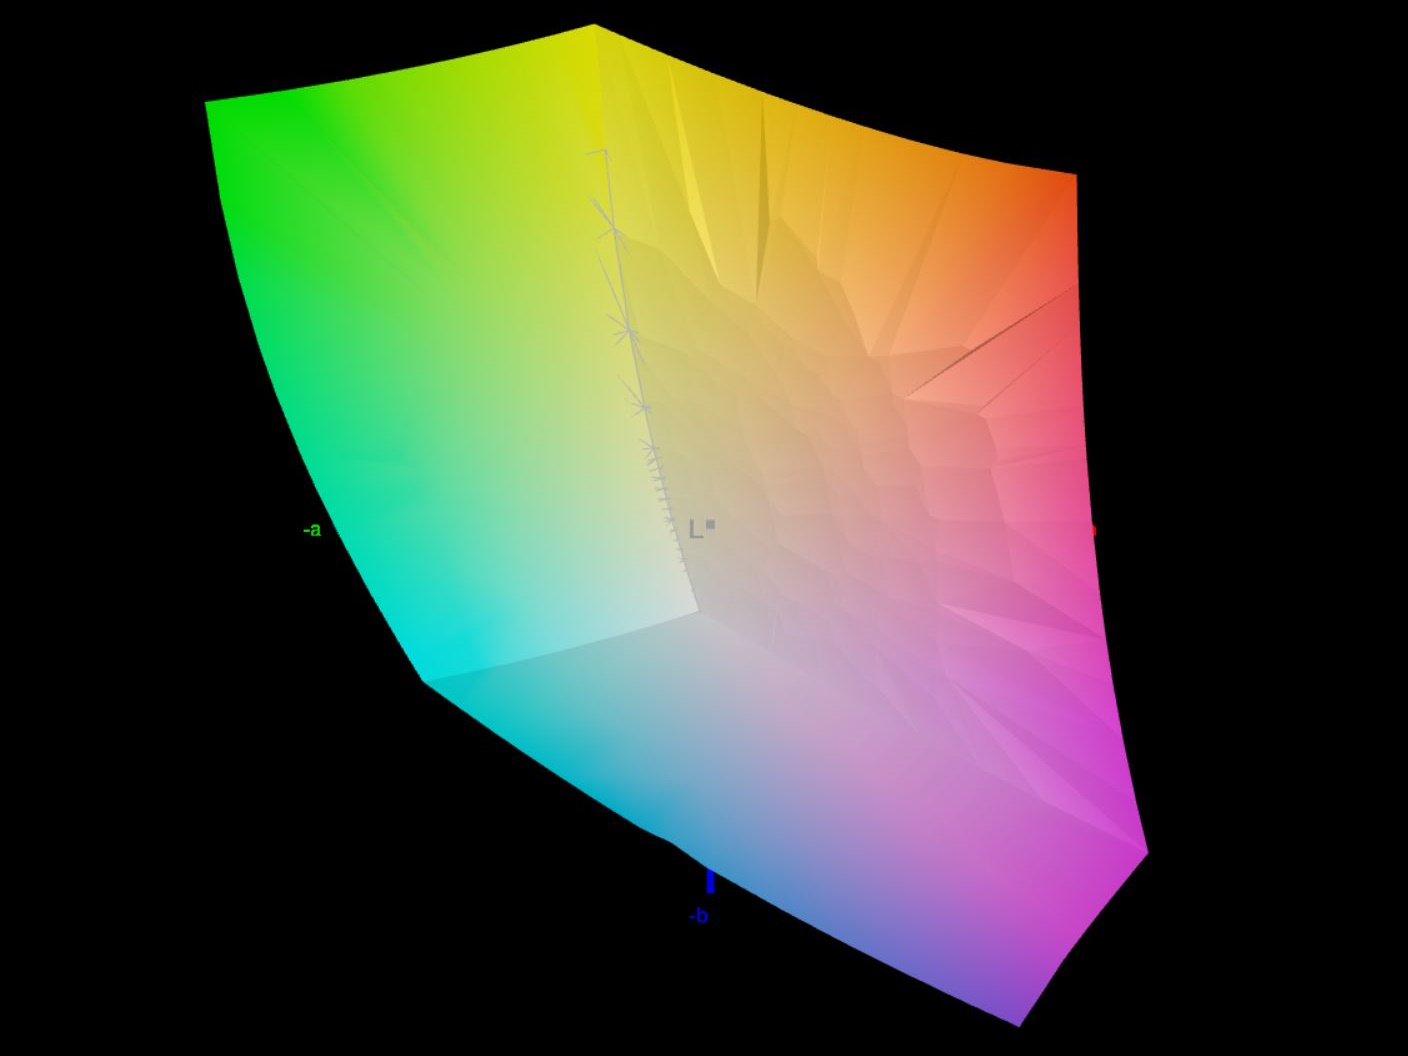
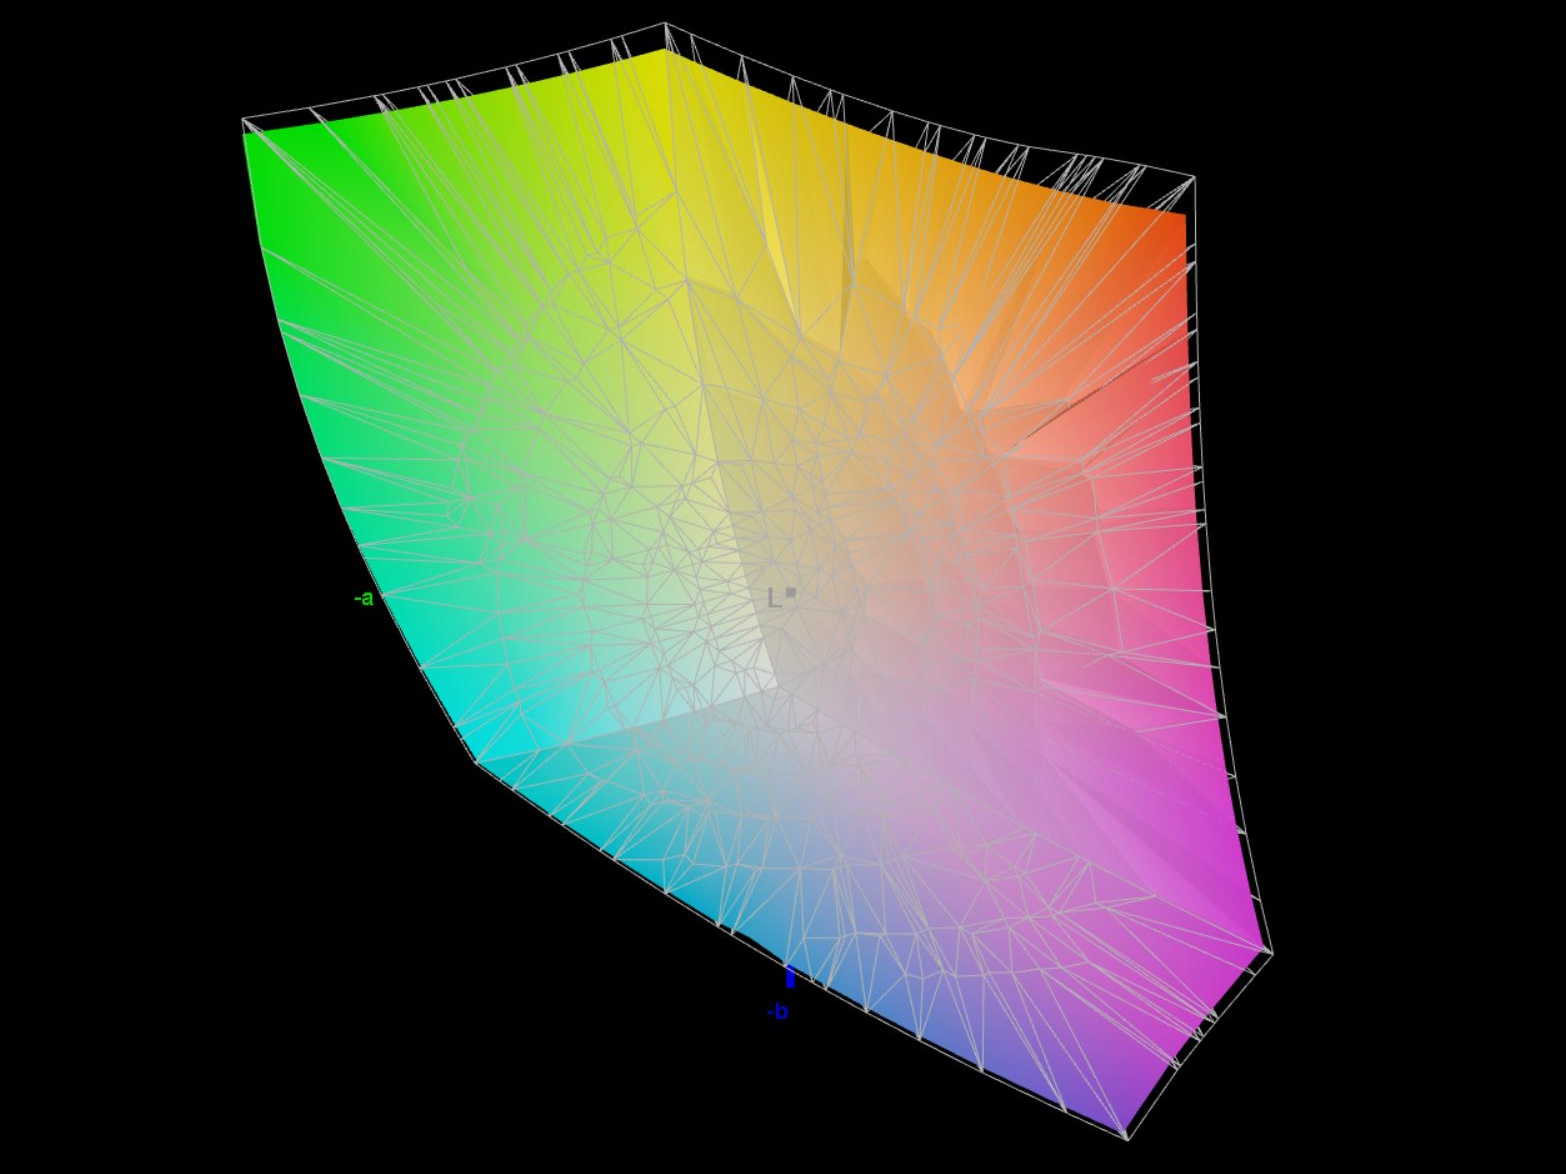
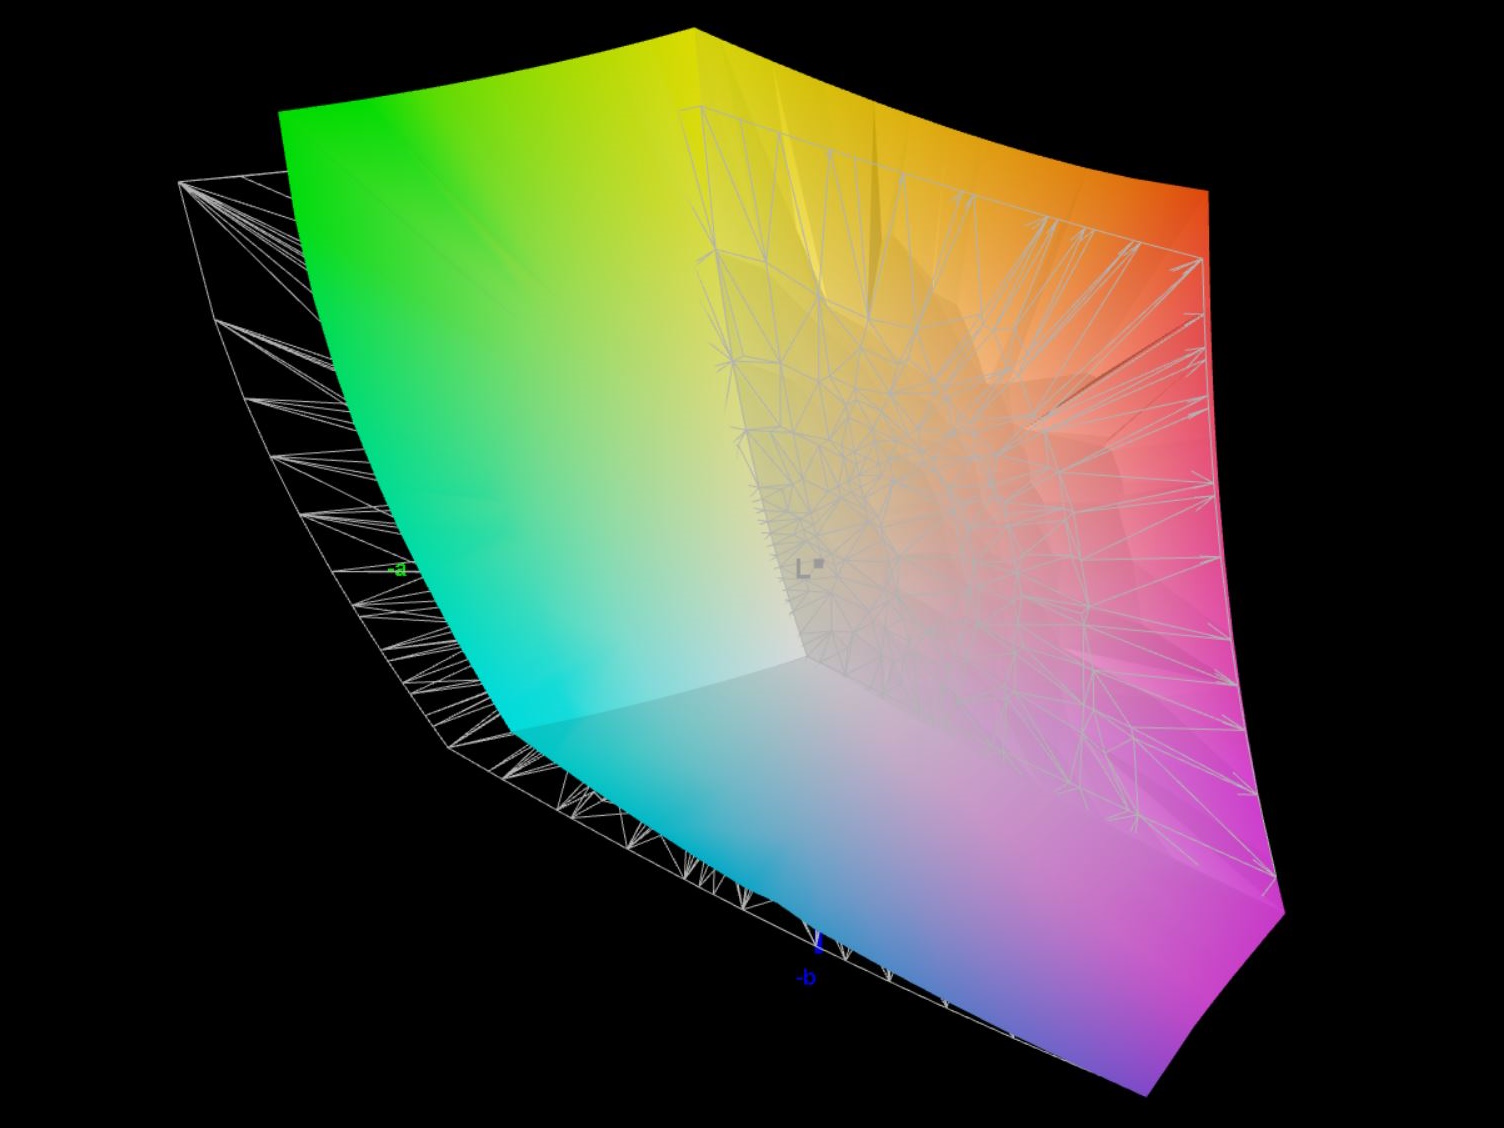
Ex 工作正常,显示屏已根据 P3 标准进行了正确校准。我们的重新校准改善了其灰度 DeltaE 值,但却恶化了其 ClocChecker DeltaE 值,这就是为什么不值得为此付出努力的原因。不过,它的色彩偏差并不理想,平均值为 2.68,离群值高达 6.41。

Display Response Times
| ↔ Response Time Black to White | ||
|---|---|---|
| 10 ms ... rise ↗ and fall ↘ combined | ↗ 5.2 ms rise | 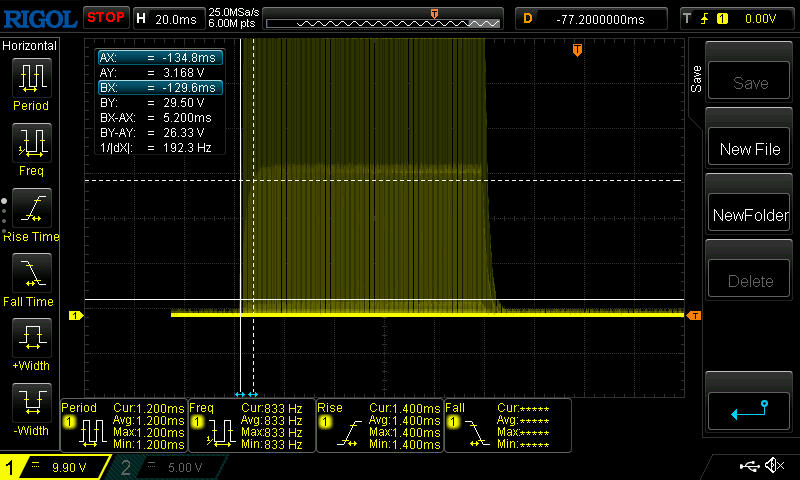 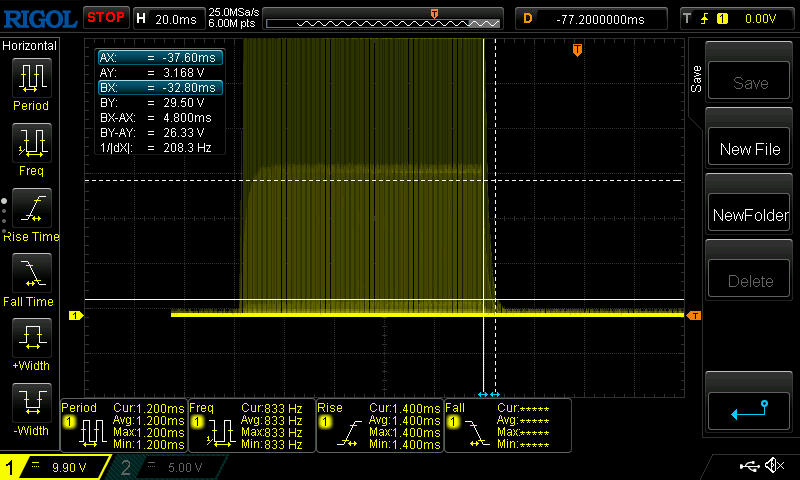 |
| ↘ 4.8 ms fall | ||
| The screen shows good response rates in our tests, but may be too slow for competitive gamers. In comparison, all tested devices range from 0.1 (minimum) to 240 (maximum) ms. » 24 % of all devices are better. This means that the measured response time is better than the average of all tested devices (20.7 ms). | ||
| ↔ Response Time 50% Grey to 80% Grey | ||
| 12.6 ms ... rise ↗ and fall ↘ combined | ↗ 6.6 ms rise | 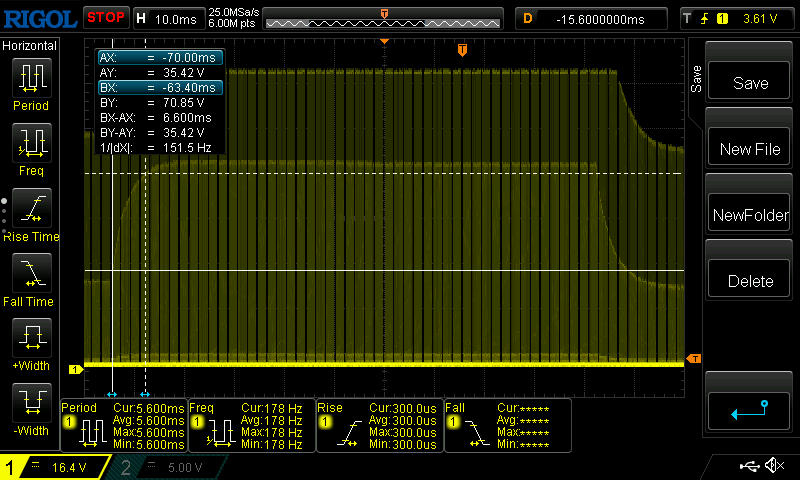 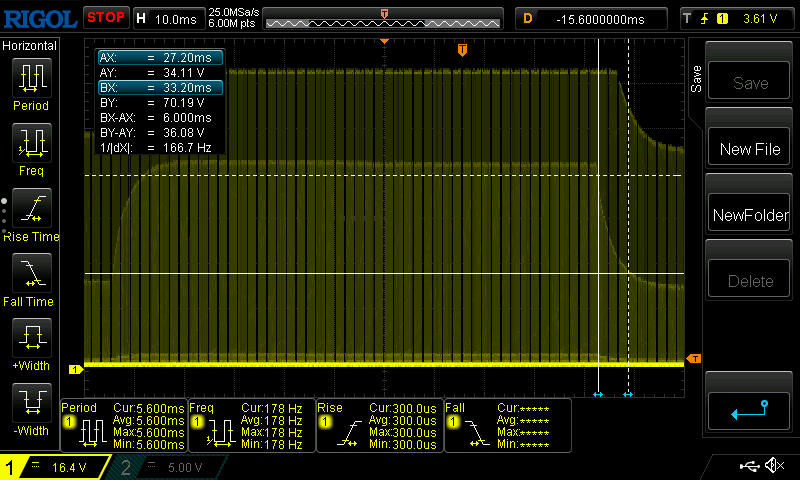 |
| ↘ 6 ms fall | ||
| The screen shows good response rates in our tests, but may be too slow for competitive gamers. In comparison, all tested devices range from 0.165 (minimum) to 636 (maximum) ms. » 23 % of all devices are better. This means that the measured response time is better than the average of all tested devices (32.5 ms). | ||
Screen Flickering / PWM (Pulse-Width Modulation)
| Screen flickering / PWM detected | 5430 Hz Amplitude: 8 % | |
The display backlight flickers at 5430 Hz (worst case, e.g., utilizing PWM) . The frequency of 5430 Hz is quite high, so most users sensitive to PWM should not notice any flickering. In comparison: 53 % of all tested devices do not use PWM to dim the display. If PWM was detected, an average of 8488 (minimum: 5 - maximum: 343500) Hz was measured. | ||

得益于屏幕的高亮度和哑光表面,它在室外的可视性相当不错。即便如此,也应避免阳光直射。

性能 - 高,但并非没有问题
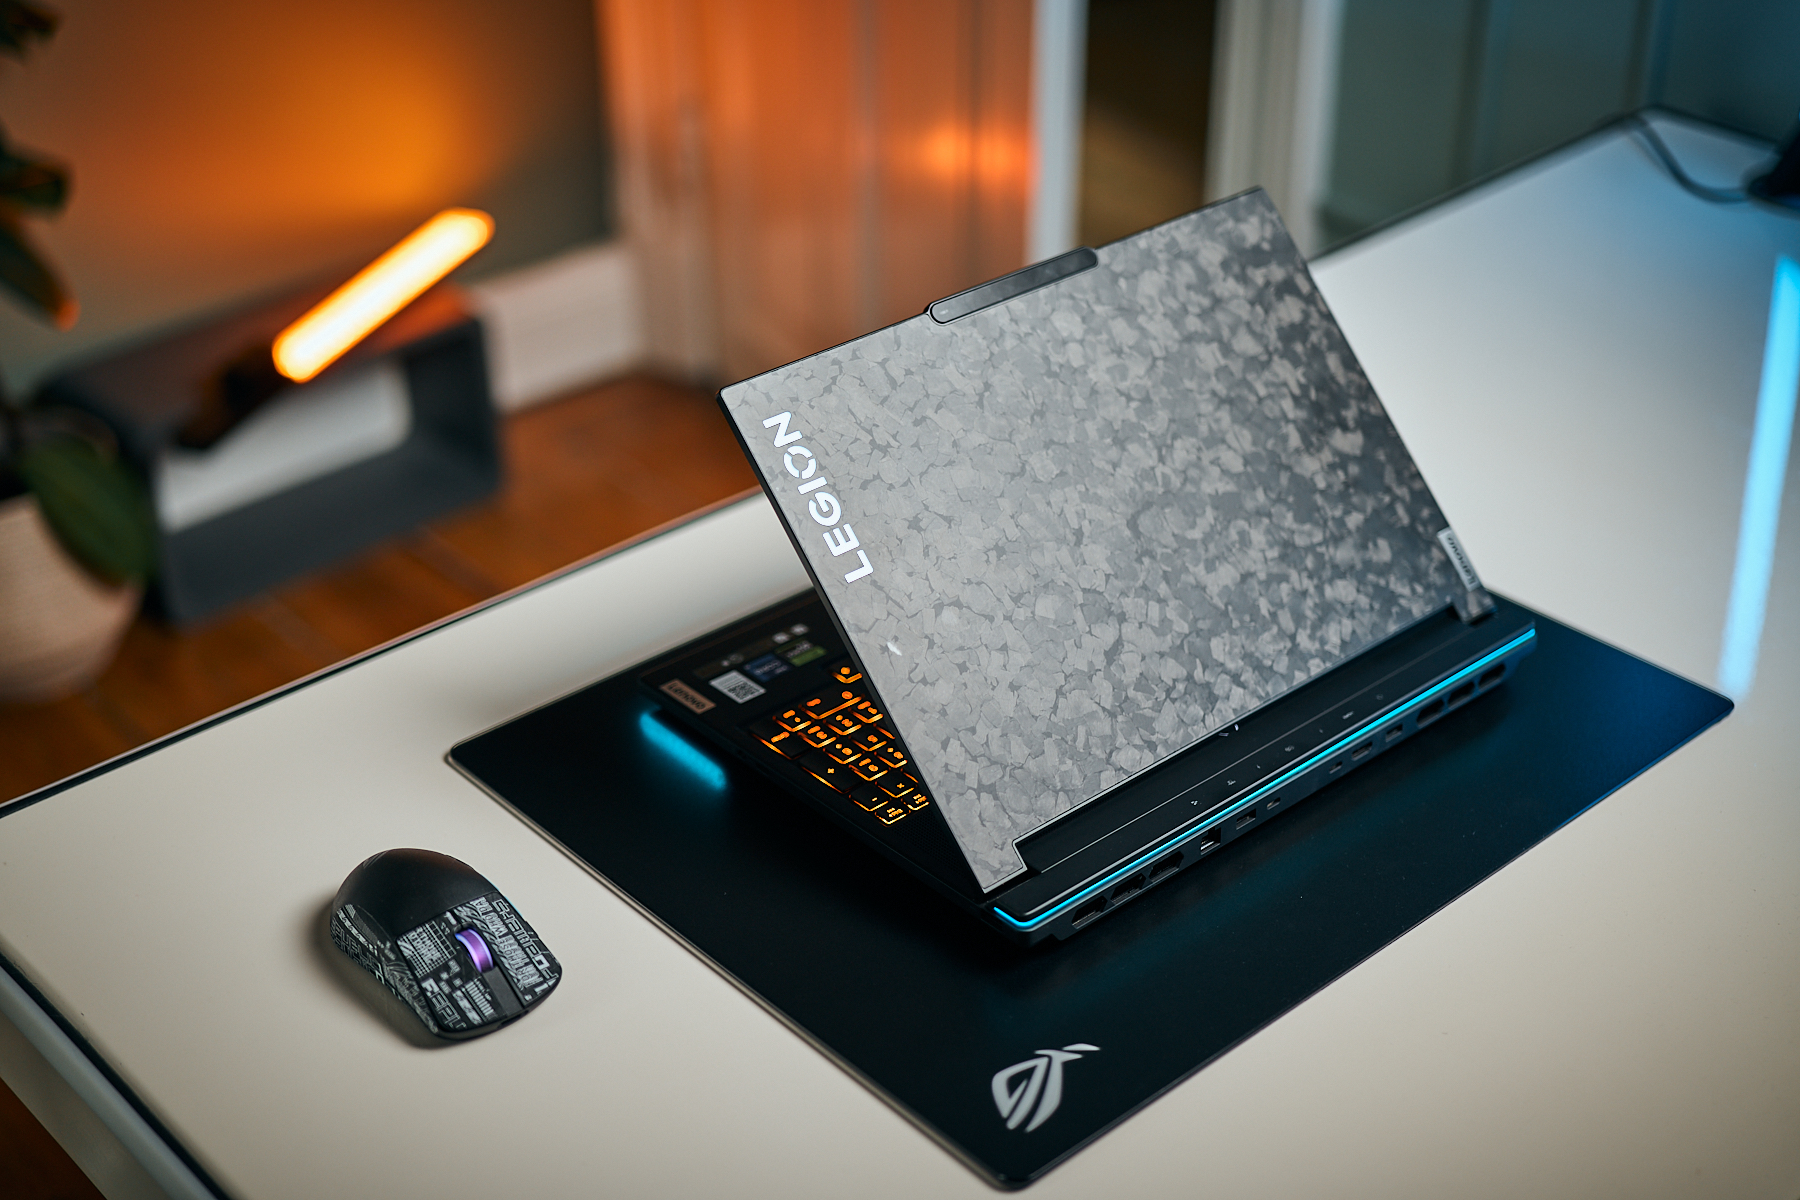
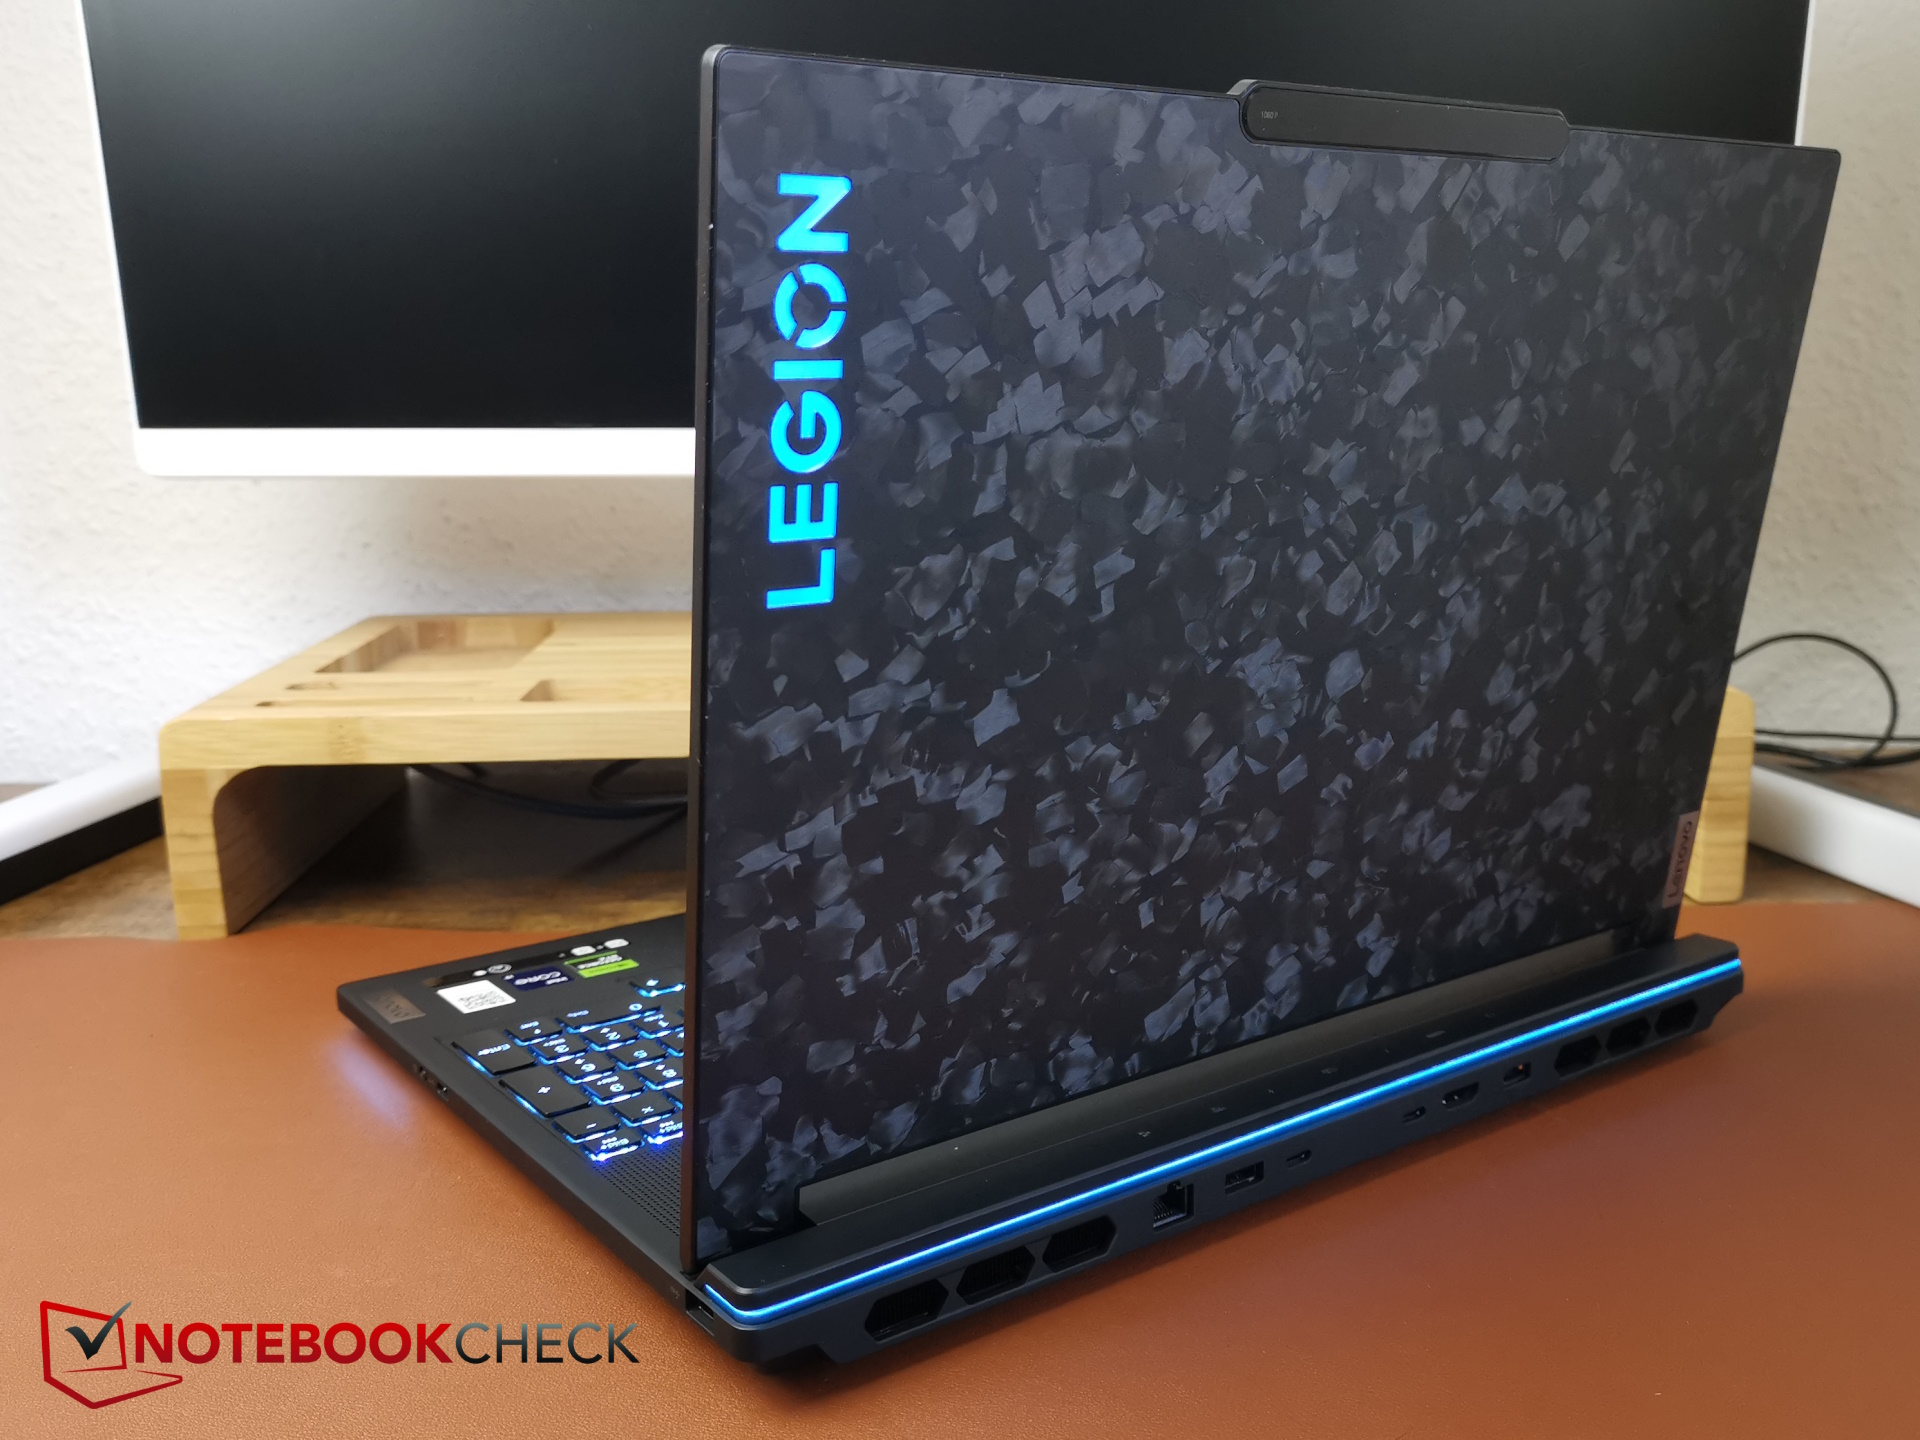
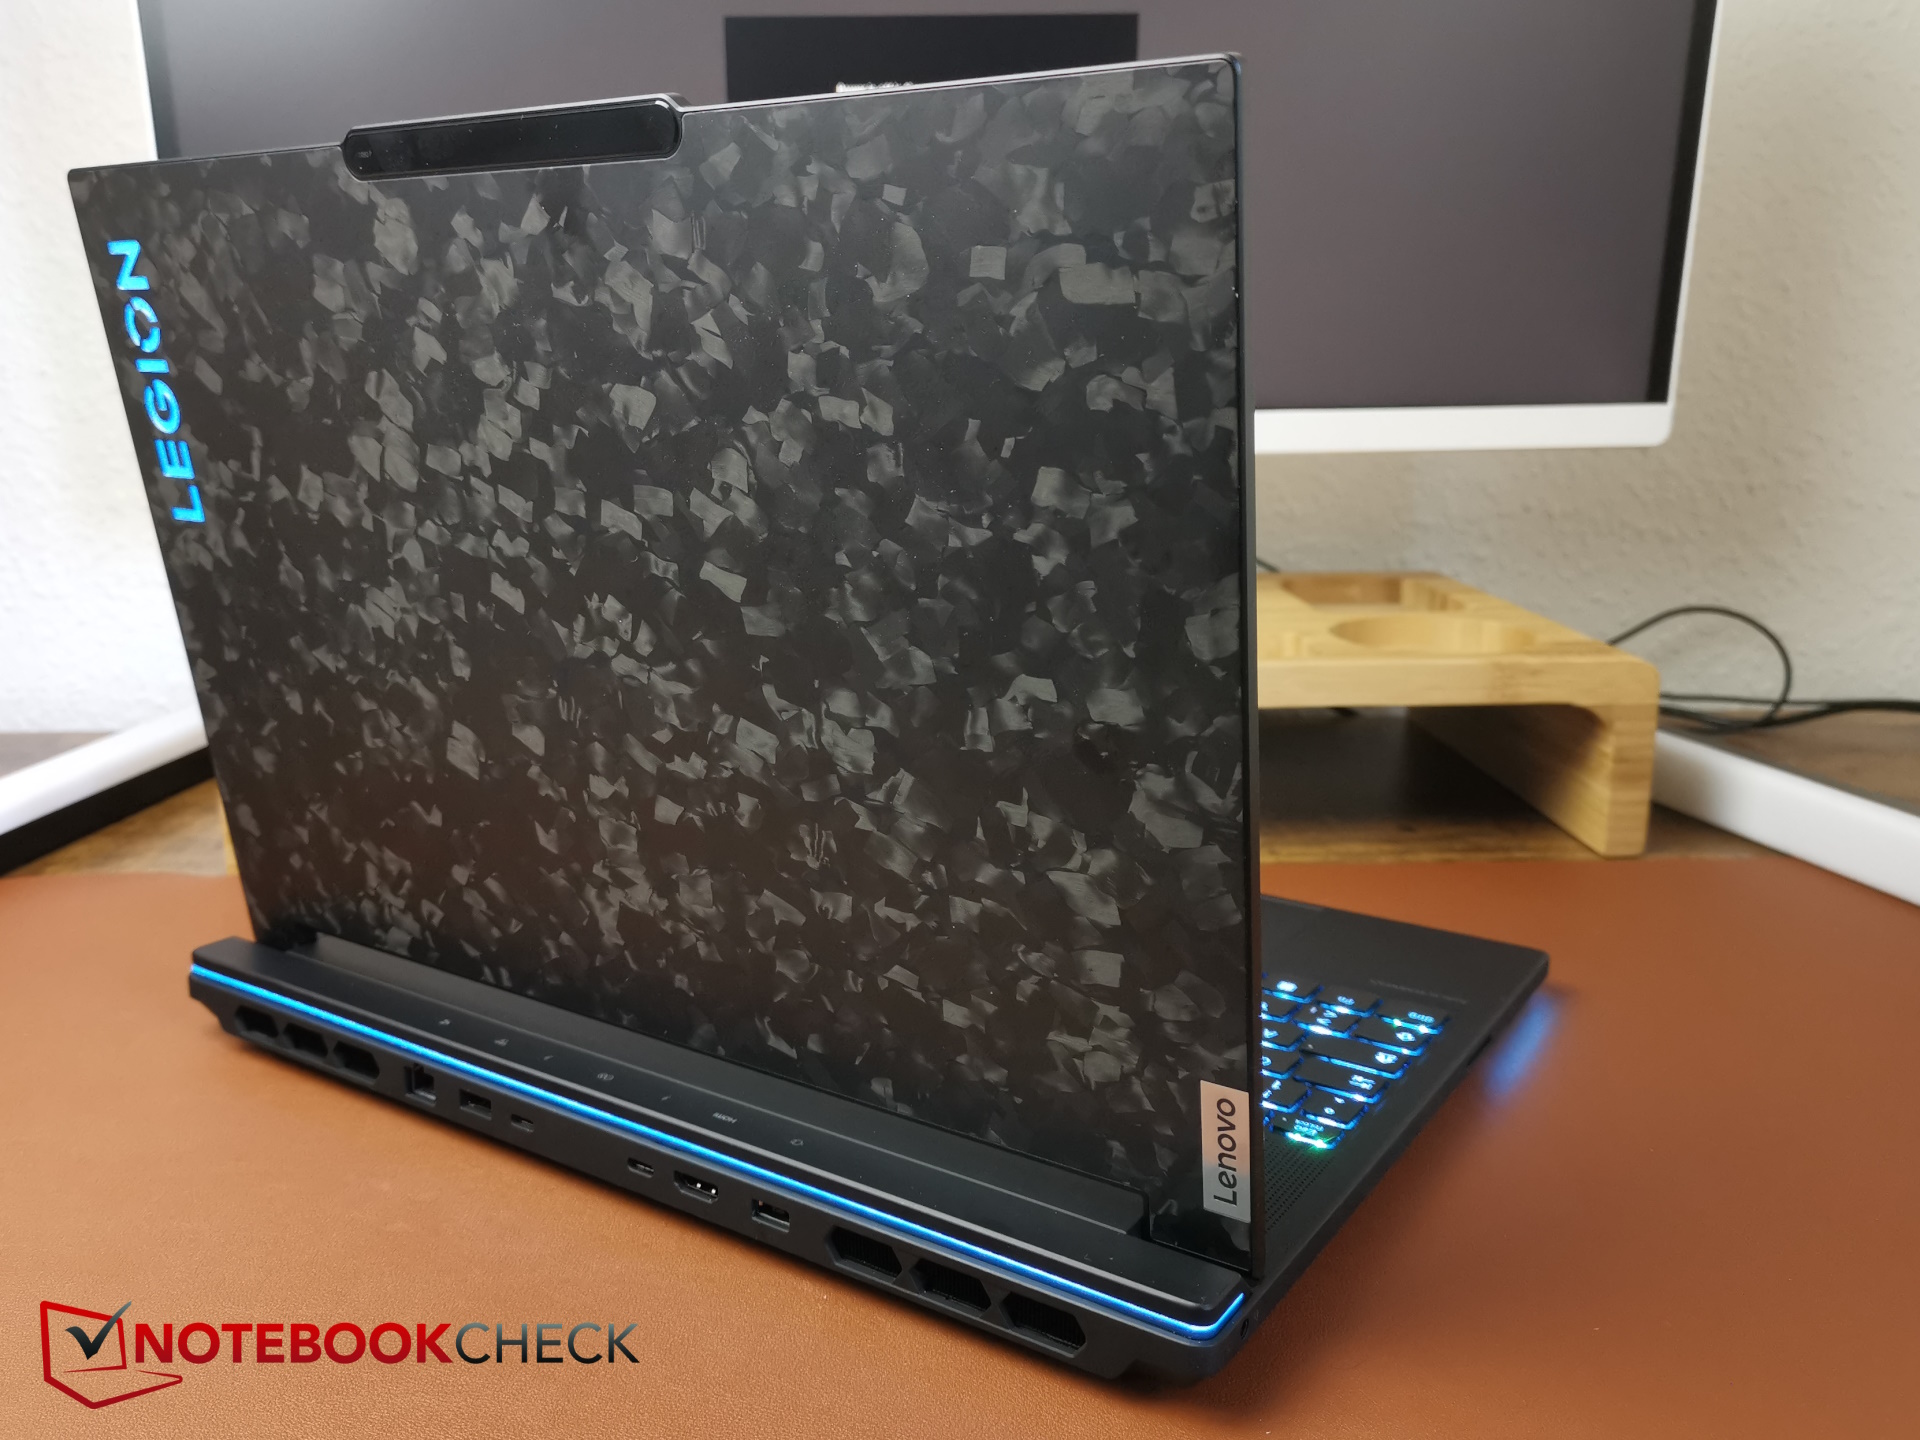
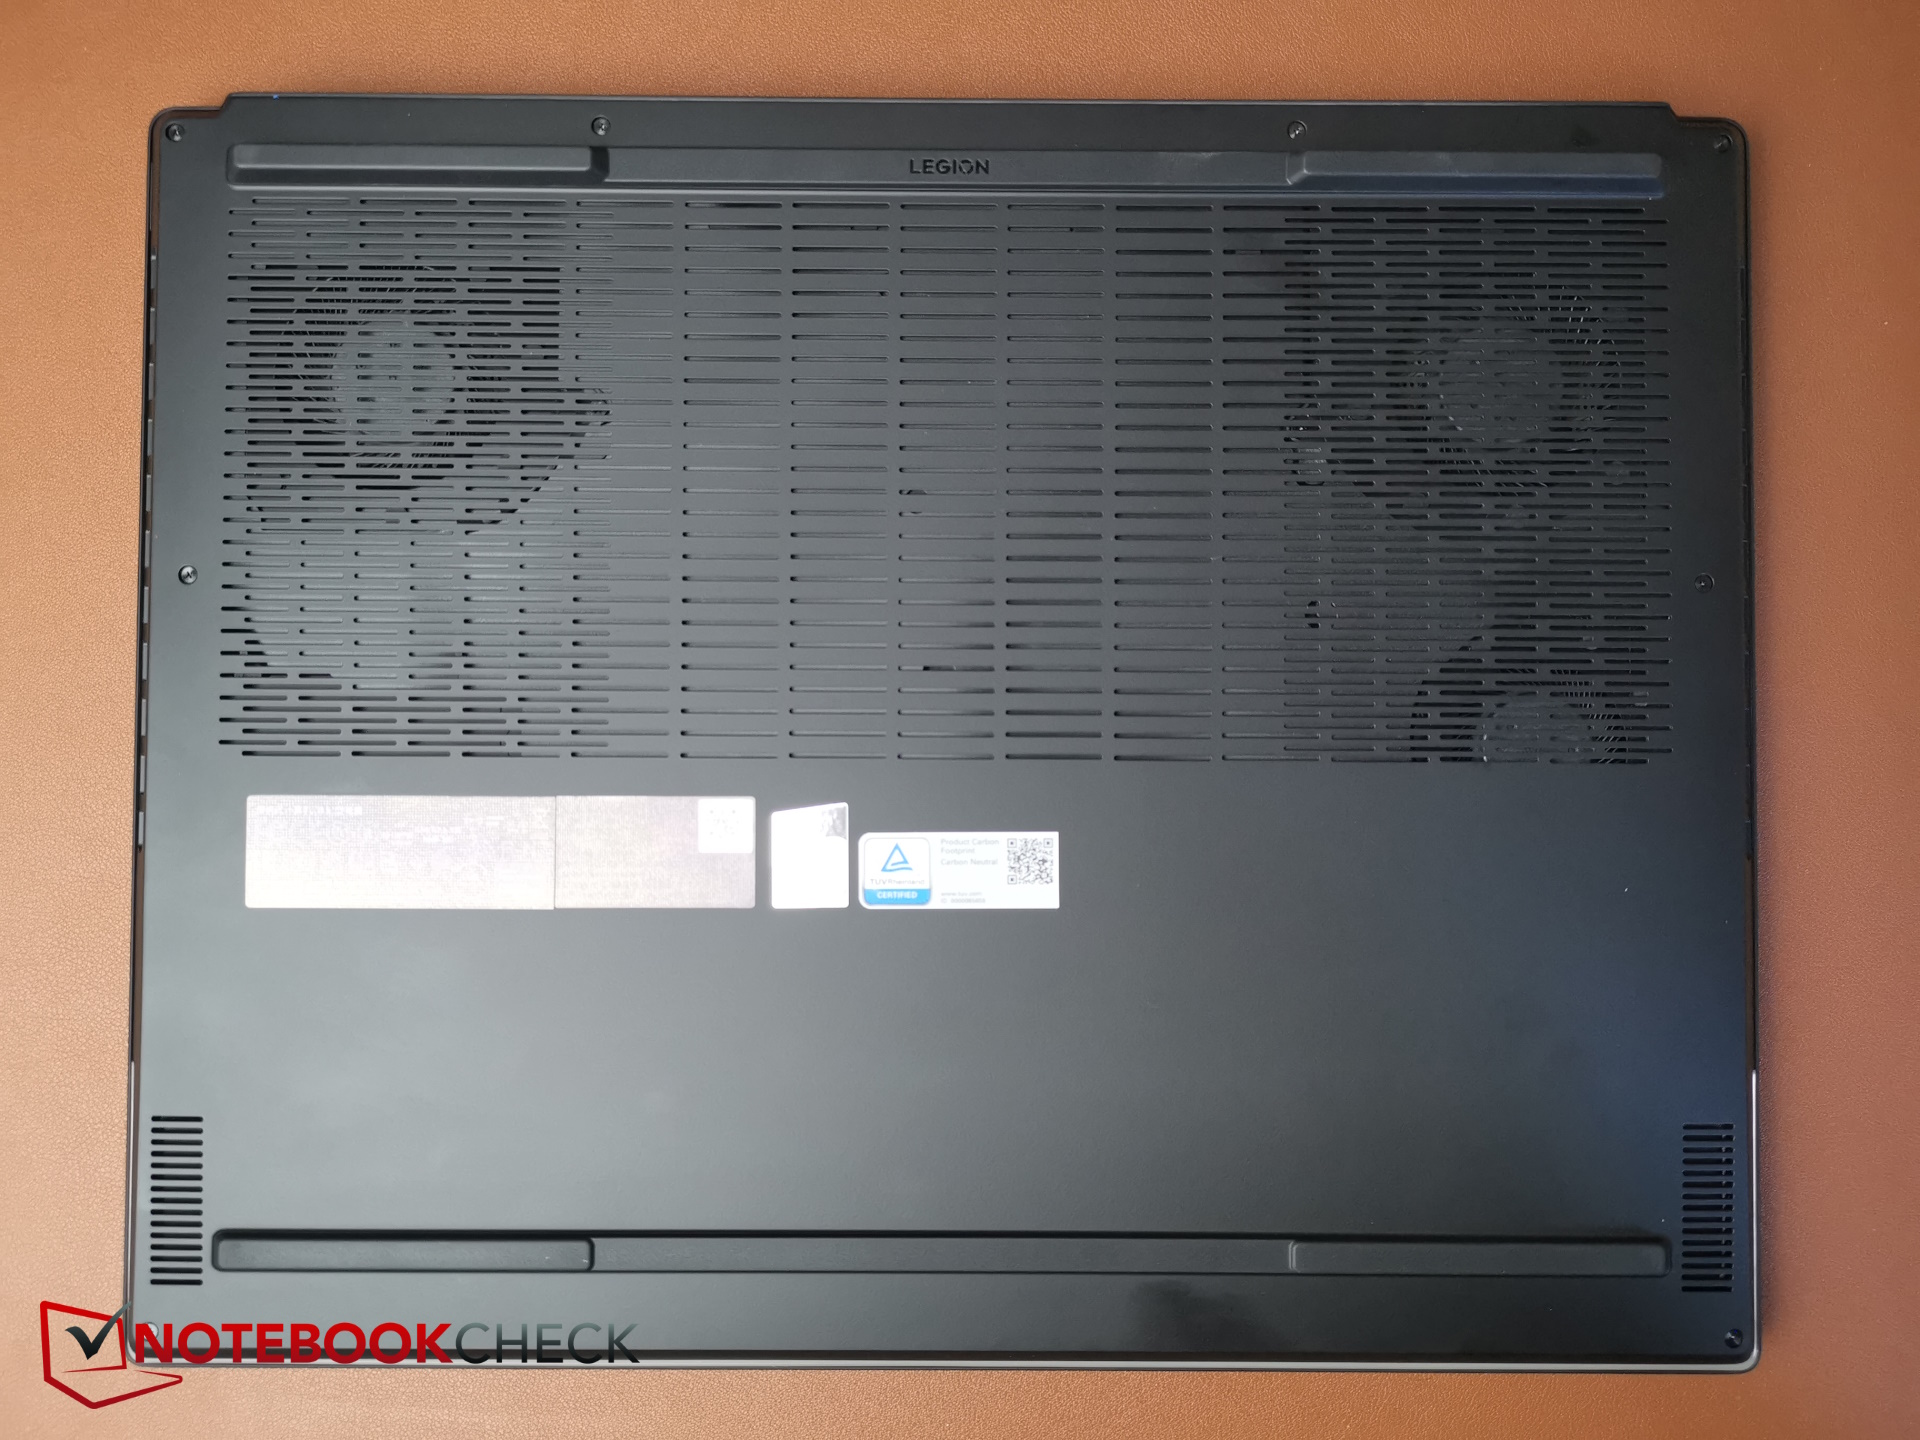
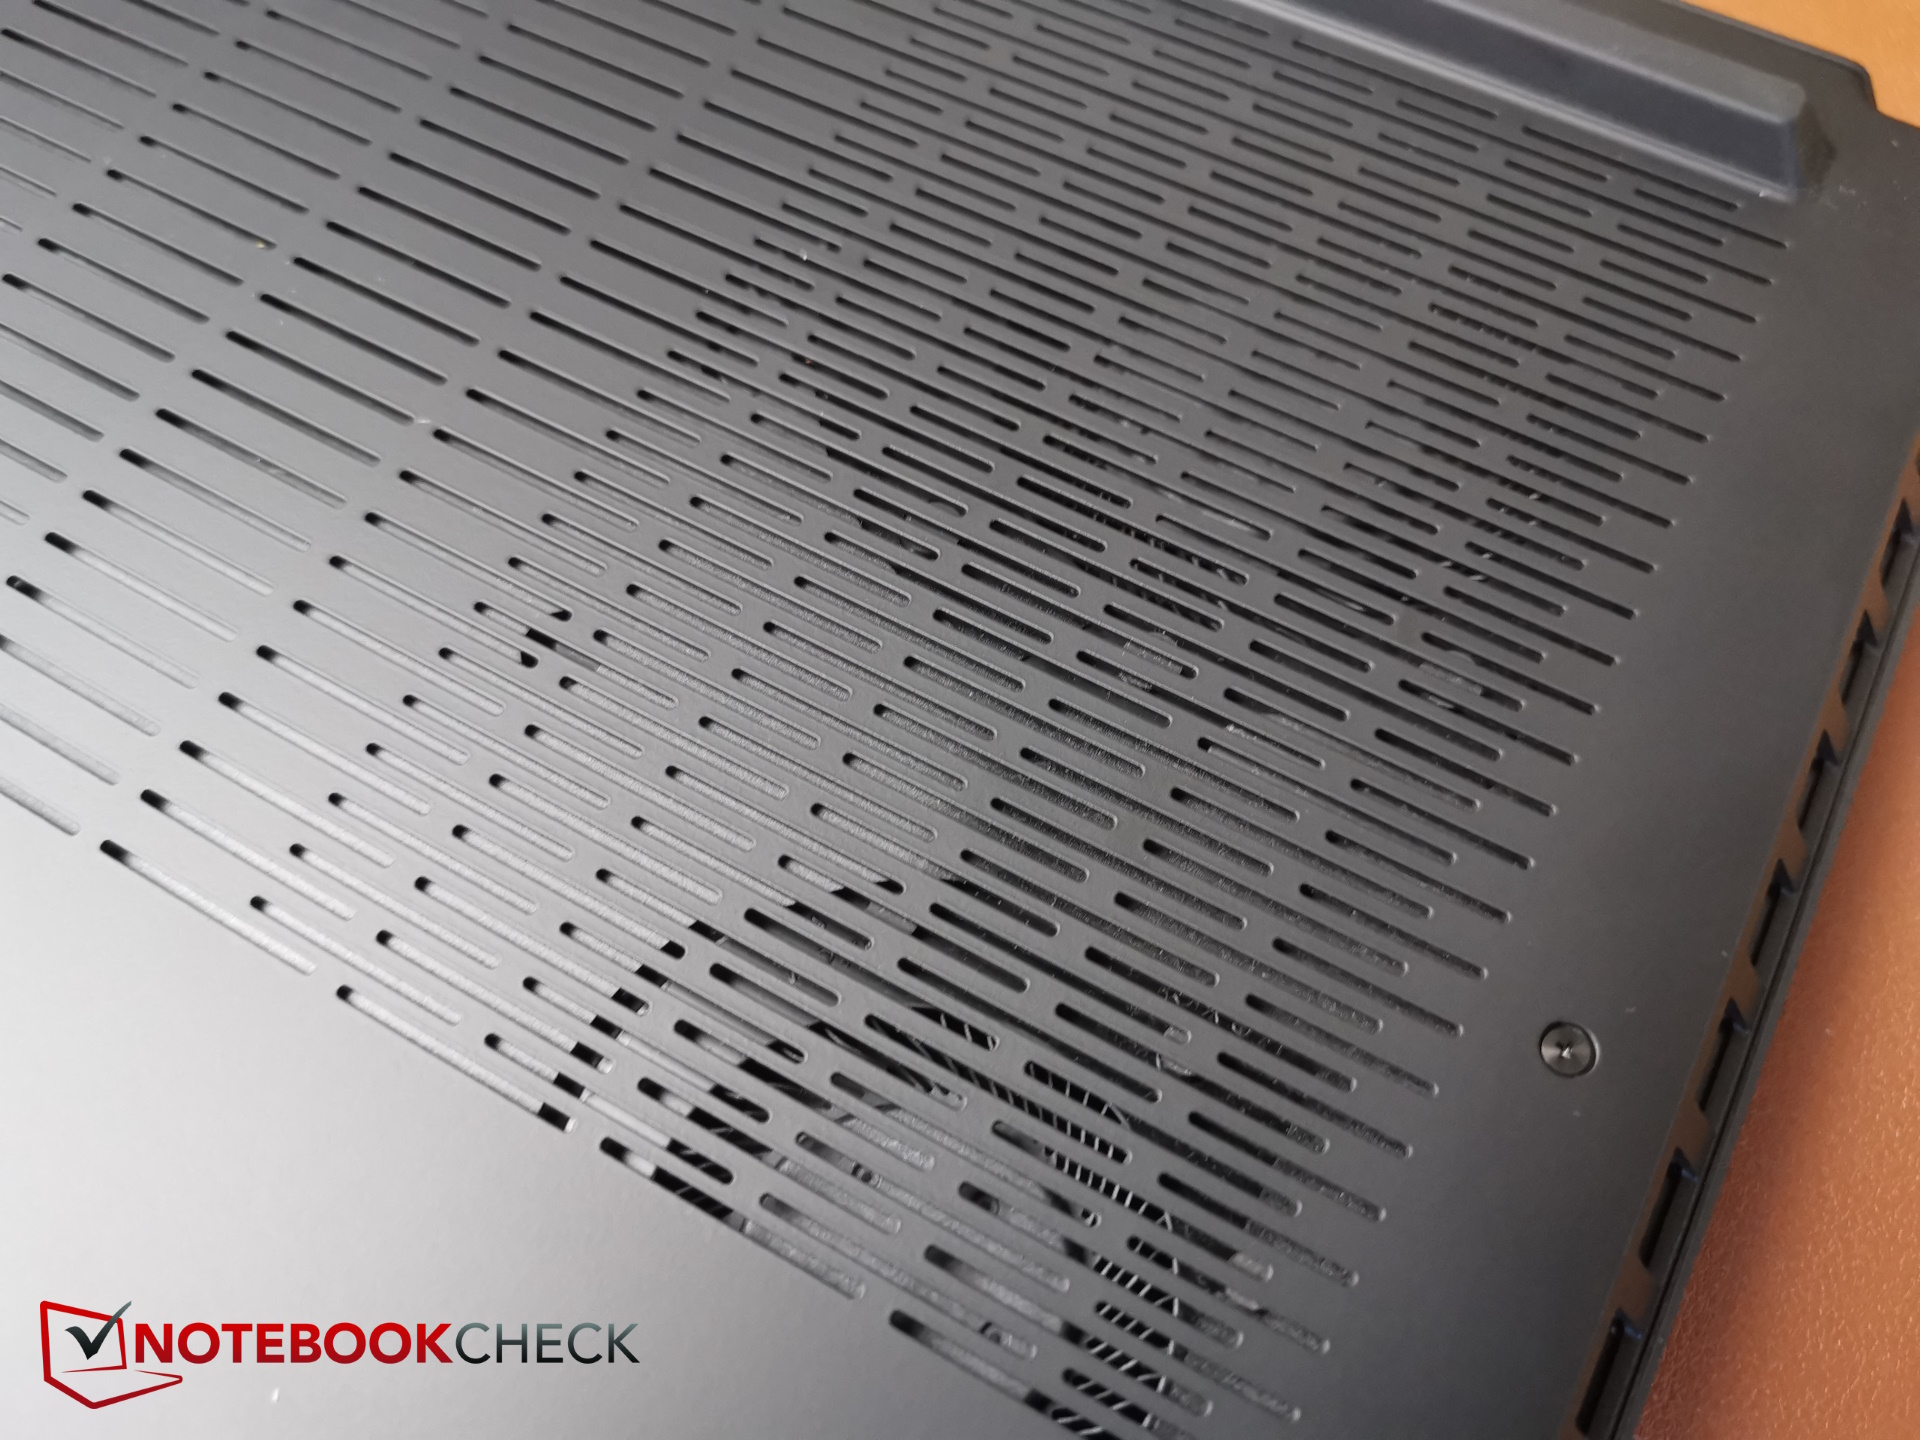
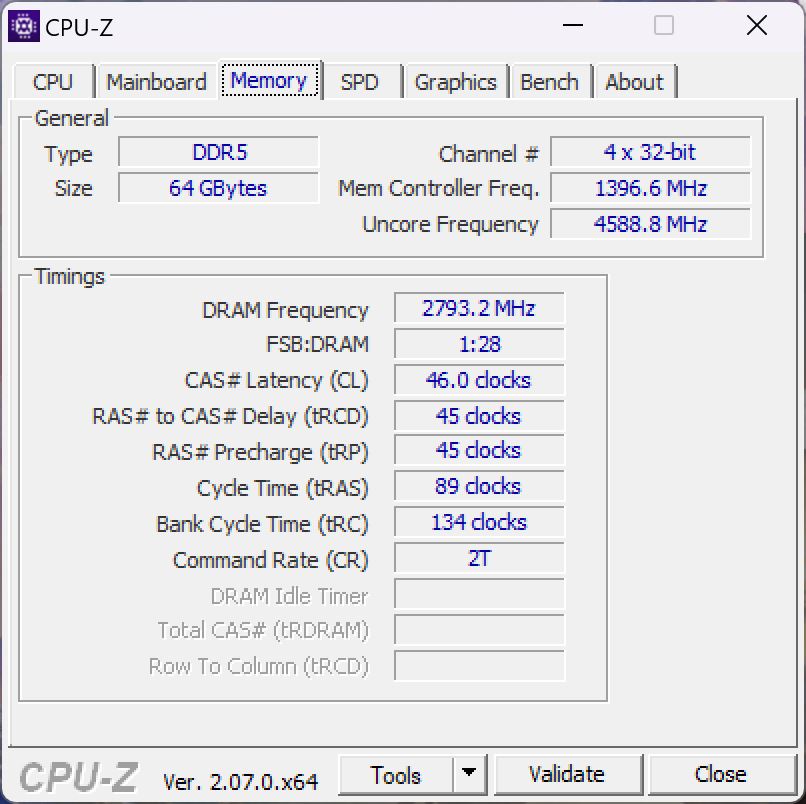
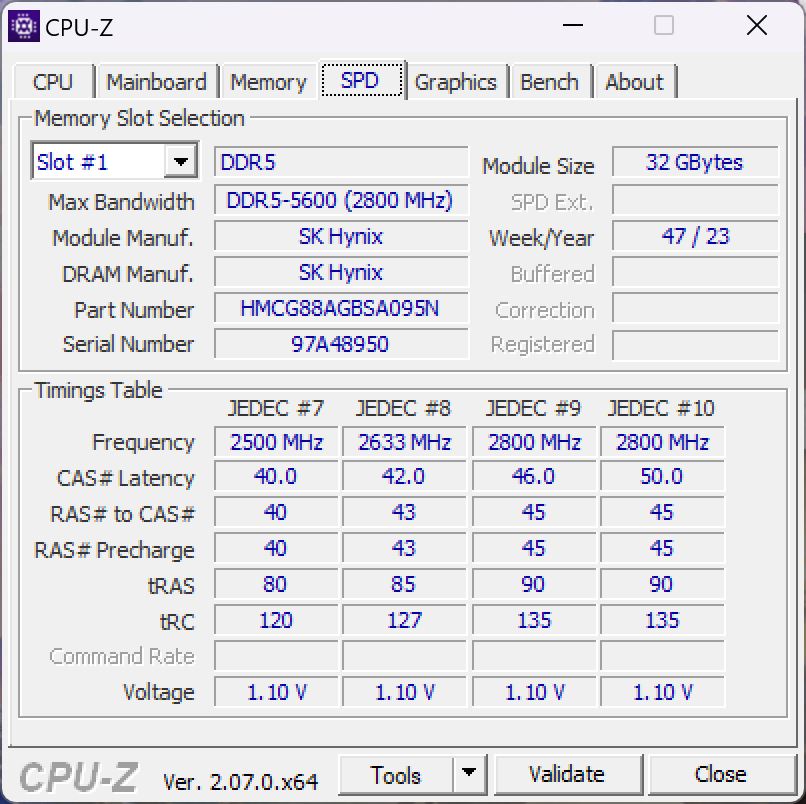
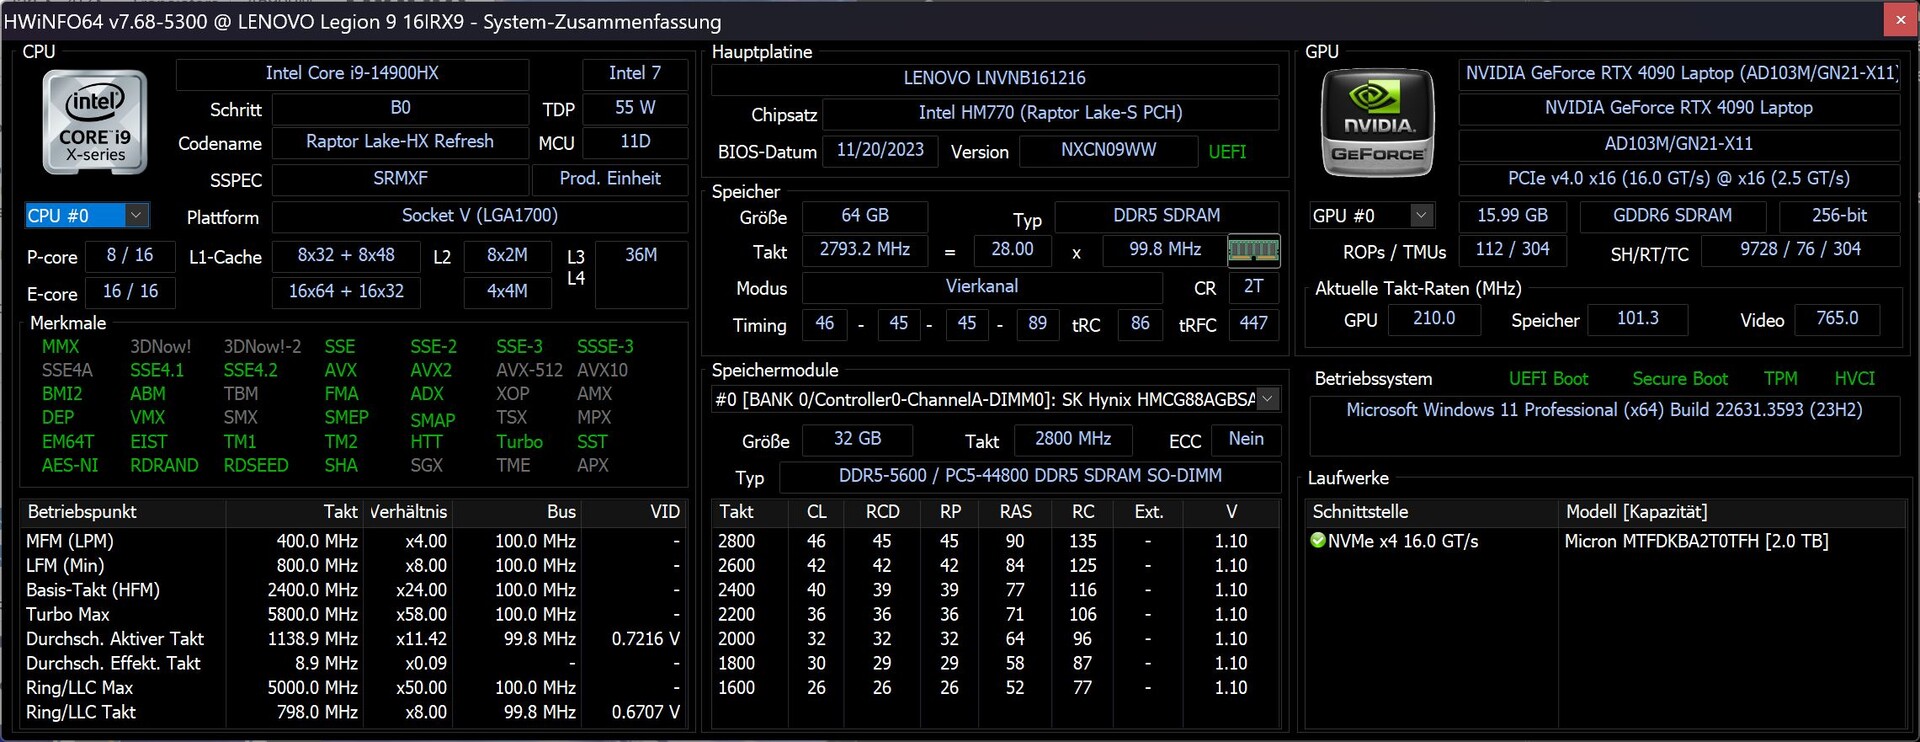
新的 i9-14900HX与强大的 RTX 4090和 64 GB 内存,显然使Legion 9i 成为一款高端游戏机。这也可以从其背面突出的设计看出,这就是为什么尽管该设备具有潜在的高性能,但创作者可能会寻找更精巧的替代品。
测试条件
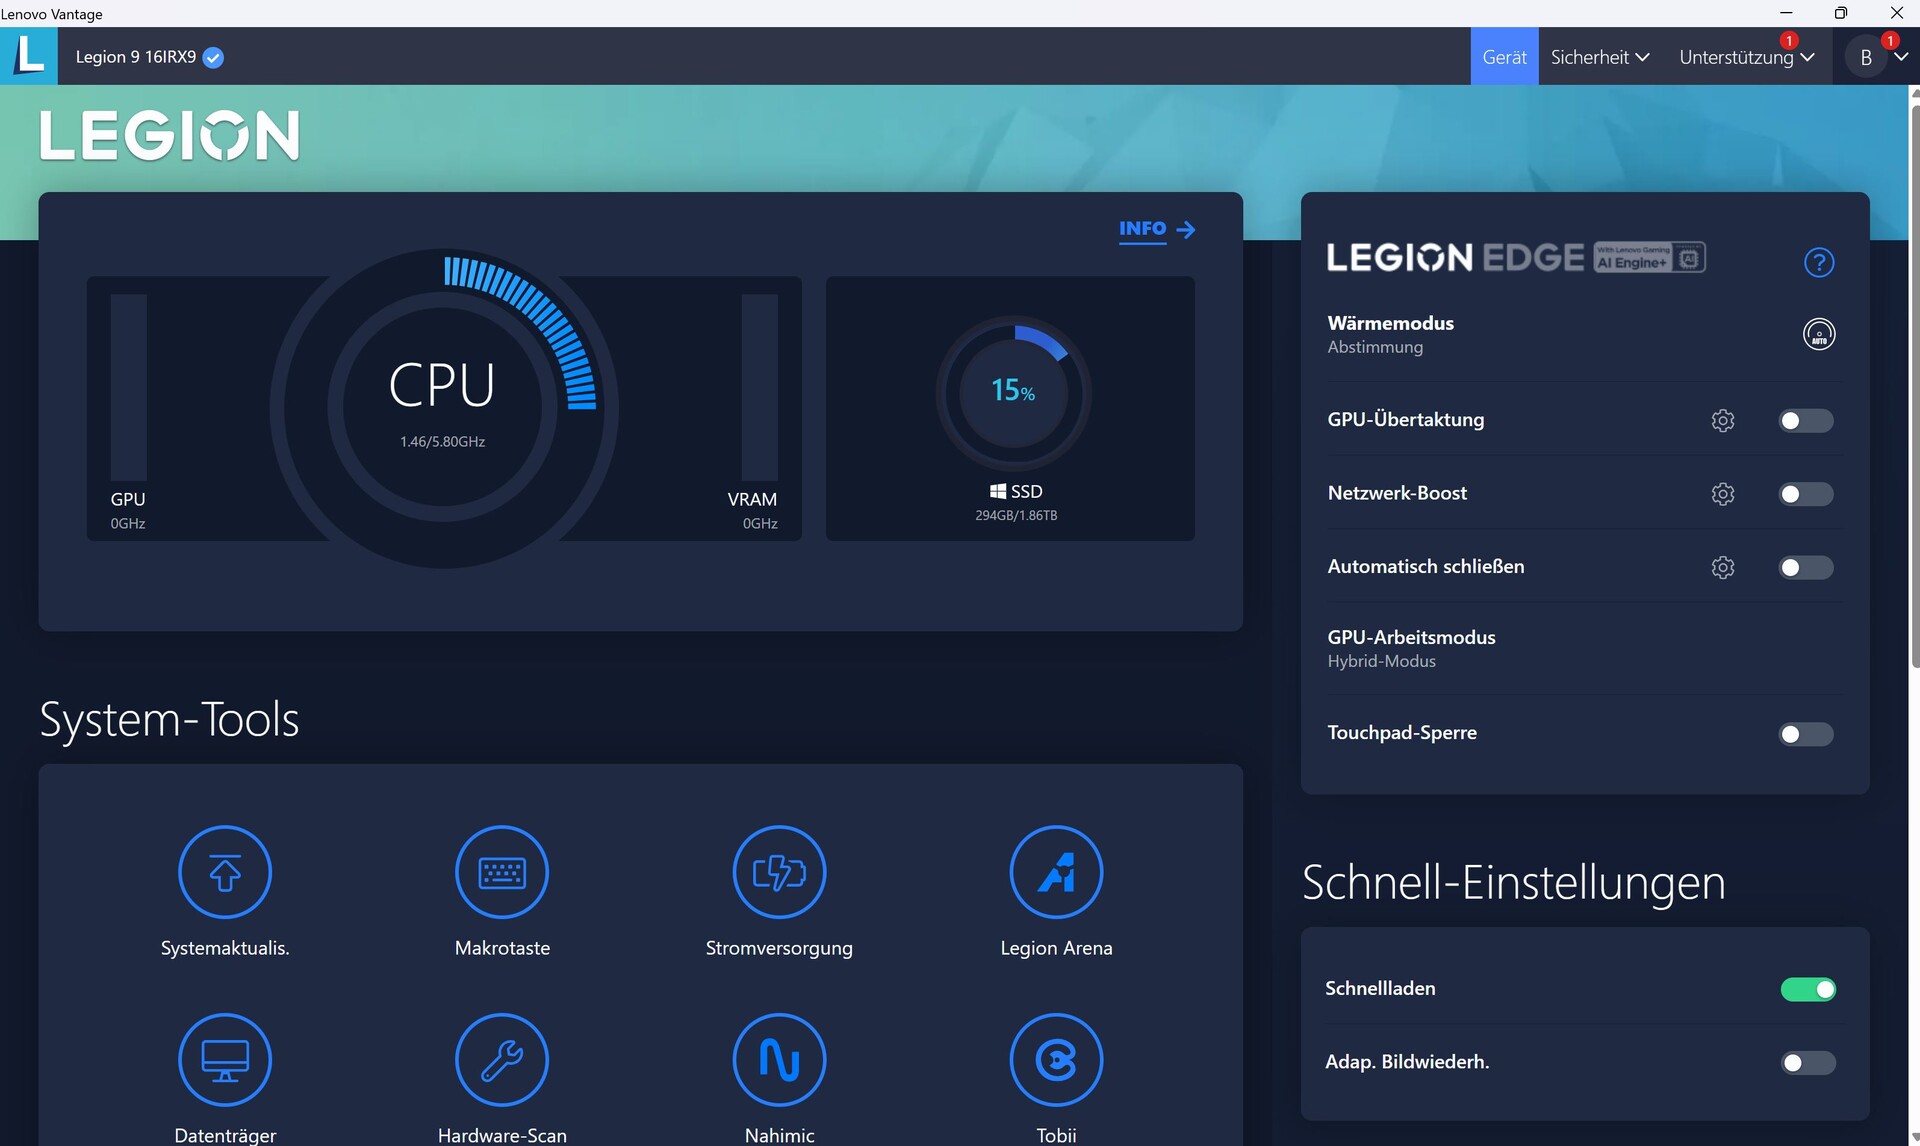
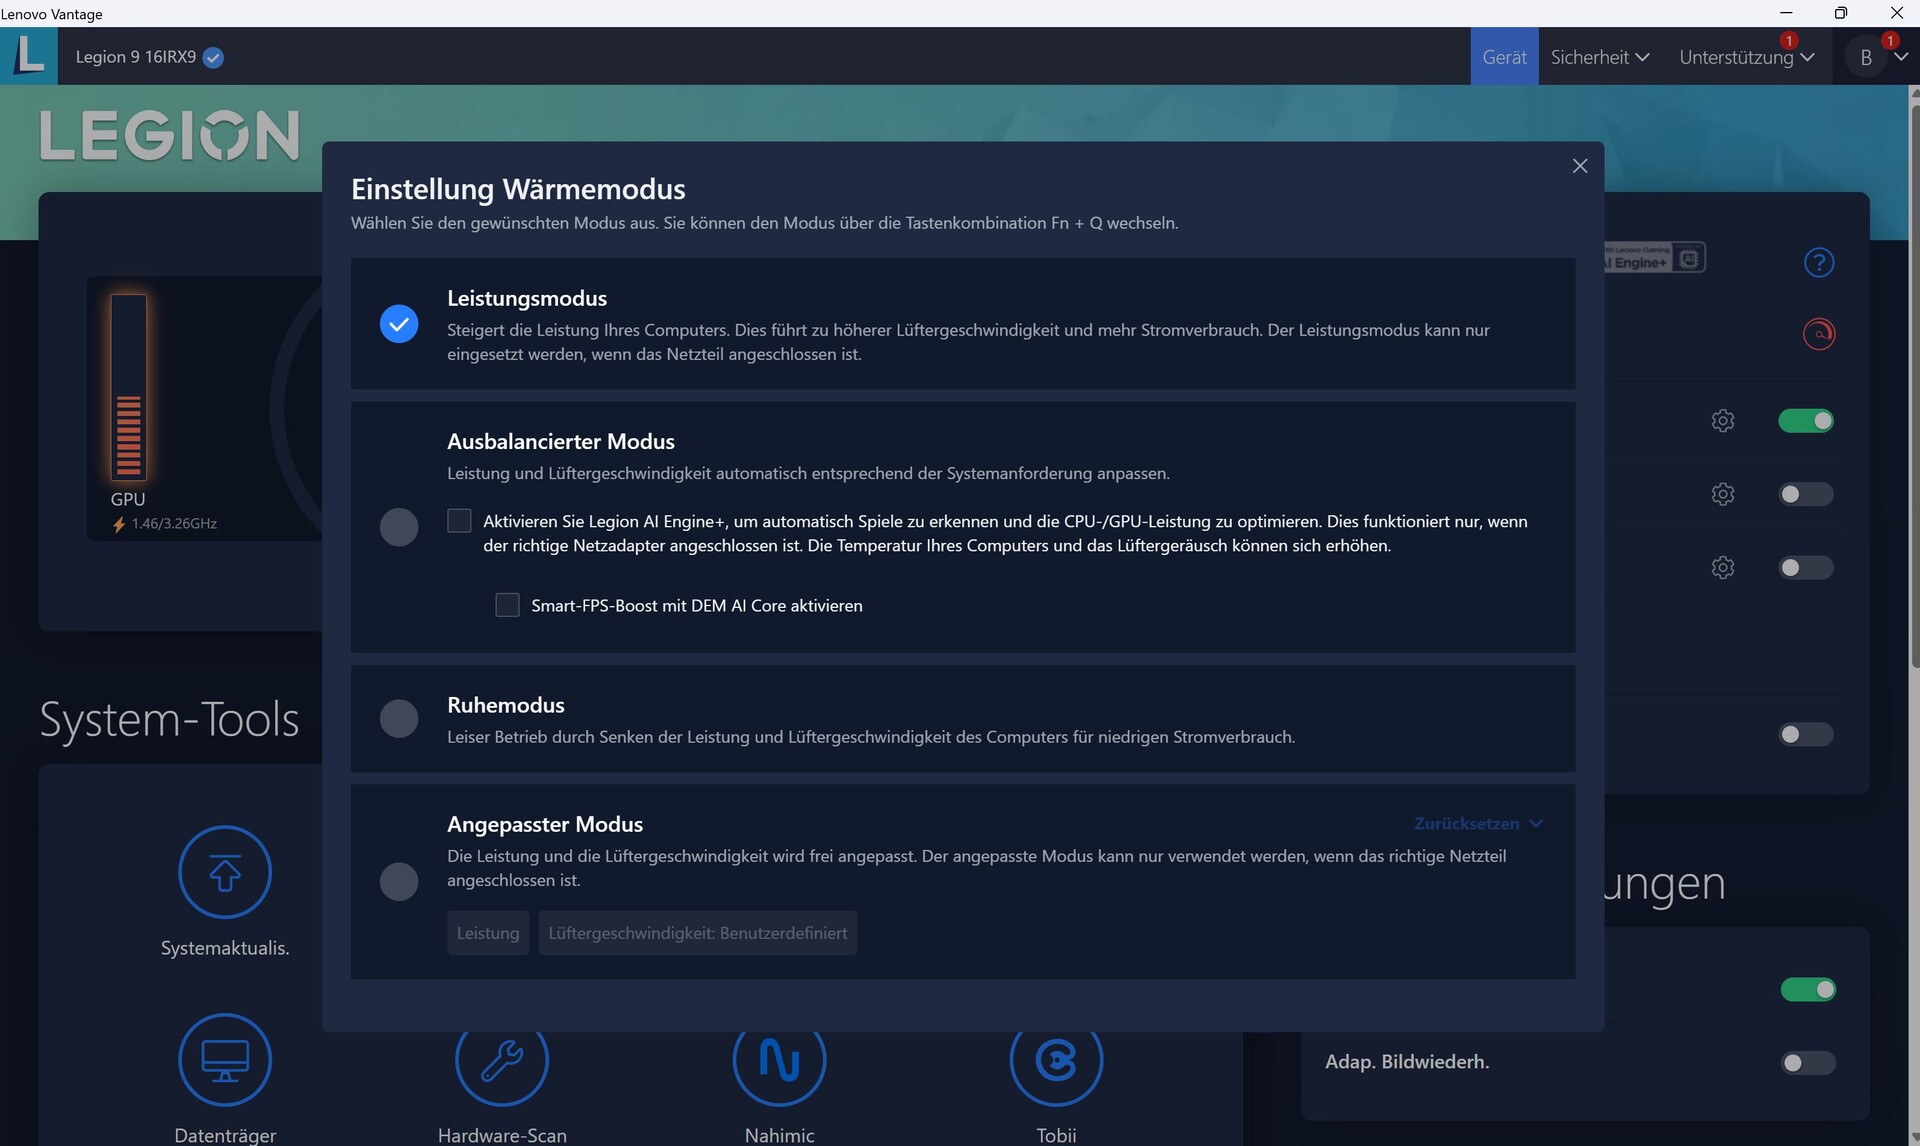
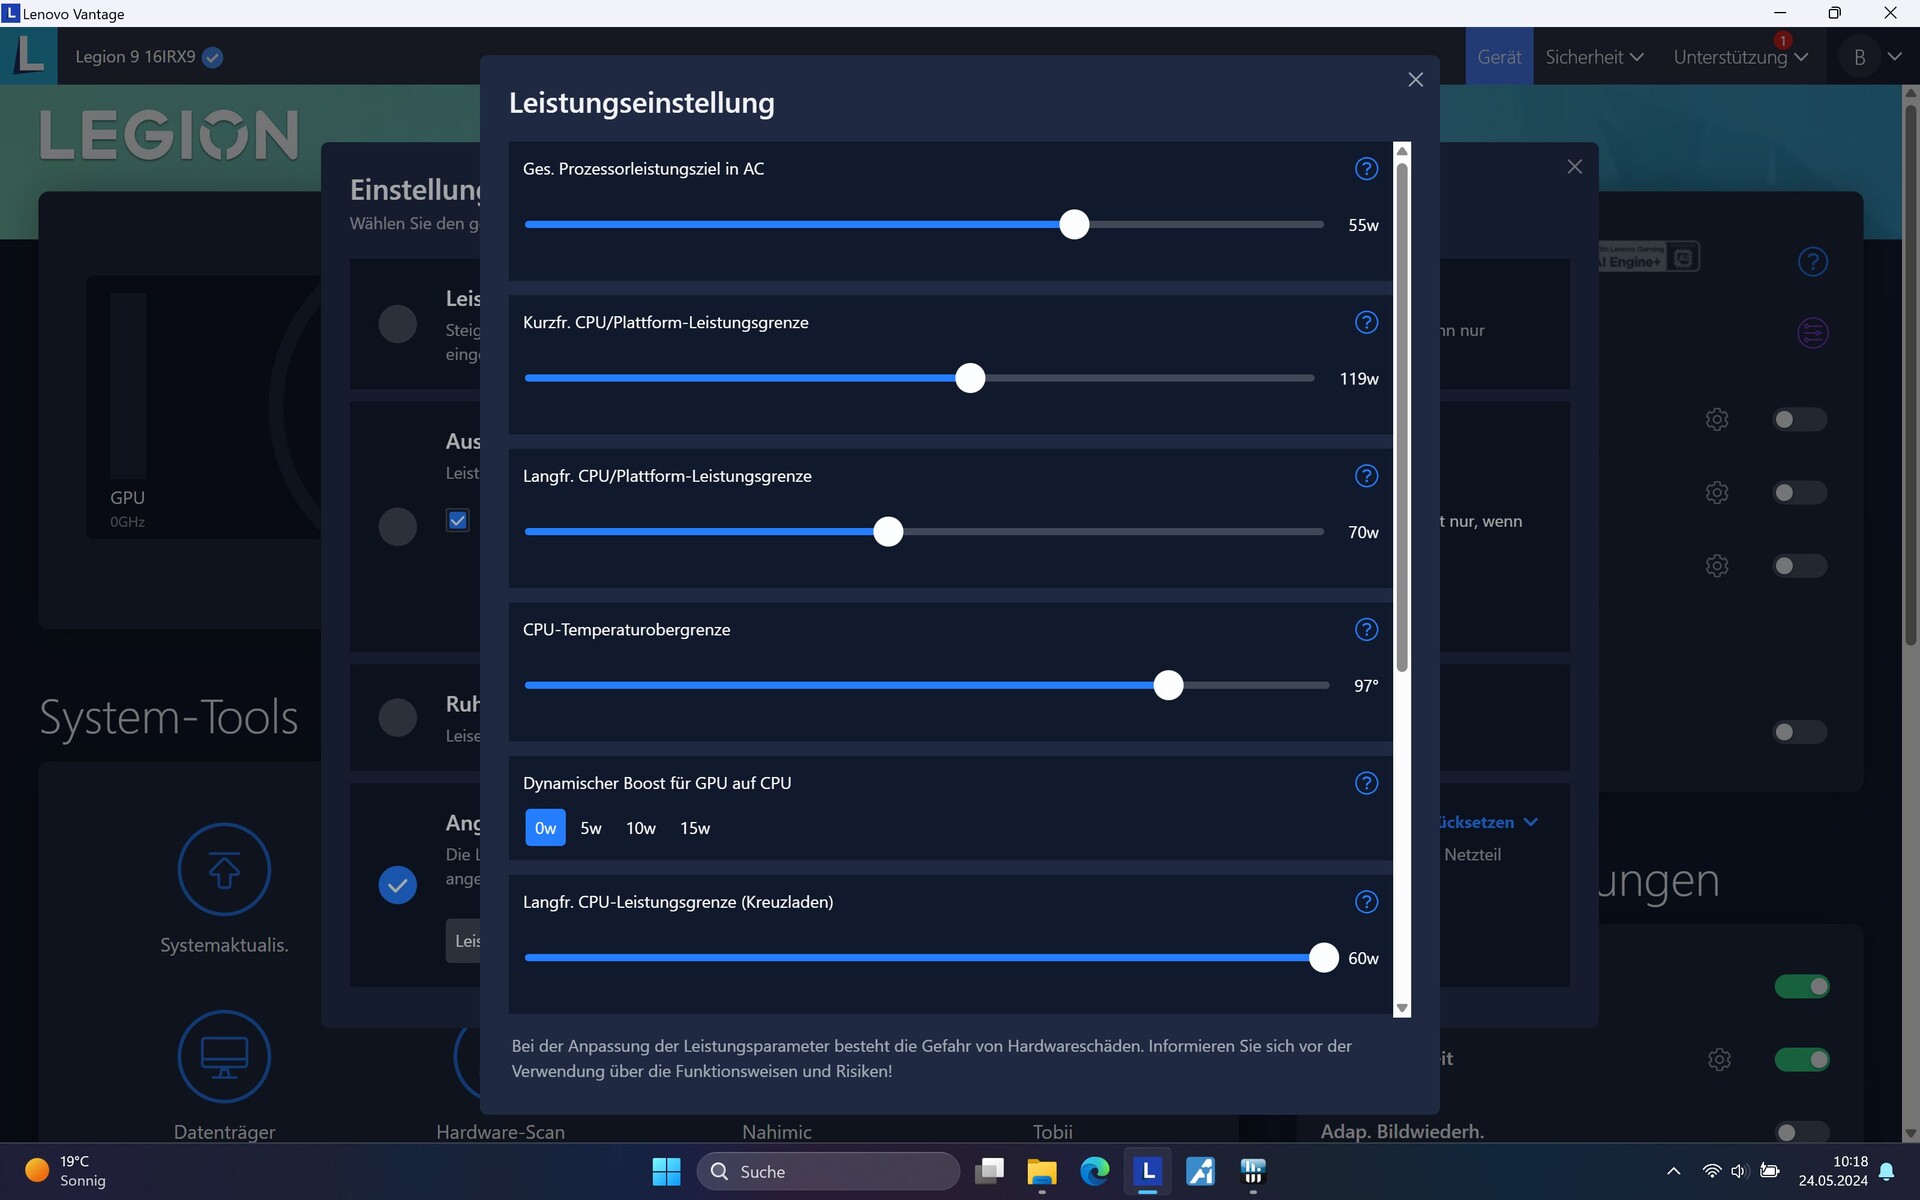
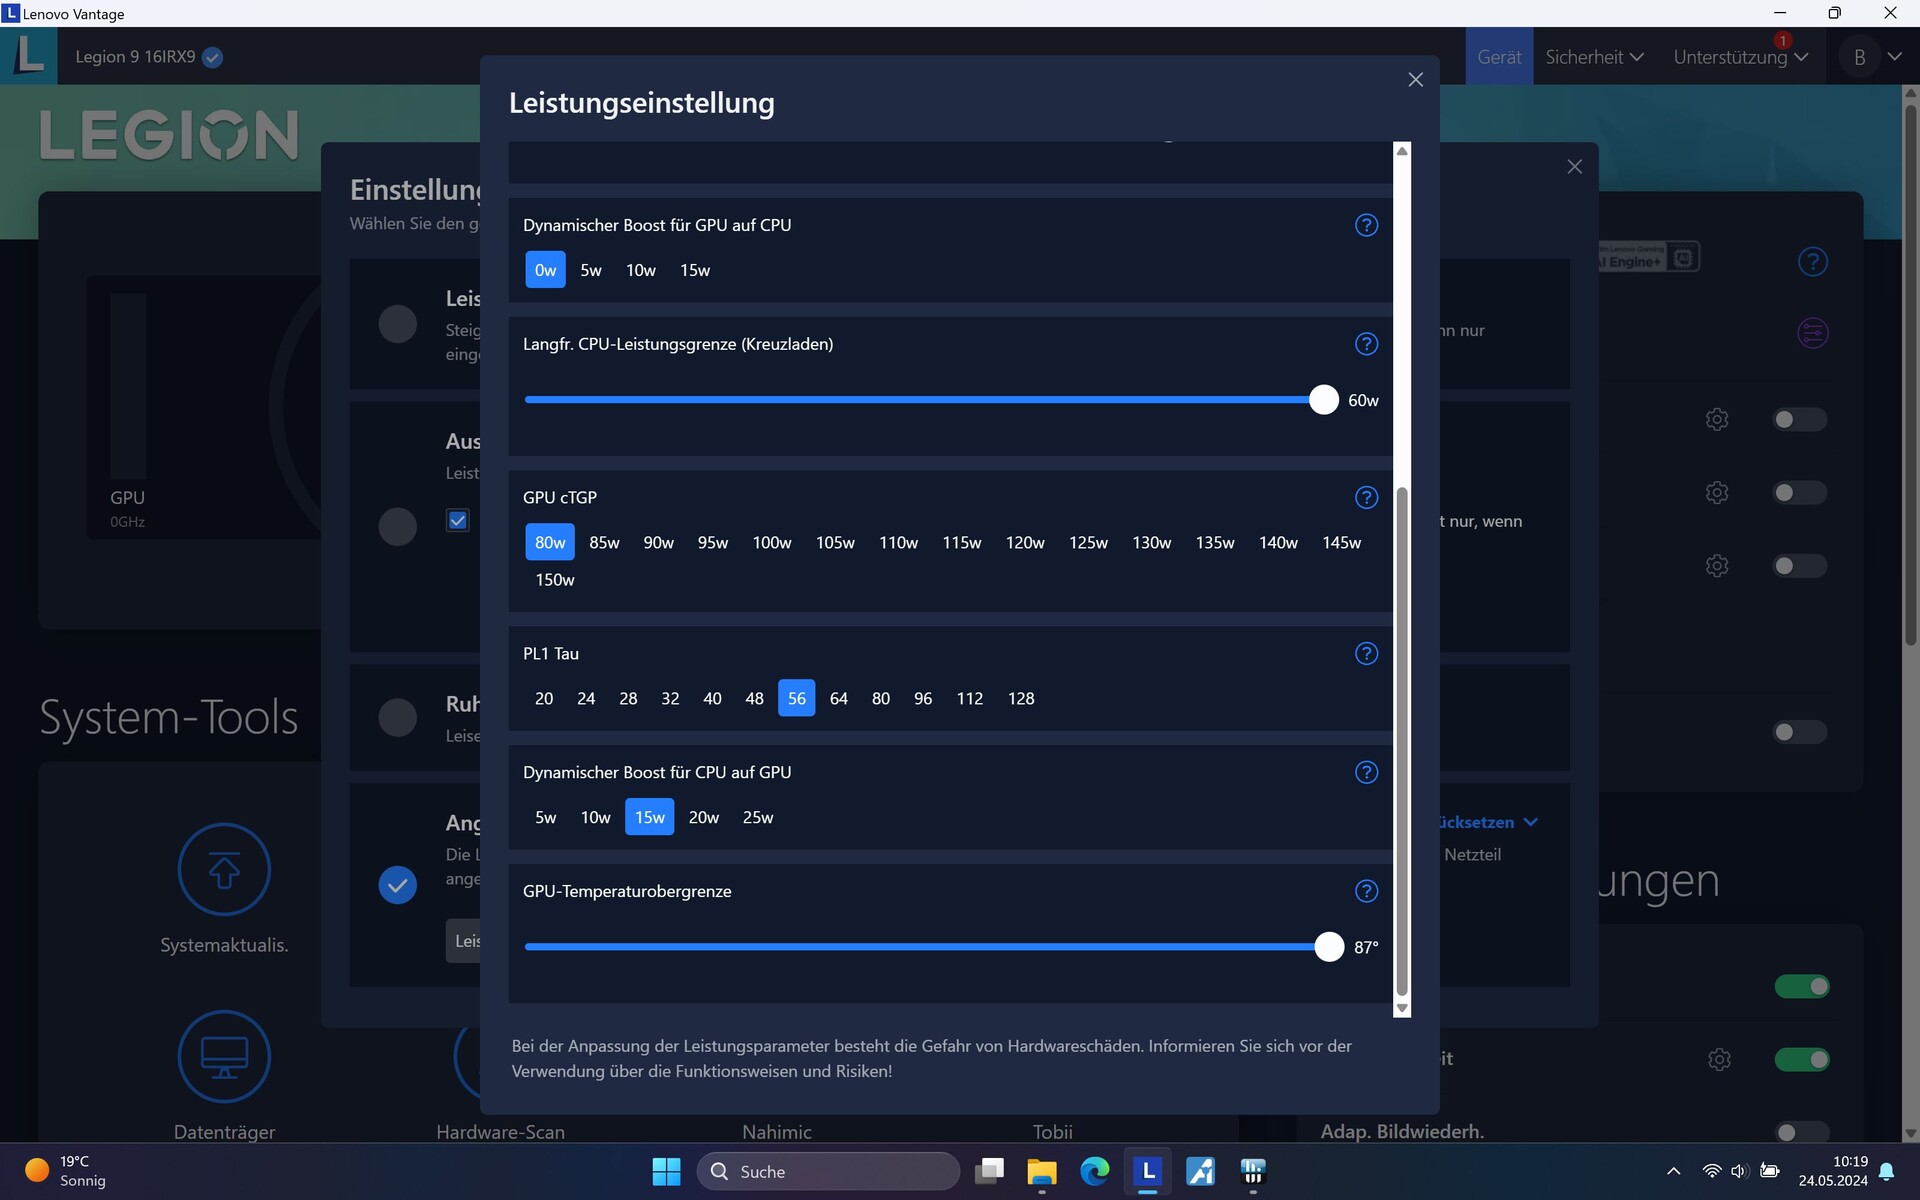
联想 Vantage 是Legion 9 控制中心的名称,其中包括性能配置文件 "Performance"(性能)、" Balanced"(平衡)(这里还可以选择 AI 进行优化)和 "Quiet"(安静)。此外还有自定义模式,允许你手动设置各种参数。
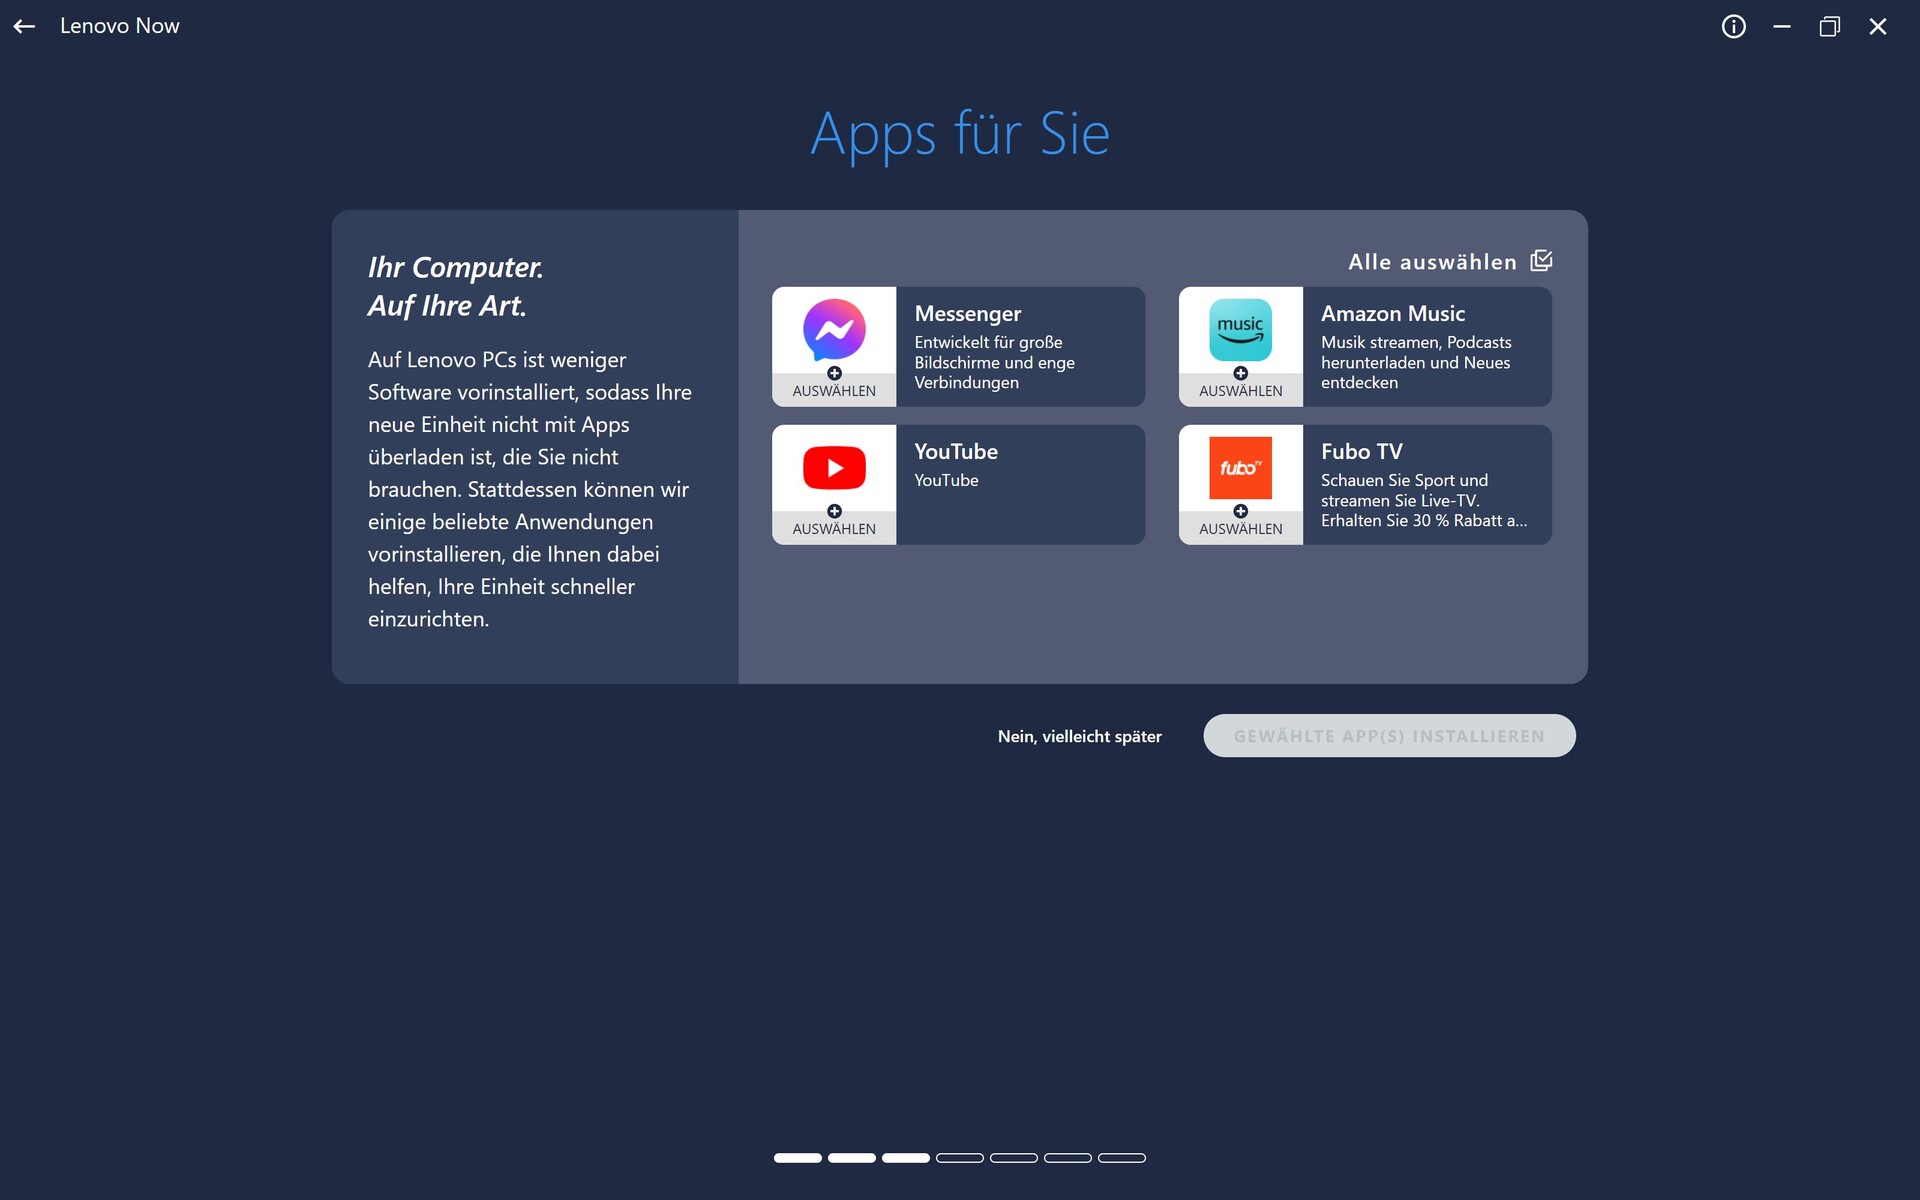
遗憾的是,Vantage 有时会出现广告,例如亚马逊音乐、YouTube 应用程序等的广告,这让我们很烦恼。这是因为 Vantage 默认激活了营销信息,要想不被它们打扰,首先必须关闭它们。
我们选择了 "性能 "模式进行基准测试,但关闭了 GPU 超频开关。

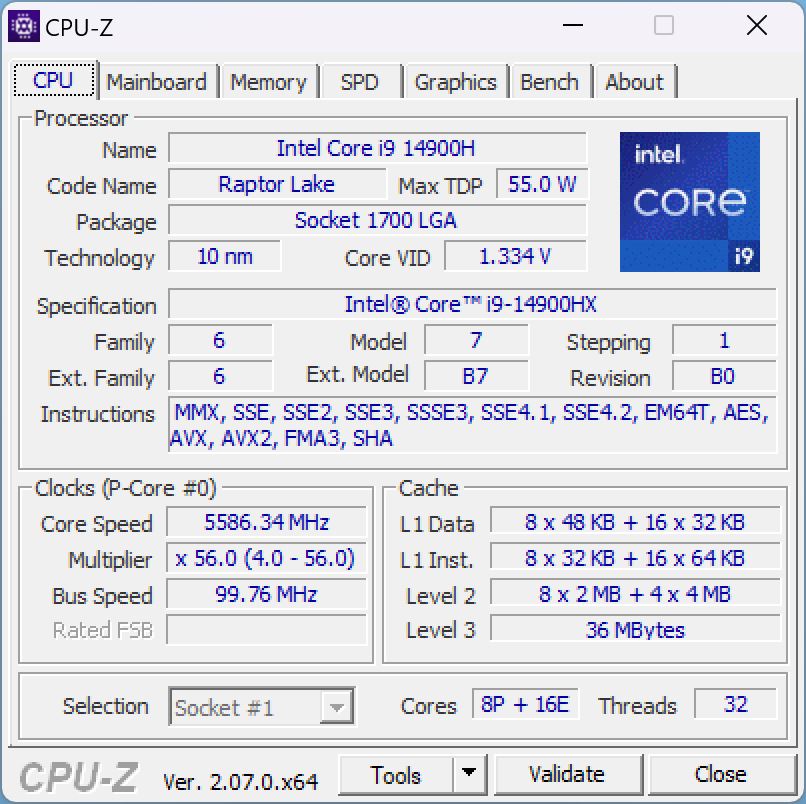
处理器
i9-14900HX i9-14900HX是英特尔最新 Raptor Lake Refresh 系列中的高端 CPU。其 8 个 P 核心的主频高达 5.8 GHz,16 个 E 核心的基本主频为 1.6 GHz。它们总共可以处理 32 个线程。
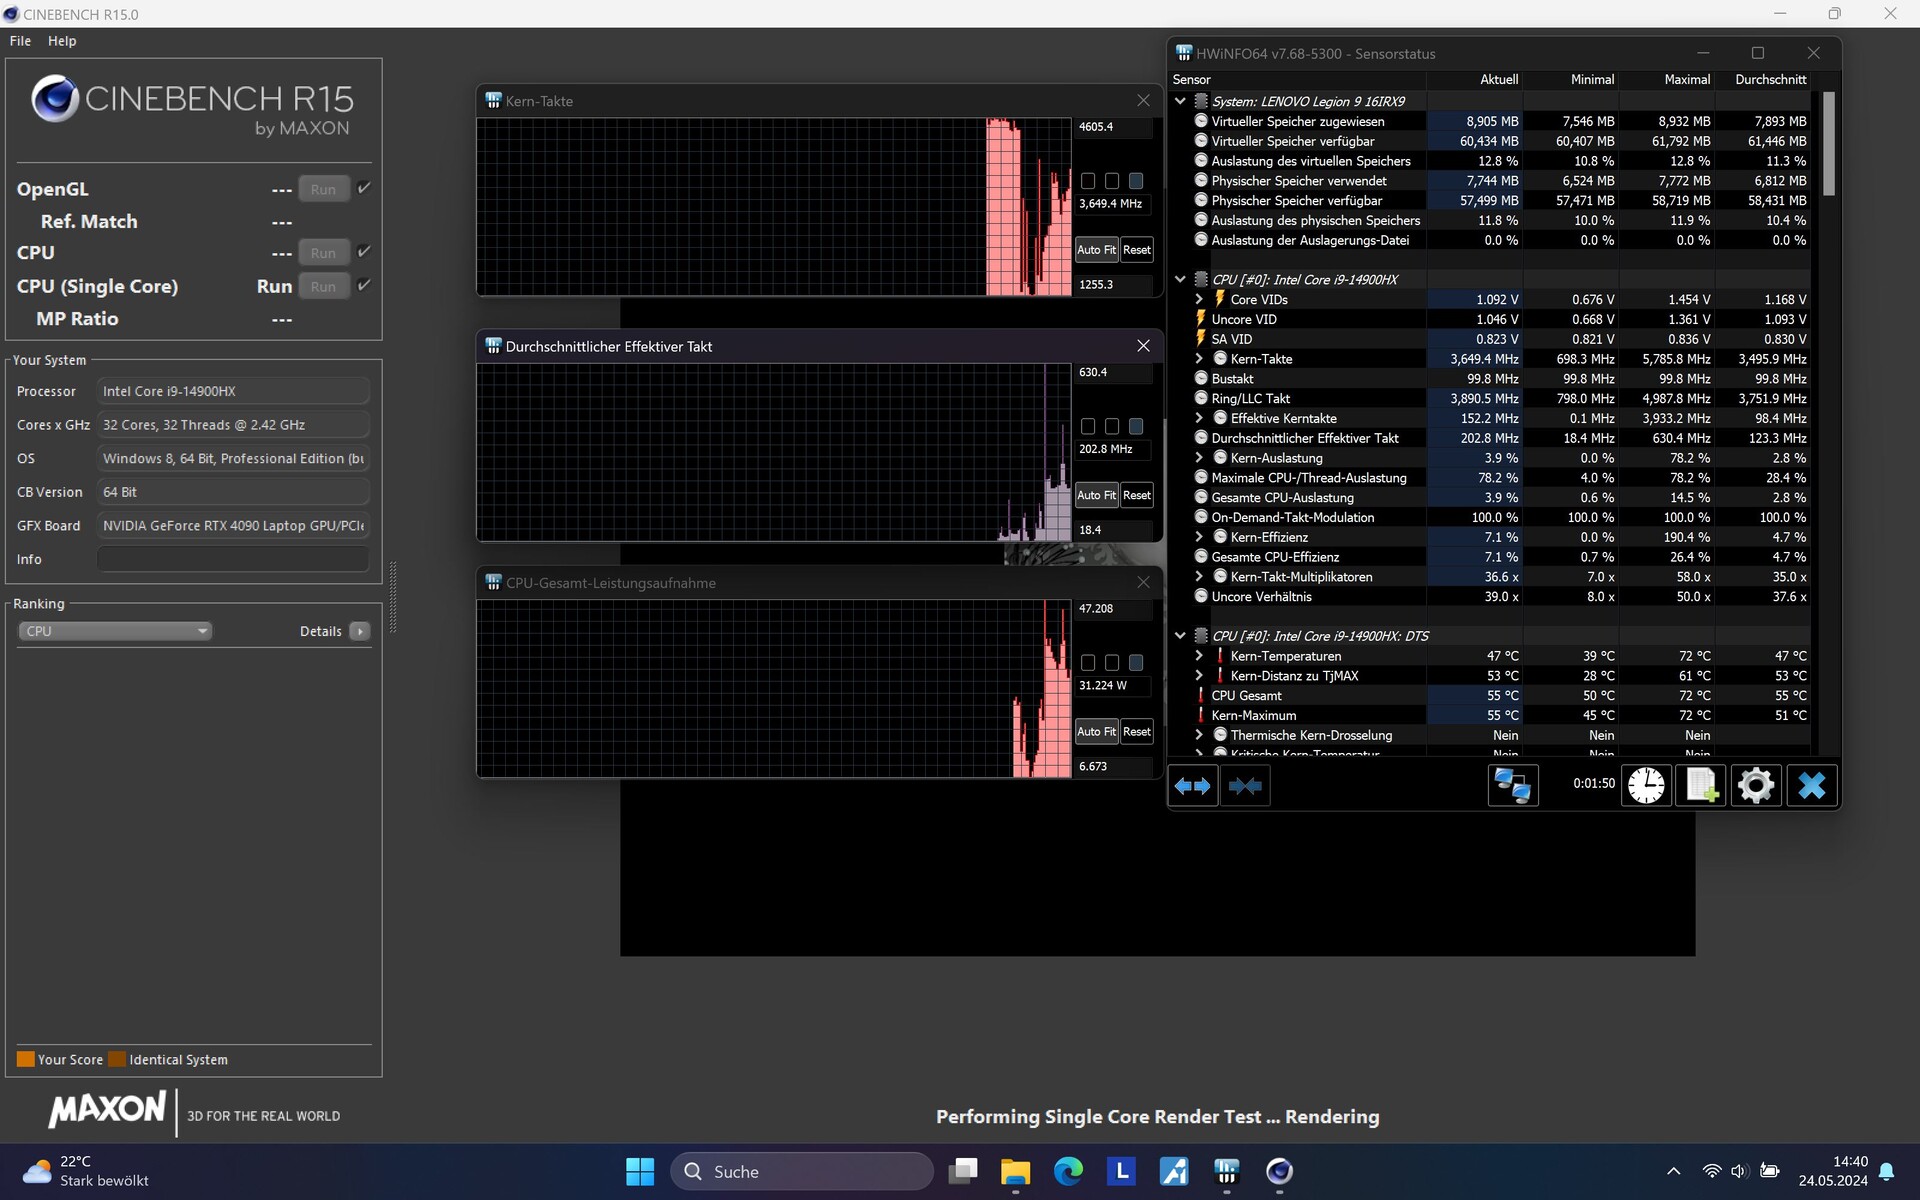
在 Cinebench R15 循环测试中,我们的Legion 9i 初始性能最高,但与采用相同 CPU 的竞争对手不同,它的性能随着时间的推移持续下降,半小时后下降了约 7.5%。之后,其性能仅略高于使用i9-13980HX 的前代产品。即便如此,Legion 9 的 CPU 仍然是同类产品中速度最快的 CPU 之一,尽管与前代产品相比,其性能提升幅度偏低。
虽然
Legion 9i 的多线程性能毋庸置疑,但在所有 CPU 基准测试中,其单核性能明显下降。这种情况是可以重现的--显然,在性能模式下,它的单核性能储备并没有耗尽,因此必须使用自定义模式手动提高关键数据。因此,我们查看了关键数据:在 Cinebench R15 单核心模式下,核心时钟频率最初为 4.6GHz。大约 50 秒后,核心频率短暂降至 1.2 GHz,然后稳定在 3 至 3.5 GHz 之间。TDP 约为 30 瓦。在另一项测试中,频率下降的情况则不那么明显。
拔下电源插头后,它在 Cinebench R15 中的多线程性能降低了约 48.5%,即与使用连接电源的笔记本电脑相比几乎降低了一半!
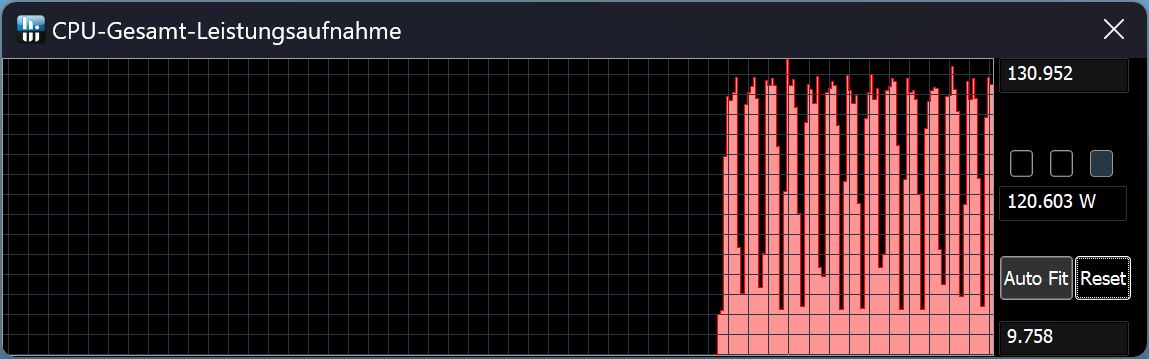
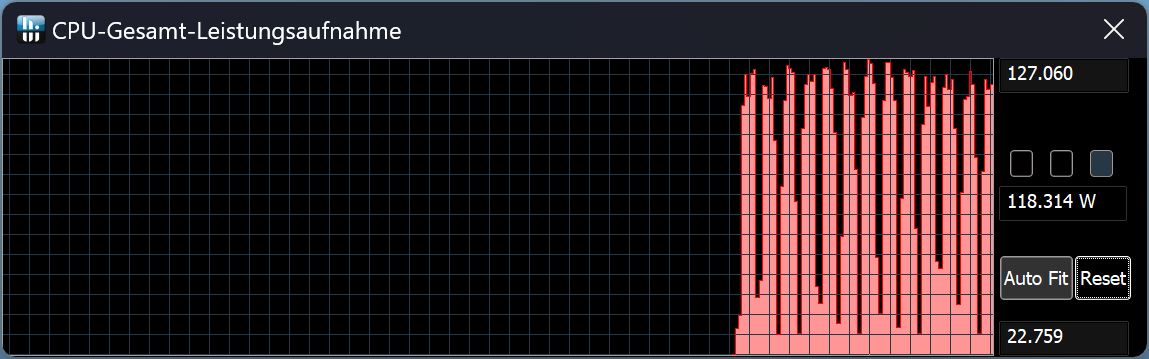
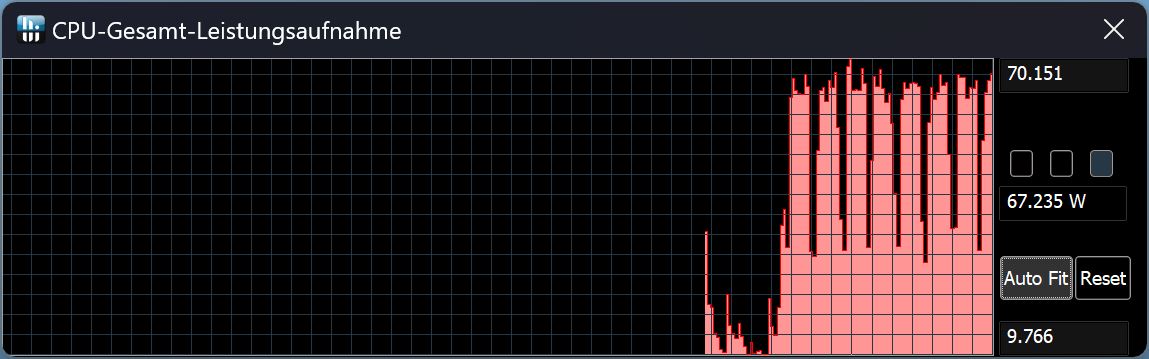
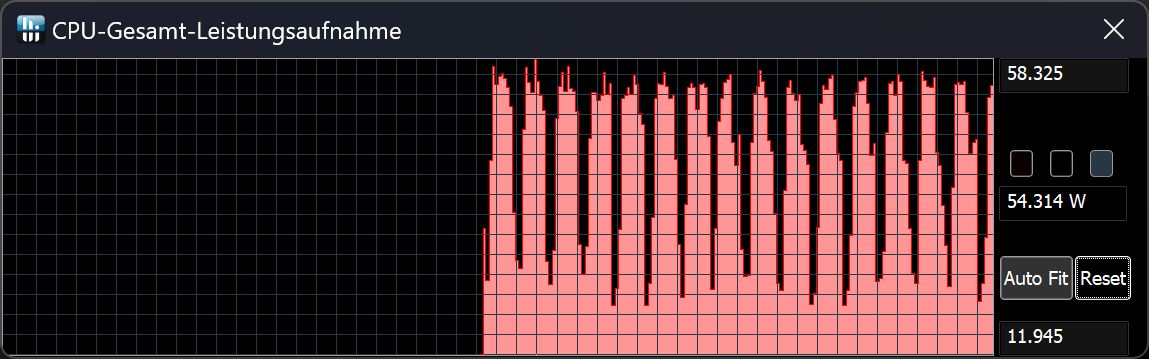
| 性能配置文件/测量值 | Cinebench-15-Score 第 1 次运行 | CPU 功耗(单位:瓦 |
|---|---|---|
| 无 CPU 超频情况下的性能 | 4,879 | 140 - 180 |
| 带 AI 的均衡性能 | 4,115 | 120 - 130 |
| 不带 AI 的均衡性能 | 4,091 | 115 - 127 |
| 静音 | 2,938 | 65 - 70 |
| 电池 | 2,516 | 40 - 58 |
Cinebench R15 Multi continuous test
Cinebench R23: Multi Core | Single Core
Cinebench R20: CPU (Multi Core) | CPU (Single Core)
Cinebench R15: CPU Multi 64Bit | CPU Single 64Bit
Blender: v2.79 BMW27 CPU
7-Zip 18.03: 7z b 4 | 7z b 4 -mmt1
Geekbench 6.4: Multi-Core | Single-Core
Geekbench 5.5: Multi-Core | Single-Core
HWBOT x265 Benchmark v2.2: 4k Preset
LibreOffice : 20 Documents To PDF
R Benchmark 2.5: Overall mean
| CPU Performance Rating | |
| Alienware m18 R2 | |
| Lenovo Legion 9 16IRX8 | |
| Razer Blade 16 2024, RTX 4090 | |
| Asus ROG Strix Scar 18 G834JYR (2024) | |
| Average Intel Core i9-14900HX | |
| Lenovo Legion 9 16IRX9, RTX 4090 | |
| Medion Erazer Beast X40 2024 | |
| Average of class Gaming | |
| Cinebench R23 / Multi Core | |
| Lenovo Legion 9 16IRX9, RTX 4090 | |
| Alienware m18 R2 | |
| Lenovo Legion 9 16IRX8 | |
| Razer Blade 16 2024, RTX 4090 | |
| Average Intel Core i9-14900HX (17078 - 36249, n=37) | |
| Asus ROG Strix Scar 18 G834JYR (2024) | |
| Medion Erazer Beast X40 2024 | |
| Average of class Gaming (5668 - 39652, n=155, last 2 years) | |
| Cinebench R23 / Single Core | |
| Alienware m18 R2 | |
| Medion Erazer Beast X40 2024 | |
| Asus ROG Strix Scar 18 G834JYR (2024) | |
| Average Intel Core i9-14900HX (1720 - 2245, n=37) | |
| Lenovo Legion 9 16IRX8 | |
| Razer Blade 16 2024, RTX 4090 | |
| Average of class Gaming (1136 - 2252, n=155, last 2 years) | |
| Lenovo Legion 9 16IRX9, RTX 4090 | |
| Cinebench R20 / CPU (Multi Core) | |
| Lenovo Legion 9 16IRX9, RTX 4090 | |
| Alienware m18 R2 | |
| Lenovo Legion 9 16IRX8 | |
| Average Intel Core i9-14900HX (6579 - 13832, n=37) | |
| Razer Blade 16 2024, RTX 4090 | |
| Asus ROG Strix Scar 18 G834JYR (2024) | |
| Medion Erazer Beast X40 2024 | |
| Average of class Gaming (2179 - 15517, n=155, last 2 years) | |
| Cinebench R20 / CPU (Single Core) | |
| Medion Erazer Beast X40 2024 | |
| Alienware m18 R2 | |
| Asus ROG Strix Scar 18 G834JYR (2024) | |
| Average Intel Core i9-14900HX (657 - 859, n=37) | |
| Razer Blade 16 2024, RTX 4090 | |
| Average of class Gaming (439 - 866, n=155, last 2 years) | |
| Lenovo Legion 9 16IRX8 | |
| Lenovo Legion 9 16IRX9, RTX 4090 | |
| Cinebench R15 / CPU Multi 64Bit | |
| Lenovo Legion 9 16IRX9, RTX 4090 | |
| Alienware m18 R2 | |
| Lenovo Legion 9 16IRX8 | |
| Razer Blade 16 2024, RTX 4090 | |
| Average Intel Core i9-14900HX (3263 - 5589, n=38) | |
| Asus ROG Strix Scar 18 G834JYR (2024) | |
| Average of class Gaming (905 - 6074, n=158, last 2 years) | |
| Medion Erazer Beast X40 2024 | |
| Cinebench R15 / CPU Single 64Bit | |
| Alienware m18 R2 | |
| Medion Erazer Beast X40 2024 | |
| Razer Blade 16 2024, RTX 4090 | |
| Average Intel Core i9-14900HX (247 - 323, n=37) | |
| Lenovo Legion 9 16IRX8 | |
| Asus ROG Strix Scar 18 G834JYR (2024) | |
| Average of class Gaming (191.9 - 343, n=155, last 2 years) | |
| Lenovo Legion 9 16IRX9, RTX 4090 | |
| Blender / v2.79 BMW27 CPU | |
| Average of class Gaming (81 - 555, n=148, last 2 years) | |
| Medion Erazer Beast X40 2024 | |
| Average Intel Core i9-14900HX (91 - 206, n=37) | |
| Asus ROG Strix Scar 18 G834JYR (2024) | |
| Razer Blade 16 2024, RTX 4090 | |
| Lenovo Legion 9 16IRX9, RTX 4090 | |
| Lenovo Legion 9 16IRX8 | |
| Alienware m18 R2 | |
| 7-Zip 18.03 / 7z b 4 | |
| Lenovo Legion 9 16IRX9, RTX 4090 | |
| Alienware m18 R2 | |
| Lenovo Legion 9 16IRX8 | |
| Razer Blade 16 2024, RTX 4090 | |
| Asus ROG Strix Scar 18 G834JYR (2024) | |
| Average Intel Core i9-14900HX (66769 - 136645, n=37) | |
| Medion Erazer Beast X40 2024 | |
| Average of class Gaming (23795 - 144064, n=153, last 2 years) | |
| 7-Zip 18.03 / 7z b 4 -mmt1 | |
| Medion Erazer Beast X40 2024 | |
| Asus ROG Strix Scar 18 G834JYR (2024) | |
| Alienware m18 R2 | |
| Average Intel Core i9-14900HX (5452 - 7545, n=37) | |
| Razer Blade 16 2024, RTX 4090 | |
| Lenovo Legion 9 16IRX8 | |
| Average of class Gaming (4199 - 7573, n=153, last 2 years) | |
| Lenovo Legion 9 16IRX9, RTX 4090 | |
| Geekbench 6.4 / Multi-Core | |
| Alienware m18 R2 | |
| Asus ROG Strix Scar 18 G834JYR (2024) | |
| Razer Blade 16 2024, RTX 4090 | |
| Lenovo Legion 9 16IRX9, RTX 4090 | |
| Lenovo Legion 9 16IRX8 | |
| Average Intel Core i9-14900HX (13158 - 19665, n=37) | |
| Medion Erazer Beast X40 2024 | |
| Average of class Gaming (5340 - 21668, n=124, last 2 years) | |
| Geekbench 6.4 / Single-Core | |
| Medion Erazer Beast X40 2024 | |
| Alienware m18 R2 | |
| Asus ROG Strix Scar 18 G834JYR (2024) | |
| Average Intel Core i9-14900HX (2419 - 3129, n=37) | |
| Razer Blade 16 2024, RTX 4090 | |
| Lenovo Legion 9 16IRX8 | |
| Average of class Gaming (1490 - 3219, n=124, last 2 years) | |
| Lenovo Legion 9 16IRX9, RTX 4090 | |
| Geekbench 5.5 / Multi-Core | |
| Lenovo Legion 9 16IRX9, RTX 4090 | |
| Alienware m18 R2 | |
| Lenovo Legion 9 16IRX8 | |
| Asus ROG Strix Scar 18 G834JYR (2024) | |
| Average Intel Core i9-14900HX (8618 - 23194, n=37) | |
| Razer Blade 16 2024, RTX 4090 | |
| Medion Erazer Beast X40 2024 | |
| Average of class Gaming (4557 - 25855, n=152, last 2 years) | |
| Geekbench 5.5 / Single-Core | |
| Alienware m18 R2 | |
| Medion Erazer Beast X40 2024 | |
| Lenovo Legion 9 16IRX8 | |
| Razer Blade 16 2024, RTX 4090 | |
| Asus ROG Strix Scar 18 G834JYR (2024) | |
| Average Intel Core i9-14900HX (1669 - 2210, n=37) | |
| Average of class Gaming (986 - 2423, n=152, last 2 years) | |
| Lenovo Legion 9 16IRX9, RTX 4090 | |
| HWBOT x265 Benchmark v2.2 / 4k Preset | |
| Alienware m18 R2 | |
| Lenovo Legion 9 16IRX8 | |
| Lenovo Legion 9 16IRX9, RTX 4090 | |
| Razer Blade 16 2024, RTX 4090 | |
| Average Intel Core i9-14900HX (16.8 - 38.9, n=37) | |
| Asus ROG Strix Scar 18 G834JYR (2024) | |
| Medion Erazer Beast X40 2024 | |
| Average of class Gaming (6.72 - 42.9, n=152, last 2 years) | |
| LibreOffice / 20 Documents To PDF | |
| Lenovo Legion 9 16IRX9, RTX 4090 | |
| Average of class Gaming (19 - 96.6, n=151, last 2 years) | |
| Razer Blade 16 2024, RTX 4090 | |
| Alienware m18 R2 | |
| Asus ROG Strix Scar 18 G834JYR (2024) | |
| Medion Erazer Beast X40 2024 | |
| Average Intel Core i9-14900HX (19 - 85.1, n=37) | |
| Lenovo Legion 9 16IRX8 | |
| R Benchmark 2.5 / Overall mean | |
| Lenovo Legion 9 16IRX9, RTX 4090 | |
| Average of class Gaming (0.3609 - 0.759, n=154, last 2 years) | |
| Asus ROG Strix Scar 18 G834JYR (2024) | |
| Average Intel Core i9-14900HX (0.3604 - 0.4859, n=37) | |
| Lenovo Legion 9 16IRX8 | |
| Razer Blade 16 2024, RTX 4090 | |
| Alienware m18 R2 | |
| Medion Erazer Beast X40 2024 | |
* ... smaller is better
AIDA64: FP32 Ray-Trace | FPU Julia | CPU SHA3 | CPU Queen | FPU SinJulia | FPU Mandel | CPU AES | CPU ZLib | FP64 Ray-Trace | CPU PhotoWorxx
| Performance Rating | |
| Alienware m18 R2 | |
| Lenovo Legion 9 16IRX9, RTX 4090 | |
| Lenovo Legion 9 16IRX8 | |
| Razer Blade 16 2024, RTX 4090 | |
| Asus ROG Strix Scar 18 G834JYR (2024) | |
| Average Intel Core i9-14900HX | |
| Medion Erazer Beast X40 2024 | |
| Average of class Gaming | |
| AIDA64 / FP32 Ray-Trace | |
| Alienware m18 R2 | |
| Lenovo Legion 9 16IRX9, RTX 4090 | |
| Lenovo Legion 9 16IRX8 | |
| Razer Blade 16 2024, RTX 4090 | |
| Asus ROG Strix Scar 18 G834JYR (2024) | |
| Average Intel Core i9-14900HX (13098 - 33474, n=36) | |
| Average of class Gaming (4986 - 81639, n=151, last 2 years) | |
| Medion Erazer Beast X40 2024 | |
| AIDA64 / FPU Julia | |
| Alienware m18 R2 | |
| Lenovo Legion 9 16IRX9, RTX 4090 | |
| Lenovo Legion 9 16IRX8 | |
| Asus ROG Strix Scar 18 G834JYR (2024) | |
| Razer Blade 16 2024, RTX 4090 | |
| Average Intel Core i9-14900HX (67573 - 166040, n=36) | |
| Average of class Gaming (25360 - 252486, n=151, last 2 years) | |
| Medion Erazer Beast X40 2024 | |
| AIDA64 / CPU SHA3 | |
| Alienware m18 R2 | |
| Lenovo Legion 9 16IRX9, RTX 4090 | |
| Lenovo Legion 9 16IRX8 | |
| Asus ROG Strix Scar 18 G834JYR (2024) | |
| Razer Blade 16 2024, RTX 4090 | |
| Average Intel Core i9-14900HX (3589 - 7979, n=36) | |
| Average of class Gaming (1339 - 10389, n=151, last 2 years) | |
| Medion Erazer Beast X40 2024 | |
| AIDA64 / CPU Queen | |
| Asus ROG Strix Scar 18 G834JYR (2024) | |
| Alienware m18 R2 | |
| Razer Blade 16 2024, RTX 4090 | |
| Average Intel Core i9-14900HX (118405 - 148966, n=36) | |
| Lenovo Legion 9 16IRX8 | |
| Medion Erazer Beast X40 2024 | |
| Lenovo Legion 9 16IRX9, RTX 4090 | |
| Average of class Gaming (50699 - 200651, n=151, last 2 years) | |
| AIDA64 / FPU SinJulia | |
| Alienware m18 R2 | |
| Lenovo Legion 9 16IRX9, RTX 4090 | |
| Asus ROG Strix Scar 18 G834JYR (2024) | |
| Razer Blade 16 2024, RTX 4090 | |
| Lenovo Legion 9 16IRX8 | |
| Average Intel Core i9-14900HX (10475 - 18517, n=36) | |
| Medion Erazer Beast X40 2024 | |
| Average of class Gaming (4800 - 32988, n=151, last 2 years) | |
| AIDA64 / FPU Mandel | |
| Alienware m18 R2 | |
| Lenovo Legion 9 16IRX9, RTX 4090 | |
| Lenovo Legion 9 16IRX8 | |
| Razer Blade 16 2024, RTX 4090 | |
| Asus ROG Strix Scar 18 G834JYR (2024) | |
| Average Intel Core i9-14900HX (32543 - 83662, n=36) | |
| Average of class Gaming (12321 - 134044, n=151, last 2 years) | |
| Medion Erazer Beast X40 2024 | |
| AIDA64 / CPU AES | |
| Average Intel Core i9-14900HX (86964 - 241777, n=36) | |
| Alienware m18 R2 | |
| Lenovo Legion 9 16IRX9, RTX 4090 | |
| Lenovo Legion 9 16IRX8 | |
| Razer Blade 16 2024, RTX 4090 | |
| Asus ROG Strix Scar 18 G834JYR (2024) | |
| Average of class Gaming (19065 - 328679, n=151, last 2 years) | |
| Medion Erazer Beast X40 2024 | |
| AIDA64 / CPU ZLib | |
| Alienware m18 R2 | |
| Lenovo Legion 9 16IRX9, RTX 4090 | |
| Lenovo Legion 9 16IRX8 | |
| Razer Blade 16 2024, RTX 4090 | |
| Average Intel Core i9-14900HX (1054 - 2292, n=36) | |
| Asus ROG Strix Scar 18 G834JYR (2024) | |
| Medion Erazer Beast X40 2024 | |
| Average of class Gaming (373 - 2531, n=151, last 2 years) | |
| AIDA64 / FP64 Ray-Trace | |
| Alienware m18 R2 | |
| Lenovo Legion 9 16IRX8 | |
| Lenovo Legion 9 16IRX9, RTX 4090 | |
| Razer Blade 16 2024, RTX 4090 | |
| Asus ROG Strix Scar 18 G834JYR (2024) | |
| Average Intel Core i9-14900HX (6809 - 18349, n=36) | |
| Average of class Gaming (2540 - 43430, n=151, last 2 years) | |
| Medion Erazer Beast X40 2024 | |
| AIDA64 / CPU PhotoWorxx | |
| Lenovo Legion 9 16IRX9, RTX 4090 | |
| Lenovo Legion 9 16IRX8 | |
| Alienware m18 R2 | |
| Asus ROG Strix Scar 18 G834JYR (2024) | |
| Razer Blade 16 2024, RTX 4090 | |
| Medion Erazer Beast X40 2024 | |
| Average Intel Core i9-14900HX (23903 - 54702, n=36) | |
| Average of class Gaming (10805 - 60161, n=151, last 2 years) | |
系统性能
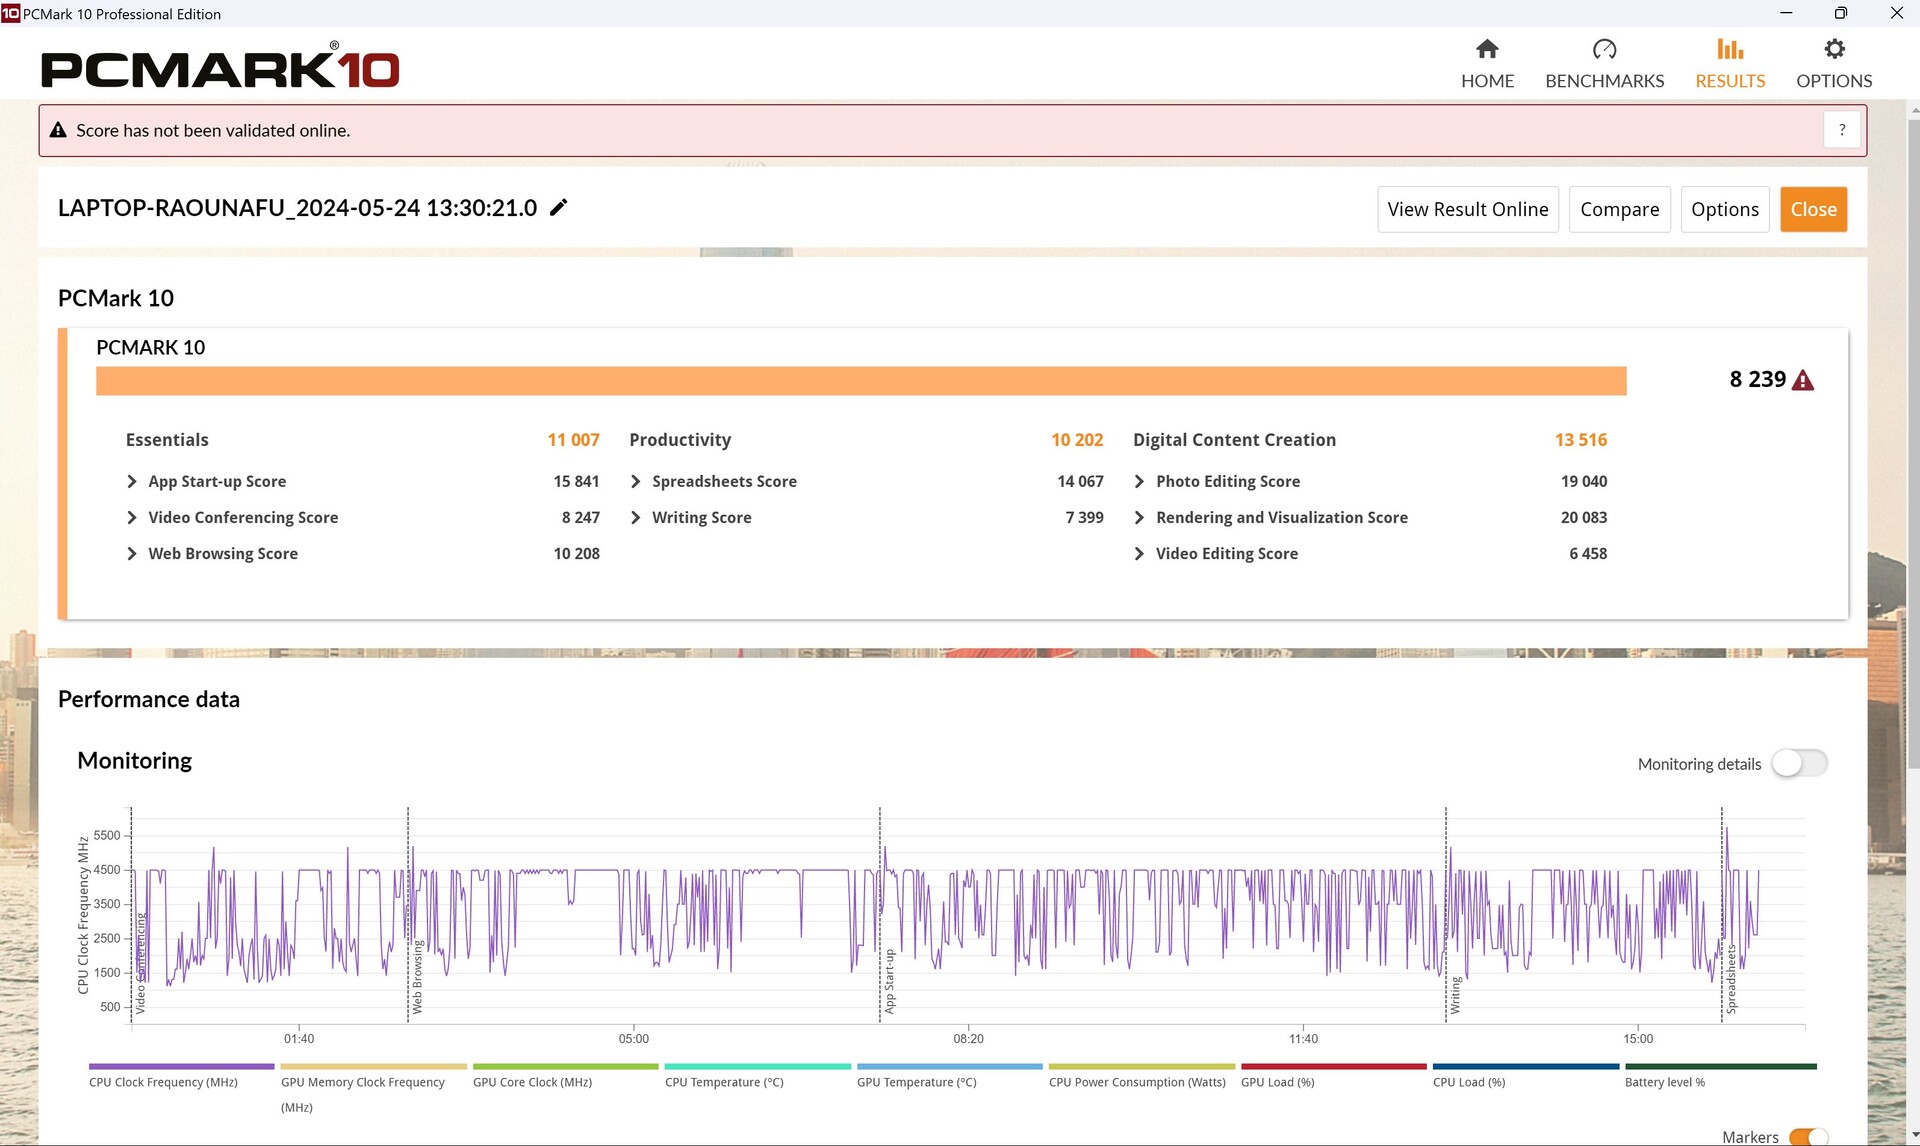
它在 PCMark 10 中的性能比具有相同 CPU/GPU 组合的普通笔记本电脑低约 5%。Aida 还显示,虽然其内存具有良好的读写速率,但内存延迟却异常高,导致在某些基准测试(如这里)中的结果不如预期。
主观上,我们注意到,虽然笔记本电脑在大部分时间都能流畅运行,但在运行游戏时偶尔会出现 "卡顿 "现象。例如,《孤岛惊魂 5》的帧率图也证实了这一点,它的帧率出现了短暂的下降,这种情况似乎发生得更频繁。其 DPC 延迟也相当高,请参见下一节。它在使用网络应用程序时的结果也屡屡不佳。
CrossMark: Overall | Productivity | Creativity | Responsiveness
WebXPRT 3: Overall
WebXPRT 4: Overall
Mozilla Kraken 1.1: Total
| PCMark 10 / Score | |
| Alienware m18 R2 | |
| Lenovo Legion 9 16IRX8 | |
| Medion Erazer Beast X40 2024 | |
| Asus ROG Strix Scar 18 G834JYR (2024) | |
| Average Intel Core i9-14900HX, NVIDIA GeForce RTX 4090 Laptop GPU (8230 - 9234, n=13) | |
| Razer Blade 16 2024, RTX 4090 | |
| Lenovo Legion 9 16IRX9, RTX 4090 | |
| Average of class Gaming (5776 - 9852, n=134, last 2 years) | |
| PCMark 10 / Essentials | |
| Lenovo Legion 9 16IRX8 | |
| Alienware m18 R2 | |
| Asus ROG Strix Scar 18 G834JYR (2024) | |
| Average Intel Core i9-14900HX, NVIDIA GeForce RTX 4090 Laptop GPU (10778 - 11628, n=13) | |
| Lenovo Legion 9 16IRX9, RTX 4090 | |
| Razer Blade 16 2024, RTX 4090 | |
| Medion Erazer Beast X40 2024 | |
| Average of class Gaming (9057 - 12600, n=134, last 2 years) | |
| PCMark 10 / Productivity | |
| Medion Erazer Beast X40 2024 | |
| Alienware m18 R2 | |
| Razer Blade 16 2024, RTX 4090 | |
| Lenovo Legion 9 16IRX8 | |
| Average Intel Core i9-14900HX, NVIDIA GeForce RTX 4090 Laptop GPU (9458 - 11759, n=13) | |
| Asus ROG Strix Scar 18 G834JYR (2024) | |
| Lenovo Legion 9 16IRX9, RTX 4090 | |
| Average of class Gaming (6662 - 14612, n=134, last 2 years) | |
| PCMark 10 / Digital Content Creation | |
| Alienware m18 R2 | |
| Lenovo Legion 9 16IRX8 | |
| Asus ROG Strix Scar 18 G834JYR (2024) | |
| Medion Erazer Beast X40 2024 | |
| Average Intel Core i9-14900HX, NVIDIA GeForce RTX 4090 Laptop GPU (13219 - 16462, n=13) | |
| Lenovo Legion 9 16IRX9, RTX 4090 | |
| Razer Blade 16 2024, RTX 4090 | |
| Average of class Gaming (6807 - 19351, n=134, last 2 years) | |
| CrossMark / Overall | |
| Asus ROG Strix Scar 18 G834JYR (2024) | |
| Razer Blade 16 2024, RTX 4090 | |
| Medion Erazer Beast X40 2024 | |
| Average Intel Core i9-14900HX, NVIDIA GeForce RTX 4090 Laptop GPU (1877 - 2344, n=10) | |
| Alienware m18 R2 | |
| Lenovo Legion 9 16IRX9, RTX 4090 | |
| Lenovo Legion 9 16IRX8 | |
| Average of class Gaming (1247 - 2344, n=114, last 2 years) | |
| CrossMark / Productivity | |
| Medion Erazer Beast X40 2024 | |
| Asus ROG Strix Scar 18 G834JYR (2024) | |
| Razer Blade 16 2024, RTX 4090 | |
| Average Intel Core i9-14900HX, NVIDIA GeForce RTX 4090 Laptop GPU (1738 - 2162, n=10) | |
| Alienware m18 R2 | |
| Average of class Gaming (1299 - 2204, n=114, last 2 years) | |
| Lenovo Legion 9 16IRX8 | |
| Lenovo Legion 9 16IRX9, RTX 4090 | |
| CrossMark / Creativity | |
| Asus ROG Strix Scar 18 G834JYR (2024) | |
| Razer Blade 16 2024, RTX 4090 | |
| Alienware m18 R2 | |
| Average Intel Core i9-14900HX, NVIDIA GeForce RTX 4090 Laptop GPU (2195 - 2660, n=10) | |
| Medion Erazer Beast X40 2024 | |
| Lenovo Legion 9 16IRX8 | |
| Lenovo Legion 9 16IRX9, RTX 4090 | |
| Average of class Gaming (1275 - 2660, n=114, last 2 years) | |
| CrossMark / Responsiveness | |
| Asus ROG Strix Scar 18 G834JYR (2024) | |
| Medion Erazer Beast X40 2024 | |
| Average Intel Core i9-14900HX, NVIDIA GeForce RTX 4090 Laptop GPU (1478 - 2327, n=10) | |
| Razer Blade 16 2024, RTX 4090 | |
| Alienware m18 R2 | |
| Lenovo Legion 9 16IRX9, RTX 4090 | |
| Average of class Gaming (1030 - 2330, n=114, last 2 years) | |
| Lenovo Legion 9 16IRX8 | |
| WebXPRT 3 / Overall | |
| Lenovo Legion 9 16IRX8 | |
| Razer Blade 16 2024, RTX 4090 | |
| Medion Erazer Beast X40 2024 | |
| Alienware m18 R2 | |
| Average Intel Core i9-14900HX, NVIDIA GeForce RTX 4090 Laptop GPU (279 - 339, n=10) | |
| Asus ROG Strix Scar 18 G834JYR (2024) | |
| Average of class Gaming (215 - 480, n=131, last 2 years) | |
| Lenovo Legion 9 16IRX9, RTX 4090 | |
| WebXPRT 4 / Overall | |
| Alienware m18 R2 | |
| Lenovo Legion 9 16IRX8 | |
| Asus ROG Strix Scar 18 G834JYR (2024) | |
| Medion Erazer Beast X40 2024 | |
| Average Intel Core i9-14900HX, NVIDIA GeForce RTX 4090 Laptop GPU (246 - 309, n=8) | |
| Average of class Gaming (176.4 - 336, n=117, last 2 years) | |
| Lenovo Legion 9 16IRX9, RTX 4090 | |
| Mozilla Kraken 1.1 / Total | |
| Lenovo Legion 9 16IRX9, RTX 4090 | |
| Average of class Gaming (405 - 674, n=144, last 2 years) | |
| Average Intel Core i9-14900HX, NVIDIA GeForce RTX 4090 Laptop GPU (428 - 535, n=11) | |
| Razer Blade 16 2024, RTX 4090 | |
| Asus ROG Strix Scar 18 G834JYR (2024) | |
| Lenovo Legion 9 16IRX8 | |
| Medion Erazer Beast X40 2024 | |
| Alienware m18 R2 | |
* ... smaller is better
| PCMark 10 Score | 8239 points | |
Help | ||
| AIDA64 / Memory Copy | |
| Asus ROG Strix Scar 18 G834JYR (2024) | |
| Lenovo Legion 9 16IRX9, RTX 4090 | |
| Alienware m18 R2 | |
| Razer Blade 16 2024, RTX 4090 | |
| Lenovo Legion 9 16IRX8 | |
| Medion Erazer Beast X40 2024 | |
| Average Intel Core i9-14900HX (38028 - 83392, n=36) | |
| Average of class Gaming (21750 - 97515, n=151, last 2 years) | |
| AIDA64 / Memory Read | |
| Asus ROG Strix Scar 18 G834JYR (2024) | |
| Razer Blade 16 2024, RTX 4090 | |
| Alienware m18 R2 | |
| Lenovo Legion 9 16IRX8 | |
| Medion Erazer Beast X40 2024 | |
| Lenovo Legion 9 16IRX9, RTX 4090 | |
| Average Intel Core i9-14900HX (43306 - 87568, n=36) | |
| Average of class Gaming (22956 - 102937, n=151, last 2 years) | |
| AIDA64 / Memory Write | |
| Lenovo Legion 9 16IRX9, RTX 4090 | |
| Asus ROG Strix Scar 18 G834JYR (2024) | |
| Medion Erazer Beast X40 2024 | |
| Alienware m18 R2 | |
| Lenovo Legion 9 16IRX8 | |
| Razer Blade 16 2024, RTX 4090 | |
| Average Intel Core i9-14900HX (37146 - 80589, n=36) | |
| Average of class Gaming (22297 - 108954, n=151, last 2 years) | |
| AIDA64 / Memory Latency | |
| Average of class Gaming (59.5 - 259, n=151, last 2 years) | |
| Lenovo Legion 9 16IRX9, RTX 4090 | |
| Alienware m18 R2 | |
| Average Intel Core i9-14900HX (76.1 - 105, n=36) | |
| Lenovo Legion 9 16IRX8 | |
| Razer Blade 16 2024, RTX 4090 | |
| Asus ROG Strix Scar 18 G834JYR (2024) | |
| Medion Erazer Beast X40 2024 | |
* ... smaller is better
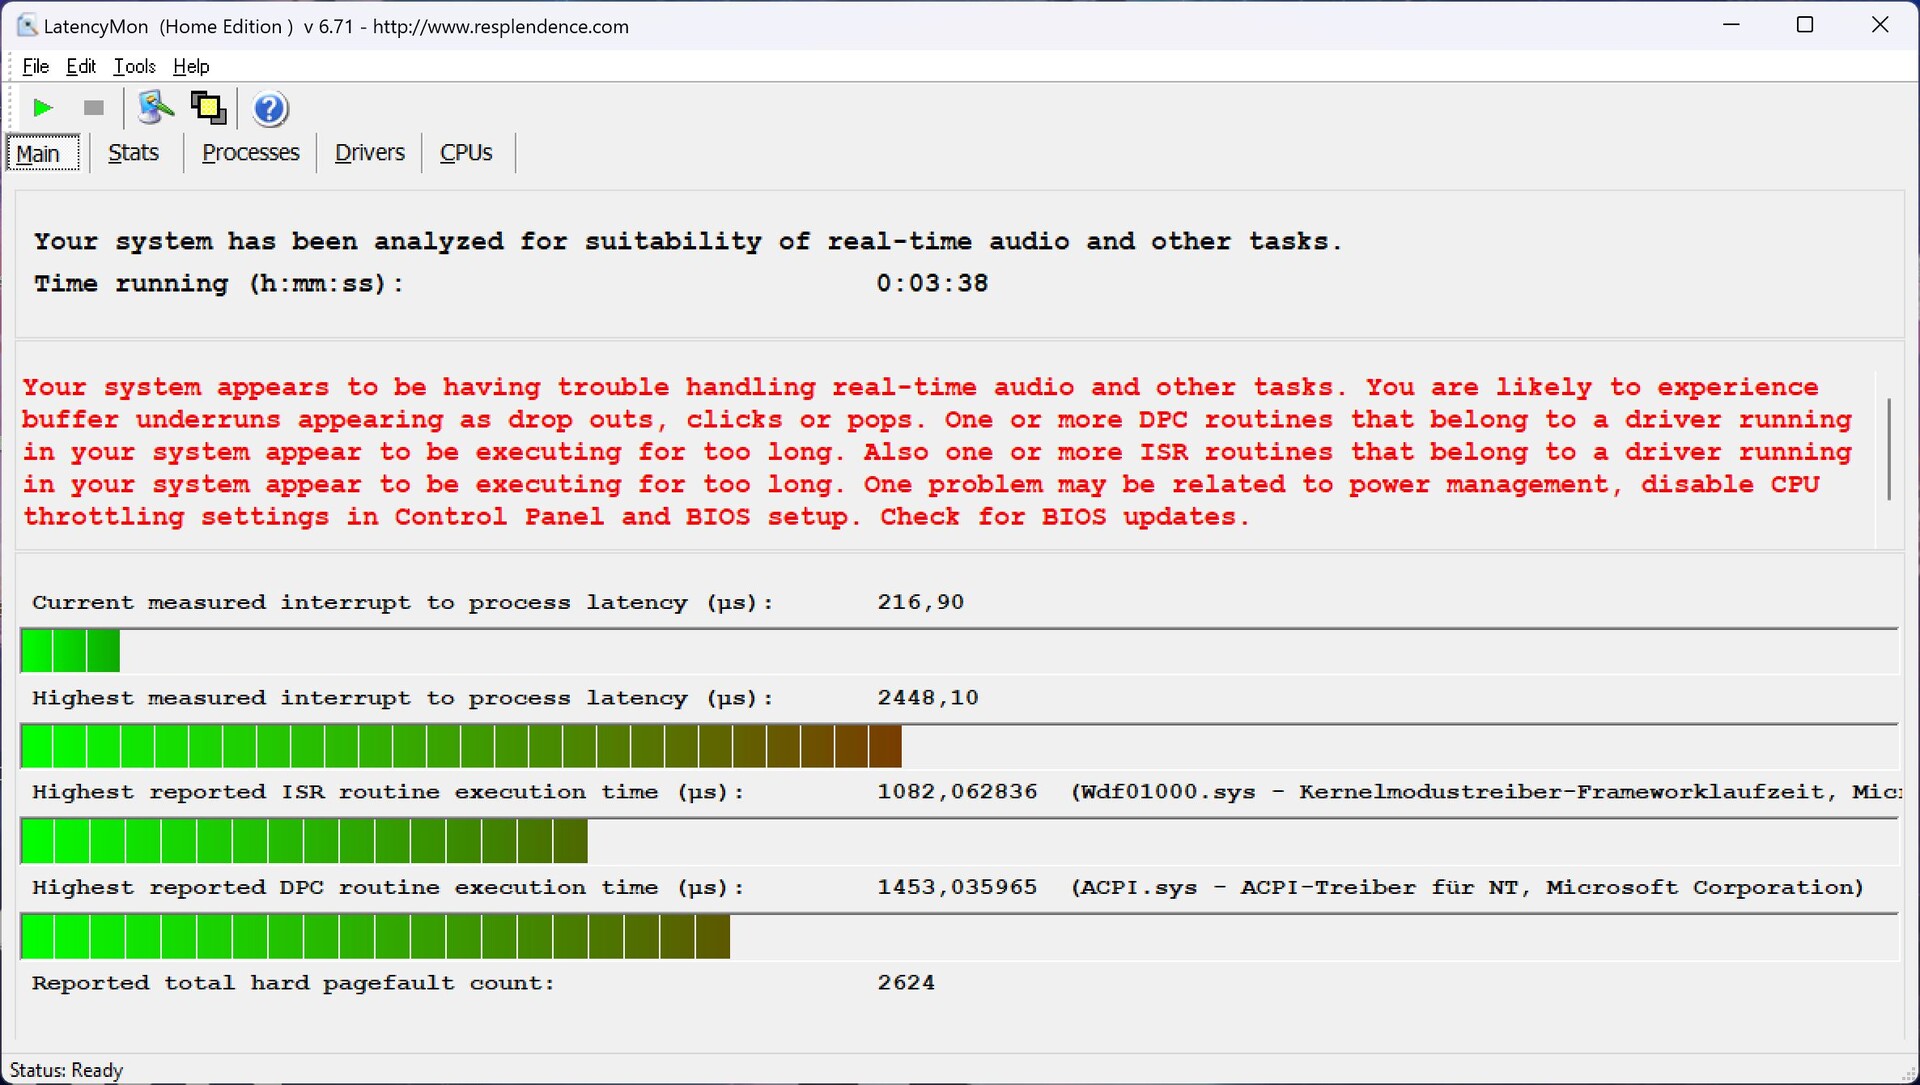
DPC 延迟
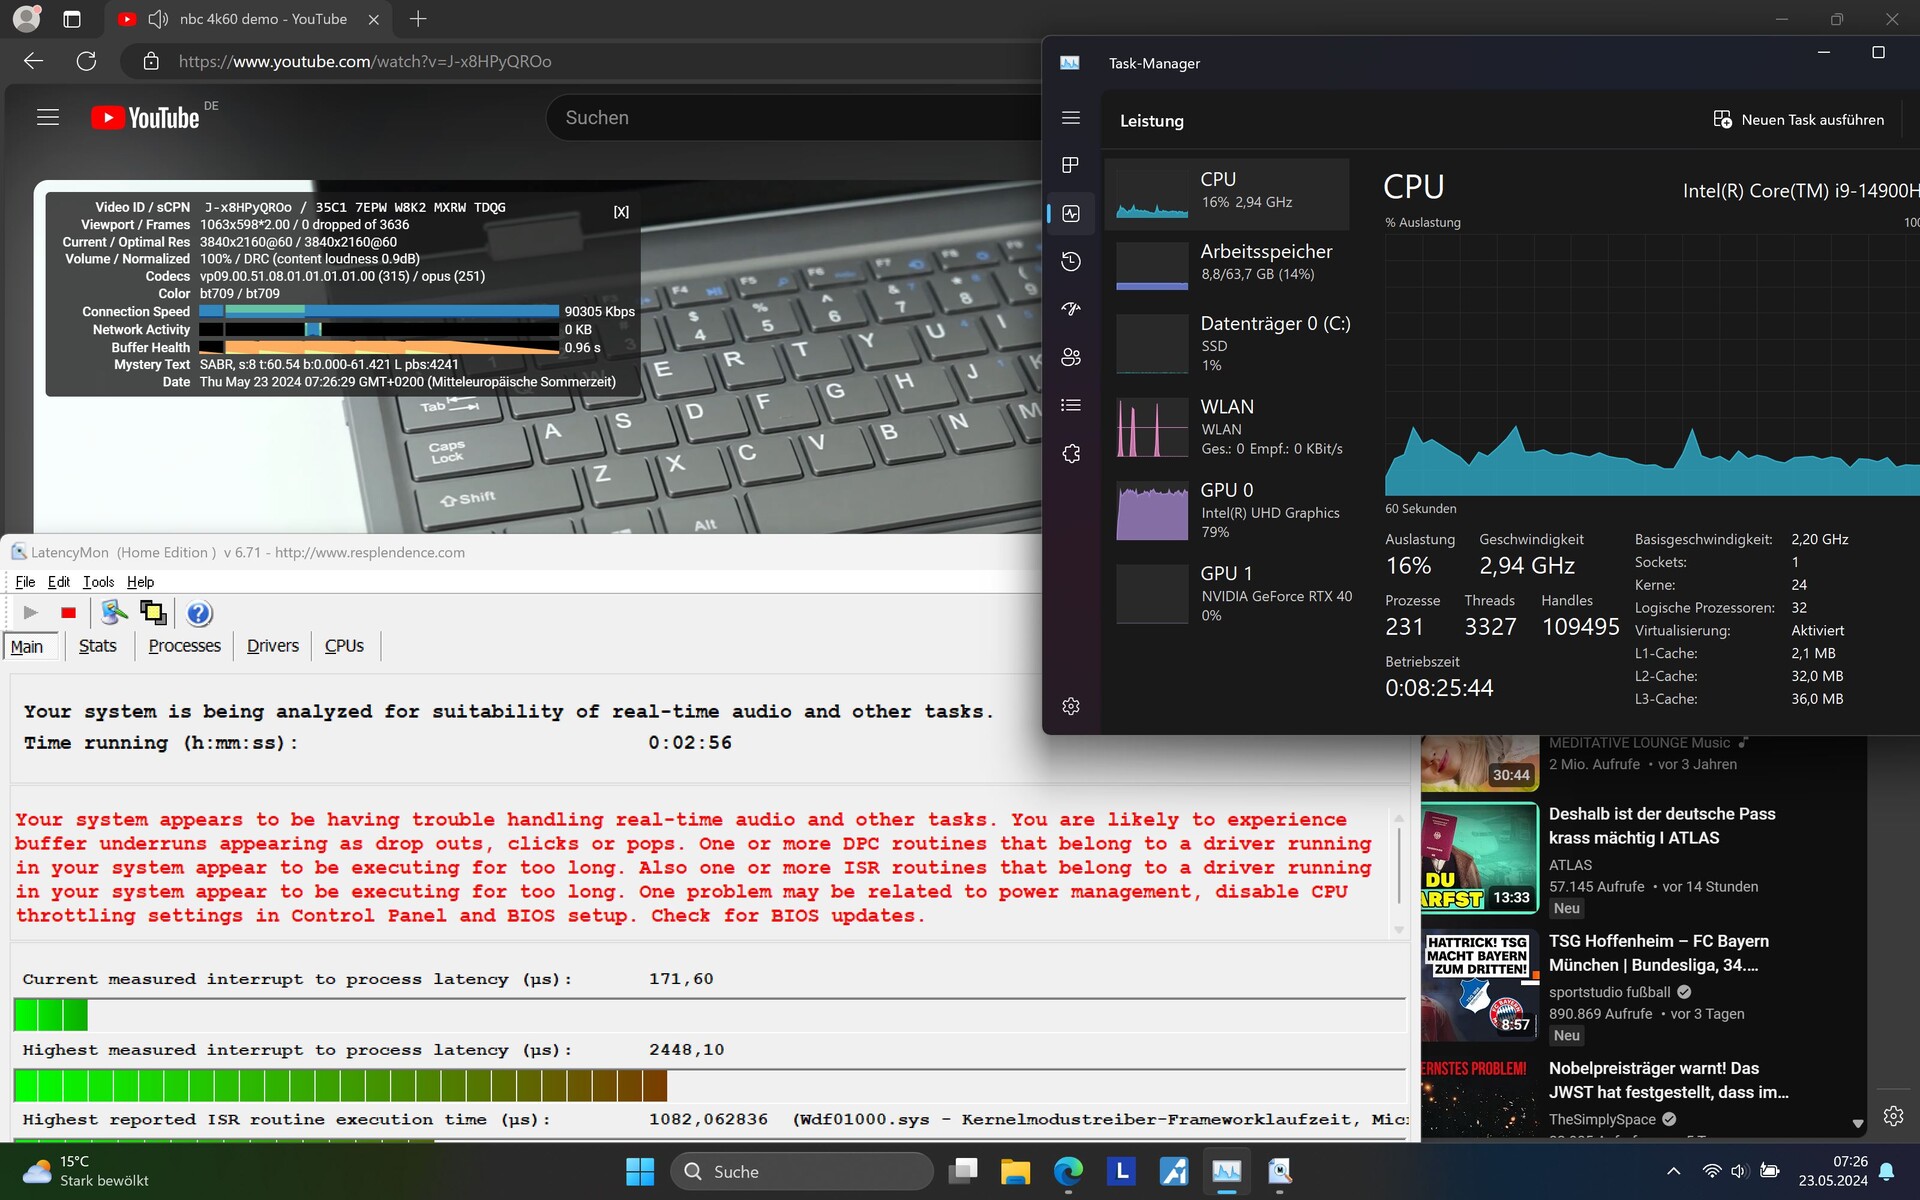
浏览器一打开就出现了第一次延迟。在我们的网站上打开多个标签页时,延迟值增加得很少。不过,主要是在播放 4K/60 fps YouTube 视频时,延迟值急剧上升。
此外,内部 GPU 负载--在这种情况下处于激活状态--持续保持在异常高的 79%;正常情况下该数值约为 20%!不过,没有出现掉帧的情况。
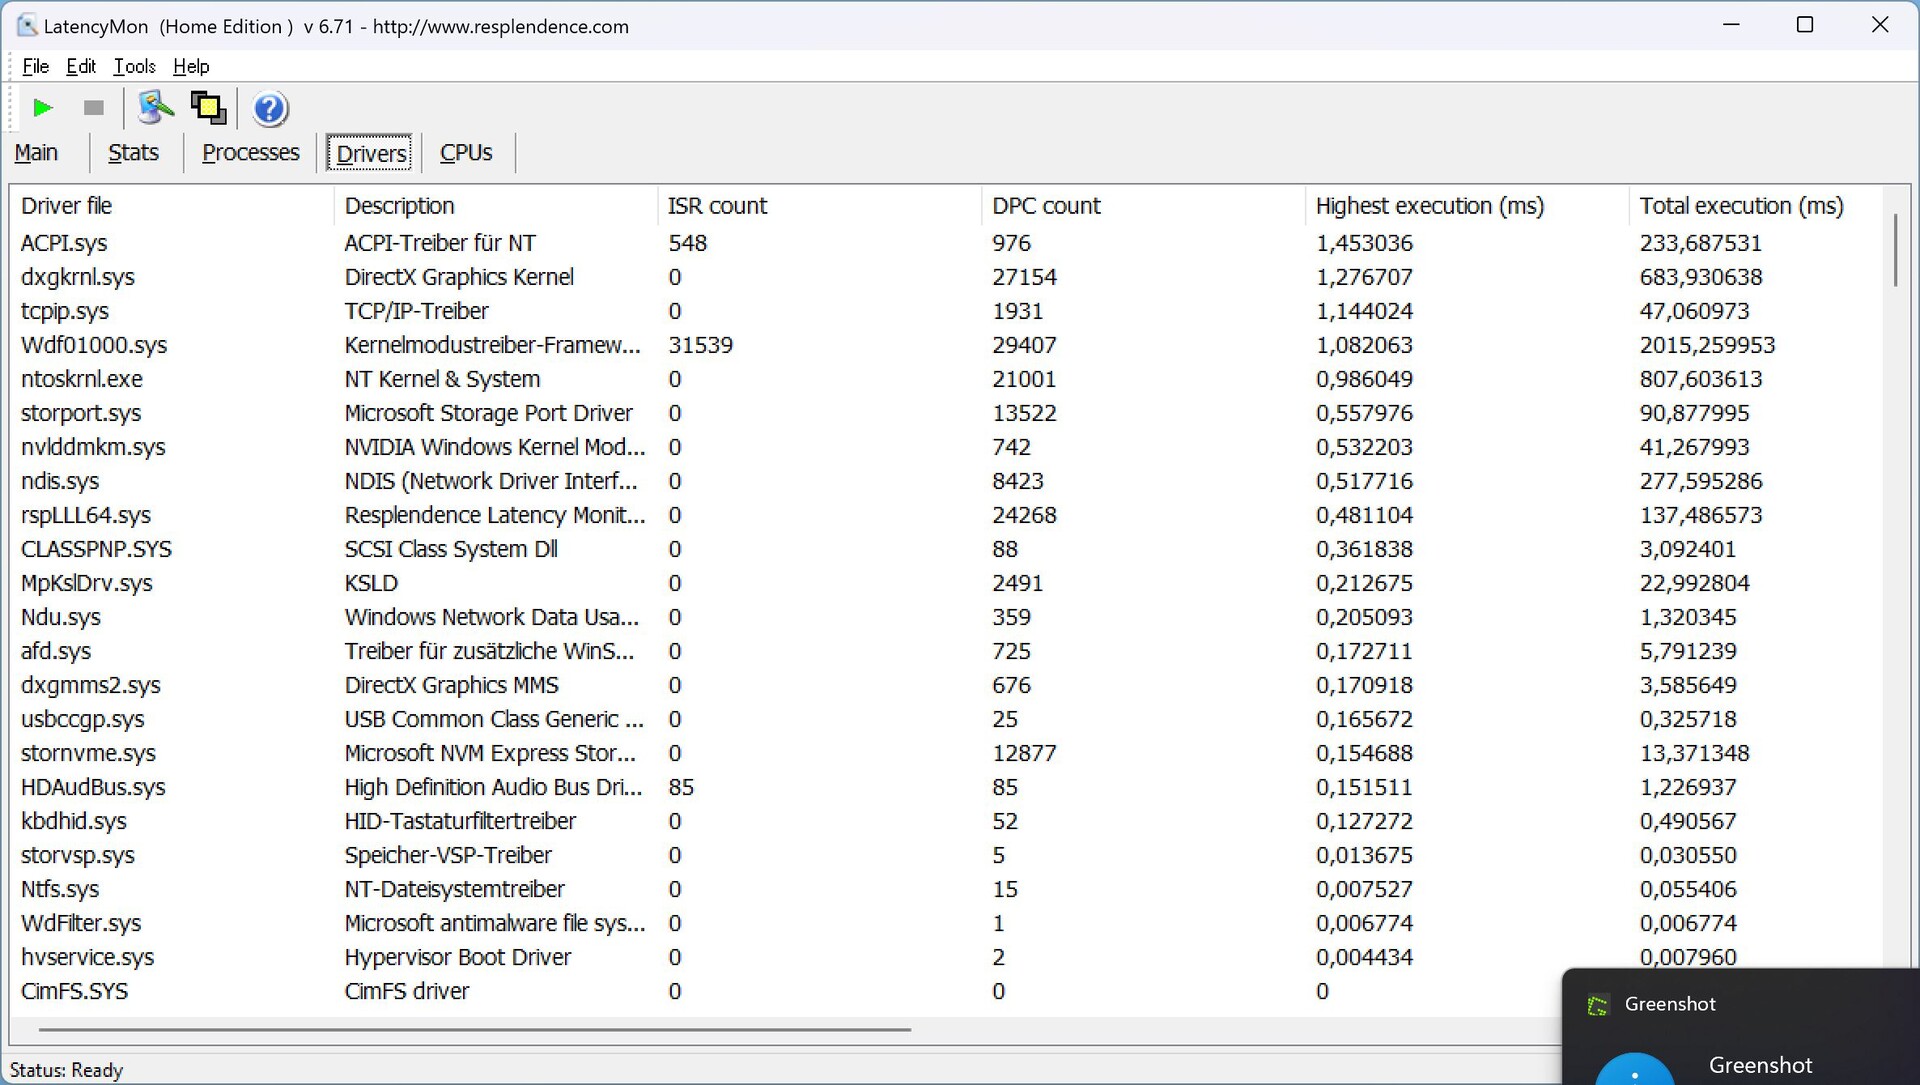
| DPC Latencies / LatencyMon - interrupt to process latency (max), Web, Youtube, Prime95 | |
| Alienware m18 R2 | |
| Lenovo Legion 9 16IRX9, RTX 4090 | |
| Lenovo Legion 9 16IRX8 | |
| Razer Blade 16 2024, RTX 4090 | |
| Medion Erazer Beast X40 2024 | |
| Asus ROG Strix Scar 18 G834JYR (2024) | |
* ... smaller is better
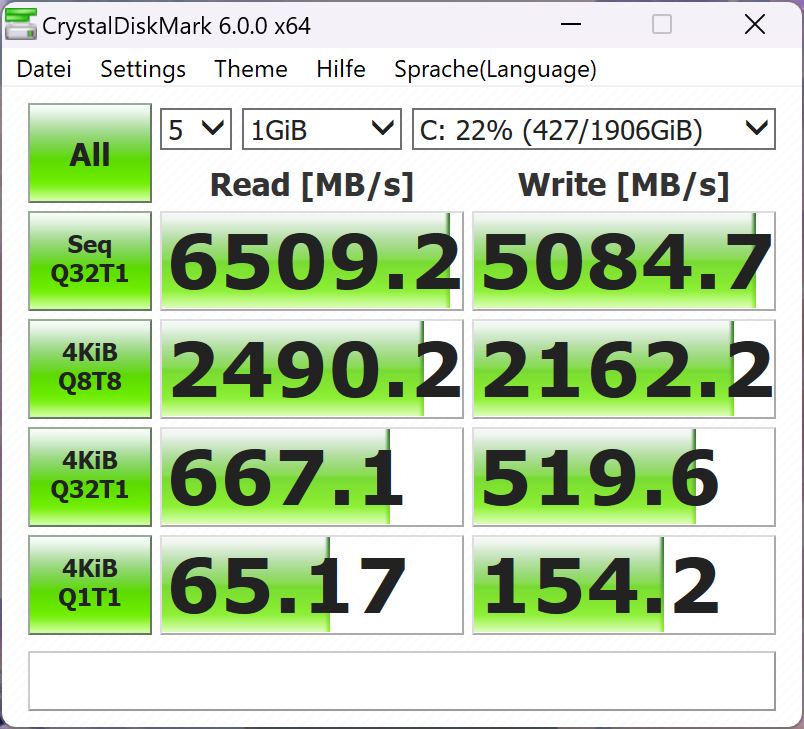
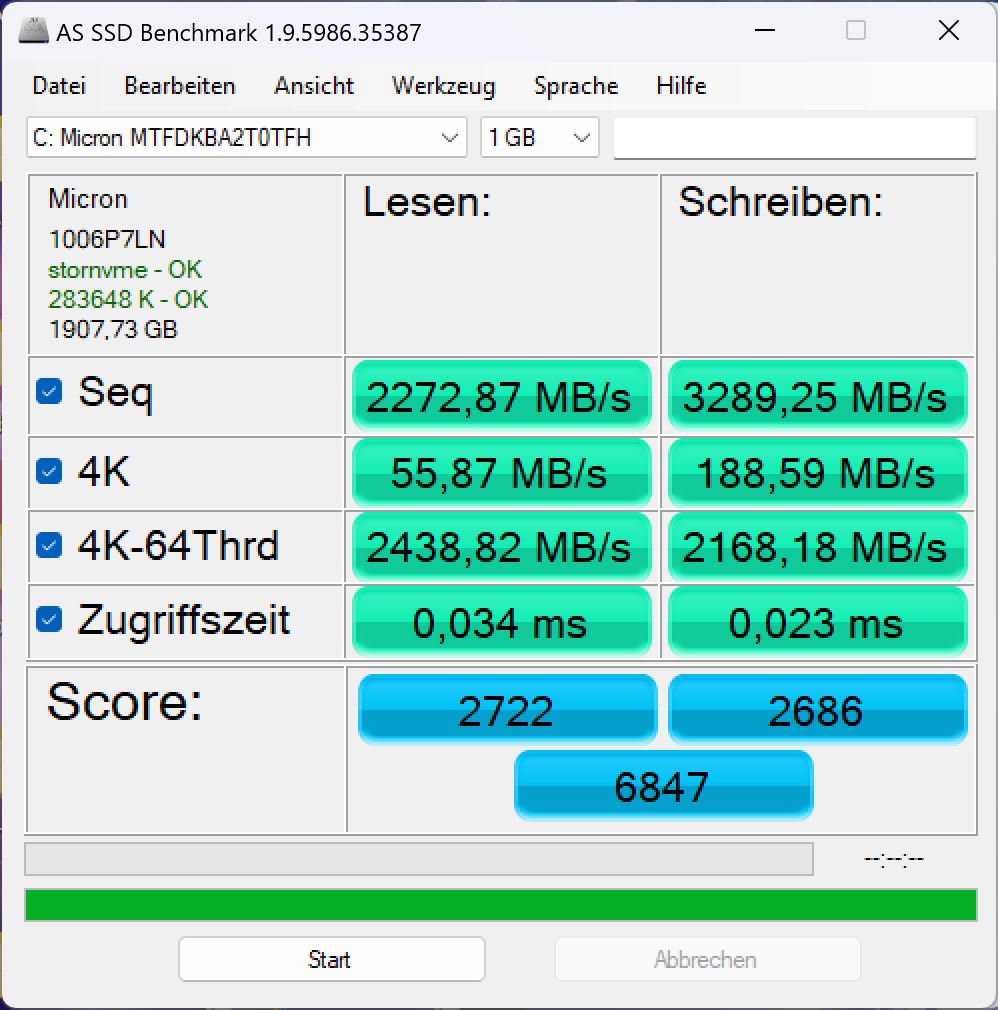
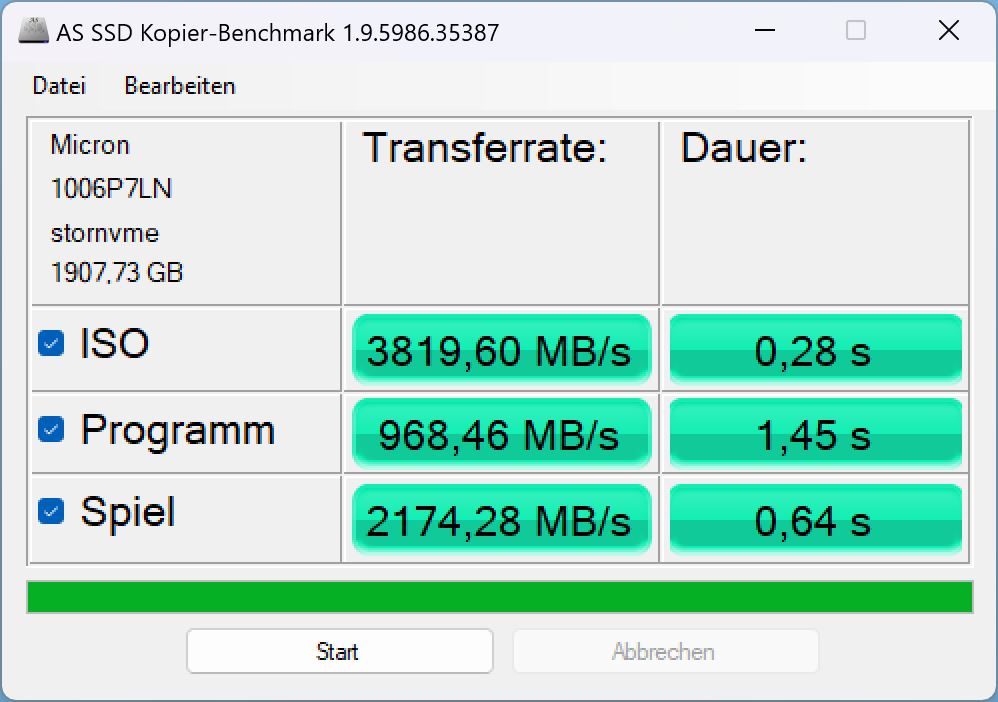
存储设备
联想为我们的测试机型安装了美光 3400,存储容量为 2 TB。它在我们的 固态硬盘最佳列表这意味着它最多只能算是中端产品。根据美光公司的说法,它的连续读取速度应高达6600 MB/s,连续写入速度应高达5000 MB/s,但我们的机型与我们数据库中采用相同固态硬盘的普通笔记本电脑一样,离这一目标相去甚远。只有 Crystaldiskmark 能确认较高的数值,而 DiskSpd 和 AS SSD 测得的数据传输率要低得多。
这款笔记本电脑的持续负载行为很不寻常:其他机型有时会在一定时间后发热,然后节流,而Legion 9 内部的存储设备却恰恰相反。测试开始时,它的性能波动很大,而且一再下降。然而,在测试的最后三分之二时间里,固态硬盘一直以最高速度运行。这可能是Legion 9i 的散热系统启动得太晚了,或者说它达到最佳散热能力的时间太晚了。

* ... smaller is better
Reading continuous performance: DiskSpd Read Loop, Queue Depth 8
图形卡
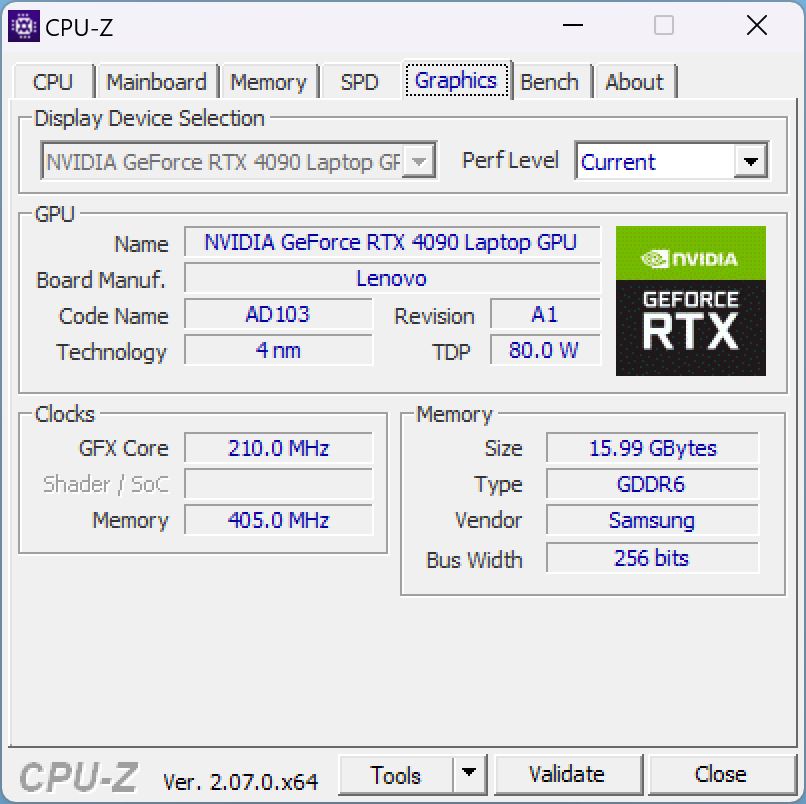
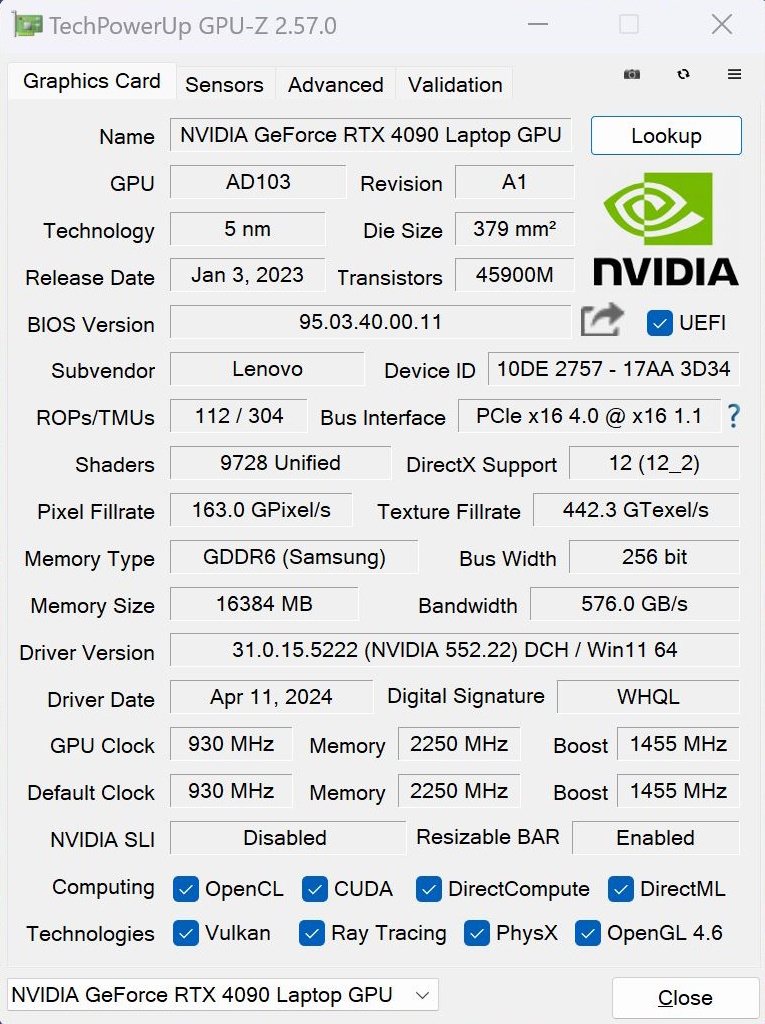
......(英文 Nvidia Geforce RTX 4090Legion 9i 内的 Nvidia Geforce RTX 4090 是目前笔记本显卡的佼佼者。因此,它应该能够以高分辨率和最高细节运行目前所有的游戏。
在合成 3DMark 测试中,它的性能大致达到了预期水平,但还是略微偏低,而直接竞争对手往往要快上几个百分点--无独有偶,小巧轻薄的 Blade 16 也是如此。
如果断开笔记本电脑的电源,其Fire Strike 3D 性能得分会下降约 40%。
在游戏方面,它的性能与 Razer Blade 16 大致相当。如果不是上述短暂的帧速率下降,它的成绩可能会更高。在我们进行的 1 小时Witcher 3 测试中,你可以从帧速率值中清楚地看到这个问题。帧率下降主要发生在早期阶段,之后系统运行稳定,性能与竞争对手相当。
只有在运行《骷髅与白骨精》(Skull & Bones)等当前要求非常高的游戏时,其 4K 帧率有时才会低于 60 fps,否则所有游戏都能以超过 60 fps 的帧率流畅运行,即使在 4K 下也是如此。
| 性能简介/测量值 | Witcher 3 fps start | Witcher 3 fps after 10 min | Consumption in watts | GPU power consumption in watts | Avg GPU clock in MHz | Noise emissions in dB |
|---|---|---|---|---|---|---|
| 性能 | 203 | 192 | 246 | 162 | 2,120 | 55.32 |
| 使用 GPU 提升的性能 | 201 | 193 | 254 | 160.5 | 2,180 | 55.32 |
| 有人工智能的均衡性能 | 197 | 182 | 254 | 159 | 2,080 | 54.81 |
| 无人工智能的平衡 | 161 | 145 | 184 | 103 | 1,530 | 47.98 |
| 安静 | 108 | 60 | 101 | 43 | 前 1,000 次,2 分钟后 800 | 32.19 |
| 3DMark 11 Performance | 46826 points | |
| 3DMark Cloud Gate Standard Score | 67697 points | |
| 3DMark Fire Strike Score | 34686 points | |
| 3DMark Time Spy Score | 20099 points | |
Help | ||
* ... smaller is better
| The Witcher 3 - 1920x1080 Ultra Graphics & Postprocessing (HBAO+) | |
| Lenovo Legion 9 16IRX8 | |
| Alienware m18 R2 | |
| Medion Erazer Beast X40 2024 | |
| Lenovo Legion 9 16IRX9, RTX 4090 | |
| Razer Blade 16 2024, RTX 4090 | |
| Asus ROG Strix Scar 18 G834JYR (2024) | |
| Average of class Gaming (18.4 - 214, n=118, last 2 years) | |
| GTA V - 1920x1080 Highest Settings possible AA:4xMSAA + FX AF:16x | |
| Lenovo Legion 9 16IRX8 | |
| Medion Erazer Beast X40 2024 | |
| Razer Blade 16 2024, RTX 4090 | |
| Alienware m18 R2 | |
| Lenovo Legion 9 16IRX9, RTX 4090 | |
| Asus ROG Strix Scar 18 G834JYR (2024) | |
| Average of class Gaming (12.1 - 168.2, n=133, last 2 years) | |
| Final Fantasy XV Benchmark - 1920x1080 High Quality | |
| Alienware m18 R2 | |
| Lenovo Legion 9 16IRX8 | |
| Medion Erazer Beast X40 2024 | |
| Asus ROG Strix Scar 18 G834JYR (2024) | |
| Lenovo Legion 9 16IRX9, RTX 4090 | |
| Razer Blade 16 2024, RTX 4090 | |
| Average of class Gaming (19.2 - 201, n=145, last 2 years) | |
Witcher 3 FPS diagram
| low | med. | high | ultra | QHD | 4K DLSS | 4K FSR | 4K | |
|---|---|---|---|---|---|---|---|---|
| GTA V (2015) | 186.9 | 185.2 | 183.3 | 136.2 | 138.9 | 95 | ||
| The Witcher 3 (2015) | 540 | 494 | 370 | 203.4 | 165 | 104.5 | ||
| Dota 2 Reborn (2015) | 201 | 181.8 | 174.4 | 164.5 | 160.8 | |||
| Final Fantasy XV Benchmark (2018) | 228 | 194.9 | 165.1 | 142 | ||||
| X-Plane 11.11 (2018) | 193.5 | 166.3 | 125.6 | 109.6 | ||||
| Far Cry 5 (2018) | 201 | 173 | 166 | 155 | 146 | 104 | ||
| Strange Brigade (2018) | 499 | 403 | 387 | 369 | 290 | |||
| F1 23 (2023) | 151.5 | 149.2 | 144.6 | |||||
| Cyberpunk 2077 2.2 Phantom Liberty (2023) | 127 | 86 | ||||||
| Skull & Bones (2024) | 164 | 140 | 149 | 118 | 98 | 90 | 81 | 61 |
| F1 24 (2024) | 339 | 304 | 113.6 | 72.1 |
排放与动力 - 噪音大、温度高
噪音排放
在台式机上闲置时,笔记本电脑的风扇大多是静音的。偶尔风扇会短暂加速,但随后又会恢复平静。但是,只要将设备置于日常负载(如上网)下,风扇就会迅速工作,即使在静音模式下也是如此。
在 3DMark06 中,风扇先是持续加速到略高于 40 分贝,然后再次平静下来,达到 35 分贝,在最后三分之一处达到 39 分贝左右。这也可能表明,系统根据散热条件调整散热和性能的时间过晚,只有在一段时间后才能达到最佳值。
在游戏和 "性能"模式下,风扇的最大运行噪音约为 55 分贝,与 Blade 16 等机型相比,噪音相当大。在平衡模式(无 AI)下,笔记本电脑的噪音降至 47 分贝,但游戏性能明显下降,降幅为 20% 至 25%。
Noise Level
| Idle |
| 23 / 23 / 23 dB(A) |
| Load |
| 39 / 55.56 dB(A) |
 | ||
30 dB silent 40 dB(A) audible 50 dB(A) loud |
||
min: | ||
| Lenovo Legion 9 16IRX9, RTX 4090 NVIDIA GeForce RTX 4090 Laptop GPU, i9-14900HX, Micron 3400 2TB MTFDKBA2T0TFH | Lenovo Legion 9 16IRX8 NVIDIA GeForce RTX 4090 Laptop GPU, i9-13980HX, 2x SK Hynix HFS001TEJ9X115N (RAID 0) | Razer Blade 16 2024, RTX 4090 NVIDIA GeForce RTX 4090 Laptop GPU, i9-14900HX, Samsung PM9A1 MZVL22T0HBLB | Alienware m18 R2 NVIDIA GeForce RTX 4090 Laptop GPU, i9-14900HX, SK Hynix PC811 HFS002TEM9X152N | Asus ROG Strix Scar 18 G834JYR (2024) NVIDIA GeForce RTX 4090 Laptop GPU, i9-14900HX, Samsung PM9A1a MZVL22T0HDLB | Medion Erazer Beast X40 2024 NVIDIA GeForce RTX 4090 Laptop GPU, i9-14900HX, Phison E18-1TB-PHISON-SSD-BICS5 | |
|---|---|---|---|---|---|---|
| Noise | -2% | -1% | -5% | -13% | -15% | |
| off / environment * | 23 | 23.7 -3% | 23 -0% | 23.6 -3% | 24 -4% | 25 -9% |
| Idle Minimum * | 23 | 24 -4% | 23 -0% | 23.8 -3% | 27 -17% | 28 -22% |
| Idle Average * | 23 | 24 -4% | 23 -0% | 26.1 -13% | 28 -22% | 29 -26% |
| Idle Maximum * | 23 | 30.4 -32% | 27.66 -20% | 31.5 -37% | 32 -39% | 32 -39% |
| Load Average * | 39 | 30.4 22% | 43.76 -12% | 31.5 19% | 50 -28% | 48 -23% |
| Witcher 3 ultra * | 55.32 | 52.2 6% | 46.81 15% | 52.1 6% | 50 10% | 50 10% |
| Load Maximum * | 55.56 | 54.9 1% | 50.37 9% | 56.6 -2% | 52 6% | 52 6% |
* ... smaller is better
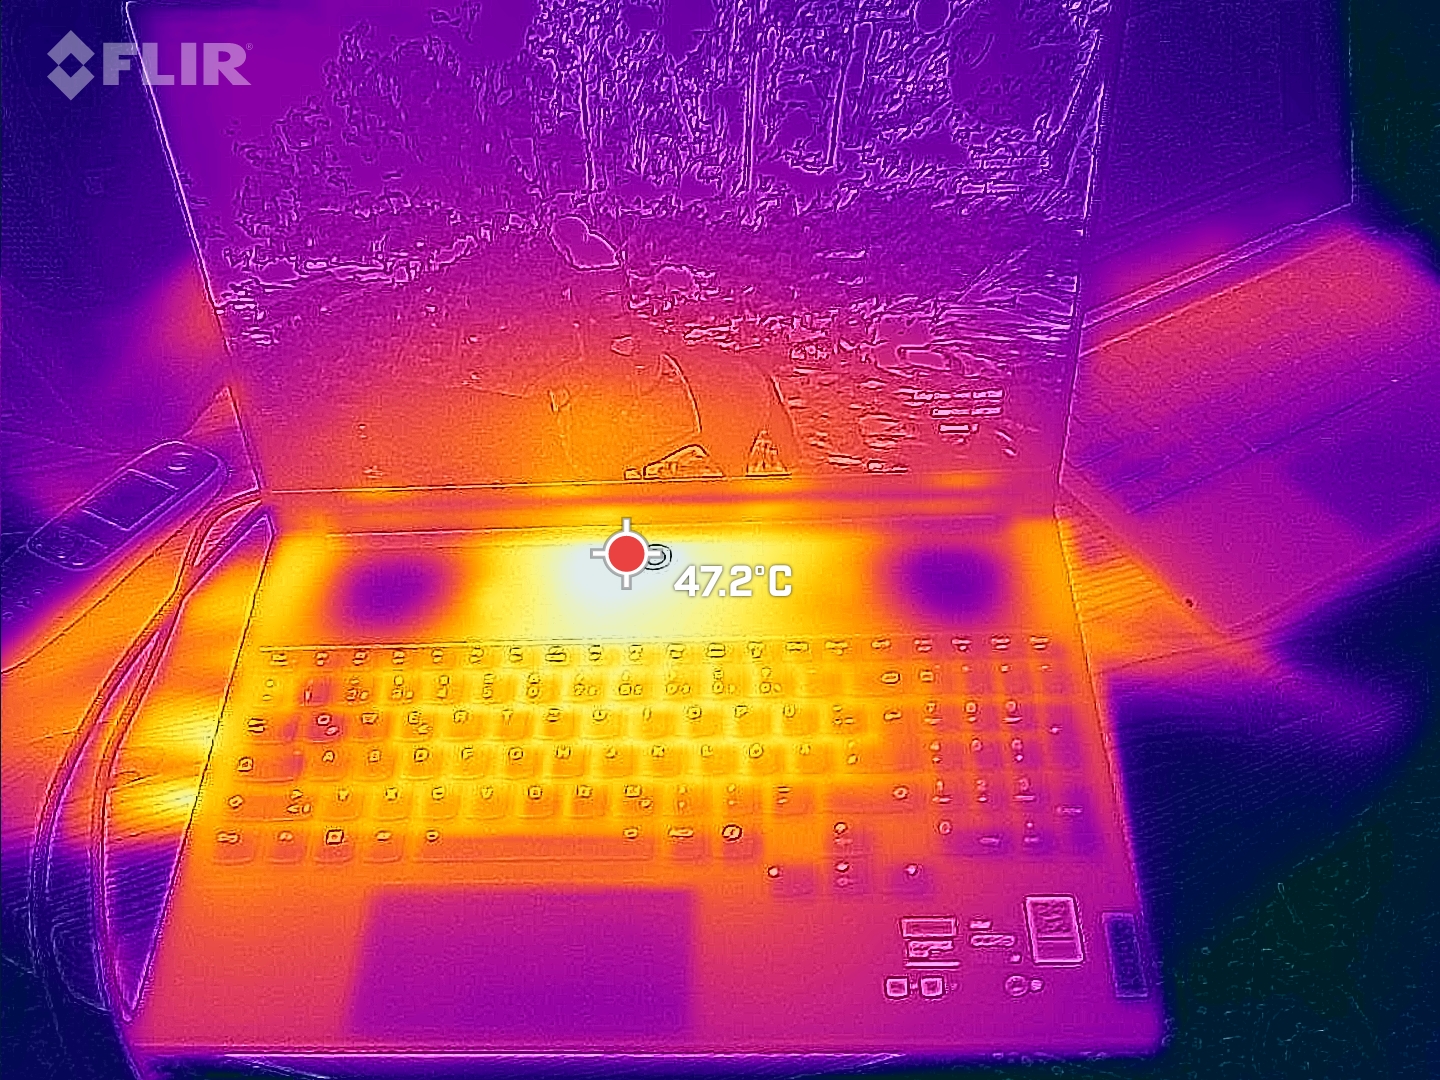
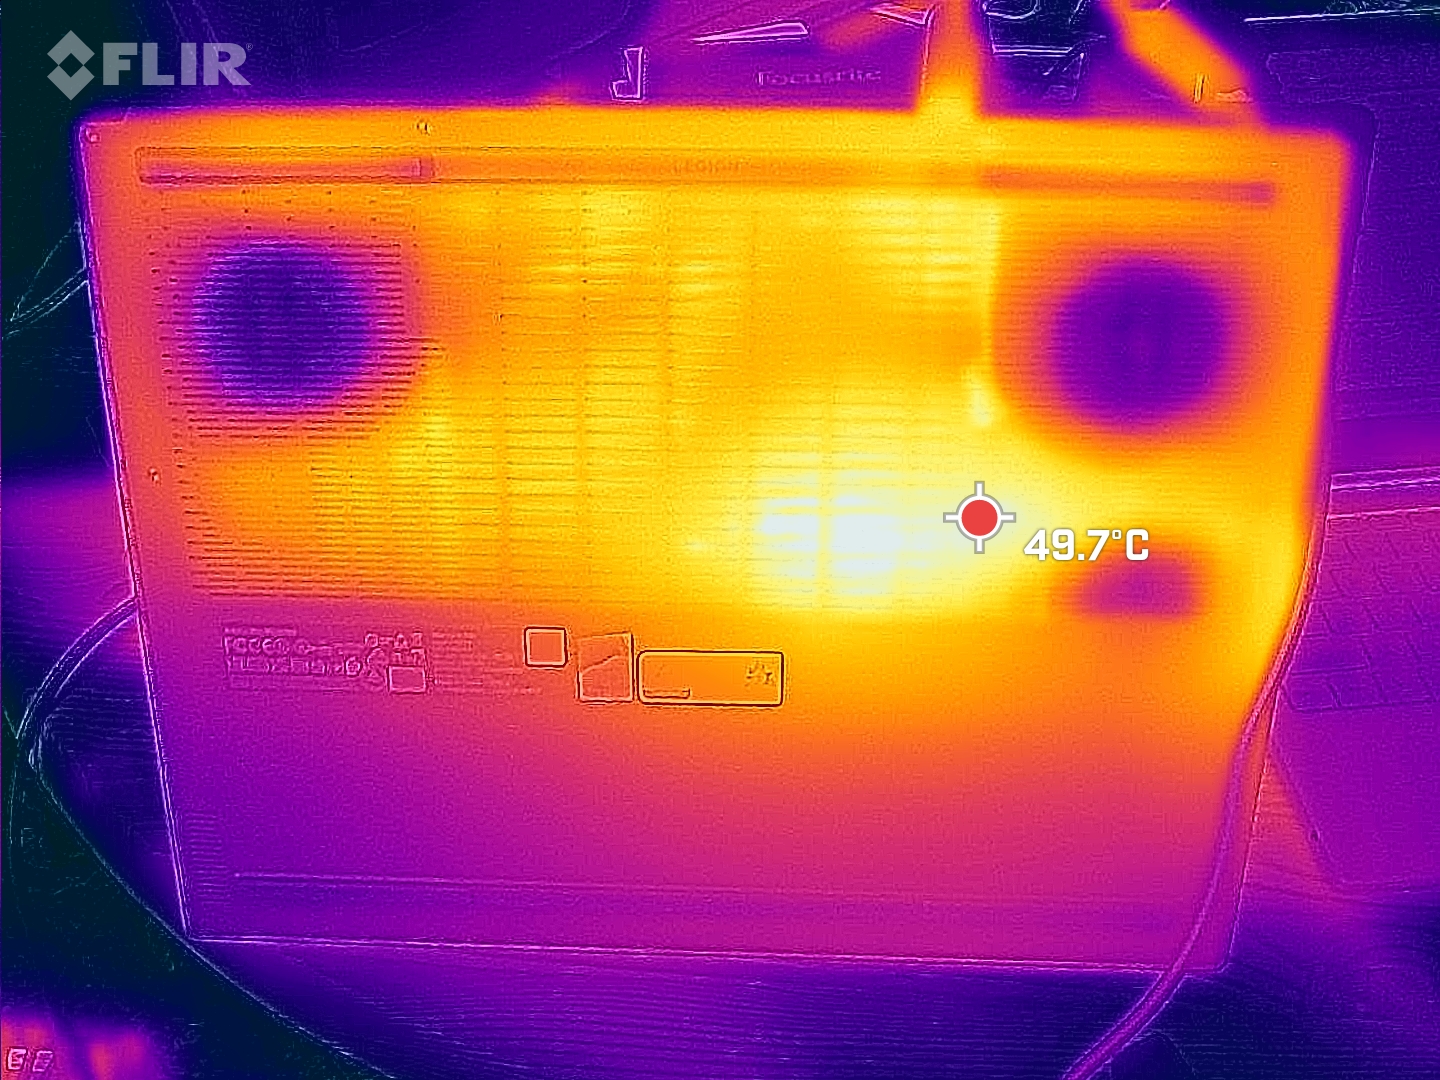
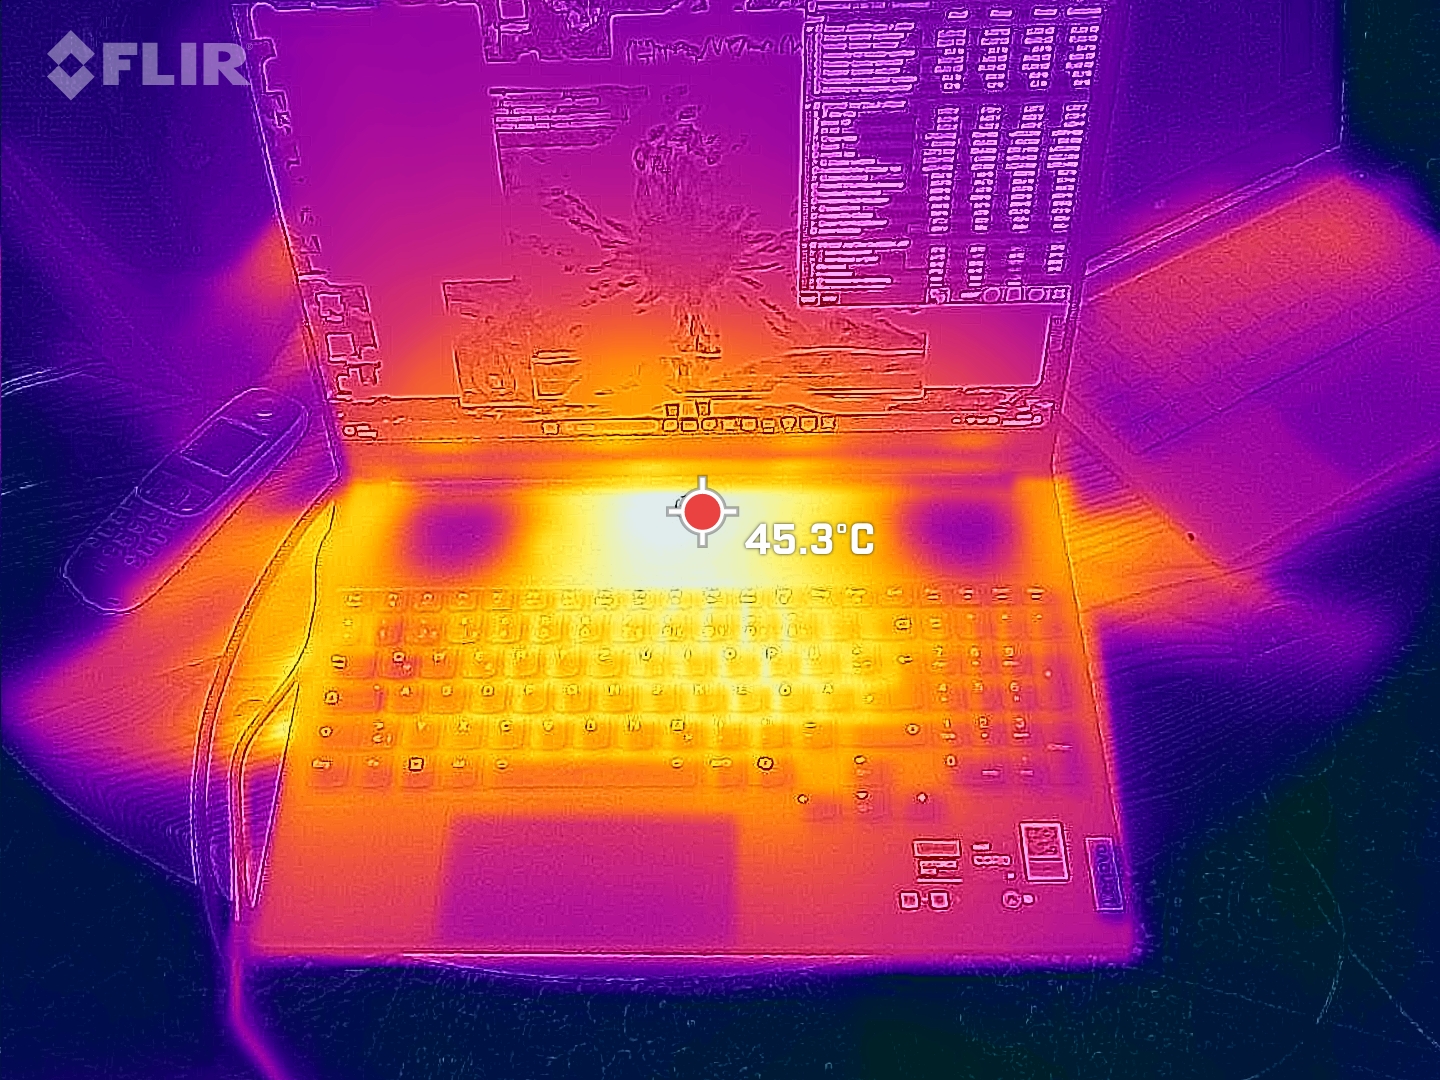
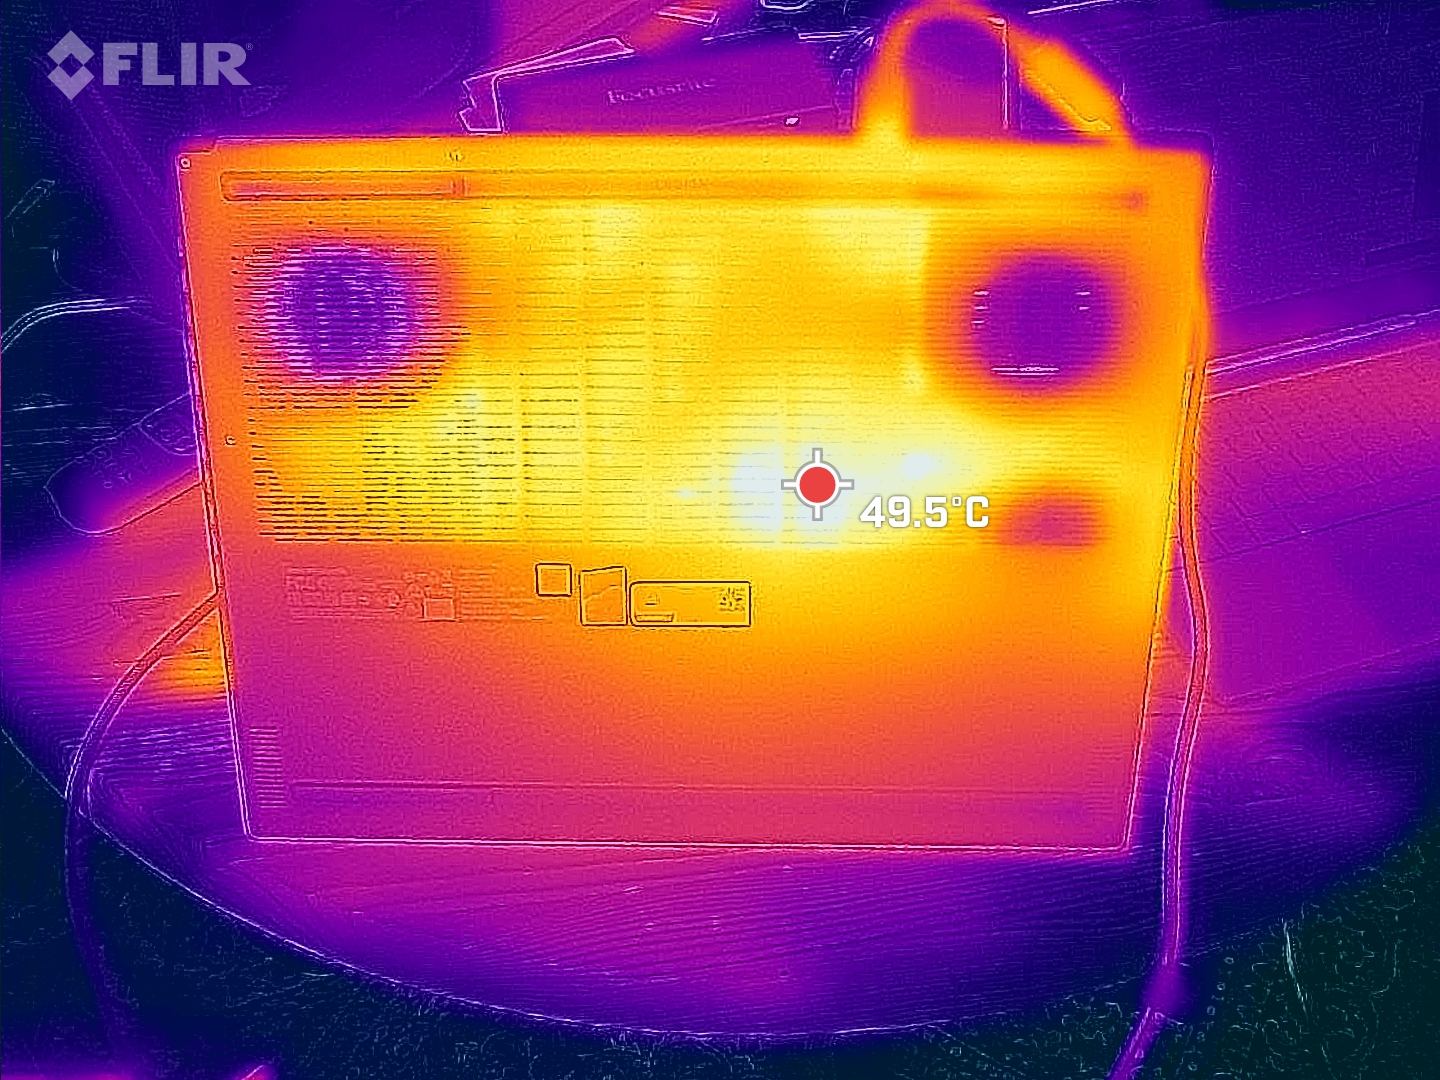
温度
尽管散热系统的噪音相当大,但相比之下,笔记本电脑的温度却相当高。在玩游戏和其他重负载时,发热点位于屏幕中央和屏幕附近。WASD 键周围的温度也很高,我们测得的温度为 46 °C。至少掌托的温度还可以。即使是它的前代产品在这方面也并不理想,但联想显然没有做出任何改进。
(-) The maximum temperature on the upper side is 56 °C / 133 F, compared to the average of 40.4 °C / 105 F, ranging from 21.2 to 68.8 °C for the class Gaming.
(-) The bottom heats up to a maximum of 53 °C / 127 F, compared to the average of 43.2 °C / 110 F
(±) In idle usage, the average temperature for the upper side is 33.6 °C / 92 F, compared to the device average of 33.9 °C / 93 F.
(-) Playing The Witcher 3, the average temperature for the upper side is 42.3 °C / 108 F, compared to the device average of 33.9 °C / 93 F.
(±) The palmrests and touchpad can get very hot to the touch with a maximum of 36 °C / 96.8 F.
(-) The average temperature of the palmrest area of similar devices was 28.9 °C / 84 F (-7.1 °C / -12.8 F).
| Lenovo Legion 9 16IRX9, RTX 4090 Intel Core i9-14900HX, NVIDIA GeForce RTX 4090 Laptop GPU | Lenovo Legion 9 16IRX8 Intel Core i9-13980HX, NVIDIA GeForce RTX 4090 Laptop GPU | Razer Blade 16 2024, RTX 4090 Intel Core i9-14900HX, NVIDIA GeForce RTX 4090 Laptop GPU | Alienware m18 R2 Intel Core i9-14900HX, NVIDIA GeForce RTX 4090 Laptop GPU | Asus ROG Strix Scar 18 G834JYR (2024) Intel Core i9-14900HX, NVIDIA GeForce RTX 4090 Laptop GPU | Medion Erazer Beast X40 2024 Intel Core i9-14900HX, NVIDIA GeForce RTX 4090 Laptop GPU | |
|---|---|---|---|---|---|---|
| Heat | 11% | 21% | 9% | 17% | 13% | |
| Maximum Upper Side * | 56 | 49.6 11% | 45 20% | 41.2 26% | 49 12% | 47 16% |
| Maximum Bottom * | 53 | 48.6 8% | 45 15% | 34.6 35% | 47 11% | 54 -2% |
| Idle Upper Side * | 38 | 33.2 13% | 29 24% | 42.8 -13% | 29 24% | 30 21% |
| Idle Bottom * | 39 | 34.2 12% | 30 23% | 43.6 -12% | 31 21% | 32 18% |
* ... smaller is better
发言人
音域非常线性,高音和中音非常均衡。不过,低音自然有所减弱,但仍可感知。扬声器的功率还可以再大一些,也就是音量再大一些。
Lenovo Legion 9 16IRX9, RTX 4090 audio analysis
(±) | speaker loudness is average but good (78.96 dB)
Bass 100 - 315 Hz
(±) | reduced bass - on average 13.2% lower than median
(±) | linearity of bass is average (8.9% delta to prev. frequency)
Mids 400 - 2000 Hz
(+) | balanced mids - only 3.2% away from median
(+) | mids are linear (3.4% delta to prev. frequency)
Highs 2 - 16 kHz
(+) | balanced highs - only 1.8% away from median
(+) | highs are linear (4% delta to prev. frequency)
Overall 100 - 16.000 Hz
(+) | overall sound is linear (11.3% difference to median)
Compared to same class
» 8% of all tested devices in this class were better, 3% similar, 89% worse
» The best had a delta of 6%, average was 18%, worst was 132%
Compared to all devices tested
» 6% of all tested devices were better, 2% similar, 92% worse
» The best had a delta of 4%, average was 24%, worst was 134%
Razer Blade 16 2024, RTX 4090 audio analysis
(±) | speaker loudness is average but good (81.16 dB)
Bass 100 - 315 Hz
(±) | reduced bass - on average 8.2% lower than median
(±) | linearity of bass is average (7.4% delta to prev. frequency)
Mids 400 - 2000 Hz
(+) | balanced mids - only 3.3% away from median
(+) | mids are linear (5.9% delta to prev. frequency)
Highs 2 - 16 kHz
(+) | balanced highs - only 1.6% away from median
(+) | highs are linear (3.1% delta to prev. frequency)
Overall 100 - 16.000 Hz
(+) | overall sound is linear (9.2% difference to median)
Compared to same class
» 3% of all tested devices in this class were better, 1% similar, 96% worse
» The best had a delta of 6%, average was 18%, worst was 132%
Compared to all devices tested
» 3% of all tested devices were better, 1% similar, 97% worse
» The best had a delta of 4%, average was 24%, worst was 134%
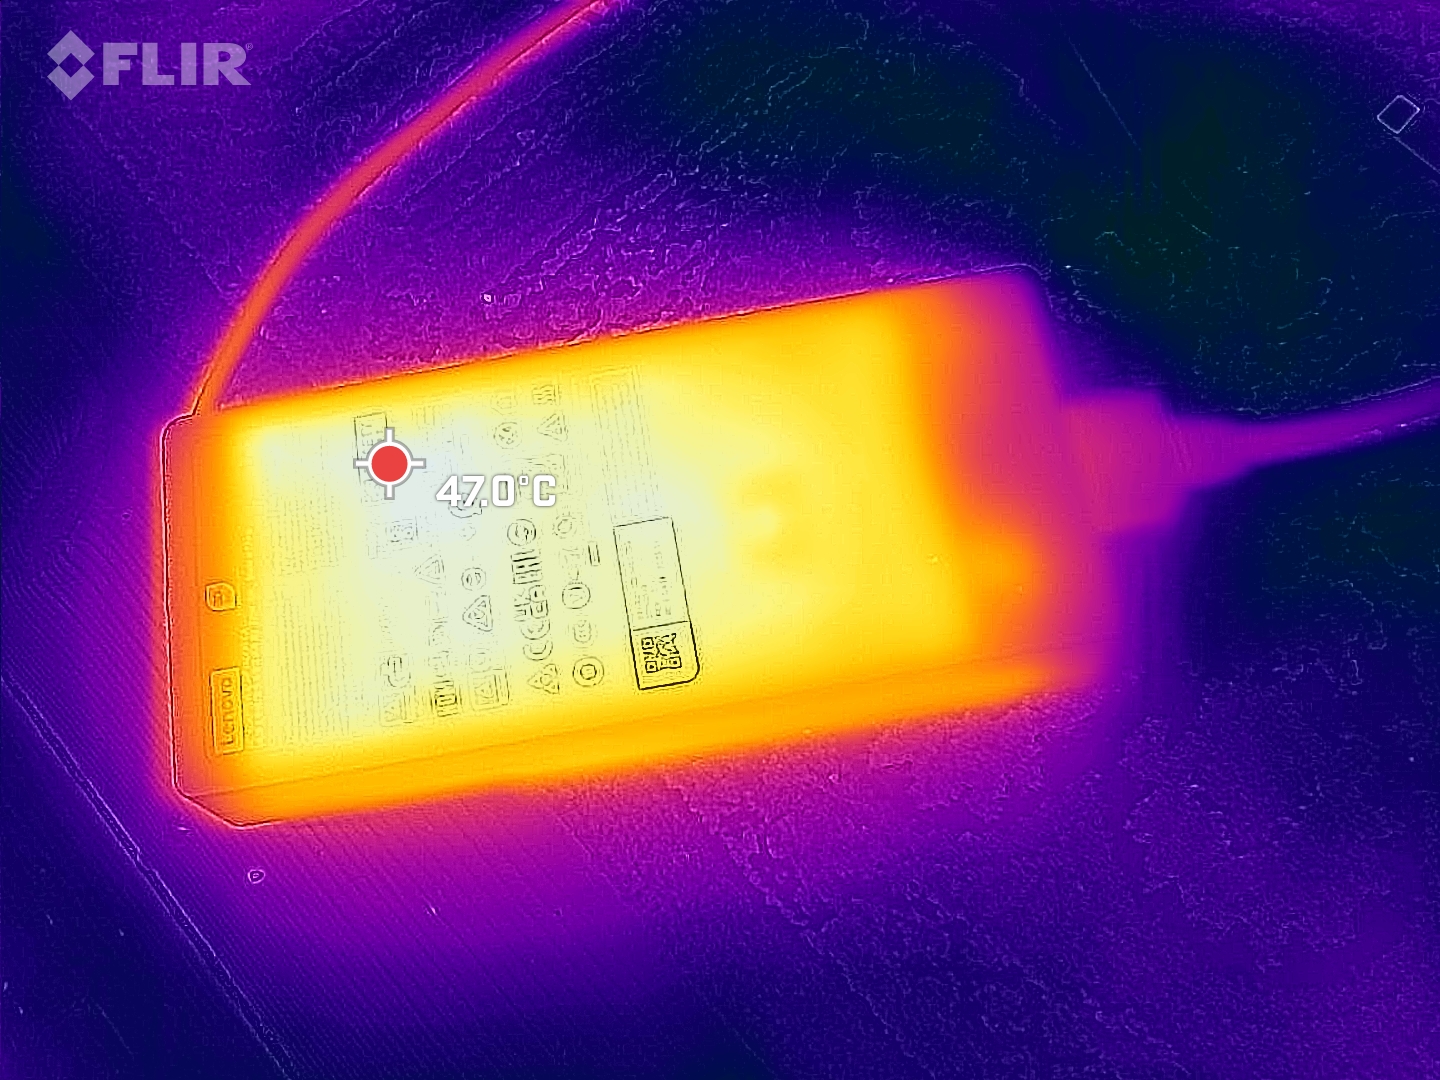
耗电量
与前代车型相比,其油耗可能略有改善,无论是怠速还是其他情况。不过,幅度并不大--即使是 18 英寸的竞争车型通常也更加节俭,至少在怠速时如此。
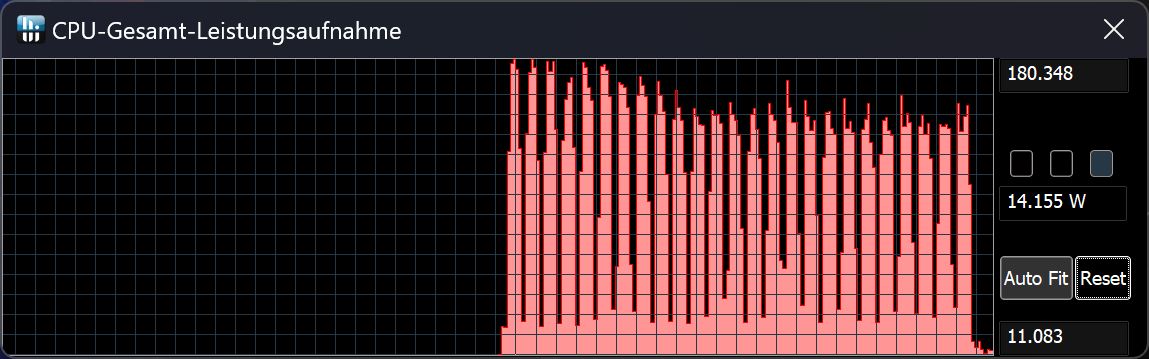
新款Legion 9 的所谓问题可以从其耗电量曲线图中再次看出,因为在各种测试中,它的耗电量(以及性能)不时出现短暂下降。在 Cinebench 23 或 Furmark 测试中,Cinebench 23 仍然正常。 Witcher 3或 Furmark 测试中不再正常。
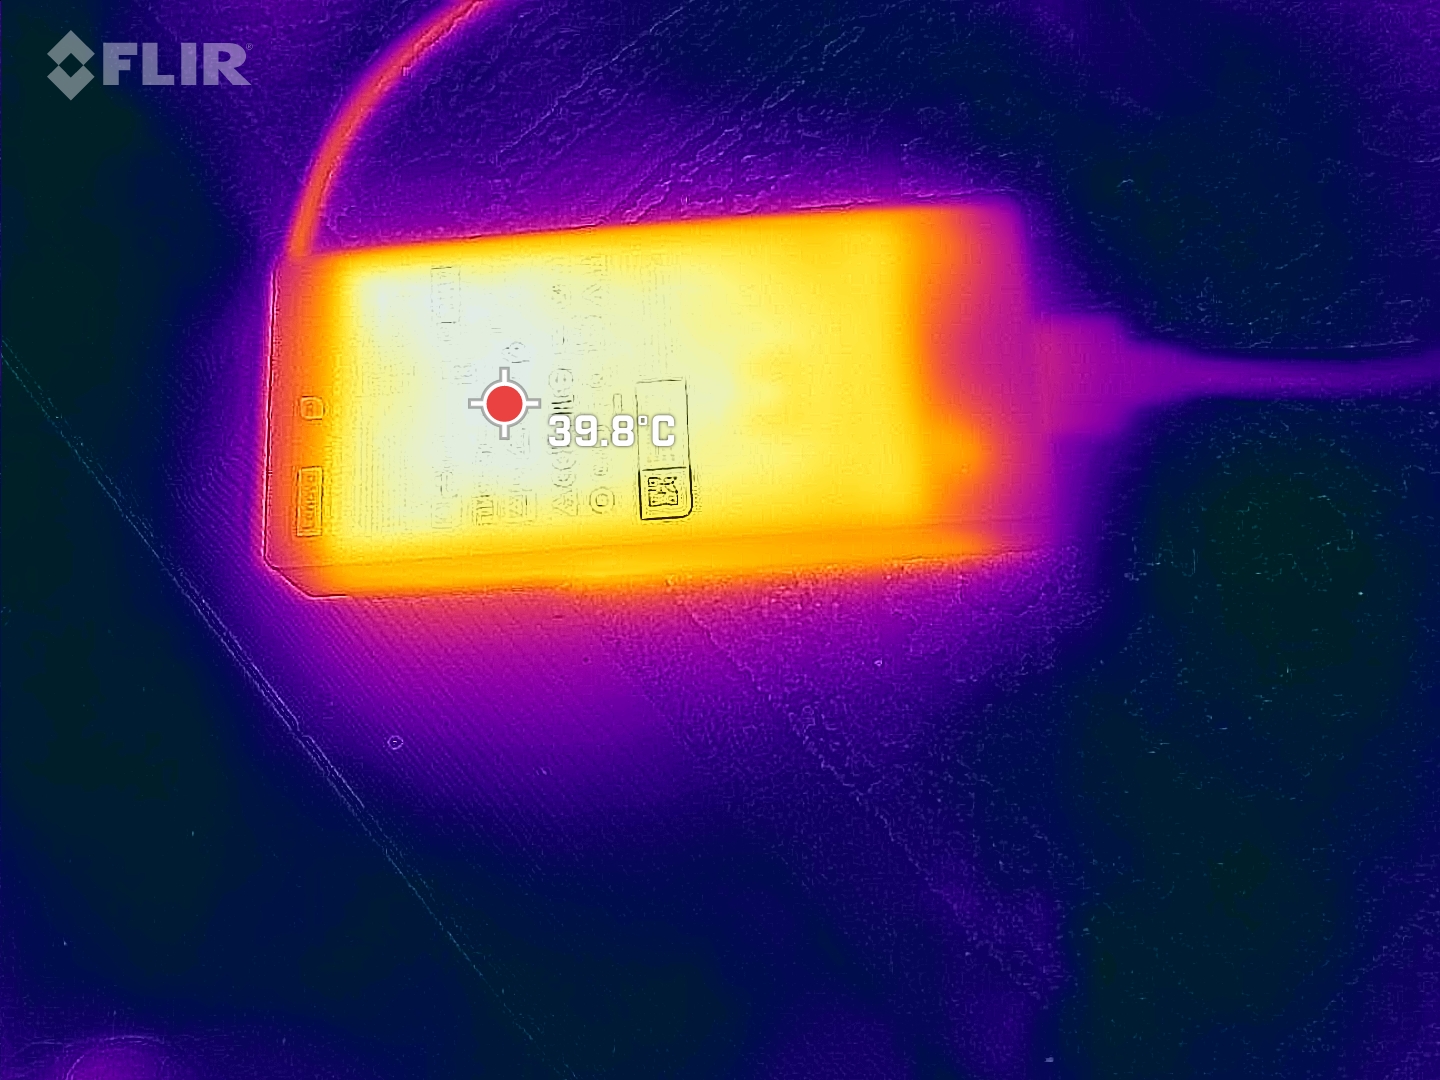
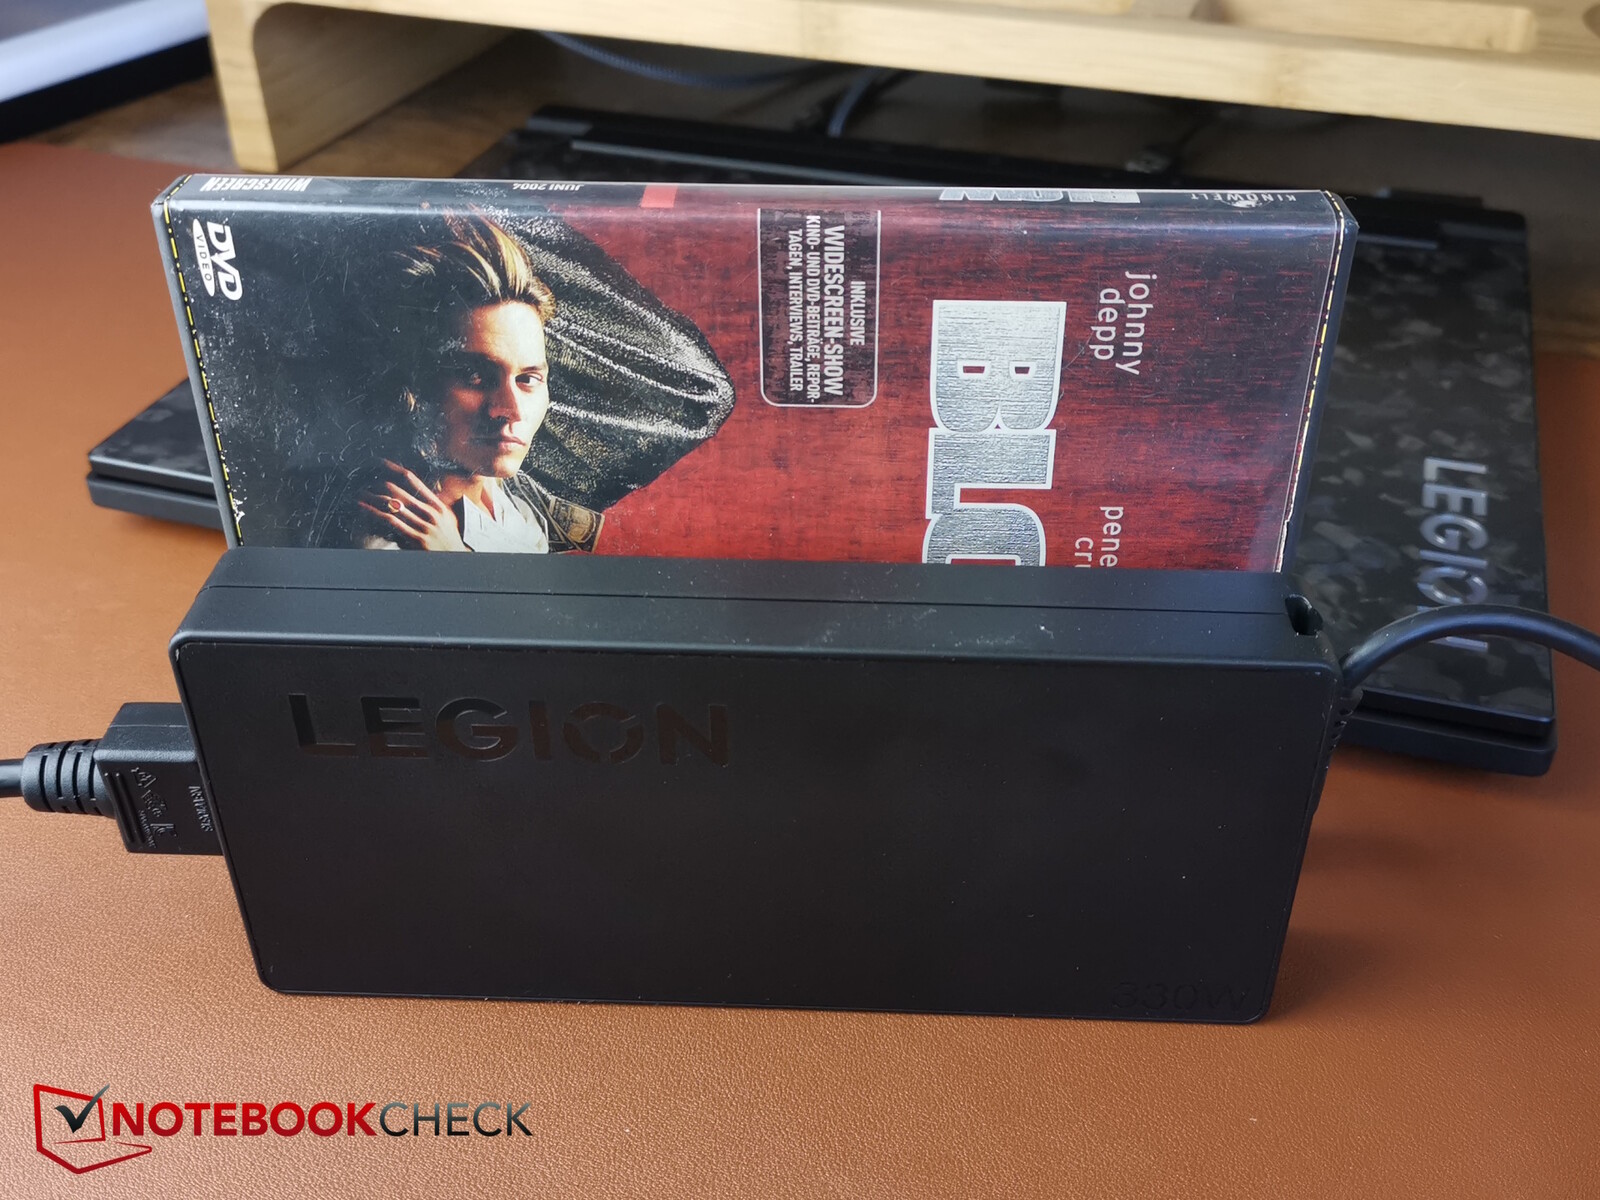
使用扁平且相对较小的电源装置,我们测得的短期最大功耗为 323 瓦。该装置的设计功率为 330 瓦,因此在任何情况下为笔记本电脑供电都不会有问题。
独一无二的功能:Legion 9 还配备了第二个电源装置,一个更小的 140 瓦 USB-C 电源装置。如果您不玩游戏,这个更小的适配器当然更适合外出使用。

| Off / Standby | |
| Idle | |
| Load |
|
Key:
min: | |
| Lenovo Legion 9 16IRX9, RTX 4090 i9-14900HX, NVIDIA GeForce RTX 4090 Laptop GPU, Micron 3400 2TB MTFDKBA2T0TFH, MiniLED, 3200x2000, 16" | Lenovo Legion 9 16IRX8 i9-13980HX, NVIDIA GeForce RTX 4090 Laptop GPU, 2x SK Hynix HFS001TEJ9X115N (RAID 0), Mini-LED, 3200x2000, 16" | Razer Blade 16 2024, RTX 4090 i9-14900HX, NVIDIA GeForce RTX 4090 Laptop GPU, Samsung PM9A1 MZVL22T0HBLB, OLED, 2560x1600, 16" | Asus ROG Strix Scar 18 G834JYR (2024) i9-14900HX, NVIDIA GeForce RTX 4090 Laptop GPU, Samsung PM9A1a MZVL22T0HDLB, Mini LED, 2560x1600, 18" | Medion Erazer Beast X40 2024 i9-14900HX, NVIDIA GeForce RTX 4090 Laptop GPU, Phison E18-1TB-PHISON-SSD-BICS5, IPS, 2560x1600, 17" | Average NVIDIA GeForce RTX 4090 Laptop GPU | Average of class Gaming | |
|---|---|---|---|---|---|---|---|
| Power Consumption | -34% | 12% | 11% | 13% | 1% | 22% | |
| Idle Minimum * | 20.5 | 32.3 -58% | 16.9 18% | 14 32% | 7 66% | 16.2 ? 21% | 13.6 ? 34% |
| Idle Average * | 27.7 | 42.6 -54% | 17.8 36% | 17 39% | 15 46% | 23.1 ? 17% | 19 ? 31% |
| Idle Maximum * | 32.1 | 57.9 -80% | 19.6 39% | 24 25% | 33 -3% | 34.2 ? -7% | 26.4 ? 18% |
| Load Average * | 105 | 121 -15% | 128 -22% | 143 -36% | 134 -28% | 130.5 ? -24% | 103.2 ? 2% |
| Witcher 3 ultra * | 246 | 254 -3% | 243 1% | 251 -2% | 280 -14% | ||
| Load Maximum * | 323 | 297.7 8% | 328 -2% | 302 7% | 294 9% | 324 ? -0% | 247 ? 24% |
* ... smaller is better
Power consumption Witcher 3 / stress test
Power consumption with external monitor
运行时间
内置电池的容量约为 100 Wh,与同类产品相近。不过,它的运行时间通常较短,这是它的前代产品和其他配备 MiniLED 屏幕的笔记本电脑已经遇到的问题。虽然运行时间有所改善,但对比设备(除 Alienware 笔记本电脑外)的电池运行时间更长。例如,同样采用 MiniLED 显示屏的华硕 ROG Scar Strix 也是如此。
尽管如此,在亮度降低到 150 尼特的情况下,也只够观看视频或上网 5 小时。而华硕设备的续航时间超过 6 小时。
联想笔记本电脑支持快速充电功能,首先需要在 Vantage 软件中激活该功能。之后,充满电只需一小时左右。
| Lenovo Legion 9 16IRX9, RTX 4090 i9-14900HX, NVIDIA GeForce RTX 4090 Laptop GPU, 99.99 Wh | Lenovo Legion 9 16IRX8 i9-13980HX, NVIDIA GeForce RTX 4090 Laptop GPU, 99.9 Wh | Razer Blade 16 2024, RTX 4090 i9-14900HX, NVIDIA GeForce RTX 4090 Laptop GPU, 95.2 Wh | Alienware m18 R2 i9-14900HX, NVIDIA GeForce RTX 4090 Laptop GPU, 97 Wh | Asus ROG Strix Scar 18 G834JYR (2024) i9-14900HX, NVIDIA GeForce RTX 4090 Laptop GPU, 90 Wh | Medion Erazer Beast X40 2024 i9-14900HX, NVIDIA GeForce RTX 4090 Laptop GPU, 99.8 Wh | Average of class Gaming | |
|---|---|---|---|---|---|---|---|
| Battery Runtime | -50% | 10% | 0% | 24% | 29% | 18% | |
| H.264 | 294 | 456 55% | 447 52% | 452 ? 54% | |||
| WiFi v1.3 | 290 | 159 -45% | 329 13% | 290 0% | 461 59% | 374 29% | 387 ? 33% |
| Load | 129 | 58 -55% | 79 -39% | 77 -40% | 84.7 ? -34% | ||
| Reader / Idle | 404 | 612 | 585 ? |
Pros
Cons
结论--问题比预想的要多
就其价格而言,联想Legion 9i 是一款高端游戏机,它拥有吸引人的设计、良好的用料、出色的制造质量以及配备 HDR1000 的明亮 Mini LED 显示屏。其竞争对手所没有的扁平式电源以及额外的 140 瓦 USB-C 电源可谓是进一步的加分项。
不过,虽然Legion 的较小机型以其良好的系统优化给人留下了深刻印象,但顶级机型的弱点和问题却比预期的要多得多。首先是延迟问题,这不仅在 LatencyMon 测试中表现明显,我们在测试内存延迟时也发现了这些问题,甚至在玩游戏时也能看到一些明显的掉帧现象。此外,它的单核性能也异常薄弱。另一个更大的问题是它的冷却系统不够理想。它的散热似乎太晚了,有时又太少,导致固态硬盘出现节流等现象。此外,在负载情况下,它的噪音非常大,而且不像竞争对手那样能有效防止表面温度过高。虽然电池续航时间有所改善,但仍不及竞争对手。因此,总的来说,它还有很大的改进空间。
Legion 9i 是一款时尚的高端游戏机,但与较小的Legion 机型不同的是,昂贵的高端机型最终会遭遇恼人的问题,如散热系统不理想和延迟问题严重。
比如,Razer Blade 16 就是一个替代品,它在更小的机箱内提供了与之相当的性能,而且没有Legion 9i 那么多问题。除此之外,它的前身实际上给人的感觉是一个更成熟的系统,而且由于后续机型的诸多问题,它甚至拥有更高的性能。因此,新的Legion 9i 目前并不值得购买。
2024 年 9 月更新:BIOS 更新已发布,修复了帧频问题。
价格和供应情况
我们配置的联想Legion 9 16IRX9 或联想Legion 9i 可以直接从联想购买,价格为3 804.66 美元。
注:我们最近更新了评级系统,第 8 版的结果与第 7 版的结果不具可比性。更多信息 此处.
Lenovo Legion 9 16IRX9, RTX 4090
- 09/27/2024 v8
Christian Hintze
 Total Sustainability Score:
 Transparency
The selection of devices to be reviewed is made by our editorial team. The test sample was provided to the author as a loan by the manufacturer or retailer for the purpose of this review. The lender had no influence on this review, nor did the manufacturer receive a copy of this review before publication. There was no obligation to publish this review. We never accept compensation or payment in return for our reviews. As an independent media company, Notebookcheck is not subjected to the authority of manufacturers, retailers or publishers.
This is how Notebookcheck is testing
Every year, Notebookcheck independently reviews hundreds of laptops and smartphones using standardized procedures to ensure that all results are comparable. We have continuously developed our test methods for around 20 years and set industry standards in the process. In our test labs, high-quality measuring equipment is utilized by experienced technicians and editors. These tests involve a multi-stage validation process. Our complex rating system is based on hundreds of well-founded measurements and benchmarks, which maintains objectivity. Further information on our test methods can be found here.
Price comparison

