


华硕 PrimeGeForce RTX 5080 OC 版评测:与RX 7900 XTX相比提升13%,与RTX 5080 FE相比价格提升30
没有擎天柱的擎天柱
华硕 PrimeGeForce RTX 5080 Founders Edition 是一款基于 Nvidia 最新 GB203 Blackwell GPU 的 SFF GPU。Prime RTX 5080 OC 的时钟频率略高于 RTX 5080 Founders Edition,但实际性能提升并不一定与标价相符。Vaidyanathan Subramaniam, 👁 Vaidyanathan Subramaniam (translated by DeepL / Ninh Duy) Published 🇺🇸 🇫🇷 ...
结论RTX 5080 SFF GPU 价值主张值得商榷
华硕今年做出了一个有趣的举动,将其传统上主打中端市场的 Prime 系列扩展到了旗舰 RTX 5080。PrimeGeForce RTX 5080 OC Edition 试图成为 Nvidia 自家 RTX 5080 Founders Edition 的有力替代品。
Prime RTX 5080 OC 采用简约而实用的设计,仅占用 2.5 个插槽,非常适合小型机(SFF)构建。
在原始性能方面,Prime RTX 5080 OC Edition 在合成基准测试和实际游戏场景中都比 RTX 5080 FE 略微提升了 2-3%。
与 Radeon RX 7900 XTX 相比,提升幅度更为明显,根据基准测试或游戏的不同,提升幅度在 10-13% 之间。
Prime RTX 5090 OC 还得益于 Nvidia 广受赞誉的软件堆栈,该显卡完全支持 Blackwell 架构最新的 DLSS 4 多帧生成功能。

华硕为 Prime RTX 5080 OC 配备了有效的散热解决方案,使显卡的热量和噪音排放保持在合理的水平。
虽然 Prime RTX 5080 OC 的性能不会出错,但也有一些需要注意的地方。与 RTX 5080 FE 相比,该显卡在游戏时的功耗可能略高,但帧数却没有明显提升。
16GB GDDR7 显存虽然比去年的 GDDR6X 显存快得多,但在某些要求较高的游戏中很快就会成为瓶颈,不过这也适用于所有 RTX 5080。
不过,Prime RTX 5080 OC 最有争议的地方在于它的定价。如果你能买到这款显卡,预计将比 RTX 5080 FE 的建议零售价(999 美元)高出 321 美元,而性能却几乎没有提升。
随着 RX 7900 XTX 显卡在最近大幅降价后恢复到原来的首发价格,以及基于 RDNA 4 的 Radeon RX 9070 XT 迫在眉睫,在花掉你的钱之前,等待并观察未来几周的定价动态变化可能会更好。
Pros
Cons
价格和供应情况
虽然 RTX 5080 Founders Edition(FE) 可能难以获得,但市场上并不缺乏板卡(AiB)合作伙伴。华硕在 ROG、TUF Gaming 和 Prime 类别下提供 RTX 50 系列 GPU。
Prime 系列专为小型(SFF)PC 构建而设计。该系列最初与 RTX 40 系列一起推出,但仅限于 RTX 4060 和 RTX 4070 GPU 及其修订版。今年,华硕将 Prime 系列扩展到 RTX 5080。
我们最近评测了华硕 TUF GamingGeForce RTX 5080 OC 。在本篇评测中,我们将对华硕 PrimeGeForce RTX 5080 OC 版进行评测,看看它与 RTX 5080 FE 相比有何不同。
PrimeGeForce RTX 5080 OC 与其他 Nvidia GPU 的比较
| 规格 | RTX 5090 FE | Prime RTX 5080 OC | RTX 5080FE | RTX 4090 FE | RTX 4080 Super FE | RTX4080FE | Asus TUF RTX 4070 TiSuper | RTX 4070 Super FE | KFA2 RTX4060 Ti EX | RTX 3090 TiFE | RTX 3090 FE | RTX 3080 TiFE |
|---|---|---|---|---|---|---|---|---|---|---|---|---|
| 芯片 | GB202 | GB203 | GB203 | AD102 | AD103 | AD103 | AD103 | AD104 | AD106 | GA102 | GA102 | GA102 |
| FinFET 工艺 | 定制 4N | 定制 4N | 定制 4N | 定制 4N | 定制 4N | 定制 4N | 定制 4N | 定制 4N | 定制 4N | 8 纳米 | 8 纳米 | 8 纳米 |
| CUDA 内核 | 21,760 | 10,752 | 10,752 | 16,384 | 10,240 | 9,728 | 8,448 | 7,168 | 4,352 | 10,752 | 10,496 | 10,240 |
| 纹理单元 | 680 | 336 | 336 | 512 | 320 | 304 | 264 | 224 | 136 | 336 | 328 | 320 |
| 张量核 | 680 第 5 代 | 336 第5 代 | 336 第 5 代 | 512 第 4 代 | 320 第 4 代 | 304 第 4 代 | 264 第 4 代 | 224 第 4 代 | 136 第 4 代 | 336 第 3 代 | 328 第 3 代 | 320 第 3 代 |
| RT 核心 | 170 第 4 代 | 84 第 4代 | 84 第 4 代 | 128 第 3 代 | 80 第 3 代 | 76 第 3 代 | 66 第 3 代 | 56 第 3 代 | 34 第 3 代 | 84 第 2 代 | 82 第 2 代 | 80 第 2 代 |
| GPU 基本时钟 | 2,017 MHz | 2,295 MHz | 2,295 MHz | 2,235 MHz | 2,295 MHz | 2,205 MHz | 2,340 MHz | 1,980 MHz | 2,310 MHz | 1,560 MHz | 1,395 MHz | 1,365 MHz |
| GPU 提升时钟 | 2,407 MHz | 2,655 MHz / 2,685 MHz (OC 模式) | 2,617 MHz | 2,520 MHz | 2,550 MHz | 2,505 MHz | 2,610 MHz | 2,475 MHz | 2,535 MHz | 1,860 MHz | 1,695 MHz | 1,665 MHz |
| 内存总线 | 512 位 | 256 位 | 256 位 | 384 位 | 256 位 | 256 位 | 256 位 | 192 位 | 128 位 | 384 位 | 384 位 | 384 位 |
| 内存带宽 | 1.79 TB/s | 960GB/s | 960 GB/s | 1,008 GB/s | 736.3 GB/s | 716.8 GB/s | 672 GB/s | 504 GB/s | 288 GB/s | 1,008 GB/s | 936 GB/s | 912 GB/s |
| 显存 | 32 GB GDDR7 | 16 GB GDDR7 | 16 GB GDDR7 | 24 GB GDDR6X | 16 GB GDDR6X | 16 GB GDDR6X | 16 GB GDDR6X | 12 GB GDDR6X | 8 GB GDDR6 | 24 GB GDDR6X | 24 GB GDDR6X | 12 GB GDDR6X |
| 功耗 | 575 W | 360 W | 360 W | 450 W | 320 W | 320 W | 285 W | 220 W | 160 W | 450 W | 350 W | 350 W |
快速浏览华硕 PrimeGeForce RTX 5080 OC 版
PrimeGeForce RTX 5080 OC 的尺寸为 304 x 126 x 50 毫米,比 RTX 5080 FE 稍厚。不过,它仍然是一款 SFF 显卡,仅占用 2.5 个插槽。
前护罩由高质量塑料制成,但我们希望它能更坚固一些,并辅以金属背板。
GeForce RTX "和 "PRIME "标识醒目地显示在前护罩上,但周围没有任何 RGB 标识。


Prime RTX 5080 OC 与市面上绝大多数 GPU 一样,提供典型的显示接口阵列。三个 DisplayPort 接口现在终于支持 DisplayPort 2.1b 标准。
与提供 2x HDMI 输出的 TUF Gaming 系列不同,Prime RTX 5080 OC 只提供一个 HDMI 2.1b 输出。
12VHPWR 连接器可为显卡提供所需的电源。华硕随附了一个 12VHPWR 至 3x 8 针适配器,可用于不兼容 ATX 3.x 的电源。
与其他华硕显卡类似,12VHPWR 接口旁边的 LED 指示灯会亮起红灯,以指示适配器连接不当或电源不足。
Prime RTX 5080 OC 具有双 BIOS 模式开关,可在性能模式和静音模式之间切换。我们使用性能模式进行了所有基准测试,并比较了两种模式下的风扇噪音水平。


在包装盒中,您还会得到许多配件,包括以下内容:
- 使用手册
- 魔术粘扣带
- 感谢卡
- 快速入门指南
- 12VHPWR 至 3x 8 针适配器电缆
没有像 TUF Gaming 系列那样提供集成螺丝刀的 GPU 固定器,这可能是由于显卡外形小巧的缘故。
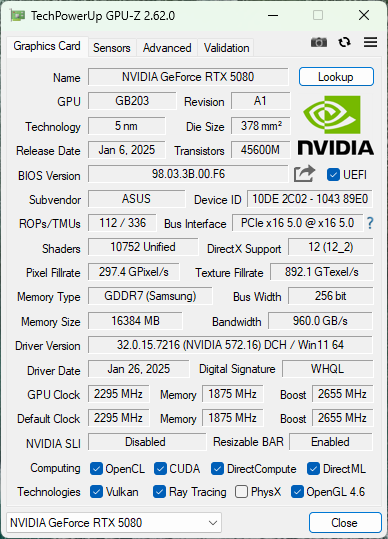
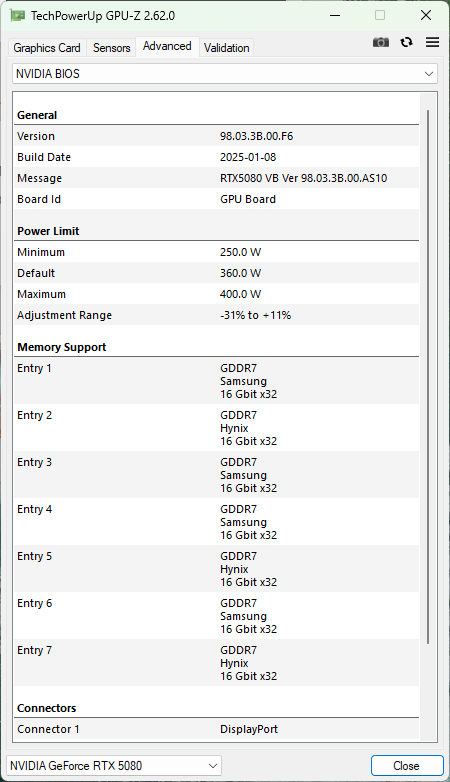
PrimeGeForce RTX 5080 OC 的默认提升频率为 2,655 MHz,比 Founders Edition 快了 38 MHz,但总显卡功耗(TGP)仍为 360 W。在性能模式下,该显卡可进一步提升至 2,685 MHz 的峰值。
功耗限制可额外增加 11%,最大 TGP 为 400 W。
测试台:Prime RTX 5080 OC 与酷睿 i9-14900K 完美搭配
我们在当前的测试台中使用了以下组件:
- Cooler Master MasterFrame 700 开放式测试台
- 英特尔酷睿 i9-14900K在 BIOS 中设置了英特尔极致配置文件
- 技嘉 Z790 Aorus Master 主板
- Sabrent Rocket 4 Plus Gen4 2 TB NVMe SSD 和 2x Crucial MX500 1 TB SATA SSD,用于操作系统、基准测试和游戏
- 2x 16 GB Kingston Fury Renegade DDR5-6400 内存,定时 32-39-39-80,电压 1.40 V
- Alienware AW3225QF 4K 240 Hz QD-OLED 显示器
- 曜越 TH420 V2 Ultra EX ARGBAiO 散热器
- Cooler Master MVE Gold V2 1250 ATX 3.0 全模块化电源
使用带有最新补丁的 Windows 11 24H2,以及向媒体发布的 Nvidia Game Ready 驱动程序 572.16 版本。
我们要感谢 Cooler Master 提供的测试台和 PSU、技嘉提供的主板、Sabrent 提供的 SSD、戴尔提供的 Alienware 显示器、曜越提供的 AiO 散热器、金士顿提供的 DDR5 内存套件,以及华硕提供的 Prime RTX 5080 Gaming OC Edition GPU。
合成基准测试:以微弱优势领先 RTX 5080 FE
华硕 PrimeGeForce RTX 5080 OC Edition 在合成基准测试中的表现与 RTX 5080 FE 大致相同。在累积 3DMark 和 Unigine 测试中,稍高的提升仅转化为 2% 的优势。
与此同时,蓝宝石 Pulse Radeon RX 7900 XTX 在 3DMarkFire Strike Graphics 中比 Prime RTX 5080 OC 提升了 4%,但在涉及光线追踪的 Port Royal 和 Speed Way 测试中却被击败。
| Performance Rating - Percent | |
| NVIDIA GeForce RTX 5090 Founders Edition | |
| NVIDIA GeForce RTX 4090 | |
| Asus Prime GeForce RTX 5080 OC Edition | |
| NVIDIA GeForce RTX 5080 Founders Edition | |
| Sapphire Pulse AMD Radeon RX 7900 XTX | |
| NVIDIA GeForce RTX 4080 Founders Edition | |
| Sapphire Pulse AMD Radeon RX 7900 XT | |
| 3DMark | |
| 1920x1080 Fire Strike Graphics | |
| NVIDIA GeForce RTX 5090 Founders Edition | |
| NVIDIA GeForce RTX 4090 | |
| Sapphire Pulse AMD Radeon RX 7900 XTX | |
| Asus Prime GeForce RTX 5080 OC Edition | |
| Sapphire Pulse AMD Radeon RX 7900 XT | |
| NVIDIA GeForce RTX 5080 Founders Edition | |
| NVIDIA GeForce RTX 4080 Founders Edition | |
| Fire Strike Extreme Graphics | |
| NVIDIA GeForce RTX 5090 Founders Edition | |
| NVIDIA GeForce RTX 4090 | |
| Asus Prime GeForce RTX 5080 OC Edition | |
| NVIDIA GeForce RTX 5080 Founders Edition | |
| Sapphire Pulse AMD Radeon RX 7900 XTX | |
| Sapphire Pulse AMD Radeon RX 7900 XT | |
| NVIDIA GeForce RTX 4080 Founders Edition | |
| 3840x2160 Fire Strike Ultra Graphics | |
| NVIDIA GeForce RTX 5090 Founders Edition | |
| NVIDIA GeForce RTX 4090 | |
| Asus Prime GeForce RTX 5080 OC Edition | |
| NVIDIA GeForce RTX 5080 Founders Edition | |
| Sapphire Pulse AMD Radeon RX 7900 XTX | |
| Sapphire Pulse AMD Radeon RX 7900 XT | |
| NVIDIA GeForce RTX 4080 Founders Edition | |
| 2560x1440 Port Royal Graphics | |
| NVIDIA GeForce RTX 5090 Founders Edition | |
| NVIDIA GeForce RTX 4090 | |
| Asus Prime GeForce RTX 5080 OC Edition | |
| NVIDIA GeForce RTX 5080 Founders Edition | |
| NVIDIA GeForce RTX 4080 Founders Edition | |
| Sapphire Pulse AMD Radeon RX 7900 XTX | |
| Sapphire Pulse AMD Radeon RX 7900 XT | |
| 2560x1440 Speed Way Score | |
| NVIDIA GeForce RTX 5090 Founders Edition | |
| NVIDIA GeForce RTX 4090 | |
| Asus Prime GeForce RTX 5080 OC Edition | |
| NVIDIA GeForce RTX 5080 Founders Edition | |
| NVIDIA GeForce RTX 4080 Founders Edition | |
| Sapphire Pulse AMD Radeon RX 7900 XTX | |
| Sapphire Pulse AMD Radeon RX 7900 XT | |
| Steel Nomad Score | |
| NVIDIA GeForce RTX 5090 Founders Edition | |
| NVIDIA GeForce RTX 4090 | |
| NVIDIA GeForce RTX 5080 Founders Edition | |
| Asus Prime GeForce RTX 5080 OC Edition | |
| Sapphire Pulse AMD Radeon RX 7900 XTX | |
| NVIDIA GeForce RTX 4080 Founders Edition | |
| Sapphire Pulse AMD Radeon RX 7900 XT | |
| 2560x1440 Time Spy Graphics | |
| NVIDIA GeForce RTX 5090 Founders Edition | |
| NVIDIA GeForce RTX 4090 | |
| Asus Prime GeForce RTX 5080 OC Edition | |
| NVIDIA GeForce RTX 5080 Founders Edition | |
| Sapphire Pulse AMD Radeon RX 7900 XTX | |
| Sapphire Pulse AMD Radeon RX 7900 XT | |
| NVIDIA GeForce RTX 4080 Founders Edition | |
| Unigine Heaven 4.0 - Extreme Preset DX11 | |
| NVIDIA GeForce RTX 5090 Founders Edition | |
| NVIDIA GeForce RTX 4090 | |
| Asus Prime GeForce RTX 5080 OC Edition | |
| NVIDIA GeForce RTX 5080 Founders Edition | |
| Sapphire Pulse AMD Radeon RX 7900 XTX | |
| NVIDIA GeForce RTX 4080 Founders Edition | |
| Sapphire Pulse AMD Radeon RX 7900 XT | |
| Unigine Valley 1.0 - 1920x1080 Extreme HD DirectX AA:x8 | |
| Sapphire Pulse AMD Radeon RX 7900 XTX | |
| Sapphire Pulse AMD Radeon RX 7900 XT | |
| Asus Prime GeForce RTX 5080 OC Edition | |
| NVIDIA GeForce RTX 4090 | |
| NVIDIA GeForce RTX 5090 Founders Edition | |
| NVIDIA GeForce RTX 4080 Founders Edition | |
| NVIDIA GeForce RTX 5080 Founders Edition | |
| Unigine Superposition | |
| 3840x2160 4k Optimized | |
| NVIDIA GeForce RTX 5090 Founders Edition | |
| NVIDIA GeForce RTX 4090 | |
| Asus Prime GeForce RTX 5080 OC Edition | |
| NVIDIA GeForce RTX 5080 Founders Edition | |
| Sapphire Pulse AMD Radeon RX 7900 XTX | |
| NVIDIA GeForce RTX 4080 Founders Edition | |
| Sapphire Pulse AMD Radeon RX 7900 XT | |
| 7680x4320 8k Optimized | |
| NVIDIA GeForce RTX 5090 Founders Edition | |
| NVIDIA GeForce RTX 4090 | |
| Asus Prime GeForce RTX 5080 OC Edition | |
| NVIDIA GeForce RTX 5080 Founders Edition | |
| Sapphire Pulse AMD Radeon RX 7900 XTX | |
| NVIDIA GeForce RTX 4080 Founders Edition | |
| Sapphire Pulse AMD Radeon RX 7900 XT | |
| 3DMark Fire Strike Score | 48491 points | |
| 3DMark Fire Strike Extreme Score | 36605 points | |
| 3DMark Time Spy Score | 30376 points | |
| 3DMark Steel Nomad Score | 7979 points | |
Help | ||
人工智能和计算性能:大幅超越 Radeon RX 7900 XTX
在 MLPerf AI 基准测试中,PrimeGeForce RTX 5080 OC 再次以毫厘之差领先 RTX 5080 FE。
Prime RTX 5080 OC 和 RTX 5080 FE 完成 Blender 3.3 Classroom CUDA 和 Classroom Optix 渲染所需的时间相同,而在 V-Ray 测试中没有实际差异。
AMD 显卡在 CUDA 和 RTX 基准测试中明显处于劣势,但 Radeon RX 7900 XTX 在某些 ComputeMark 子测试中击败了两款 RTX 5080 型号。
| MLPerf Client 0.5 - overall generation rate | |
| NVIDIA GeForce RTX 5090 Founders Edition | |
| NVIDIA GeForce RTX 4090 | |
| Asus Prime GeForce RTX 5080 OC Edition | |
| NVIDIA GeForce RTX 5080 Founders Edition | |
| Sapphire Pulse AMD Radeon RX 7900 XTX | |
| NVIDIA GeForce RTX 4080 Founders Edition | |
| Sapphire Pulse AMD Radeon RX 7900 XT | |
| Blender | |
| v3.3 Classroom CUDA | |
| NVIDIA GeForce RTX 4080 Founders Edition | |
| NVIDIA GeForce RTX 5080 Founders Edition | |
| Asus Prime GeForce RTX 5080 OC Edition | |
| NVIDIA GeForce RTX 4090 | |
| NVIDIA GeForce RTX 5090 Founders Edition | |
| v3.3 Classroom OPTIX/RTX | |
| NVIDIA GeForce RTX 4080 Founders Edition | |
| NVIDIA GeForce RTX 5080 Founders Edition | |
| Asus Prime GeForce RTX 5080 OC Edition | |
| NVIDIA GeForce RTX 4090 | |
| NVIDIA GeForce RTX 5090 Founders Edition | |
| V-Ray Benchmark Next 4.10 - GPU | |
| NVIDIA GeForce RTX 5090 Founders Edition | |
| NVIDIA GeForce RTX 4090 | |
| NVIDIA GeForce RTX 5080 Founders Edition | |
| Asus Prime GeForce RTX 5080 OC Edition | |
| NVIDIA GeForce RTX 4080 Founders Edition | |
| Sapphire Pulse AMD Radeon RX 7900 XTX | |
| Sapphire Pulse AMD Radeon RX 7900 XT | |
| V-Ray 5 Benchmark | |
| GPU CUDA | |
| NVIDIA GeForce RTX 5090 Founders Edition | |
| NVIDIA GeForce RTX 4090 | |
| Asus Prime GeForce RTX 5080 OC Edition | |
| NVIDIA GeForce RTX 5080 Founders Edition | |
| NVIDIA GeForce RTX 4080 Founders Edition | |
| Sapphire Pulse AMD Radeon RX 7900 XTX | |
| Sapphire Pulse AMD Radeon RX 7900 XT | |
| GPU RTX | |
| NVIDIA GeForce RTX 5090 Founders Edition | |
| NVIDIA GeForce RTX 4090 | |
| NVIDIA GeForce RTX 5080 Founders Edition | |
| Asus Prime GeForce RTX 5080 OC Edition | |
| NVIDIA GeForce RTX 4080 Founders Edition | |
| ComputeMark v2.1 | |
| 1024x600 Normal, Score | |
| NVIDIA GeForce RTX 5090 Founders Edition | |
| NVIDIA GeForce RTX 4090 | |
| Asus Prime GeForce RTX 5080 OC Edition | |
| NVIDIA GeForce RTX 5080 Founders Edition | |
| Sapphire Pulse AMD Radeon RX 7900 XTX | |
| Sapphire Pulse AMD Radeon RX 7900 XT | |
| NVIDIA GeForce RTX 4080 Founders Edition | |
| 1024x600 Normal, Fluid 3DTex | |
| NVIDIA GeForce RTX 5090 Founders Edition | |
| Asus Prime GeForce RTX 5080 OC Edition | |
| NVIDIA GeForce RTX 5080 Founders Edition | |
| NVIDIA GeForce RTX 4090 | |
| Sapphire Pulse AMD Radeon RX 7900 XTX | |
| Sapphire Pulse AMD Radeon RX 7900 XT | |
| NVIDIA GeForce RTX 4080 Founders Edition | |
| 1024x600 Normal, Fluid 2DTexArr | |
| NVIDIA GeForce RTX 5090 Founders Edition | |
| Sapphire Pulse AMD Radeon RX 7900 XTX | |
| Sapphire Pulse AMD Radeon RX 7900 XT | |
| Asus Prime GeForce RTX 5080 OC Edition | |
| NVIDIA GeForce RTX 5080 Founders Edition | |
| NVIDIA GeForce RTX 4090 | |
| NVIDIA GeForce RTX 4080 Founders Edition | |
| 1024x600 Normal, Mandel Vector | |
| NVIDIA GeForce RTX 5090 Founders Edition | |
| Sapphire Pulse AMD Radeon RX 7900 XTX | |
| NVIDIA GeForce RTX 4090 | |
| Asus Prime GeForce RTX 5080 OC Edition | |
| NVIDIA GeForce RTX 5080 Founders Edition | |
| Sapphire Pulse AMD Radeon RX 7900 XT | |
| NVIDIA GeForce RTX 4080 Founders Edition | |
| 1024x600 Normal, Mandel Scalar | |
| NVIDIA GeForce RTX 5090 Founders Edition | |
| NVIDIA GeForce RTX 4090 | |
| Sapphire Pulse AMD Radeon RX 7900 XTX | |
| Asus Prime GeForce RTX 5080 OC Edition | |
| NVIDIA GeForce RTX 5080 Founders Edition | |
| Sapphire Pulse AMD Radeon RX 7900 XT | |
| NVIDIA GeForce RTX 4080 Founders Edition | |
| 1024x600 Normal, QJuliaRayTrace | |
| NVIDIA GeForce RTX 5090 Founders Edition | |
| NVIDIA GeForce RTX 4090 | |
| Asus Prime GeForce RTX 5080 OC Edition | |
| NVIDIA GeForce RTX 5080 Founders Edition | |
| NVIDIA GeForce RTX 4080 Founders Edition | |
| Sapphire Pulse AMD Radeon RX 7900 XTX | |
| Sapphire Pulse AMD Radeon RX 7900 XT | |
| LuxMark v2.0 64Bit | |
| Room GPUs-only | |
| NVIDIA GeForce RTX 5090 Founders Edition | |
| NVIDIA GeForce RTX 4090 | |
| Asus Prime GeForce RTX 5080 OC Edition | |
| NVIDIA GeForce RTX 5080 Founders Edition | |
| NVIDIA GeForce RTX 4080 Founders Edition | |
| Sapphire Pulse AMD Radeon RX 7900 XTX | |
| Sapphire Pulse AMD Radeon RX 7900 XT | |
| Sala GPUs-only | |
| NVIDIA GeForce RTX 5090 Founders Edition | |
| NVIDIA GeForce RTX 4090 | |
| Asus Prime GeForce RTX 5080 OC Edition | |
| NVIDIA GeForce RTX 5080 Founders Edition | |
| NVIDIA GeForce RTX 4080 Founders Edition | |
| Sapphire Pulse AMD Radeon RX 7900 XTX | |
| Sapphire Pulse AMD Radeon RX 7900 XT | |
* ... smaller is better
游戏性能:光栅性能明显优于 RX 7900 XTX
PrimeGeForce RTX 5080 OC Edition 在 1080p、1440p 和 4K Ultra 的累积游戏测试中仅以最微弱的优势领先于 RTX 5080 FE,而总体性能比 Radeon RX 7900 XTX 高出 13%。
RX 7900 XTX 最大的领先优势来自F1 244K Ultra,Prime RTX 5080 OC 快 47%。
有趣的是,Alan Wake 2,旗舰版 RDNA 3 GPU 比 Prime RTX 5080 OC 高出 12%,比 RTX 5080 FE 高出 18%。
总体而言,Prime RTX 5080 OC 在相当多的现代 AAA 级游戏中,在超设置下无需升频帮助即可达到甚至超过 4K 60 fps 大关。
| Performance Rating - Percent | |
| NVIDIA GeForce RTX 5090 Founders Edition | |
| NVIDIA GeForce RTX 4090 | |
| Asus Prime GeForce RTX 5080 OC Edition | |
| NVIDIA GeForce RTX 5080 Founders Edition | |
| Sapphire Pulse AMD Radeon RX 7900 XTX | |
| NVIDIA GeForce RTX 4080 Founders Edition | |
| Sapphire Pulse AMD Radeon RX 7900 XT -1! | |
| Indiana Jones and the Great Circle | |
| 3840x2160 Very Ultra Preset | |
| NVIDIA GeForce RTX 5090 Founders Edition | |
| NVIDIA GeForce RTX 4090 | |
| Asus Prime GeForce RTX 5080 OC Edition | |
| NVIDIA GeForce RTX 5080 Founders Edition | |
| Sapphire Pulse AMD Radeon RX 7900 XTX | |
| NVIDIA GeForce RTX 4080 Founders Edition | |
| Sapphire Pulse AMD Radeon RX 7900 XT | |
| 2560x1440 Very Ultra Preset | |
| NVIDIA GeForce RTX 5090 Founders Edition | |
| NVIDIA GeForce RTX 4090 | |
| Asus Prime GeForce RTX 5080 OC Edition | |
| NVIDIA GeForce RTX 5080 Founders Edition | |
| Sapphire Pulse AMD Radeon RX 7900 XTX | |
| Sapphire Pulse AMD Radeon RX 7900 XT | |
| NVIDIA GeForce RTX 4080 Founders Edition | |
| 1920x1080 Very Ultra Preset | |
| NVIDIA GeForce RTX 5090 Founders Edition | |
| NVIDIA GeForce RTX 4090 | |
| Asus Prime GeForce RTX 5080 OC Edition | |
| NVIDIA GeForce RTX 5080 Founders Edition | |
| Sapphire Pulse AMD Radeon RX 7900 XTX | |
| Sapphire Pulse AMD Radeon RX 7900 XT | |
| NVIDIA GeForce RTX 4080 Founders Edition | |
| Black Myth: Wukong | |
| 3840x2160 cinematic TSR 100 | |
| NVIDIA GeForce RTX 5090 Founders Edition | |
| NVIDIA GeForce RTX 4090 | |
| NVIDIA GeForce RTX 5080 Founders Edition | |
| Asus Prime GeForce RTX 5080 OC Edition | |
| NVIDIA GeForce RTX 4080 Founders Edition | |
| Sapphire Pulse AMD Radeon RX 7900 XTX | |
| Sapphire Pulse AMD Radeon RX 7900 XT | |
| 2560x1440 cinematic TSR 100 | |
| NVIDIA GeForce RTX 5090 Founders Edition | |
| NVIDIA GeForce RTX 4090 | |
| Asus Prime GeForce RTX 5080 OC Edition | |
| NVIDIA GeForce RTX 5080 Founders Edition | |
| Sapphire Pulse AMD Radeon RX 7900 XTX | |
| NVIDIA GeForce RTX 4080 Founders Edition | |
| Sapphire Pulse AMD Radeon RX 7900 XT | |
| 1920x1080 cinematic TSR 100 | |
| NVIDIA GeForce RTX 5090 Founders Edition | |
| NVIDIA GeForce RTX 4090 | |
| Asus Prime GeForce RTX 5080 OC Edition | |
| NVIDIA GeForce RTX 5080 Founders Edition | |
| NVIDIA GeForce RTX 4080 Founders Edition | |
| Sapphire Pulse AMD Radeon RX 7900 XTX | |
| Sapphire Pulse AMD Radeon RX 7900 XT | |
| Alan Wake 2 | |
| 3840x2160 High Preset | |
| NVIDIA GeForce RTX 5090 Founders Edition | |
| NVIDIA GeForce RTX 4090 | |
| Sapphire Pulse AMD Radeon RX 7900 XTX | |
| Asus Prime GeForce RTX 5080 OC Edition | |
| NVIDIA GeForce RTX 5080 Founders Edition | |
| Sapphire Pulse AMD Radeon RX 7900 XT | |
| NVIDIA GeForce RTX 4080 Founders Edition | |
| 2560x1440 High Preset | |
| NVIDIA GeForce RTX 5090 Founders Edition | |
| Sapphire Pulse AMD Radeon RX 7900 XTX | |
| NVIDIA GeForce RTX 4090 | |
| Asus Prime GeForce RTX 5080 OC Edition | |
| NVIDIA GeForce RTX 5080 Founders Edition | |
| Sapphire Pulse AMD Radeon RX 7900 XT | |
| NVIDIA GeForce RTX 4080 Founders Edition | |
| 1920x1080 High Preset | |
| NVIDIA GeForce RTX 5090 Founders Edition | |
| NVIDIA GeForce RTX 4090 | |
| Sapphire Pulse AMD Radeon RX 7900 XTX | |
| Asus Prime GeForce RTX 5080 OC Edition | |
| NVIDIA GeForce RTX 5080 Founders Edition | |
| Sapphire Pulse AMD Radeon RX 7900 XT | |
| NVIDIA GeForce RTX 4080 Founders Edition | |
| F1 24 | |
| 3840x2160 Ultra High Preset AA:T AF:16x | |
| NVIDIA GeForce RTX 5090 Founders Edition | |
| NVIDIA GeForce RTX 4090 | |
| Asus Prime GeForce RTX 5080 OC Edition | |
| NVIDIA GeForce RTX 5080 Founders Edition | |
| NVIDIA GeForce RTX 4080 Founders Edition | |
| Sapphire Pulse AMD Radeon RX 7900 XTX | |
| Sapphire Pulse AMD Radeon RX 7900 XT | |
| 2560x1440 Ultra High Preset AA:T AF:16x | |
| NVIDIA GeForce RTX 5090 Founders Edition | |
| NVIDIA GeForce RTX 4090 | |
| Asus Prime GeForce RTX 5080 OC Edition | |
| NVIDIA GeForce RTX 5080 Founders Edition | |
| NVIDIA GeForce RTX 4080 Founders Edition | |
| Sapphire Pulse AMD Radeon RX 7900 XTX | |
| Sapphire Pulse AMD Radeon RX 7900 XT | |
| 1920x1080 Ultra High Preset AA:T AF:16x | |
| NVIDIA GeForce RTX 5090 Founders Edition | |
| NVIDIA GeForce RTX 4090 | |
| Asus Prime GeForce RTX 5080 OC Edition | |
| NVIDIA GeForce RTX 5080 Founders Edition | |
| NVIDIA GeForce RTX 4080 Founders Edition | |
| Sapphire Pulse AMD Radeon RX 7900 XTX | |
| Sapphire Pulse AMD Radeon RX 7900 XT | |
| Assassin's Creed Mirage | |
| 3840x2160 Ultra High Preset (Adaptive Quality Off) | |
| NVIDIA GeForce RTX 5090 Founders Edition | |
| NVIDIA GeForce RTX 4090 | |
| NVIDIA GeForce RTX 5080 Founders Edition | |
| Asus Prime GeForce RTX 5080 OC Edition | |
| Sapphire Pulse AMD Radeon RX 7900 XTX | |
| NVIDIA GeForce RTX 4080 Founders Edition | |
| Sapphire Pulse AMD Radeon RX 7900 XT | |
| 2560x1440 Ultra High Preset (Adaptive Quality Off) | |
| NVIDIA GeForce RTX 5090 Founders Edition | |
| Asus Prime GeForce RTX 5080 OC Edition | |
| NVIDIA GeForce RTX 5080 Founders Edition | |
| Sapphire Pulse AMD Radeon RX 7900 XTX | |
| Sapphire Pulse AMD Radeon RX 7900 XT | |
| NVIDIA GeForce RTX 4080 Founders Edition | |
| NVIDIA GeForce RTX 4090 | |
| 1920x1080 Ultra High Preset (Adaptive Quality Off) | |
| NVIDIA GeForce RTX 4090 | |
| NVIDIA GeForce RTX 5090 Founders Edition | |
| NVIDIA GeForce RTX 5080 Founders Edition | |
| Asus Prime GeForce RTX 5080 OC Edition | |
| Sapphire Pulse AMD Radeon RX 7900 XTX | |
| Sapphire Pulse AMD Radeon RX 7900 XT | |
| NVIDIA GeForce RTX 4080 Founders Edition | |
| Avatar Frontiers of Pandora | |
| 3840x2160 Ultra Preset AA:T | |
| NVIDIA GeForce RTX 5090 Founders Edition | |
| NVIDIA GeForce RTX 4090 | |
| NVIDIA GeForce RTX 5080 Founders Edition | |
| Asus Prime GeForce RTX 5080 OC Edition | |
| Sapphire Pulse AMD Radeon RX 7900 XTX | |
| NVIDIA GeForce RTX 4080 Founders Edition | |
| Sapphire Pulse AMD Radeon RX 7900 XT | |
| 2560x1440 Ultra Preset AA:T | |
| NVIDIA GeForce RTX 5090 Founders Edition | |
| NVIDIA GeForce RTX 4090 | |
| NVIDIA GeForce RTX 5080 Founders Edition | |
| Asus Prime GeForce RTX 5080 OC Edition | |
| Sapphire Pulse AMD Radeon RX 7900 XTX | |
| NVIDIA GeForce RTX 4080 Founders Edition | |
| Sapphire Pulse AMD Radeon RX 7900 XT | |
| 1920x1080 Ultra Preset AA:T | |
| NVIDIA GeForce RTX 5090 Founders Edition | |
| NVIDIA GeForce RTX 4090 | |
| NVIDIA GeForce RTX 5080 Founders Edition | |
| Asus Prime GeForce RTX 5080 OC Edition | |
| Sapphire Pulse AMD Radeon RX 7900 XTX | |
| NVIDIA GeForce RTX 4080 Founders Edition | |
| Sapphire Pulse AMD Radeon RX 7900 XT | |
| Cyberpunk 2077 2.2 Phantom Liberty | |
| 2560x1440 Ultra Preset (FSR off) | |
| NVIDIA GeForce RTX 5090 Founders Edition | |
| Asus Prime GeForce RTX 5080 OC Edition | |
| NVIDIA GeForce RTX 5080 Founders Edition | |
| NVIDIA GeForce RTX 4090 | |
| Sapphire Pulse AMD Radeon RX 7900 XTX | |
| Sapphire Pulse AMD Radeon RX 7900 XT | |
| NVIDIA GeForce RTX 4080 Founders Edition | |
| 1920x1080 Ultra Preset (FSR off) | |
| NVIDIA GeForce RTX 5090 Founders Edition | |
| Sapphire Pulse AMD Radeon RX 7900 XTX | |
| NVIDIA GeForce RTX 4090 | |
| Asus Prime GeForce RTX 5080 OC Edition | |
| NVIDIA GeForce RTX 5080 Founders Edition | |
| NVIDIA GeForce RTX 4080 Founders Edition | |
| X-Plane 11.11 | |
| 3840x2160 high (fps_test=3) | |
| NVIDIA GeForce RTX 5090 Founders Edition | |
| NVIDIA GeForce RTX 4090 | |
| Asus Prime GeForce RTX 5080 OC Edition | |
| NVIDIA GeForce RTX 5080 Founders Edition | |
| NVIDIA GeForce RTX 4080 Founders Edition | |
| Sapphire Pulse AMD Radeon RX 7900 XTX | |
| Sapphire Pulse AMD Radeon RX 7900 XT | |
| 1920x1080 high (fps_test=3) | |
| NVIDIA GeForce RTX 5090 Founders Edition | |
| NVIDIA GeForce RTX 5080 Founders Edition | |
| NVIDIA GeForce RTX 4090 | |
| Asus Prime GeForce RTX 5080 OC Edition | |
| NVIDIA GeForce RTX 4080 Founders Edition | |
| Sapphire Pulse AMD Radeon RX 7900 XTX | |
| Sapphire Pulse AMD Radeon RX 7900 XT | |
光线追踪性能
RX 7900 XTX 在《艾伦-觉醒 2》光栅游戏中的领先优势无法延续到光线追踪设置中,在 4K 游戏中,它比 Prime RTX 5080 OC 落后 47%。
在《赛博朋克 2077》魅影自由 中,Prime RTX 5080 OC 比 RX 7900 XTX 领先高达 58%。不过,RTX 5080 FE 带来的收益微乎其微。
RTX 5080 的 16 GB GDDR7 VRAM 比 RTX 4080 Super 的 GDDR6X 快 30%。 RTX 4080 Super.然而,在现代 AAA 级游戏的某些设置中,这可能被证明是一个重大限制。
例如,在Indiana Jones and the Great Circle中,当在 4K 下启用全路径追踪时,甚至无法浏览菜单,更不用说玩游戏了。启用 DLSS 和帧生成也无济于事。
| Indiana Jones and the Great Circle - 2560x1440 Very Ultra Preset + Full Path Tracing + Quality DLSS + Frame Generation | |
| NVIDIA GeForce RTX 5090 Founders Edition | |
| NVIDIA GeForce RTX 4090 | |
| Asus Prime GeForce RTX 5080 OC Edition | |
| NVIDIA GeForce RTX 5080 Founders Edition | |
| NVIDIA GeForce RTX 4080 Founders Edition | |
| Black Myth: Wukong | |
| 3840x2160 cinematic RT: Very High DLSS 68 FG | |
| NVIDIA GeForce RTX 4090 | |
| NVIDIA GeForce RTX 5090 Founders Edition | |
| Asus Prime GeForce RTX 5080 OC Edition | |
| NVIDIA GeForce RTX 5080 Founders Edition | |
| NVIDIA GeForce RTX 4080 Founders Edition | |
| 2560x1440 cinematic RT: Very High DLSS 68 FG | |
| NVIDIA GeForce RTX 5090 Founders Edition | |
| NVIDIA GeForce RTX 4090 | |
| Asus Prime GeForce RTX 5080 OC Edition | |
| NVIDIA GeForce RTX 5080 Founders Edition | |
| NVIDIA GeForce RTX 4080 Founders Edition | |
| Alan Wake 2 | |
| 3840x2160 High Preset + High Ray Tracing | |
| NVIDIA GeForce RTX 5090 Founders Edition | |
| NVIDIA GeForce RTX 4090 | |
| Asus Prime GeForce RTX 5080 OC Edition | |
| NVIDIA GeForce RTX 5080 Founders Edition | |
| NVIDIA GeForce RTX 4080 Founders Edition | |
| Sapphire Pulse AMD Radeon RX 7900 XTX | |
| Sapphire Pulse AMD Radeon RX 7900 XT | |
| 1920x1080 High Preset + High Ray Tracing | |
| NVIDIA GeForce RTX 5090 Founders Edition | |
| NVIDIA GeForce RTX 4090 | |
| Asus Prime GeForce RTX 5080 OC Edition | |
| NVIDIA GeForce RTX 5080 Founders Edition | |
| NVIDIA GeForce RTX 4080 Founders Edition | |
| Sapphire Pulse AMD Radeon RX 7900 XTX | |
| Sapphire Pulse AMD Radeon RX 7900 XT | |
| 3840x2160 High Preset + High Ray Tracing + Quality DLSS + FG | |
| NVIDIA GeForce RTX 5090 Founders Edition | |
| NVIDIA GeForce RTX 4090 | |
| Asus Prime GeForce RTX 5080 OC Edition | |
| NVIDIA GeForce RTX 5080 Founders Edition | |
| NVIDIA GeForce RTX 4080 Founders Edition | |
| Cyberpunk 2077 2.2 Phantom Liberty | |
| 3840x2160 Ray Tracing Ultra Preset (DLSS off, no Path Tracing) | |
| NVIDIA GeForce RTX 5090 Founders Edition | |
| NVIDIA GeForce RTX 4090 | |
| NVIDIA GeForce RTX 5080 Founders Edition | |
| Asus Prime GeForce RTX 5080 OC Edition | |
| NVIDIA GeForce RTX 4080 Founders Edition | |
| Sapphire Pulse AMD Radeon RX 7900 XTX | |
| Sapphire Pulse AMD Radeon RX 7900 XT | |
| 1920x1080 Ray Tracing Ultra Preset (DLSS off) | |
| NVIDIA GeForce RTX 5090 Founders Edition | |
| NVIDIA GeForce RTX 4090 | |
| Asus Prime GeForce RTX 5080 OC Edition | |
| NVIDIA GeForce RTX 5080 Founders Edition | |
| NVIDIA GeForce RTX 4080 Founders Edition | |
| Sapphire Pulse AMD Radeon RX 7900 XTX | |
| Sapphire Pulse AMD Radeon RX 7900 XT | |
DLSS 4 多帧生成
目前只有少数游戏支持 DLSS 4 多帧生成 (MFG)。不过,许多其他受支持的游戏可以通过 Nvidia 应用程序中的重载功能使用 DLSS 4(适用于所有 RTX GPU)和 MFG(仅适用于 Blackwell GPU)。
与《艾伦-威克 2》或《赛博朋克 2077:魅影自由》相比,《星球大战外传》在启用 DLSS 和帧生成后,Prime RTX 5080 OC 比 RTX 5080 FE 提升了 5-7%。
奇怪的是,我们在《赛博朋克 2077:自由魅影》中注意到了一个异常结果,在 4K Ray Tracing Overdrive 预置下启用 MFG 2x,Prime RTX 5080 OC 的性能比 RTX 5080 FE 慢 31%。
尽管仔细检查了两次测试的设置、驱动程序和操作系统版本,华硕显卡还是意外地落后了。
| Alan Wake 2 | |
| 3840x2160 High Preset + Ultra Ray Tracing + Quality DLSS + FG 4x | |
| NVIDIA GeForce RTX 5090 Founders Edition | |
| Asus Prime GeForce RTX 5080 OC Edition | |
| NVIDIA GeForce RTX 5080 Founders Edition | |
| 3840x2160 High Preset + Ultra Ray Tracing + Quality DLSS + FG 2x | |
| NVIDIA GeForce RTX 5090 Founders Edition | |
| Asus Prime GeForce RTX 5080 OC Edition | |
| NVIDIA GeForce RTX 5080 Founders Edition | |
| 3840x2160 High Preset + High Ray Tracing + Quality DLSS + FG | |
| NVIDIA GeForce RTX 5090 Founders Edition | |
| NVIDIA GeForce RTX 4090 | |
| Asus Prime GeForce RTX 5080 OC Edition | |
| NVIDIA GeForce RTX 5080 Founders Edition | |
| Cyberpunk 2077 2.2 Phantom Liberty | |
| 3840x2160 Ray Tracing Overdrive Preset + DLSS 4 Transformer Quality + Frame Generation MFG 4x | |
| NVIDIA GeForce RTX 5090 Founders Edition | |
| NVIDIA GeForce RTX 5080 Founders Edition | |
| Asus Prime GeForce RTX 5080 OC Edition | |
| 3840x2160 Ray Tracing Overdrive Preset + DLSS 4 Transformer Quality + Frame Generation (M)FG 2x | |
| NVIDIA GeForce RTX 5090 Founders Edition | |
| NVIDIA GeForce RTX 5080 Founders Edition | |
| Asus Prime GeForce RTX 5080 OC Edition | |
| 2560x1440 Ultra Preset DLSS4 quality no FG | |
| NVIDIA GeForce RTX 5090 Founders Edition | |
| Asus Prime GeForce RTX 5080 OC Edition | |
| Star Wars Outlaws | |
| 2560x1440 cinem. ultra, RT ultra, DLSS, FG RR | |
| NVIDIA GeForce RTX 5090 Founders Edition | |
| NVIDIA GeForce RTX 4090 | |
| Asus Prime GeForce RTX 5080 OC Edition | |
| NVIDIA GeForce RTX 5080 Founders Edition | |
| 3840x2160 cinem. ultra, RT ultra, DLSS, FG RR | |
| NVIDIA GeForce RTX 5090 Founders Edition | |
| NVIDIA GeForce RTX 4090 | |
| Asus Prime GeForce RTX 5080 OC Edition | |
| NVIDIA GeForce RTX 5080 Founders Edition | |
| 3840x2160 cinem. ultra, RT ultra, DLSS, FG 4x, RR | |
| NVIDIA GeForce RTX 5090 Founders Edition | |
| Asus Prime GeForce RTX 5080 OC Edition | |
| NVIDIA GeForce RTX 5080 Founders Edition | |
| low | med. | high | ultra | QHD DLSS | QHD | 4K DLSS | 4K | |
|---|---|---|---|---|---|---|---|---|
| The Witcher 3 (2015) | 278 | 232 | 225 | |||||
| X-Plane 11.11 (2018) | 154.2 | 128.1 | ||||||
| Baldur's Gate 3 (2023) | 240 | 193.7 | 169.8 | 109.4 | ||||
| Cyberpunk 2077 2.2 Phantom Liberty (2023) | 180.2 | 163.3 | 152.5 | |||||
| Assassin's Creed Mirage (2023) | 194 | 163 | 140 | 109 | ||||
| Alan Wake 2 (2023) | 146.9 | 108.6 | 95.2 | 57.6 | ||||
| Avatar Frontiers of Pandora (2023) | 132.6 | 94.5 | 85.9 | 51.1 | ||||
| F1 24 (2024) | 204 | 141.9 | 122 | 73.2 | ||||
| Black Myth: Wukong (2024) | 80 | 88 | 63 | 65 | 38 | |||
| Star Wars Outlaws (2024) | 108.7 | 104.3 | 80.6 | 71.4 | 50 | |||
| Stalker 2 (2024) | 102.4 | 171.6 | 87.4 | 113.7 | 55 | |||
| Indiana Jones and the Great Circle (2024) | 168.5 | 139.4 | 93 |
排放物:可承受的热量和噪音输出
华硕 PrimeGeForce RTX 5080 OC Edition 在散热方面有一些小技巧。虽然没有液态金属导热接口材料,但华硕表示,该显卡使用了相变导热垫来提高传导性,同时还采用了蒸气室-热沉组合。
此外,通风金属背板的设计也有助于更好地散热。
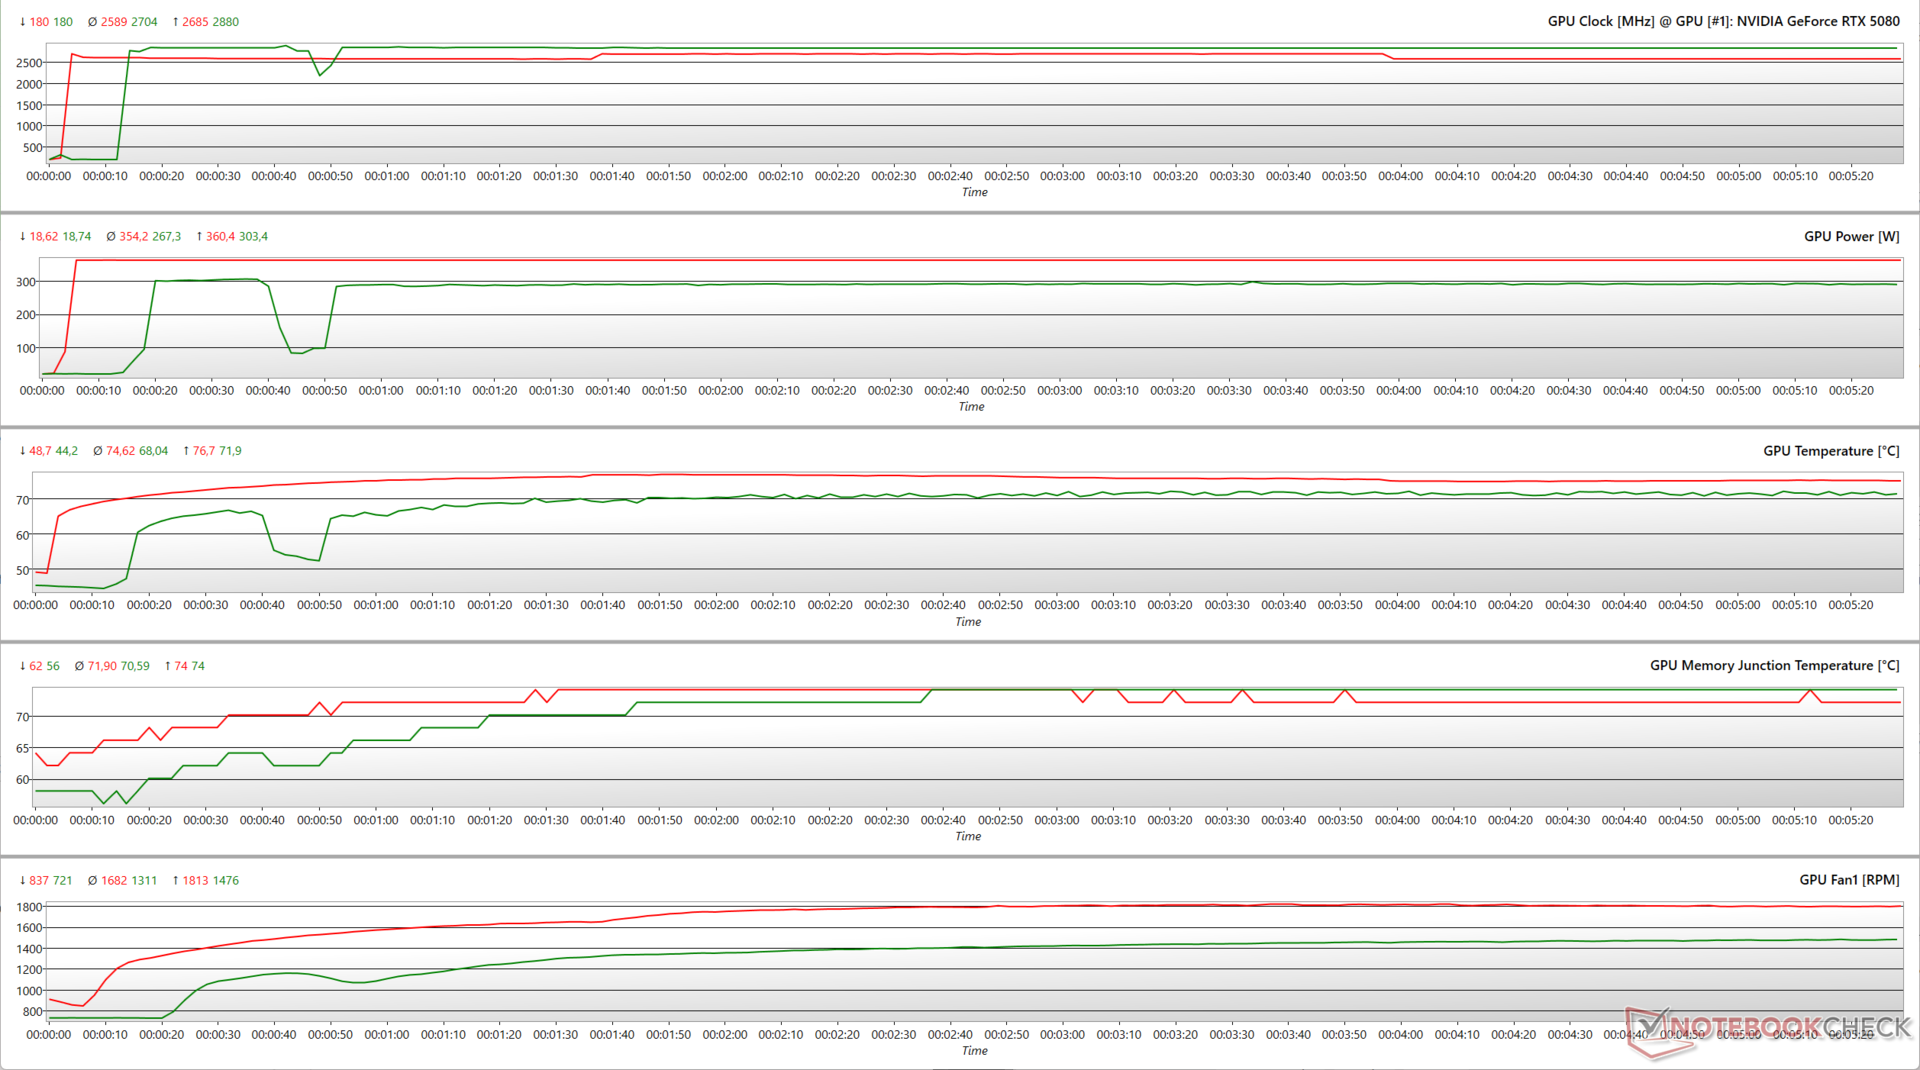
压力测试
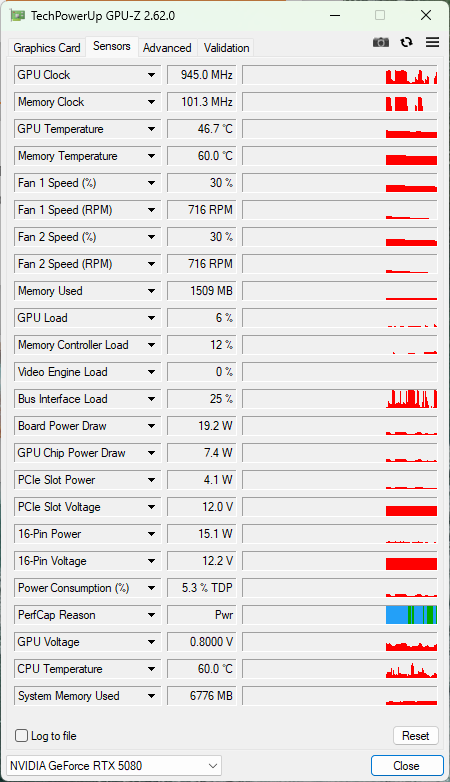
使用 FurMark(1280x720,无 AA)进行的简短压力测试表明,Prime RTX 5080 OC 可以达到额定的 2,685 MHz 提升频率,而功耗为 360 W,平均核心温度约为 74.6 °C。
在 1080p 超高清设置下使用《赛博朋克 2077:魅影自由》时,Prime RTX 5080 OC 在仅消耗 303 W 和 68 °C 平均温度的情况下,将频率提升至 2,880 MHz。
这表明,Blackwell 在根据可用散热和功耗余量适时提高频率方面与 Ada 非常相似。
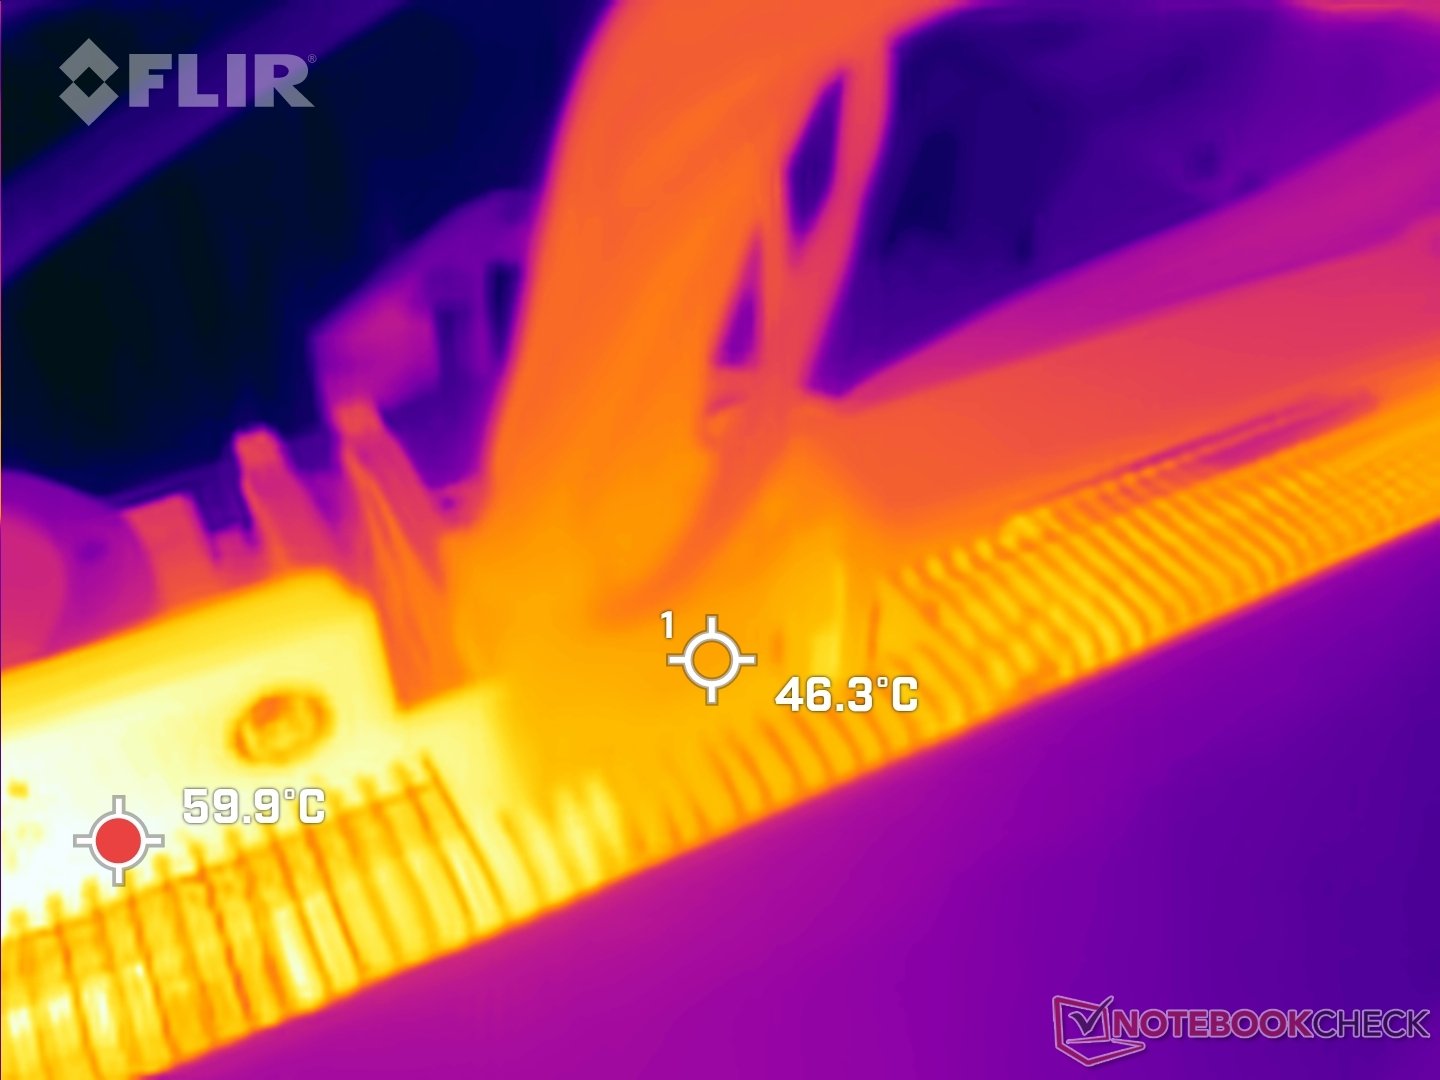
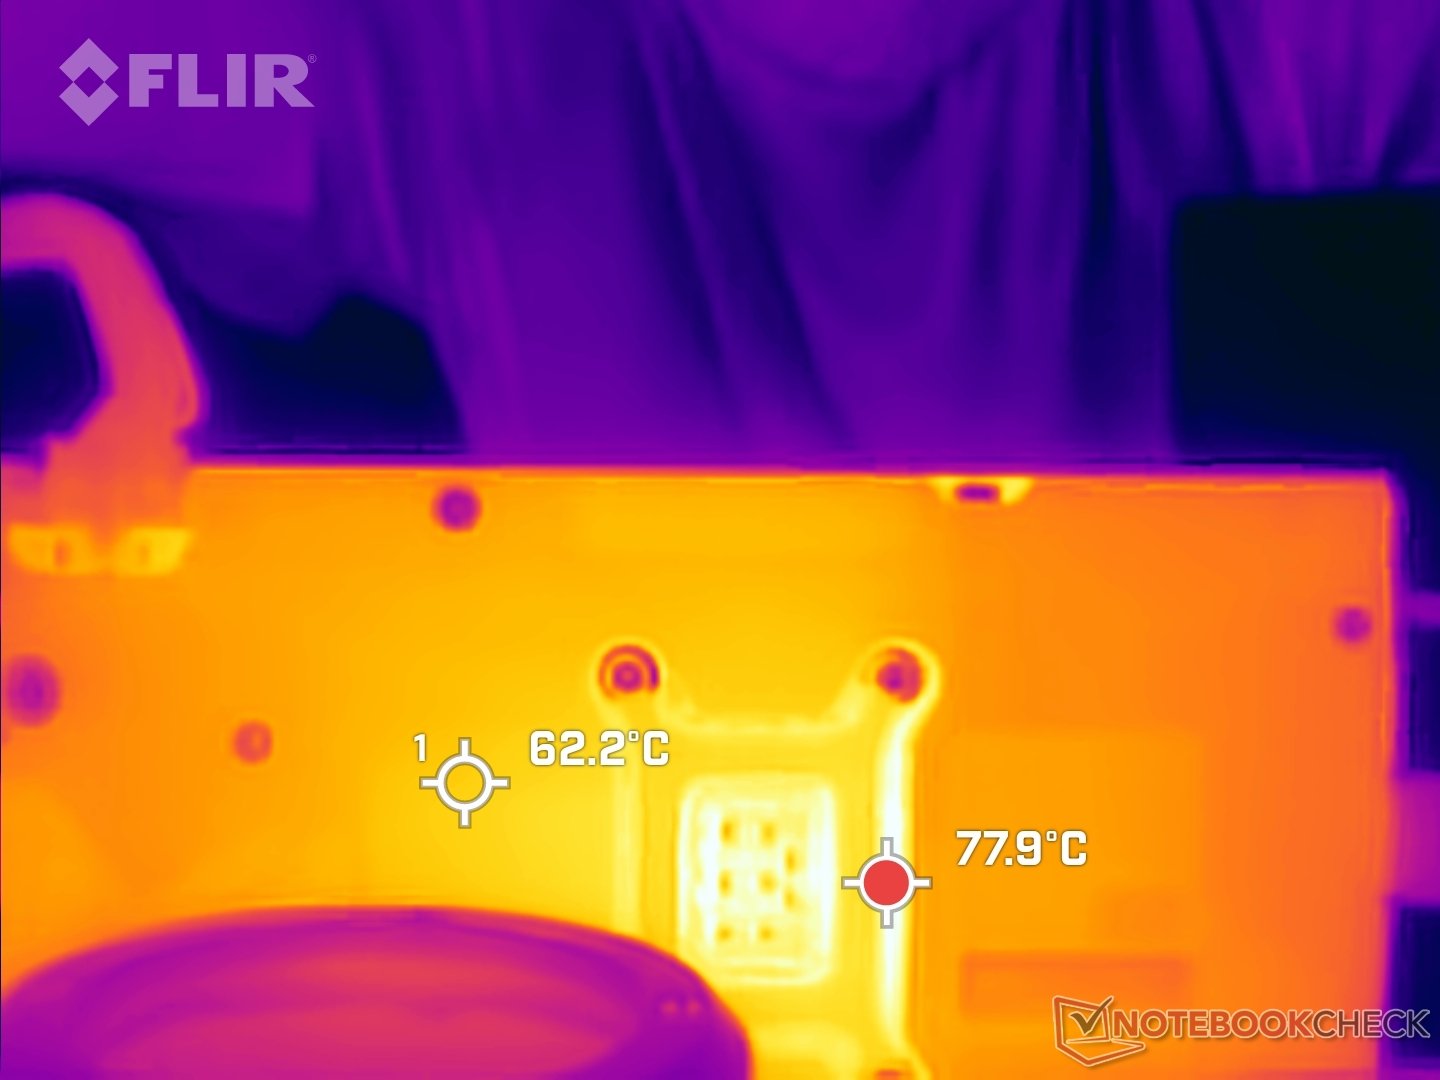
表面温度
Prime RTX 5080 OC 的前护罩即使在重负载时也能保持相当低的温度,不过背板温度高达 62 °C,环境温度为 23 °C时 GPU 区域温度可达 78 °C。
。
我们在 12VHPWR 接口附近记录到的温度约为 46 °C,这并不令人担忧。

噪音水平

Prime RTX 5080 OC 的三轴科技风扇采用双滚珠轴承和更长的叶片,提高了可靠性和冷却效果。
在默认风扇曲线中,当核心温度低于 50 °C 时,风扇会停止运转。
在 111% 的目标功率下运行 FurMark 时,我们记录到的最大声压级 (SPL) 为 47.6 dB(A)。
用户可以在性能和安静 VBIOS 模式之间进行选择,其中安静模式在很大程度上有效地将噪音水平限制在 40 db(A) 左右。
| 压力测试 | VBIOS模式/功率目标 | 风扇噪音 dB(A) |
| FurMark 1280 x 720,无 AA | 性能 / 100% | 45.26 |
| FurMark 1280 x 720,无 AA | 静音 / 100% | 40.01 |
| FurMark 1280 x 720,无 AA | 性能 / 111% | 47.60 |
| FurMark 1280 x 720,无 AA | 安静 / 111% | 43.35 |
| 赛博朋克 2077 1080p 超高清 | 性能 / 100% | 40.75 |
| 赛博朋克 2077 1080p 超强版 | 静音 / 100% | 38.80 |
| 赛博朋克 2077 1080p 超强版 | 性能 / 111% | 41.58 |
| 赛博朋克 2077 1080p 超强版 | 静音 / 111% | 38.58 |
能源管理:与 RX 7900 XTX 相比,游戏能效的提升令人欣喜
PrimeGeForce RTX 5080 OC Edition 在 FurMark(1280x720,无 AA)中显示的墙面功耗比 RTX 5080 FE 更低(尽管主频更高)。
相反,虽然 Prime RTX 5080 OC 和 RTX 5080 FE GPU 在《赛博朋克 2077》1080p 超高清游戏中的功耗几乎相同,但在TheWitcher 3 1080p 超高清游戏中,华硕显卡的功耗比 FE 高出 13%。
因此,在《 赛博朋克 2077》中,Prime GPU 的能效比 FE 显卡高 4%,而在《Witcher 3 》中,后者的能效比 FE 显卡高 13%。
尽管如此,Prime RTX 5080 OC 在《Witcher 3 》中的能效比 Radeon RX 7900 XTX 高出 20%。
Power consumption: External monitor
:
| Power Consumption / FurMark 1.19 GPU Stress Test (external Monitor) | |
| NVIDIA GeForce RTX 5090 Founders Edition (Idle: 90 W) | |
| NVIDIA GeForce RTX 4090 (Idle: 82 W) | |
| Sapphire Pulse AMD Radeon RX 7900 XTX (Idle: 74 W) | |
| NVIDIA GeForce RTX 5080 Founders Edition (Idle: 70 W) | |
| Sapphire Pulse AMD Radeon RX 7900 XT (Idle: 94 W) | |
| Asus Prime GeForce RTX 5080 OC Edition (Idle: 78 W) | |
| NVIDIA GeForce RTX 4080 Founders Edition (Idle: 72 W) | |
| Power Consumption / Cyberpunk 2077 FHD ultra no FSR (external Monitor) | |
| Sapphire Pulse AMD Radeon RX 7900 XTX (Idle: 74 W) | |
| Sapphire Pulse AMD Radeon RX 7900 XT (Idle: 94 W) | |
| NVIDIA GeForce RTX 5090 Founders Edition (Idle: 90 ) | |
| NVIDIA GeForce RTX 4090 (Idle: 82 W) | |
| Asus Prime GeForce RTX 5080 OC Edition (Idle: 78 W) | |
| NVIDIA GeForce RTX 5080 Founders Edition (Idle: 70 W) | |
| NVIDIA GeForce RTX 4080 Founders Edition (Idle: 72 W) | |
| Power Consumption / Cyberpunk 2077 ultra Efficiency | |
| Asus Prime GeForce RTX 5080 OC Edition | |
| NVIDIA GeForce RTX 5080 Founders Edition | |
| NVIDIA GeForce RTX 4090 | |
| NVIDIA GeForce RTX 4080 Founders Edition | |
| NVIDIA GeForce RTX 5090 Founders Edition | |
| Sapphire Pulse AMD Radeon RX 7900 XT | |
| Sapphire Pulse AMD Radeon RX 7900 XTX | |
| Power Consumption / The Witcher 3 ultra (external Monitor) | |
| NVIDIA GeForce RTX 5090 Founders Edition (Idle: 90 W) | |
| Sapphire Pulse AMD Radeon RX 7900 XTX (Idle: 74 W) | |
| NVIDIA GeForce RTX 4090 (Idle: 82 W) | |
| Sapphire Pulse AMD Radeon RX 7900 XT (Idle: 94 W) | |
| Asus Prime GeForce RTX 5080 OC Edition (Idle: 78 W) | |
| NVIDIA GeForce RTX 5080 Founders Edition (Idle: 70 W) | |
| NVIDIA GeForce RTX 4080 Founders Edition (Idle: 72 W) | |
| Power Consumption / Witcher 3 ultra Efficiency (external Monitor) | |
| NVIDIA GeForce RTX 5080 Founders Edition | |
| NVIDIA GeForce RTX 4080 Founders Edition | |
| NVIDIA GeForce RTX 4090 | |
| Asus Prime GeForce RTX 5080 OC Edition | |
| NVIDIA GeForce RTX 5090 Founders Edition | |
| Sapphire Pulse AMD Radeon RX 7900 XT | |
| Sapphire Pulse AMD Radeon RX 7900 XTX | |
| 1280x720 FurMark 1.19 GPU Stress Test (external Monitor) | |
| 1920x1080 The Witcher 3 ultra (external Monitor) | |
* ... smaller is better
Notebookcheck 对华硕 PrimeGeForce RTX 5080 OC 版的印象
凭借 PrimeGeForce RTX 5080 OC Edition,华硕为 Nvidia 自家的GeForce RTX 5080 Founders Edition 提供了一个可行的 AiB 选项。不过,比 RTX 5080 FE 高出 320 美元的价格可能会让潜在买家望而却步。
Transparency
The selection of devices to be reviewed is made by our editorial team. The test sample was provided to the author as a loan by the manufacturer or retailer for the purpose of this review. The lender had no influence on this review, nor did the manufacturer receive a copy of this review before publication. There was no obligation to publish this review. We never accept compensation or payment in return for our reviews. As an independent media company, Notebookcheck is not subjected to the authority of manufacturers, retailers or publishers.
This is how Notebookcheck is testing
Every year, Notebookcheck independently reviews hundreds of laptops and smartphones using standardized procedures to ensure that all results are comparable. We have continuously developed our test methods for around 20 years and set industry standards in the process. In our test labs, high-quality measuring equipment is utilized by experienced technicians and editors. These tests involve a multi-stage validation process. Our complex rating system is based on hundreds of well-founded measurements and benchmarks, which maintains objectivity. Further information on our test methods can be found here.

