


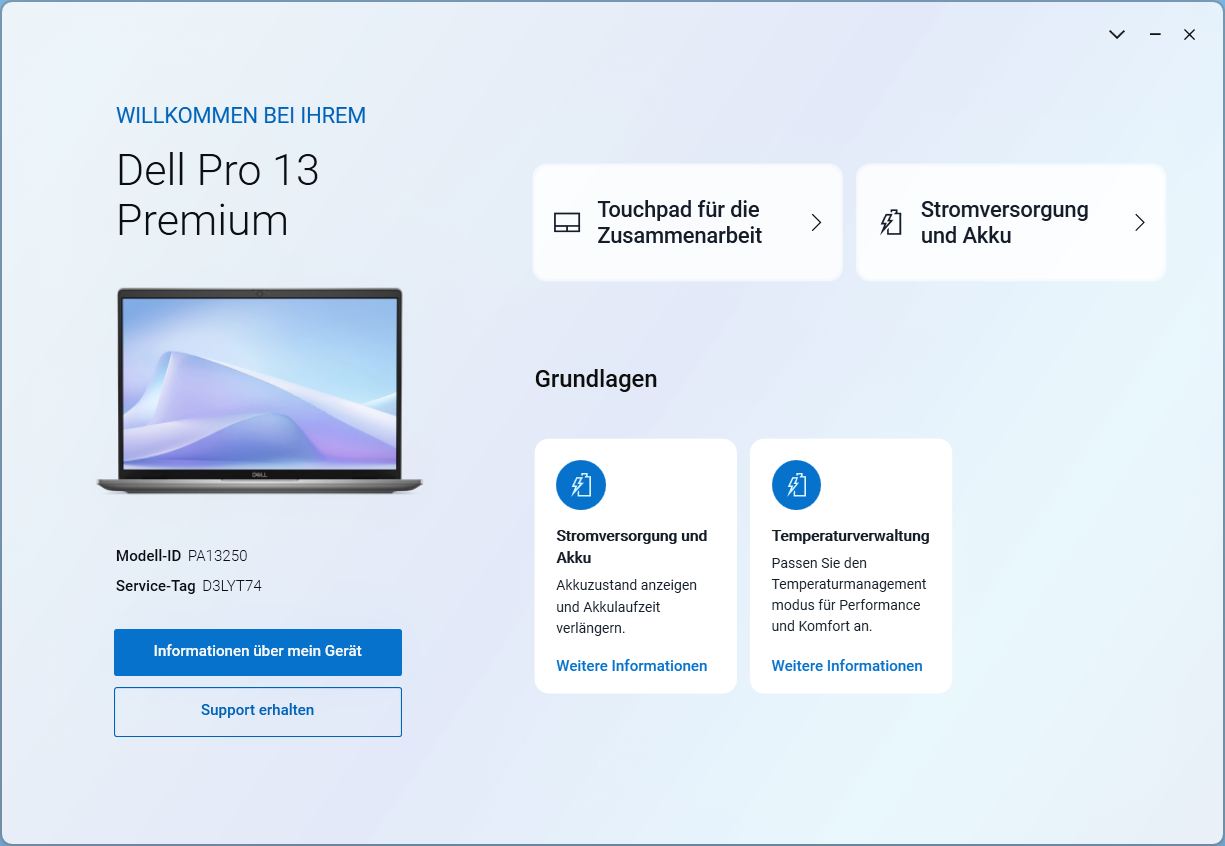
戴尔 Pro 13 Premium 评测:几乎完美的商务笔记本电脑
Promium "笔记本电脑
我们将抓住这个机会,对戴尔产品线中的 13 英寸商务笔记本电脑进行评测。戴尔 Pro 13 Premium 主要面向要求苛刻的商务用户,其现代化的端口设计吸引了众多企业家,它采用坚固而轻巧的镁合金机身、AI,电池续航时间也非常长。Christian Hintze, 👁 Christian Hintze (translated by DeepL / Ninh Duy) Published 🇺🇸 🇩🇪 ...
评语 - 一款几乎完整的商务笔记本电脑
戴尔 Pro 13 Premium 是一款出色的商务笔记本电脑,它几乎没有任何缺点,但却有很多值得称赞的功能,因此获得了我们的奖项。企业员工和其他潜在买家将获得一款结构紧凑、体积小、重量轻、经济实惠、运行时间极长(24 小时!)且功能强大的笔记本电脑,它拥有高品质的镁合金机身、高分辨率 800 万像素网络摄像头以及双 Thunderbolt 4 和 Wi-Fi 7 等现代接口。此外,这款笔记本电脑几乎在任何情况下都能保持持续冷却。
不过,这也是有代价的,这款笔记本电脑的售价不低于1900美元至2500美元!考虑到这一点,蹩脚的 M.2 2230 固态硬盘几乎令人发指,但在日常使用中,你几乎不会注意到其中的差别。唯一需要改进的地方是名称和可升级性。
Pros
Cons
- $29.99Smatree Hard EVA Protective Sleeve Compatible for 13.3 inch Dell Pro 13 Premium (PA13250), for 13 inch DELL Latitude 7350/7320 Detachable, for 12 inch DELL Latitude 7230 Rugged Extreme Tablet (X8016)
- $49.99Smatree 13 inch Laptop Sleeve for DELL Pro 13 Premium PA13250, Protective Laptop Case with Accessory Pocket, YKK Zipper, Patented Shockproof Design (E431)
可能的替代品比较
Image | Model / Review | Price | Weight | Height | Display |
|---|---|---|---|---|---|
1. 89.9%  | Dell Pro 13 Premium PA13250 Intel Core Ultra 7 268V ⎘ Intel Arc Graphics 140V ⎘ 32 GB Memory, 1024 GB SSD | Amazon: 1. $39.99 Smatree Hard Shell Laptop Ca... 2. $29.99 Smatree Hard EVA Protective ... 3. $49.99 Smatree 13 inch Laptop Sleev... List Price: 2700 Euro | 1.1 kg | 17.2 mm | 13.30" 1920x1200 170 PPI IPS |
2. 85%  | MSI Prestige 13 AI Plus Evo A2VMG Intel Core Ultra 7 258V ⎘ Intel Arc Graphics 140V ⎘ 32 GB Memory | Amazon: $1,349.99 List Price: 1400 USD | 970 g | 16.9 mm | 13.30" 2880x1800 255 PPI OLED |
3. 85.1%  | Lenovo ThinkPad X13 2-in-1 Gen 5 Intel Core Ultra 7 165U ⎘ Intel Graphics 4-Core iGPU (Arc) ⎘ 32 GB Memory, 1000 GB SSD | Amazon: $1,601.95 List Price: 2107.23 Euro | 1.3 kg | 16.4 mm | 13.30" 1920x1200 170 PPI IPS |
4. 84%  | Framework Laptop 13.5 Core Ultra 7 155H Intel Core Ultra 7 155H ⎘ Intel Arc 8-Core iGPU ⎘ 32 GB Memory | List Price: 1500 USD | 1.4 kg | 15.85 mm | 13.50" 2880x1920 256 PPI IPS |
5. 85.3%  | Dell XPS 13 9350 Intel Core Ultra 7 256V ⎘ Intel Arc Graphics 140V ⎘ 16 GB Memory, 512 GB SSD | Amazon: 1. $1,499.99 2025 Latest Dell XPS 13 9350... 2. $1,699.00 NewDell XPS 13 9350 Powerful... 3. $1,599.99 Dell XPS 13 9340 Business La... List Price: 1400 USD | 1.2 kg | 15.3 mm | 13.40" 1920x1200 169 PPI IPS |
6. 80.7%  | Microsoft Surface Pro Copilot+ Qualcomm Snapdragon X Plus X1P-64-100 ⎘ Qualcomm SD X Adreno X1-85 3.8 TFLOPS ⎘ 16 GB Memory, 256 GB SSD | Amazon: $1,079.99 List Price: 1199€ | 872 g | 9.3 mm | 13.00" 2880x1920 266 PPI IPS |
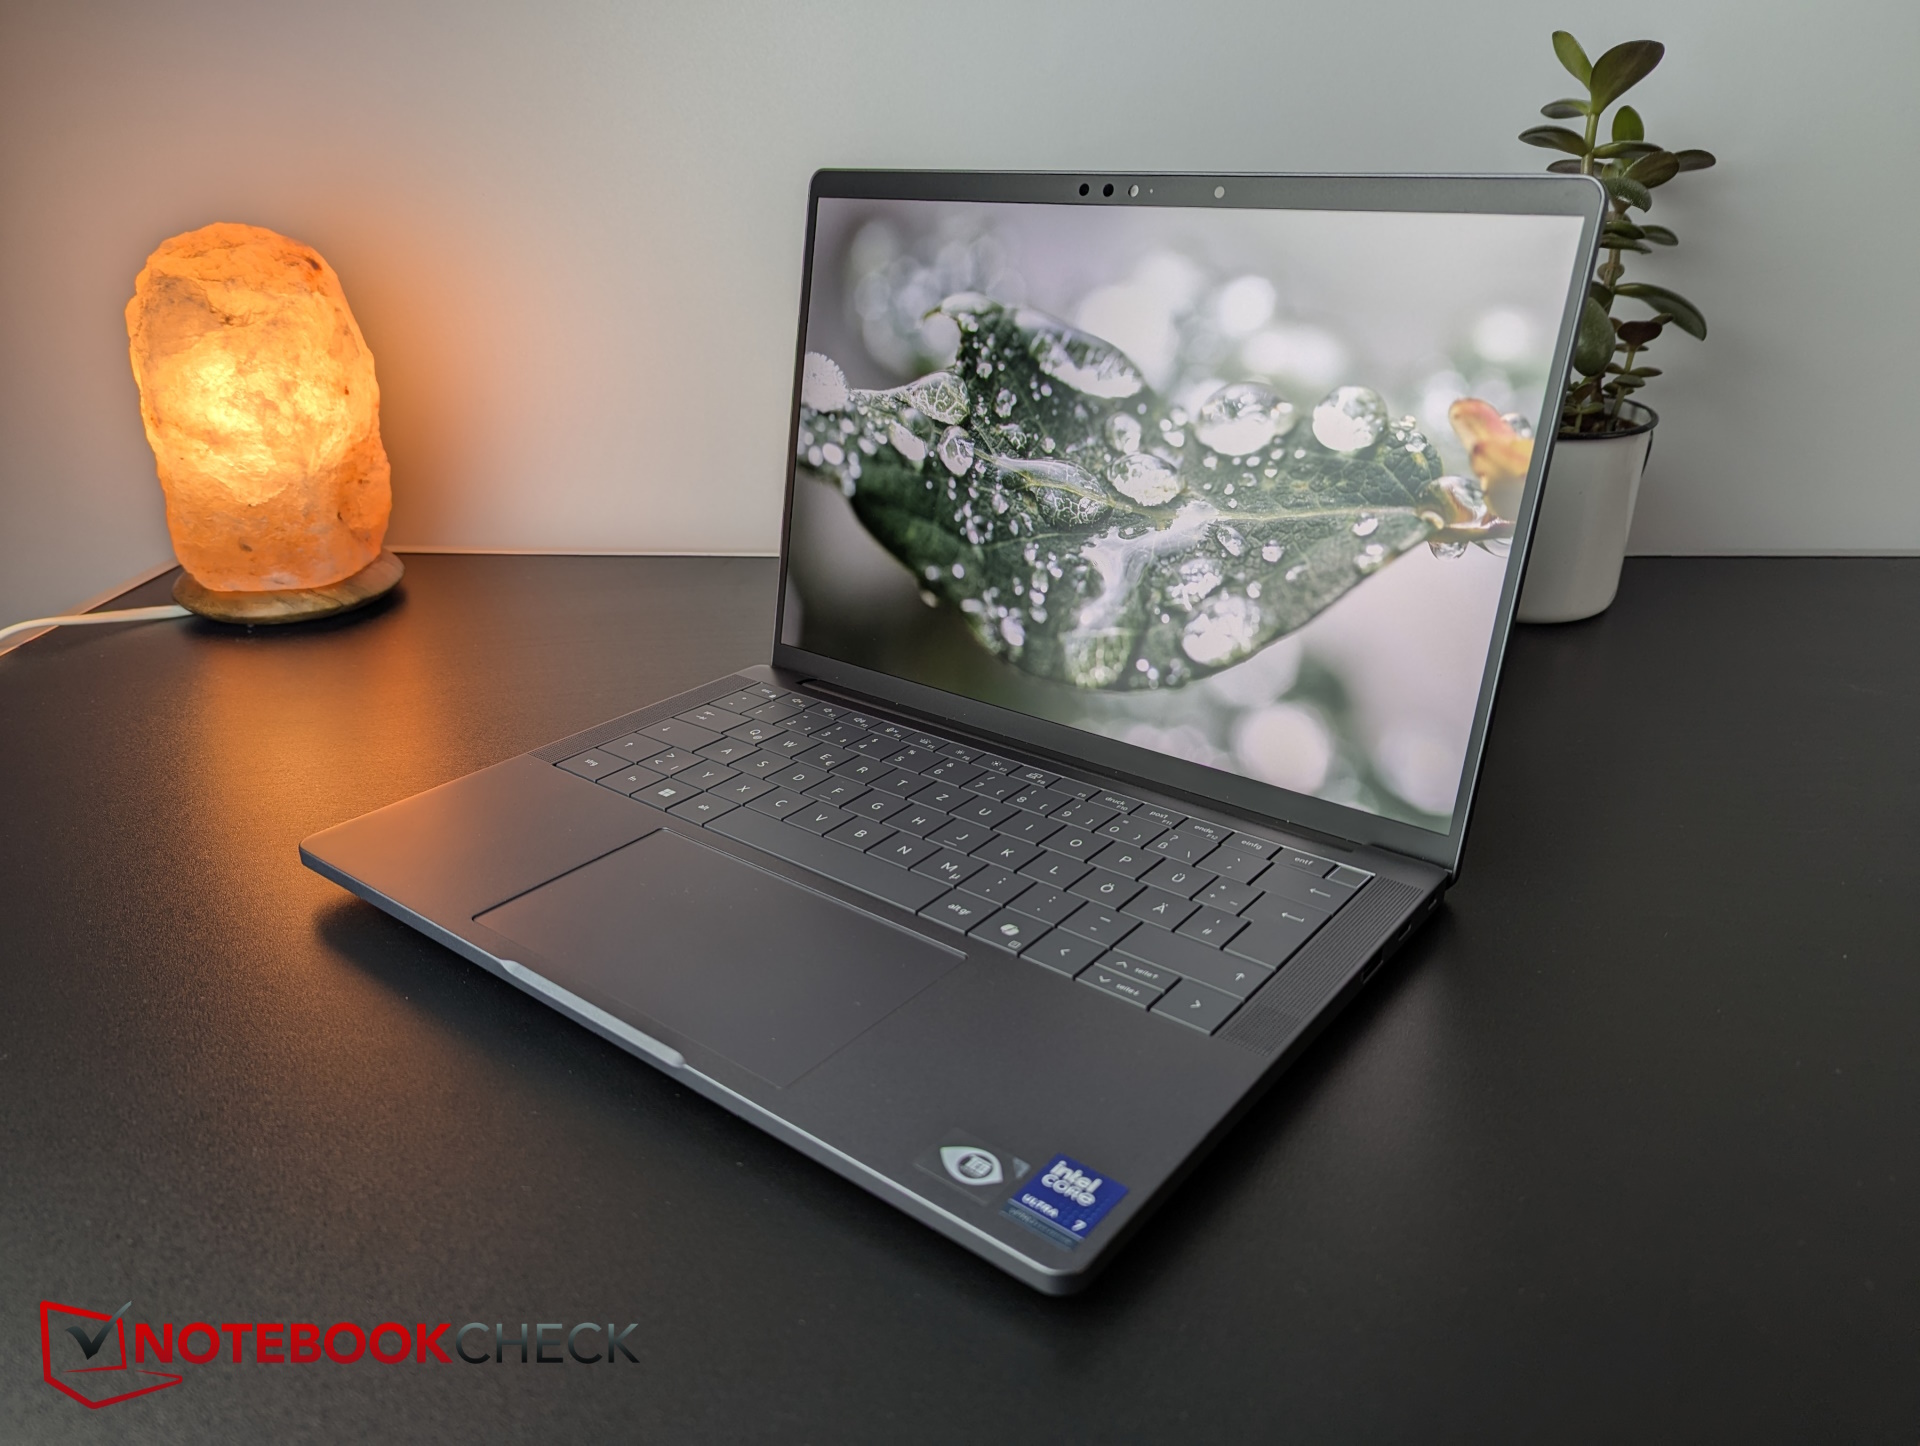
戴尔最近改变了命名方案。通过 Pro 系列,戴尔瞄准了典型的商务用户,基本上取代了之前的Latitude 系列。Premium代表着最好的材料和功能,我们目前的13英寸机型配备了现代化的端口、广泛的安全性、大量的人工智能、坚固的镁合金机箱,尽管如此,它的重量仅略高于1千克。那么,这是一款适合商务用户的高端笔记本电脑吗?
规格
外壳和功能 - 这款戴尔产品配有 800 万像素网络摄像头
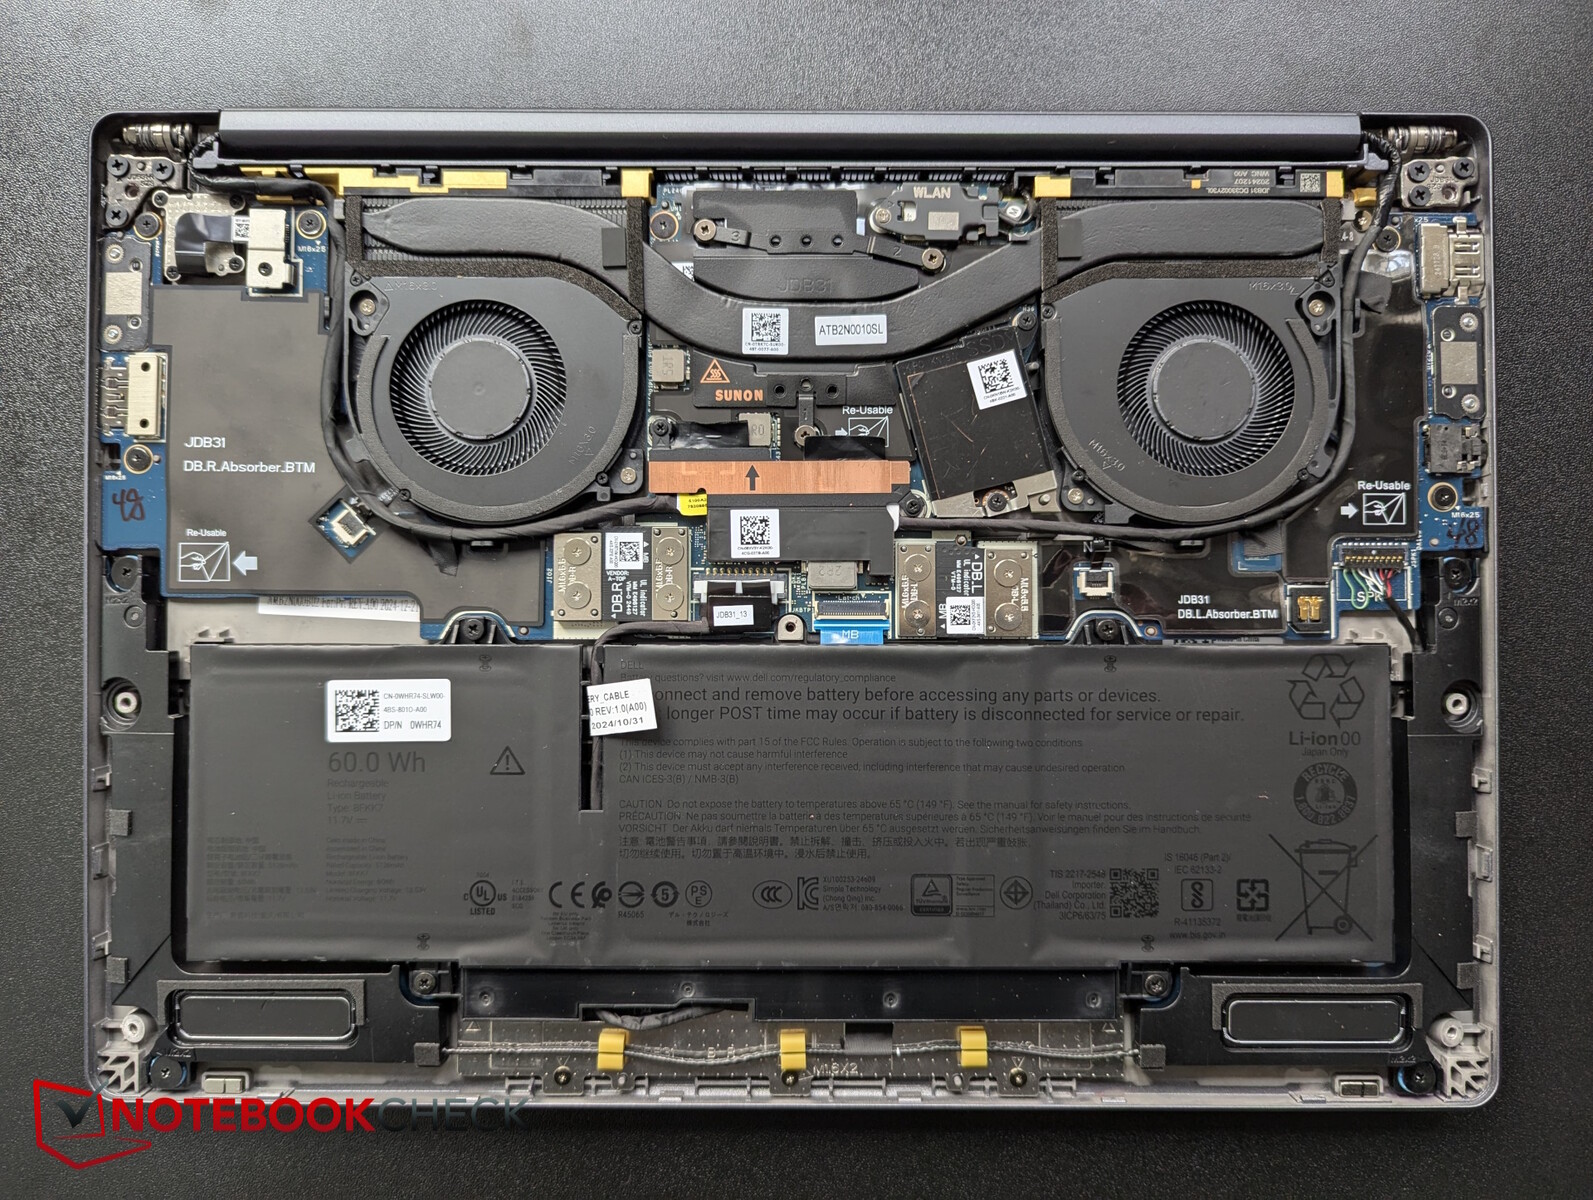
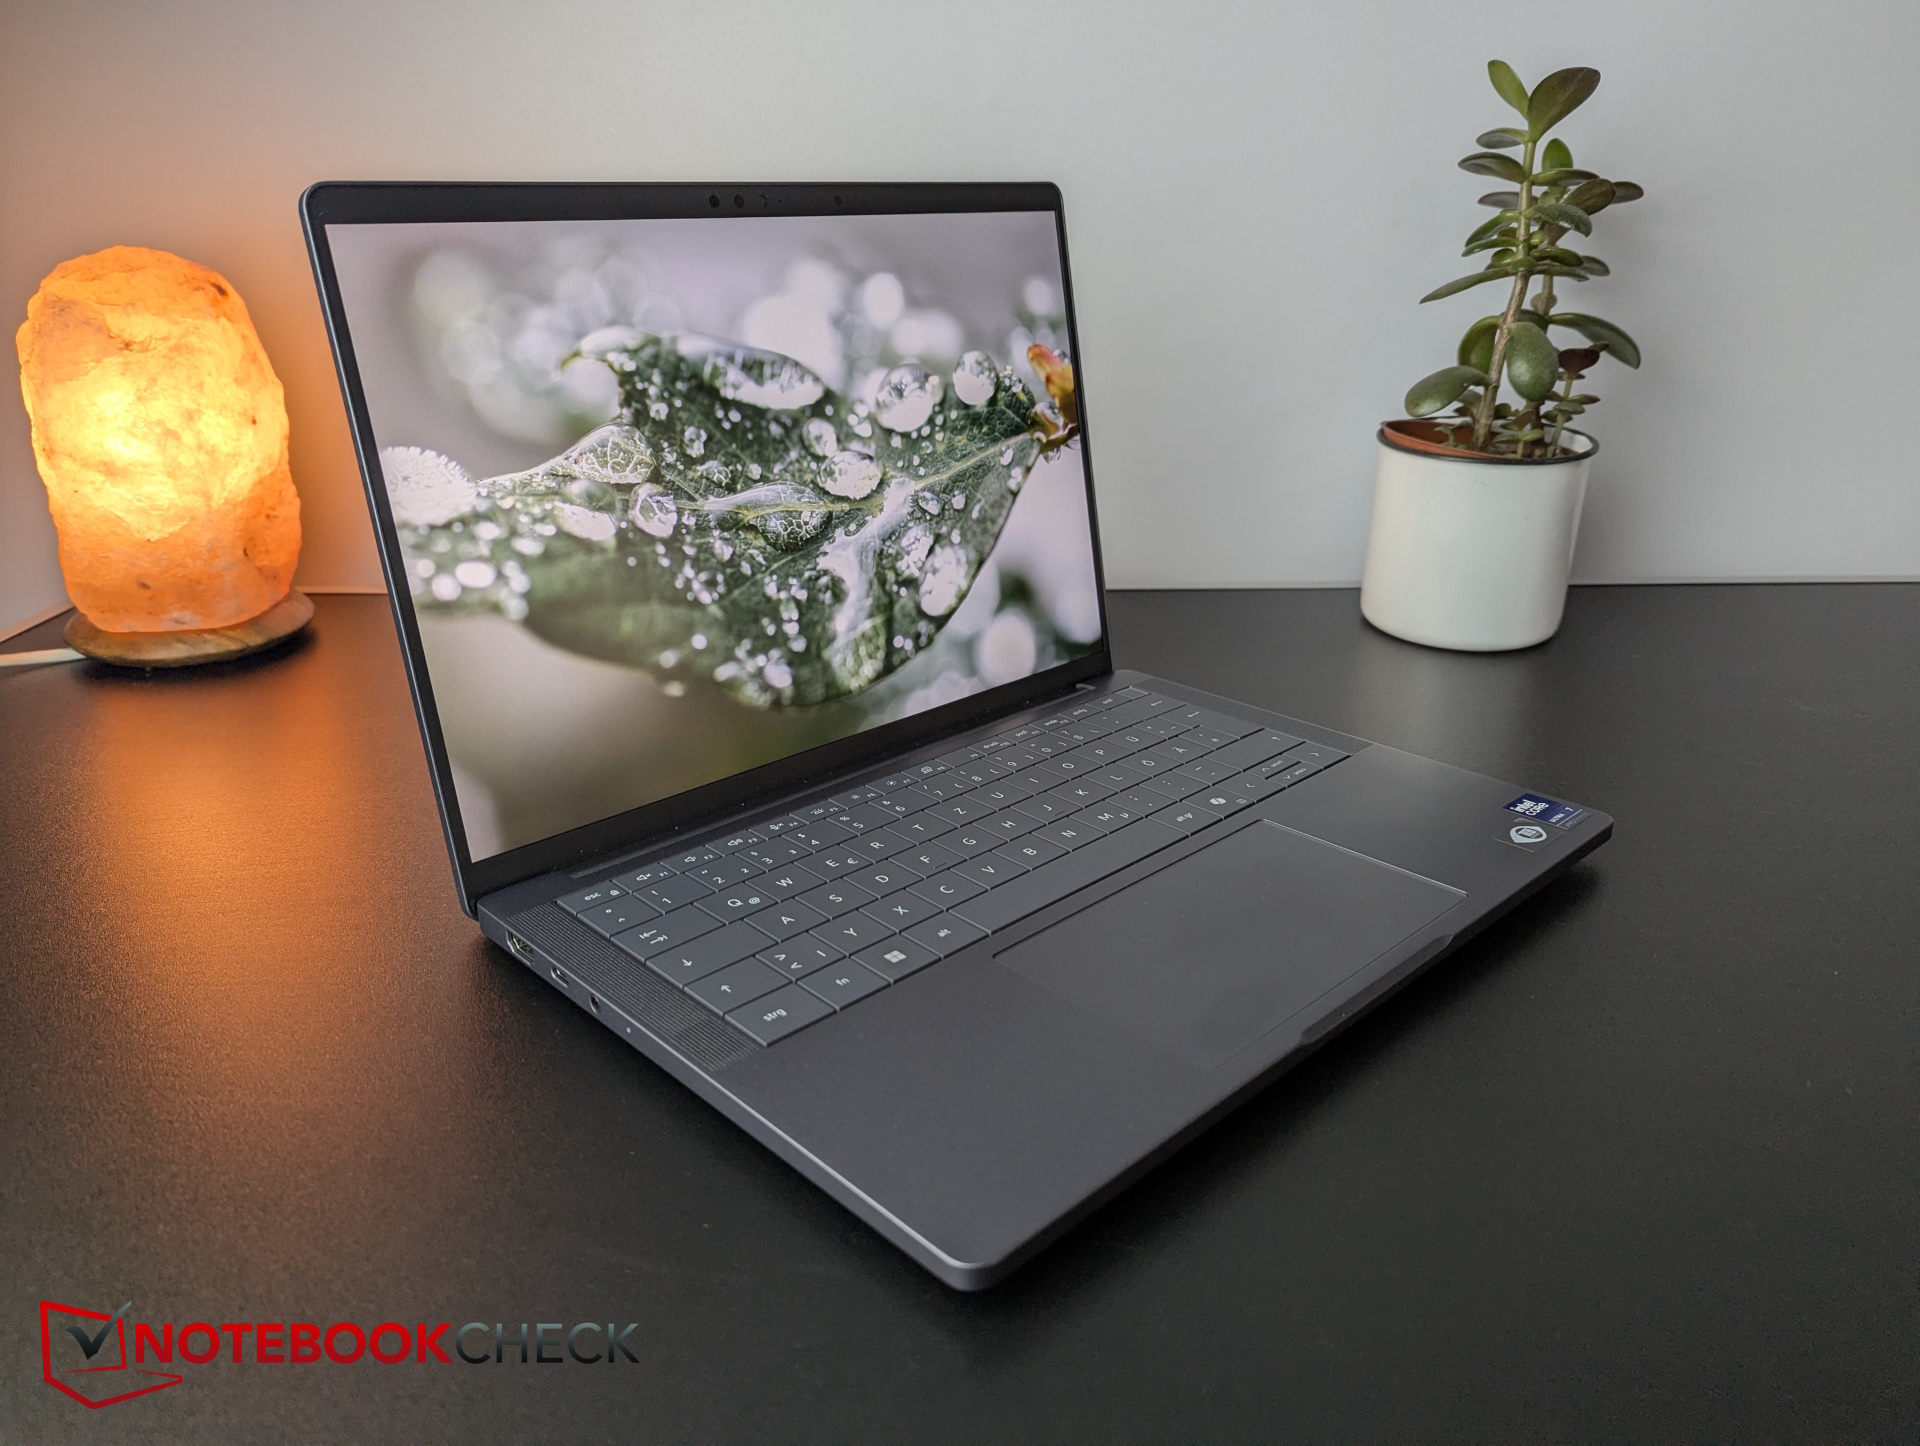
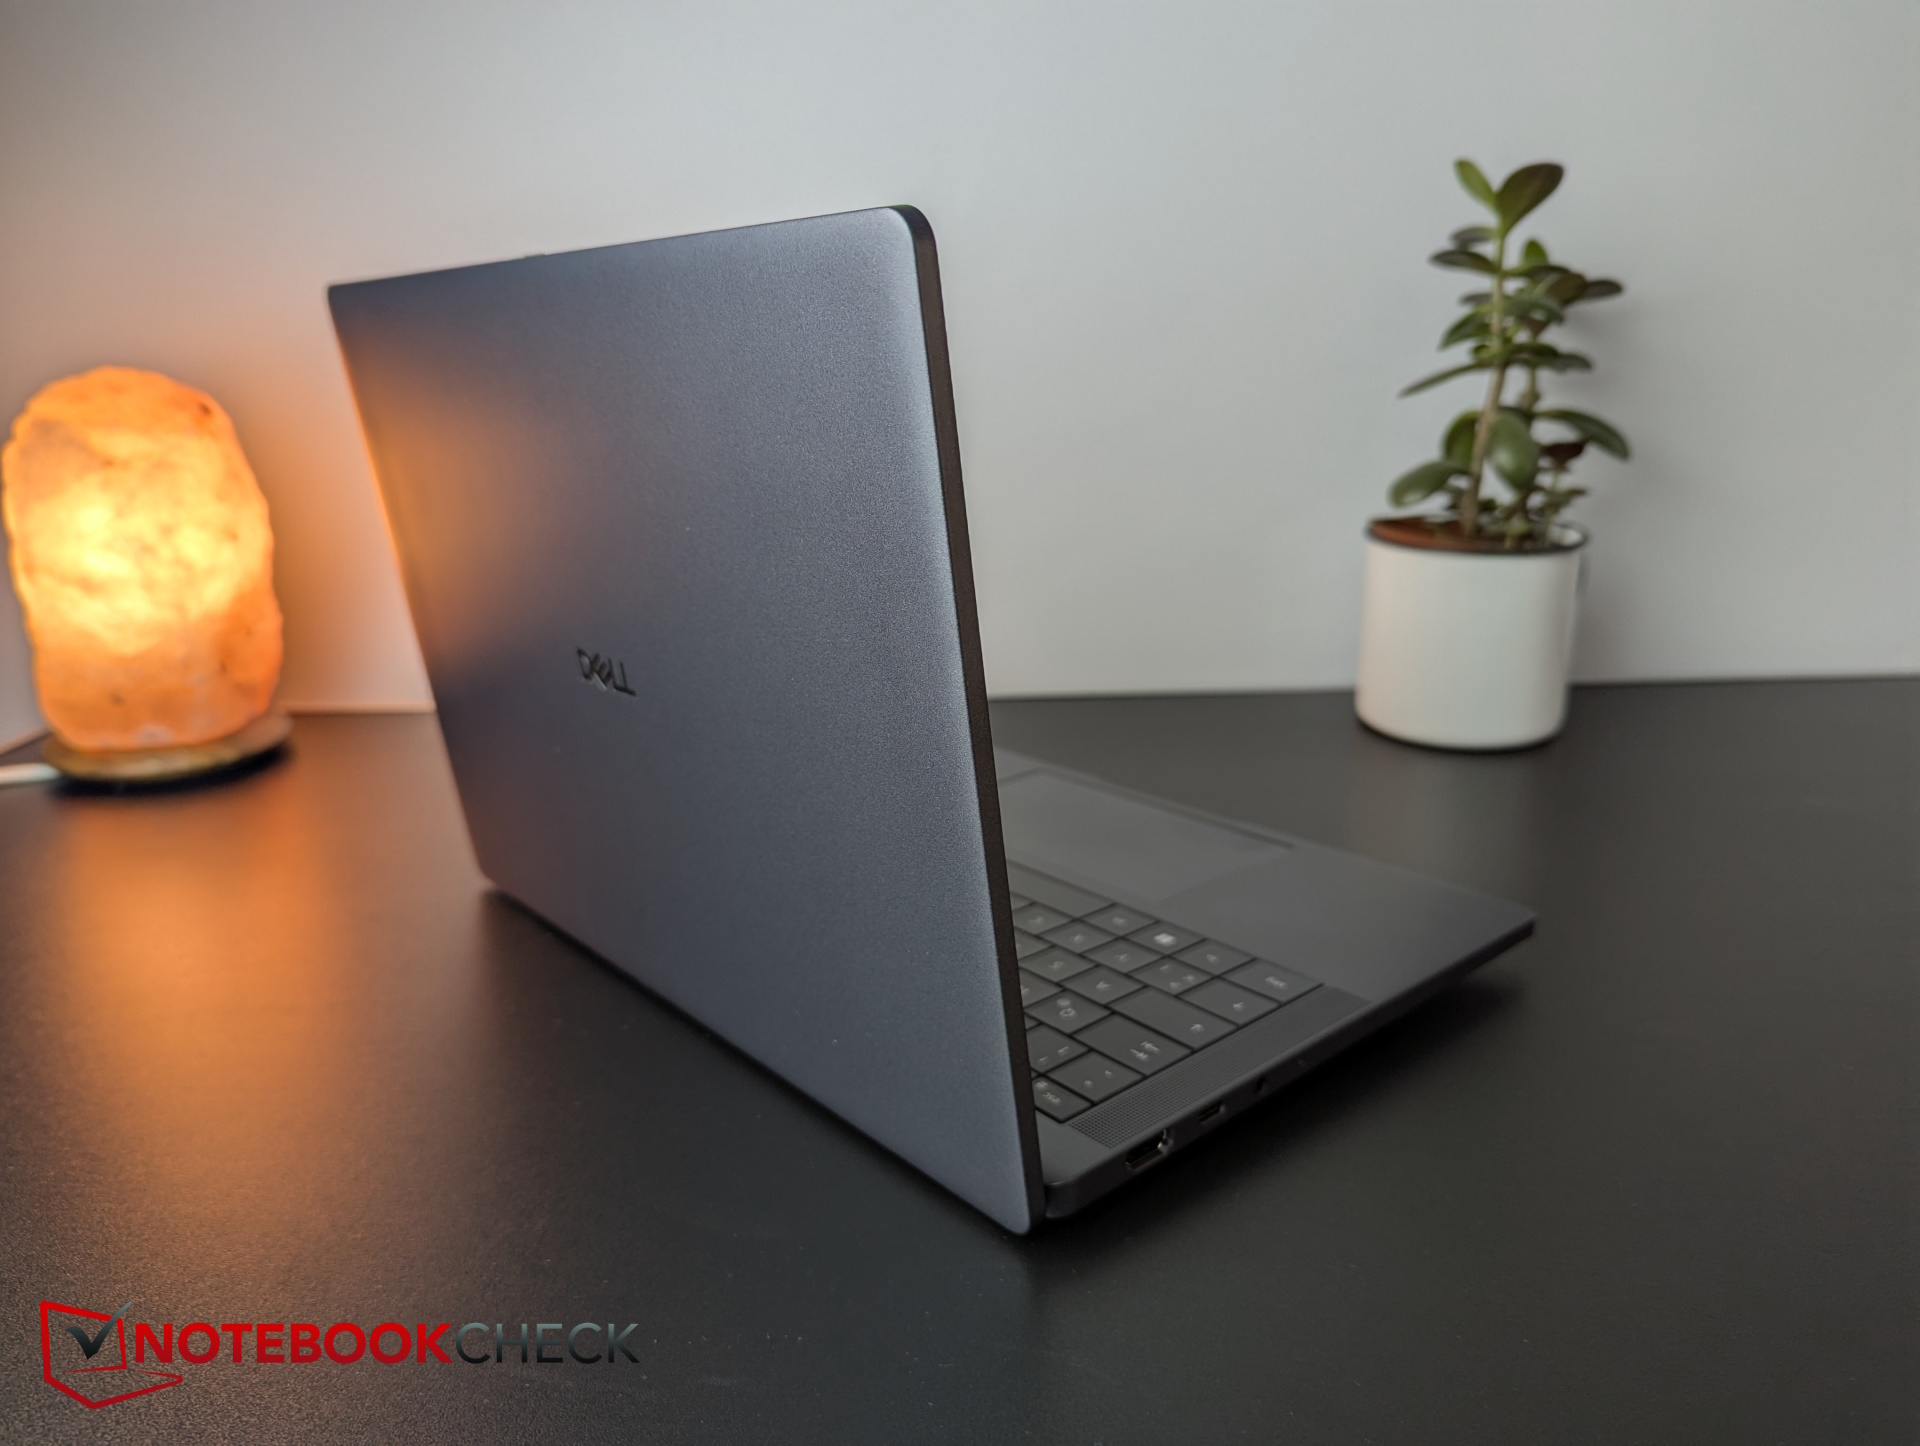
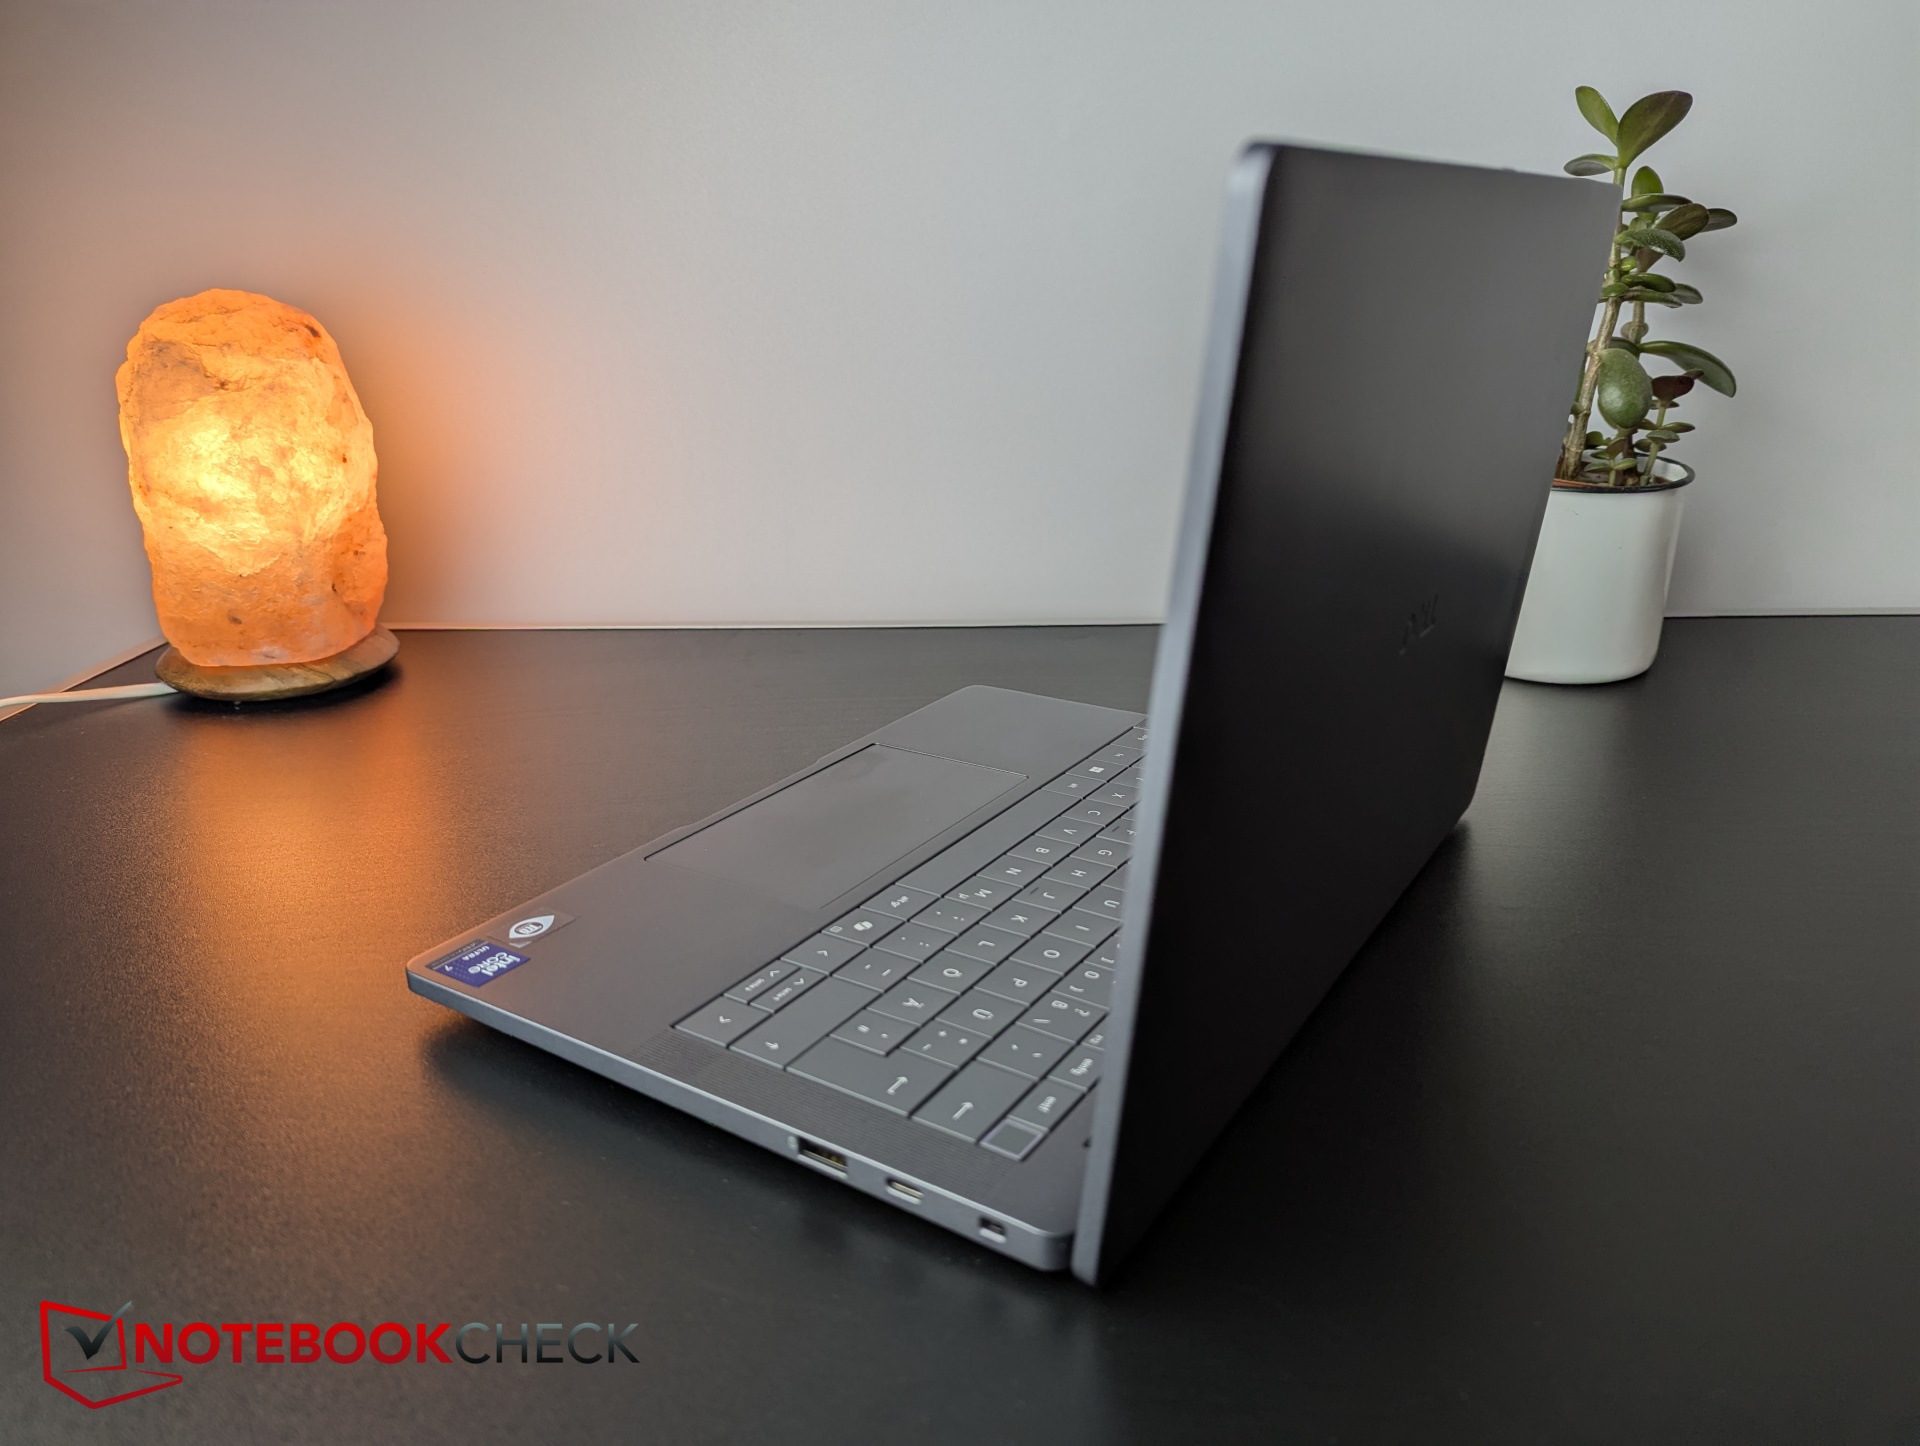
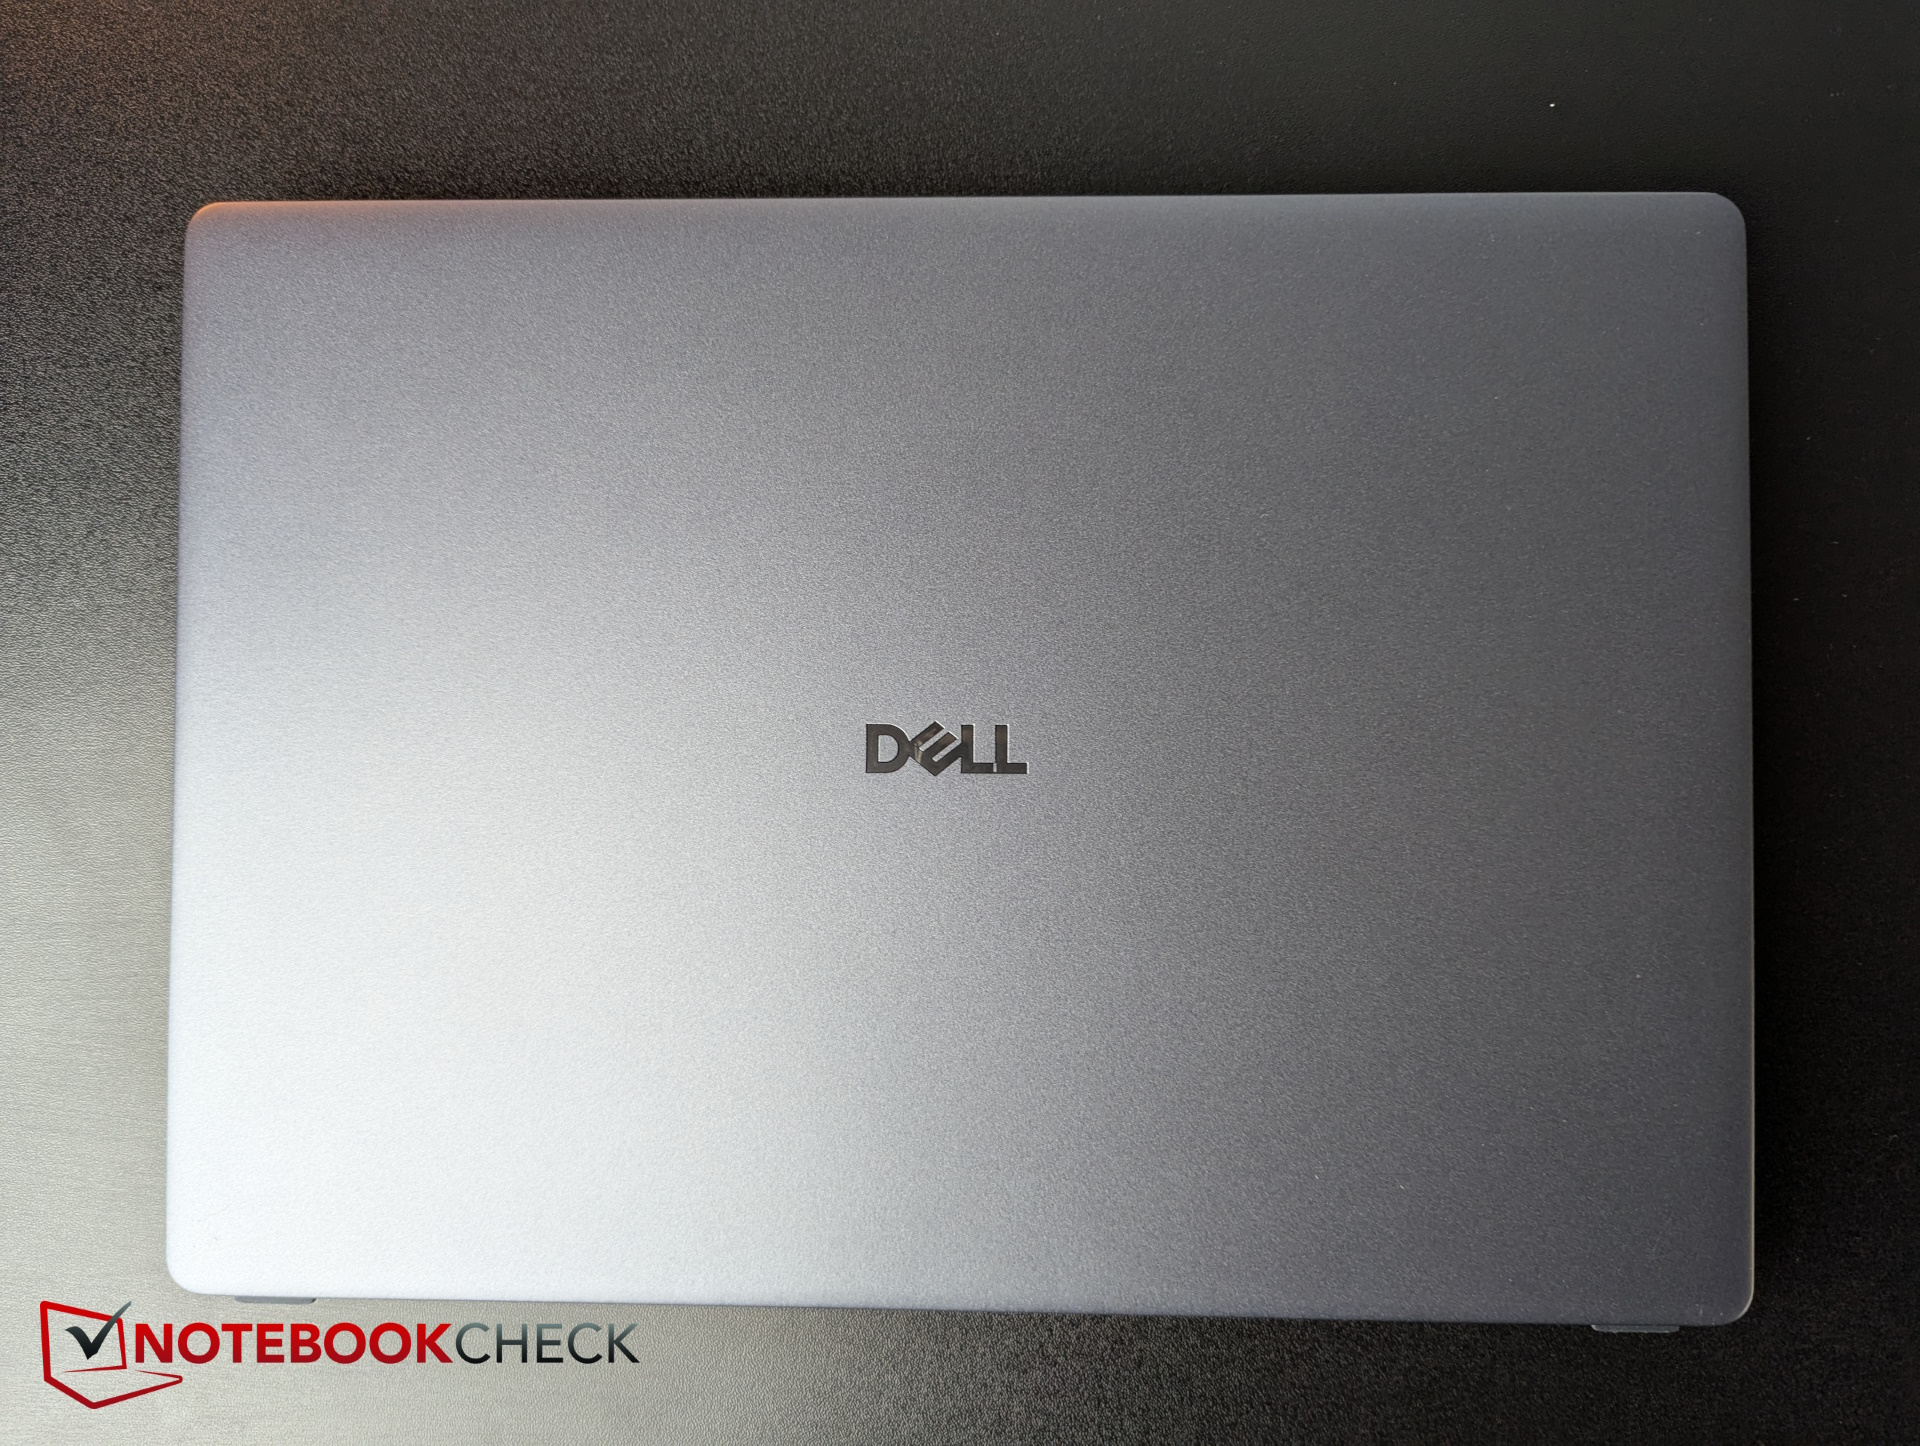
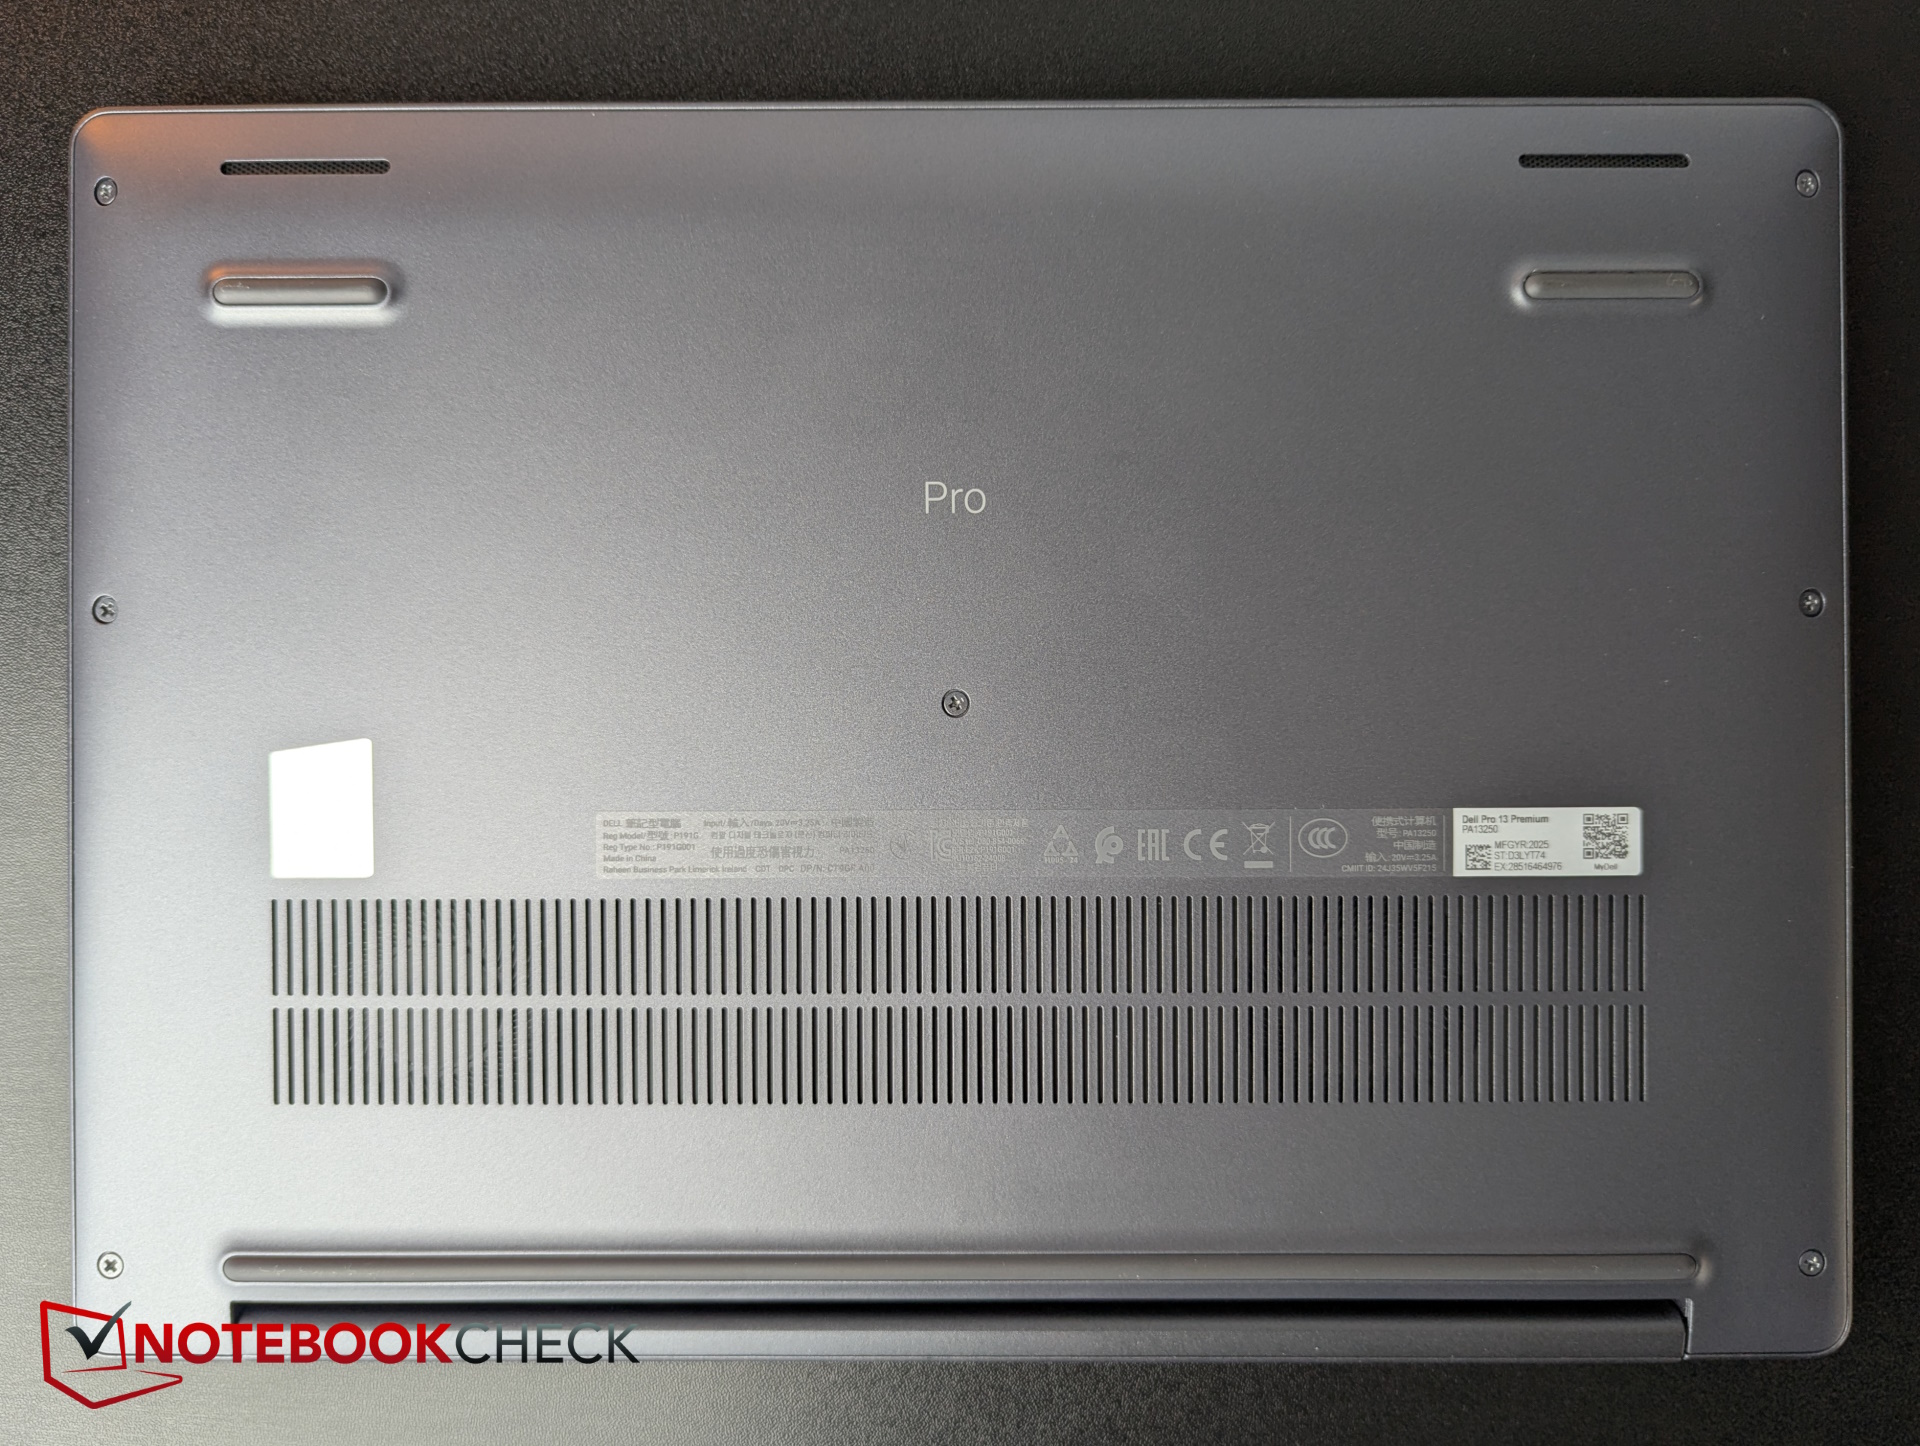
深灰色的外壳由 90% 的再生镁制成。这使得底座和 180 度的盖子非常稳固,我们在扭动设备时没有发现任何吱吱嘎嘎的声音。设计显得非常紧凑、简洁而优雅。
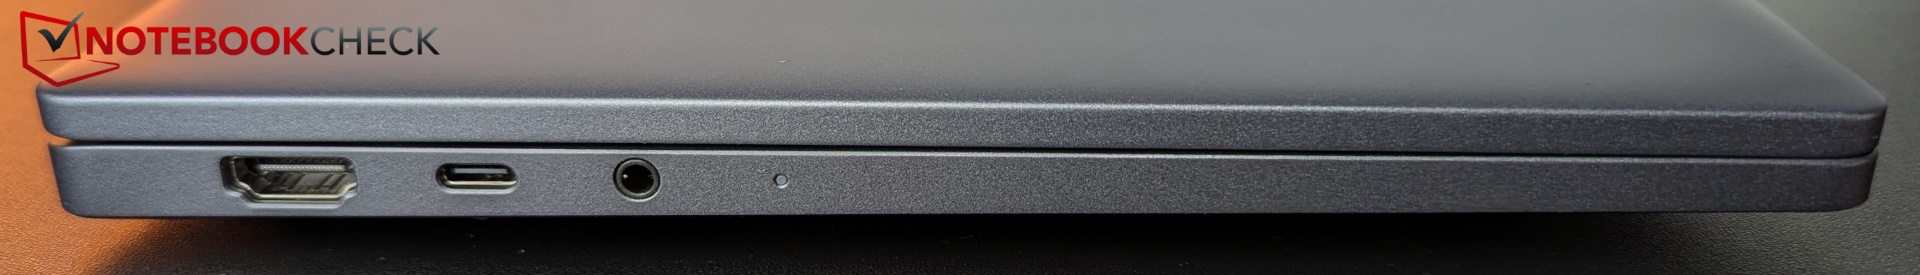
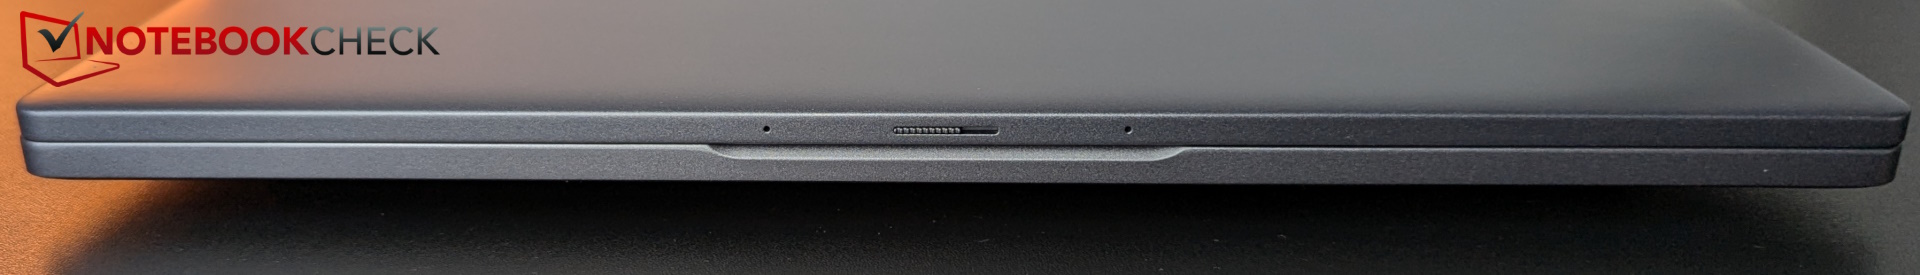
Pro 13 Premium 配备了两个 Thunderbolt 4 端口(两侧各一个)和一个全尺寸 HDMI 端口。电源按钮上集成了指纹传感器。没有读卡器或专用 LAN 端口。不过,戴尔提供 Wi-Fi 7。SIM 卡插槽为可选配置。
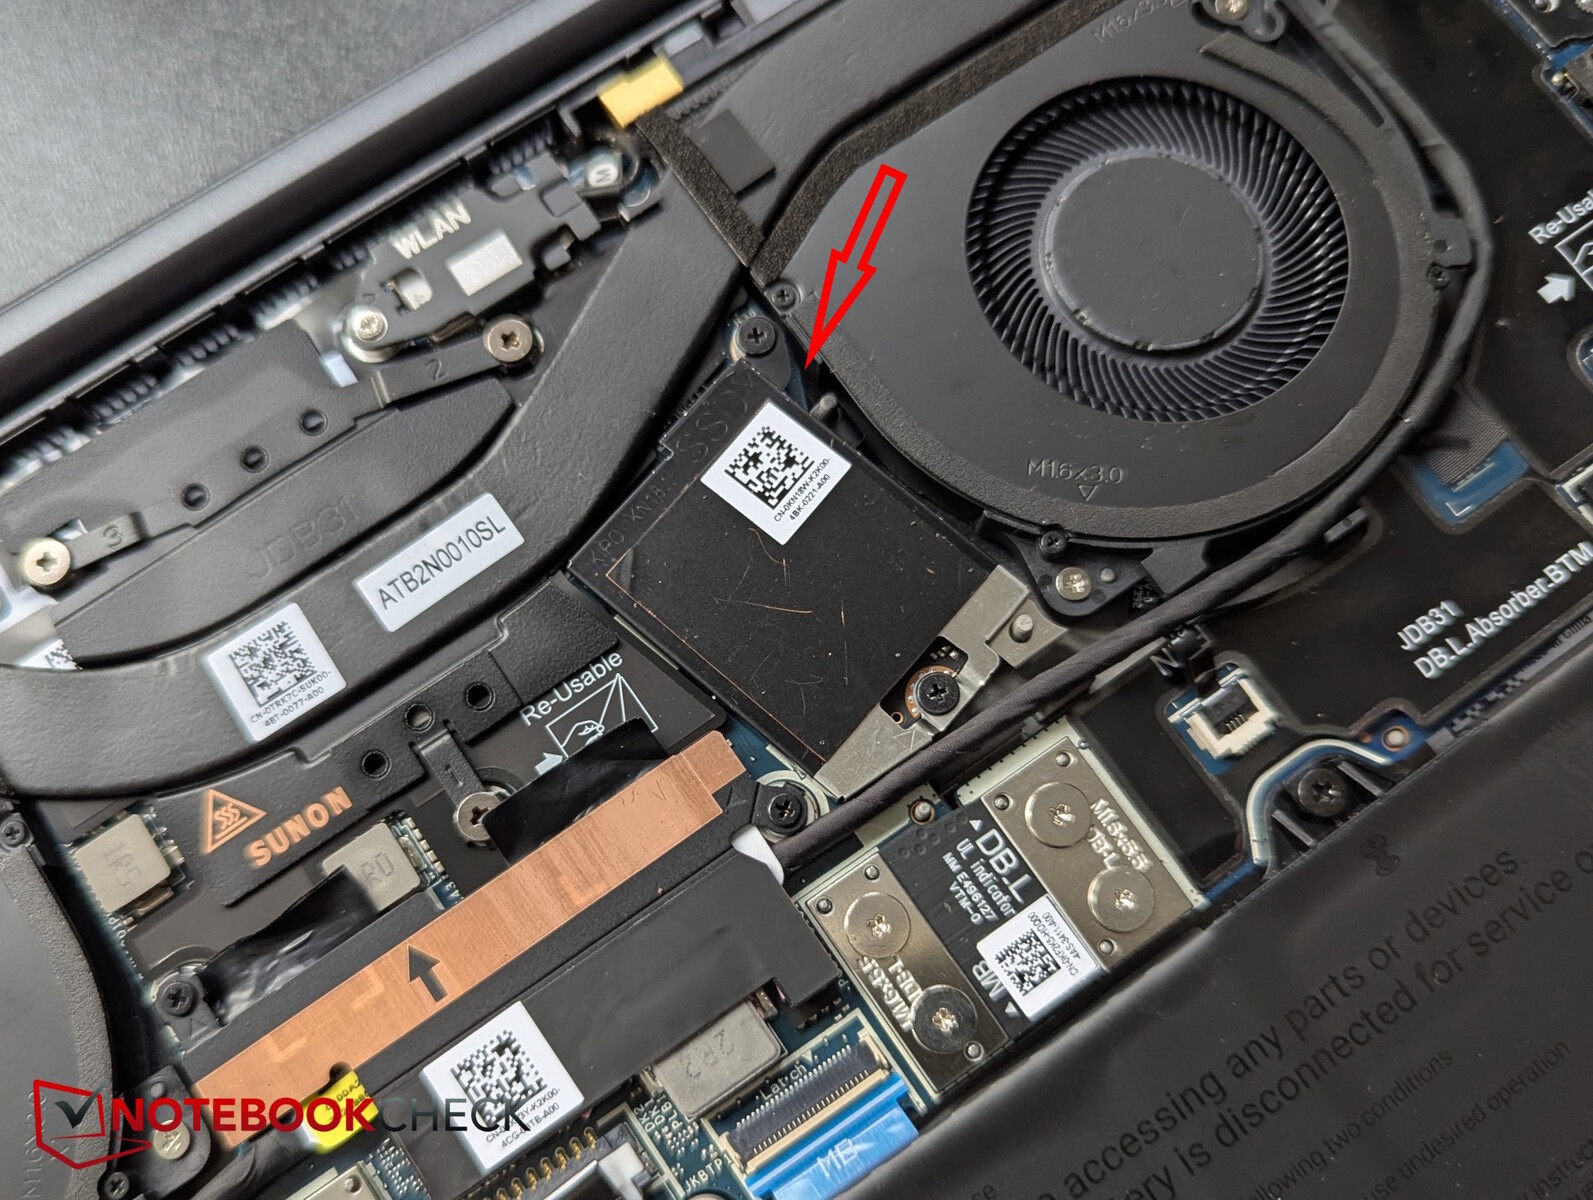
商务笔记本电脑的底板上还留有十字螺丝,打开相对容易。不过,内存和 Wi-Fi 模块是永久安装在内部的,固态硬盘也只是小型的 M.2 2230 格式,而且没有第二个插槽。
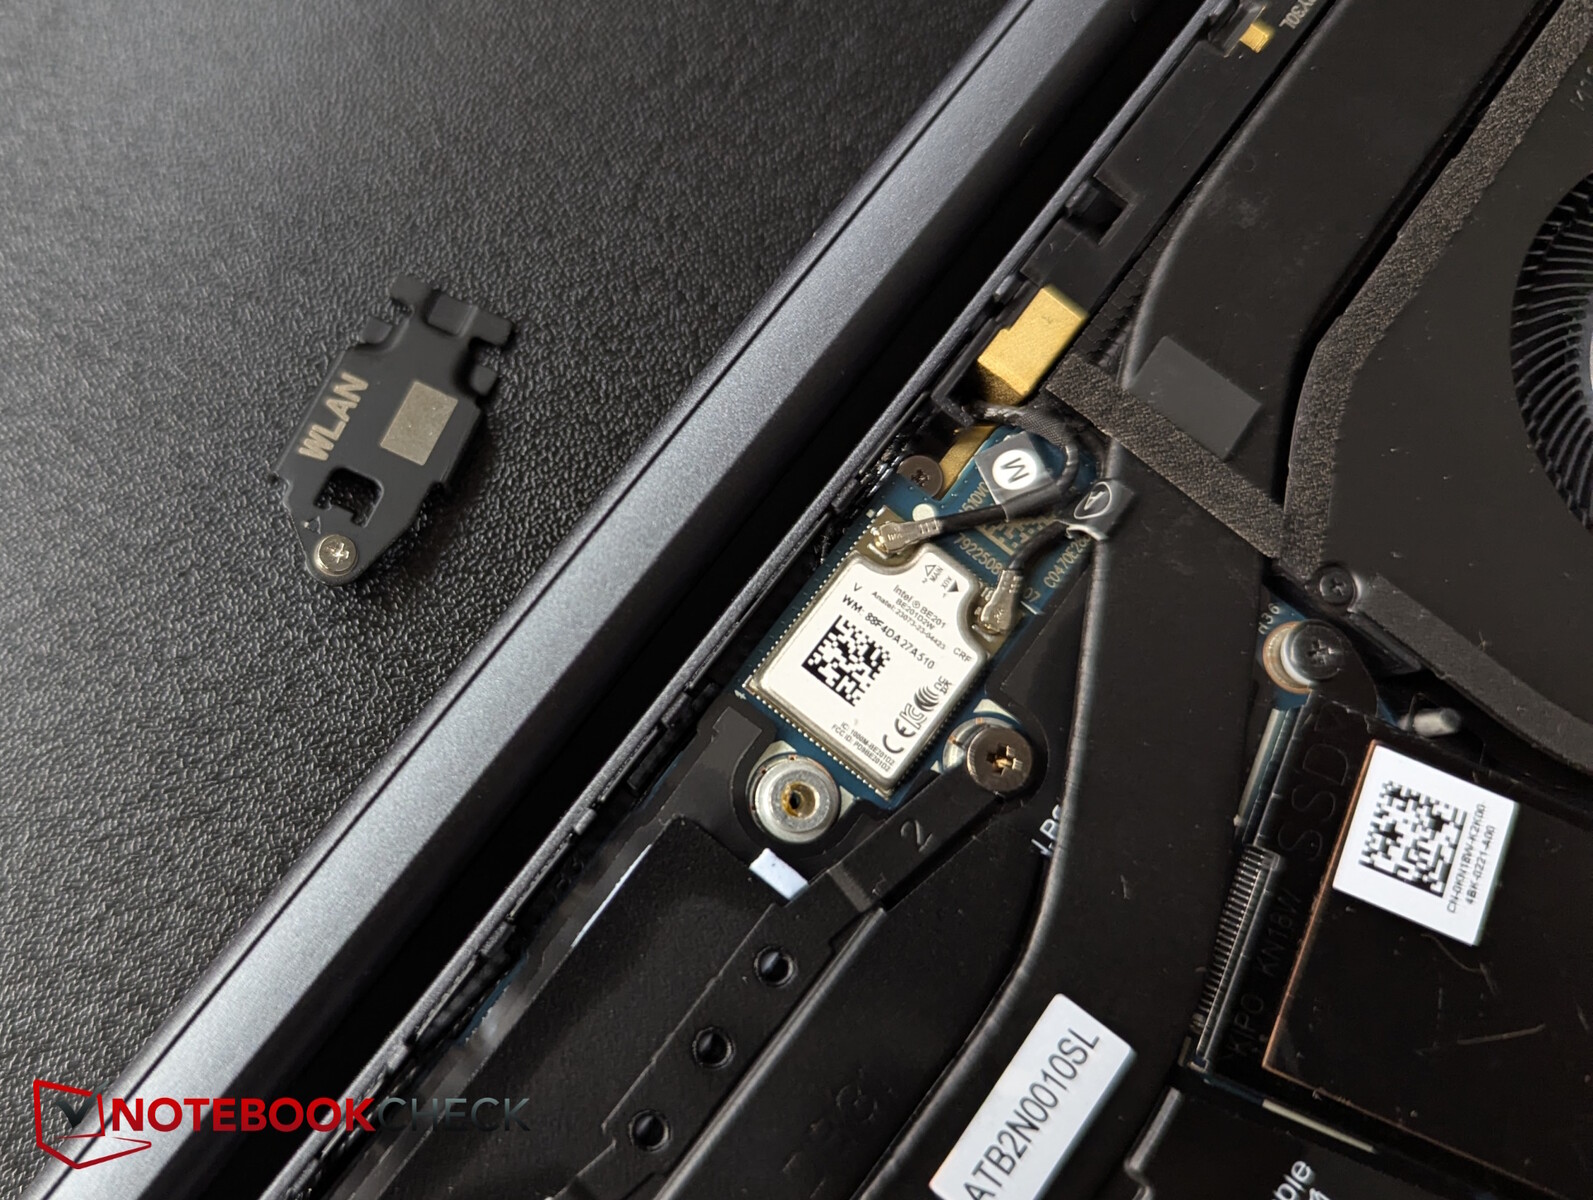

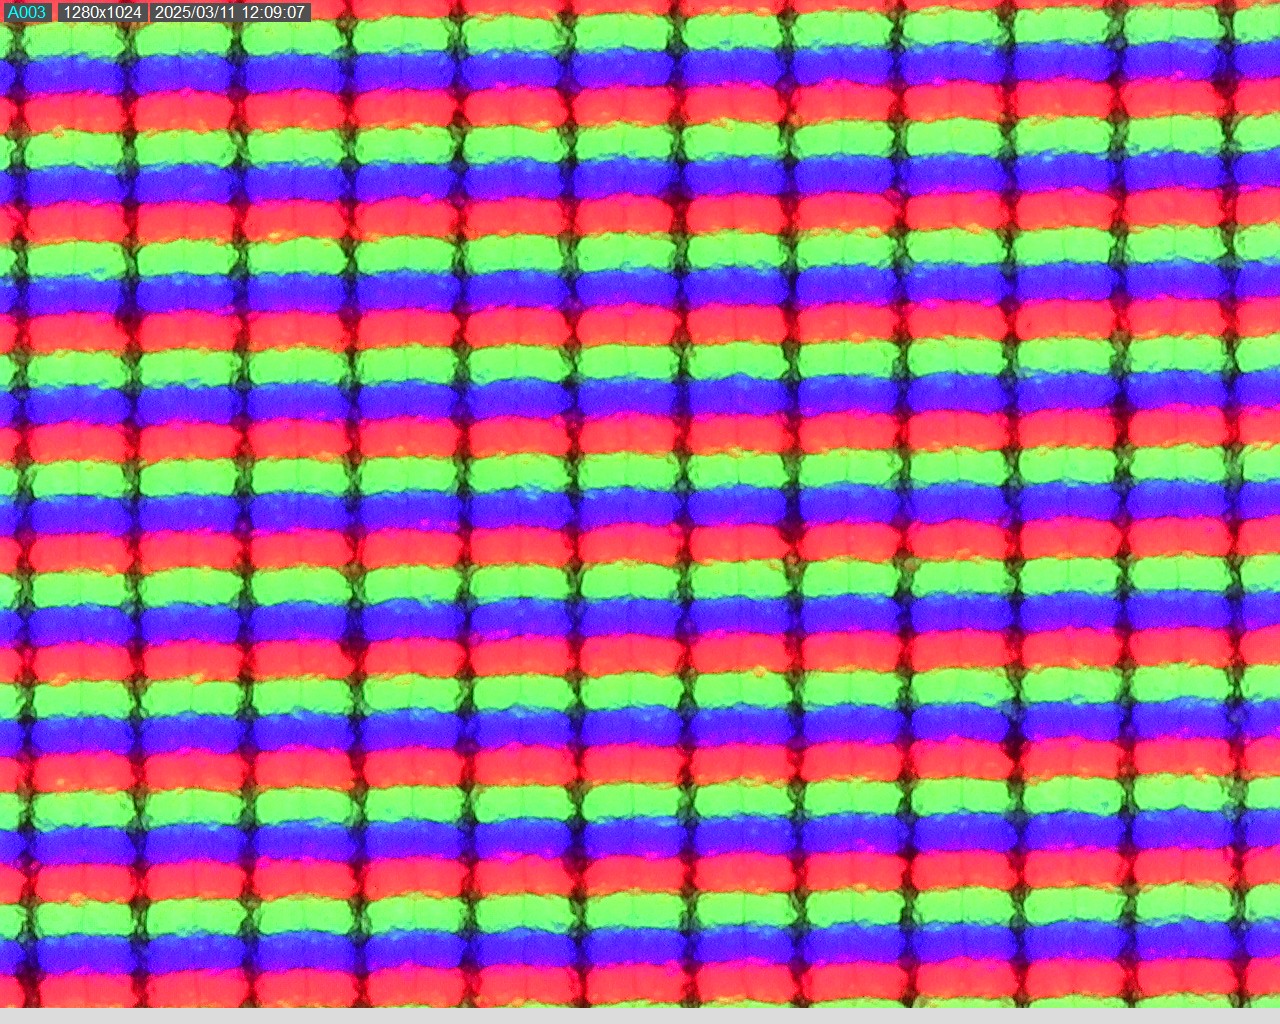
红外网络摄像头的分辨率高达 800 万像素,异常之高。这使得测试图像具有良好的清晰度,但色彩偏差属于中等偏高,尤其是在绿色范围内。WiFi 7 模块的传输速度一直很高。


可持续性
据华硕称,Pro 13 Premium 通过了能源之星认证、EPEAT Gold 注册,并获得了 Climate+ 认证。在功耗和可维修性方面,它还符合最新的 TCO 第 9 代认证。
使用的材料包括 PCR 塑料、再生镁、生物基塑料和再生钴,包装由 100% 再生或可再生材料制成,主要是纸板。
输入设备 - 13 Premium 配备电话会议触摸板
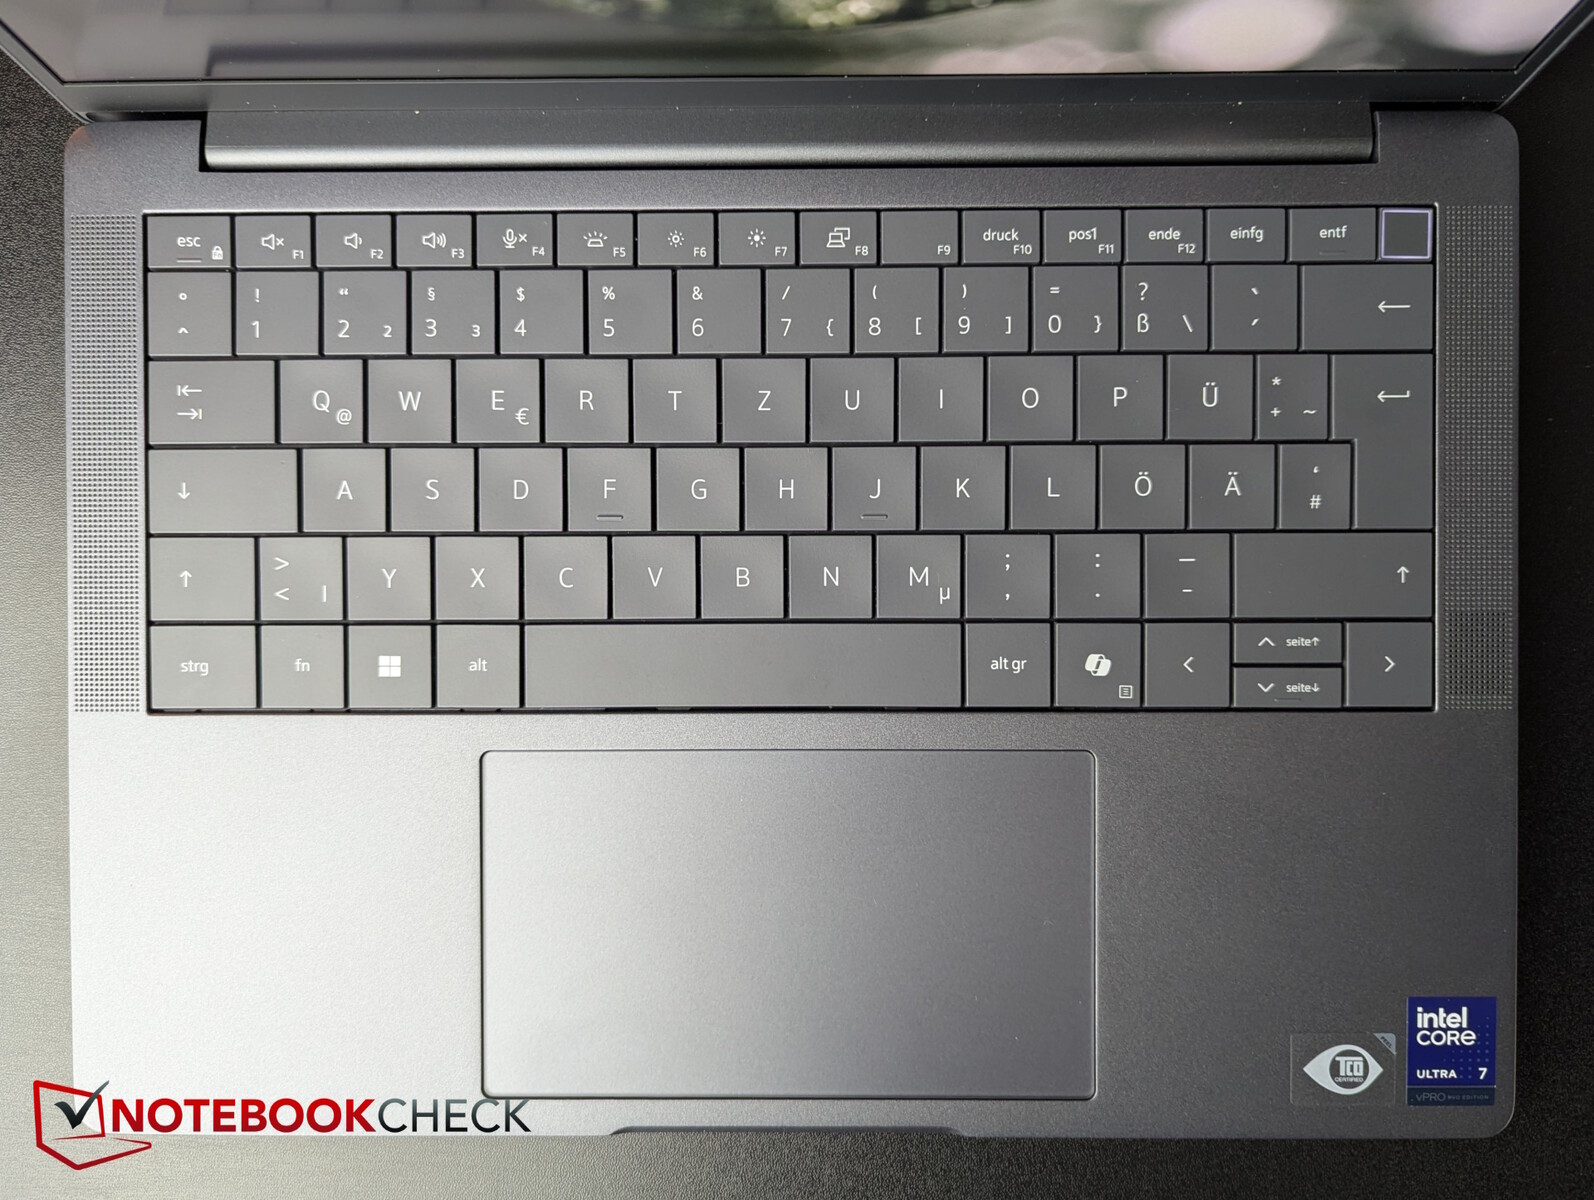
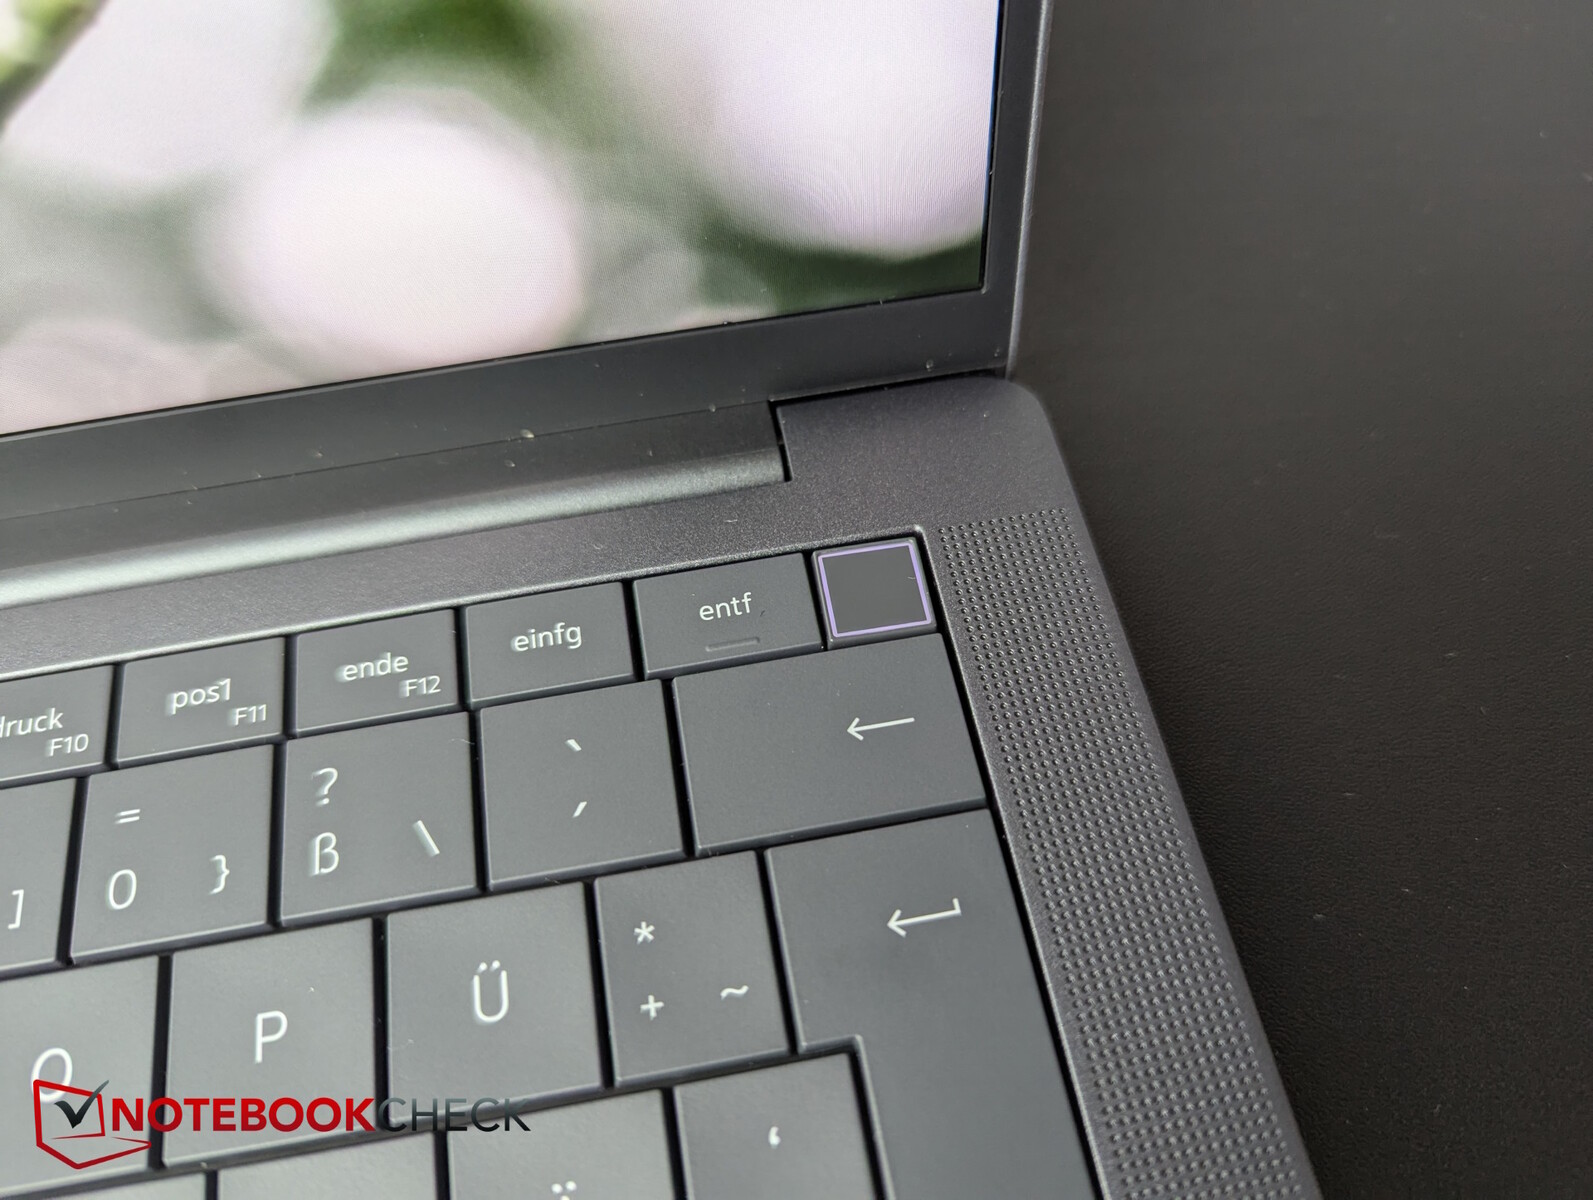
戴尔的键盘布局非常简洁紧凑,按键较大(约 1.7 厘米),按键之间没有缝隙,垂直方向键的高度减半。键盘右上方的电源键集成了指纹传感器。
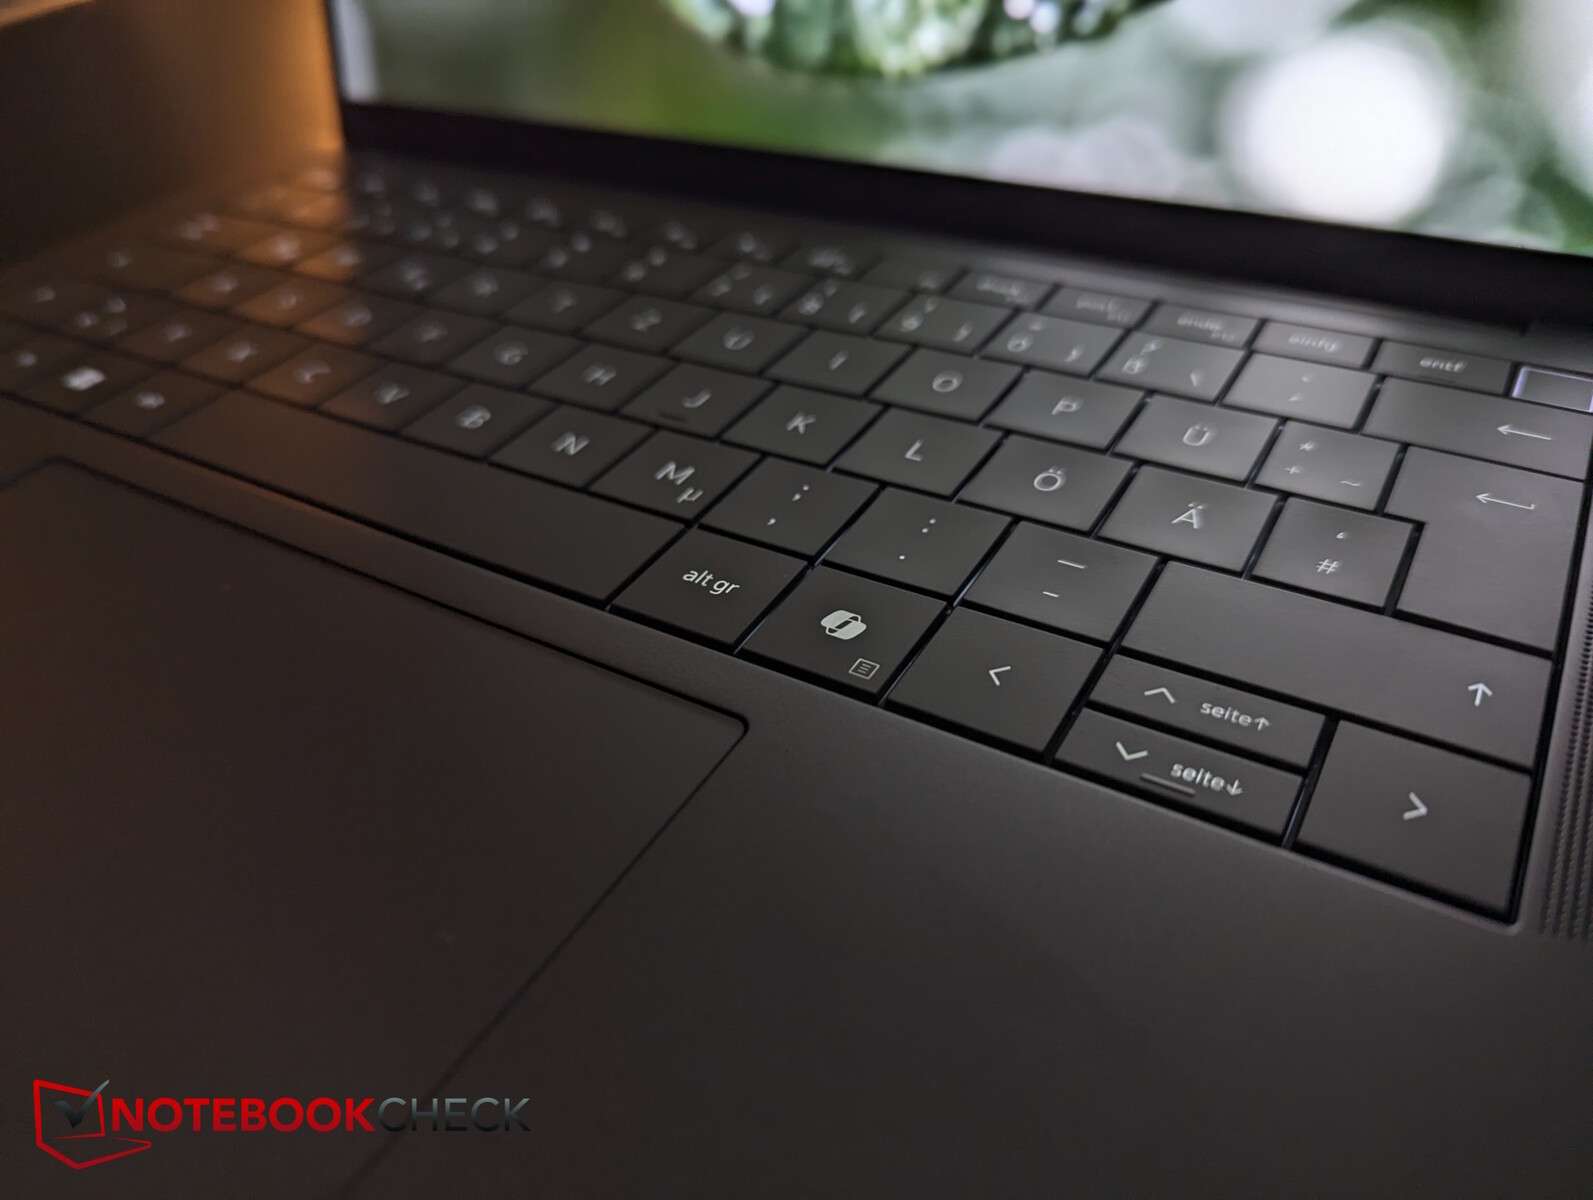
按键行程为浅至中等,但反馈明显。这样用户就可以快速键入,按键噪音也比较适中。由于采用了微型 LED,两段式背光的功耗据说降低了 75%。
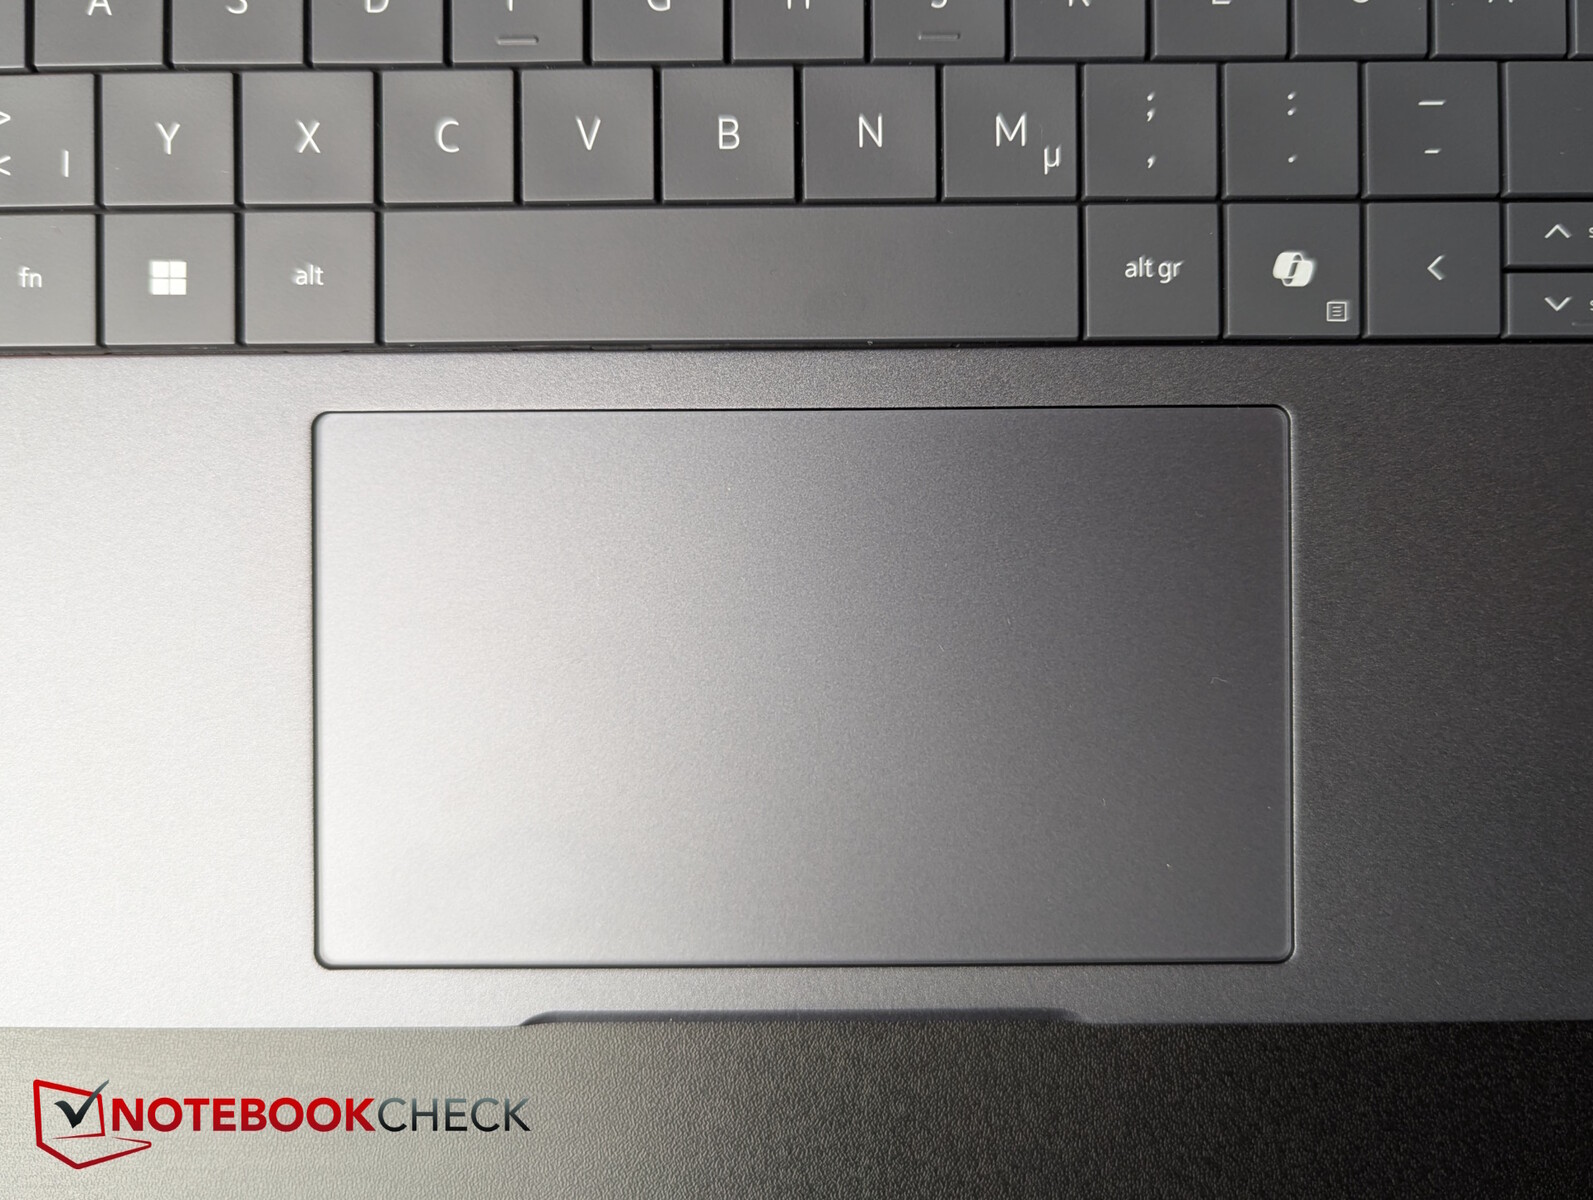
触摸板的尺寸约为 12.5 x 7.1 厘米,最突出的特点是在顶排加入了视频聊天专用键(摄像头开/关、屏幕共享、聊天、麦克风开/关)。只有在 Zoom 或 Microsoft Teams 通话时才能看到触摸符号。触摸屏表面非常光滑,但如果刚洗过手或由于其他原因手指略微潮湿,就会出现明显的卡顿现象。集成的鼠标按键点击声音小,反馈悦耳,触发可靠。
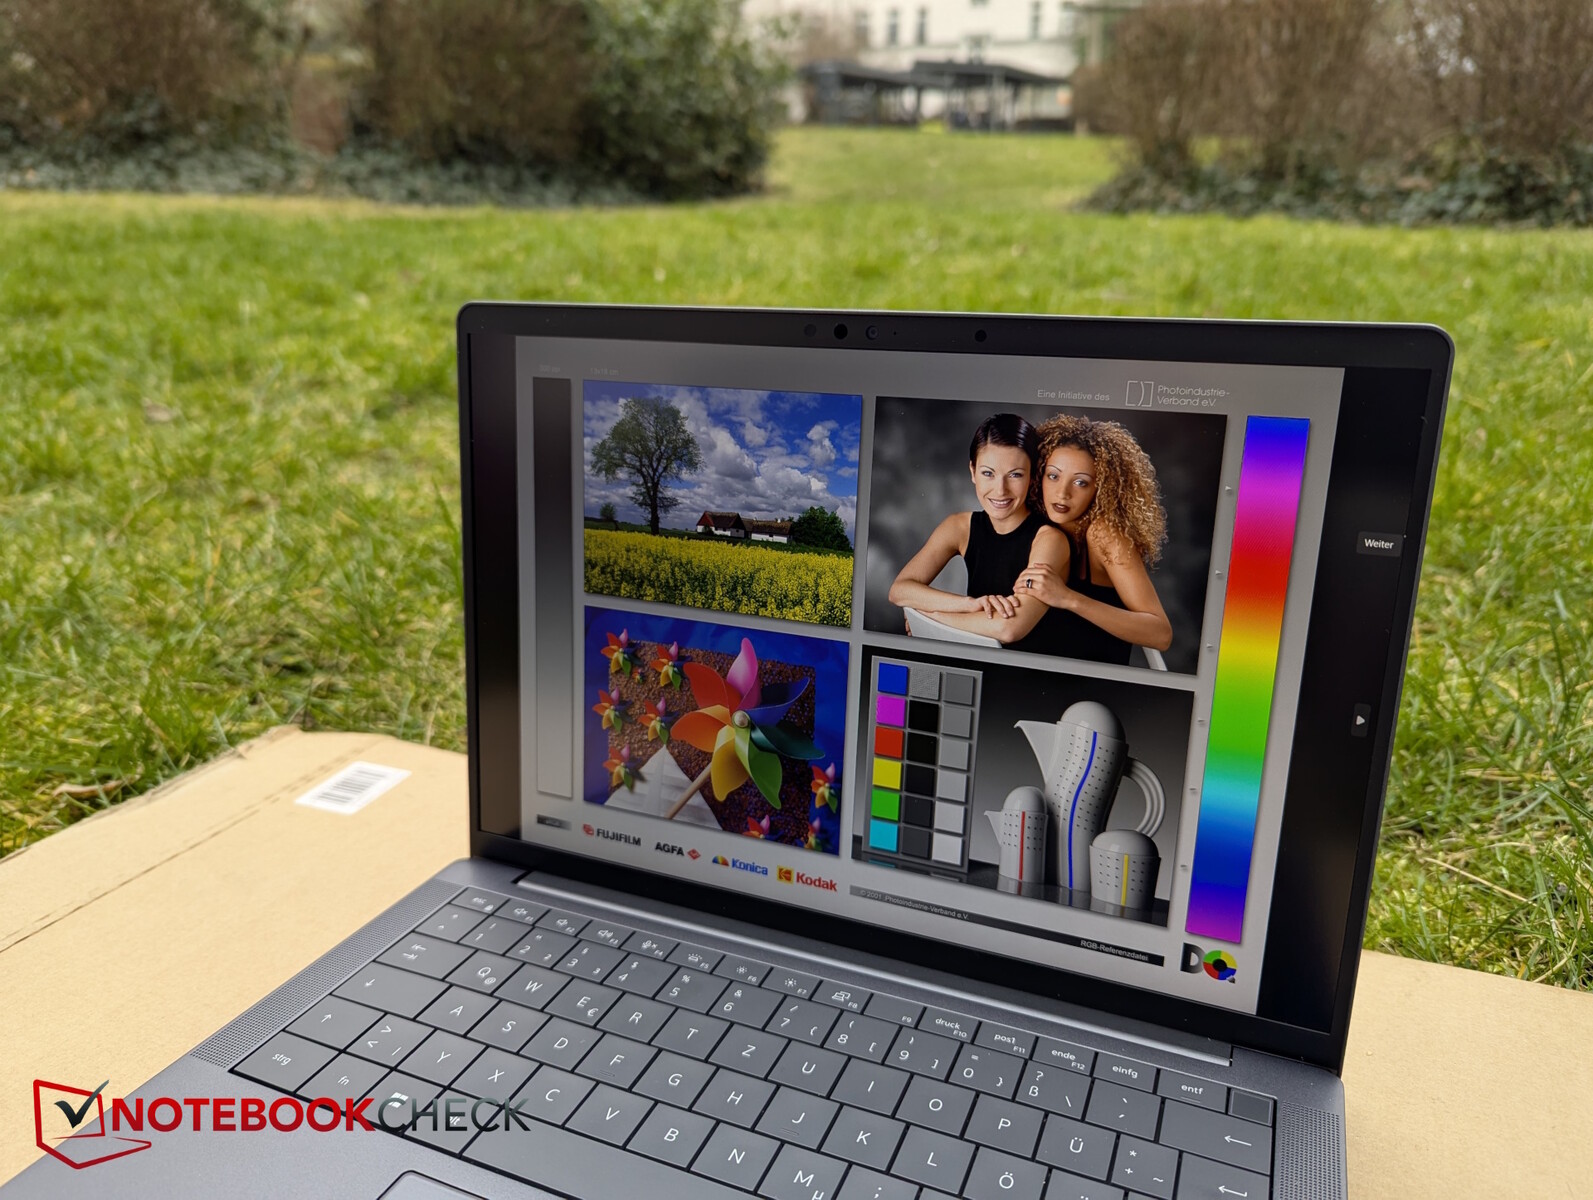
显示屏 - 高对比度办公面板,提供其他选项
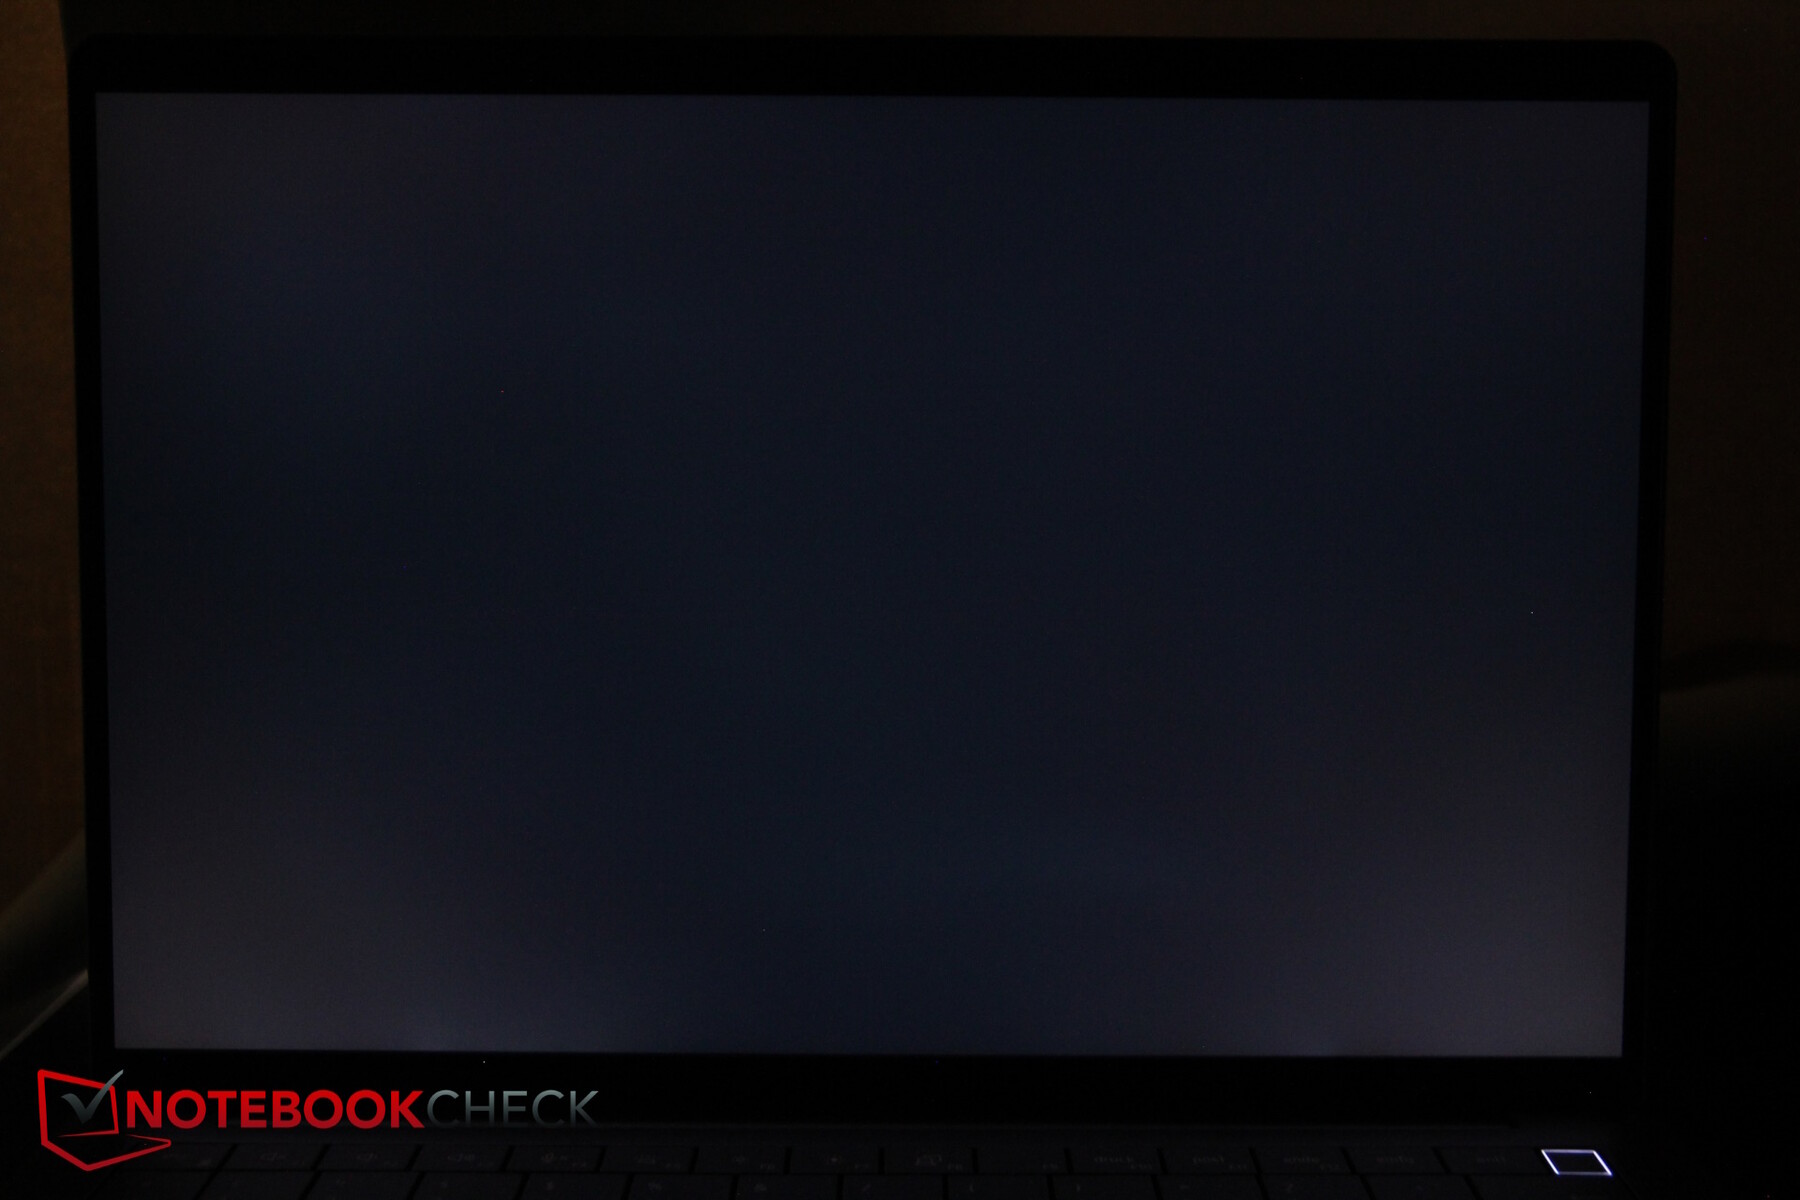
有几种显示屏可供选择,但我们现在看到的是哑光、16:10 长宽比、1,920 x 1,200 显示屏,官方亮度为 400 尼特,没有触摸输入功能。另外还有一个 300 尼特的版本,以及分辨率为 2,560 x 1,600 像素、500 尼特和触摸功能的顶级版本。戴尔强调其所有显示器都特别节能。
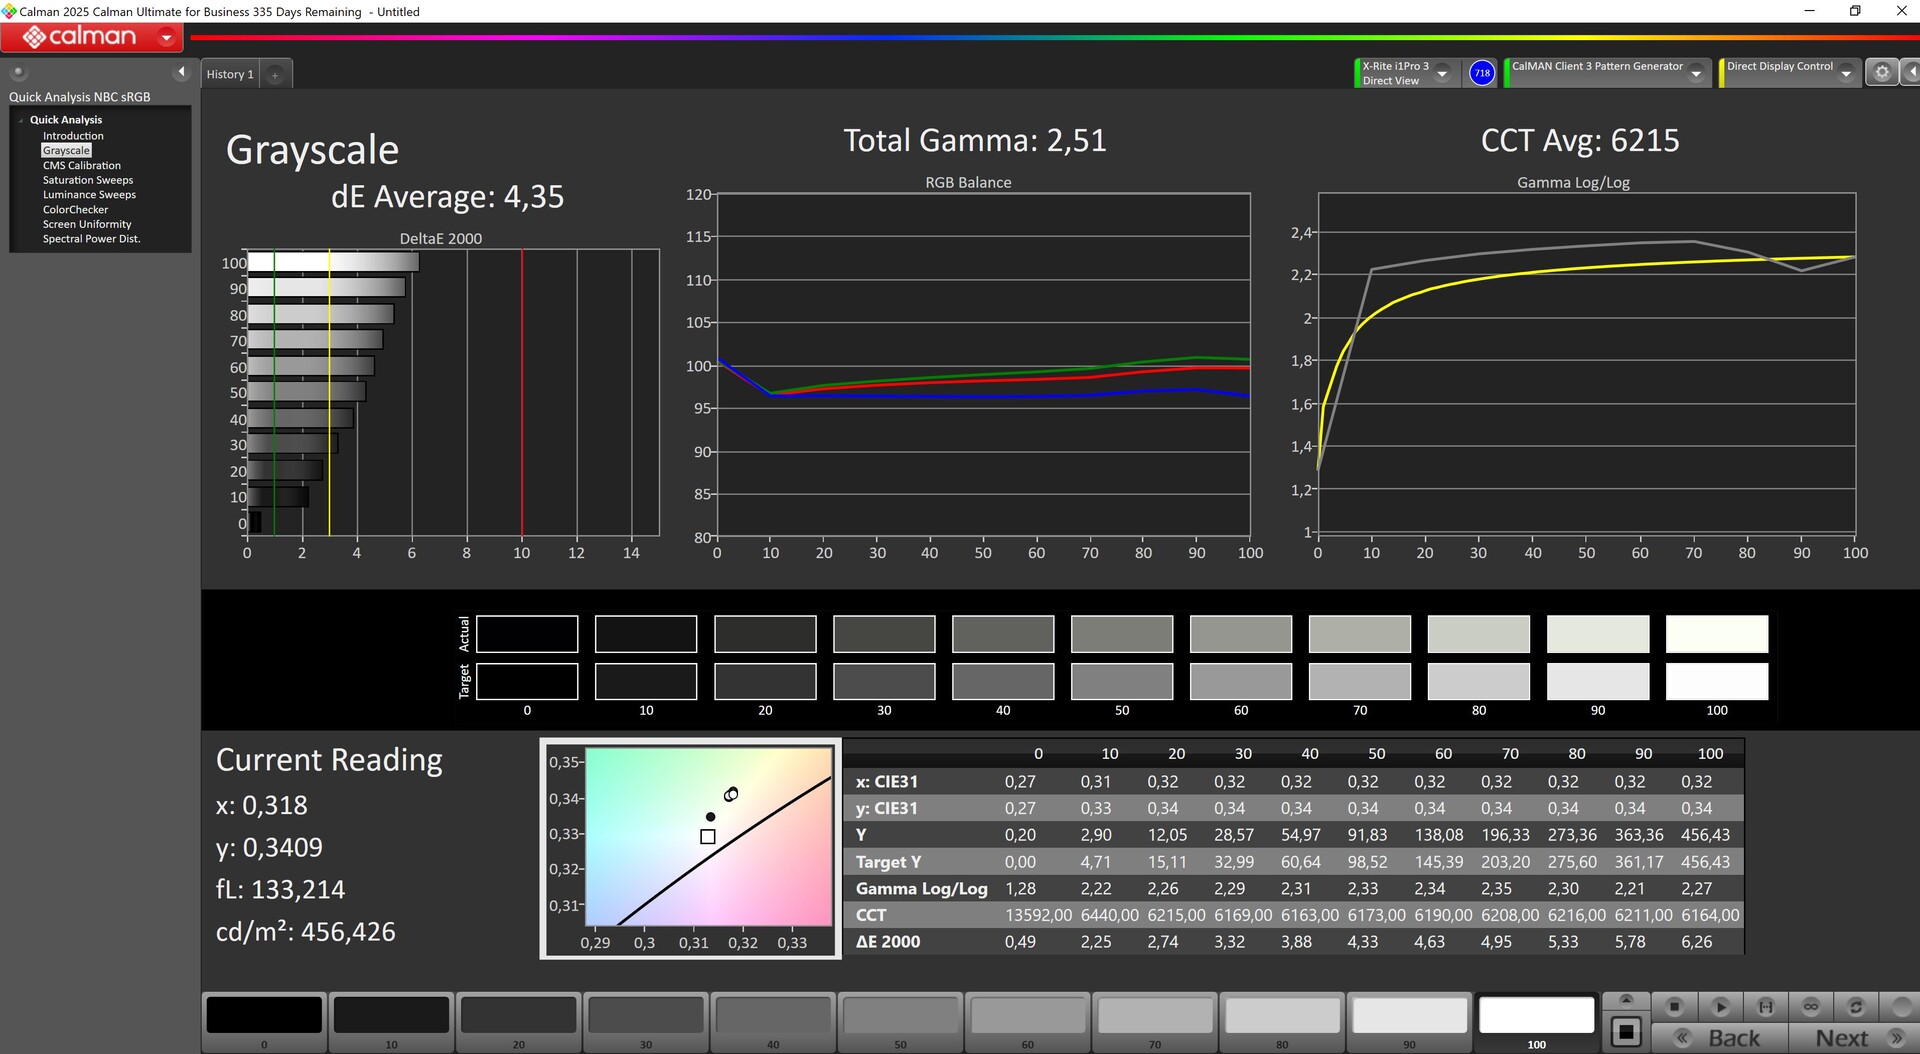
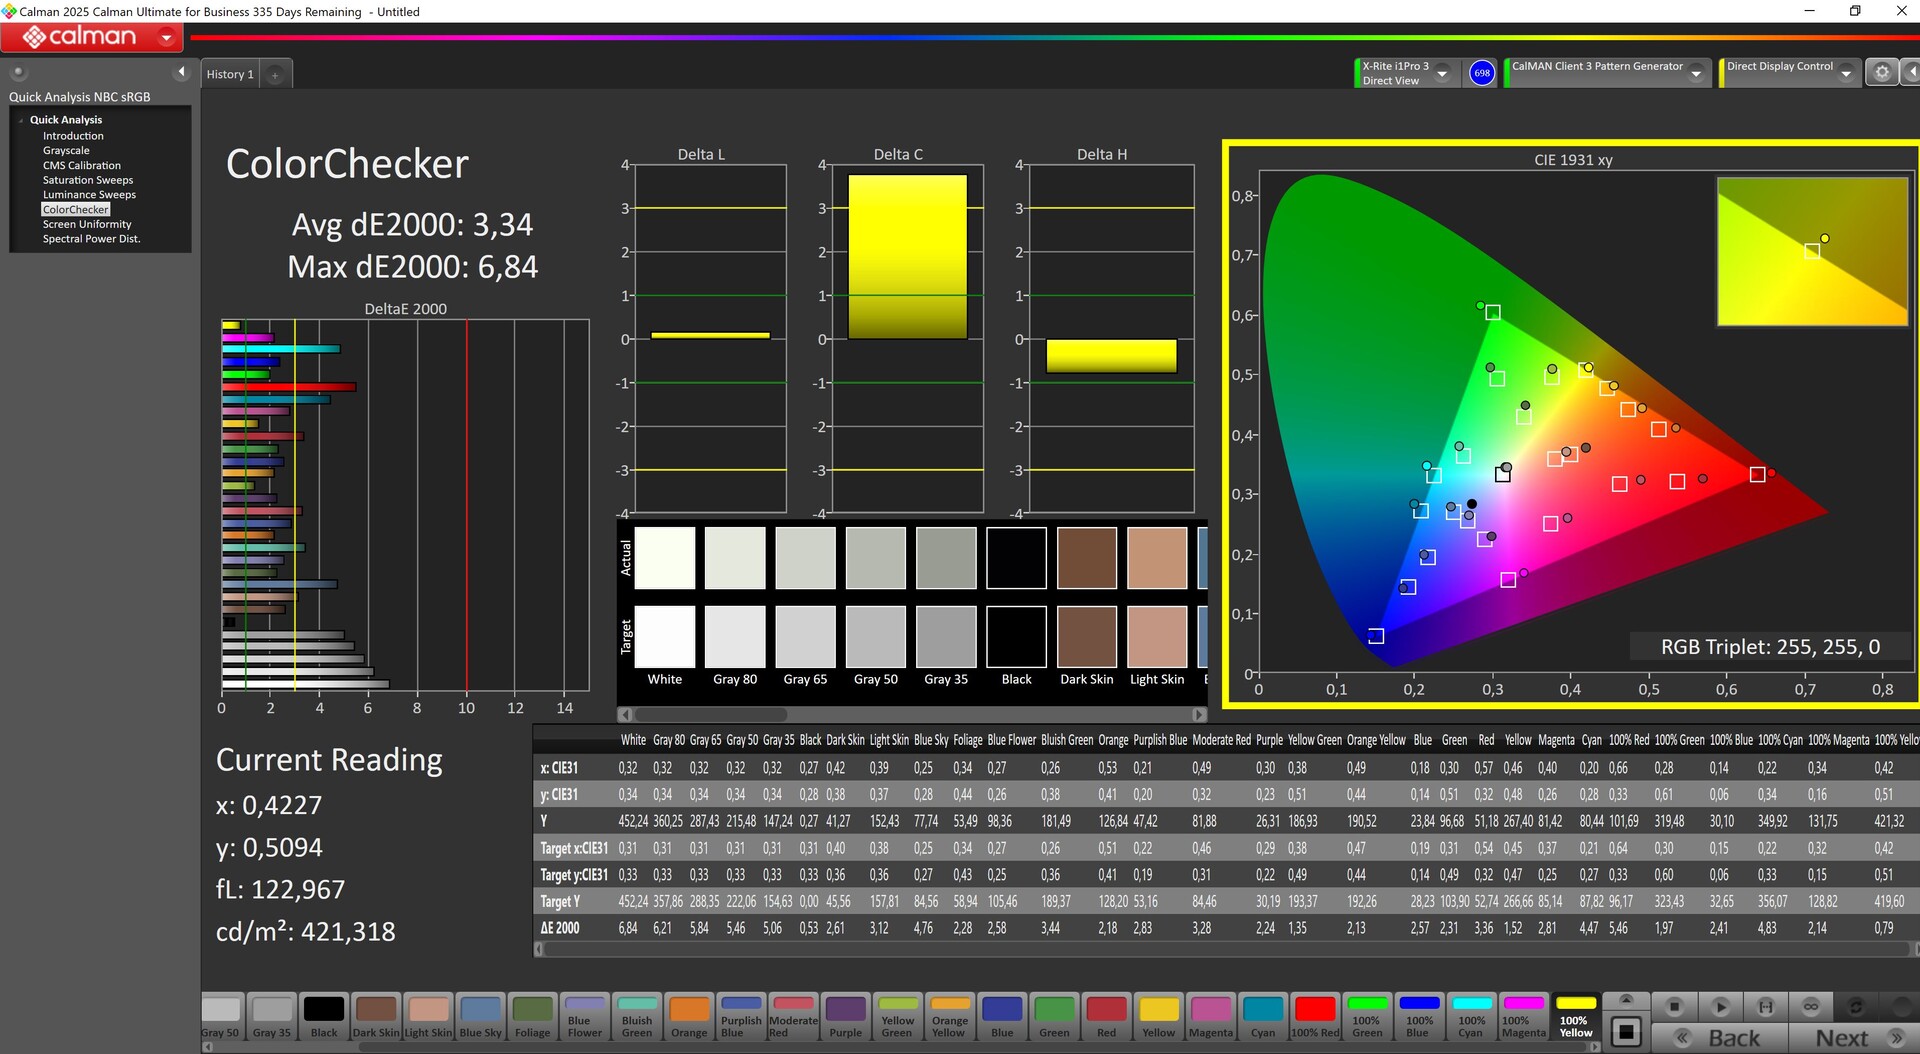
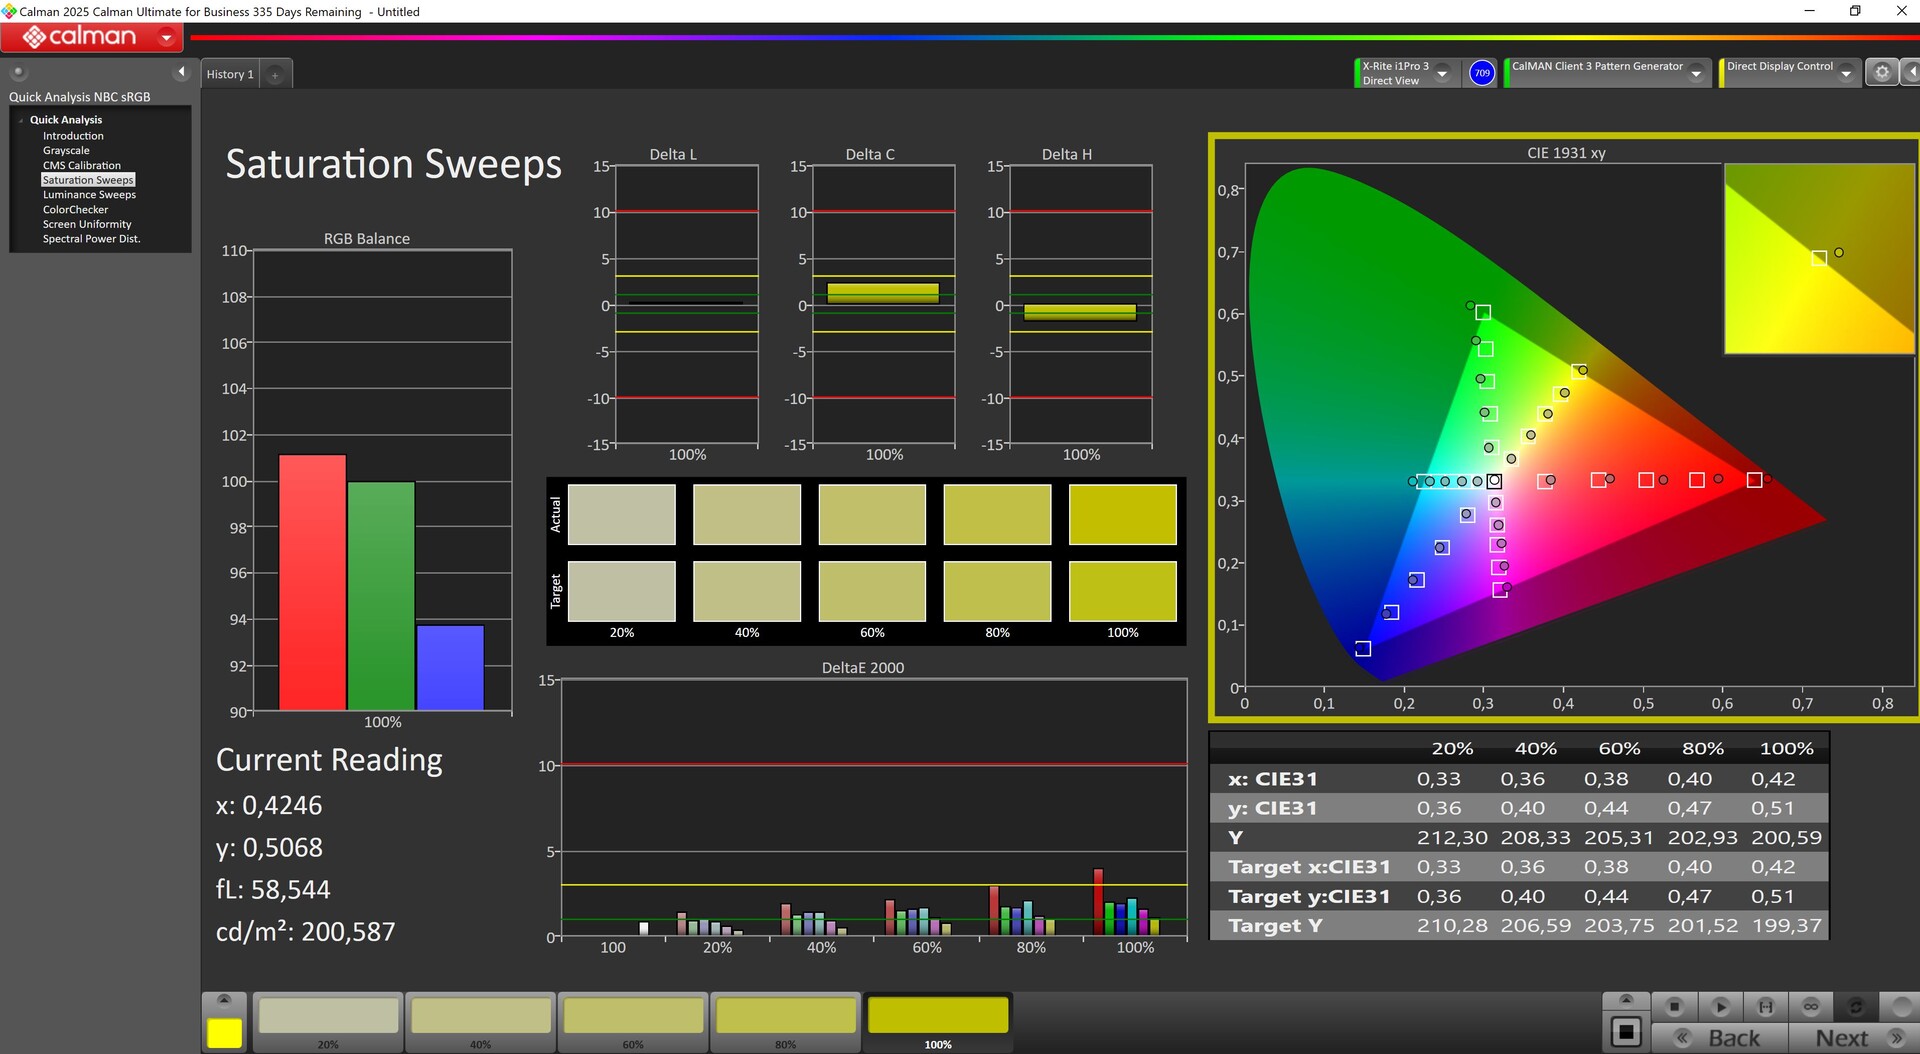
我们测得的平均亮度为 460 尼特。由于黑阶相对较低,对比度也比较理想。AdobeRGB 和 Display P3 的覆盖率约为 75%,而 sRGB 则几乎完全覆盖。
不过,响应时间相当慢,面板仅支持 60 Hz。
| |||||||||||||||||||||||||
Brightness Distribution: 89 %
Center on Battery: 456 cd/m²
Contrast: 1983:1 (Black: 0.23 cd/m²)
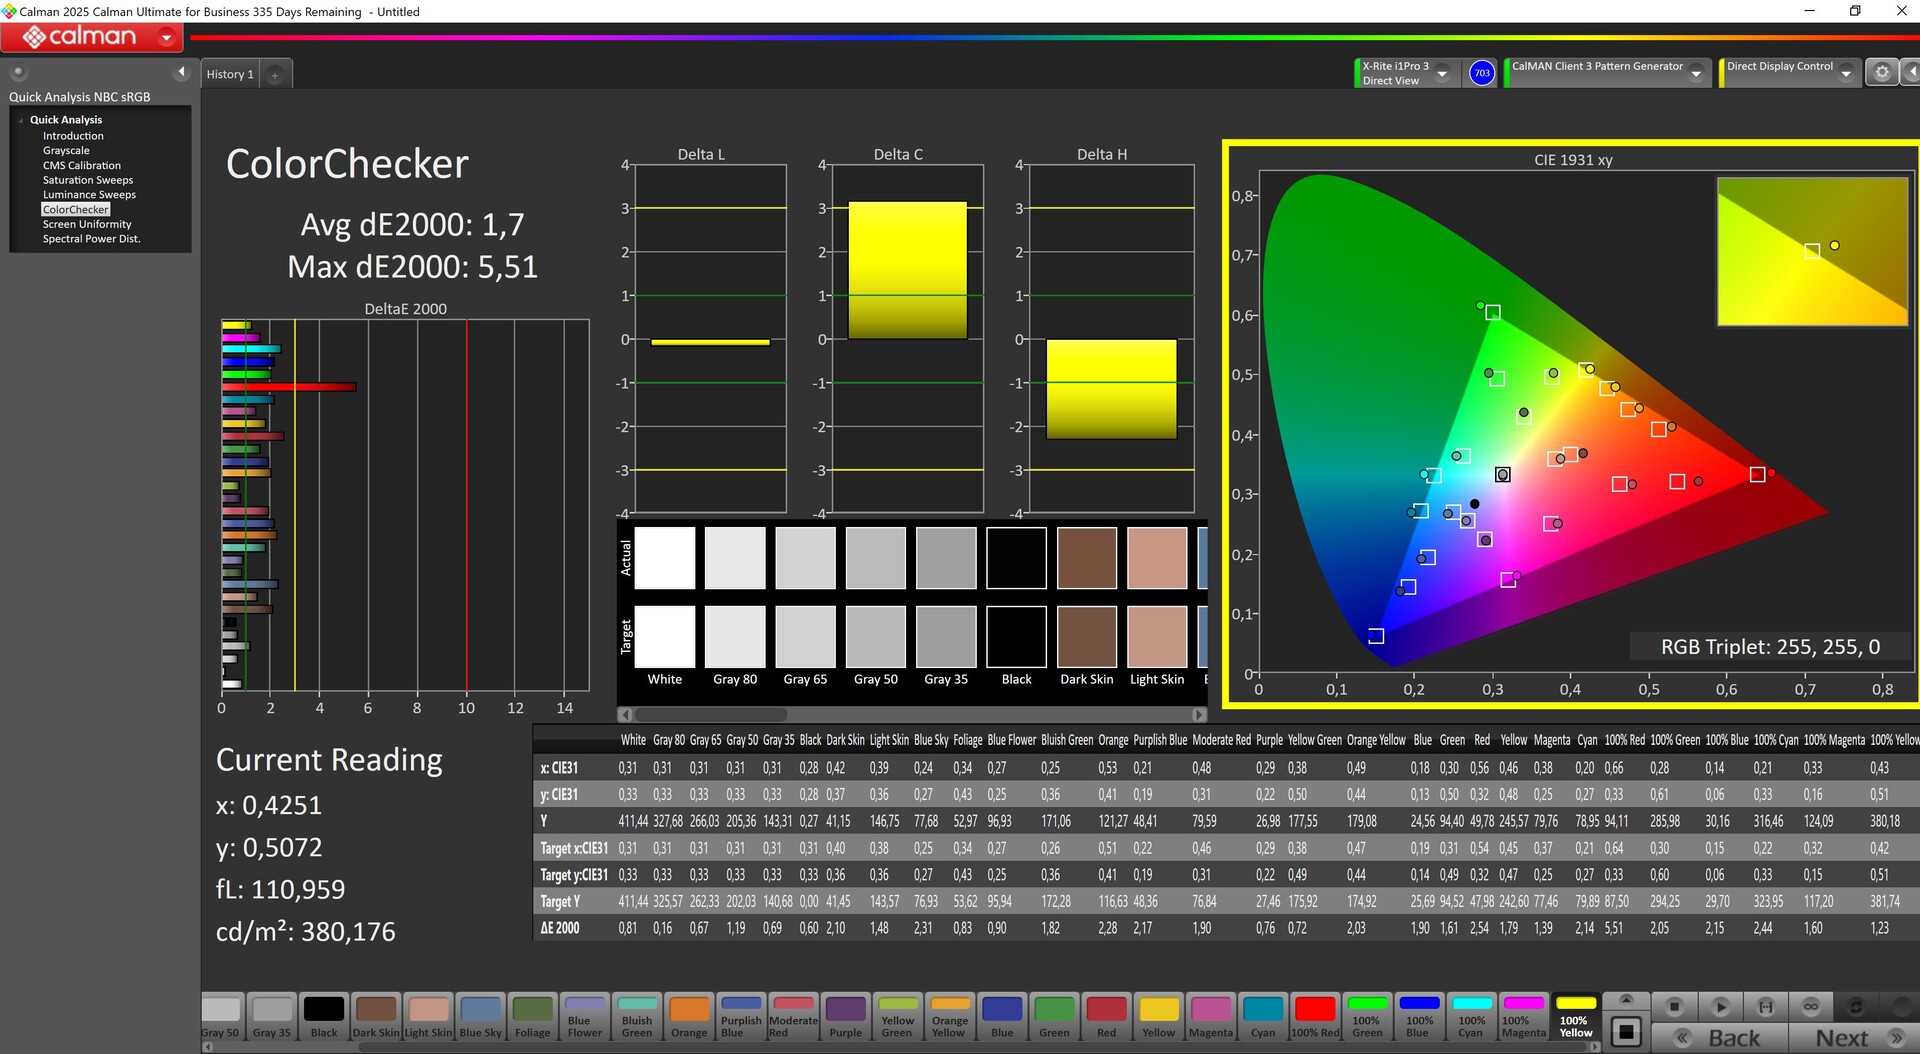
ΔE Color 3.3 | 0.5-29.43 Ø4.87, calibrated: 1.7
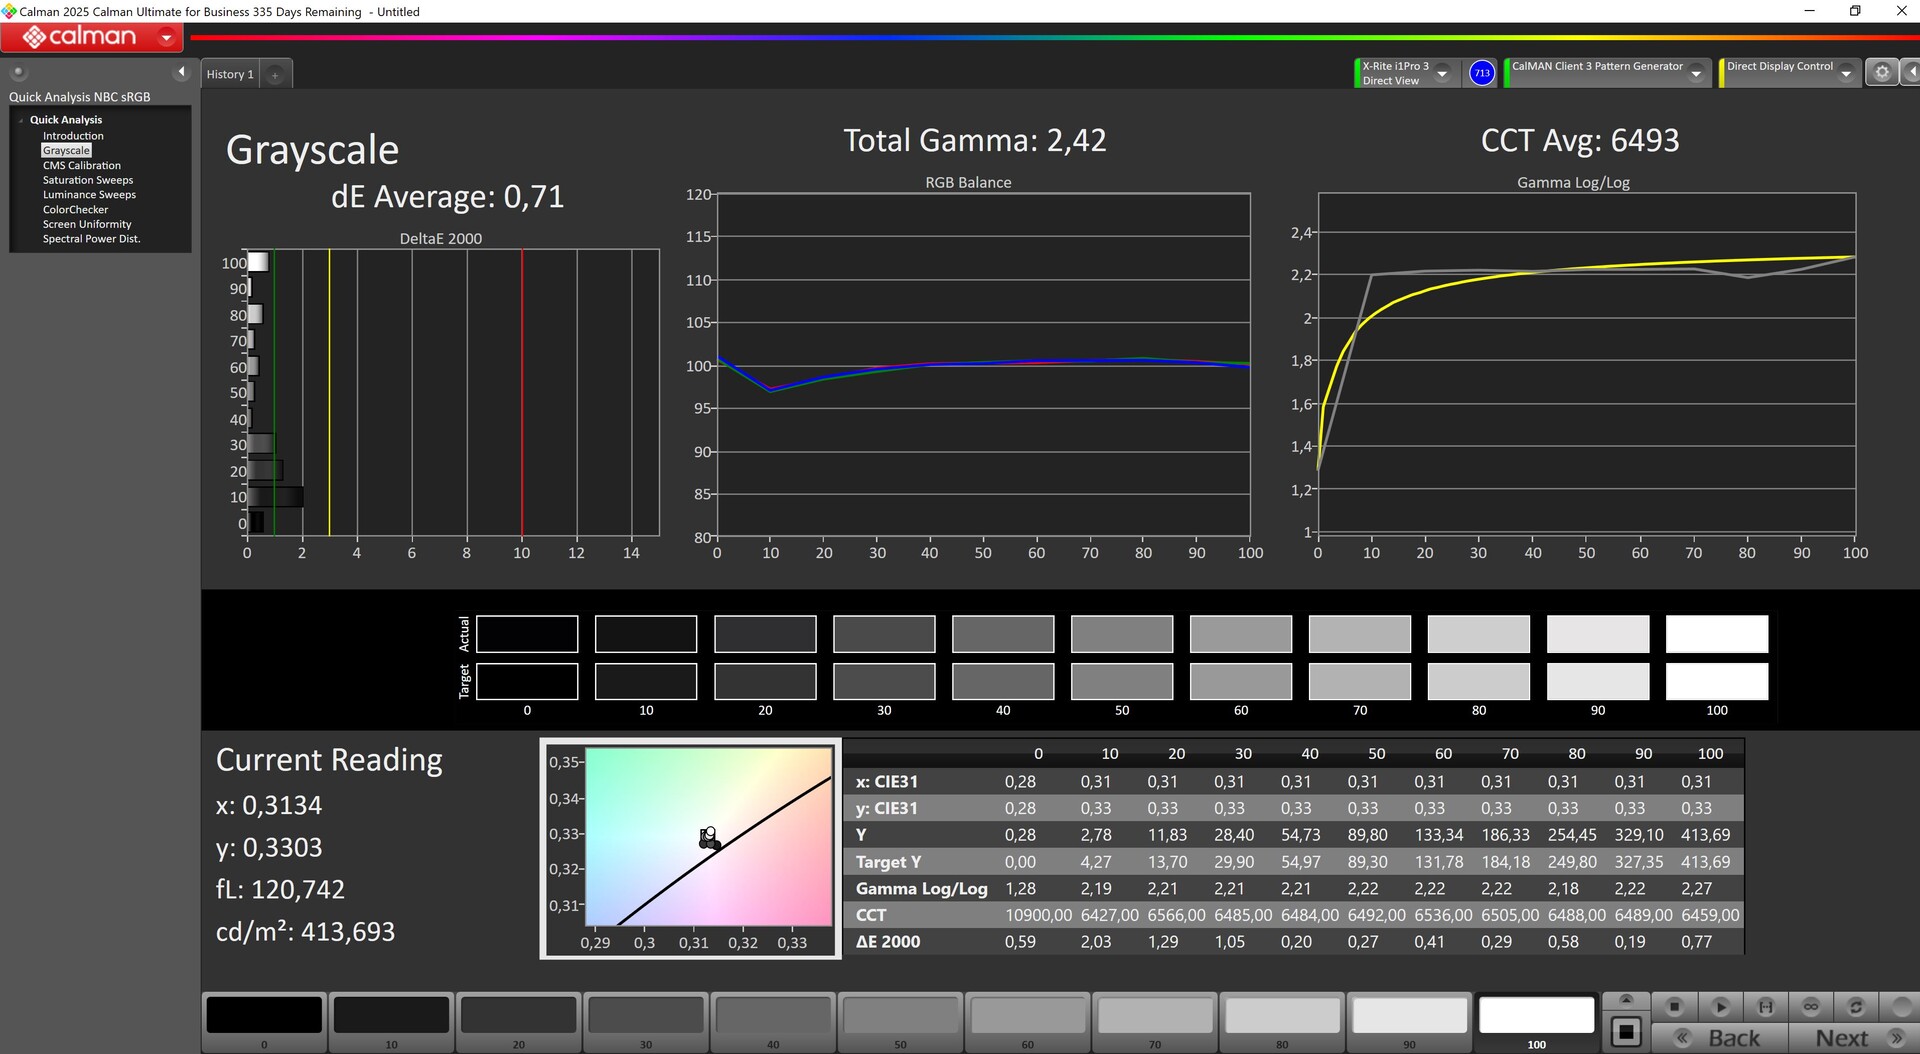
ΔE Greyscale 4.35 | 0.5-98 Ø5.1
75.9% AdobeRGB 1998 (Argyll 2.2.0 3D)
99.1% sRGB (Argyll 2.2.0 3D)
74.3% Display P3 (Argyll 2.2.0 3D)
Gamma: 2.51
| Dell Pro 13 Premium PA13250 B133UAN (AUOBEB0), IPS, 1920x1200, 13.3", 60 Hz | MSI Prestige 13 AI Plus Evo A2VMG ATNA33AA07-0, OLED, 2880x1800, 13.3", 60 Hz | Lenovo ThinkPad X13 2-in-1 Gen 5 Lenovo B133UAN01.2, IPS, 1920x1200, 13.3", 60 Hz | Framework Laptop 13.5 Core Ultra 7 155H BOE NE135A1M-NY1, IPS, 2880x1920, 13.5", 120 Hz | Dell XPS 13 9350 LG Philips 134WU2, IPS, 1920x1200, 13.4", 120 Hz | Microsoft Surface Pro Copilot+ LP129WT342166, IPS, 2880x1920, 13", 120 Hz | |
|---|---|---|---|---|---|---|
| Display | 20% | -4% | -2% | -6% | 6% | |
| Display P3 Coverage | 74.3 | 99.9 34% | 71.1 -4% | 72.8 -2% | 67.3 -9% | 83.4 12% |
| sRGB Coverage | 99.1 | 100 1% | 97.1 -2% | 98.6 -1% | 99 0% | 99.7 1% |
| AdobeRGB 1998 Coverage | 75.9 | 95.8 26% | 71.7 -6% | 72.9 -4% | 68.6 -10% | 79.4 5% |
| Response Times | 94% | -9% | 16% | 16% | 29% | |
| Response Time Grey 50% / Grey 80% * | 52.8 ? | 1.94 ? 96% | 50.2 ? 5% | 41.9 ? 21% | 37.3 ? 29% | 39.6 ? 25% |
| Response Time Black / White * | 26.4 ? | 2.02 ? 92% | 32.6 ? -23% | 23.7 ? 10% | 25.9 ? 2% | 18 ? 32% |
| PWM Frequency | 60 ? | |||||
| Screen | 17% | -9% | -11% | 31% | 4% | |
| Brightness middle | 456 | 382.4 -16% | 334 -27% | 498.5 9% | 462.8 1% | 585 28% |
| Brightness | 460 | 383 -17% | 308 -33% | 464 1% | 435 -5% | 574 25% |
| Brightness Distribution | 89 | 99 11% | 86 -3% | 86 -3% | 87 -2% | 89 0% |
| Black Level * | 0.23 | 0.37 -61% | 0.36 -57% | 0.19 17% | 0.56 -143% | |
| Contrast | 1983 | 903 -54% | 1385 -30% | 2436 23% | 1045 -47% | |
| Colorchecker dE 2000 * | 3.3 | 3.84 -16% | 2.36 28% | 4.27 -29% | 1.92 42% | 1.3 61% |
| Colorchecker dE 2000 max. * | 6.47 | 6.66 -3% | 4.93 24% | 7.08 -9% | 3.45 47% | 3 54% |
| Colorchecker dE 2000 calibrated * | 1.7 | 0.41 76% | 1.25 26% | 1.26 26% | 0.48 72% | |
| Greyscale dE 2000 * | 4.35 | 0.7 84% | 3.38 22% | 4.7 -8% | 0.6 86% | 2 54% |
| Gamma | 2.51 88% | 2.23 99% | 2.38 92% | 2.09 105% | 2.19 100% | 2.18 101% |
| CCT | 6215 105% | 6475 100% | 6352 102% | 7417 88% | 6539 99% | 6914 94% |
| Total Average (Program / Settings) | 44% /
31% | -7% /
-8% | 1% /
-5% | 14% /
21% | 13% /
8% |
* ... smaller is better
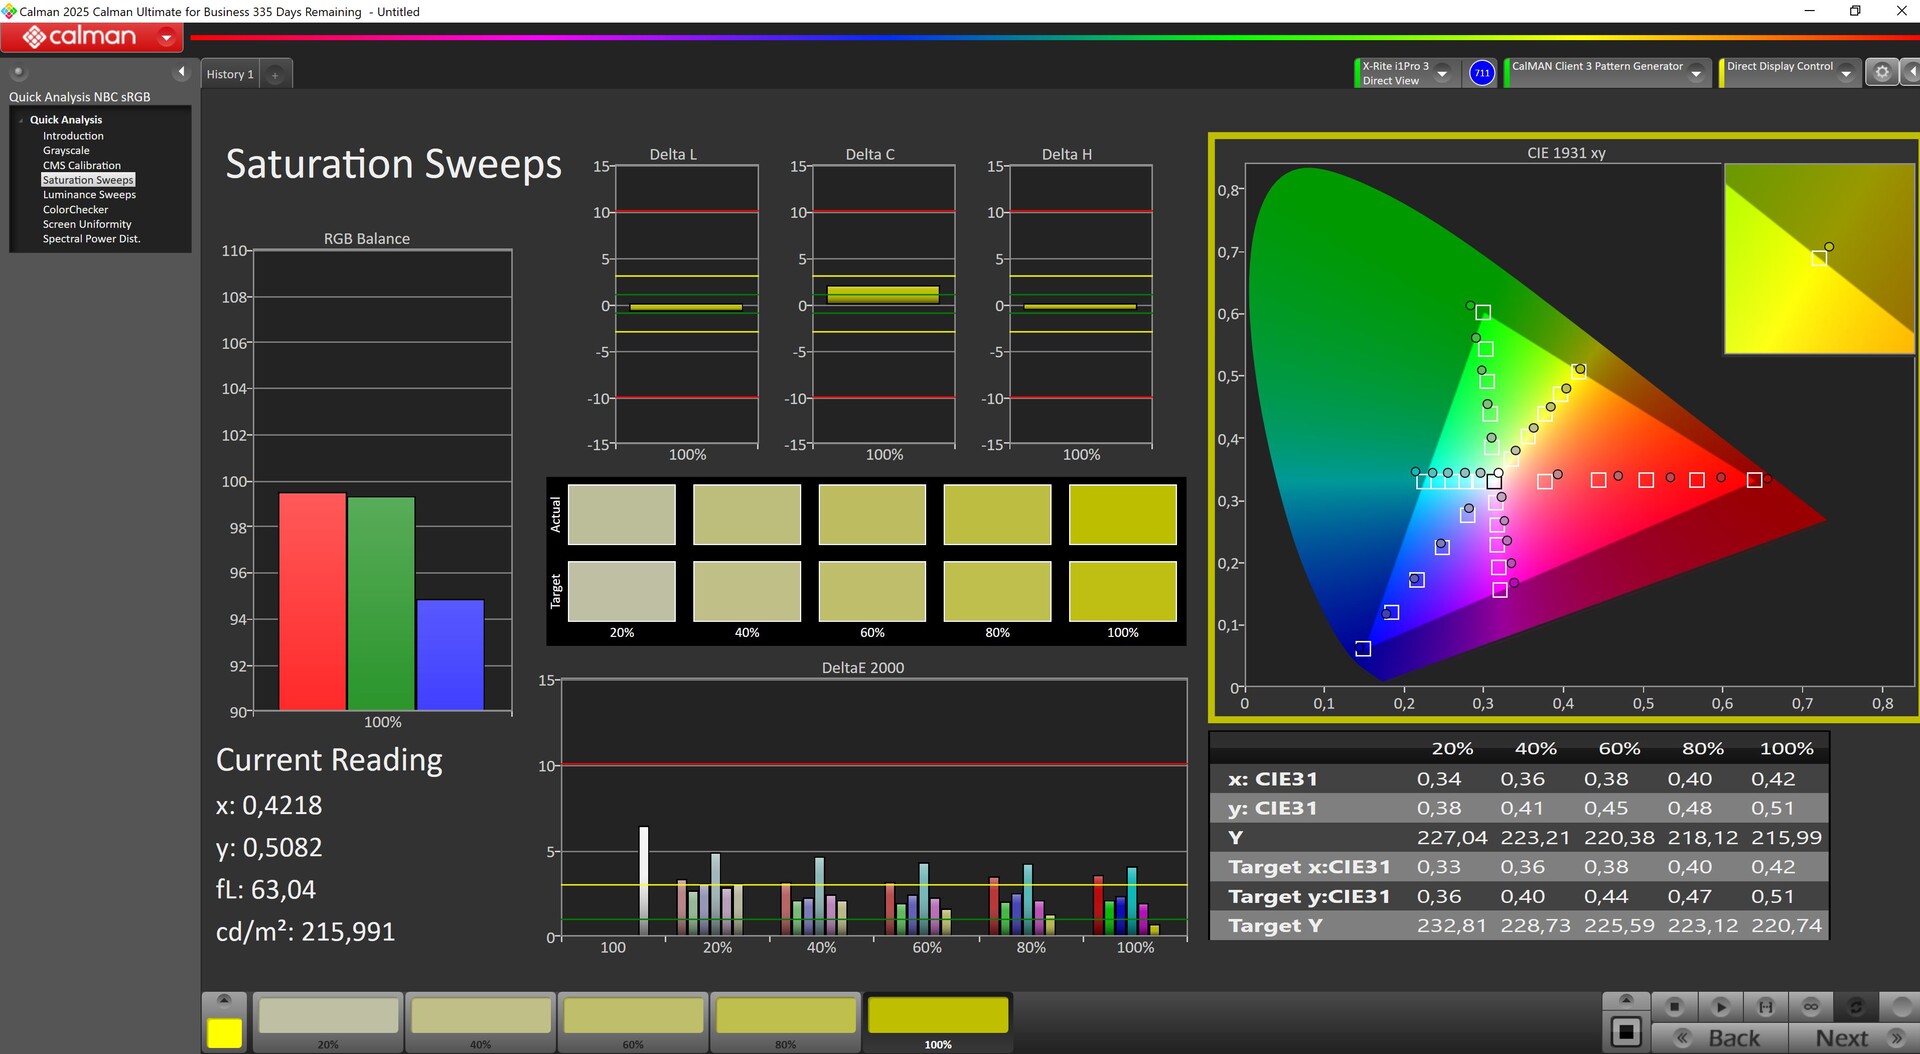
虽然我们的手动校准成功改善了灰度和 ColorChecker 的 DeltaE 值,但红色区域仍有一个异常值。
Display Response Times
| ↔ Response Time Black to White | ||
|---|---|---|
| 26.4 ms ... rise ↗ and fall ↘ combined | ↗ 12.2 ms rise | 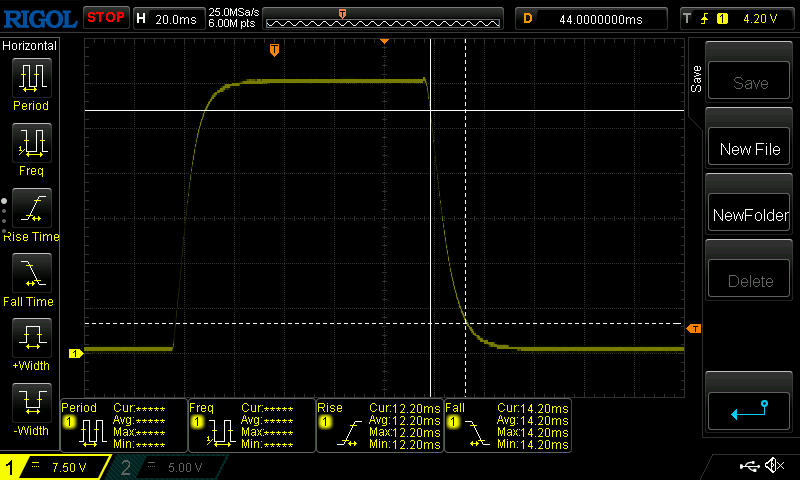 |
| ↘ 14.2 ms fall | ||
| The screen shows relatively slow response rates in our tests and may be too slow for gamers. In comparison, all tested devices range from 0.1 (minimum) to 240 (maximum) ms. » 63 % of all devices are better. This means that the measured response time is worse than the average of all tested devices (20.8 ms). | ||
| ↔ Response Time 50% Grey to 80% Grey | ||
| 52.8 ms ... rise ↗ and fall ↘ combined | ↗ 23.4 ms rise | 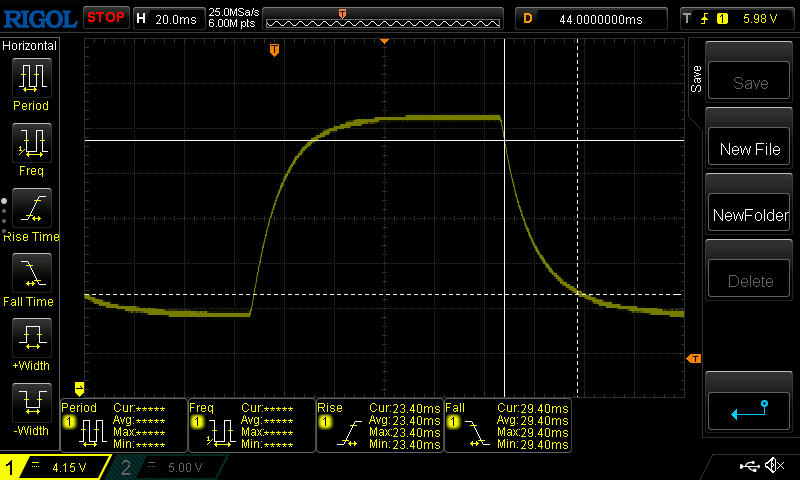 |
| ↘ 29.4 ms fall | ||
| The screen shows slow response rates in our tests and will be unsatisfactory for gamers. In comparison, all tested devices range from 0.165 (minimum) to 636 (maximum) ms. » 89 % of all devices are better. This means that the measured response time is worse than the average of all tested devices (32.5 ms). | ||
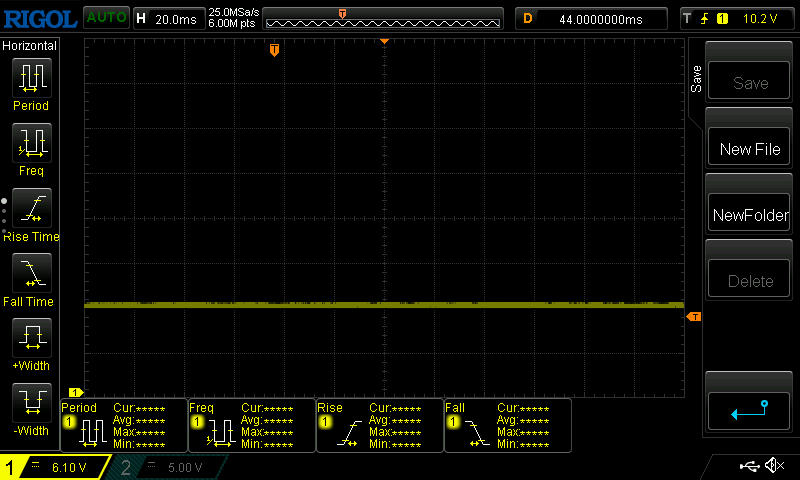
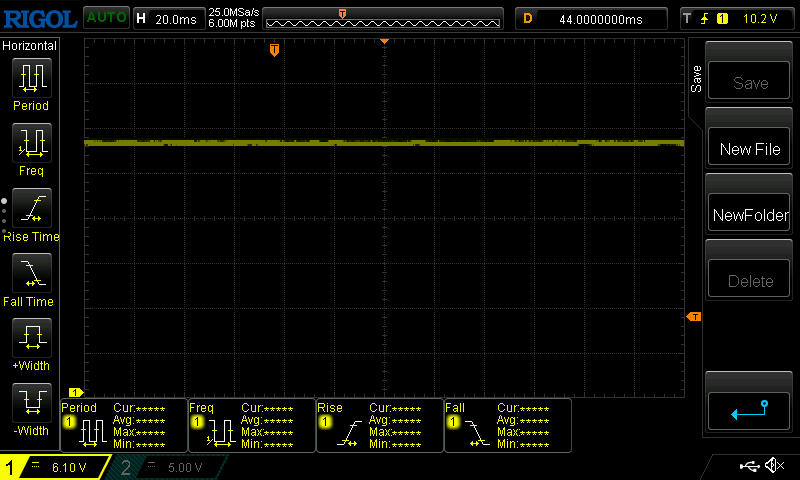
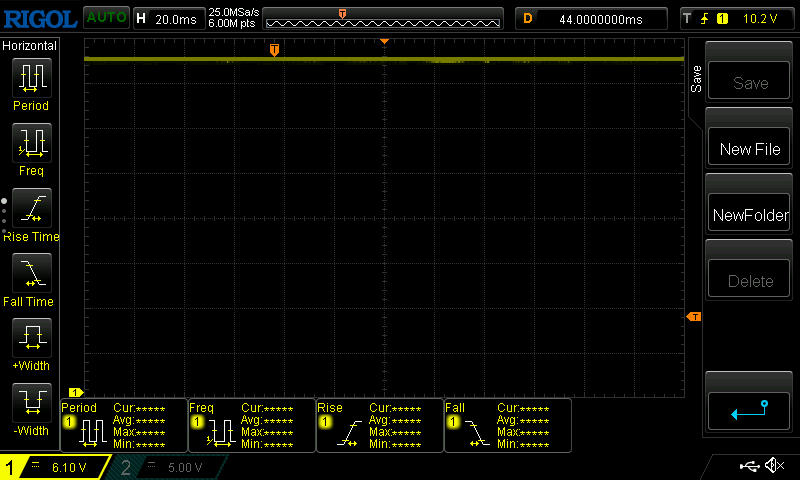
Screen Flickering / PWM (Pulse-Width Modulation)
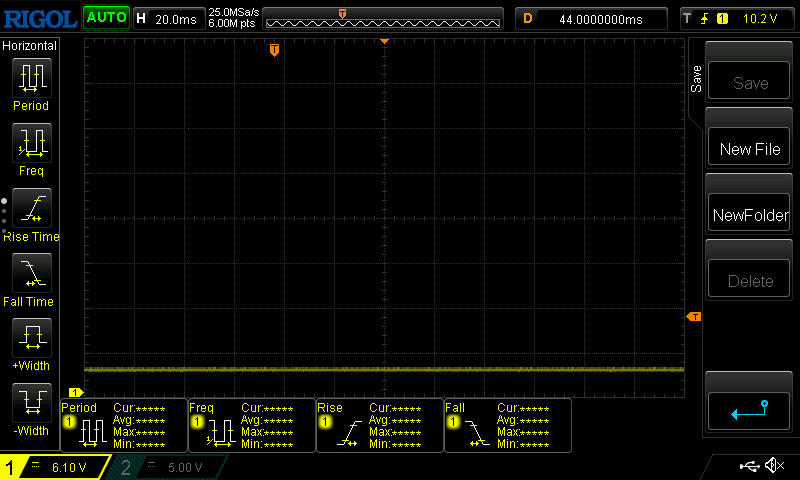
| Screen flickering / PWM not detected | 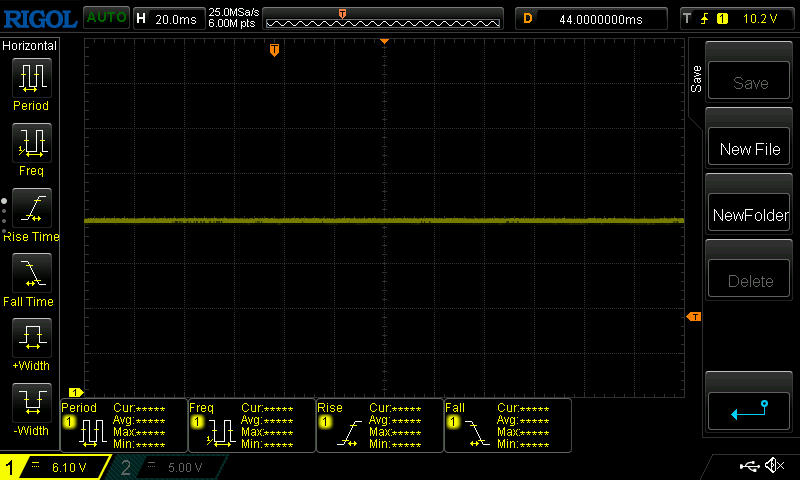 | ||
In comparison: 53 % of all tested devices do not use PWM to dim the display. If PWM was detected, an average of 8516 (minimum: 5 - maximum: 343500) Hz was measured. | |||

在室外,良好的亮度和对比度、哑光表面以及良好的视角稳定性有助于确保基本无故障运行。


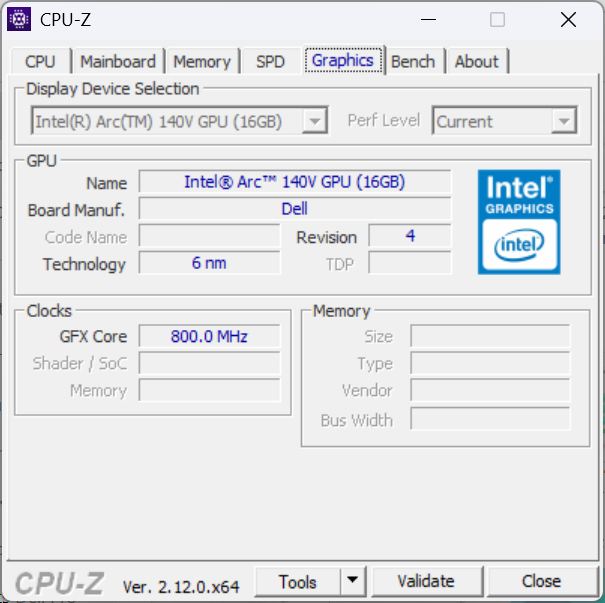
性能 - 140 伏强力弧光灯
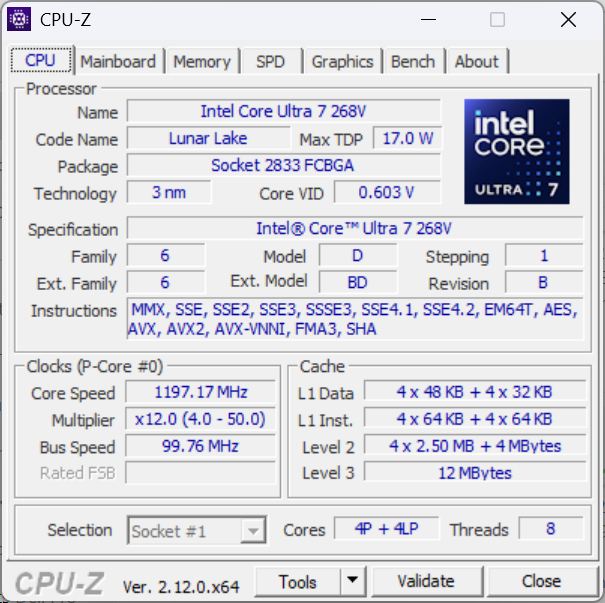
跳动的心脏是全新的 英特尔酷睿至尊 7 268V处理器,内置 32GB 内存。此外,还有一款配置较弱的 酷睿至尊 5 236V和 16GB 内存的版本。存储空间也有多种配置可供选择(256 GB、512 GB、1 TB)。戴尔 Pro 13 Premium 显然面向移动商务用户。
测试条件
戴尔优化大师作为控制中心,提供影响性能的风扇设置和其他一些选项。在进行基准测试时,我们将其保留为预选的 "优化 "模式。

处理器
英特尔 英特尔酷睿至尊 7 268V是高能效 Lunar Lake 系列中的高端型号之一。其四个 E 核心和四个 P 核心的主频从 2.2 GHz 到 5.0 GHz,还配备了 48 TOPS NPU。
在我们进行的每项测试中,它的单核性能都特别出色。在多核基准测试中,戴尔 Pro 13 的 CPU 表现有些令人失望,经常略微落后于竞争对手,其中一些竞争对手的处理器在名义上要弱一些。在电池模式下,性能损失约 16%。
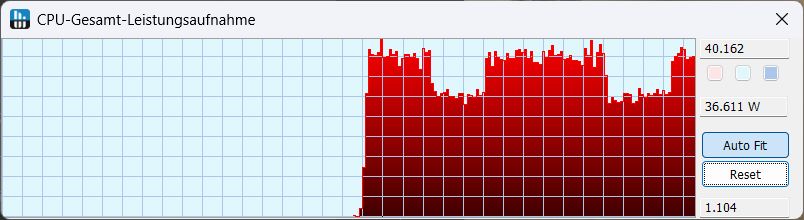
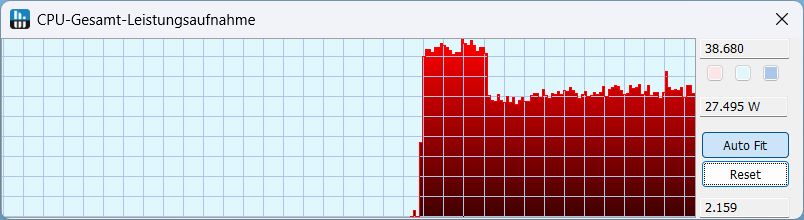
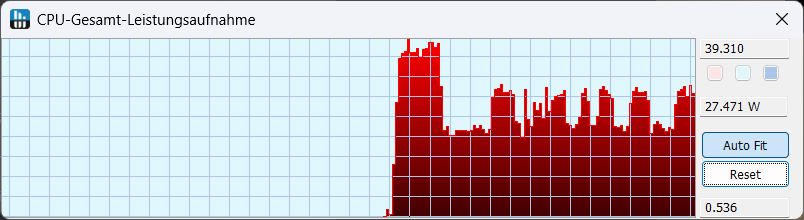
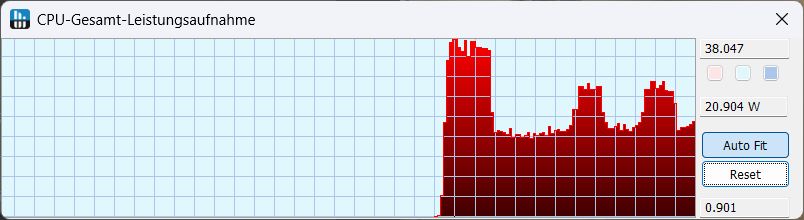
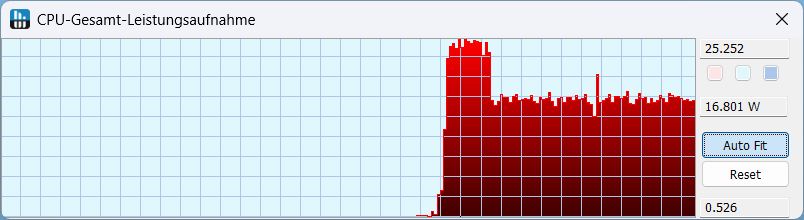
在 Cinebench R15 循环中,性能在前三次运行中下降了约 28%,此后保持不变。在标准优化模式下,功耗最初约为 38 瓦,随后降至 27 瓦。右侧的图片显示了 Cinebench R23 的功耗表现,具体取决于风扇模式。
Cinebench R15 Multi Continuous Test
Cinebench R23: Multi Core | Single Core
Cinebench R20: CPU (Multi Core) | CPU (Single Core)
Cinebench R15: CPU Multi 64Bit | CPU Single 64Bit
Blender: v2.79 BMW27 CPU
7-Zip 18.03: 7z b 4 | 7z b 4 -mmt1
Geekbench 6.4: Multi-Core | Single-Core
Geekbench 5.5: Multi-Core | Single-Core
HWBOT x265 Benchmark v2.2: 4k Preset
LibreOffice : 20 Documents To PDF
R Benchmark 2.5: Overall mean
| CPU Performance Rating | |
| Framework Laptop 13.5 Core Ultra 7 155H | |
| MSI Prestige 13 AI Plus Evo A2VMG | |
| Dell XPS 13 9350 | |
| Average Intel Core Ultra 7 268V | |
| Average of class Subnotebook | |
| Dell Pro 13 Premium PA13250 | |
| Lenovo ThinkPad X13 2-in-1 Gen 5 | |
| Microsoft Surface Pro Copilot+ -2! | |
| Cinebench R23 / Multi Core | |
| Framework Laptop 13.5 Core Ultra 7 155H | |
| Average of class Subnotebook (1555 - 21812, n=76, last 2 years) | |
| MSI Prestige 13 AI Plus Evo A2VMG | |
| Dell XPS 13 9350 | |
| Average Intel Core Ultra 7 268V (9835 - 10535, n=2) | |
| Dell Pro 13 Premium PA13250 | |
| Microsoft Surface Pro Copilot+ | |
| Lenovo ThinkPad X13 2-in-1 Gen 5 | |
| Cinebench R23 / Single Core | |
| Dell Pro 13 Premium PA13250 | |
| Average Intel Core Ultra 7 268V (1910 - 1985, n=2) | |
| Dell XPS 13 9350 | |
| MSI Prestige 13 AI Plus Evo A2VMG | |
| Framework Laptop 13.5 Core Ultra 7 155H | |
| Average of class Subnotebook (358 - 2165, n=76, last 2 years) | |
| Lenovo ThinkPad X13 2-in-1 Gen 5 | |
| Microsoft Surface Pro Copilot+ | |
| Cinebench R20 / CPU (Multi Core) | |
| Framework Laptop 13.5 Core Ultra 7 155H | |
| Average of class Subnotebook (579 - 8541, n=71, last 2 years) | |
| MSI Prestige 13 AI Plus Evo A2VMG | |
| Dell XPS 13 9350 | |
| Average Intel Core Ultra 7 268V (3811 - 4129, n=2) | |
| Dell Pro 13 Premium PA13250 | |
| Lenovo ThinkPad X13 2-in-1 Gen 5 | |
| Microsoft Surface Pro Copilot+ | |
| Cinebench R20 / CPU (Single Core) | |
| Dell Pro 13 Premium PA13250 | |
| Average Intel Core Ultra 7 268V (736 - 764, n=2) | |
| Dell XPS 13 9350 | |
| MSI Prestige 13 AI Plus Evo A2VMG | |
| Framework Laptop 13.5 Core Ultra 7 155H | |
| Average of class Subnotebook (128 - 826, n=71, last 2 years) | |
| Lenovo ThinkPad X13 2-in-1 Gen 5 | |
| Microsoft Surface Pro Copilot+ | |
| Cinebench R15 / CPU Multi 64Bit | |
| Framework Laptop 13.5 Core Ultra 7 155H | |
| Microsoft Surface Pro Copilot+ | |
| Average of class Subnotebook (327 - 3345, n=77, last 2 years) | |
| MSI Prestige 13 AI Plus Evo A2VMG | |
| Average Intel Core Ultra 7 268V (1601 - 1616, n=2) | |
| Dell Pro 13 Premium PA13250 | |
| Dell XPS 13 9350 | |
| Lenovo ThinkPad X13 2-in-1 Gen 5 | |
| Cinebench R15 / CPU Single 64Bit | |
| Dell Pro 13 Premium PA13250 | |
| Average Intel Core Ultra 7 268V (287 - 302, n=2) | |
| Dell XPS 13 9350 | |
| MSI Prestige 13 AI Plus Evo A2VMG | |
| Framework Laptop 13.5 Core Ultra 7 155H | |
| Average of class Subnotebook (72.4 - 322, n=72, last 2 years) | |
| Lenovo ThinkPad X13 2-in-1 Gen 5 | |
| Microsoft Surface Pro Copilot+ | |
| Blender / v2.79 BMW27 CPU | |
| Dell Pro 13 Premium PA13250 | |
| Microsoft Surface Pro Copilot+ | |
| Lenovo ThinkPad X13 2-in-1 Gen 5 | |
| Average of class Subnotebook (159 - 2271, n=75, last 2 years) | |
| Average Intel Core Ultra 7 268V (337 - 410, n=2) | |
| Dell XPS 13 9350 | |
| MSI Prestige 13 AI Plus Evo A2VMG | |
| Framework Laptop 13.5 Core Ultra 7 155H | |
| 7-Zip 18.03 / 7z b 4 | |
| Framework Laptop 13.5 Core Ultra 7 155H | |
| Average of class Subnotebook (11668 - 77867, n=67, last 2 years) | |
| Microsoft Surface Pro Copilot+ | |
| Dell XPS 13 9350 | |
| MSI Prestige 13 AI Plus Evo A2VMG | |
| Average Intel Core Ultra 7 268V (32797 - 35687, n=2) | |
| Dell Pro 13 Premium PA13250 | |
| Lenovo ThinkPad X13 2-in-1 Gen 5 | |
| 7-Zip 18.03 / 7z b 4 -mmt1 | |
| Average Intel Core Ultra 7 268V (5884 - 6021, n=2) | |
| Dell Pro 13 Premium PA13250 | |
| Dell XPS 13 9350 | |
| MSI Prestige 13 AI Plus Evo A2VMG | |
| Average of class Subnotebook (2643 - 6442, n=69, last 2 years) | |
| Framework Laptop 13.5 Core Ultra 7 155H | |
| Microsoft Surface Pro Copilot+ | |
| Lenovo ThinkPad X13 2-in-1 Gen 5 | |
| Geekbench 6.4 / Multi-Core | |
| Microsoft Surface Pro Copilot+ | |
| Framework Laptop 13.5 Core Ultra 7 155H | |
| Average of class Subnotebook (2244 - 17489, n=72, last 2 years) | |
| MSI Prestige 13 AI Plus Evo A2VMG | |
| Dell XPS 13 9350 | |
| Average Intel Core Ultra 7 268V (10589 - 11279, n=3) | |
| Dell Pro 13 Premium PA13250 | |
| Lenovo ThinkPad X13 2-in-1 Gen 5 | |
| Geekbench 6.4 / Single-Core | |
| Dell Pro 13 Premium PA13250 | |
| Dell XPS 13 9350 | |
| Average Intel Core Ultra 7 268V (2583 - 2871, n=3) | |
| MSI Prestige 13 AI Plus Evo A2VMG | |
| Average of class Subnotebook (960 - 3655, n=67, last 2 years) | |
| Microsoft Surface Pro Copilot+ | |
| Framework Laptop 13.5 Core Ultra 7 155H | |
| Lenovo ThinkPad X13 2-in-1 Gen 5 | |
| Lenovo ThinkPad X13 2-in-1 Gen 5 | |
| Geekbench 5.5 / Multi-Core | |
| Framework Laptop 13.5 Core Ultra 7 155H | |
| Average of class Subnotebook (2557 - 17218, n=68, last 2 years) | |
| Average Intel Core Ultra 7 268V (9491 - 9801, n=3) | |
| MSI Prestige 13 AI Plus Evo A2VMG | |
| Dell Pro 13 Premium PA13250 | |
| Dell XPS 13 9350 | |
| Lenovo ThinkPad X13 2-in-1 Gen 5 | |
| Geekbench 5.5 / Single-Core | |
| Average Intel Core Ultra 7 268V (2008 - 2091, n=3) | |
| Dell XPS 13 9350 | |
| Dell Pro 13 Premium PA13250 | |
| MSI Prestige 13 AI Plus Evo A2VMG | |
| Average of class Subnotebook (726 - 2350, n=68, last 2 years) | |
| Framework Laptop 13.5 Core Ultra 7 155H | |
| Lenovo ThinkPad X13 2-in-1 Gen 5 | |
| HWBOT x265 Benchmark v2.2 / 4k Preset | |
| MSI Prestige 13 AI Plus Evo A2VMG | |
| Framework Laptop 13.5 Core Ultra 7 155H | |
| Dell XPS 13 9350 | |
| Average of class Subnotebook (0.97 - 25.1, n=70, last 2 years) | |
| Average Intel Core Ultra 7 268V (10.4 - 12.9, n=2) | |
| Dell Pro 13 Premium PA13250 | |
| Lenovo ThinkPad X13 2-in-1 Gen 5 | |
| Microsoft Surface Pro Copilot+ | |
| LibreOffice / 20 Documents To PDF | |
| Dell Pro 13 Premium PA13250 | |
| Microsoft Surface Pro Copilot+ | |
| Lenovo ThinkPad X13 2-in-1 Gen 5 | |
| Average of class Subnotebook (38.5 - 220, n=68, last 2 years) | |
| Average Intel Core Ultra 7 268V (48 - 60.8, n=2) | |
| Dell XPS 13 9350 | |
| MSI Prestige 13 AI Plus Evo A2VMG | |
| Framework Laptop 13.5 Core Ultra 7 155H | |
| R Benchmark 2.5 / Overall mean | |
| Microsoft Surface Pro Copilot+ | |
| Lenovo ThinkPad X13 2-in-1 Gen 5 | |
| Average of class Subnotebook (0.403 - 1.456, n=70, last 2 years) | |
| Framework Laptop 13.5 Core Ultra 7 155H | |
| MSI Prestige 13 AI Plus Evo A2VMG | |
| Dell XPS 13 9350 | |
| Average Intel Core Ultra 7 268V (0.4344 - 0.4565, n=2) | |
| Dell Pro 13 Premium PA13250 | |
* ... smaller is better
AIDA64: FP32 Ray-Trace | FPU Julia | CPU SHA3 | CPU Queen | FPU SinJulia | FPU Mandel | CPU AES | CPU ZLib | FP64 Ray-Trace | CPU PhotoWorxx
| Performance Rating | |
| Framework Laptop 13.5 Core Ultra 7 155H | |
| Average of class Subnotebook | |
| MSI Prestige 13 AI Plus Evo A2VMG | |
| Dell XPS 13 9350 | |
| Average Intel Core Ultra 7 268V | |
| Dell Pro 13 Premium PA13250 | |
| Lenovo ThinkPad X13 2-in-1 Gen 5 | |
| Microsoft Surface Pro Copilot+ | |
| AIDA64 / FP32 Ray-Trace | |
| Average of class Subnotebook (1135 - 32888, n=70, last 2 years) | |
| MSI Prestige 13 AI Plus Evo A2VMG | |
| Dell XPS 13 9350 | |
| Framework Laptop 13.5 Core Ultra 7 155H | |
| Average Intel Core Ultra 7 268V (10556 - 11547, n=2) | |
| Dell Pro 13 Premium PA13250 | |
| Microsoft Surface Pro Copilot+ | |
| Lenovo ThinkPad X13 2-in-1 Gen 5 | |
| AIDA64 / FPU Julia | |
| MSI Prestige 13 AI Plus Evo A2VMG | |
| Dell XPS 13 9350 | |
| Framework Laptop 13.5 Core Ultra 7 155H | |
| Average of class Subnotebook (5218 - 123315, n=70, last 2 years) | |
| Average Intel Core Ultra 7 268V (47659 - 56299, n=2) | |
| Dell Pro 13 Premium PA13250 | |
| Lenovo ThinkPad X13 2-in-1 Gen 5 | |
| Microsoft Surface Pro Copilot+ | |
| AIDA64 / CPU SHA3 | |
| Average of class Subnotebook (444 - 5287, n=70, last 2 years) | |
| MSI Prestige 13 AI Plus Evo A2VMG | |
| Framework Laptop 13.5 Core Ultra 7 155H | |
| Dell XPS 13 9350 | |
| Average Intel Core Ultra 7 268V (2117 - 2538, n=2) | |
| Dell Pro 13 Premium PA13250 | |
| Lenovo ThinkPad X13 2-in-1 Gen 5 | |
| Microsoft Surface Pro Copilot+ | |
| AIDA64 / CPU Queen | |
| Framework Laptop 13.5 Core Ultra 7 155H | |
| Average of class Subnotebook (10579 - 115682, n=70, last 2 years) | |
| Microsoft Surface Pro Copilot+ | |
| MSI Prestige 13 AI Plus Evo A2VMG | |
| Dell Pro 13 Premium PA13250 | |
| Average Intel Core Ultra 7 268V (49645 - 49759, n=2) | |
| Dell XPS 13 9350 | |
| Lenovo ThinkPad X13 2-in-1 Gen 5 | |
| AIDA64 / FPU SinJulia | |
| Framework Laptop 13.5 Core Ultra 7 155H | |
| Average of class Subnotebook (744 - 18418, n=70, last 2 years) | |
| Lenovo ThinkPad X13 2-in-1 Gen 5 | |
| Dell XPS 13 9350 | |
| MSI Prestige 13 AI Plus Evo A2VMG | |
| Average Intel Core Ultra 7 268V (4353 - 4426, n=2) | |
| Dell Pro 13 Premium PA13250 | |
| Microsoft Surface Pro Copilot+ | |
| AIDA64 / FPU Mandel | |
| MSI Prestige 13 AI Plus Evo A2VMG | |
| Dell XPS 13 9350 | |
| Average of class Subnotebook (3341 - 65433, n=70, last 2 years) | |
| Framework Laptop 13.5 Core Ultra 7 155H | |
| Average Intel Core Ultra 7 268V (25929 - 29637, n=2) | |
| Dell Pro 13 Premium PA13250 | |
| Lenovo ThinkPad X13 2-in-1 Gen 5 | |
| Microsoft Surface Pro Copilot+ | |
| AIDA64 / CPU AES | |
| Framework Laptop 13.5 Core Ultra 7 155H | |
| Microsoft Surface Pro Copilot+ | |
| Average of class Subnotebook (638 - 161430, n=70, last 2 years) | |
| Dell XPS 13 9350 | |
| MSI Prestige 13 AI Plus Evo A2VMG | |
| Lenovo ThinkPad X13 2-in-1 Gen 5 | |
| Average Intel Core Ultra 7 268V (33196 - 38706, n=2) | |
| Dell Pro 13 Premium PA13250 | |
| AIDA64 / CPU ZLib | |
| Framework Laptop 13.5 Core Ultra 7 155H | |
| Average of class Subnotebook (164.9 - 1379, n=70, last 2 years) | |
| Microsoft Surface Pro Copilot+ | |
| MSI Prestige 13 AI Plus Evo A2VMG | |
| Dell XPS 13 9350 | |
| Lenovo ThinkPad X13 2-in-1 Gen 5 | |
| Average Intel Core Ultra 7 268V (441 - 583, n=2) | |
| Dell Pro 13 Premium PA13250 | |
| AIDA64 / FP64 Ray-Trace | |
| MSI Prestige 13 AI Plus Evo A2VMG | |
| Average of class Subnotebook (610 - 17495, n=70, last 2 years) | |
| Dell XPS 13 9350 | |
| Average Intel Core Ultra 7 268V (5938 - 6214, n=2) | |
| Framework Laptop 13.5 Core Ultra 7 155H | |
| Dell Pro 13 Premium PA13250 | |
| Lenovo ThinkPad X13 2-in-1 Gen 5 | |
| Microsoft Surface Pro Copilot+ | |
| AIDA64 / CPU PhotoWorxx | |
| MSI Prestige 13 AI Plus Evo A2VMG | |
| Dell XPS 13 9350 | |
| Average Intel Core Ultra 7 268V (46733 - 53540, n=2) | |
| Dell Pro 13 Premium PA13250 | |
| Framework Laptop 13.5 Core Ultra 7 155H | |
| Average of class Subnotebook (6569 - 64588, n=70, last 2 years) | |
| Lenovo ThinkPad X13 2-in-1 Gen 5 | |
| Microsoft Surface Pro Copilot+ | |
系统性能
在 PCMark 10 和 CrossMark 中,对比设备的性能接近,但无论是在这方面还是在网络测试中,我们的戴尔 Pro 都处于中间位置,而不是争夺第一的位置。

CrossMark: Overall | Productivity | Creativity | Responsiveness
WebXPRT 3: Overall
WebXPRT 4: Overall
Mozilla Kraken 1.1: Total
| PCMark 10 / Score | |
| Average Intel Core Ultra 7 268V, Intel Arc Graphics 140V (6729 - 7236, n=2) | |
| Dell XPS 13 9350 | |
| Framework Laptop 13.5 Core Ultra 7 155H | |
| MSI Prestige 13 AI Plus Evo A2VMG | |
| Dell Pro 13 Premium PA13250 | |
| Average of class Subnotebook (4993 - 7788, n=59, last 2 years) | |
| Lenovo ThinkPad X13 2-in-1 Gen 5 | |
| PCMark 10 / Essentials | |
| Lenovo ThinkPad X13 2-in-1 Gen 5 | |
| Framework Laptop 13.5 Core Ultra 7 155H | |
| Average of class Subnotebook (9363 - 11331, n=59, last 2 years) | |
| Average Intel Core Ultra 7 268V, Intel Arc Graphics 140V (10007 - 10701, n=2) | |
| MSI Prestige 13 AI Plus Evo A2VMG | |
| Dell Pro 13 Premium PA13250 | |
| Dell XPS 13 9350 | |
| PCMark 10 / Productivity | |
| Dell XPS 13 9350 | |
| Average Intel Core Ultra 7 268V, Intel Arc Graphics 140V (8766 - 9217, n=2) | |
| Dell Pro 13 Premium PA13250 | |
| Framework Laptop 13.5 Core Ultra 7 155H | |
| Average of class Subnotebook (5435 - 10623, n=59, last 2 years) | |
| MSI Prestige 13 AI Plus Evo A2VMG | |
| Lenovo ThinkPad X13 2-in-1 Gen 5 | |
| PCMark 10 / Digital Content Creation | |
| MSI Prestige 13 AI Plus Evo A2VMG | |
| Average Intel Core Ultra 7 268V, Intel Arc Graphics 140V (9425 - 10427, n=2) | |
| Dell XPS 13 9350 | |
| Framework Laptop 13.5 Core Ultra 7 155H | |
| Dell Pro 13 Premium PA13250 | |
| Average of class Subnotebook (5305 - 12442, n=59, last 2 years) | |
| Lenovo ThinkPad X13 2-in-1 Gen 5 | |
| CrossMark / Overall | |
| Dell XPS 13 9350 | |
| MSI Prestige 13 AI Plus Evo A2VMG | |
| Average Intel Core Ultra 7 268V, Intel Arc Graphics 140V (1643 - 1738, n=2) | |
| Framework Laptop 13.5 Core Ultra 7 155H | |
| Dell Pro 13 Premium PA13250 | |
| Average of class Subnotebook (365 - 2018, n=68, last 2 years) | |
| Lenovo ThinkPad X13 2-in-1 Gen 5 | |
| Microsoft Surface Pro Copilot+ | |
| CrossMark / Productivity | |
| Dell XPS 13 9350 | |
| MSI Prestige 13 AI Plus Evo A2VMG | |
| Average Intel Core Ultra 7 268V, Intel Arc Graphics 140V (1577 - 1680, n=2) | |
| Framework Laptop 13.5 Core Ultra 7 155H | |
| Dell Pro 13 Premium PA13250 | |
| Lenovo ThinkPad X13 2-in-1 Gen 5 | |
| Average of class Subnotebook (364 - 1875, n=68, last 2 years) | |
| Microsoft Surface Pro Copilot+ | |
| CrossMark / Creativity | |
| MSI Prestige 13 AI Plus Evo A2VMG | |
| Dell XPS 13 9350 | |
| Average Intel Core Ultra 7 268V, Intel Arc Graphics 140V (1866 - 1976, n=2) | |
| Framework Laptop 13.5 Core Ultra 7 155H | |
| Dell Pro 13 Premium PA13250 | |
| Average of class Subnotebook (372 - 2396, n=68, last 2 years) | |
| Lenovo ThinkPad X13 2-in-1 Gen 5 | |
| Microsoft Surface Pro Copilot+ | |
| CrossMark / Responsiveness | |
| Lenovo ThinkPad X13 2-in-1 Gen 5 | |
| Framework Laptop 13.5 Core Ultra 7 155H | |
| Dell XPS 13 9350 | |
| Average of class Subnotebook (312 - 1899, n=68, last 2 years) | |
| MSI Prestige 13 AI Plus Evo A2VMG | |
| Average Intel Core Ultra 7 268V, Intel Arc Graphics 140V (1267 - 1311, n=2) | |
| Dell Pro 13 Premium PA13250 | |
| Microsoft Surface Pro Copilot+ | |
| WebXPRT 3 / Overall | |
| Microsoft Surface Pro Copilot+ | |
| Average of class Subnotebook (156 - 479, n=67, last 2 years) | |
| Dell XPS 13 9350 | |
| MSI Prestige 13 AI Plus Evo A2VMG | |
| Framework Laptop 13.5 Core Ultra 7 155H | |
| Average Intel Core Ultra 7 268V, Intel Arc Graphics 140V (266 - 310, n=2) | |
| Dell Pro 13 Premium PA13250 | |
| Lenovo ThinkPad X13 2-in-1 Gen 5 | |
| WebXPRT 4 / Overall | |
| MSI Prestige 13 AI Plus Evo A2VMG | |
| Dell XPS 13 9350 | |
| Average Intel Core Ultra 7 268V, Intel Arc Graphics 140V (245 - 287, n=2) | |
| Average of class Subnotebook (132 - 348, n=68, last 2 years) | |
| Microsoft Surface Pro Copilot+ | |
| Framework Laptop 13.5 Core Ultra 7 155H | |
| Dell Pro 13 Premium PA13250 | |
| Lenovo ThinkPad X13 2-in-1 Gen 5 | |
| Mozilla Kraken 1.1 / Total | |
| Lenovo ThinkPad X13 2-in-1 Gen 5 | |
| Framework Laptop 13.5 Core Ultra 7 155H | |
| Average of class Subnotebook (278 - 1104, n=76, last 2 years) | |
| Dell Pro 13 Premium PA13250 | |
| Average Intel Core Ultra 7 268V, Intel Arc Graphics 140V (475 - 476, n=2) | |
| MSI Prestige 13 AI Plus Evo A2VMG | |
| Dell XPS 13 9350 | |
| Microsoft Surface Pro Copilot+ | |
* ... smaller is better
| PCMark 10 Score | 6729 points | |
Help | ||
| AIDA64 / Memory Copy | |
| MSI Prestige 13 AI Plus Evo A2VMG | |
| Average Intel Core Ultra 7 268V (100445 - 107108, n=2) | |
| Dell XPS 13 9350 | |
| Dell Pro 13 Premium PA13250 | |
| Average of class Subnotebook (14554 - 109035, n=70, last 2 years) | |
| Framework Laptop 13.5 Core Ultra 7 155H | |
| Lenovo ThinkPad X13 2-in-1 Gen 5 | |
| Microsoft Surface Pro Copilot+ | |
| AIDA64 / Memory Read | |
| Microsoft Surface Pro Copilot+ | |
| Dell XPS 13 9350 | |
| MSI Prestige 13 AI Plus Evo A2VMG | |
| Average Intel Core Ultra 7 268V (82511 - 88341, n=2) | |
| Dell Pro 13 Premium PA13250 | |
| Framework Laptop 13.5 Core Ultra 7 155H | |
| Average of class Subnotebook (15948 - 122210, n=70, last 2 years) | |
| Lenovo ThinkPad X13 2-in-1 Gen 5 | |
| AIDA64 / Memory Write | |
| MSI Prestige 13 AI Plus Evo A2VMG | |
| Average Intel Core Ultra 7 268V (115959 - 117888, n=2) | |
| Dell Pro 13 Premium PA13250 | |
| Dell XPS 13 9350 | |
| Average of class Subnotebook (15709 - 117898, n=70, last 2 years) | |
| Framework Laptop 13.5 Core Ultra 7 155H | |
| Lenovo ThinkPad X13 2-in-1 Gen 5 | |
| Microsoft Surface Pro Copilot+ | |
| AIDA64 / Memory Latency | |
| Lenovo ThinkPad X13 2-in-1 Gen 5 | |
| Framework Laptop 13.5 Core Ultra 7 155H | |
| Average of class Subnotebook (7.2 - 187.8, n=69, last 2 years) | |
| Dell Pro 13 Premium PA13250 | |
| MSI Prestige 13 AI Plus Evo A2VMG | |
| Dell XPS 13 9350 | |
| Average Intel Core Ultra 7 268V (97.4 - 101.2, n=2) | |
| Microsoft Surface Pro Copilot+ | |
* ... smaller is better
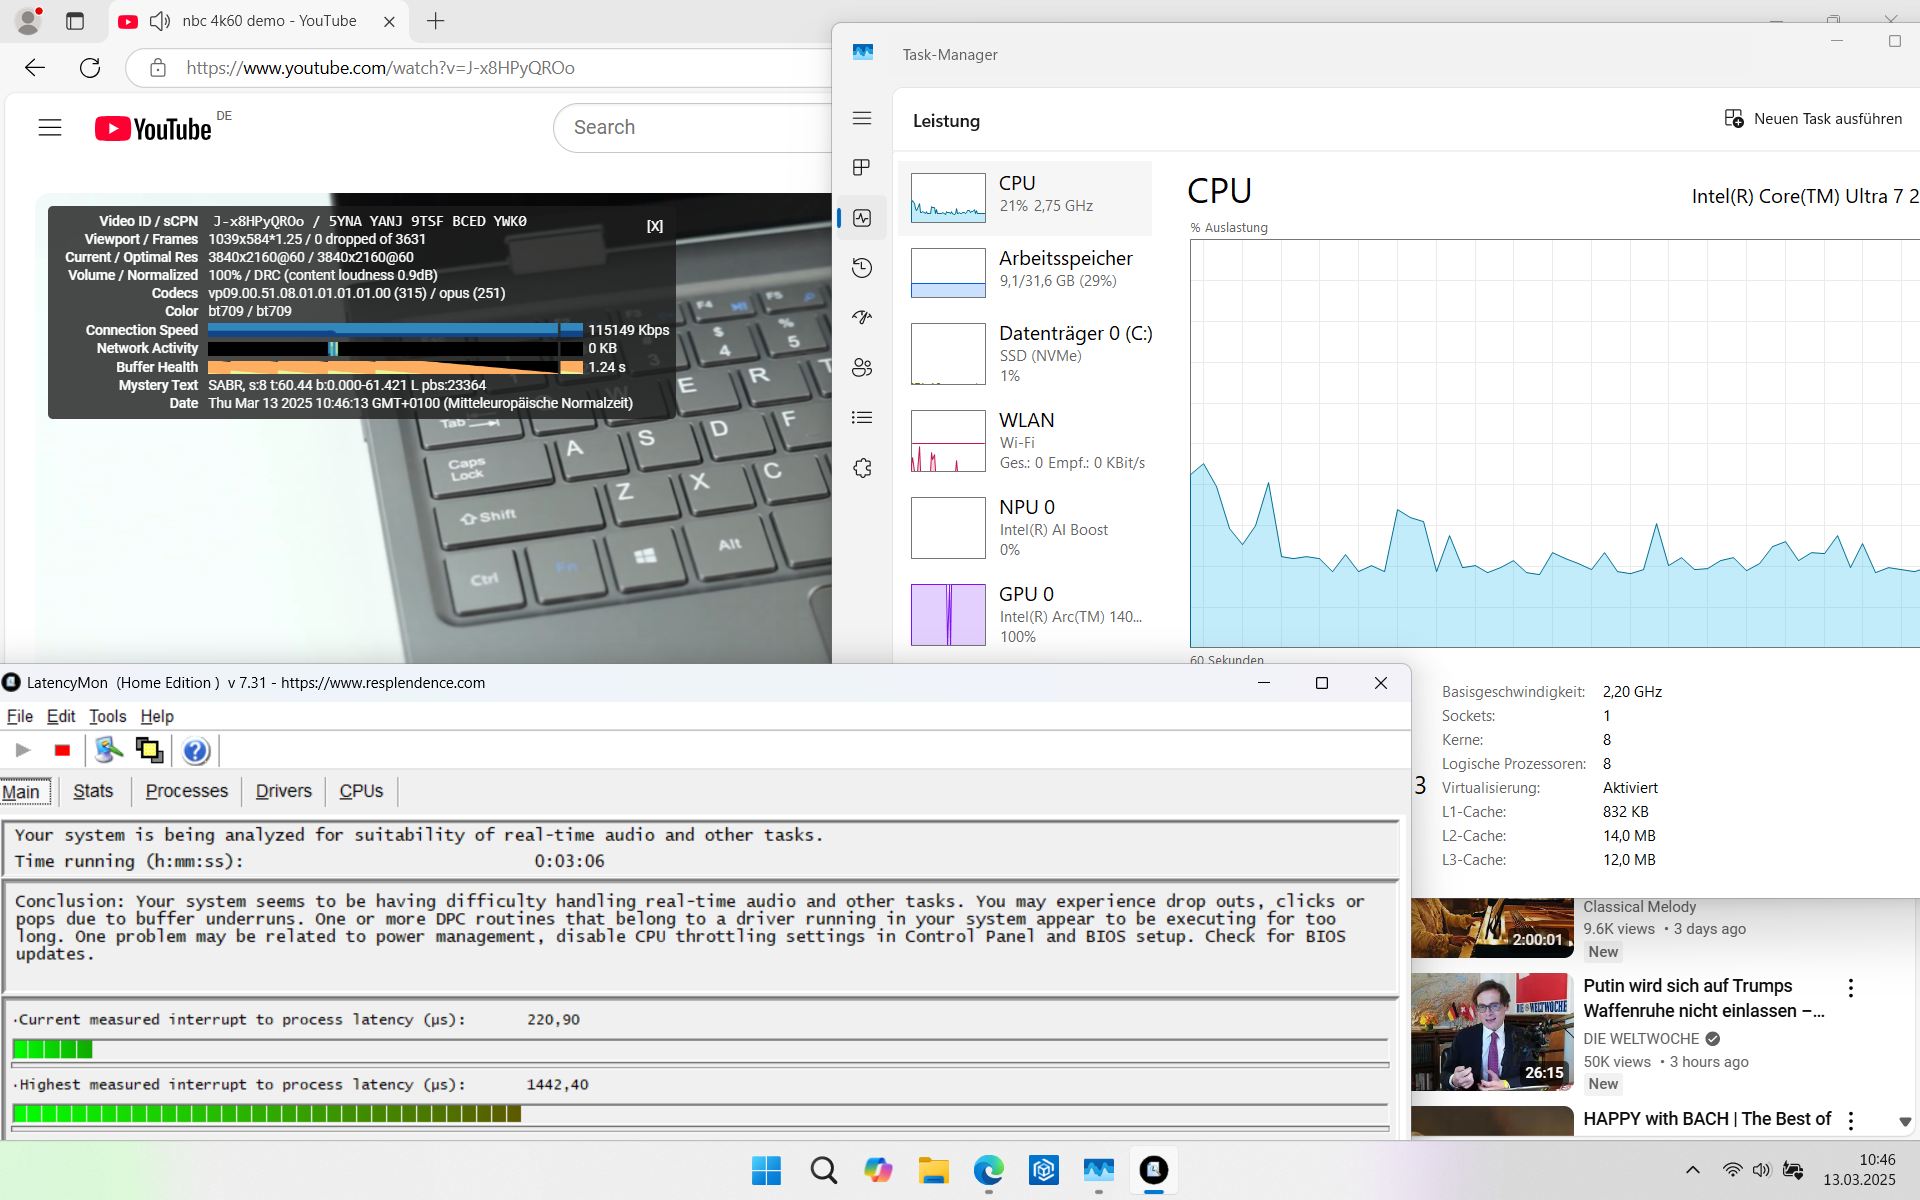
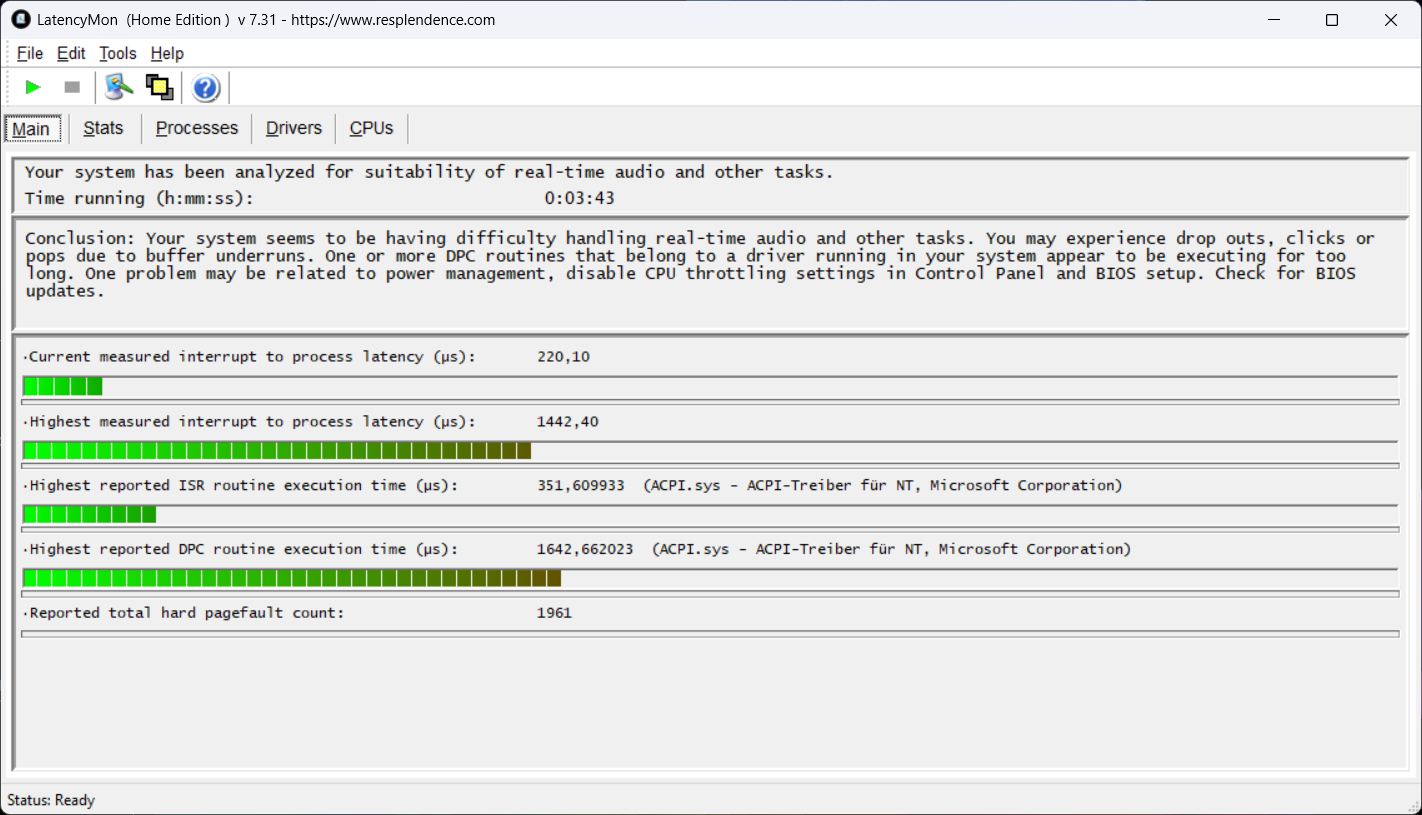
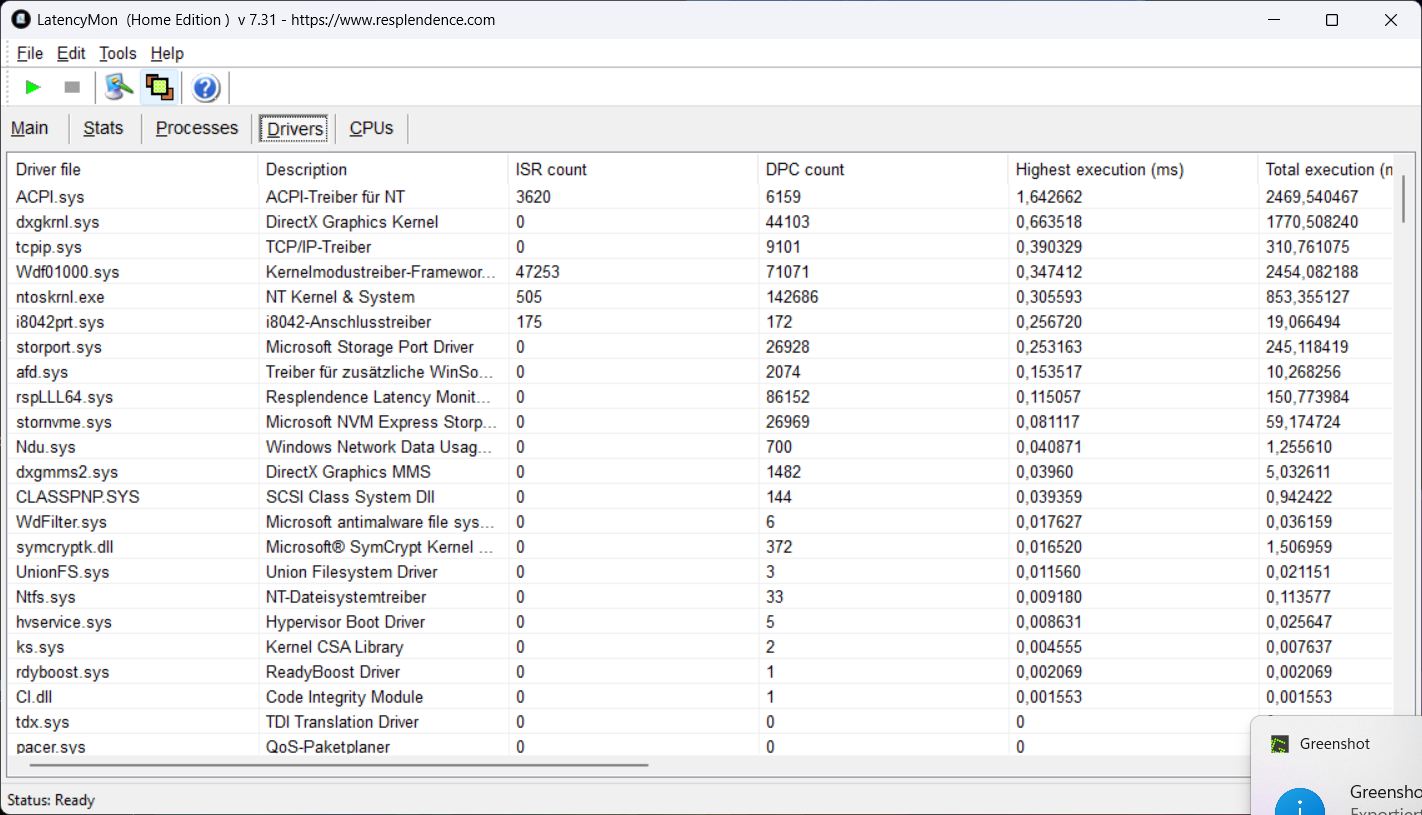
DPC 延迟
在打开多个浏览器标签页时,首次出现了严重的延迟问题。在播放 4K/60fps 的 YouTube 视频时,延迟也有所增加,幸好视频运行时没有掉帧。最终数值对我们来说有点过高。
| DPC Latencies / LatencyMon - interrupt to process latency (max), Web, Youtube, Prime95 | |
| Dell Pro 13 Premium PA13250 | |
| Lenovo ThinkPad X13 2-in-1 Gen 5 | |
| MSI Prestige 13 AI Plus Evo A2VMG | |
| Framework Laptop 13.5 Core Ultra 7 155H | |
* ... smaller is better
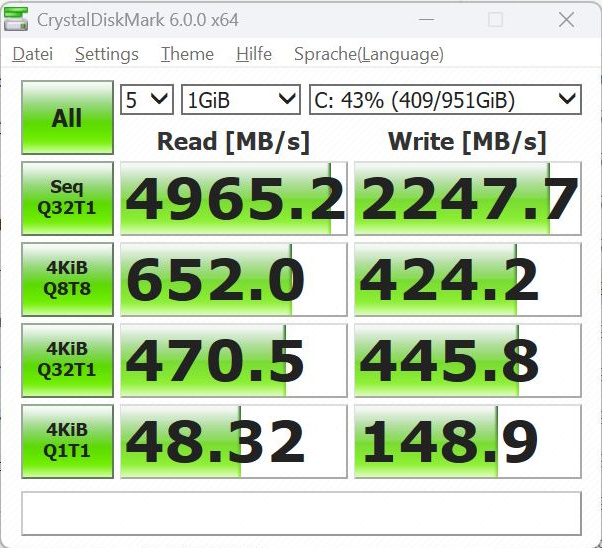
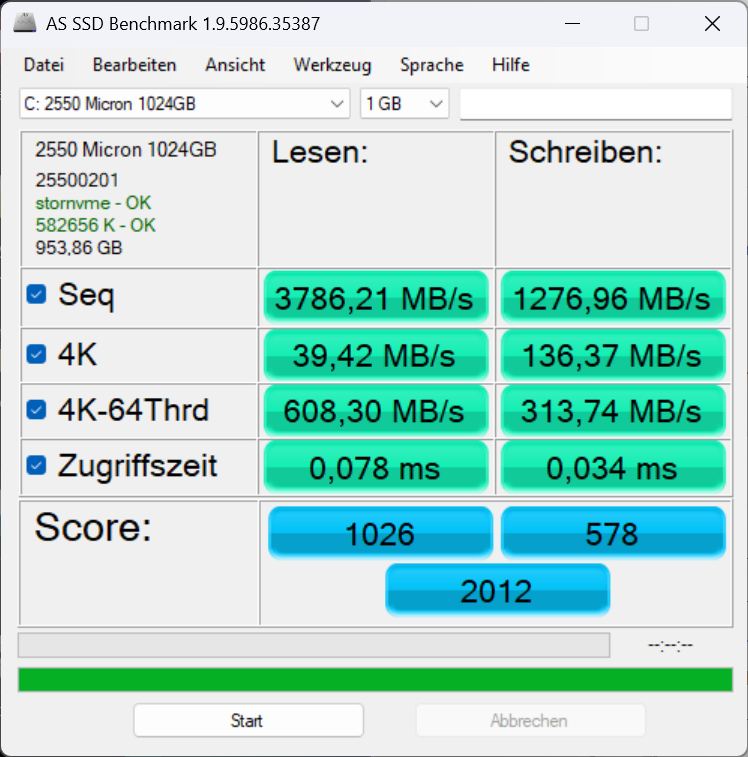
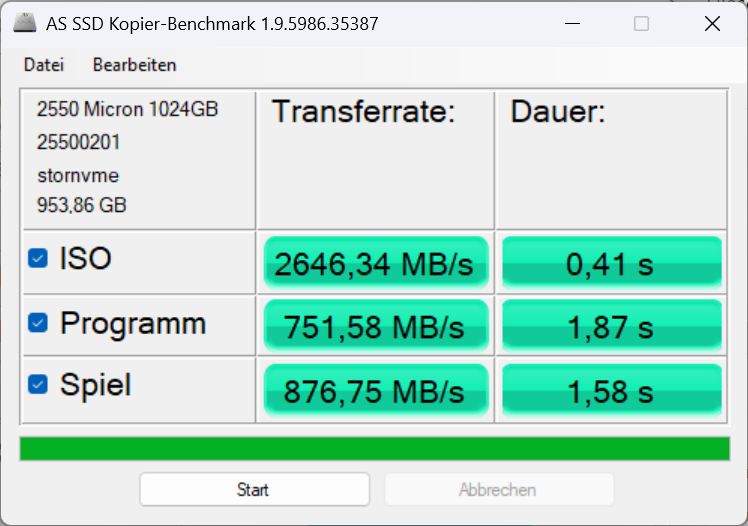
大容量存储器
存储容量为 1 TB Micron 2550,但根据配置的不同,也有 512 GB 的型号可供选择。总体而言,这款硬盘的速度令人失望,但性能长期保持相当稳定。

* ... smaller is better
Continuous Performance Read: DiskSpd Read Loop, Queue Depth 8
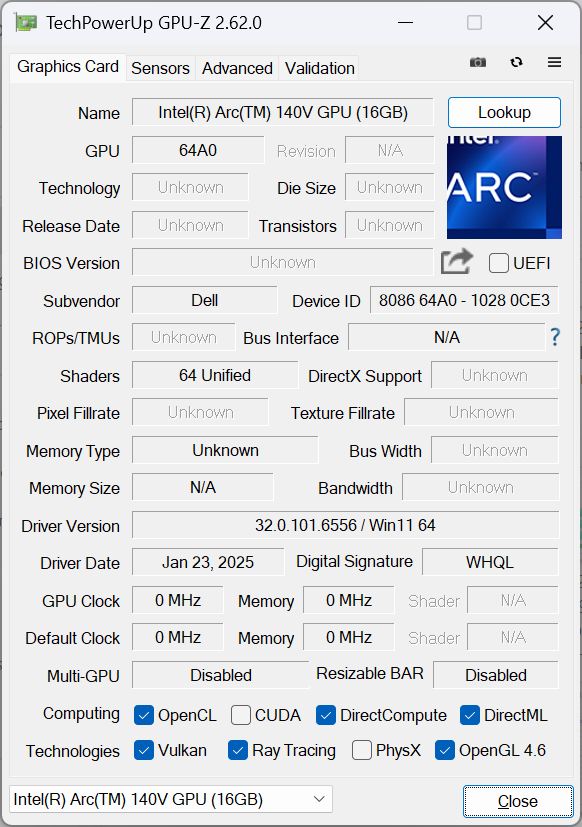
图形卡
英特尔 英特尔弧形图形 140ViGPU 这是一款速度相对较快的集成显卡。在合成 3DMark 基准测试中,它的表现达到或略高于我们的预期。在使用电池供电的循环Fire Strike 中,我们没有发现任何性能下降。
它在游戏中的表现也令人印象深刻,几乎每款游戏都能以全高清和 30fps 以上的中等细节运行,在某些情况下,它甚至能满足高细节的要求。赛博朋克 2077》的 30 分钟帧率看起来非常稳定。
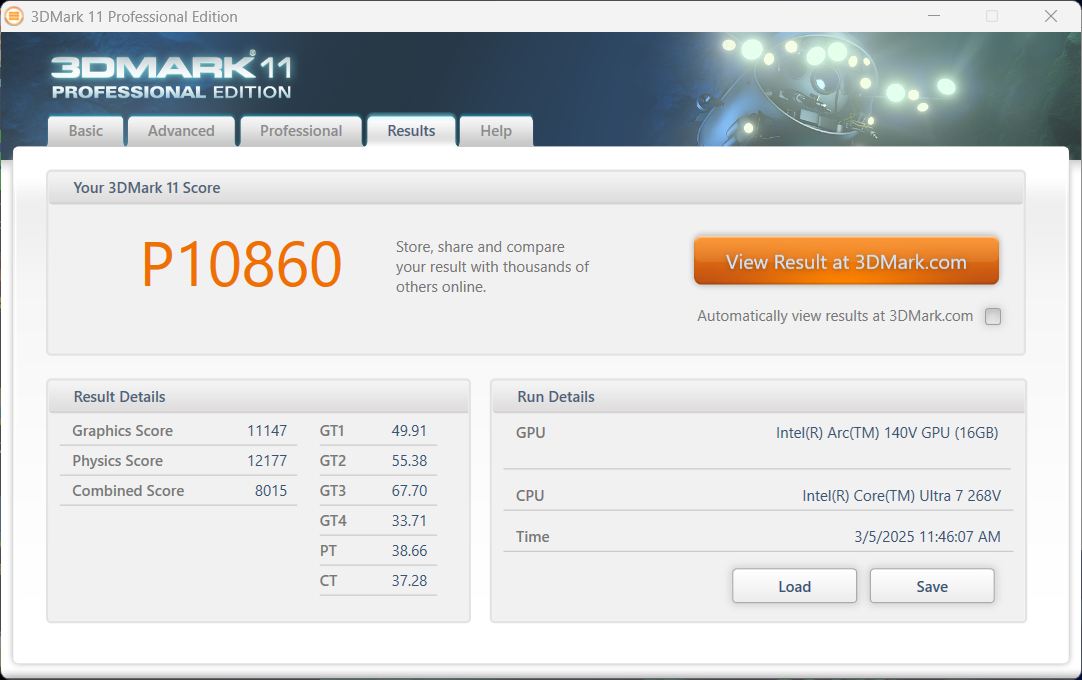
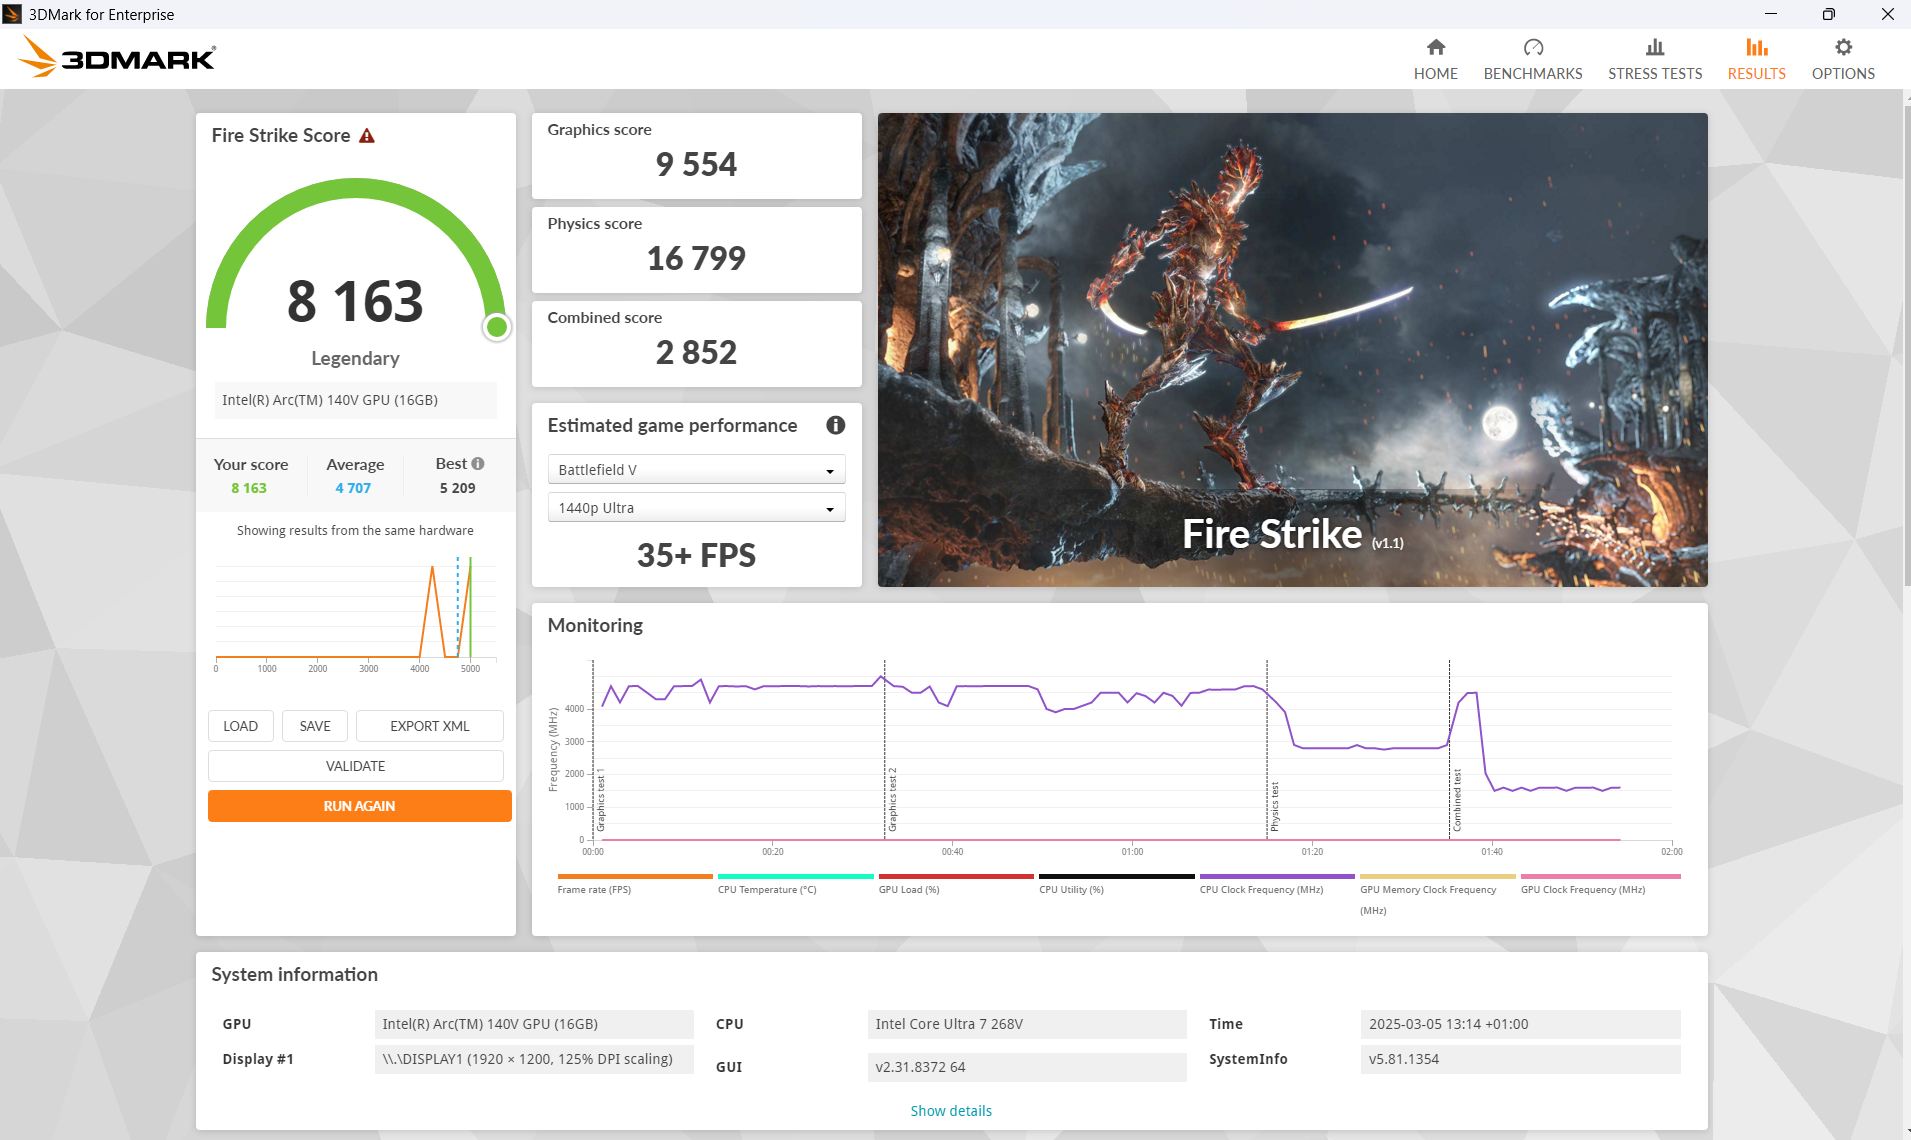
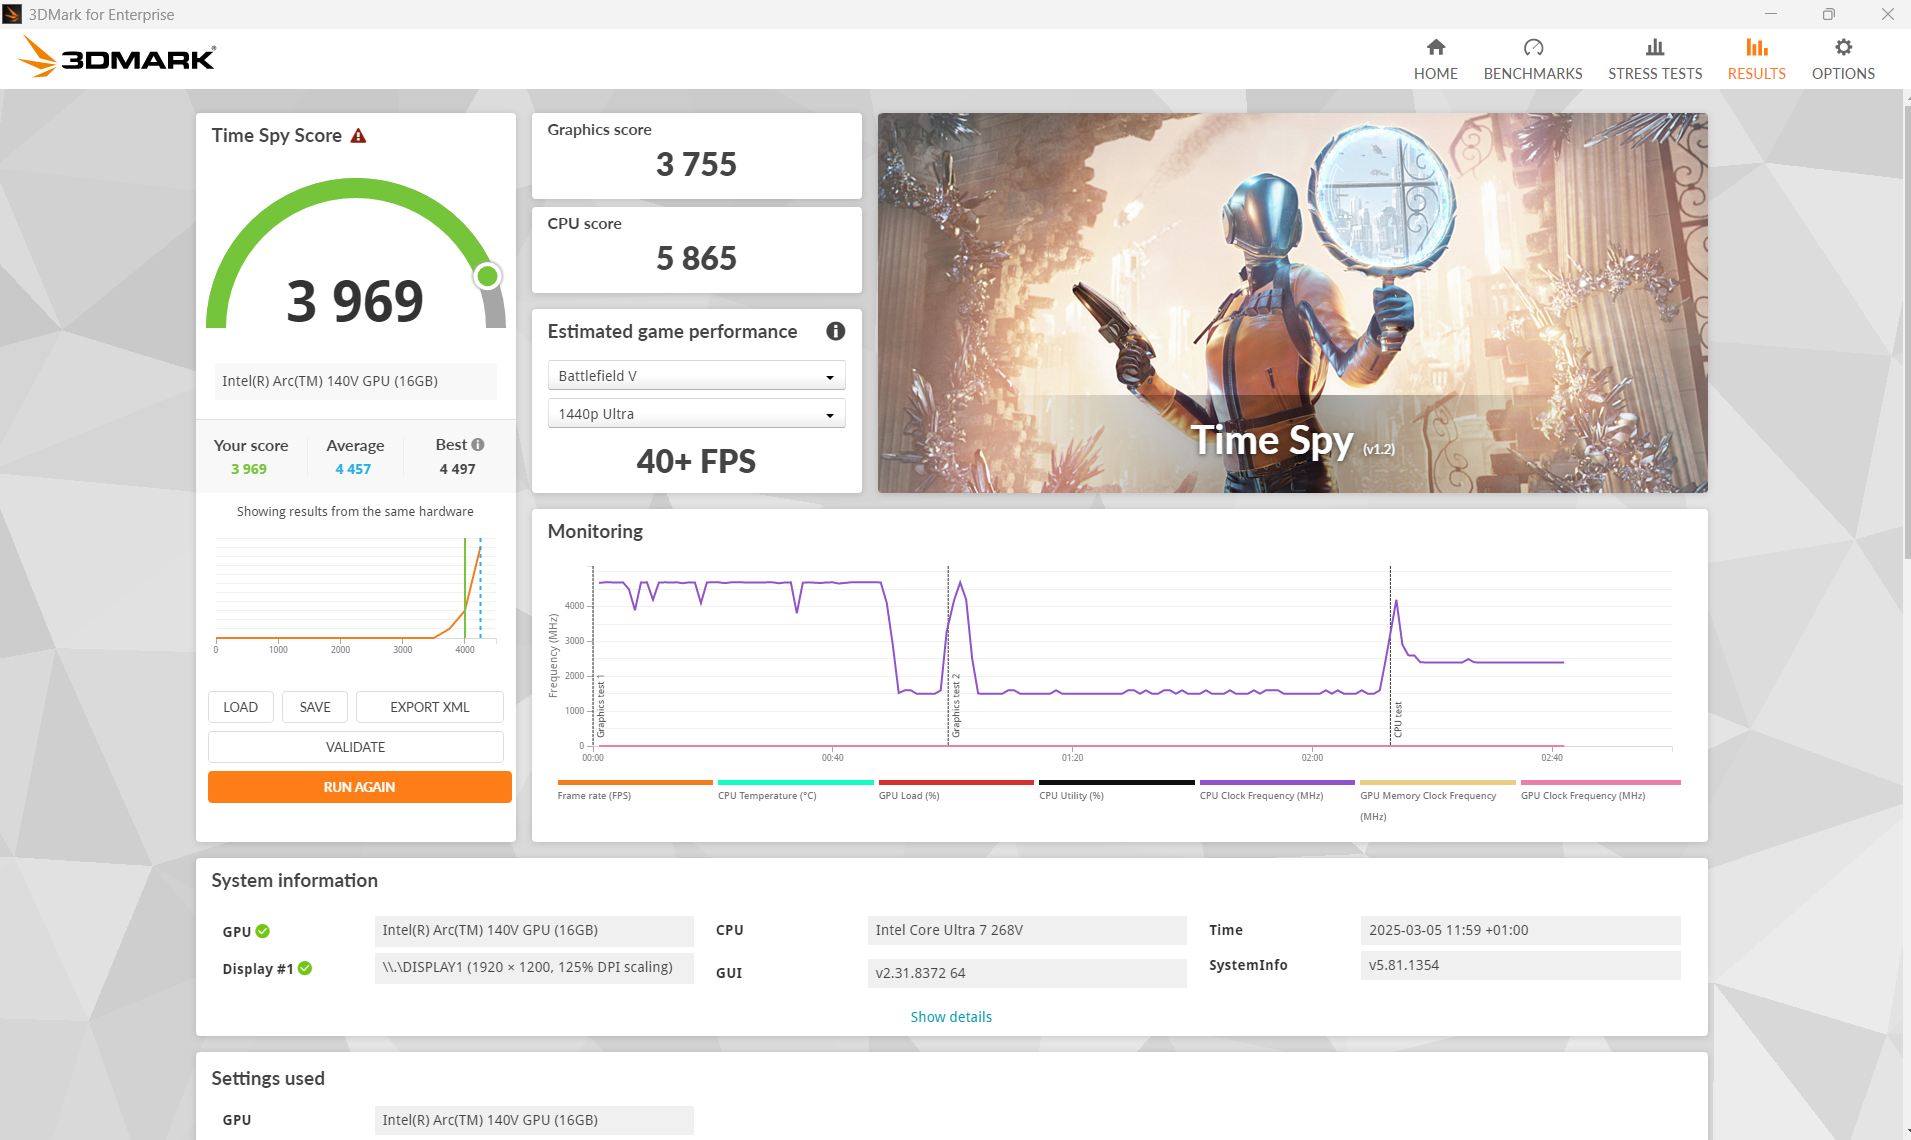
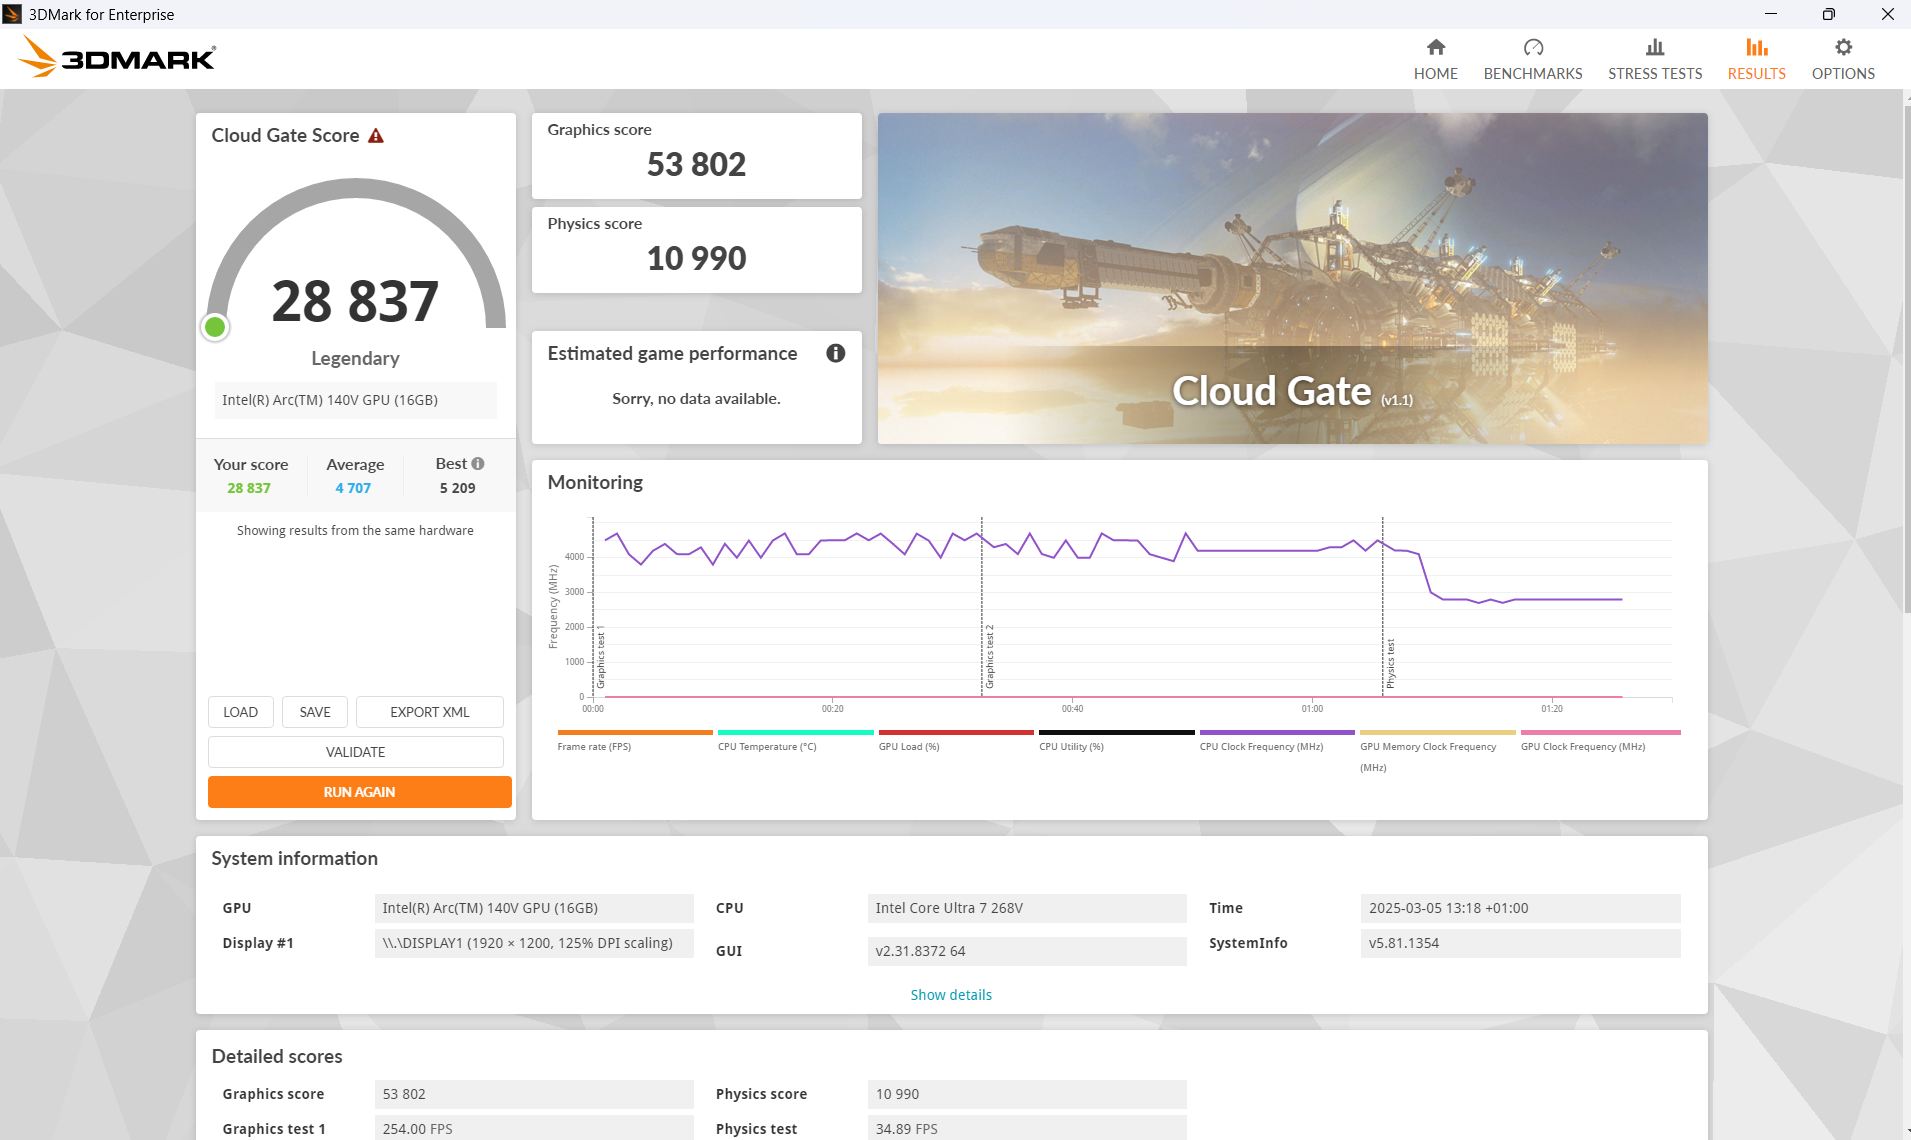
| 3DMark 11 Performance | 10860 points | |
| 3DMark Cloud Gate Standard Score | 28837 points | |
| 3DMark Fire Strike Score | 8163 points | |
| 3DMark Time Spy Score | 3969 points | |
Help | ||
* ... smaller is better
| Cyberpunk 2077 2.2 Phantom Liberty - 1920x1080 Ultra Preset (FSR off) | |
| MSI Prestige 13 AI Plus Evo A2VMG | |
| Dell Pro 13 Premium PA13250 | |
| Framework Laptop 13.5 Core Ultra 7 155H | |
| Average of class Subnotebook (8.48 - 31.4, n=47, last 2 years) | |
| Dell XPS 13 9350 | |
| Microsoft Surface Pro Copilot+ | |
| Lenovo ThinkPad X13 2-in-1 Gen 5 | |
| GTA V - 1920x1080 Highest Settings possible AA:4xMSAA + FX AF:16x | |
| MSI Prestige 13 AI Plus Evo A2VMG | |
| Dell Pro 13 Premium PA13250 | |
| Dell XPS 13 9350 | |
| Microsoft Surface Pro Copilot+ | |
| Average of class Subnotebook (7.81 - 53, n=67, last 2 years) | |
| Framework Laptop 13.5 Core Ultra 7 155H | |
| Lenovo ThinkPad X13 2-in-1 Gen 5 | |
Cyberpunk 2077 ultra FPS diagram
| low | med. | high | ultra | |
|---|---|---|---|---|
| GTA V (2015) | 153.4 | 140 | 26.3 | |
| Dota 2 Reborn (2015) | 107.5 | 101.7 | 87.8 | 71.2 |
| Final Fantasy XV Benchmark (2018) | 74.9 | 42.3 | 29.1 | |
| X-Plane 11.11 (2018) | 48.1 | 36.7 | 32.7 | |
| Strange Brigade (2018) | 223 | 83.3 | 69.5 | 57.8 |
| Baldur's Gate 3 (2023) | 45.5 | 35.7 | 31.3 | 30.8 |
| Cyberpunk 2077 2.2 Phantom Liberty (2023) | 43.5 | 35.4 | 28.6 | 28.1 |
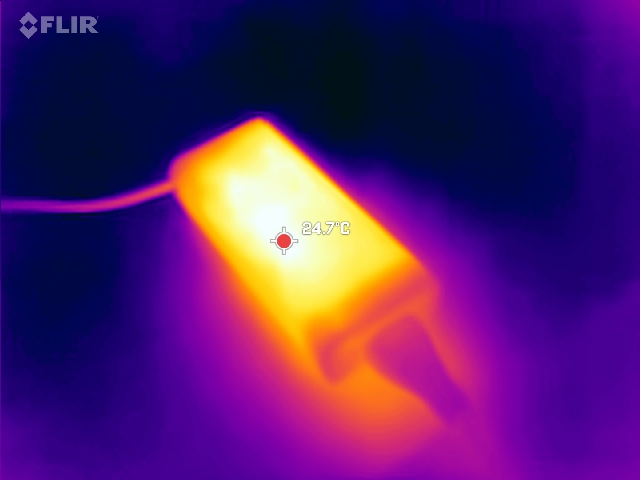
排放与能源 - 戴尔专业版经济实惠
噪音排放
风扇空转时通常很安静。在最大负载下进行游戏时,我们测得的最大噪音为 42 分贝,但实际上噪音更低(即使在压力测试中),通常只有 36 或 37 分贝。
Noise Level
| Idle |
| 23 / 23 / 23 dB(A) |
| Load |
| 37 / 42.74 dB(A) |
 | ||
30 dB silent 40 dB(A) audible 50 dB(A) loud |
||
min: | ||
| Dell Pro 13 Premium PA13250 Arc 140V, Core Ultra 7 268V, Micron 2550 1TB | MSI Prestige 13 AI Plus Evo A2VMG Arc 140V, Core Ultra 7 258V | Lenovo ThinkPad X13 2-in-1 Gen 5 Graphics 4-Core, Ultra 7 165U, Lenovo UMIS RPETJ1T24MHP2QDQ | Framework Laptop 13.5 Core Ultra 7 155H Arc 8-Core, Ultra 7 155H | Dell XPS 13 9350 Arc 140V, Core Ultra 7 256V, Micron 2550 512GB | Microsoft Surface Pro Copilot+ Adreno X1-85 3.8 TFLOPS, SD X Plus X1P-64-100, Samsung PM9B1 256GB MZ9L4256HCJQ | |
|---|---|---|---|---|---|---|
| Noise | -8% | 4% | -7% | 3% | 2% | |
| off / environment * | 23 | 24.1 -5% | 23 -0% | 24 -4% | 24.1 -5% | 23.8 -3% |
| Idle Minimum * | 23 | 24.8 -8% | 23 -0% | 24.1 -5% | 24.4 -6% | 23.8 -3% |
| Idle Average * | 23 | 24.8 -8% | 23 -0% | 25.1 -9% | 24.4 -6% | 23.8 -3% |
| Idle Maximum * | 23 | 26.7 -16% | 23 -0% | 27 -17% | 24.4 -6% | 23.8 -3% |
| Load Average * | 37 | 36.8 1% | 34.44 7% | 38.4 -4% | 26.2 29% | 23.8 36% |
| Cyberpunk 2077 ultra * | 42.74 | 44.5 -4% | 38.28 10% | 43.7 -2% | 34.2 20% | 44.7 -5% |
| Load Maximum * | 42.74 | 50.8 -19% | 39.04 9% | 45.8 -7% | 45.2 -6% | 44.7 -5% |
* ... smaller is better
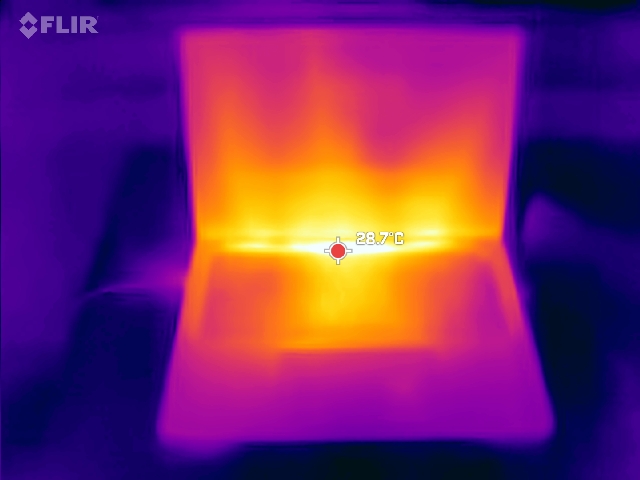
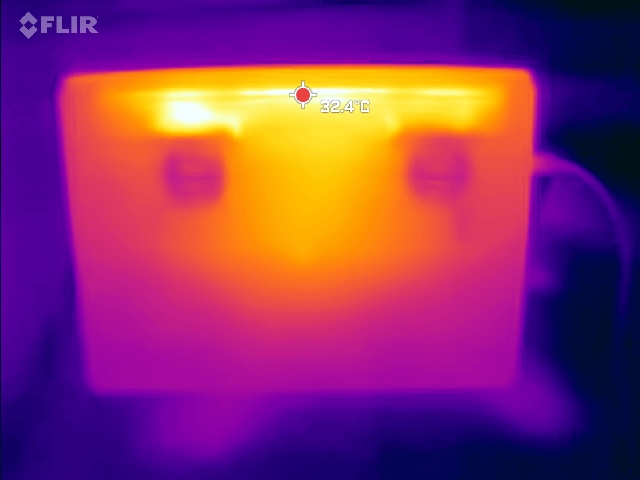
温度
与许多同尺寸的办公和商用产品不同,戴尔 Pro 13 Premium 使用了两个风扇,而不是一个,这对表面温度有积极的影响。在我们的压力测试中,游戏温度较高,但即使在这里,我们测得的热点温度也仅为 37°C。笔记本电脑两侧的散热效果相同,而不是某些竞争对手所看到的只有一侧。
(+) The maximum temperature on the upper side is 31 °C / 88 F, compared to the average of 35.9 °C / 97 F, ranging from 21.4 to 59 °C for the class Subnotebook.
(+) The bottom heats up to a maximum of 31 °C / 88 F, compared to the average of 39.3 °C / 103 F
(+) In idle usage, the average temperature for the upper side is 22.3 °C / 72 F, compared to the device average of 30.8 °C / 87 F.
(+) 3: The average temperature for the upper side is 28.8 °C / 84 F, compared to the average of 30.8 °C / 87 F for the class Subnotebook.
(+) The palmrests and touchpad are cooler than skin temperature with a maximum of 26 °C / 78.8 F and are therefore cool to the touch.
(+) The average temperature of the palmrest area of similar devices was 28.2 °C / 82.8 F (+2.2 °C / 4 F).
| Dell Pro 13 Premium PA13250 Intel Core Ultra 7 268V, Intel Arc Graphics 140V | MSI Prestige 13 AI Plus Evo A2VMG Intel Core Ultra 7 258V, Intel Arc Graphics 140V | Lenovo ThinkPad X13 2-in-1 Gen 5 Intel Core Ultra 7 165U, Intel Graphics 4-Core iGPU (Arc) | Framework Laptop 13.5 Core Ultra 7 155H Intel Core Ultra 7 155H, Intel Arc 8-Core iGPU | Dell XPS 13 9350 Intel Core Ultra 7 256V, Intel Arc Graphics 140V | Microsoft Surface Pro Copilot+ Qualcomm Snapdragon X Plus X1P-64-100, Qualcomm SD X Adreno X1-85 3.8 TFLOPS | |
|---|---|---|---|---|---|---|
| Heat | -23% | -52% | -29% | -12% | -25% | |
| Maximum Upper Side * | 31 | 43.4 -40% | 60 -94% | 42.8 -38% | 34.8 -12% | 43.9 -42% |
| Maximum Bottom * | 31 | 42.4 -37% | 57 -84% | 45.2 -46% | 37.4 -21% | 44.9 -45% |
| Idle Upper Side * | 24 | 25.4 -6% | 27 -13% | 27.2 -13% | 25.4 -6% | 26.2 -9% |
| Idle Bottom * | 24 | 25.6 -7% | 28 -17% | 28.6 -19% | 26.2 -9% | 24.6 -3% |
* ... smaller is better
发言人
对于如此小巧的笔记本电脑来说,扬声器的表现甚至超过了一些大得多的机型。中音均衡,但仍缺乏低音。音频插孔输入可用于连接外部设备。
Dell Pro 13 Premium PA13250 audio analysis
(+) | speakers can play relatively loud (87.49 dB)
Bass 100 - 315 Hz
(-) | nearly no bass - on average 15.9% lower than median
(±) | linearity of bass is average (8.3% delta to prev. frequency)
Mids 400 - 2000 Hz
(+) | balanced mids - only 2.9% away from median
(+) | mids are linear (4.7% delta to prev. frequency)
Highs 2 - 16 kHz
(±) | reduced highs - on average 5.2% lower than median
(±) | linearity of highs is average (7.1% delta to prev. frequency)
Overall 100 - 16.000 Hz
(+) | overall sound is linear (12.2% difference to median)
Compared to same class
» 14% of all tested devices in this class were better, 4% similar, 82% worse
» The best had a delta of 5%, average was 19%, worst was 53%
Compared to all devices tested
» 8% of all tested devices were better, 2% similar, 89% worse
» The best had a delta of 4%, average was 24%, worst was 134%
MSI Prestige 13 AI Plus Evo A2VMG audio analysis
(+) | speakers can play relatively loud (84.5 dB)
Bass 100 - 315 Hz
(-) | nearly no bass - on average 19.4% lower than median
(±) | linearity of bass is average (9.6% delta to prev. frequency)
Mids 400 - 2000 Hz
(±) | higher mids - on average 6.4% higher than median
(+) | mids are linear (5.1% delta to prev. frequency)
Highs 2 - 16 kHz
(±) | higher highs - on average 6.1% higher than median
(+) | highs are linear (4.6% delta to prev. frequency)
Overall 100 - 16.000 Hz
(±) | linearity of overall sound is average (18.2% difference to median)
Compared to same class
» 50% of all tested devices in this class were better, 7% similar, 43% worse
» The best had a delta of 5%, average was 19%, worst was 53%
Compared to all devices tested
» 36% of all tested devices were better, 8% similar, 56% worse
» The best had a delta of 4%, average was 24%, worst was 134%
耗电量
得益于 Lunar Lake SoC,戴尔 Pro 13 非常经济。空闲时的功耗仅为 2 到 4.75 W,我们在运行《赛博朋克 2077》时测得的功耗仅为 38 W。只有 戴尔 XPS 13 9350在运行《赛博朋克 2077》时,我们测得的功耗仅为 38 W。
| Off / Standby | |
| Idle | |
| Load |
|
Key:
min: | |
| Dell Pro 13 Premium PA13250 Core Ultra 7 268V, Arc 140V | MSI Prestige 13 AI Plus Evo A2VMG Core Ultra 7 258V, Arc 140V | Lenovo ThinkPad X13 2-in-1 Gen 5 Ultra 7 165U, Graphics 4-Core | Framework Laptop 13.5 Core Ultra 7 155H Ultra 7 155H, Arc 8-Core | Dell XPS 13 9350 Core Ultra 7 256V, Arc 140V | Microsoft Surface Pro Copilot+ SD X Plus X1P-64-100, Adreno X1-85 3.8 TFLOPS | Average of class Subnotebook | |
|---|---|---|---|---|---|---|---|
| Power Consumption | -39% | -19% | -26% | 7% | -23% | -62% | |
| Idle Minimum * | 2 | 3.5 -75% | 3.2 -60% | 2.5 -25% | 1.3 35% | 1.9 5% | 4.3 ? -115% |
| Idle Average * | 4.3 | 5.9 -37% | 6.1 -42% | 5.2 -21% | 2.5 42% | 9.2 -114% | 7.33 ? -70% |
| Idle Maximum * | 4.75 | 10 -111% | 6.7 -41% | 5.8 -22% | 4.1 14% | 9.5 -100% | 9.07 ? -91% |
| Load Average * | 40 | 38.7 3% | 44.2 -11% | 47.5 -19% | 40.1 -0% | 29.6 26% | 45.2 ? -13% |
| Cyberpunk 2077 ultra * | 36.4 | 46.3 -27% | 25.2 31% | 54.5 -50% | 46.1 -27% | 39.5 -9% | |
| Cyberpunk 2077 ultra external monitor * | 38 | 45.6 -20% | 38.5 -1% | 52.4 -38% | 43.1 -13% | 37.4 2% | |
| Load Maximum * | 57 | 61.5 -8% | 62.5 -10% | 61.5 -8% | 57.3 -1% | 40.7 29% | 69 ? -21% |
* ... smaller is better
Power consumption Cyberpunk / stress test
Power consumption with an external monitor
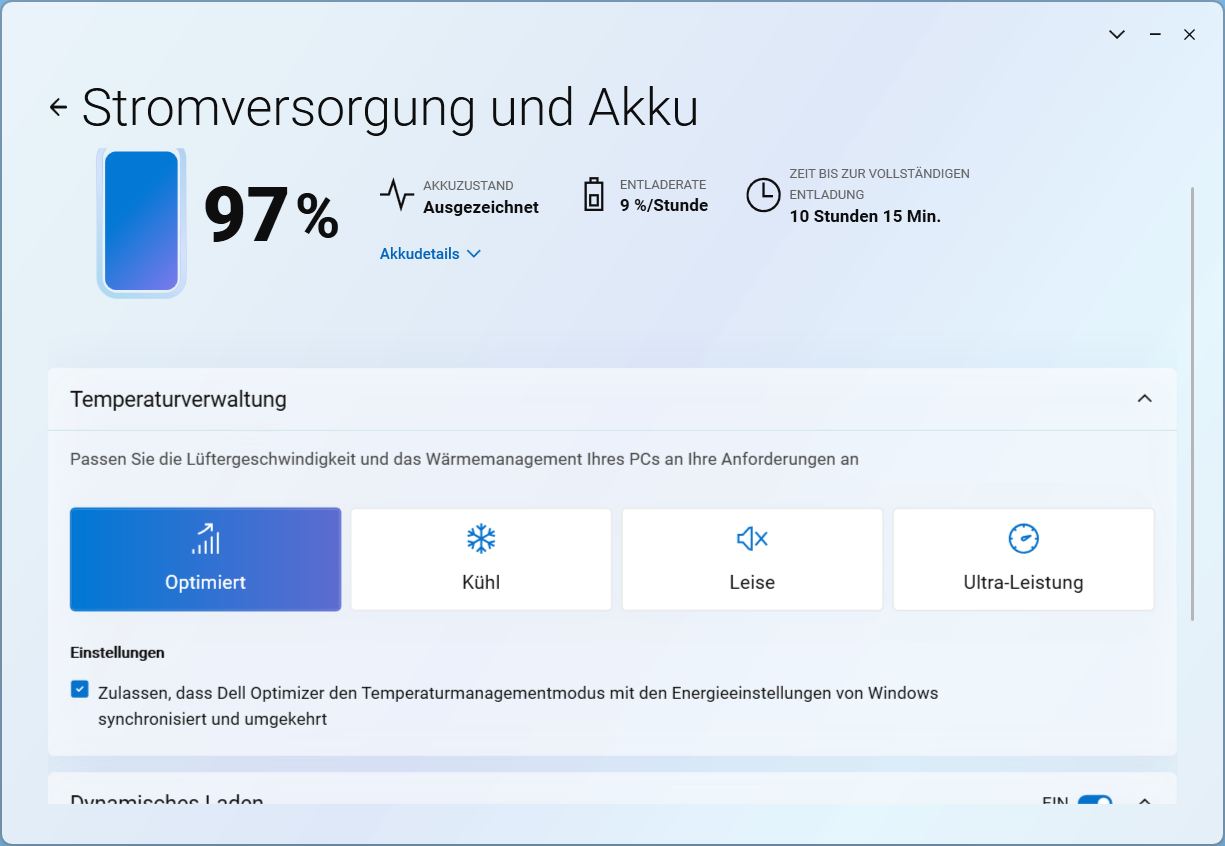
电池寿命
由于功耗低,电池续航能力非常出色。我们在 WLAN 和视频测试中记录了近 24 小时的续航时间,这是一个非常棒的结果!60 瓦电池的容量属于中等水平。XPS 13 XPS 13的电池容量(55 瓦时)略小。
| Dell Pro 13 Premium PA13250 Core Ultra 7 268V, Arc 140V, 60 Wh | MSI Prestige 13 AI Plus Evo A2VMG Core Ultra 7 258V, Arc 140V, 75 Wh | Lenovo ThinkPad X13 2-in-1 Gen 5 Ultra 7 165U, Graphics 4-Core, 54.7 Wh | Framework Laptop 13.5 Core Ultra 7 155H Ultra 7 155H, Arc 8-Core, 61 Wh | Dell XPS 13 9350 Core Ultra 7 256V, Arc 140V, 55 Wh | Microsoft Surface Pro Copilot+ SD X Plus X1P-64-100, Adreno X1-85 3.8 TFLOPS, 47 Wh | Average of class Subnotebook | |
|---|---|---|---|---|---|---|---|
| Battery Runtime | -44% | -50% | -52% | -15% | -48% | -36% | |
| H.264 | 1425 | 731 -49% | 841 -41% | 961 ? -33% | |||
| WiFi v1.3 | 1440 | 804 -44% | 739 -49% | 630 -56% | 1236 -14% | 662 -54% | 757 ? -47% |
| Load | 170 | 84 -51% | 90 -47% | 142 -16% | 89 -48% | 121.3 ? -29% | |
| Reader / Idle | 2296 | 3407 | 1882 ? |
Notebookcheck 总体评分
戴尔 Pro 13 Premium 几乎满足了您对移动商务笔记本电脑的所有期望:它体积小、重量轻、经济实惠、电池续航时间长,而且还能提供高水平的性能。除了价格昂贵之外,这款产品几乎没有任何值得抱怨的地方。
Dell Pro 13 Premium PA13250
- 03/14/2025 v8
Christian Hintze
 Total Sustainability Score:
 Transparency
The selection of devices to be reviewed is made by our editorial team. The test sample was provided to the author as a loan by the manufacturer or retailer for the purpose of this review. The lender had no influence on this review, nor did the manufacturer receive a copy of this review before publication. There was no obligation to publish this review. We never accept compensation or payment in return for our reviews. As an independent media company, Notebookcheck is not subjected to the authority of manufacturers, retailers or publishers.
This is how Notebookcheck is testing
Every year, Notebookcheck independently reviews hundreds of laptops and smartphones using standardized procedures to ensure that all results are comparable. We have continuously developed our test methods for around 20 years and set industry standards in the process. In our test labs, high-quality measuring equipment is utilized by experienced technicians and editors. These tests involve a multi-stage validation process. Our complex rating system is based on hundreds of well-founded measurements and benchmarks, which maintains objectivity. Further information on our test methods can be found here.

