

RTX 5080 笔记本电脑是 WQHD 游戏的最佳选择 - 华硕 ROG Strix G16 G615 评测
谁真正需要 RTX 5090 笔记本电脑?
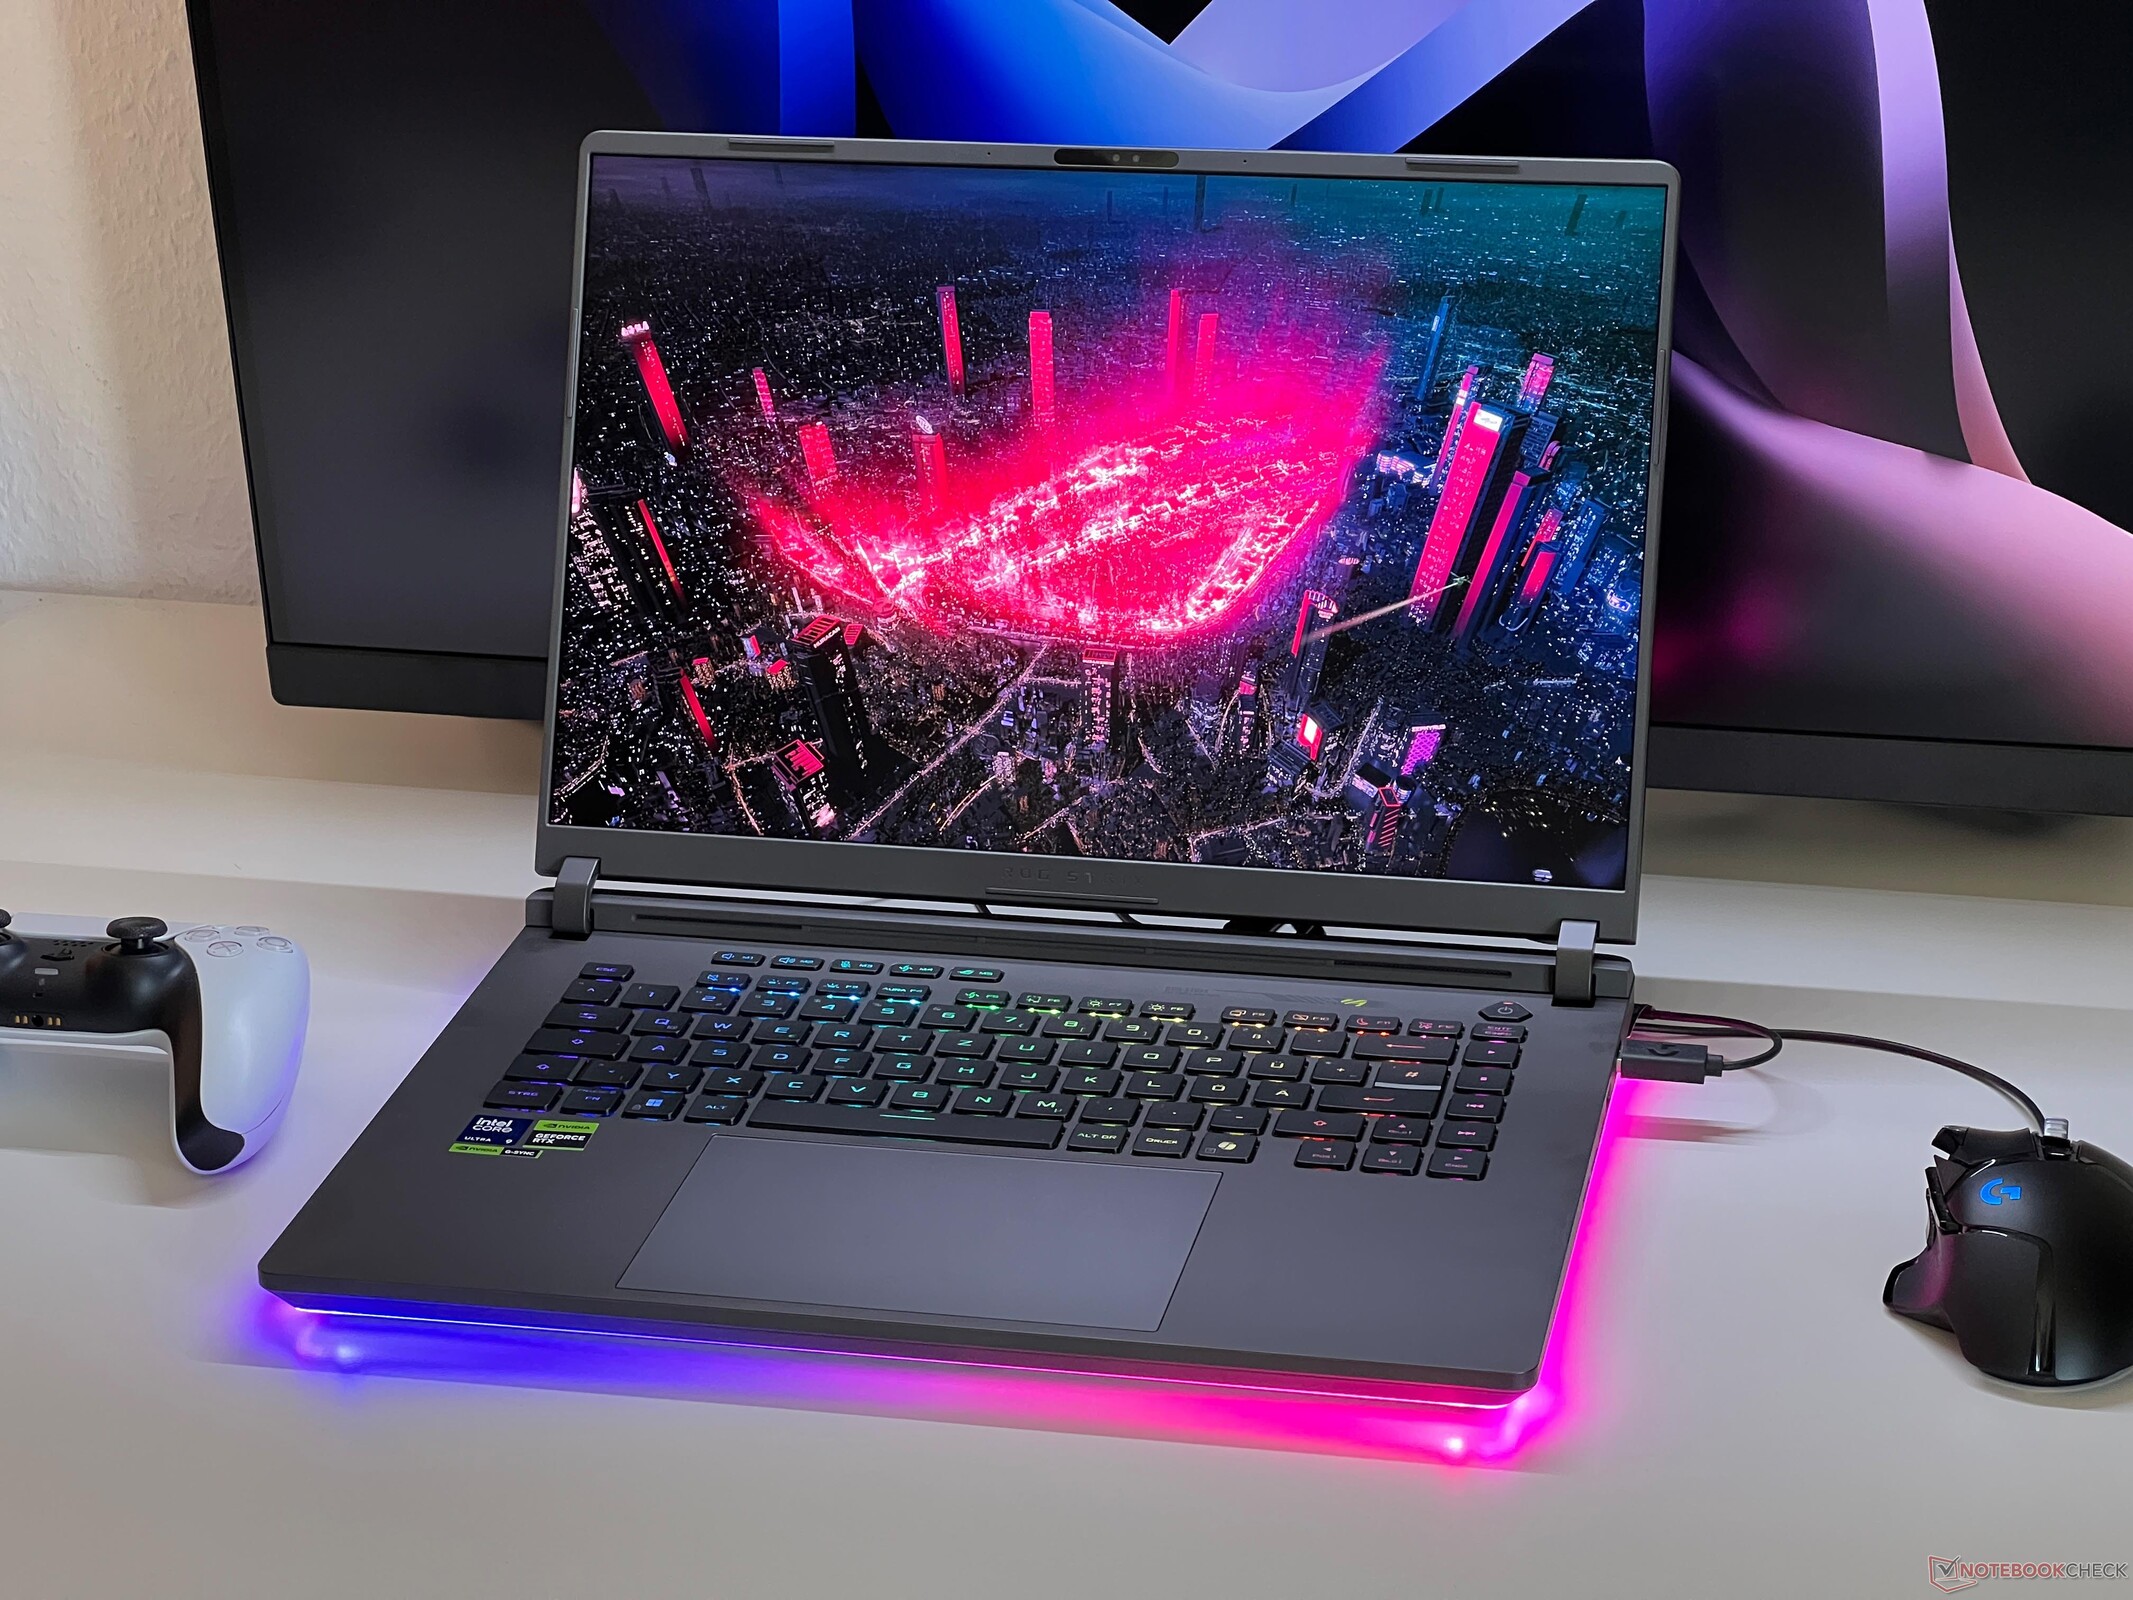
新款华硕 ROG Strix G16 最多可配备 RTX 5080 笔记本电脑,但这在游戏时不会有太大问题。Strix G16 代表了一款不错的游戏套装,配备了雾面 IPS 显示屏、快速的酷睿 Ultra 9 275 HX 以及非常不错的维护选项。Andreas Osthoff, 👁 Andreas Osthoff (translated by DeepL / Ninh Duy) Published 🇺🇸 🇩🇪 ...
结论 - ROG Strix G16 是一款出色的游戏笔记本电脑
新款华硕 ROG Strix G16 是一款功能强大的游戏笔记本电脑,在我们的测试中给人留下了良好的整体印象。事实上,Mini-LED 面板和 RTX 5090 笔记本电脑是为更昂贵的 Strix SCAR 16 所保留的,这并不代表什么问题。采用 240 Hz 的哑光 IPS 面板在对比度方面仍稍显落后,但另一方面,它不会出现任何 PWM 闪烁,而且整体图像质量非常好。在这种情况下,你只能选择不使用 HDR。
新的GeForce RTX 5080 笔记本电脑非常适合原生 WQHD 分辨率,再加上快速的英特尔酷睿 Ultra 9 275HX,你将获得充足的游戏性能,尽管旧的 RTX 4080 笔记本电脑也不会落后很多。因此,只有使用旧版 RTX 3000 GPU 的用户才有升级的必要。RTX 5090 笔记本电脑的速度也会稍快一些,但只有在 4K 游戏中才能真正发挥其优势。更令人讨厌的是,华硕只将可能更好的 Ryzen 9 9955HX 游戏处理器与 RTX 5070 Ti 笔记本电脑结合使用,而且还是老式机箱设计。
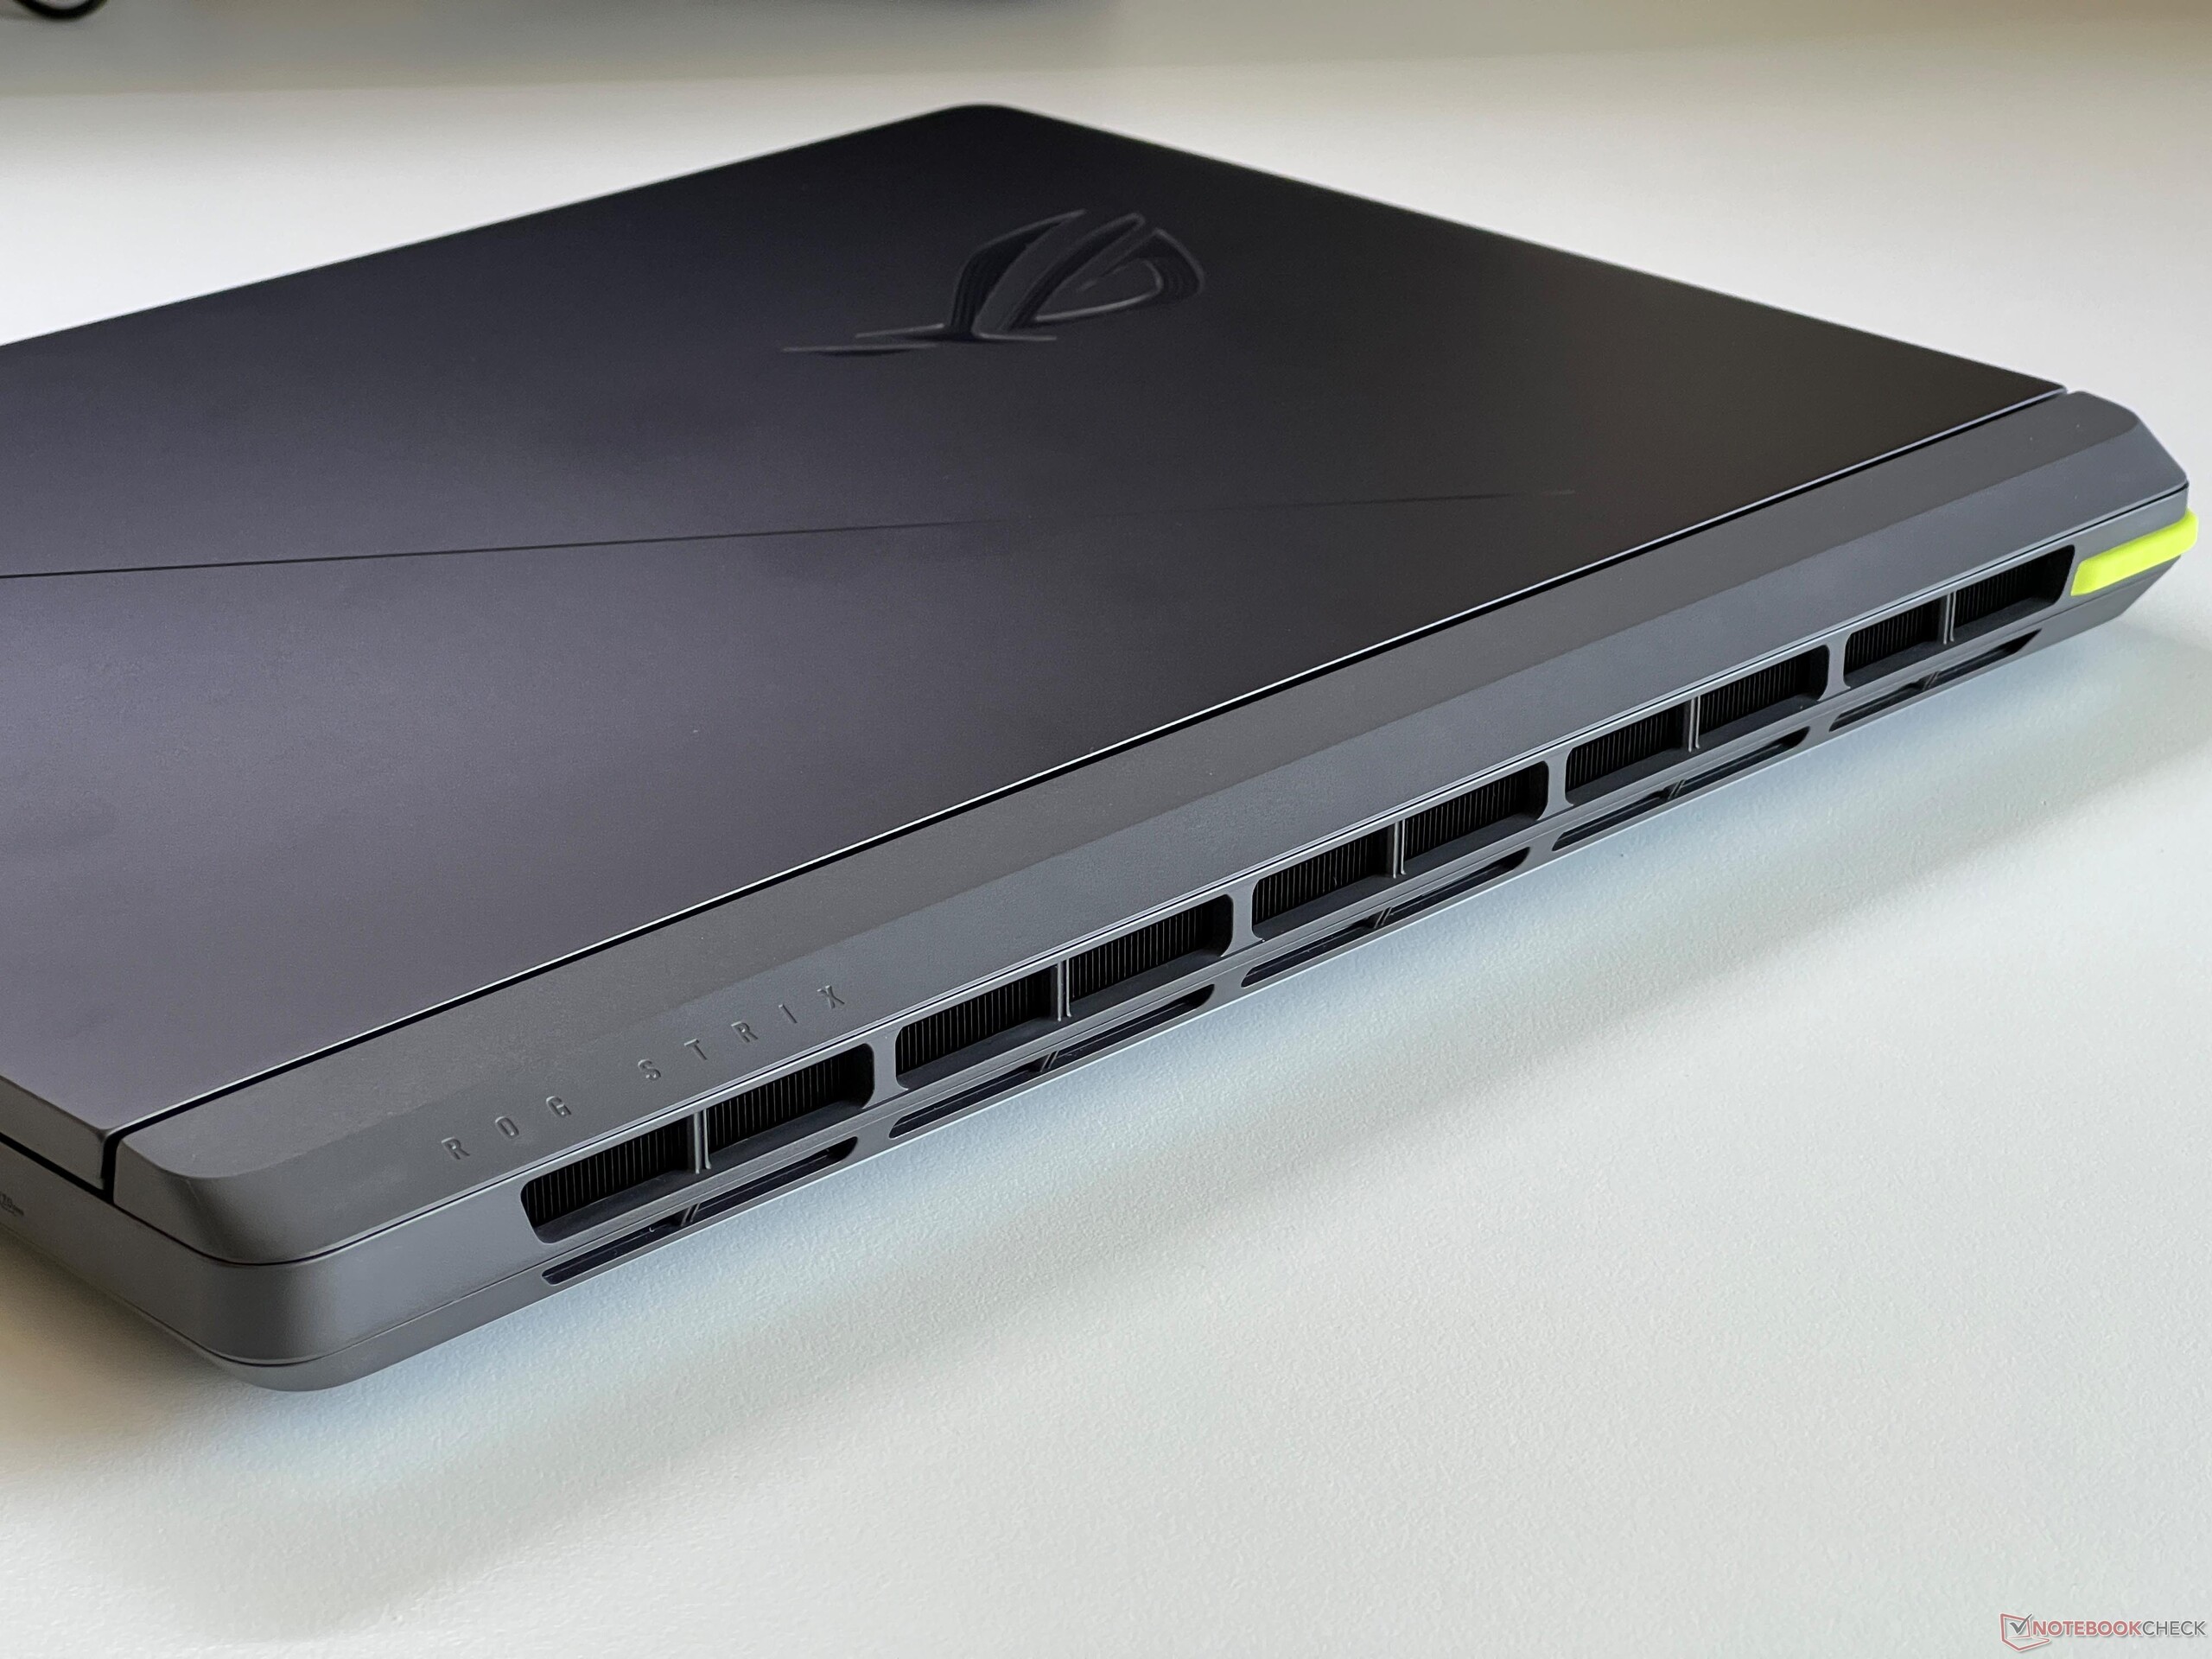
机箱完全由塑料制成,但灰色的表面不像黑色的 ROG Strix SCAR 那样容易沾染灰尘。机箱整体质量不错,亮点在于底部的 LED 条形照明灯和底座的解锁装置。除了它们的位置,我们对连接也没有任何抱怨,因为已经包含了两个快速的 Thunderbolt 5 连接。键盘非常舒适,但缺少数字键盘。Strix G16 的电池续航时间也领先于竞争对手。
最接近的竞争对手可能是 联想Legion Pro 7i 16 G10G10 采用 RTX 5080 笔记本电脑,游戏性能略高,OLED 显示屏也非常出色,但会反光并产生 PWM 闪烁。此外,同类配置的价格要高出 300 欧元(约合人民币 341 元)。在不久的将来,我们还将测试 XMG Neo 16 与 AMD Ryzen 9 9955HX 和 RTX 5080 Laptop 的配合使用情况。
Pros
Cons
ROG Strix 型号是华硕的高端游戏笔记本电脑,Strix 和 Strix SCAR 型号之间存在一些差异。ROG SCAR 旗舰机型配备最快的 GPU(RTX 5090 笔记本电脑),并提供 Mini-LED 面板以及显示盖上的辅助显示屏形式的额外照明选项。相比之下,普通的 ROG Strix(G16 或 G18)最多配备 RTX 5080 笔记本电脑,包括 IPS 显示屏。而搭载 Ryzen 9 9955HX 的 AMD 型号 G16/G18 甚至仅限于 RTX 5070 Ti,而且还使用了完全不同的机箱(没有新的维护挡板)。
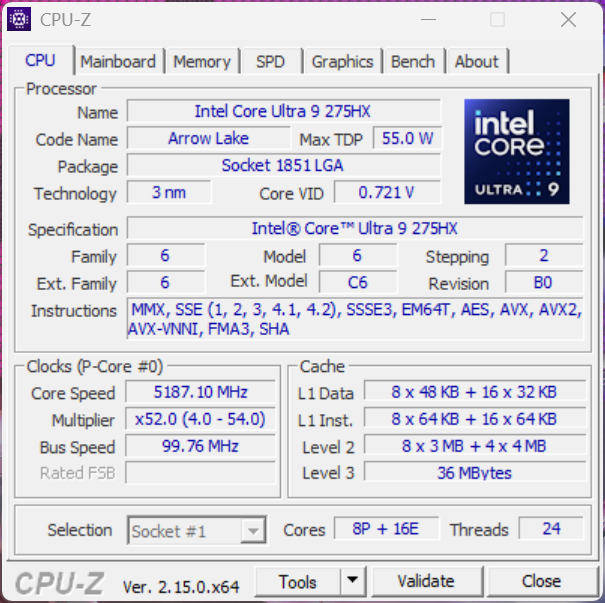
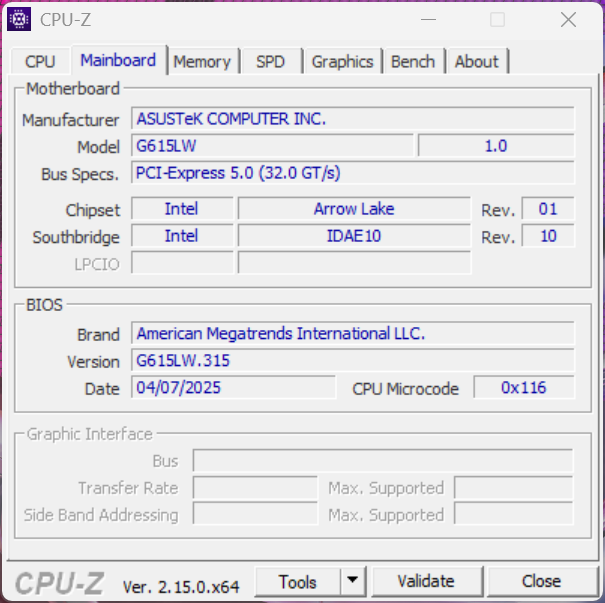
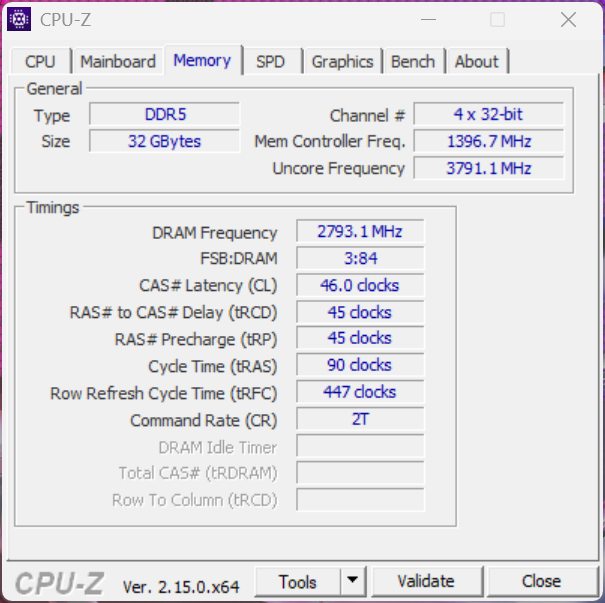
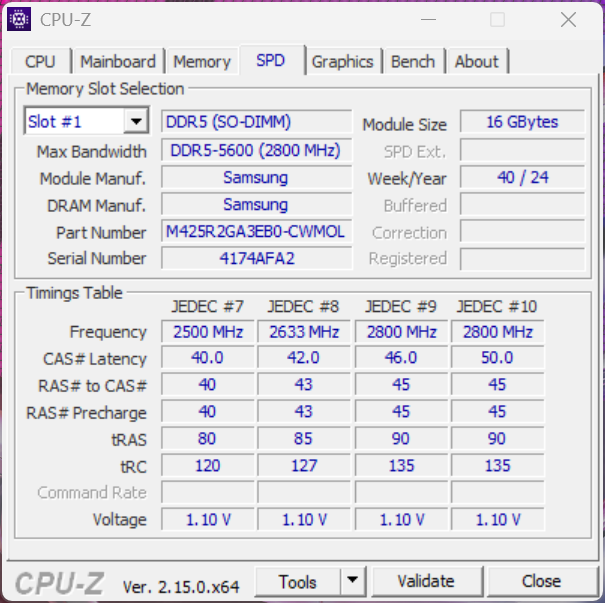
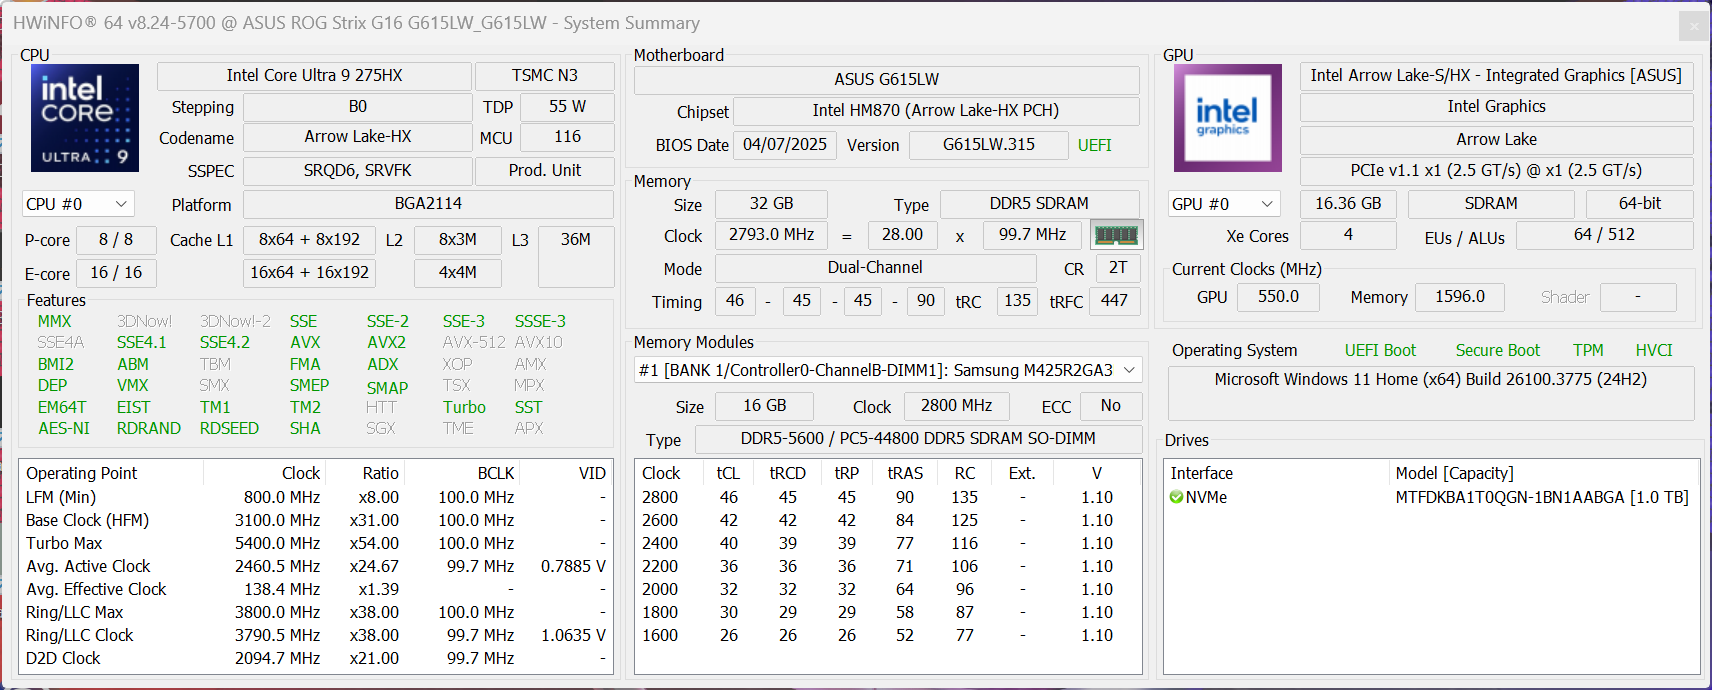
今天,我们测试的是 ROG Strix G16 G615,配备英特尔酷睿 Ultra 9 275HX、32 GB 内存、1 TB SSD、240 Hz 的 WQHD-IPS 面板和GeForce RTX 5080 笔记本电脑,建议零售价为 3299 欧元(德国约合 3750 美元)。
规格
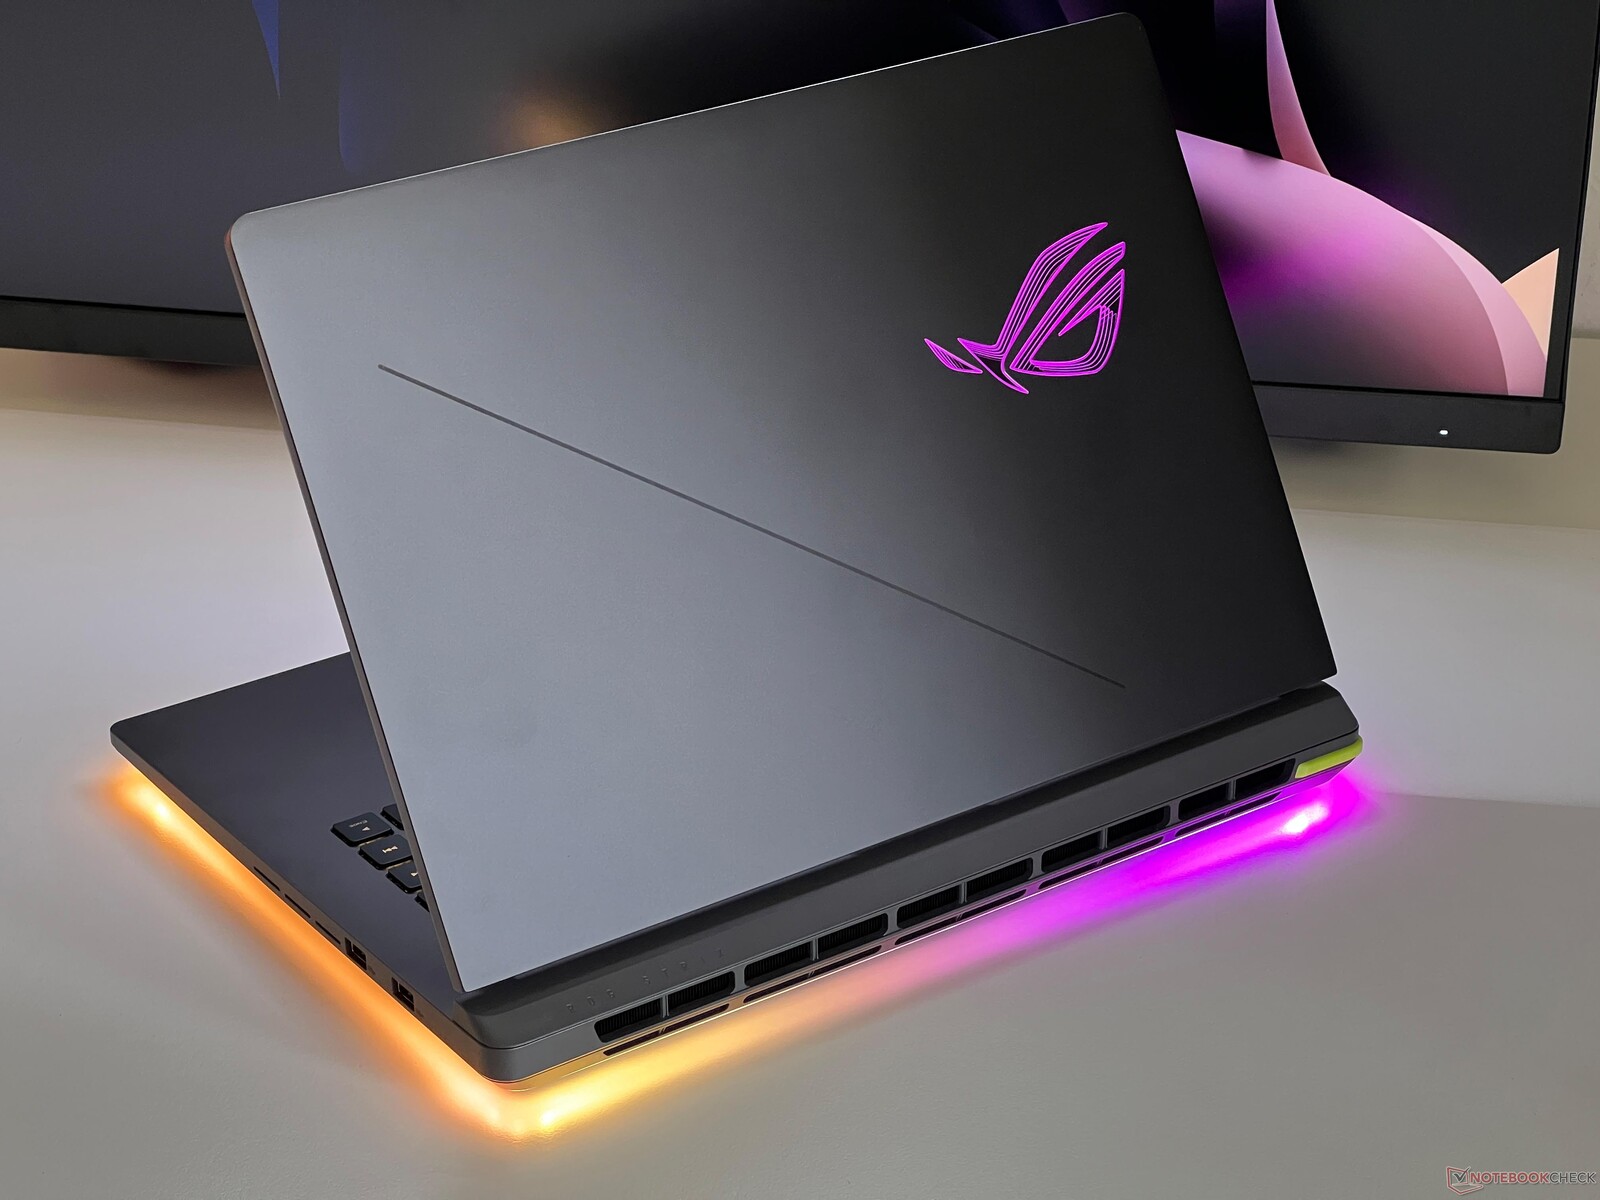
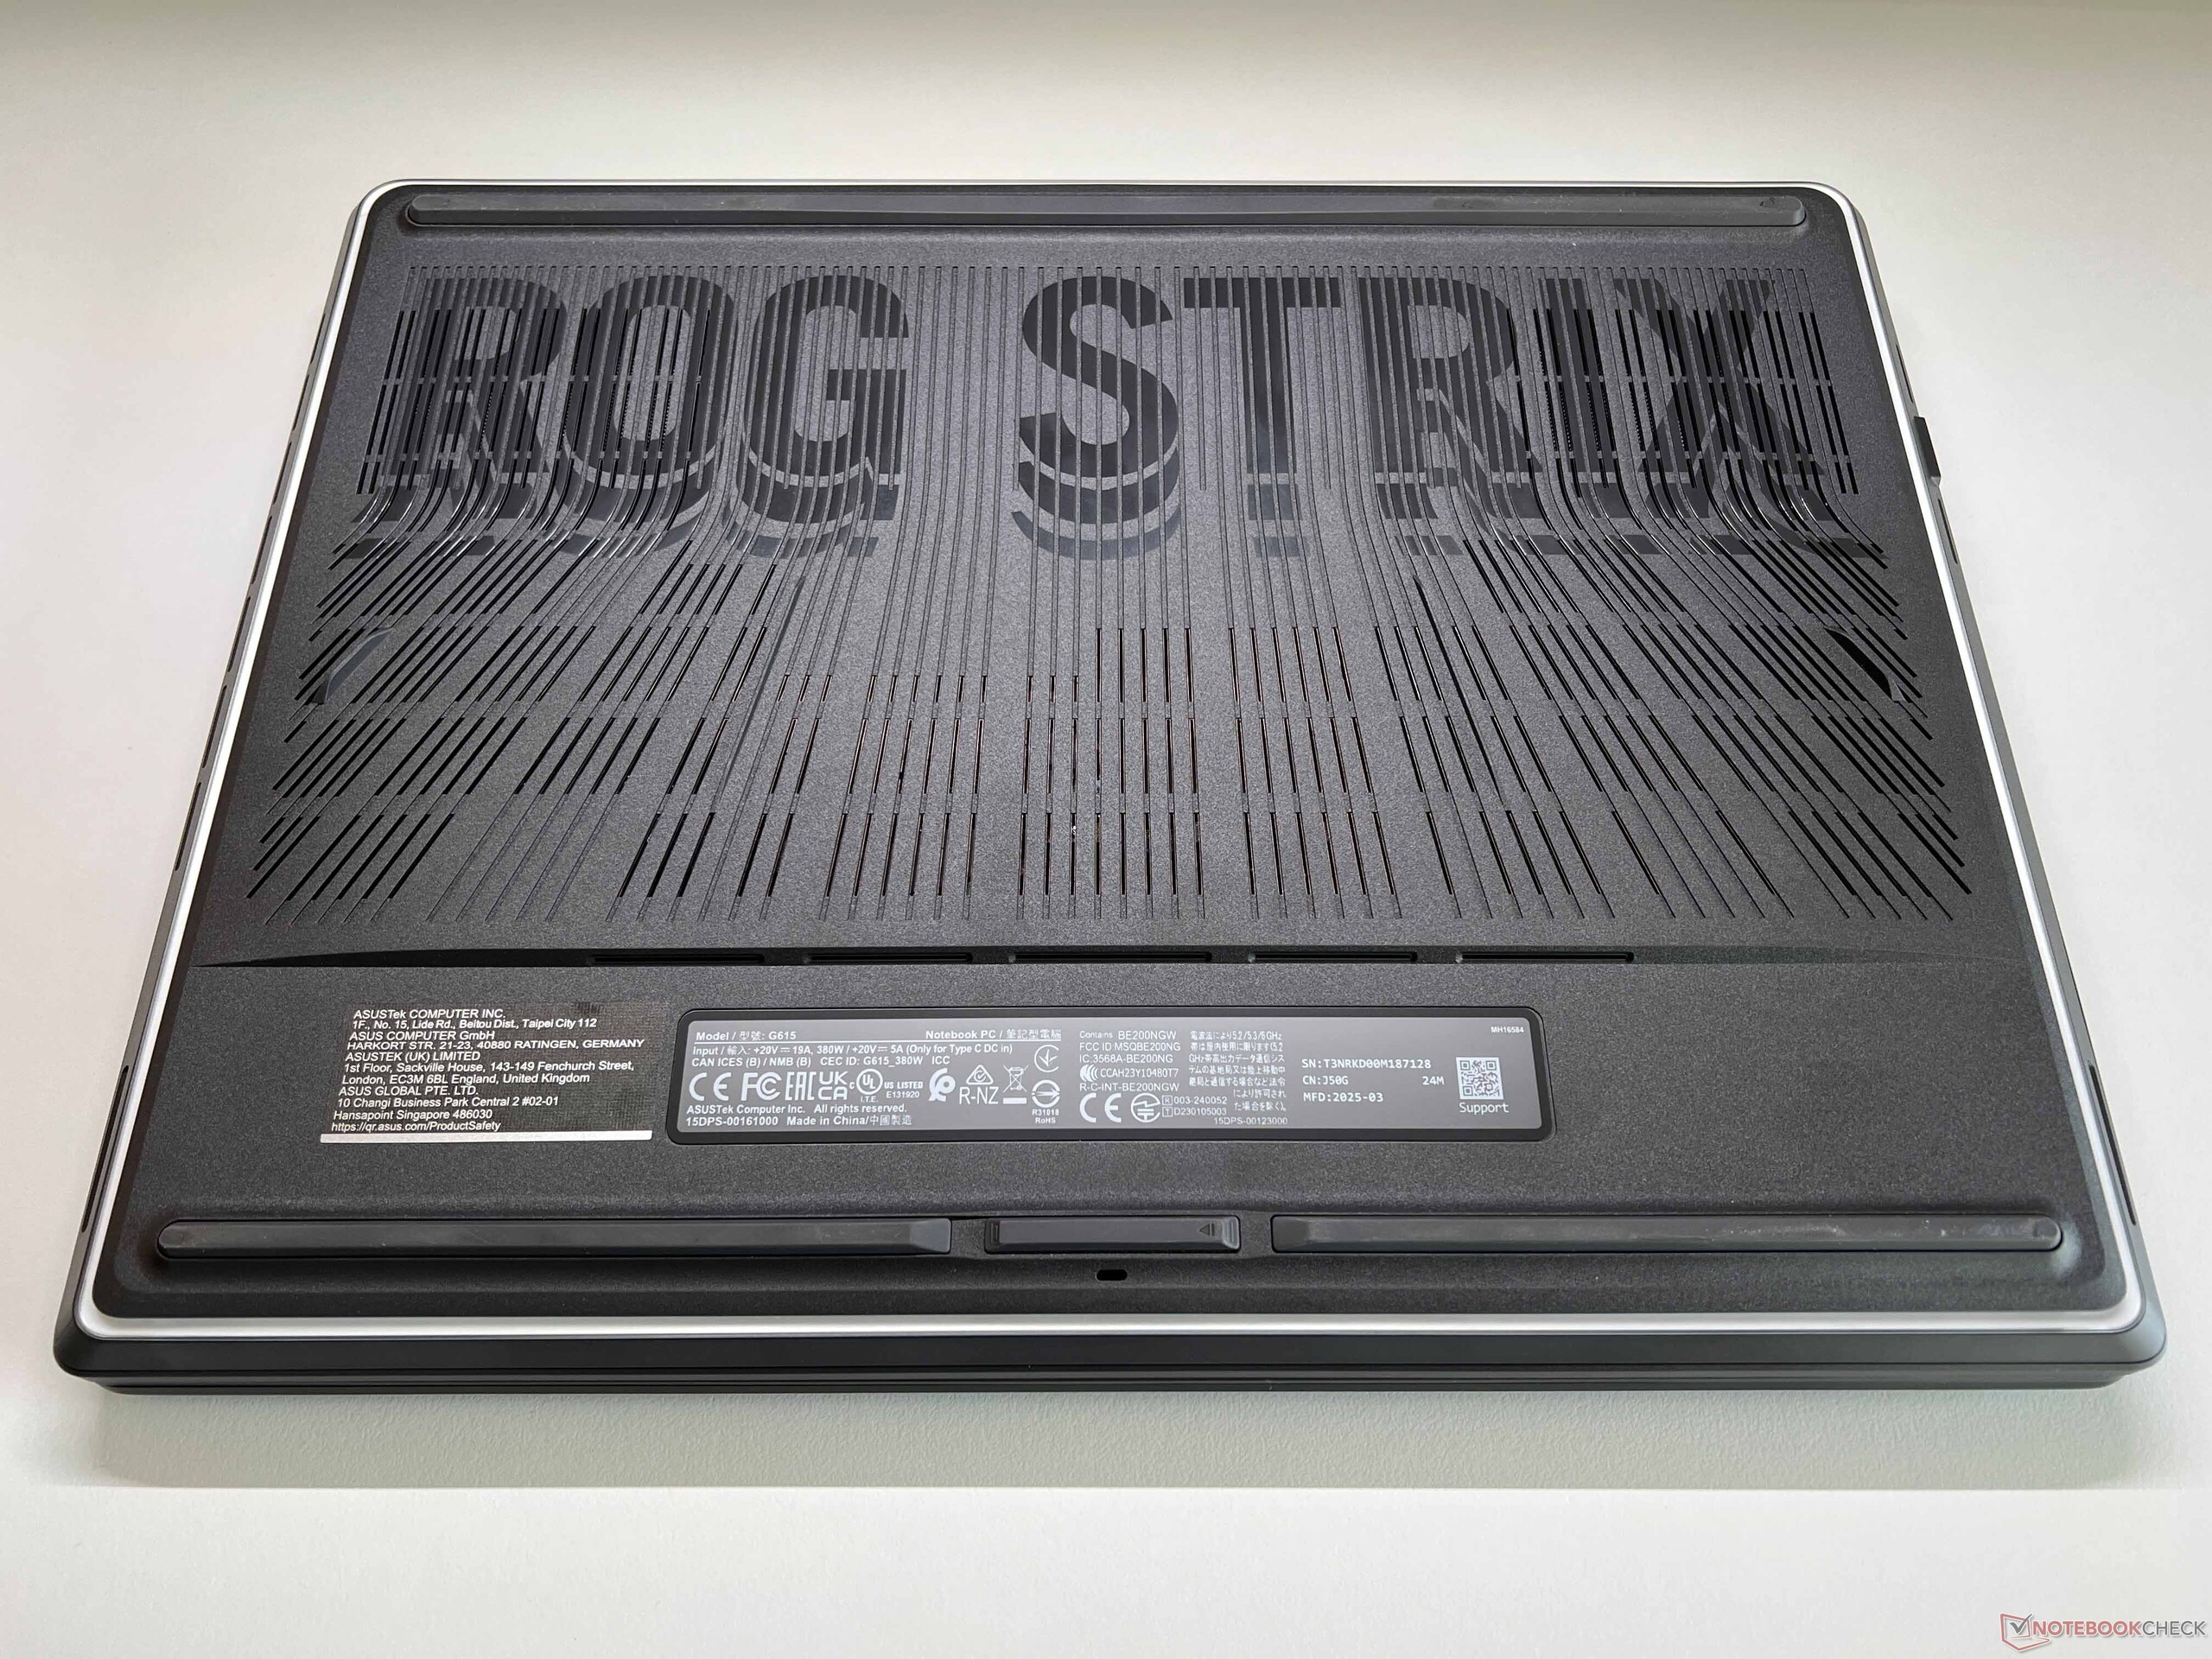
箱体 - 深灰色,照明度高
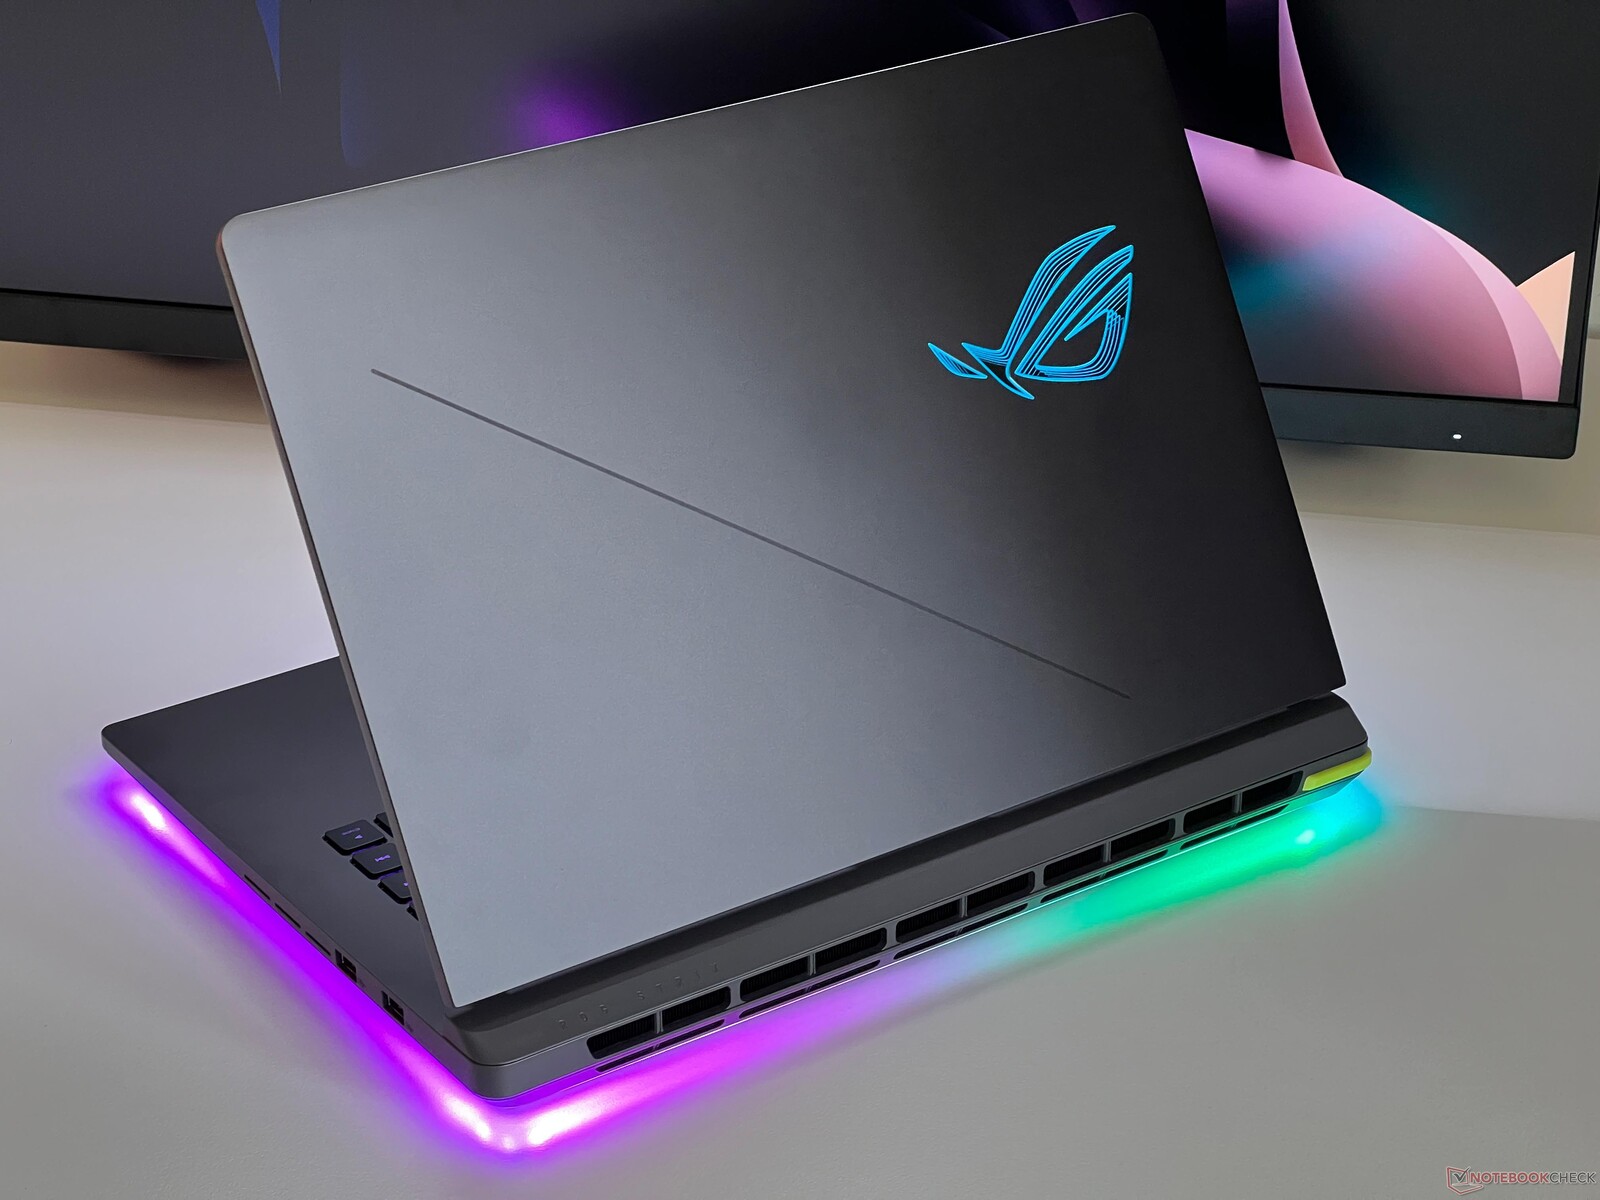
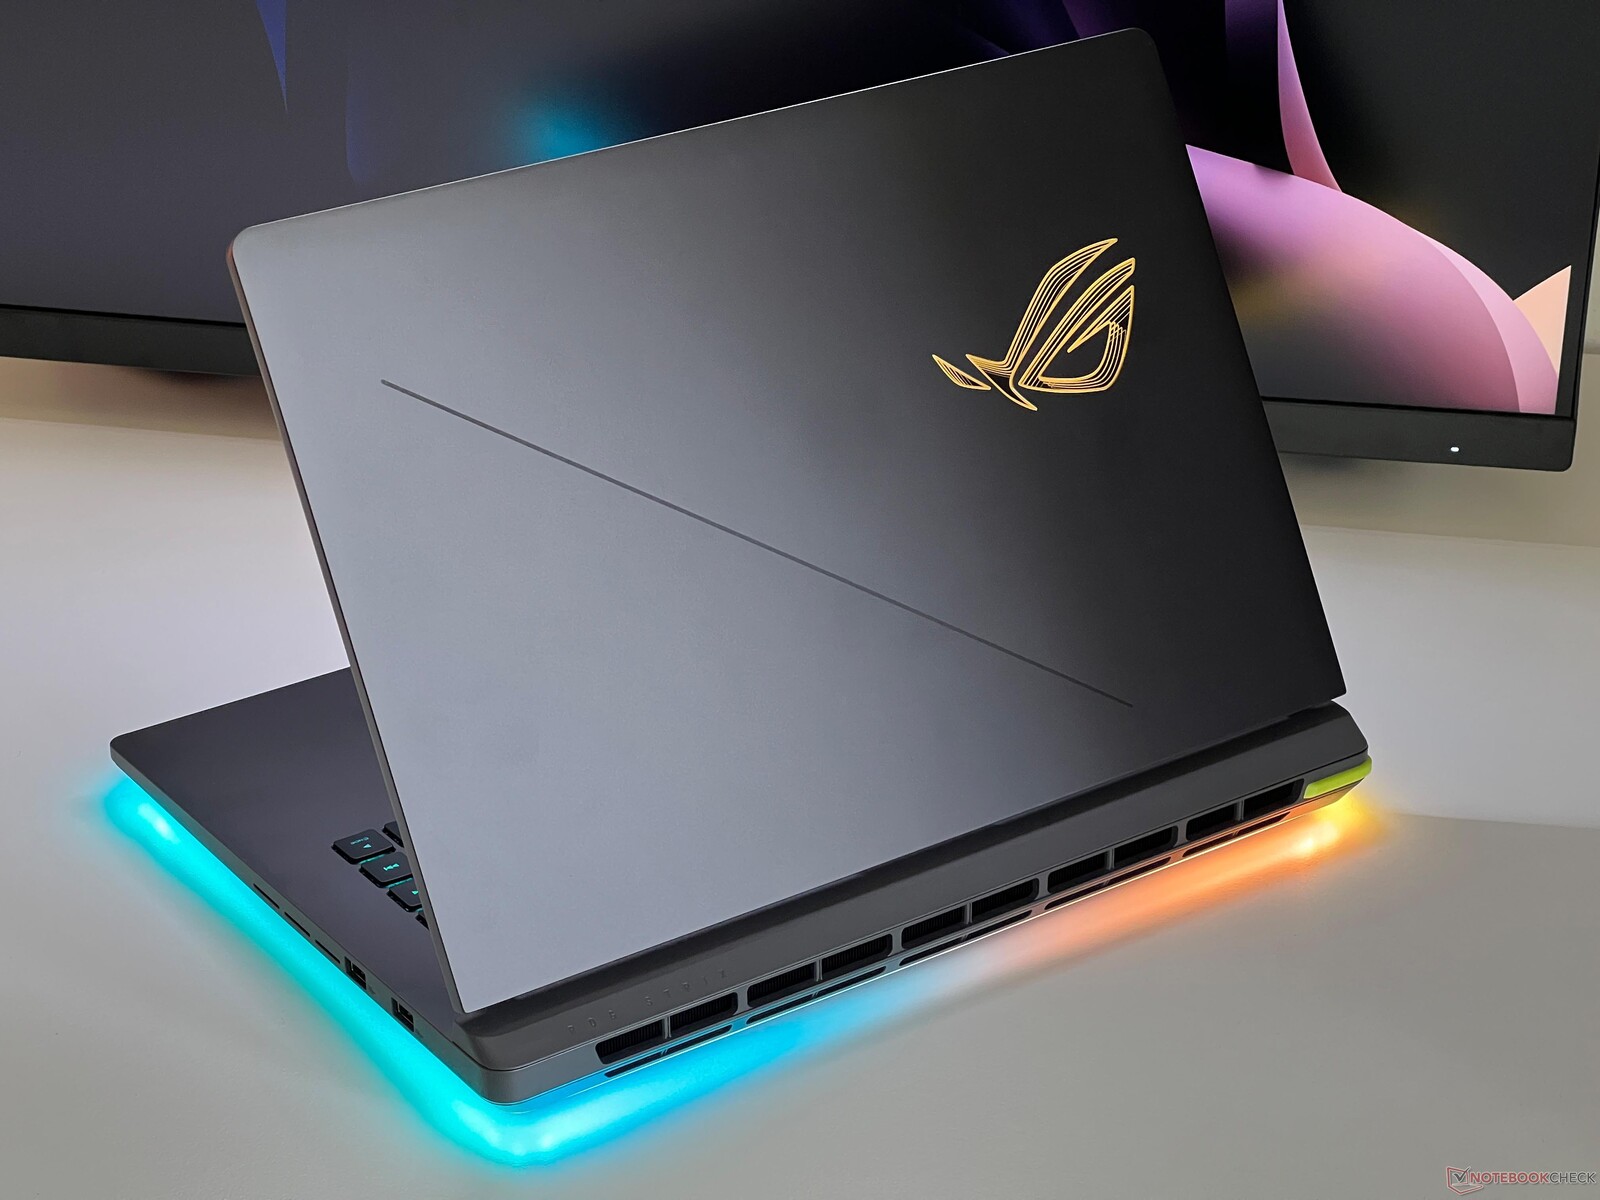
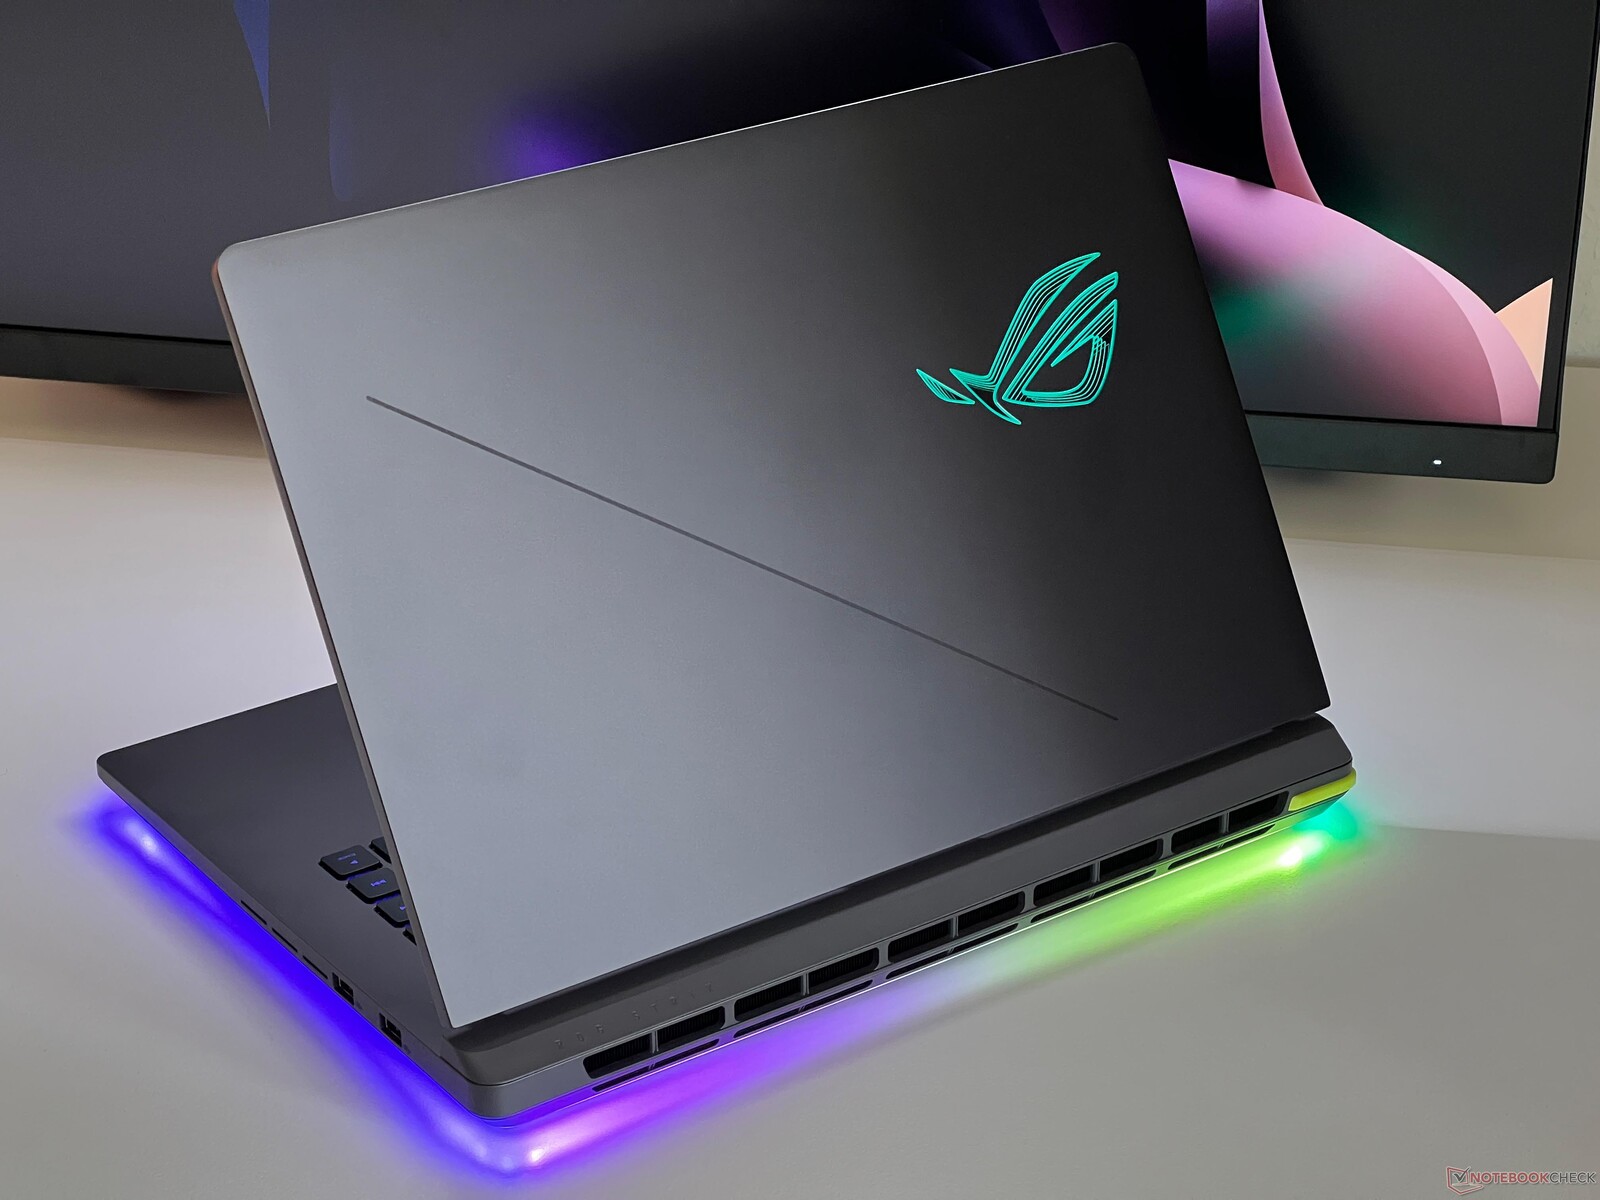
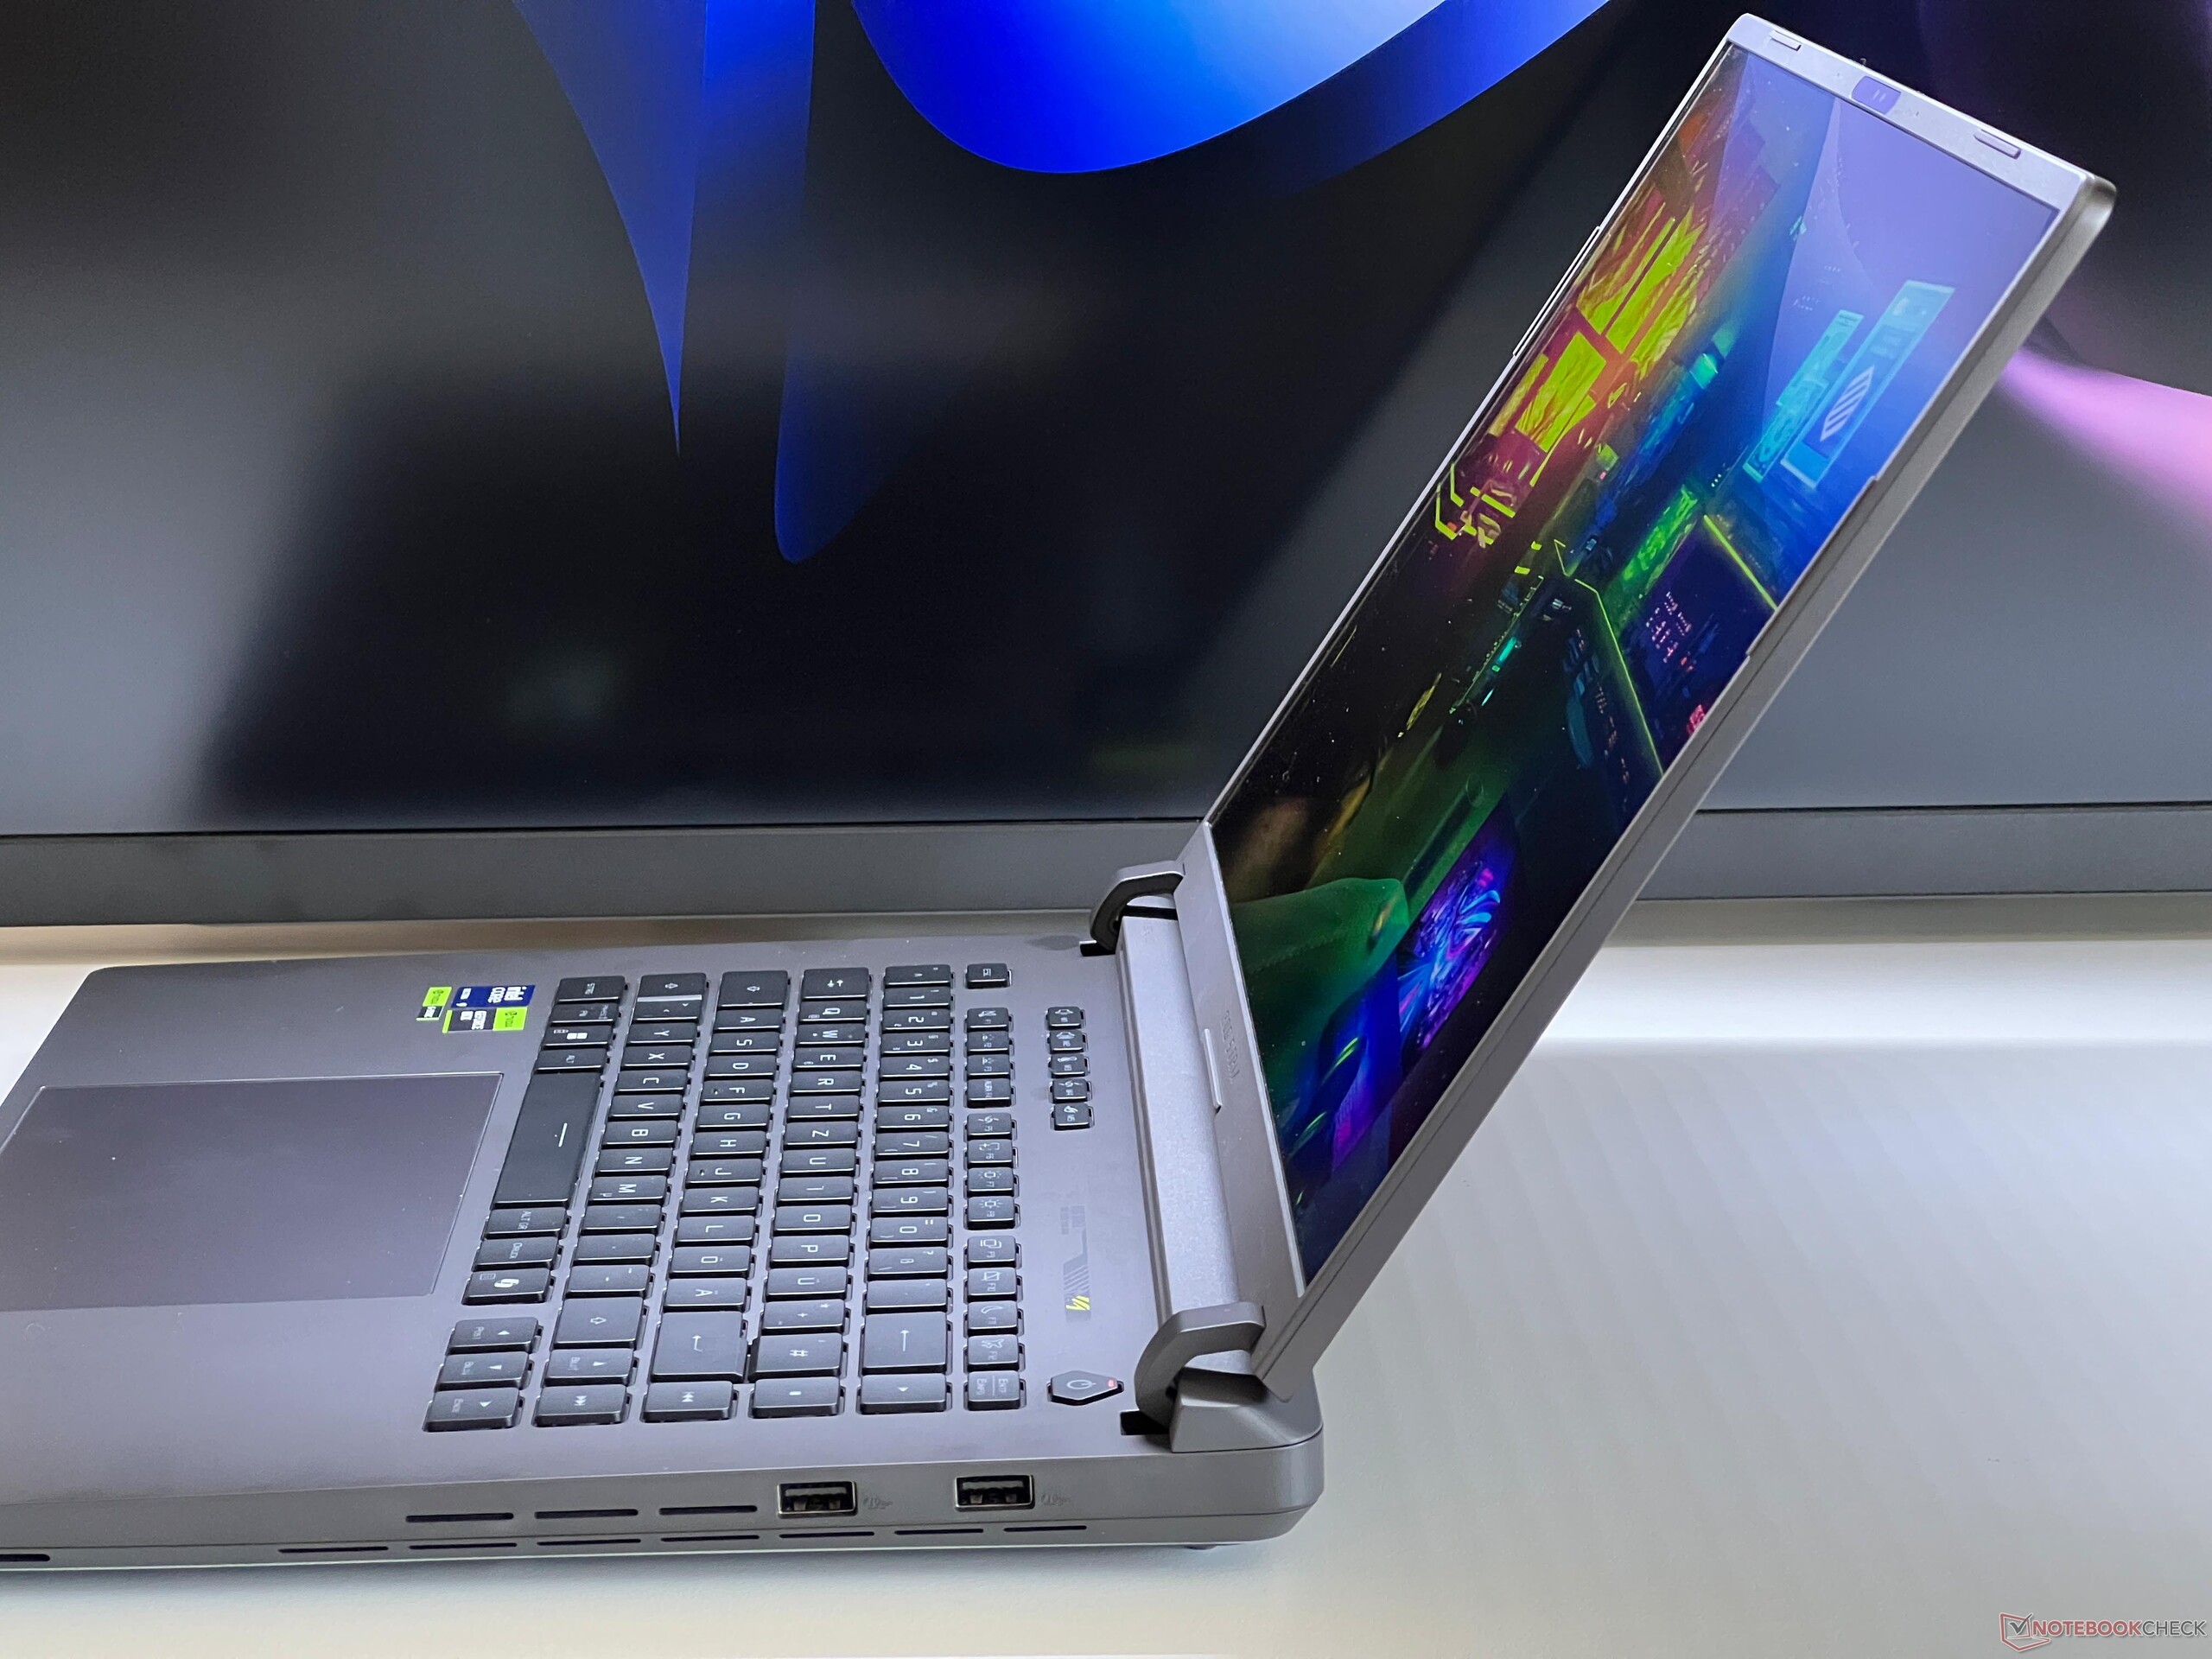
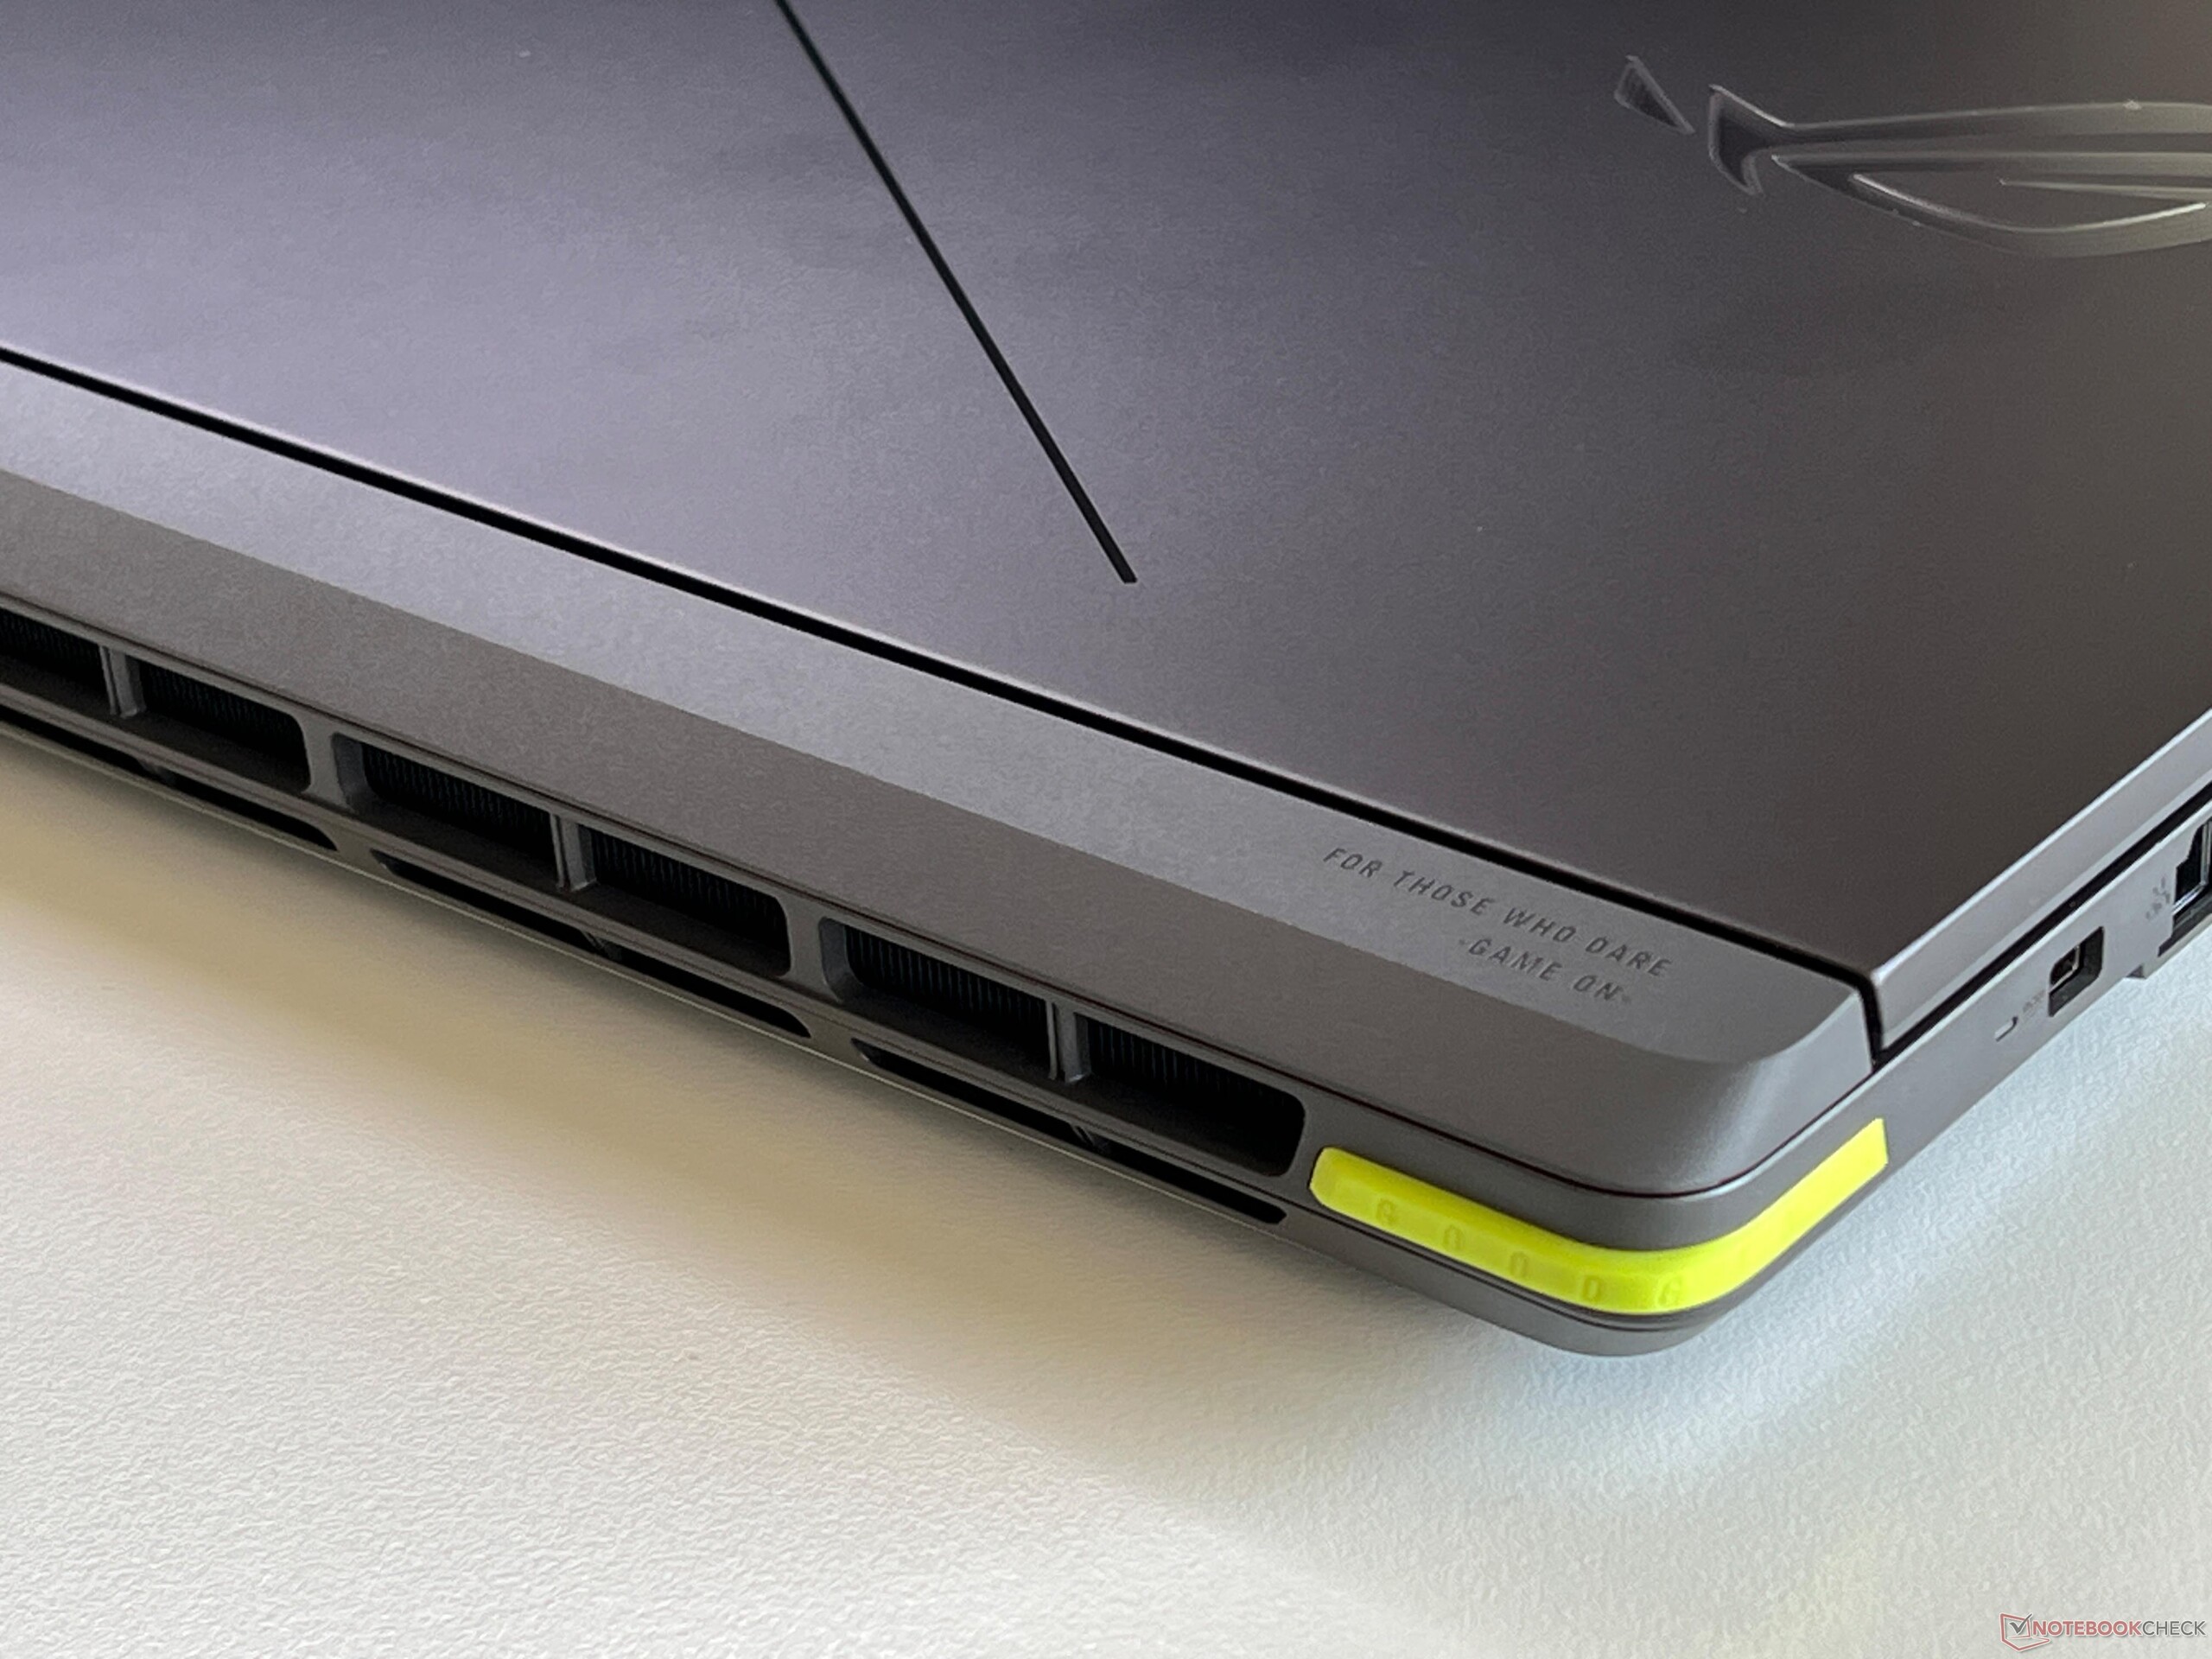
如前所述,Strix G16 与 Strix SCAR 系列有许多共同之处,包括塑料外壳、环绕底座的发光 LED 条和发光徽标。只是在盖子上没有额外的 DotMatrix 显示屏。此外,还有两个霓虹绿的小设计元素(键盘上方的 ROG 徽标和左后角的小条纹)。你可以随心所欲地使用照明,但也可以完全关闭,以获得不那么显眼的外观。深灰色的塑料表面不像 Strix SCAR 18 的黑色表面那样容易留下指纹和污垢。 Strix SCAR 18的黑色表面那样容易留下指纹和污垢。
尽管在这个价位上您应该已经对金属机壳有所期待,但机壳的整体质量还是非常不错的。无论是稳定性还是做工,我们都没有发现任何问题。铰链也做得不错,但最大开启角度只有 130 度左右。
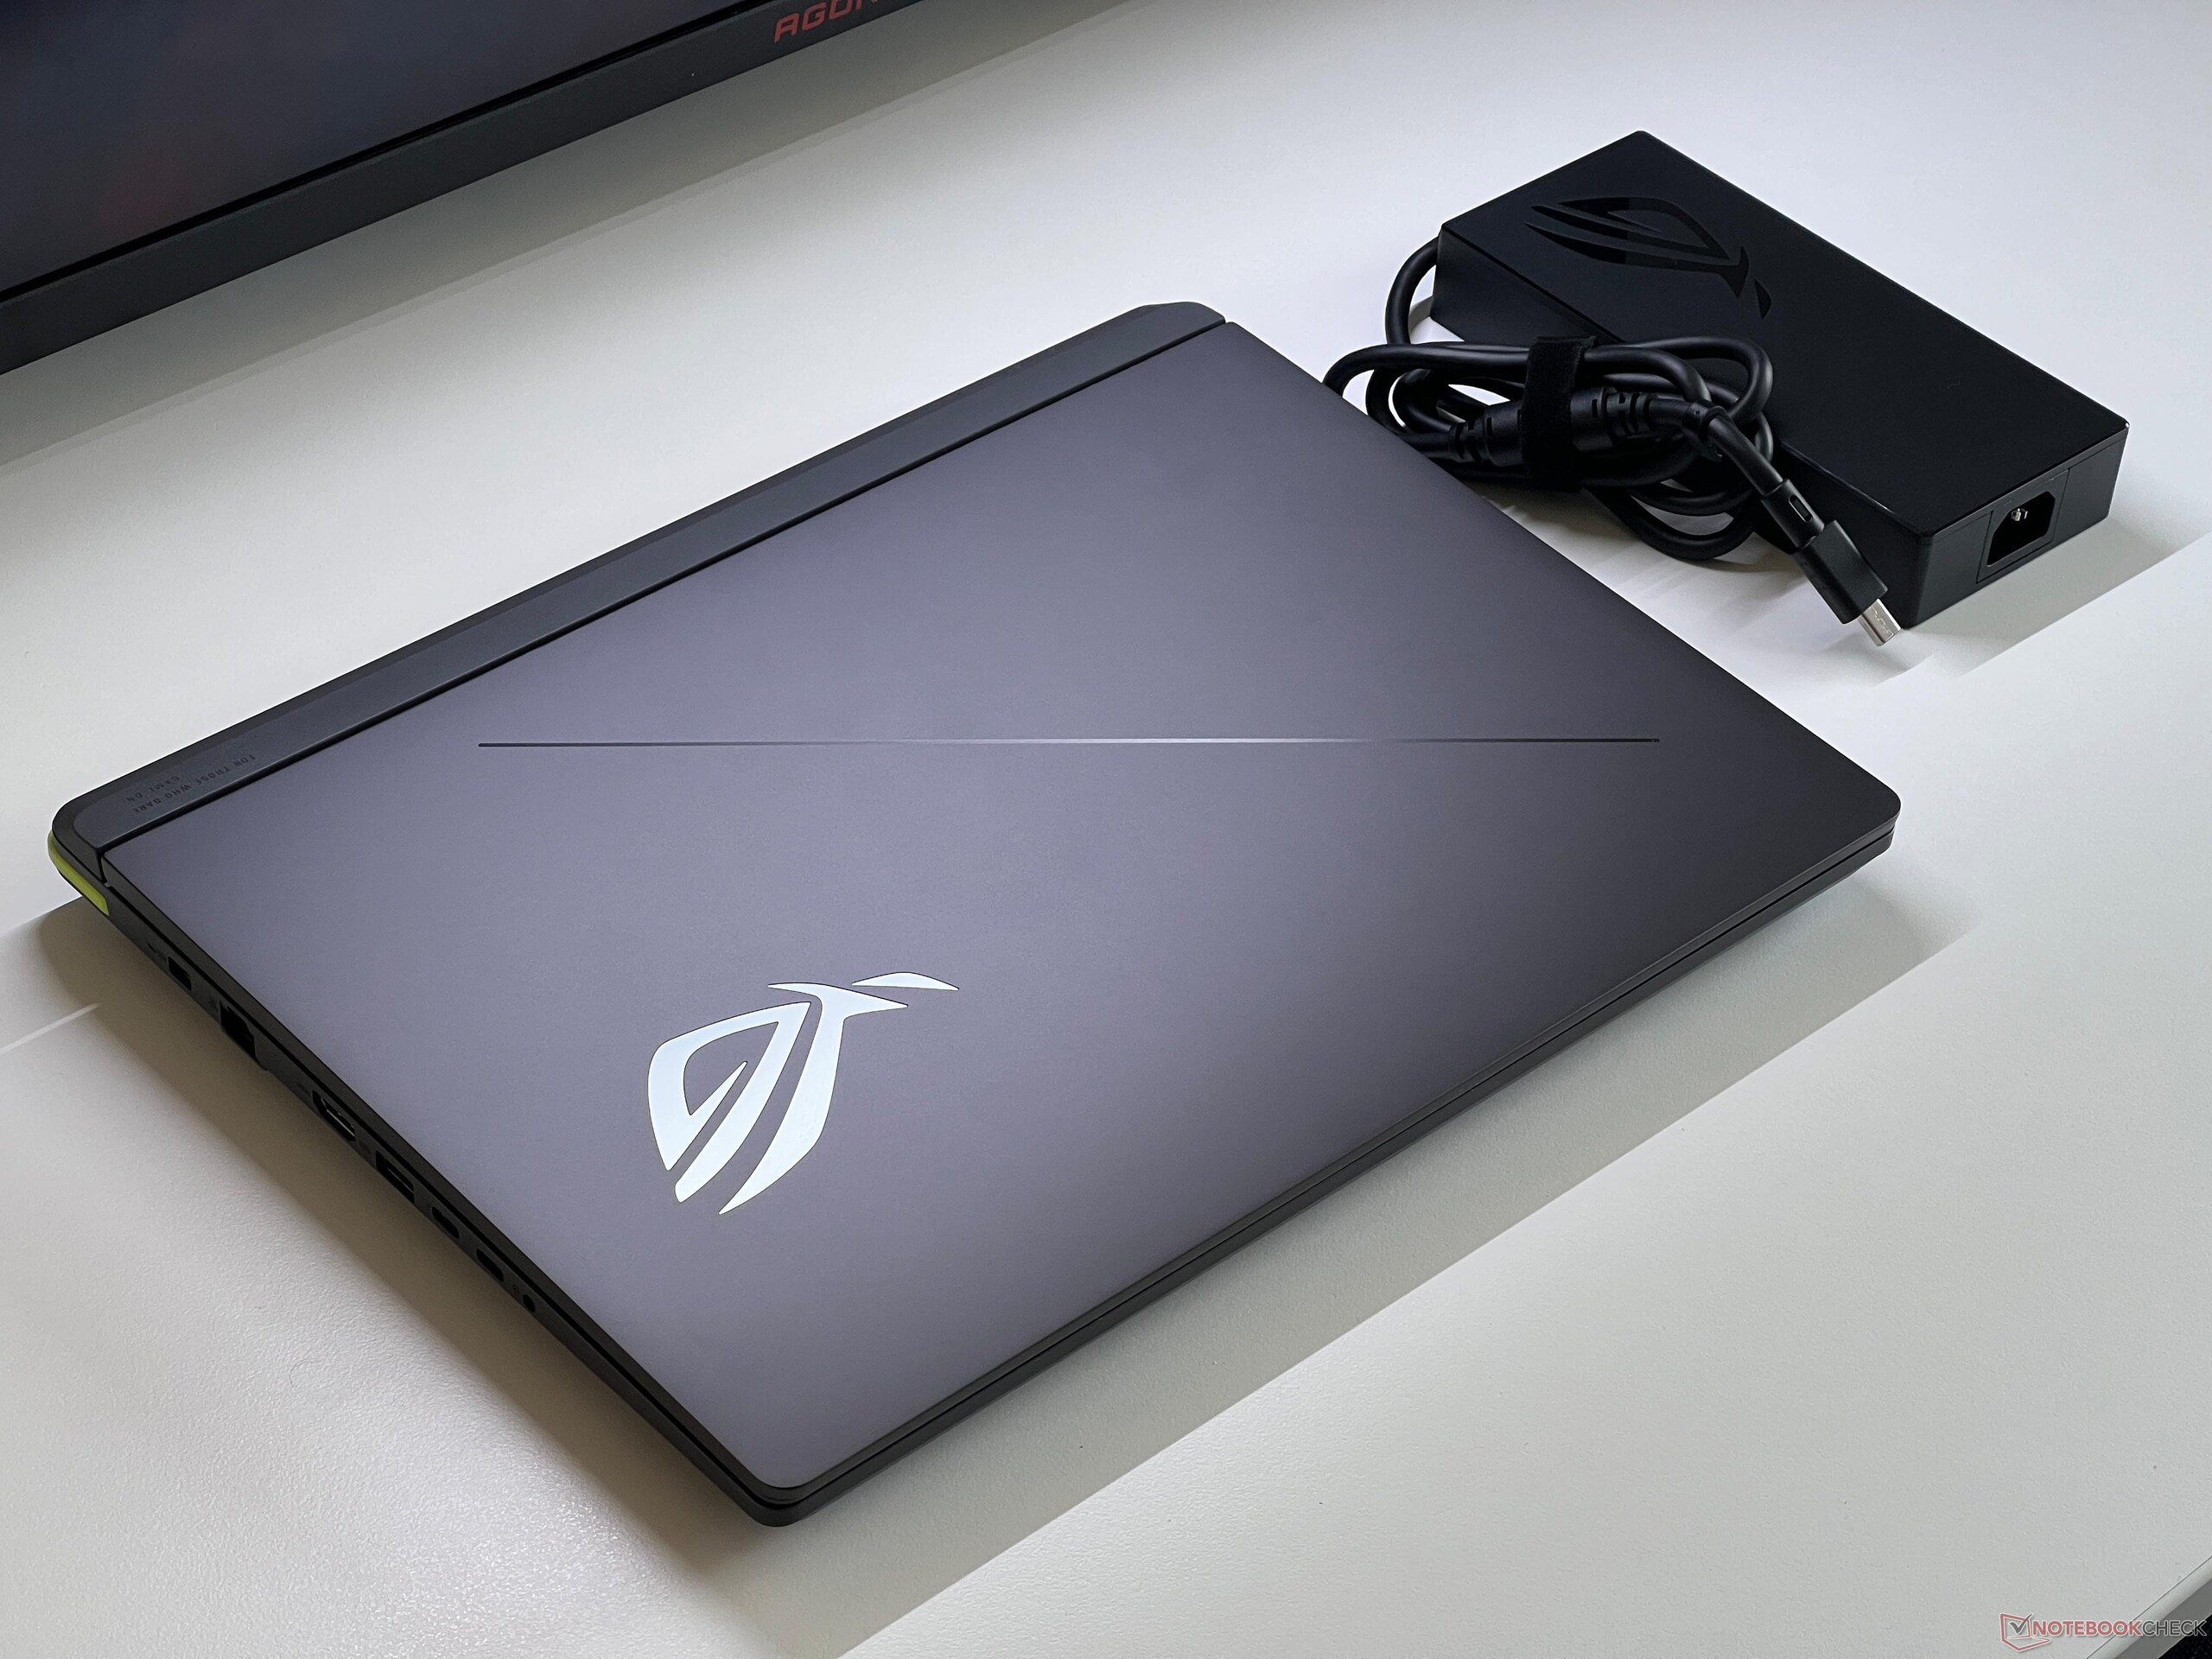

我们对比的设备在占地面积方面的差异并不明显,因为所有笔记本电脑都相对较大。在这方面,ROG Zephyrus G16 等设备当然更具优势。我们测试设备的重量为 2.6 千克(约 5.7 磅),在同类产品中也处于中等水平。380 瓦充电器又增加了 1 千克(约 2.2 磅)的重量。
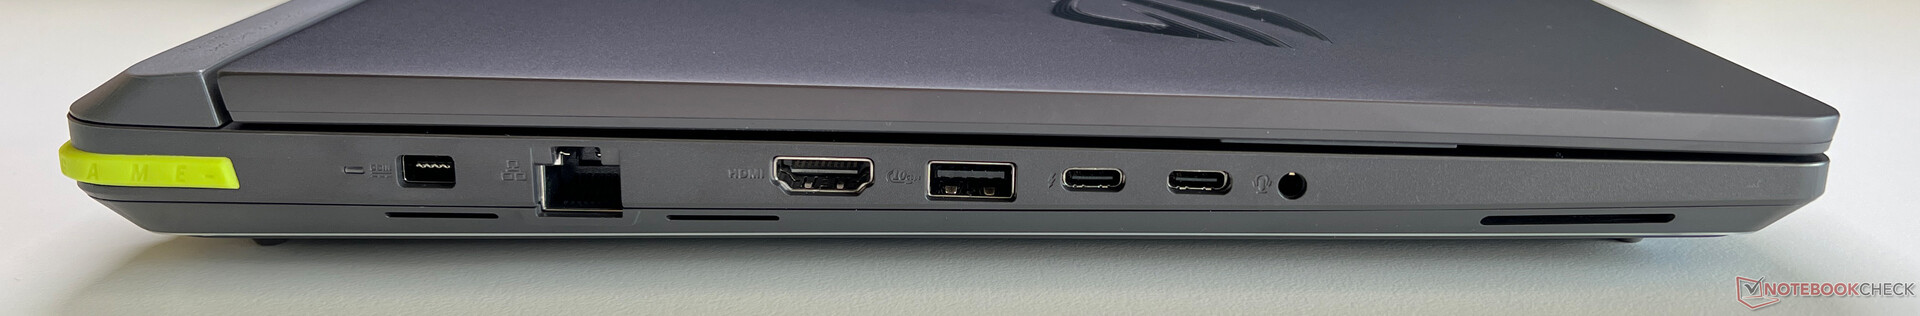
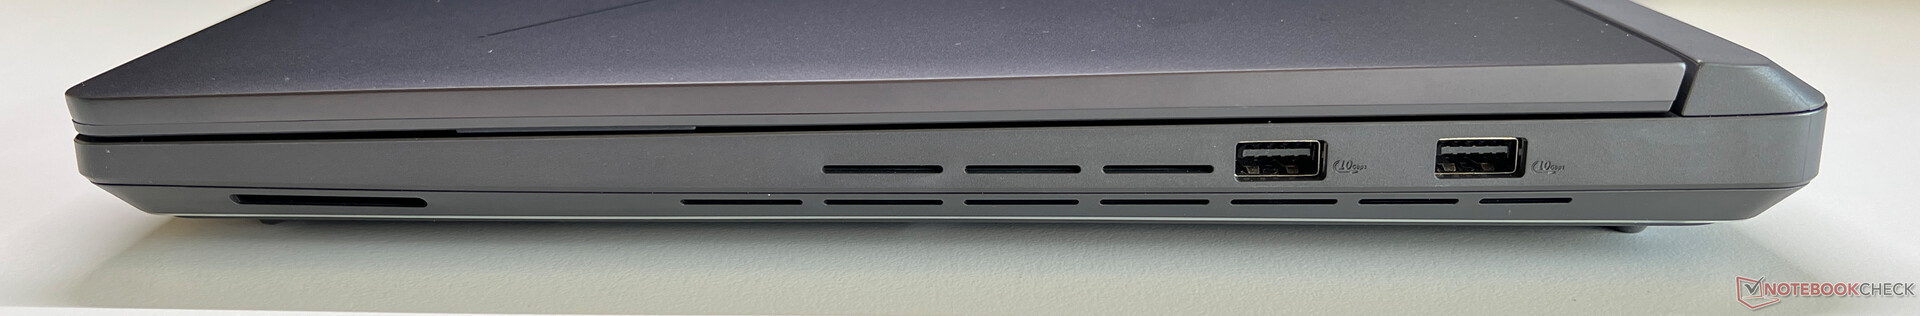
设备 - 配备雷电 5 的 Strix G16
由于整个机箱背面都用于散热,所有连接都分布在两侧。特别是在网络连接、电源或图像输出方面,这并不总是一个理想的解决方案。Strix G16 已经支持 Thunderbolt 5,而且整体连接充足。尽管这不是一款 Copilot+ 笔记本电脑,但仍支持网络摄像头的演播室特效或实时字幕等功能。
交流
除了以太网连接(2.5 Gbit/s)外,还提供了包括蓝牙 5.4 支持在内的现代 Wi-Fi 7 模块。在我们使用华硕参考路由器进行的标准化测试中,连接速度非常好且稳定。
| Networking | |
| Asus ROG Strix G16 G615 | |
| iperf3 transmit AXE11000 | |
| iperf3 receive AXE11000 | |
| Acer Predator Helios 16 PH16-72 | |
| iperf3 transmit AXE11000 | |
| iperf3 receive AXE11000 | |
| iperf3 transmit AXE11000 6GHz | |
| iperf3 receive AXE11000 6GHz | |
| SCHENKER XMG Neo 16 (Early 24) | |
| iperf3 transmit AXE11000 | |
| iperf3 receive AXE11000 | |
| Asus ROG Strix Scar 16 G634JZR | |
| iperf3 transmit AXE11000 | |
| iperf3 receive AXE11000 | |
| iperf3 transmit AXE11000 6GHz | |
| iperf3 receive AXE11000 6GHz | |
| HP Omen 16 (2024) | |
| iperf3 transmit AXE11000 | |
| iperf3 receive AXE11000 | |
| Lenovo Legion Pro 7 16IRX9H | |
| iperf3 transmit AXE11000 | |
| iperf3 receive AXE11000 | |
| Lenovo Legion Pro 7i 16 Gen 10 | |
| iperf3 transmit AXE11000 | |
| iperf3 receive AXE11000 | |
| iperf3 transmit AXE11000 6GHz | |
| iperf3 receive AXE11000 6GHz | |
网络摄像头
1080p 网络摄像头(无手动快门)可以完成工作,但拍摄的照片并无特别之处。内置红外模块支持通过 Windows Hello 进行人脸识别。


维护

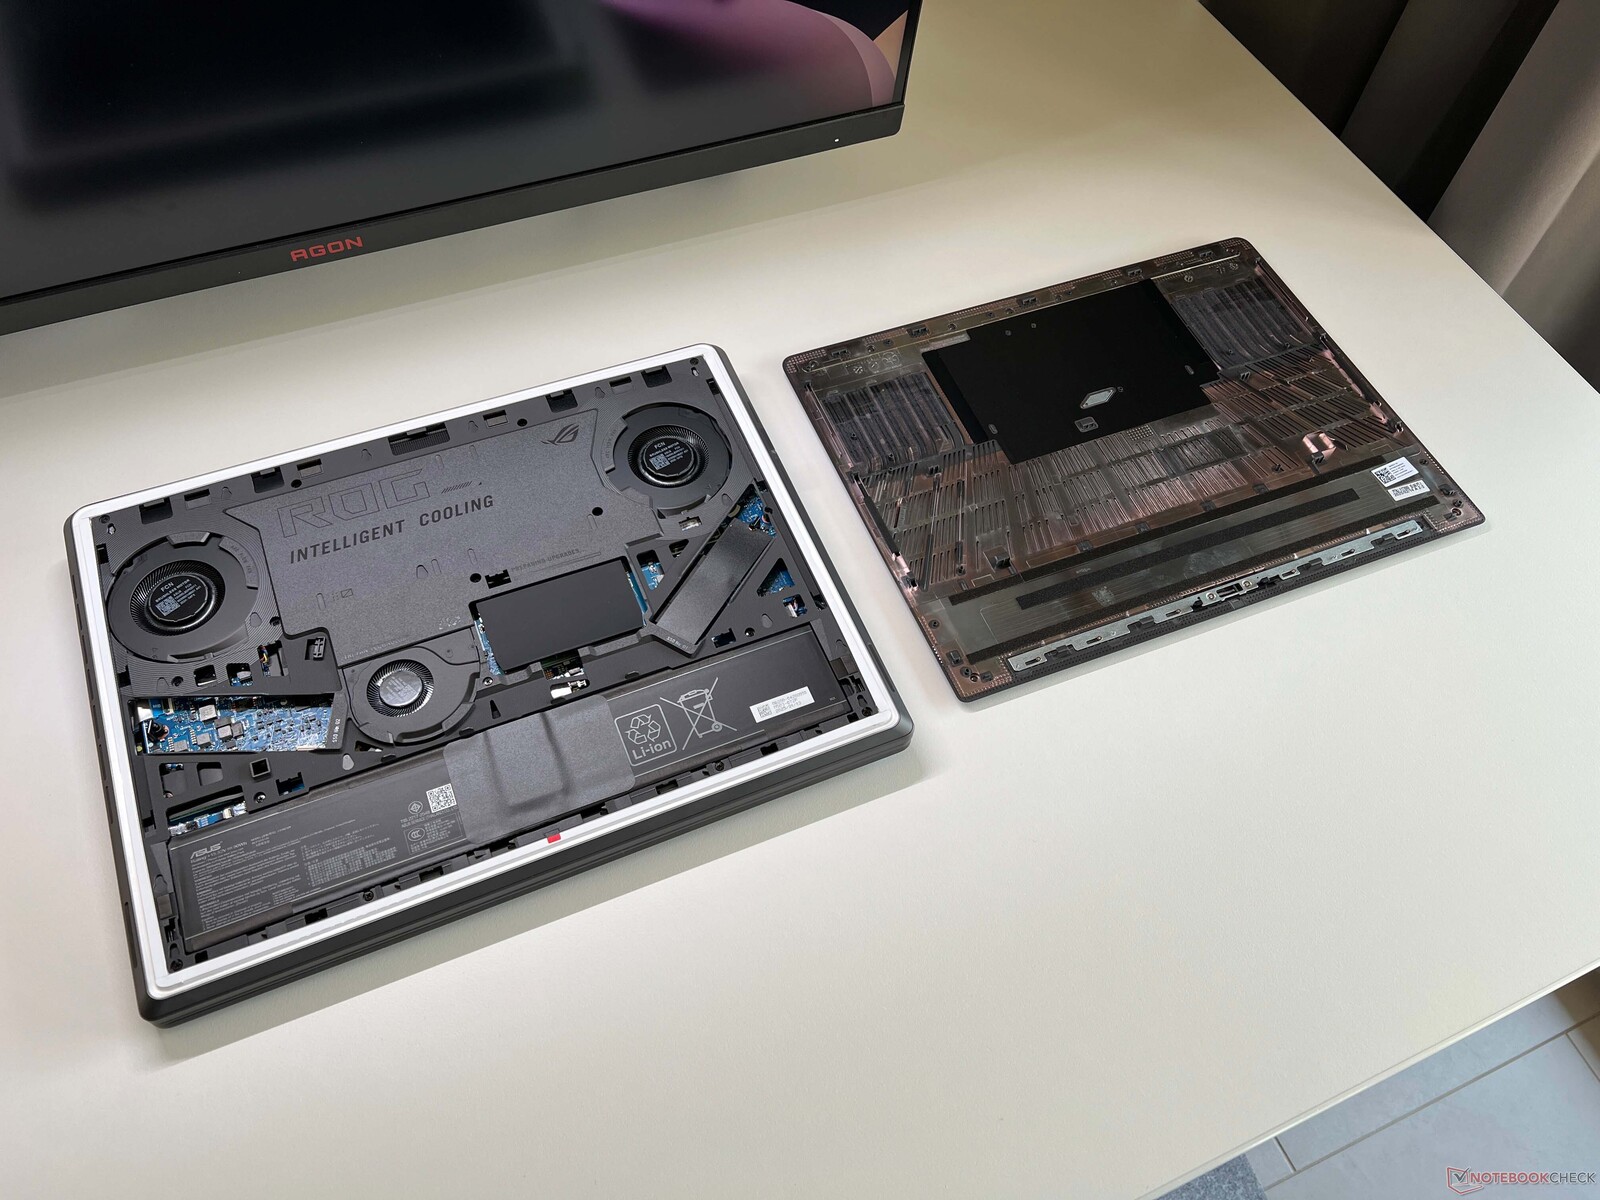
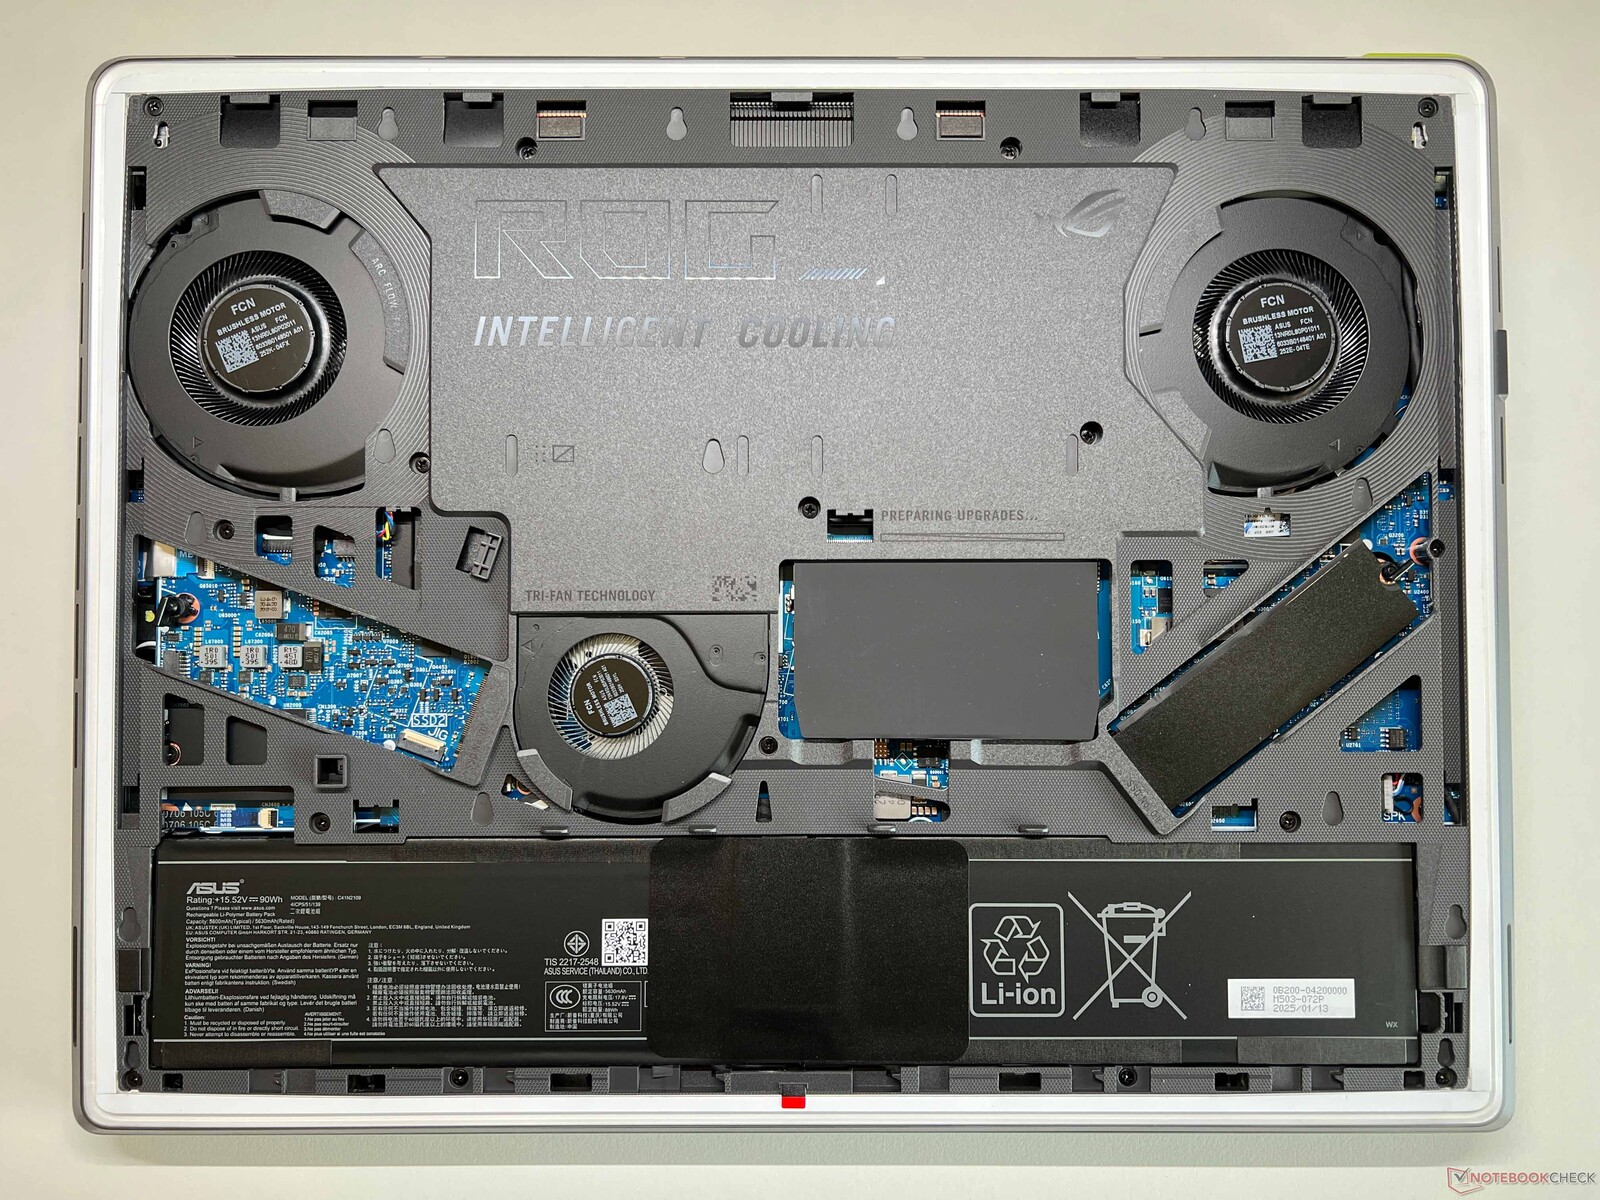
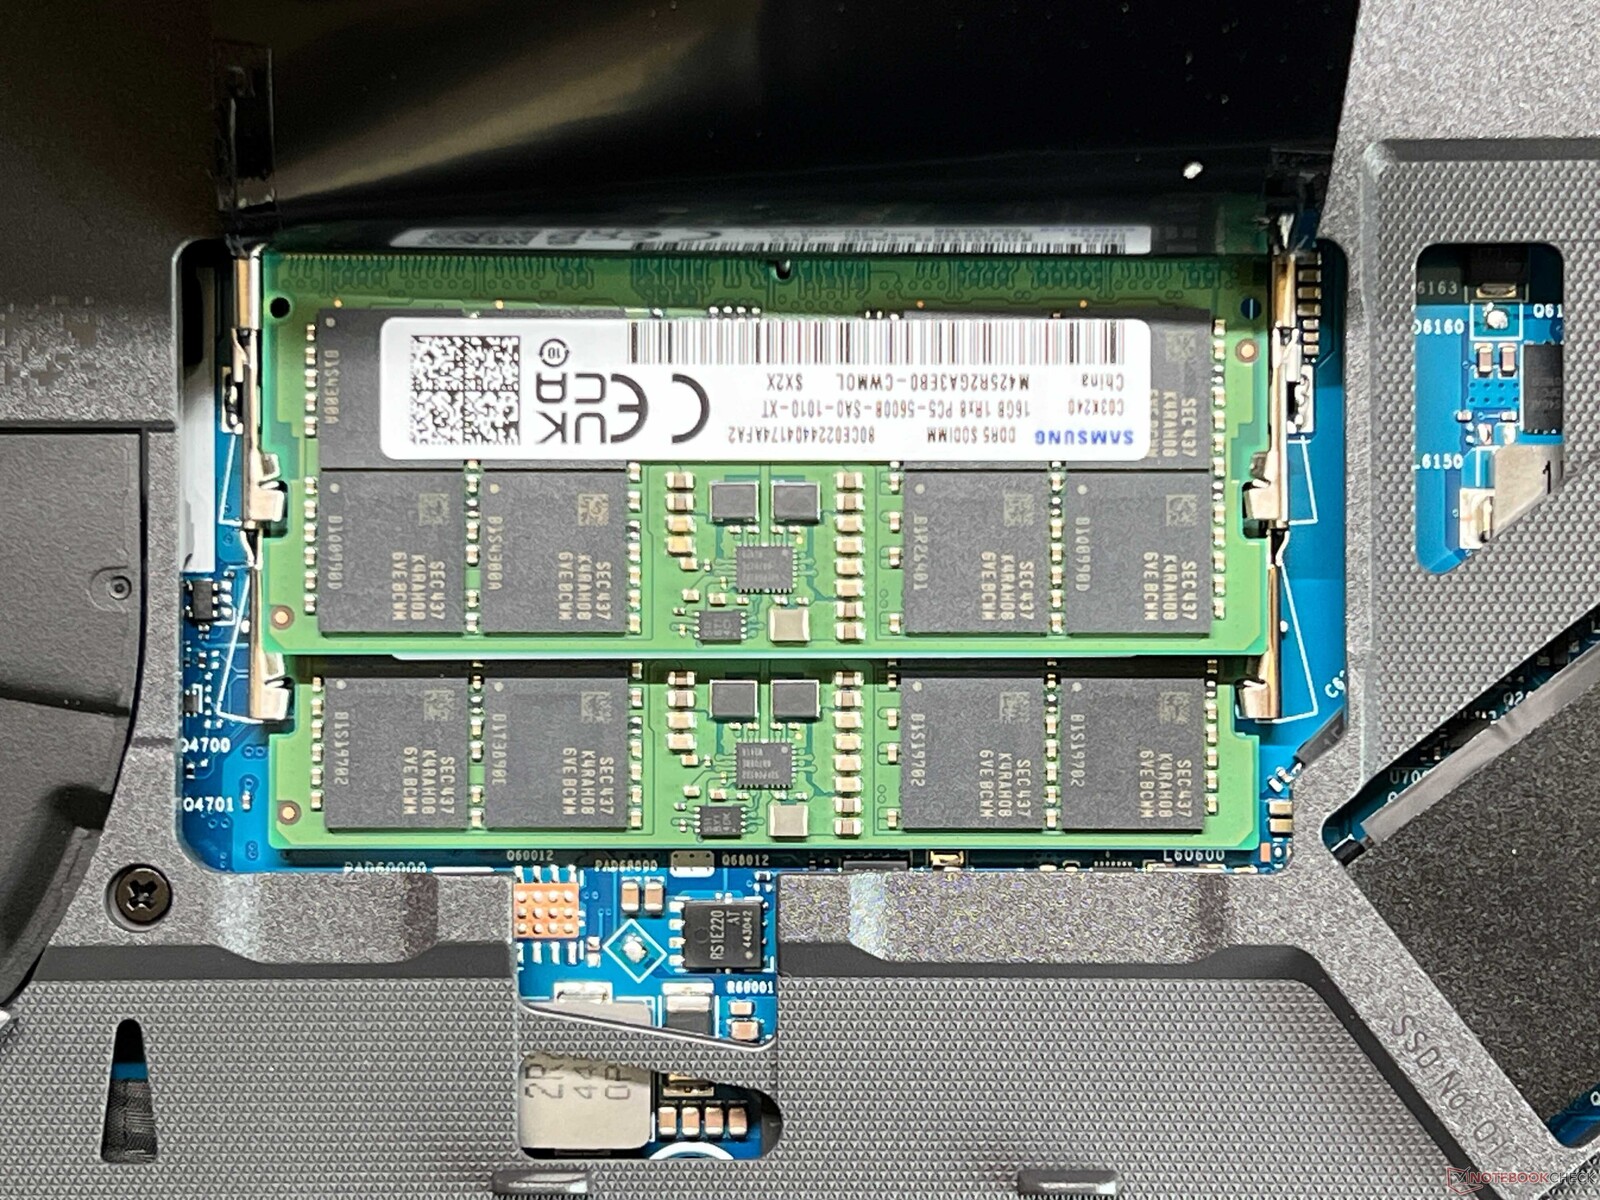
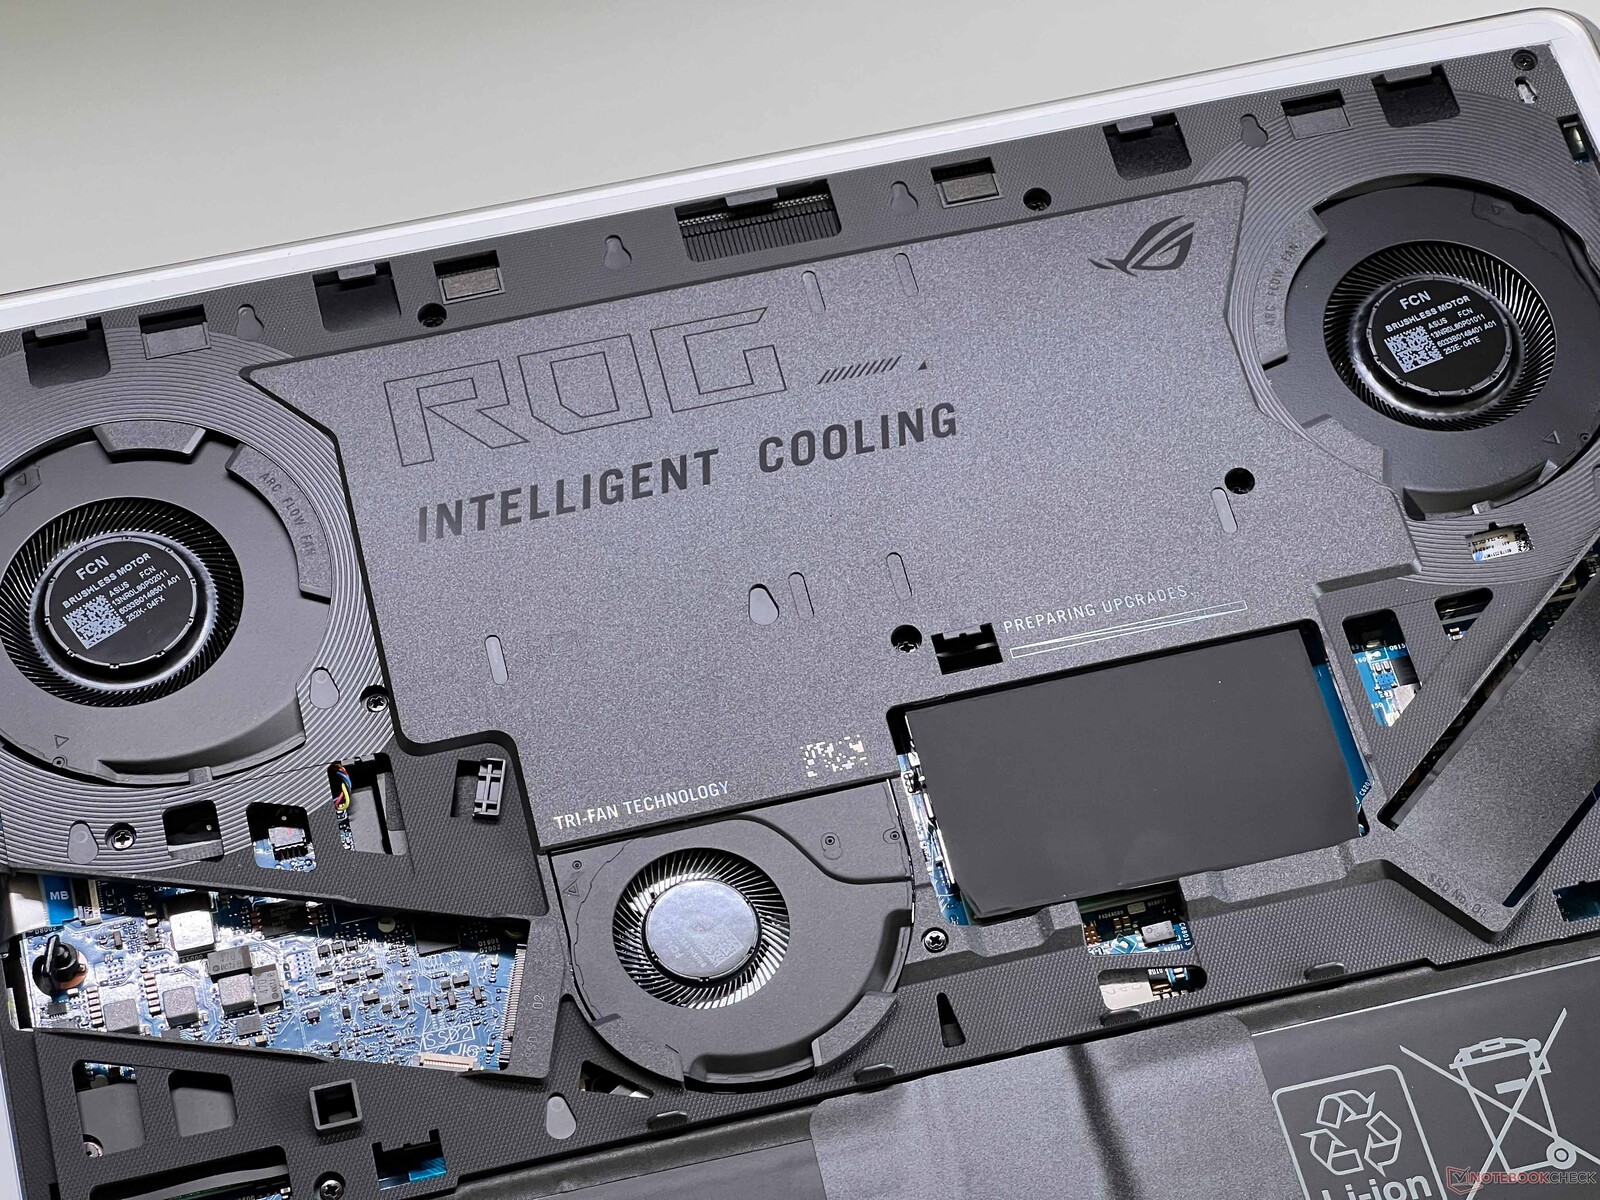
访问 Strix G16 的组件非常简单,因为你可以用一个小滑块轻松打开底板的锁,将底板推向前方即可将其取下。笔记本电脑内部主要是散热系统,包括蒸汽室和三个风扇。用户还可以快速访问两个固态硬盘插槽和两个内存模块插槽。
可持续性
华硕没有提供任何有关使用回收材料或二氧化碳排放量的信息。包装主要由纸板和纸张组成。
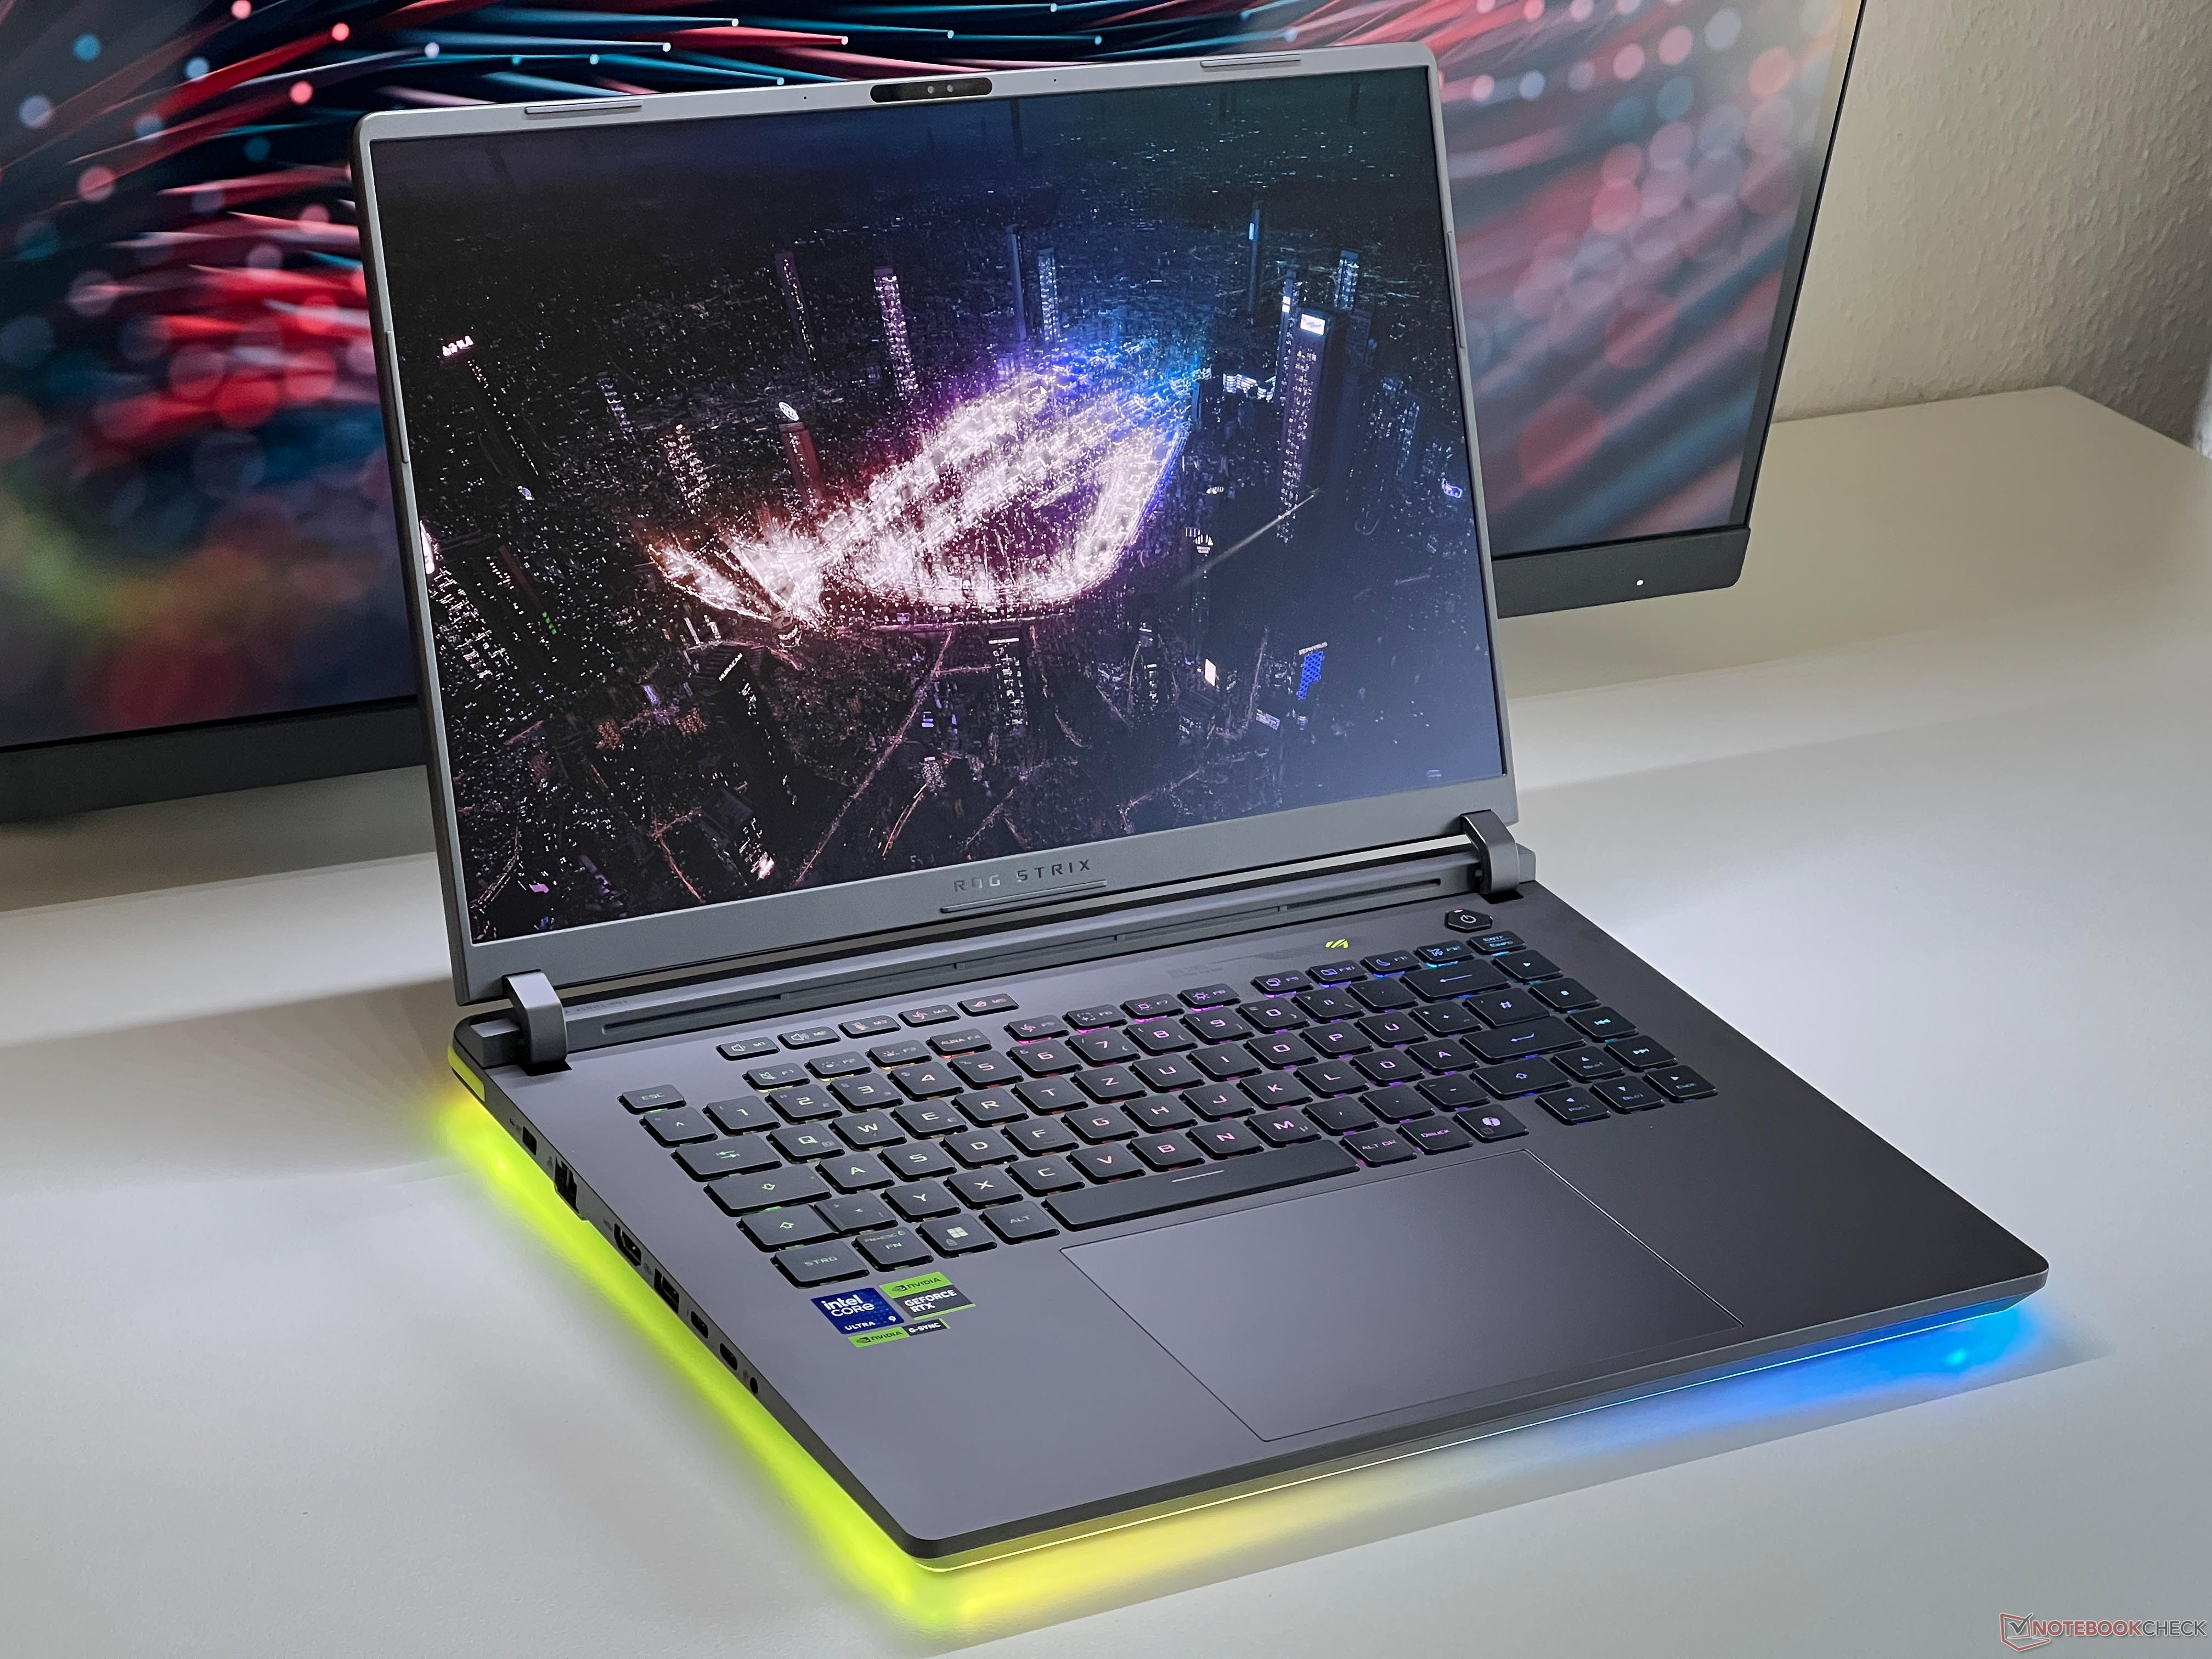
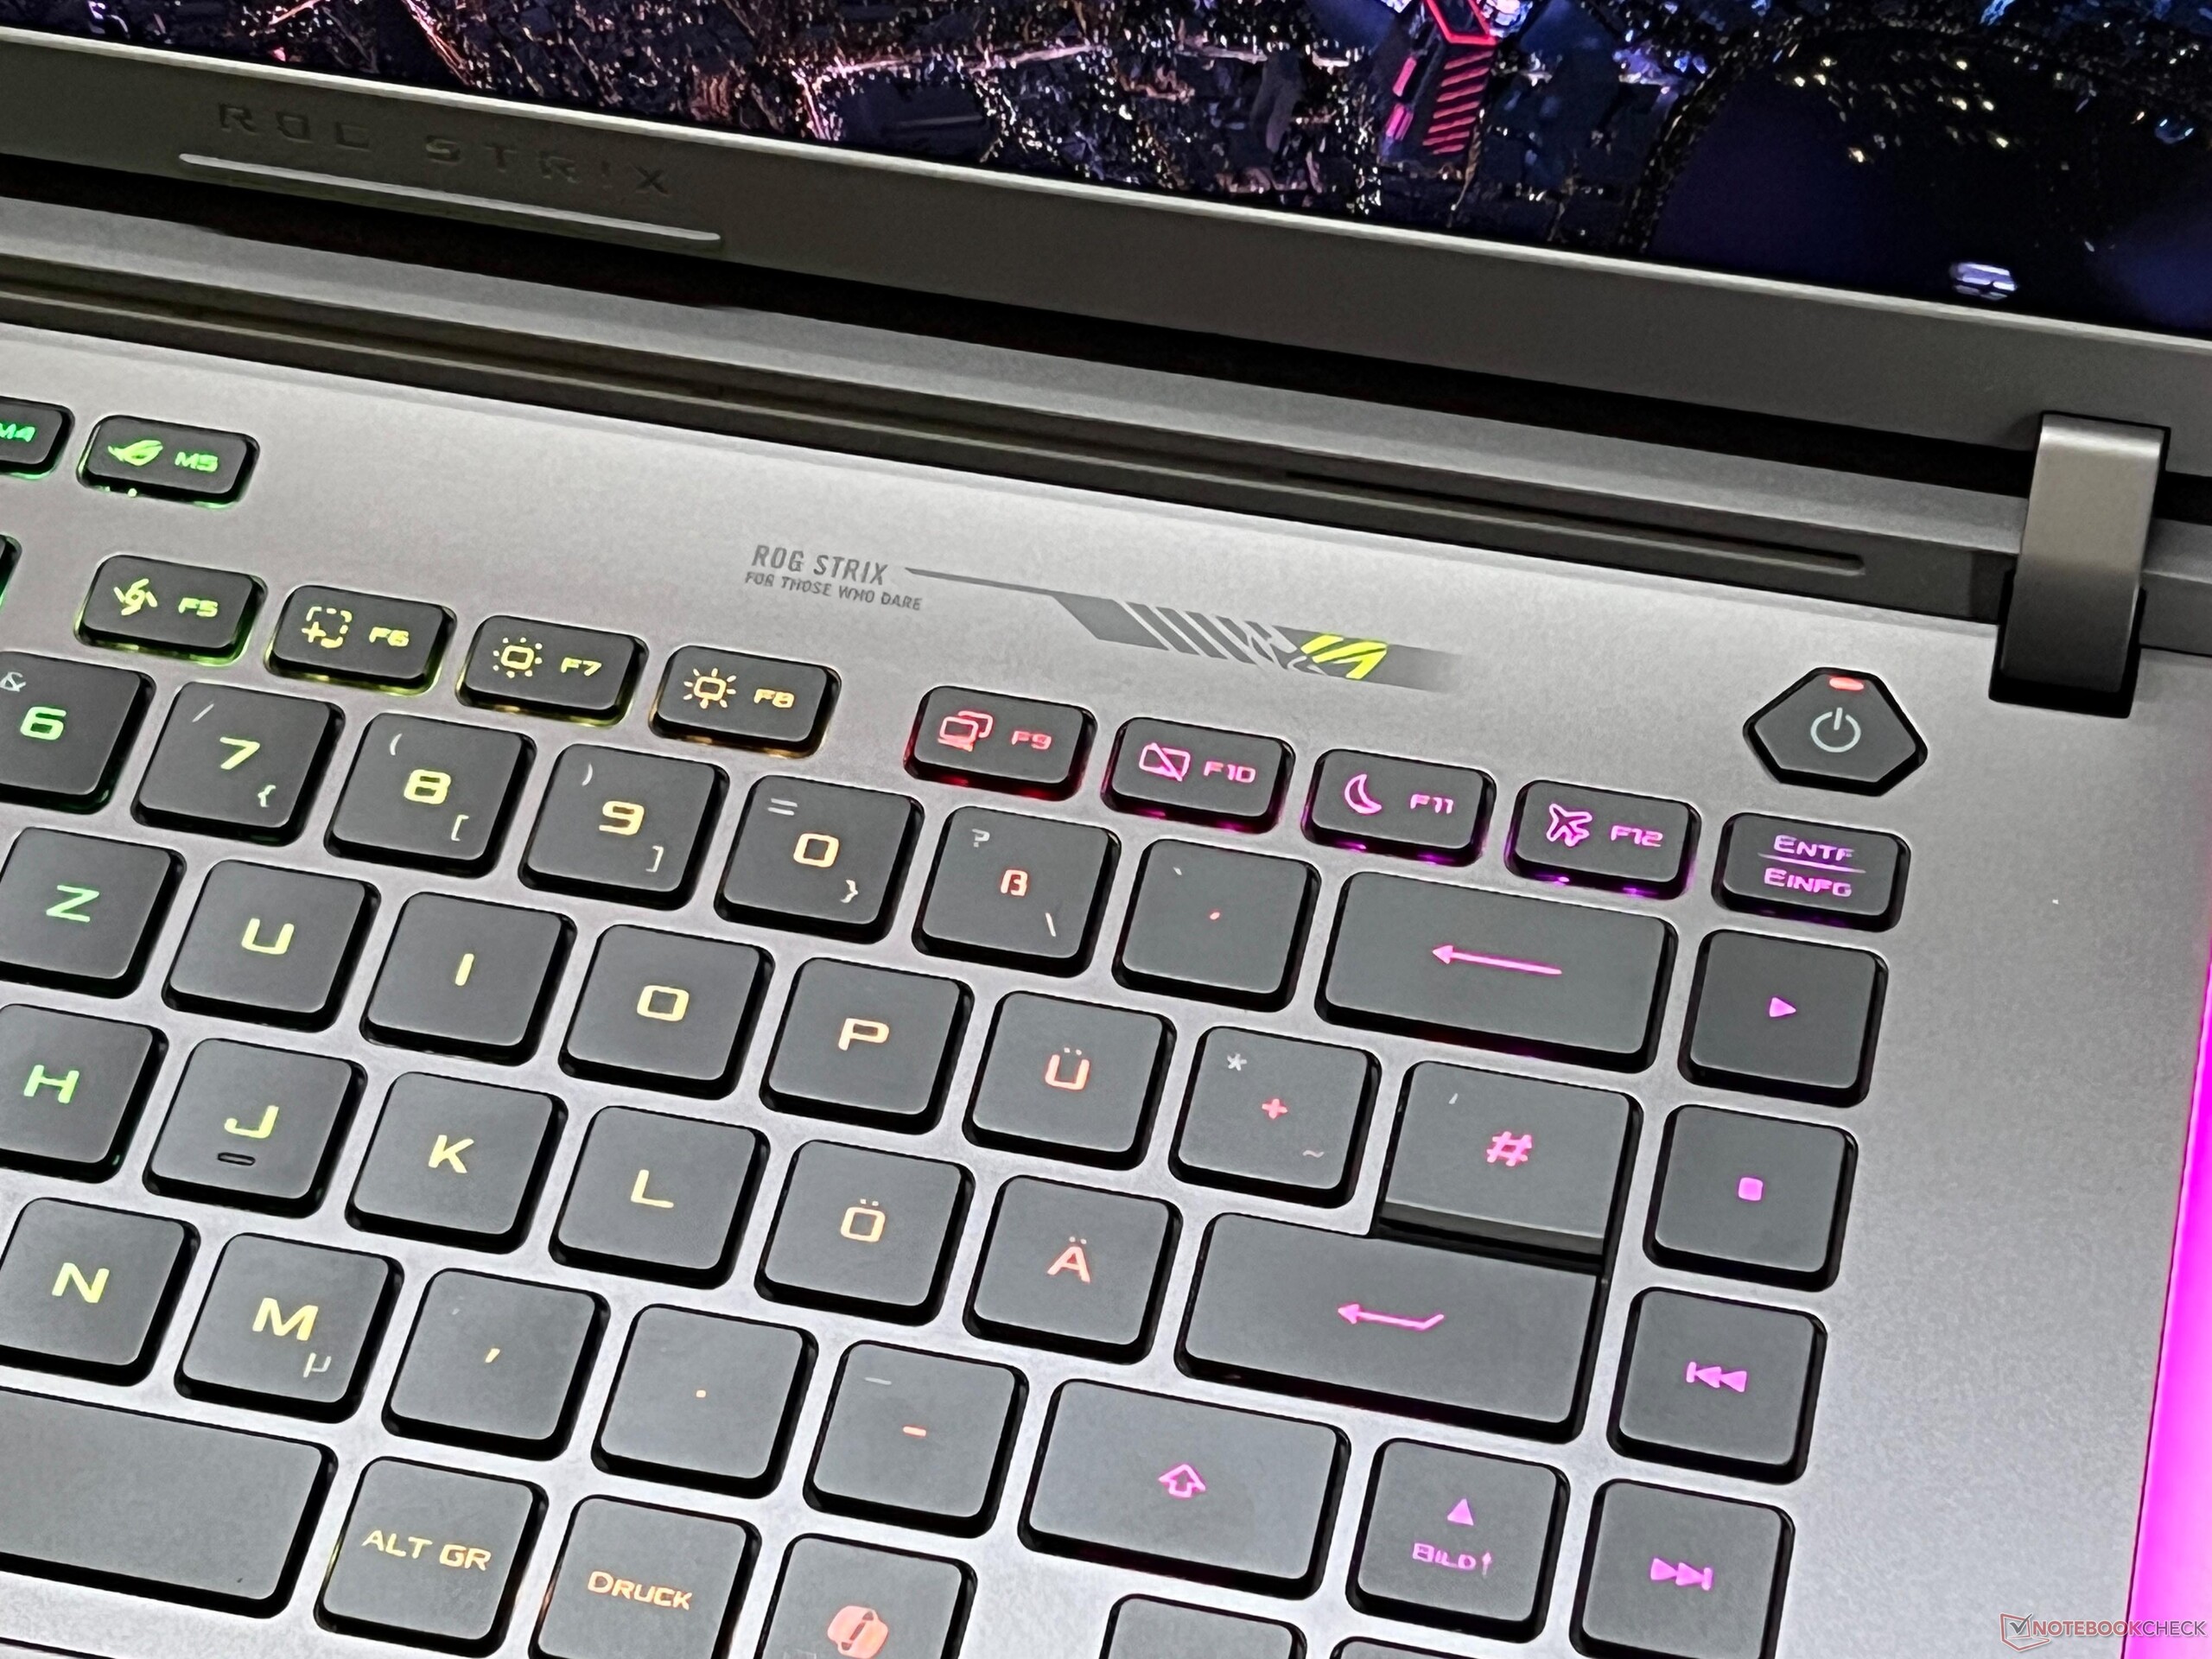
输入设备 - 舒适的键盘
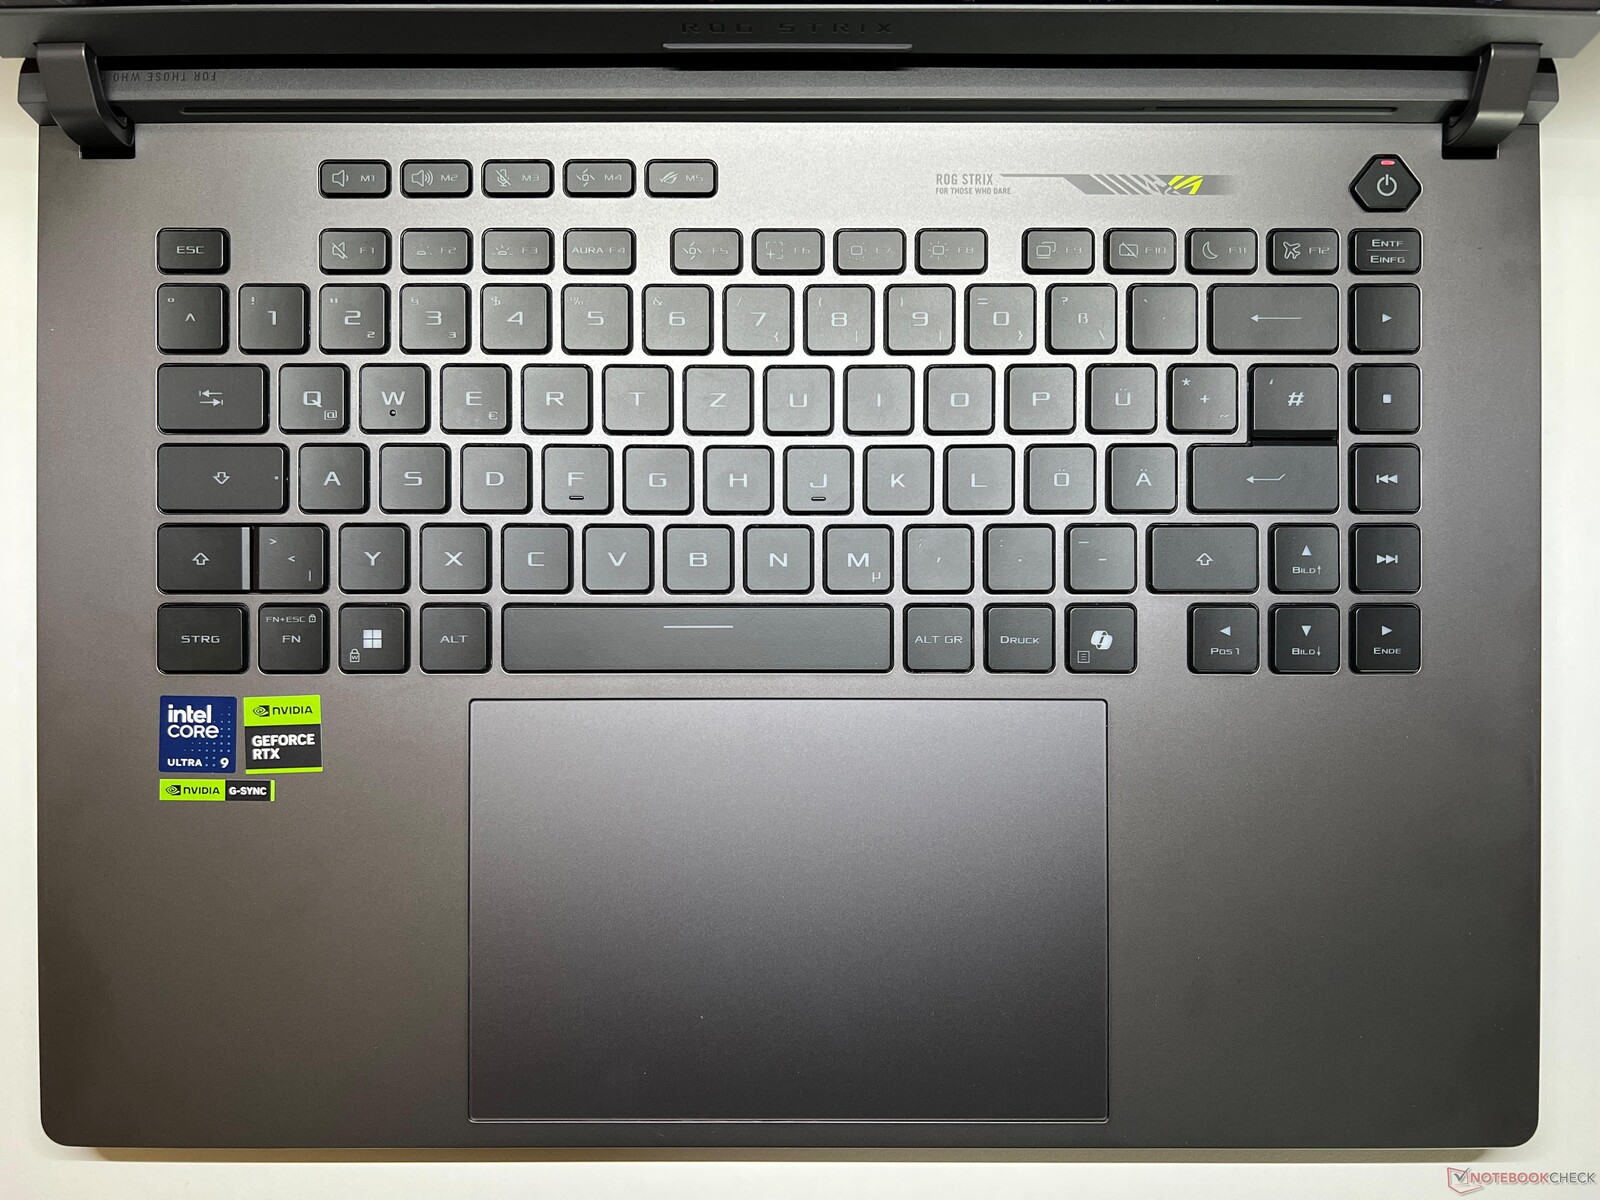
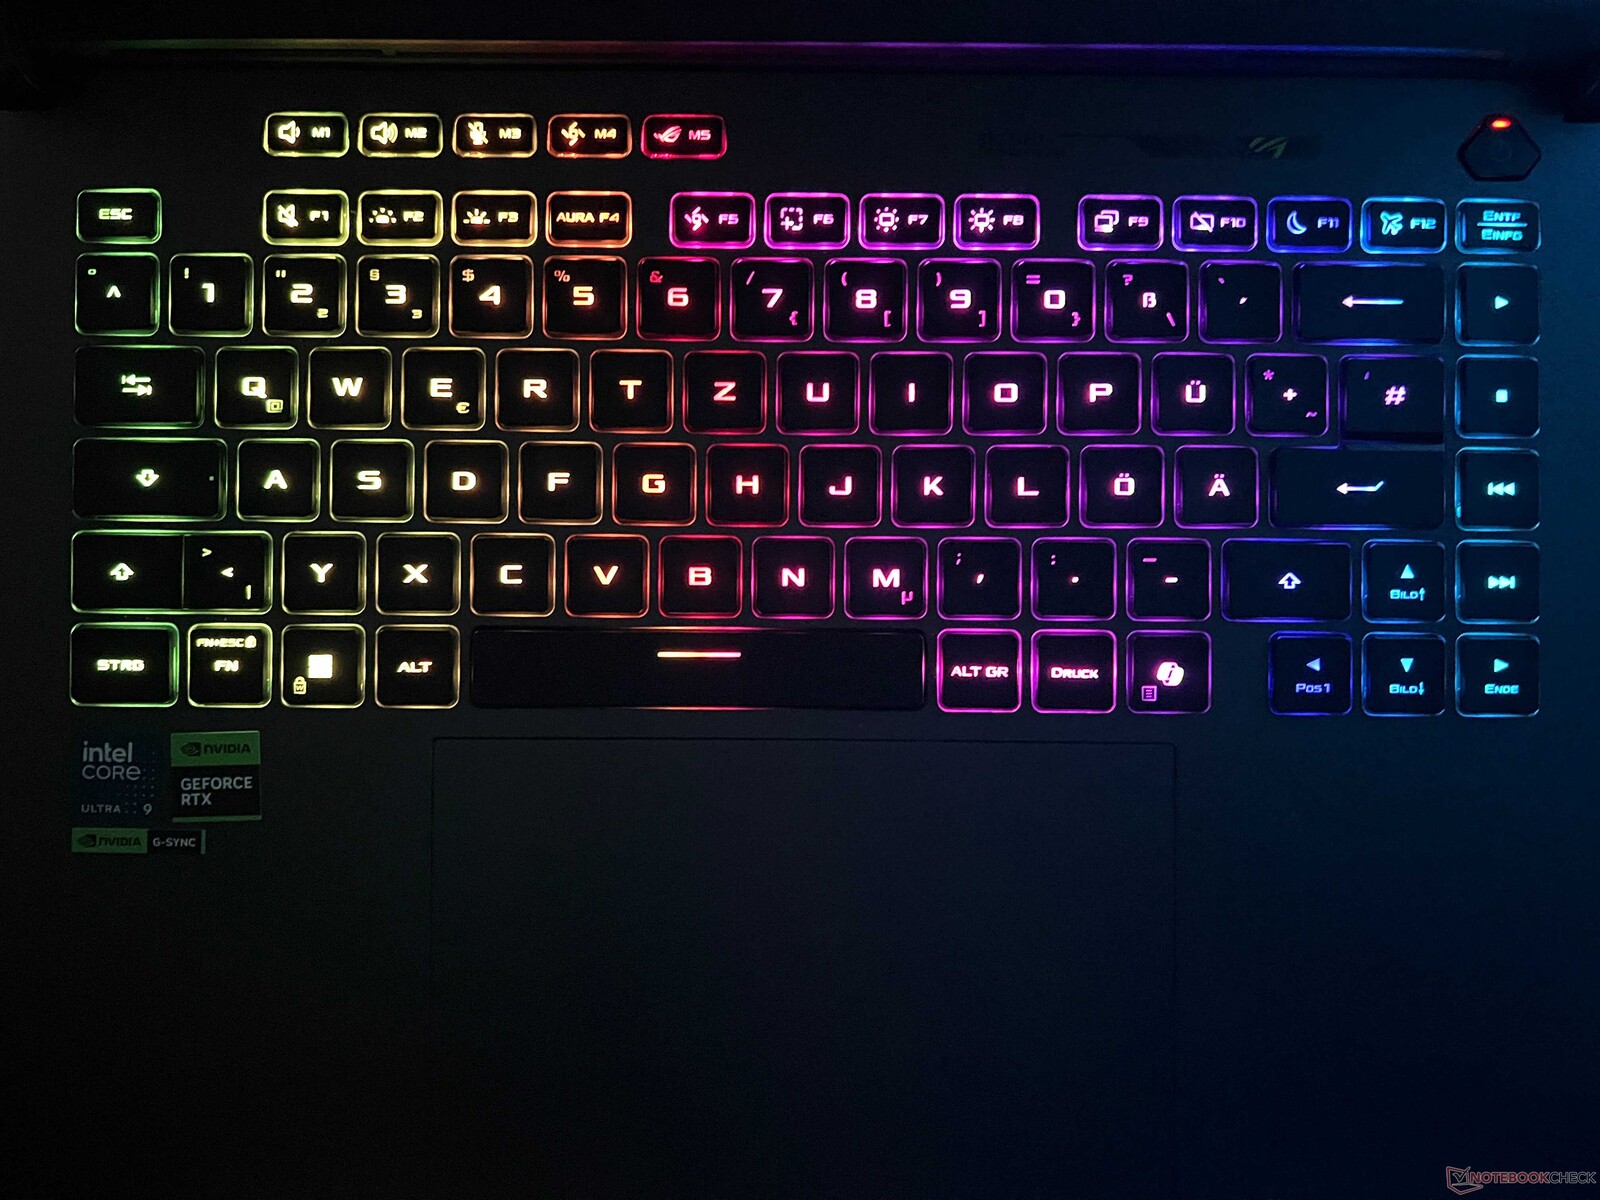
Strix G16 采用薄膜键盘,键程足够大,整体打字体验非常舒适安静。按键可以单独发光,当然也可以与外壳的其他部分同步发光。键盘的整体布局非常合理,方向键的尺寸也没有缩小。不过,要习惯右侧多出的一列媒体控制键还是需要一点时间。
由于华硕没有在这里设置数字键盘,因此非常大的 ClickPad(15 x 9.8 厘米,约 5.9 x 3.9 英寸)被放置在底座的中央。由于其良好的滑动特性,操作起来十分顺手。底部区域的机械咔哒声反馈良好,发出均匀、低沉的咔哒声。
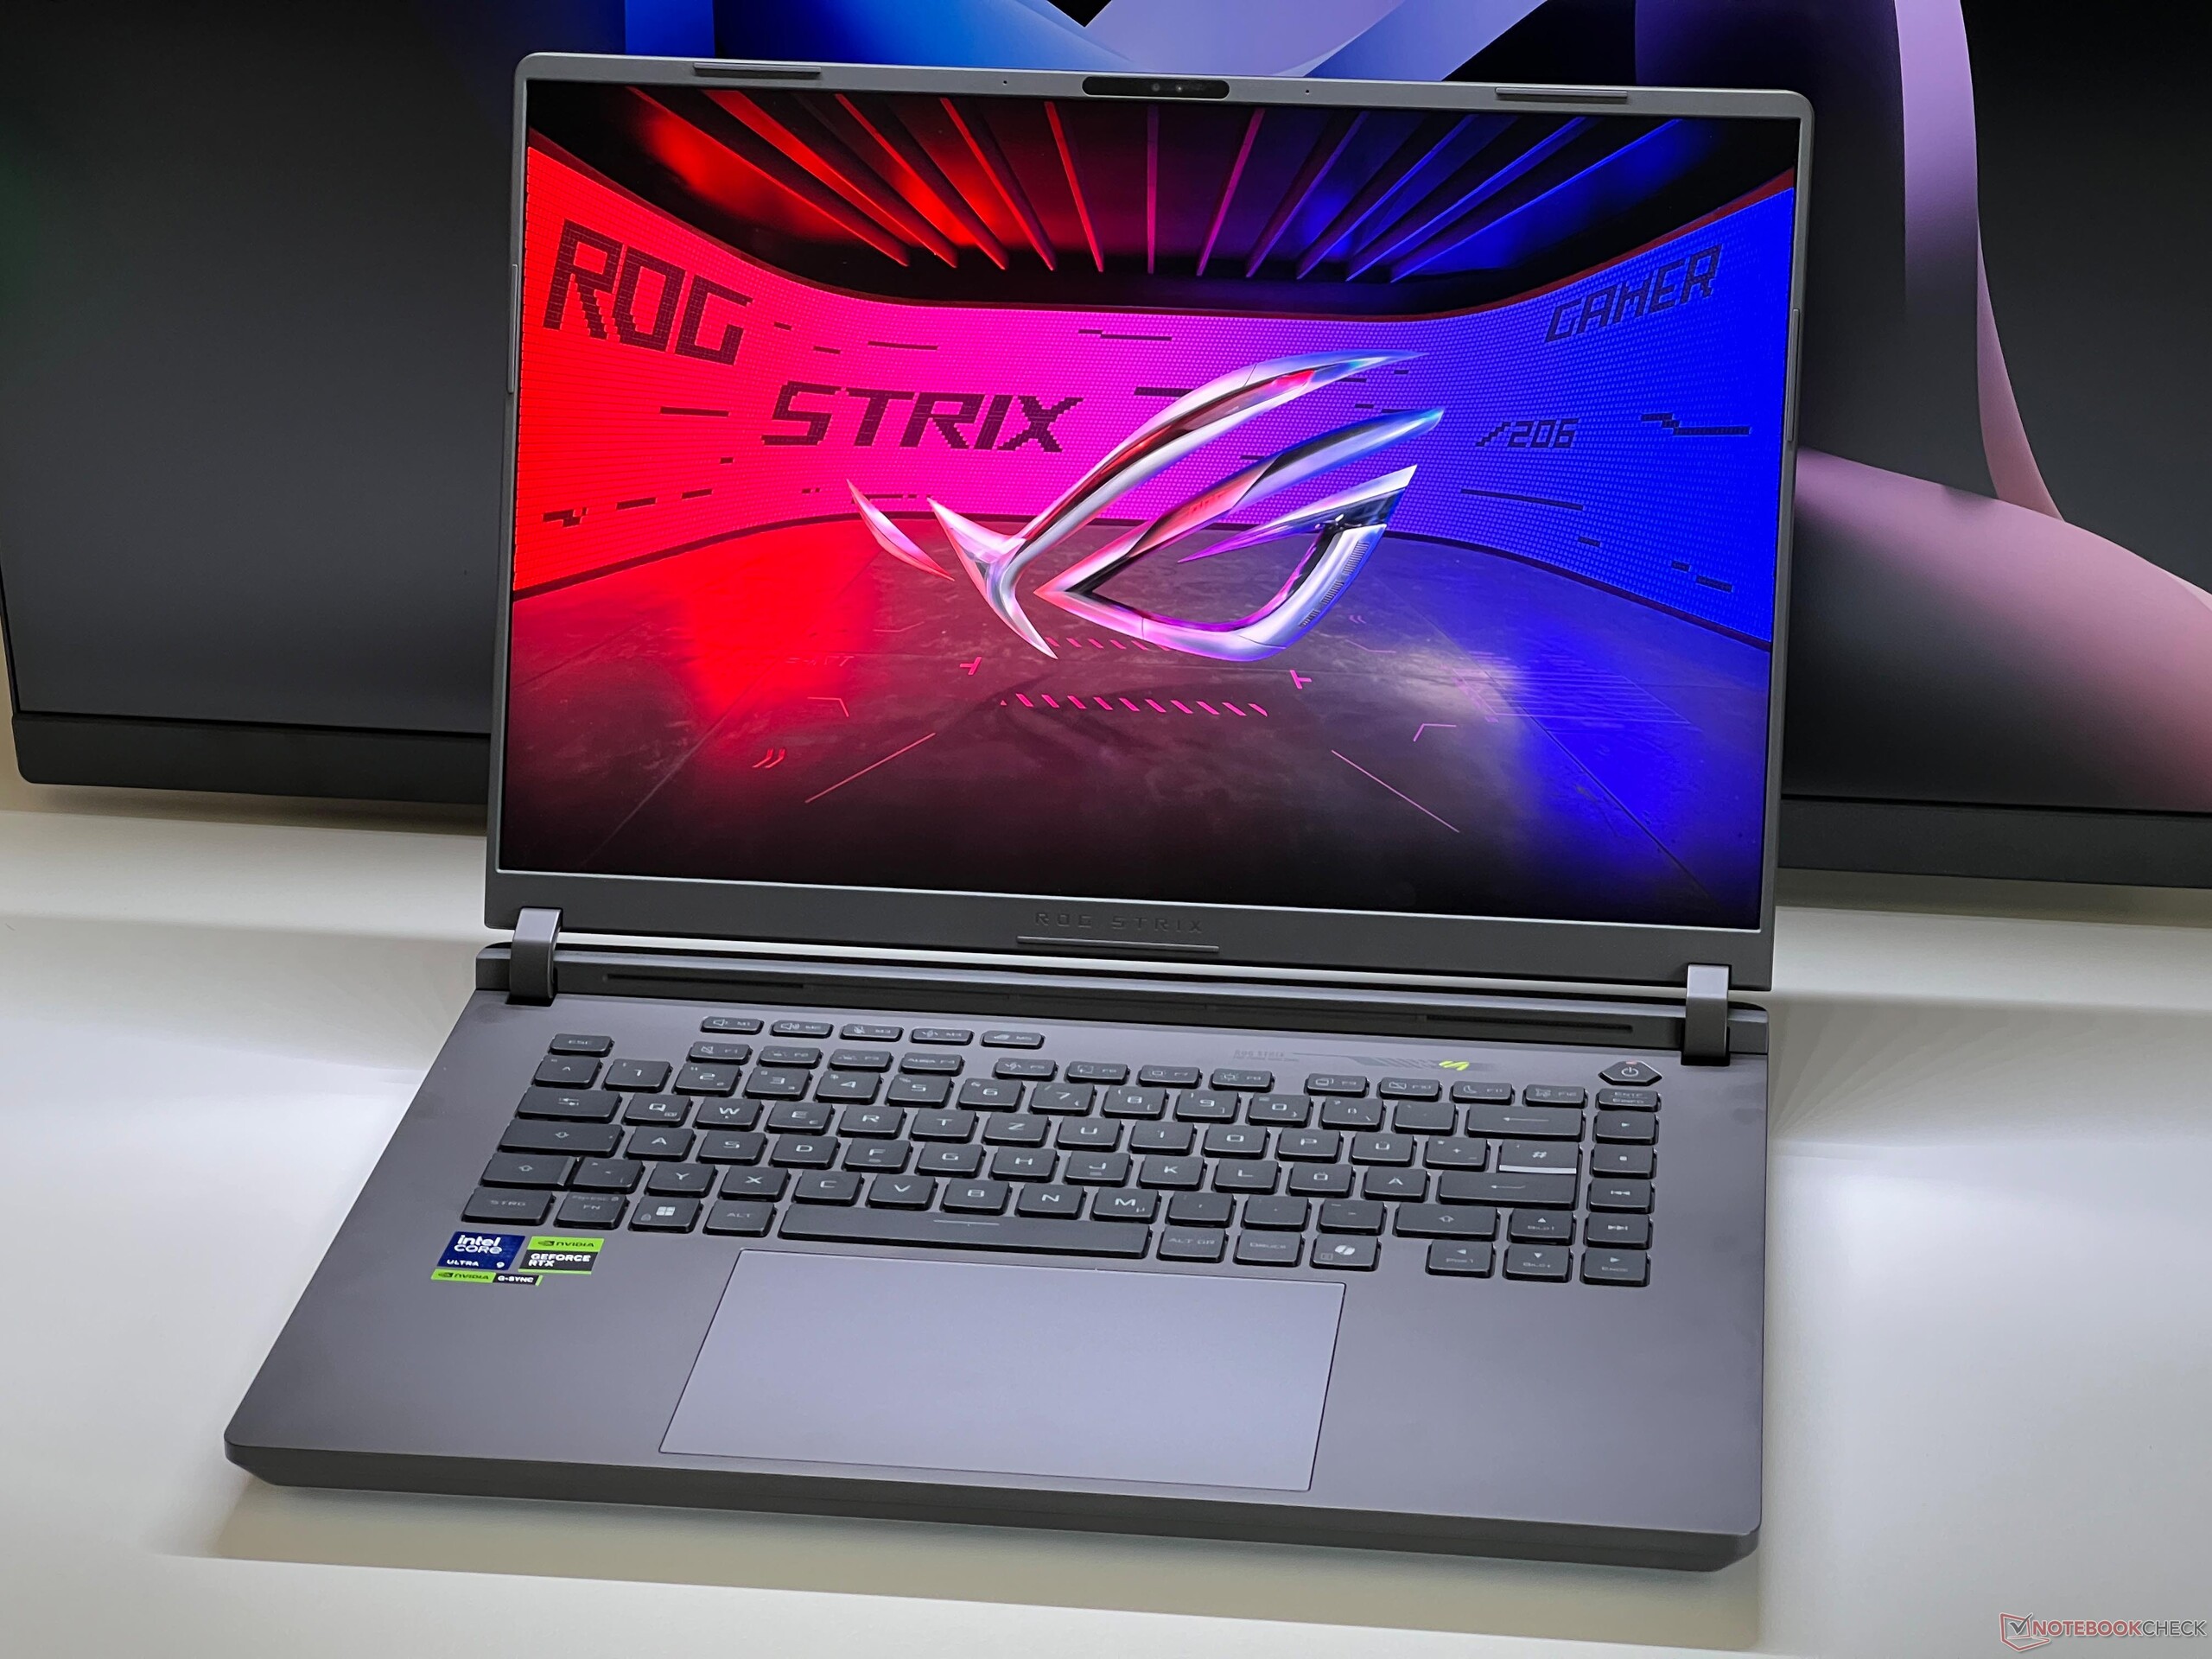
显示屏 - IPS,240 Hz 和 G-Sync

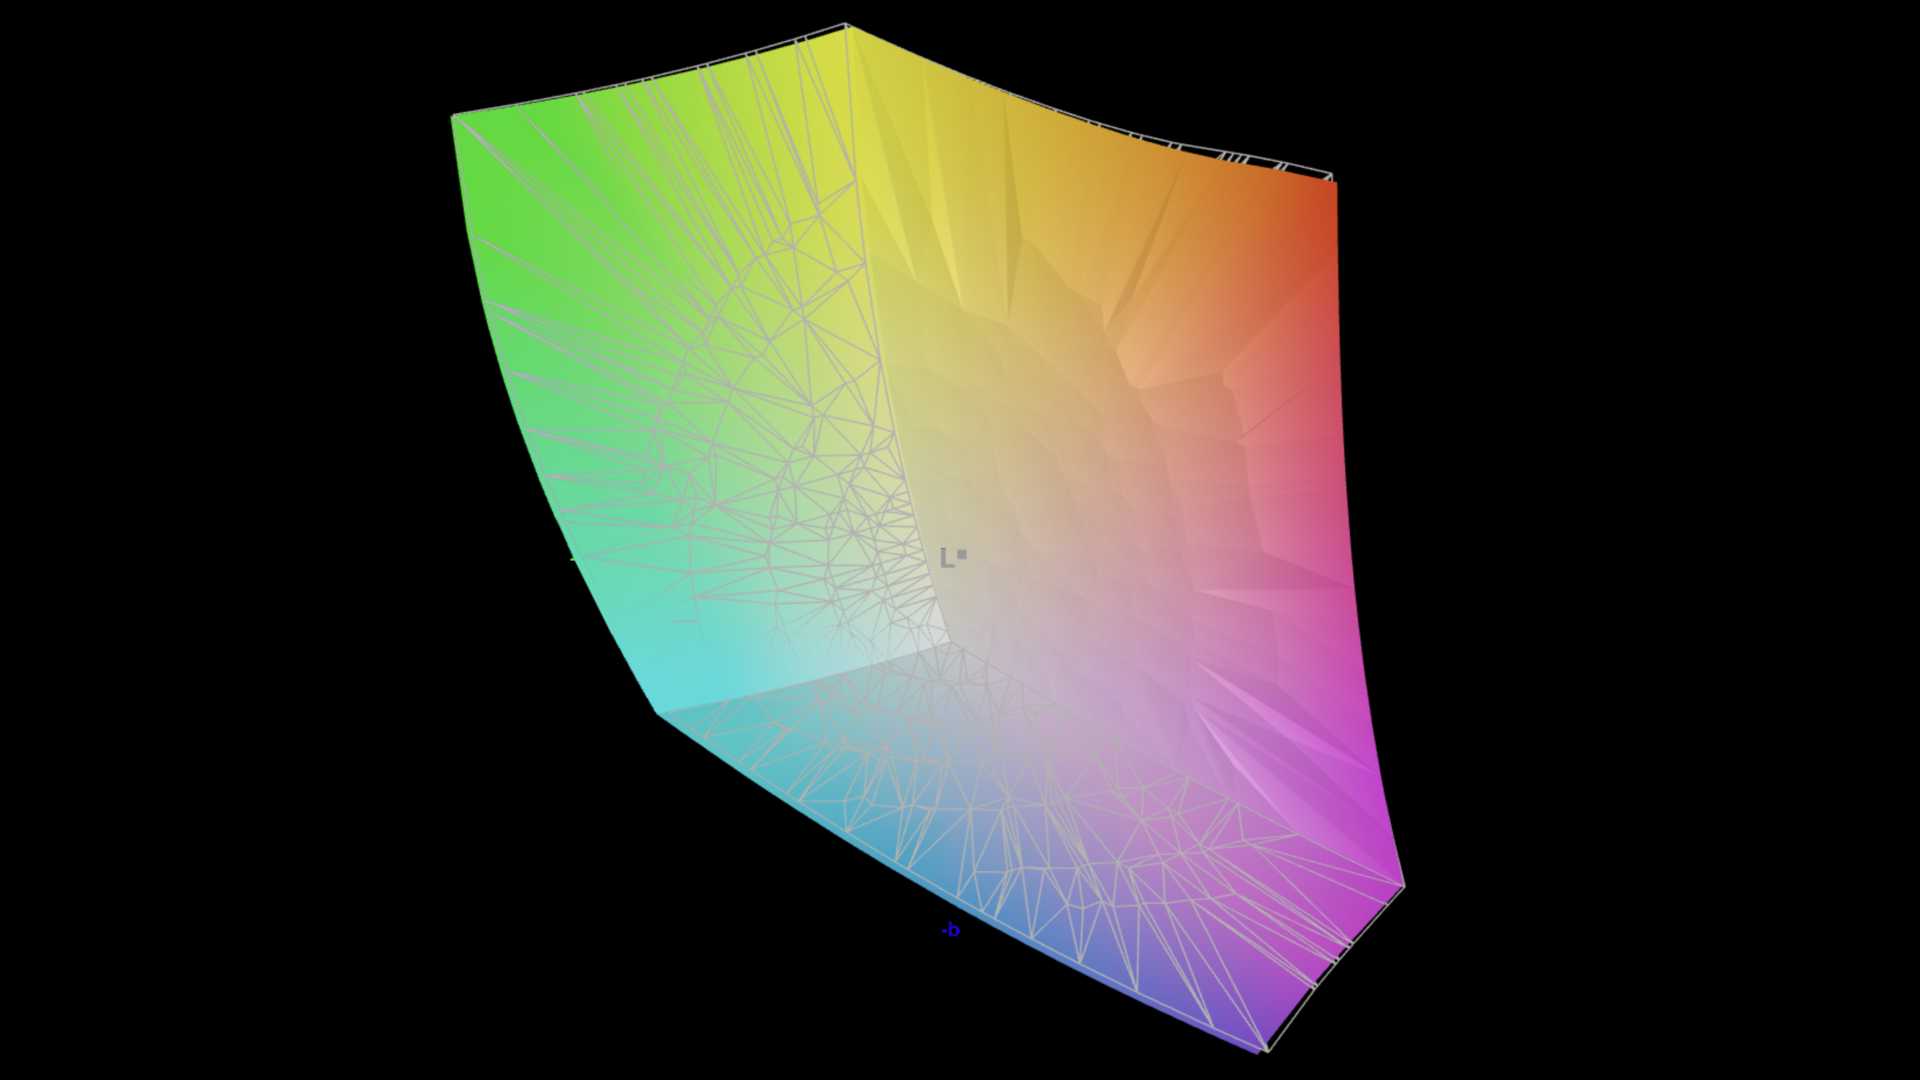
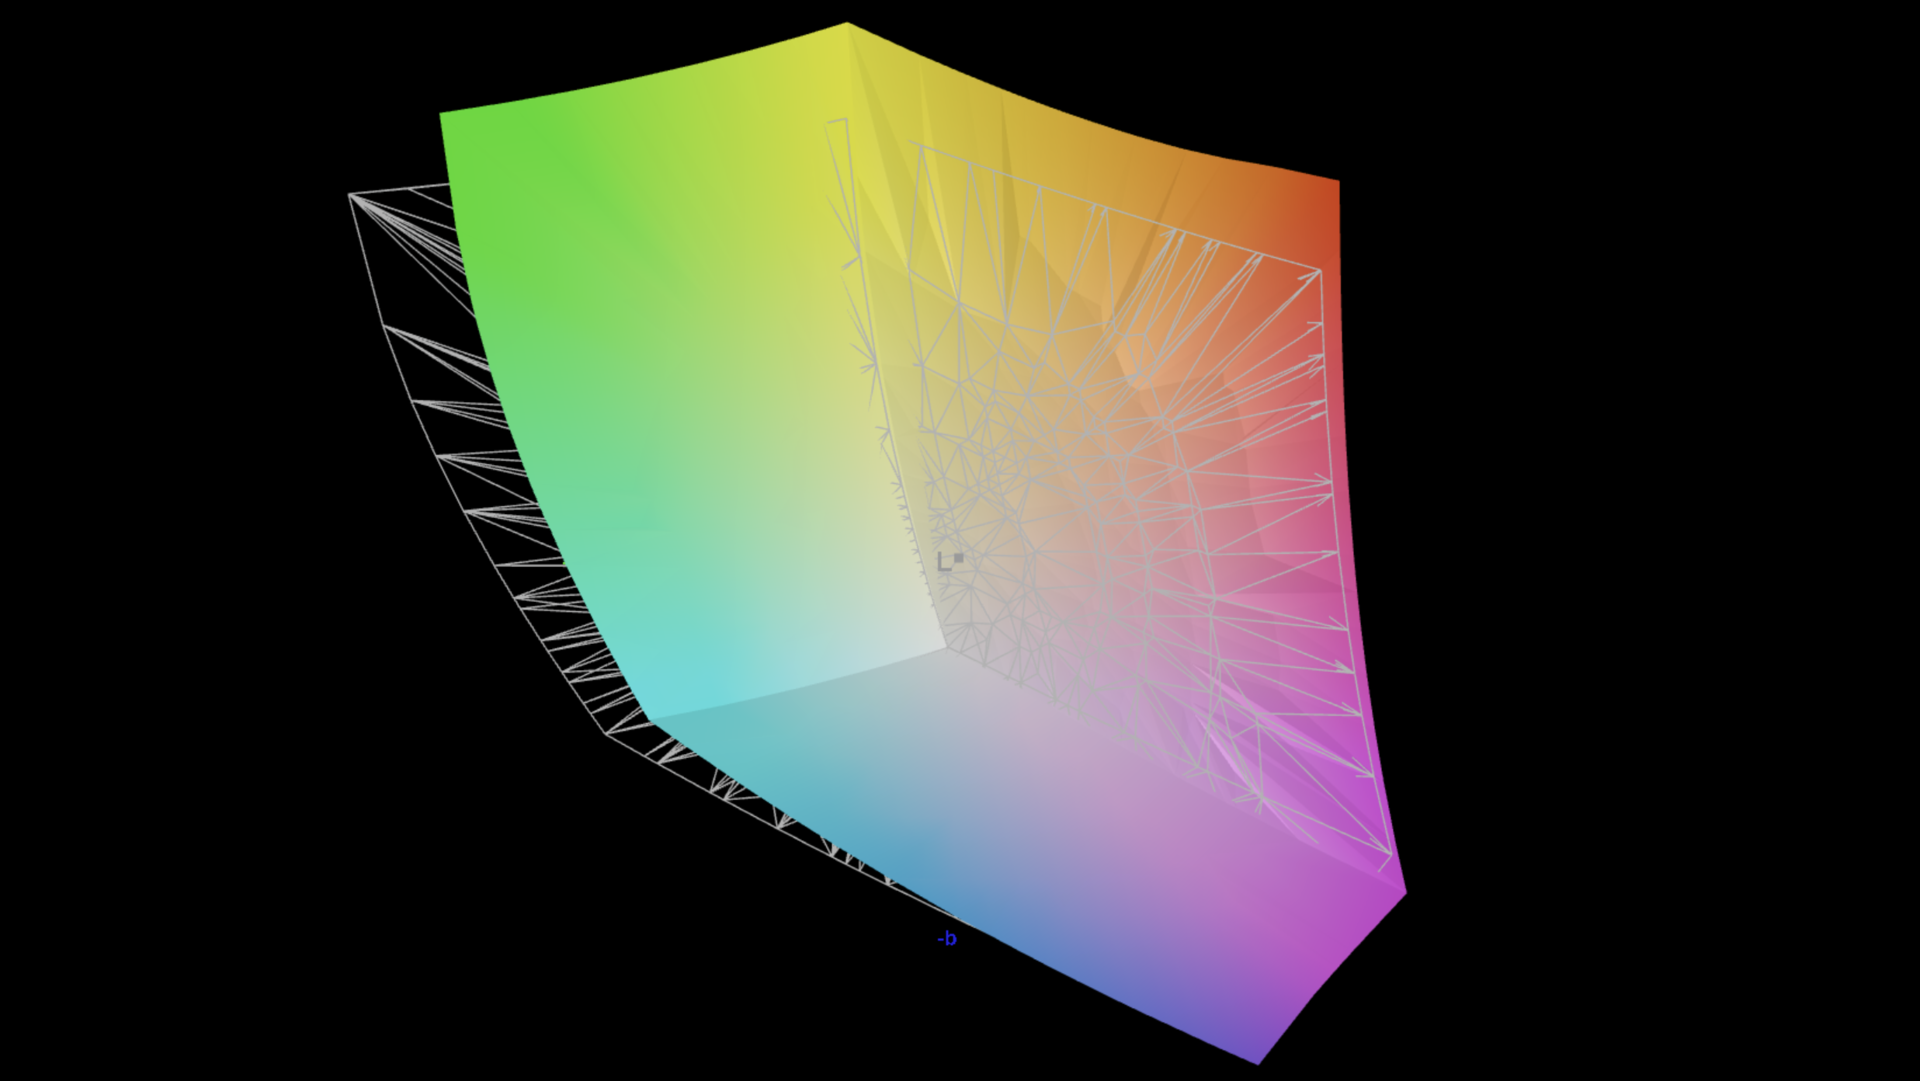
ROG Strix G16 独家提供分辨率为 2560x1600 像素(16:10、G-Sync)的 16 英寸大尺寸 IPS 显示屏。雾面面板的主观画质非常出色。即使是明亮的区域也不会出现颗粒感的问题,但对比度当然也小于 OLED 或 Mini-LED 面板。另一方面,由于采用了 240 Hz 的刷新率,因此不会出现 PWM 闪烁,响应时间非常快,动作也非常流畅。在全亮度下,你可以在暗图像中看到一些轻微的光晕。不支持 HDR 内容。
面板的平均亮度约为 535 cd/m²。黑色值为 0.41 cd/m²,略微偏高,导致最大对比度略低。
| |||||||||||||||||||||||||
Brightness Distribution: 89 %
Center on Battery: 545 cd/m²
Contrast: 1329:1 (Black: 0.41 cd/m²)
ΔE Color 1.6 | 0.5-29.43 Ø4.86, calibrated: 0.8
ΔE Greyscale 2.4 | 0.5-98 Ø5.1
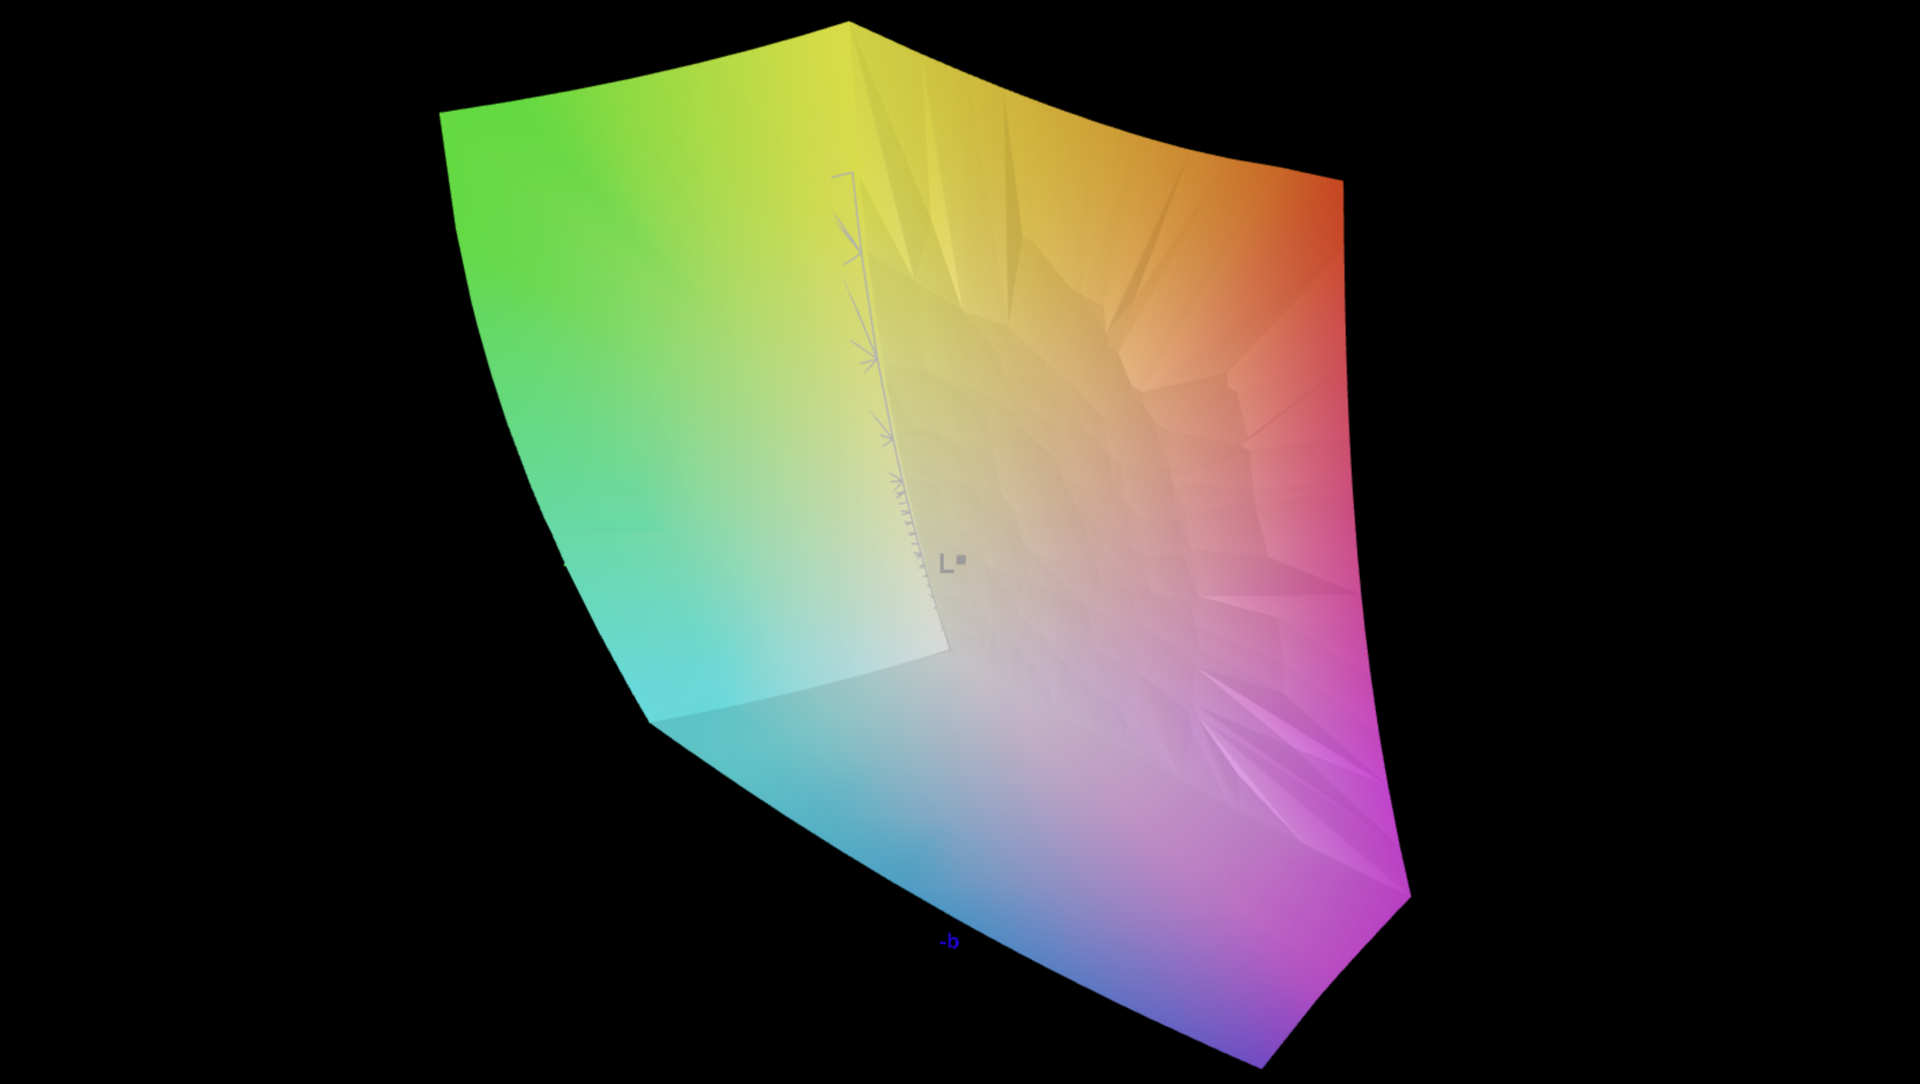
89.1% AdobeRGB 1998 (Argyll 2.2.0 3D)
99.9% sRGB (Argyll 2.2.0 3D)
99.1% Display P3 (Argyll 2.2.0 3D)
Gamma: 2.25
| Asus ROG Strix G16 G615 NE160QDM-NZC, IPS, 2560x1600, 16", 240 Hz | Acer Predator Helios 16 PH16-72 AUO43A8, IPS, 2560x1600, 16", 240 Hz | SCHENKER XMG Neo 16 (Early 24) BOE NE160QDM-NZA, IPS, 2560x1600, 16", 240 Hz | Asus ROG Strix Scar 16 G634JZR BOE NE160QDM-NM7, Mini LED, 2560x1600, 16", 240 Hz | HP Omen 16 (2024) BOE BOE0B7D, IPS, 2560x1440, 16.1", 240 Hz | Lenovo Legion Pro 7 16IRX9H BOE CQ NE16QDM-NZB, IPS, 2560x1600, 16", 240 Hz | Lenovo Legion Pro 7i 16 Gen 10 Samsung ATNA60HU01-0, OLED, 2560x1600, 16", 240 Hz | |
|---|---|---|---|---|---|---|---|
| Display | 2% | -17% | 1% | -18% | -1% | 2% | |
| Display P3 Coverage | 99.1 | 99.82 1% | 70.2 -29% | 99.8 1% | 68.6 -31% | 98.5 -1% | 99.5 0% |
| sRGB Coverage | 99.9 | 100 0% | 98 -2% | 100 0% | 98.6 -1% | 99.9 0% | 100 0% |
| AdobeRGB 1998 Coverage | 89.1 | 94.12 6% | 70.6 -21% | 90.8 2% | 70.6 -21% | 86.7 -3% | 94.4 6% |
| Response Times | -533% | -64% | -40% | -130% | -85% | 94% | |
| Response Time Grey 50% / Grey 80% * | 4.6 ? | 7.2 ? -57% | 11.2 ? -143% | 5 ? -9% | 14.1 ? -207% | 12.6 ? -174% | 0.28 ? 94% |
| Response Time Black / White * | 6.1 ? | 67.6 ? -1008% | 5.1 ? 16% | 10.4 ? -70% | 9.3 ? -52% | 5.8 ? 5% | 0.43 ? 93% |
| PWM Frequency | 2630 | 2040 ? | 1438 ? | ||||
| Screen | 58394% | -41% | 10% | -17% | 12% | -15% | |
| Brightness middle | 545 | 699 28% | 530 -3% | 490 -10% | 292 -46% | 487 -11% | 490.4 -10% |
| Brightness | 536 | 672 25% | 497 -7% | 487 -9% | 291 -46% | 460 -14% | 498 -7% |
| Brightness Distribution | 89 | 92 3% | 85 -4% | 94 6% | 85 -4% | 88 -1% | 97 9% |
| Black Level * | 0.41 | 0.0001 100% | 0.53 -29% | 0.4 2% | 0.24 41% | 0.42 -2% | |
| Contrast | 1329 | 6990000 525859% | 1000 -25% | 1225 -8% | 1217 -8% | 1160 -13% | |
| Colorchecker dE 2000 * | 1.6 | 3.89 -143% | 3.21 -101% | 1.08 32% | 2.36 -48% | 1.12 30% | 3.2 -100% |
| Colorchecker dE 2000 max. * | 4 | 5.51 -38% | 5.8 -45% | 2.38 40% | 4.08 -2% | 2.26 43% | 6.04 -51% |
| Colorchecker dE 2000 calibrated * | 0.8 | 2.17 -171% | 1.44 -80% | 0.9 -13% | 0.93 -16% | 0.54 32% | 0.84 -5% |
| Greyscale dE 2000 * | 2.4 | 5.14 -114% | 4.2 -75% | 1.1 54% | 3 -25% | 1.4 42% | 1 58% |
| Gamma | 2.25 98% | 2.018 109% | 2.226 99% | 2.13 103% | 2.101 105% | 2.242 98% | 2.24 98% |
| CCT | 6737 96% | 7113 91% | 6448 101% | 6724 97% | 5976 109% | 6809 95% | 6373 102% |
| Total Average (Program / Settings) | 19288% /
37464% | -41% /
-39% | -10% /
1% | -55% /
-33% | -25% /
-5% | 27% /
7% |
* ... smaller is better
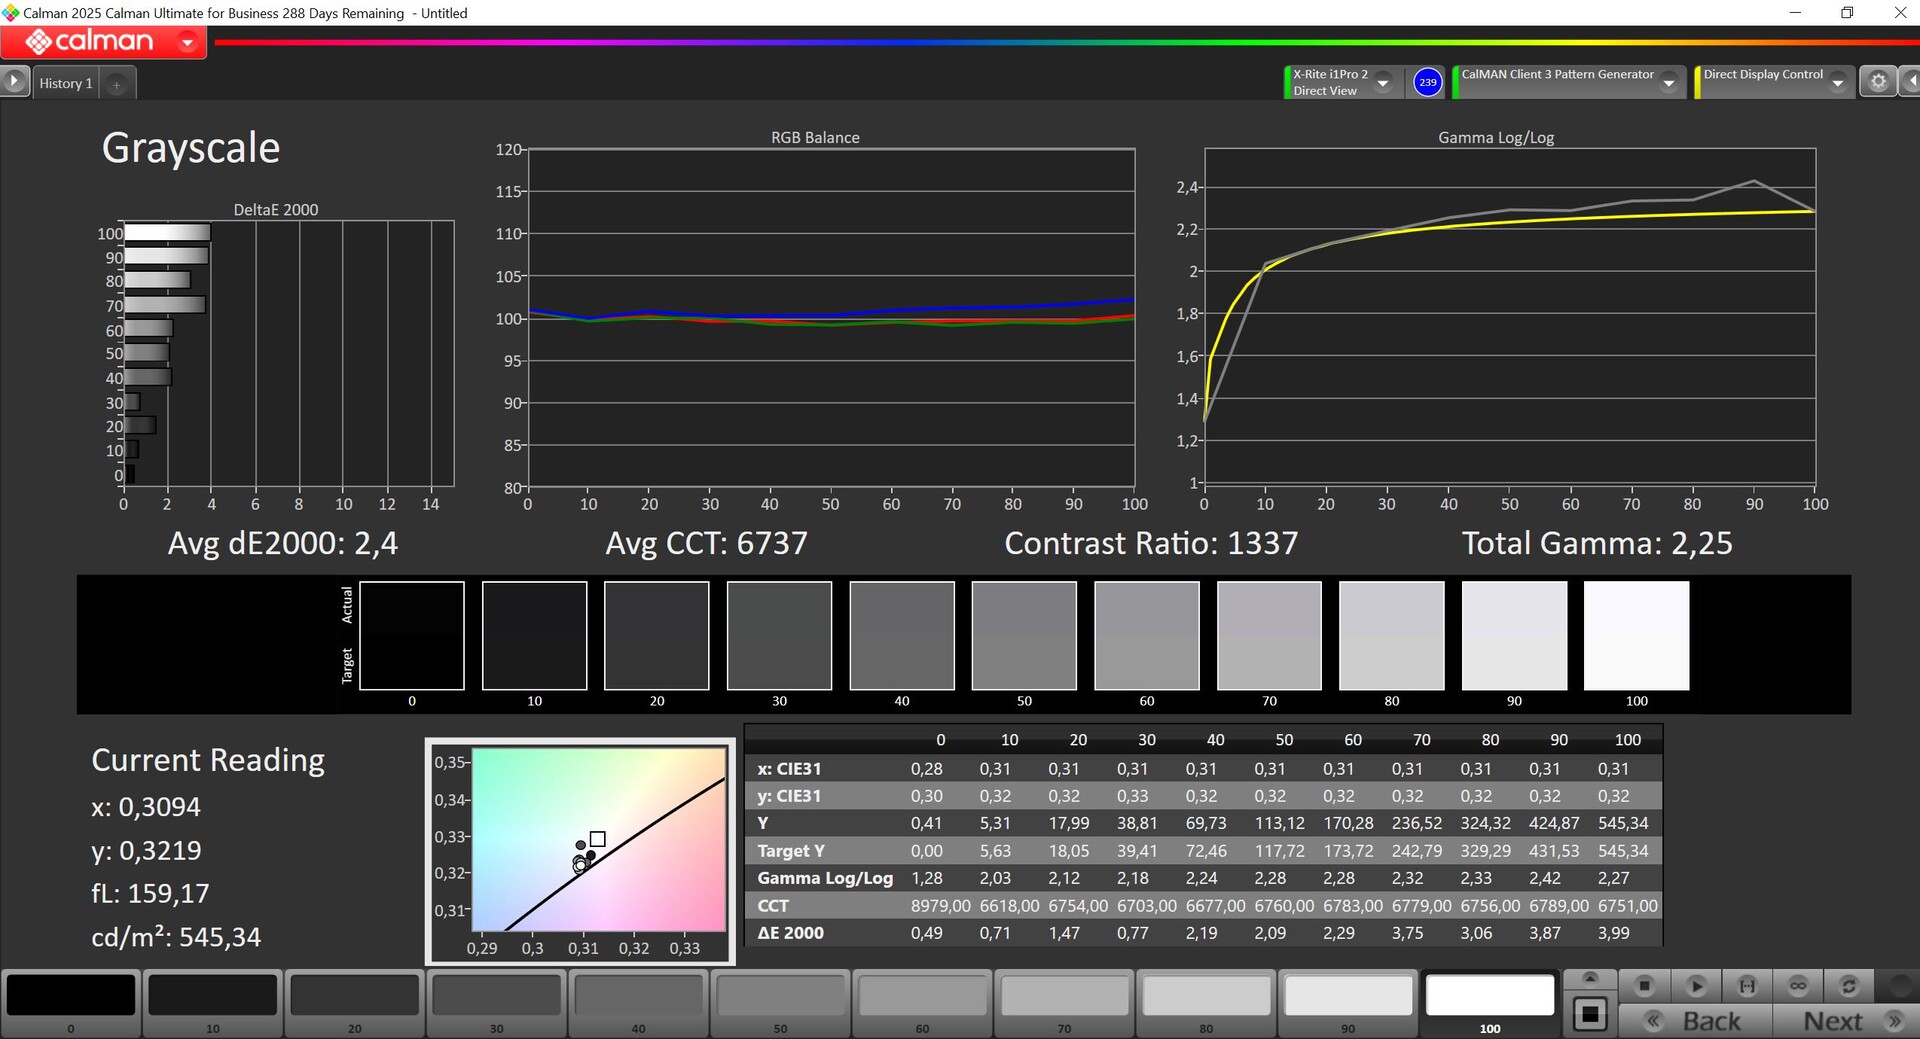
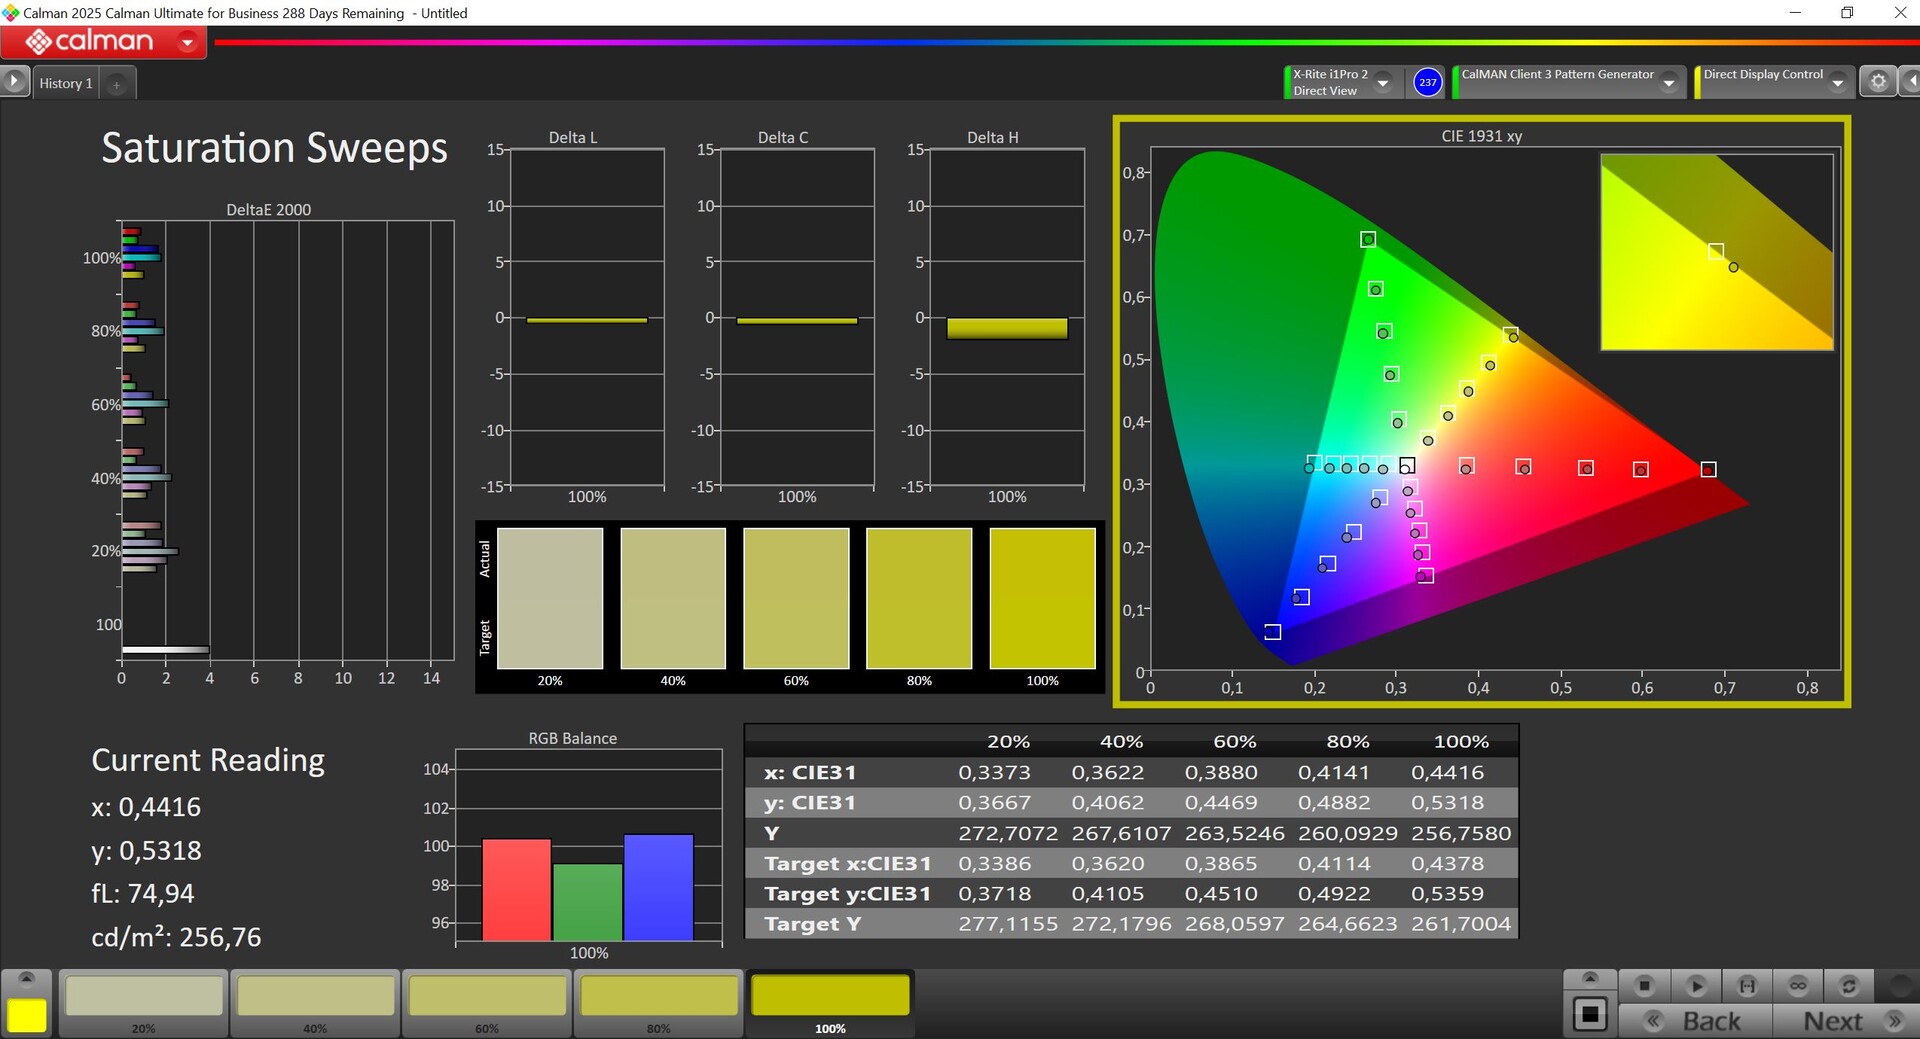


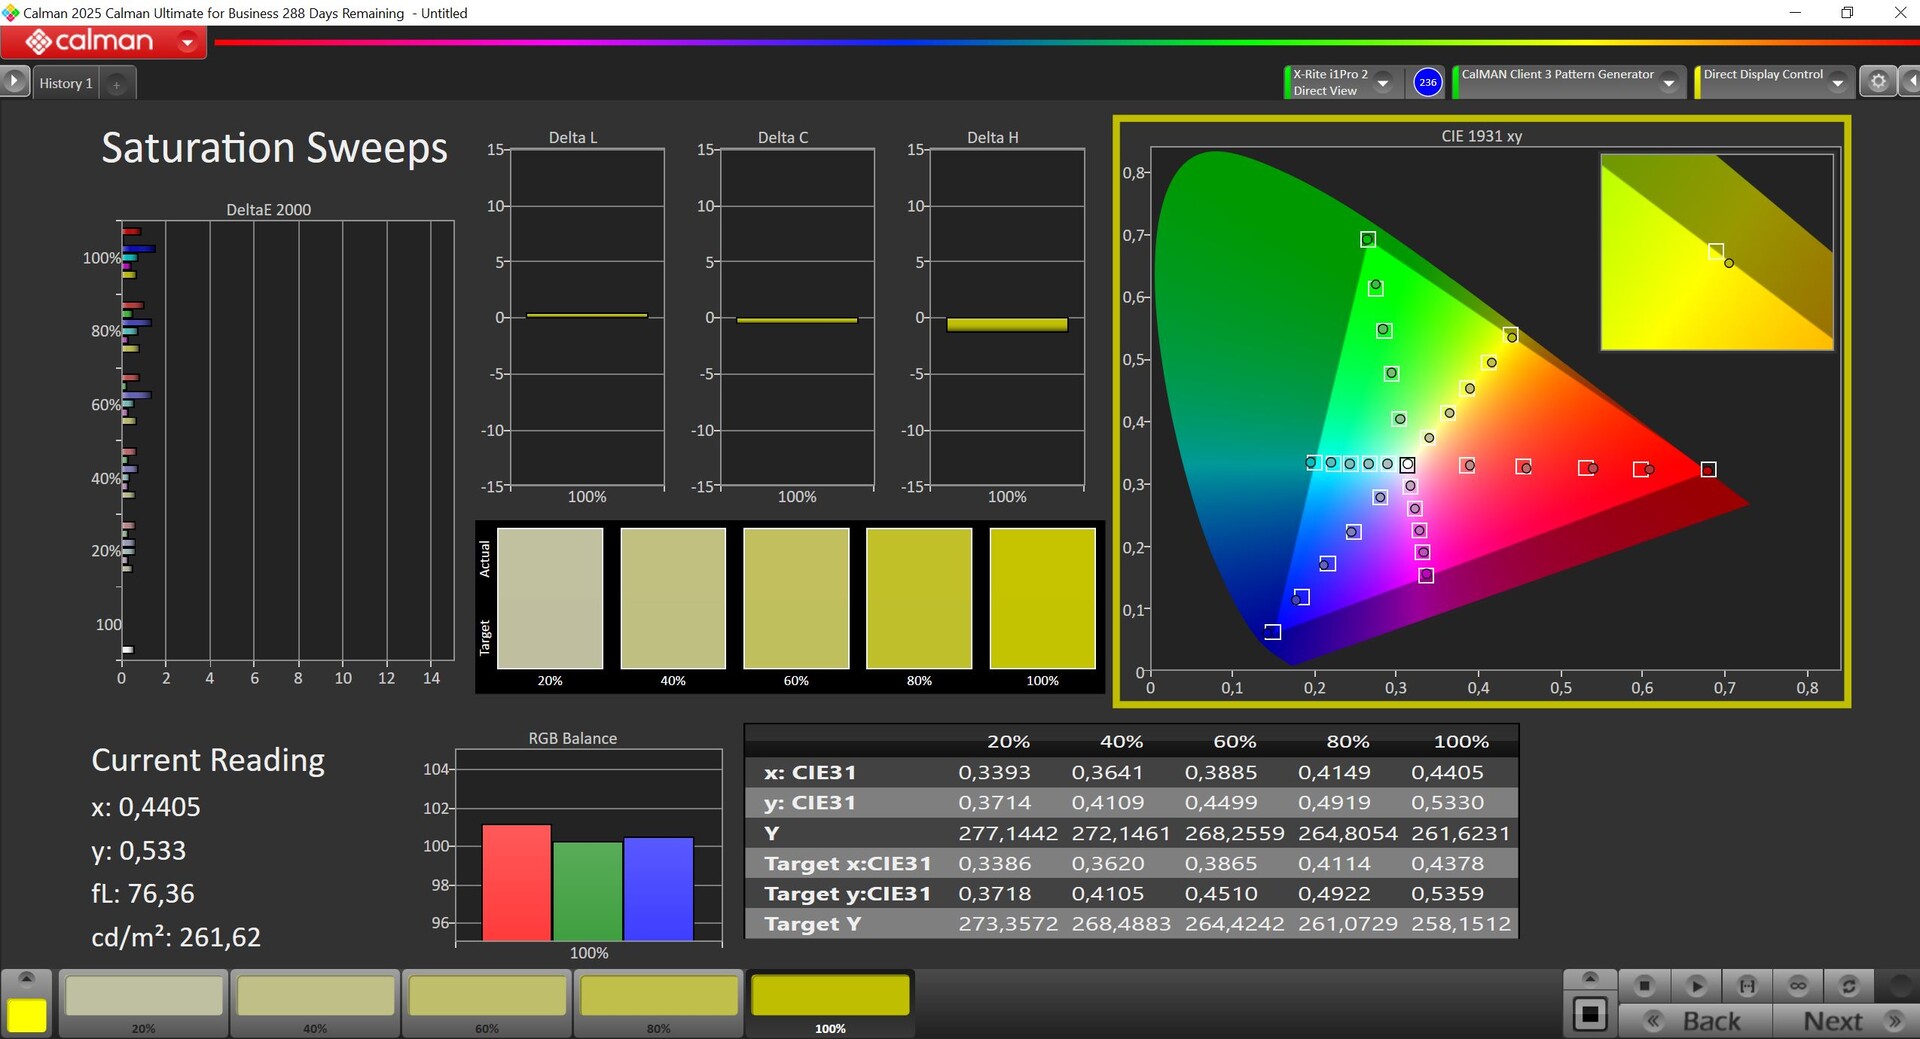
华硕提供了各种色彩配置文件,我们使用专业的 CalMAN 软件进行测量。所有配置文件基本上都非常相似,在各自的色彩空间(P3 或 sRGB)中都能提供不错的图像质量,但我们只有在应用自己的校准时才能充分发挥面板的潜力(可从上面的链接免费下载相应的配置文件)。得益于全色彩空间覆盖(P3 和 sRGB),您也可以毫无问题地使用显示器进行图像处理。


Display Response Times
| ↔ Response Time Black to White | ||
|---|---|---|
| 6.1 ms ... rise ↗ and fall ↘ combined | ↗ 1.6 ms rise | 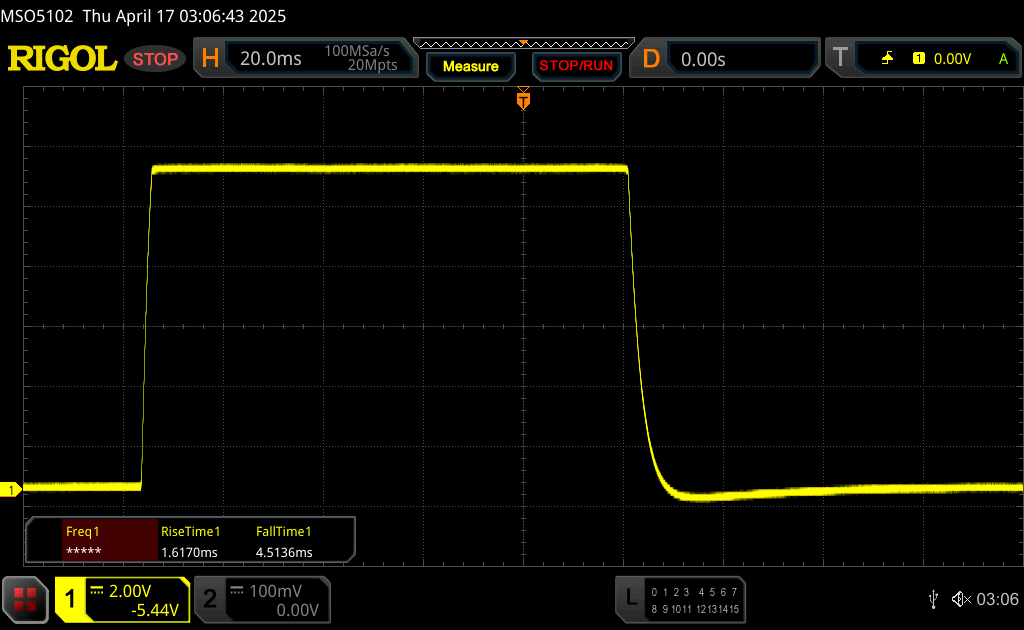 |
| ↘ 4.5 ms fall | ||
| The screen shows very fast response rates in our tests and should be very well suited for fast-paced gaming. In comparison, all tested devices range from 0.1 (minimum) to 240 (maximum) ms. » 17 % of all devices are better. This means that the measured response time is better than the average of all tested devices (20.7 ms). | ||
| ↔ Response Time 50% Grey to 80% Grey | ||
| 4.6 ms ... rise ↗ and fall ↘ combined | ↗ 2.1 ms rise | 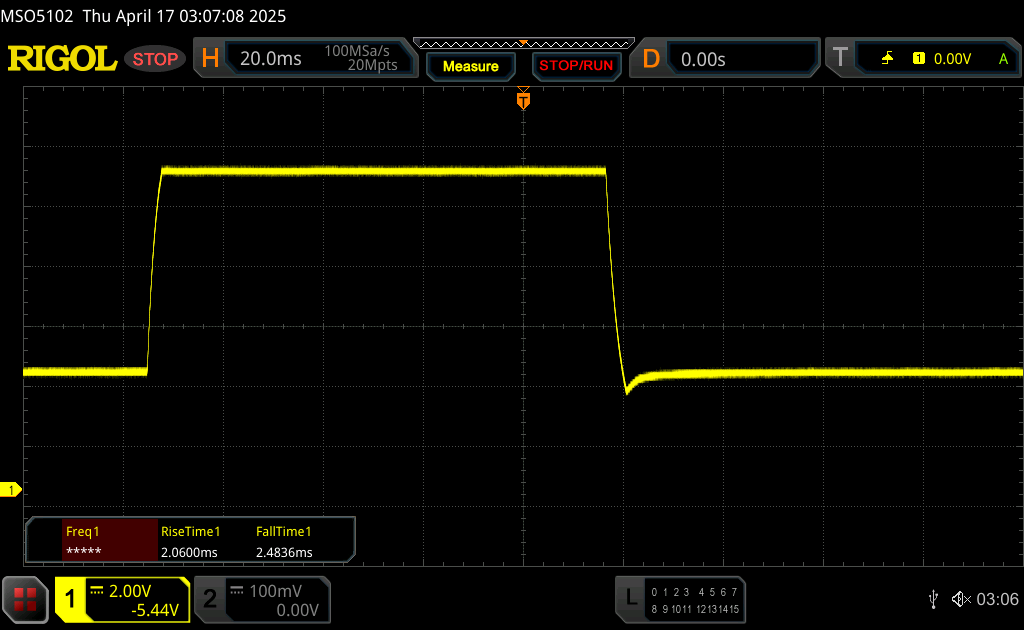 |
| ↘ 2.5 ms fall | ||
| The screen shows very fast response rates in our tests and should be very well suited for fast-paced gaming. In comparison, all tested devices range from 0.165 (minimum) to 636 (maximum) ms. » 14 % of all devices are better. This means that the measured response time is better than the average of all tested devices (32.4 ms). | ||
Screen Flickering / PWM (Pulse-Width Modulation)
| Screen flickering / PWM not detected |  | ||
In comparison: 53 % of all tested devices do not use PWM to dim the display. If PWM was detected, an average of 8471 (minimum: 5 - maximum: 343500) Hz was measured. | |||


性能 - Core Ultra 9 和 RTX 5080 笔记本电脑
测试条件
ROG Strix G16 提供常用的电源配置文件(静音、高性能、涡轮增压)以及手动模式和 GPU 切换的附加模式。下表列出了各配置文件的概览。在日常操作中,只需按下一个按键,就能轻松切换不同的配置文件。我们在Turbo模式(GPU 模式:标准)下进行基准测试和测量。在电池运行状态下,只有 "安静 "和 "性能"两个配置文件可用。
| 电源配置文件 | CPU TDP | CB24 Multi | GPU TGP | Time Spy Graphics | 赛博朋克 2077 QHD Ultra | 最大风扇噪音 |
|---|---|---|---|---|---|---|
| 静音 | 160/45 瓦 | 1,490 点 | 55 瓦 | 11,041 点 | 43.1 FPS | 36.1 dB(A) |
| 性能 | 160/105 瓦 | 2,033 点 | 160 瓦 | 20,138 点 | 91.6 FPS | 49.3 dB(A) |
| 涡轮 | 175/150 瓦 | 2,207 点 | 175 瓦 | 21,571 点 | 99.5 FPS | 54.2 dB(A) |
| 电池(性能) | 65/42 瓦 | 1,627 点 | 55 瓦 | 9,172 点 | 32 FPS | 34 dB(A) |
处理器 - Core Ultra 9 275HX
华硕使用新的 英特尔酷睿至尊 9 275HX处理器,其最大功耗为 175 瓦,最高功耗为 150 瓦。新款 Stix G16 的 CPU 性能非常出色,在所有基准测试中都名列前茅。不过,与老款酷睿 i9-14900HX 的快速执行相比,优势并不是特别大。
Cinebench R15 Multi Constant Load Test
Cinebench 2024: CPU Multi Core | CPU Single Core
Cinebench R23: Multi Core | Single Core
Cinebench R20: CPU (Multi Core) | CPU (Single Core)
Cinebench R15: CPU Multi 64Bit | CPU Single 64Bit
Blender: v2.79 BMW27 CPU
7-Zip 18.03: 7z b 4 | 7z b 4 -mmt1
Geekbench 6.4: Multi-Core | Single-Core
Geekbench 5.5: Multi-Core | Single-Core
HWBOT x265 Benchmark v2.2: 4k Preset
LibreOffice : 20 Documents To PDF
R Benchmark 2.5: Overall mean
| CPU Performance Rating | |
| Asus ROG Strix G16 G615 | |
| SCHENKER XMG Neo 16 (Early 24) | |
| Lenovo Legion Pro 7i 16 Gen 10 | |
| Average Intel Core Ultra 9 275HX | |
| Lenovo Legion Pro 7 16IRX9H | |
| Asus ROG Strix Scar 16 G634JZR | |
| Acer Predator Helios 16 PH16-72 | |
| HP Omen 16 (2024) | |
| Average of class Gaming | |
| Cinebench 2024 / CPU Multi Core | |
| Asus ROG Strix G16 G615 | |
| Average Intel Core Ultra 9 275HX (1913 - 2223, n=4) | |
| Lenovo Legion Pro 7i 16 Gen 10 | |
| SCHENKER XMG Neo 16 (Early 24) | |
| Lenovo Legion Pro 7 16IRX9H | |
| Asus ROG Strix Scar 16 G634JZR | |
| Acer Predator Helios 16 PH16-72 | |
| Average of class Gaming (331 - 2223, n=59, last 2 years) | |
| HP Omen 16 (2024) | |
| Cinebench 2024 / CPU Single Core | |
| Asus ROG Strix G16 G615 | |
| Average Intel Core Ultra 9 275HX (130.7 - 138, n=4) | |
| Lenovo Legion Pro 7i 16 Gen 10 | |
| SCHENKER XMG Neo 16 (Early 24) | |
| Lenovo Legion Pro 7 16IRX9H | |
| HP Omen 16 (2024) | |
| Asus ROG Strix Scar 16 G634JZR | |
| Acer Predator Helios 16 PH16-72 | |
| Average of class Gaming (68.2 - 138, n=60, last 2 years) | |
| Cinebench R23 / Multi Core | |
| Lenovo Legion Pro 7i 16 Gen 10 | |
| SCHENKER XMG Neo 16 (Early 24) | |
| Average Intel Core Ultra 9 275HX (33449 - 39001, n=7) | |
| Asus ROG Strix G16 G615 | |
| Lenovo Legion Pro 7 16IRX9H | |
| Asus ROG Strix Scar 16 G634JZR | |
| Acer Predator Helios 16 PH16-72 | |
| HP Omen 16 (2024) | |
| Average of class Gaming (5668 - 39652, n=148, last 2 years) | |
| Cinebench R23 / Single Core | |
| SCHENKER XMG Neo 16 (Early 24) | |
| Lenovo Legion Pro 7 16IRX9H | |
| HP Omen 16 (2024) | |
| Lenovo Legion Pro 7i 16 Gen 10 | |
| Asus ROG Strix Scar 16 G634JZR | |
| Asus ROG Strix G16 G615 | |
| Average Intel Core Ultra 9 275HX (2126 - 2252, n=7) | |
| Acer Predator Helios 16 PH16-72 | |
| Average of class Gaming (1136 - 2252, n=148, last 2 years) | |
| Cinebench R20 / CPU (Multi Core) | |
| Lenovo Legion Pro 7i 16 Gen 10 | |
| Average Intel Core Ultra 9 275HX (13178 - 15517, n=7) | |
| Asus ROG Strix G16 G615 | |
| SCHENKER XMG Neo 16 (Early 24) | |
| Lenovo Legion Pro 7 16IRX9H | |
| Asus ROG Strix Scar 16 G634JZR | |
| Acer Predator Helios 16 PH16-72 | |
| HP Omen 16 (2024) | |
| Average of class Gaming (2179 - 15517, n=148, last 2 years) | |
| Cinebench R20 / CPU (Single Core) | |
| Asus ROG Strix G16 G615 | |
| HP Omen 16 (2024) | |
| SCHENKER XMG Neo 16 (Early 24) | |
| Average Intel Core Ultra 9 275HX (811 - 866, n=7) | |
| Asus ROG Strix Scar 16 G634JZR | |
| Lenovo Legion Pro 7 16IRX9H | |
| Lenovo Legion Pro 7i 16 Gen 10 | |
| Acer Predator Helios 16 PH16-72 | |
| Average of class Gaming (439 - 866, n=148, last 2 years) | |
| Cinebench R15 / CPU Multi 64Bit | |
| Asus ROG Strix G16 G615 | |
| Lenovo Legion Pro 7i 16 Gen 10 | |
| Average Intel Core Ultra 9 275HX (5044 - 6060, n=7) | |
| SCHENKER XMG Neo 16 (Early 24) | |
| Asus ROG Strix Scar 16 G634JZR | |
| Lenovo Legion Pro 7 16IRX9H | |
| Acer Predator Helios 16 PH16-72 | |
| HP Omen 16 (2024) | |
| Average of class Gaming (1537 - 6074, n=151, last 2 years) | |
| Cinebench R15 / CPU Single 64Bit | |
| Asus ROG Strix G16 G615 | |
| Lenovo Legion Pro 7i 16 Gen 10 | |
| Average Intel Core Ultra 9 275HX (317 - 343, n=7) | |
| Asus ROG Strix Scar 16 G634JZR | |
| Lenovo Legion Pro 7 16IRX9H | |
| HP Omen 16 (2024) | |
| SCHENKER XMG Neo 16 (Early 24) | |
| Acer Predator Helios 16 PH16-72 | |
| Average of class Gaming (191.9 - 343, n=148, last 2 years) | |
| Blender / v2.79 BMW27 CPU | |
| Average of class Gaming (81 - 517, n=142, last 2 years) | |
| HP Omen 16 (2024) | |
| Acer Predator Helios 16 PH16-72 | |
| Asus ROG Strix Scar 16 G634JZR | |
| Lenovo Legion Pro 7 16IRX9H | |
| SCHENKER XMG Neo 16 (Early 24) | |
| Average Intel Core Ultra 9 275HX (86 - 102, n=7) | |
| Lenovo Legion Pro 7i 16 Gen 10 | |
| Asus ROG Strix G16 G615 | |
| 7-Zip 18.03 / 7z b 4 | |
| SCHENKER XMG Neo 16 (Early 24) | |
| Lenovo Legion Pro 7 16IRX9H | |
| Asus ROG Strix Scar 16 G634JZR | |
| Asus ROG Strix G16 G615 | |
| Lenovo Legion Pro 7i 16 Gen 10 | |
| Average Intel Core Ultra 9 275HX (104686 - 122818, n=7) | |
| Acer Predator Helios 16 PH16-72 | |
| HP Omen 16 (2024) | |
| Average of class Gaming (23795 - 144064, n=146, last 2 years) | |
| 7-Zip 18.03 / 7z b 4 -mmt1 | |
| Asus ROG Strix Scar 16 G634JZR | |
| SCHENKER XMG Neo 16 (Early 24) | |
| Lenovo Legion Pro 7 16IRX9H | |
| HP Omen 16 (2024) | |
| Asus ROG Strix G16 G615 | |
| Acer Predator Helios 16 PH16-72 | |
| Average Intel Core Ultra 9 275HX (6186 - 7036, n=7) | |
| Lenovo Legion Pro 7i 16 Gen 10 | |
| Average of class Gaming (4199 - 7573, n=146, last 2 years) | |
| Geekbench 6.4 / Multi-Core | |
| Asus ROG Strix G16 G615 | |
| SCHENKER XMG Neo 16 (Early 24) | |
| Average Intel Core Ultra 9 275HX (16033 - 21668, n=8) | |
| Lenovo Legion Pro 7i 16 Gen 10 | |
| Asus ROG Strix Scar 16 G634JZR | |
| Lenovo Legion Pro 7 16IRX9H | |
| Acer Predator Helios 16 PH16-72 | |
| HP Omen 16 (2024) | |
| Average of class Gaming (5340 - 21668, n=124, last 2 years) | |
| Geekbench 6.4 / Single-Core | |
| SCHENKER XMG Neo 16 (Early 24) | |
| HP Omen 16 (2024) | |
| Lenovo Legion Pro 7i 16 Gen 10 | |
| Average Intel Core Ultra 9 275HX (2917 - 3158, n=8) | |
| Lenovo Legion Pro 7 16IRX9H | |
| Asus ROG Strix Scar 16 G634JZR | |
| Asus ROG Strix G16 G615 | |
| Acer Predator Helios 16 PH16-72 | |
| Average of class Gaming (1490 - 3219, n=124, last 2 years) | |
| Geekbench 5.5 / Multi-Core | |
| Asus ROG Strix G16 G615 | |
| Average Intel Core Ultra 9 275HX (21195 - 25855, n=7) | |
| SCHENKER XMG Neo 16 (Early 24) | |
| Lenovo Legion Pro 7i 16 Gen 10 | |
| Asus ROG Strix Scar 16 G634JZR | |
| Acer Predator Helios 16 PH16-72 | |
| Lenovo Legion Pro 7 16IRX9H | |
| HP Omen 16 (2024) | |
| Average of class Gaming (4557 - 25855, n=145, last 2 years) | |
| Geekbench 5.5 / Single-Core | |
| Asus ROG Strix Scar 16 G634JZR | |
| Lenovo Legion Pro 7i 16 Gen 10 | |
| SCHENKER XMG Neo 16 (Early 24) | |
| Average Intel Core Ultra 9 275HX (2034 - 2292, n=7) | |
| Asus ROG Strix G16 G615 | |
| HP Omen 16 (2024) | |
| Lenovo Legion Pro 7 16IRX9H | |
| Acer Predator Helios 16 PH16-72 | |
| Average of class Gaming (986 - 2423, n=145, last 2 years) | |
| HWBOT x265 Benchmark v2.2 / 4k Preset | |
| Asus ROG Strix G16 G615 | |
| Lenovo Legion Pro 7i 16 Gen 10 | |
| Average Intel Core Ultra 9 275HX (35 - 41.2, n=7) | |
| SCHENKER XMG Neo 16 (Early 24) | |
| Lenovo Legion Pro 7 16IRX9H | |
| Asus ROG Strix Scar 16 G634JZR | |
| Acer Predator Helios 16 PH16-72 | |
| Average of class Gaming (7.7 - 42.9, n=146, last 2 years) | |
| HP Omen 16 (2024) | |
| LibreOffice / 20 Documents To PDF | |
| Average Intel Core Ultra 9 275HX (36.9 - 88, n=7) | |
| Asus ROG Strix Scar 16 G634JZR | |
| Average of class Gaming (19 - 96.6, n=144, last 2 years) | |
| HP Omen 16 (2024) | |
| Asus ROG Strix G16 G615 | |
| Lenovo Legion Pro 7i 16 Gen 10 | |
| Lenovo Legion Pro 7 16IRX9H | |
| SCHENKER XMG Neo 16 (Early 24) | |
| Acer Predator Helios 16 PH16-72 | |
| R Benchmark 2.5 / Overall mean | |
| Average of class Gaming (0.3609 - 0.759, n=147, last 2 years) | |
| Average Intel Core Ultra 9 275HX (0.3943 - 0.4568, n=7) | |
| Lenovo Legion Pro 7i 16 Gen 10 | |
| Asus ROG Strix G16 G615 | |
| Lenovo Legion Pro 7 16IRX9H | |
| Acer Predator Helios 16 PH16-72 | |
| HP Omen 16 (2024) | |
| Asus ROG Strix Scar 16 G634JZR | |
| SCHENKER XMG Neo 16 (Early 24) | |
* ... smaller is better
AIDA64: FP32 Ray-Trace | FPU Julia | CPU SHA3 | CPU Queen | FPU SinJulia | FPU Mandel | CPU AES | CPU ZLib | FP64 Ray-Trace | CPU PhotoWorxx
| Performance Rating | |
| Asus ROG Strix G16 G615 | |
| Lenovo Legion Pro 7i 16 Gen 10 | |
| Average Intel Core Ultra 9 275HX | |
| SCHENKER XMG Neo 16 (Early 24) | |
| Asus ROG Strix Scar 16 G634JZR | |
| Lenovo Legion Pro 7 16IRX9H | |
| Acer Predator Helios 16 PH16-72 | |
| Average of class Gaming | |
| HP Omen 16 (2024) | |
| AIDA64 / FP32 Ray-Trace | |
| Asus ROG Strix G16 G615 | |
| Average Intel Core Ultra 9 275HX (32615 - 39551, n=7) | |
| Lenovo Legion Pro 7i 16 Gen 10 | |
| SCHENKER XMG Neo 16 (Early 24) | |
| Lenovo Legion Pro 7 16IRX9H | |
| Asus ROG Strix Scar 16 G634JZR | |
| Acer Predator Helios 16 PH16-72 | |
| Average of class Gaming (7192 - 81639, n=146, last 2 years) | |
| HP Omen 16 (2024) | |
| AIDA64 / FPU Julia | |
| Asus ROG Strix G16 G615 | |
| Average Intel Core Ultra 9 275HX (166245 - 194867, n=7) | |
| Lenovo Legion Pro 7i 16 Gen 10 | |
| SCHENKER XMG Neo 16 (Early 24) | |
| Lenovo Legion Pro 7 16IRX9H | |
| Asus ROG Strix Scar 16 G634JZR | |
| Acer Predator Helios 16 PH16-72 | |
| Average of class Gaming (35040 - 252486, n=146, last 2 years) | |
| HP Omen 16 (2024) | |
| AIDA64 / CPU SHA3 | |
| Asus ROG Strix G16 G615 | |
| Average Intel Core Ultra 9 275HX (7829 - 9482, n=7) | |
| Lenovo Legion Pro 7i 16 Gen 10 | |
| SCHENKER XMG Neo 16 (Early 24) | |
| Lenovo Legion Pro 7 16IRX9H | |
| Asus ROG Strix Scar 16 G634JZR | |
| Acer Predator Helios 16 PH16-72 | |
| Average of class Gaming (1728 - 10389, n=146, last 2 years) | |
| HP Omen 16 (2024) | |
| AIDA64 / CPU Queen | |
| SCHENKER XMG Neo 16 (Early 24) | |
| Asus ROG Strix Scar 16 G634JZR | |
| Lenovo Legion Pro 7 16IRX9H | |
| Acer Predator Helios 16 PH16-72 | |
| Asus ROG Strix G16 G615 | |
| Lenovo Legion Pro 7i 16 Gen 10 | |
| Average Intel Core Ultra 9 275HX (125013 - 139608, n=7) | |
| HP Omen 16 (2024) | |
| Average of class Gaming (50699 - 200651, n=146, last 2 years) | |
| AIDA64 / FPU SinJulia | |
| SCHENKER XMG Neo 16 (Early 24) | |
| Lenovo Legion Pro 7 16IRX9H | |
| Asus ROG Strix Scar 16 G634JZR | |
| Acer Predator Helios 16 PH16-72 | |
| Lenovo Legion Pro 7i 16 Gen 10 | |
| Asus ROG Strix G16 G615 | |
| Average Intel Core Ultra 9 275HX (12272 - 14112, n=7) | |
| Average of class Gaming (5020 - 32988, n=146, last 2 years) | |
| HP Omen 16 (2024) | |
| AIDA64 / FPU Mandel | |
| Asus ROG Strix G16 G615 | |
| Average Intel Core Ultra 9 275HX (87156 - 104057, n=7) | |
| Lenovo Legion Pro 7i 16 Gen 10 | |
| SCHENKER XMG Neo 16 (Early 24) | |
| Lenovo Legion Pro 7 16IRX9H | |
| Asus ROG Strix Scar 16 G634JZR | |
| Acer Predator Helios 16 PH16-72 | |
| Average of class Gaming (17585 - 134044, n=146, last 2 years) | |
| HP Omen 16 (2024) | |
| AIDA64 / CPU AES | |
| Asus ROG Strix Scar 16 G634JZR | |
| SCHENKER XMG Neo 16 (Early 24) | |
| Lenovo Legion Pro 7 16IRX9H | |
| Asus ROG Strix G16 G615 | |
| Lenovo Legion Pro 7i 16 Gen 10 | |
| Average Intel Core Ultra 9 275HX (118108 - 134920, n=7) | |
| Acer Predator Helios 16 PH16-72 | |
| Average of class Gaming (19065 - 328679, n=146, last 2 years) | |
| HP Omen 16 (2024) | |
| AIDA64 / CPU ZLib | |
| SCHENKER XMG Neo 16 (Early 24) | |
| Asus ROG Strix G16 G615 | |
| Lenovo Legion Pro 7 16IRX9H | |
| Average Intel Core Ultra 9 275HX (1896 - 2220, n=7) | |
| Lenovo Legion Pro 7i 16 Gen 10 | |
| Asus ROG Strix Scar 16 G634JZR | |
| Acer Predator Helios 16 PH16-72 | |
| Average of class Gaming (373 - 2531, n=146, last 2 years) | |
| HP Omen 16 (2024) | |
| AIDA64 / FP64 Ray-Trace | |
| Asus ROG Strix G16 G615 | |
| Average Intel Core Ultra 9 275HX (17631 - 21372, n=7) | |
| Lenovo Legion Pro 7i 16 Gen 10 | |
| SCHENKER XMG Neo 16 (Early 24) | |
| Lenovo Legion Pro 7 16IRX9H | |
| Asus ROG Strix Scar 16 G634JZR | |
| Acer Predator Helios 16 PH16-72 | |
| Average of class Gaming (3856 - 43430, n=146, last 2 years) | |
| HP Omen 16 (2024) | |
| AIDA64 / CPU PhotoWorxx | |
| Lenovo Legion Pro 7i 16 Gen 10 | |
| Average Intel Core Ultra 9 275HX (47726 - 56613, n=7) | |
| Asus ROG Strix Scar 16 G634JZR | |
| HP Omen 16 (2024) | |
| SCHENKER XMG Neo 16 (Early 24) | |
| Acer Predator Helios 16 PH16-72 | |
| Lenovo Legion Pro 7 16IRX9H | |
| Asus ROG Strix G16 G615 | |
| Average of class Gaming (10805 - 60161, n=146, last 2 years) | |
系统性能
系统性能非常出色,尽管所有竞争对手的性能都非常相似。在我们的测试中,系统稳定性没有任何问题,笔记本电脑的反应始终非常灵敏。在图形切换过程中,会有短暂的等待(例如在启动游戏时),但这是正常现象。
CrossMark: Overall | Productivity | Creativity | Responsiveness
WebXPRT 3: Overall
WebXPRT 4: Overall
Mozilla Kraken 1.1: Total
| PCMark 10 / Score | |
| Lenovo Legion Pro 7i 16 Gen 10 | |
| Acer Predator Helios 16 PH16-72 | |
| SCHENKER XMG Neo 16 (Early 24) | |
| Average Intel Core Ultra 9 275HX, Nvidia GeForce RTX 5080 Laptop (8856 - 9153, n=2) | |
| Lenovo Legion Pro 7 16IRX9H | |
| HP Omen 16 (2024) | |
| Asus ROG Strix G16 G615 | |
| Average of class Gaming (5776 - 9852, n=131, last 2 years) | |
| Asus ROG Strix Scar 16 G634JZR | |
| PCMark 10 / Essentials | |
| Acer Predator Helios 16 PH16-72 | |
| Lenovo Legion Pro 7 16IRX9H | |
| Asus ROG Strix Scar 16 G634JZR | |
| HP Omen 16 (2024) | |
| Lenovo Legion Pro 7i 16 Gen 10 | |
| Average Intel Core Ultra 9 275HX, Nvidia GeForce RTX 5080 Laptop (11177 - 11215, n=2) | |
| Asus ROG Strix G16 G615 | |
| SCHENKER XMG Neo 16 (Early 24) | |
| Average of class Gaming (9057 - 12600, n=131, last 2 years) | |
| PCMark 10 / Productivity | |
| SCHENKER XMG Neo 16 (Early 24) | |
| HP Omen 16 (2024) | |
| Lenovo Legion Pro 7 16IRX9H | |
| Acer Predator Helios 16 PH16-72 | |
| Average of class Gaming (6662 - 14612, n=131, last 2 years) | |
| Lenovo Legion Pro 7i 16 Gen 10 | |
| Average Intel Core Ultra 9 275HX, Nvidia GeForce RTX 5080 Laptop (9212 - 9590, n=2) | |
| Asus ROG Strix G16 G615 | |
| Asus ROG Strix Scar 16 G634JZR | |
| PCMark 10 / Digital Content Creation | |
| Lenovo Legion Pro 7i 16 Gen 10 | |
| Average Intel Core Ultra 9 275HX, Nvidia GeForce RTX 5080 Laptop (18305 - 19351, n=2) | |
| Asus ROG Strix G16 G615 | |
| Asus ROG Strix Scar 16 G634JZR | |
| SCHENKER XMG Neo 16 (Early 24) | |
| HP Omen 16 (2024) | |
| Acer Predator Helios 16 PH16-72 | |
| Lenovo Legion Pro 7 16IRX9H | |
| Average of class Gaming (6807 - 19351, n=131, last 2 years) | |
| CrossMark / Overall | |
| SCHENKER XMG Neo 16 (Early 24) | |
| Lenovo Legion Pro 7 16IRX9H | |
| HP Omen 16 (2024) | |
| Acer Predator Helios 16 PH16-72 | |
| Asus ROG Strix G16 G615 | |
| Average Intel Core Ultra 9 275HX, Nvidia GeForce RTX 5080 Laptop (2017 - 2165, n=2) | |
| Asus ROG Strix Scar 16 G634JZR | |
| Lenovo Legion Pro 7i 16 Gen 10 | |
| Average of class Gaming (1247 - 2344, n=111, last 2 years) | |
| CrossMark / Productivity | |
| Lenovo Legion Pro 7 16IRX9H | |
| SCHENKER XMG Neo 16 (Early 24) | |
| HP Omen 16 (2024) | |
| Acer Predator Helios 16 PH16-72 | |
| Asus ROG Strix G16 G615 | |
| Average Intel Core Ultra 9 275HX, Nvidia GeForce RTX 5080 Laptop (1922 - 2014, n=2) | |
| Lenovo Legion Pro 7i 16 Gen 10 | |
| Asus ROG Strix Scar 16 G634JZR | |
| Average of class Gaming (1299 - 2204, n=111, last 2 years) | |
| CrossMark / Creativity | |
| SCHENKER XMG Neo 16 (Early 24) | |
| Lenovo Legion Pro 7 16IRX9H | |
| Asus ROG Strix G16 G615 | |
| Acer Predator Helios 16 PH16-72 | |
| Average Intel Core Ultra 9 275HX, Nvidia GeForce RTX 5080 Laptop (2288 - 2451, n=2) | |
| HP Omen 16 (2024) | |
| Asus ROG Strix Scar 16 G634JZR | |
| Lenovo Legion Pro 7i 16 Gen 10 | |
| Average of class Gaming (1275 - 2660, n=111, last 2 years) | |
| CrossMark / Responsiveness | |
| Lenovo Legion Pro 7 16IRX9H | |
| HP Omen 16 (2024) | |
| SCHENKER XMG Neo 16 (Early 24) | |
| Acer Predator Helios 16 PH16-72 | |
| Asus ROG Strix G16 G615 | |
| Asus ROG Strix Scar 16 G634JZR | |
| Average Intel Core Ultra 9 275HX, Nvidia GeForce RTX 5080 Laptop (1597 - 1853, n=2) | |
| Average of class Gaming (1030 - 2330, n=111, last 2 years) | |
| Lenovo Legion Pro 7i 16 Gen 10 | |
| WebXPRT 3 / Overall | |
| Lenovo Legion Pro 7i 16 Gen 10 | |
| Average Intel Core Ultra 9 275HX, Nvidia GeForce RTX 5080 Laptop (347 - 359, n=2) | |
| Asus ROG Strix G16 G615 | |
| Lenovo Legion Pro 7 16IRX9H | |
| SCHENKER XMG Neo 16 (Early 24) | |
| Acer Predator Helios 16 PH16-72 | |
| HP Omen 16 (2024) | |
| Asus ROG Strix Scar 16 G634JZR | |
| Average of class Gaming (215 - 480, n=126, last 2 years) | |
| WebXPRT 4 / Overall | |
| Asus ROG Strix G16 G615 | |
| Average Intel Core Ultra 9 275HX, Nvidia GeForce RTX 5080 Laptop (333 - 336, n=2) | |
| Lenovo Legion Pro 7i 16 Gen 10 | |
| Lenovo Legion Pro 7 16IRX9H | |
| HP Omen 16 (2024) | |
| Asus ROG Strix Scar 16 G634JZR | |
| SCHENKER XMG Neo 16 (Early 24) | |
| Acer Predator Helios 16 PH16-72 | |
| Average of class Gaming (176.4 - 336, n=111, last 2 years) | |
| Mozilla Kraken 1.1 / Total | |
| Average of class Gaming (405 - 674, n=139, last 2 years) | |
| Asus ROG Strix Scar 16 G634JZR | |
| Acer Predator Helios 16 PH16-72 | |
| Lenovo Legion Pro 7 16IRX9H | |
| HP Omen 16 (2024) | |
| SCHENKER XMG Neo 16 (Early 24) | |
| Lenovo Legion Pro 7i 16 Gen 10 | |
| Average Intel Core Ultra 9 275HX, Nvidia GeForce RTX 5080 Laptop (405 - 408, n=2) | |
| Asus ROG Strix G16 G615 | |
* ... smaller is better
| PCMark 10 Score | 8856 points | |
Help | ||
| AIDA64 / Memory Copy | |
| Asus ROG Strix G16 G615 | |
| Lenovo Legion Pro 7i 16 Gen 10 | |
| Average Intel Core Ultra 9 275HX (74558 - 86549, n=7) | |
| HP Omen 16 (2024) | |
| Acer Predator Helios 16 PH16-72 | |
| SCHENKER XMG Neo 16 (Early 24) | |
| Asus ROG Strix Scar 16 G634JZR | |
| Lenovo Legion Pro 7 16IRX9H | |
| Average of class Gaming (21750 - 97515, n=146, last 2 years) | |
| AIDA64 / Memory Read | |
| Lenovo Legion Pro 7i 16 Gen 10 | |
| Asus ROG Strix Scar 16 G634JZR | |
| SCHENKER XMG Neo 16 (Early 24) | |
| HP Omen 16 (2024) | |
| Lenovo Legion Pro 7 16IRX9H | |
| Acer Predator Helios 16 PH16-72 | |
| Average Intel Core Ultra 9 275HX (74094 - 95542, n=7) | |
| Asus ROG Strix G16 G615 | |
| Average of class Gaming (22956 - 102937, n=146, last 2 years) | |
| AIDA64 / Memory Write | |
| Lenovo Legion Pro 7i 16 Gen 10 | |
| Average Intel Core Ultra 9 275HX (72929 - 84581, n=7) | |
| HP Omen 16 (2024) | |
| SCHENKER XMG Neo 16 (Early 24) | |
| Asus ROG Strix Scar 16 G634JZR | |
| Acer Predator Helios 16 PH16-72 | |
| Asus ROG Strix G16 G615 | |
| Lenovo Legion Pro 7 16IRX9H | |
| Average of class Gaming (22297 - 108954, n=146, last 2 years) | |
| AIDA64 / Memory Latency | |
| Average Intel Core Ultra 9 275HX (108.9 - 125.1, n=7) | |
| Asus ROG Strix G16 G615 | |
| Lenovo Legion Pro 7i 16 Gen 10 | |
| Average of class Gaming (59.5 - 259, n=146, last 2 years) | |
| HP Omen 16 (2024) | |
| Acer Predator Helios 16 PH16-72 | |
| Asus ROG Strix Scar 16 G634JZR | |
| Lenovo Legion Pro 7 16IRX9H | |
| SCHENKER XMG Neo 16 (Early 24) | |
* ... smaller is better
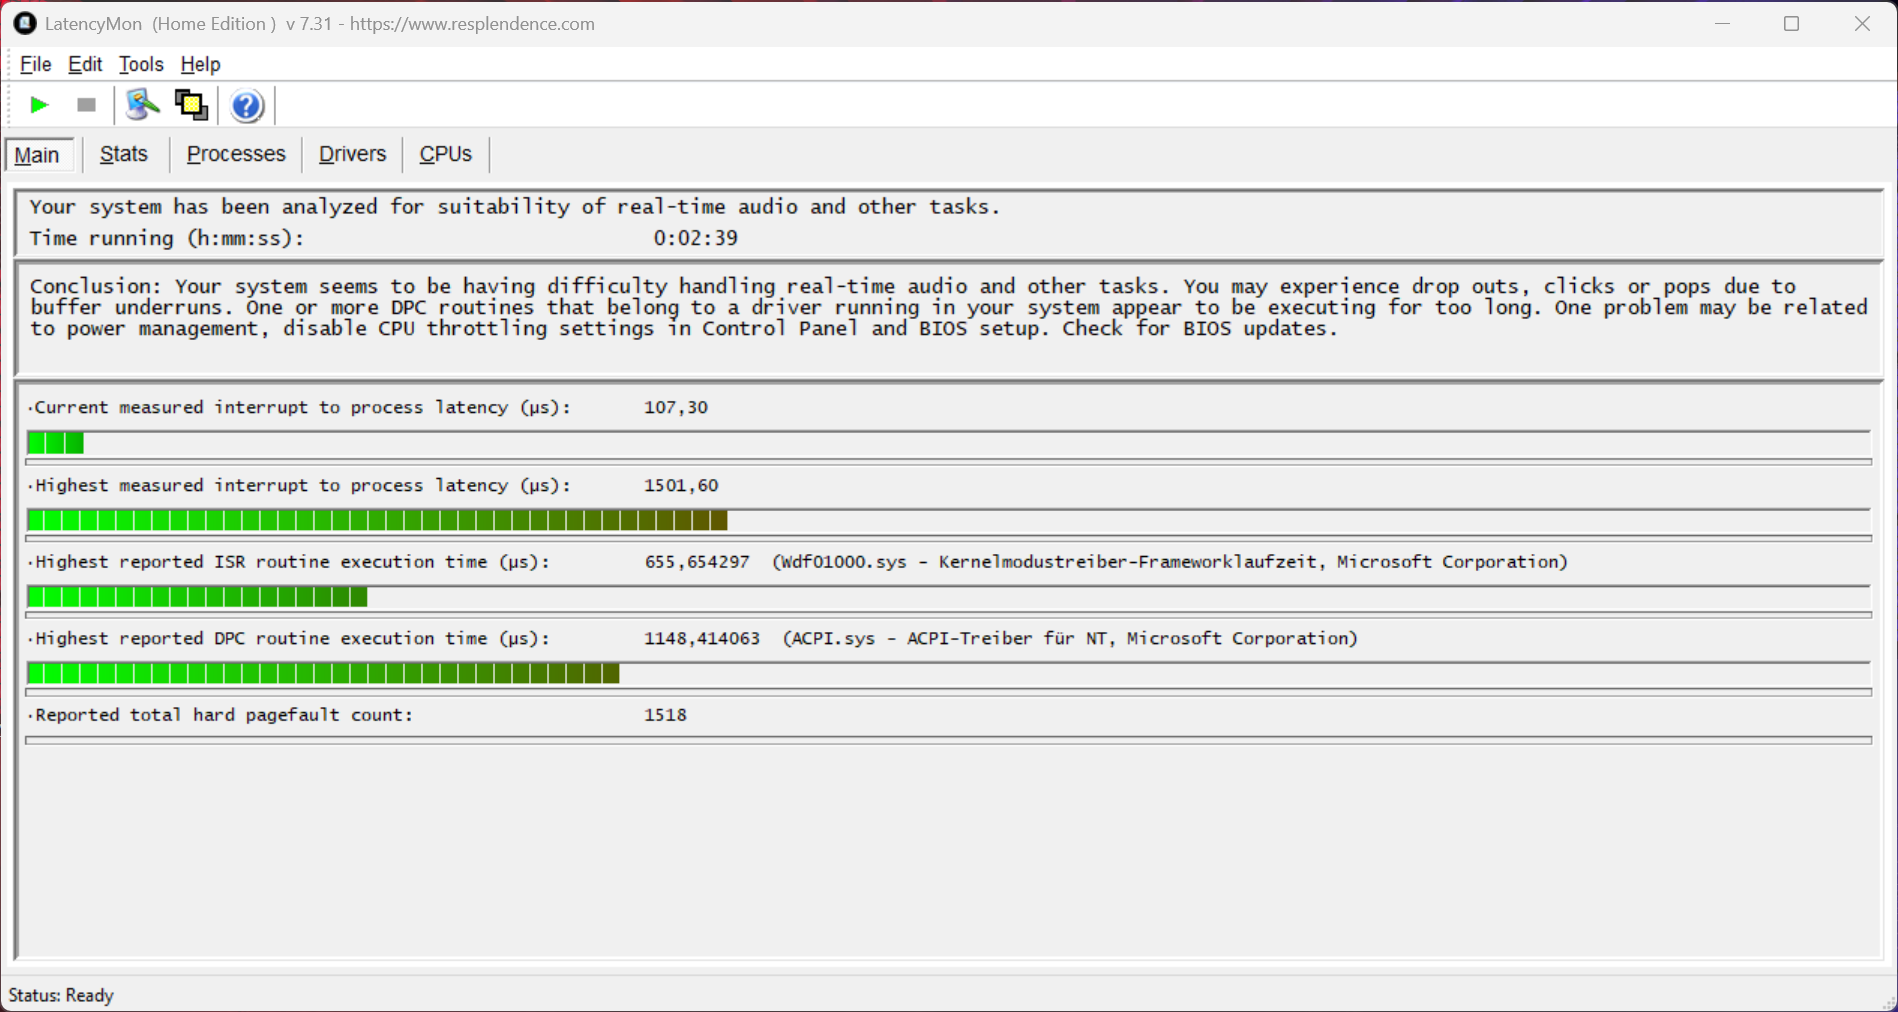
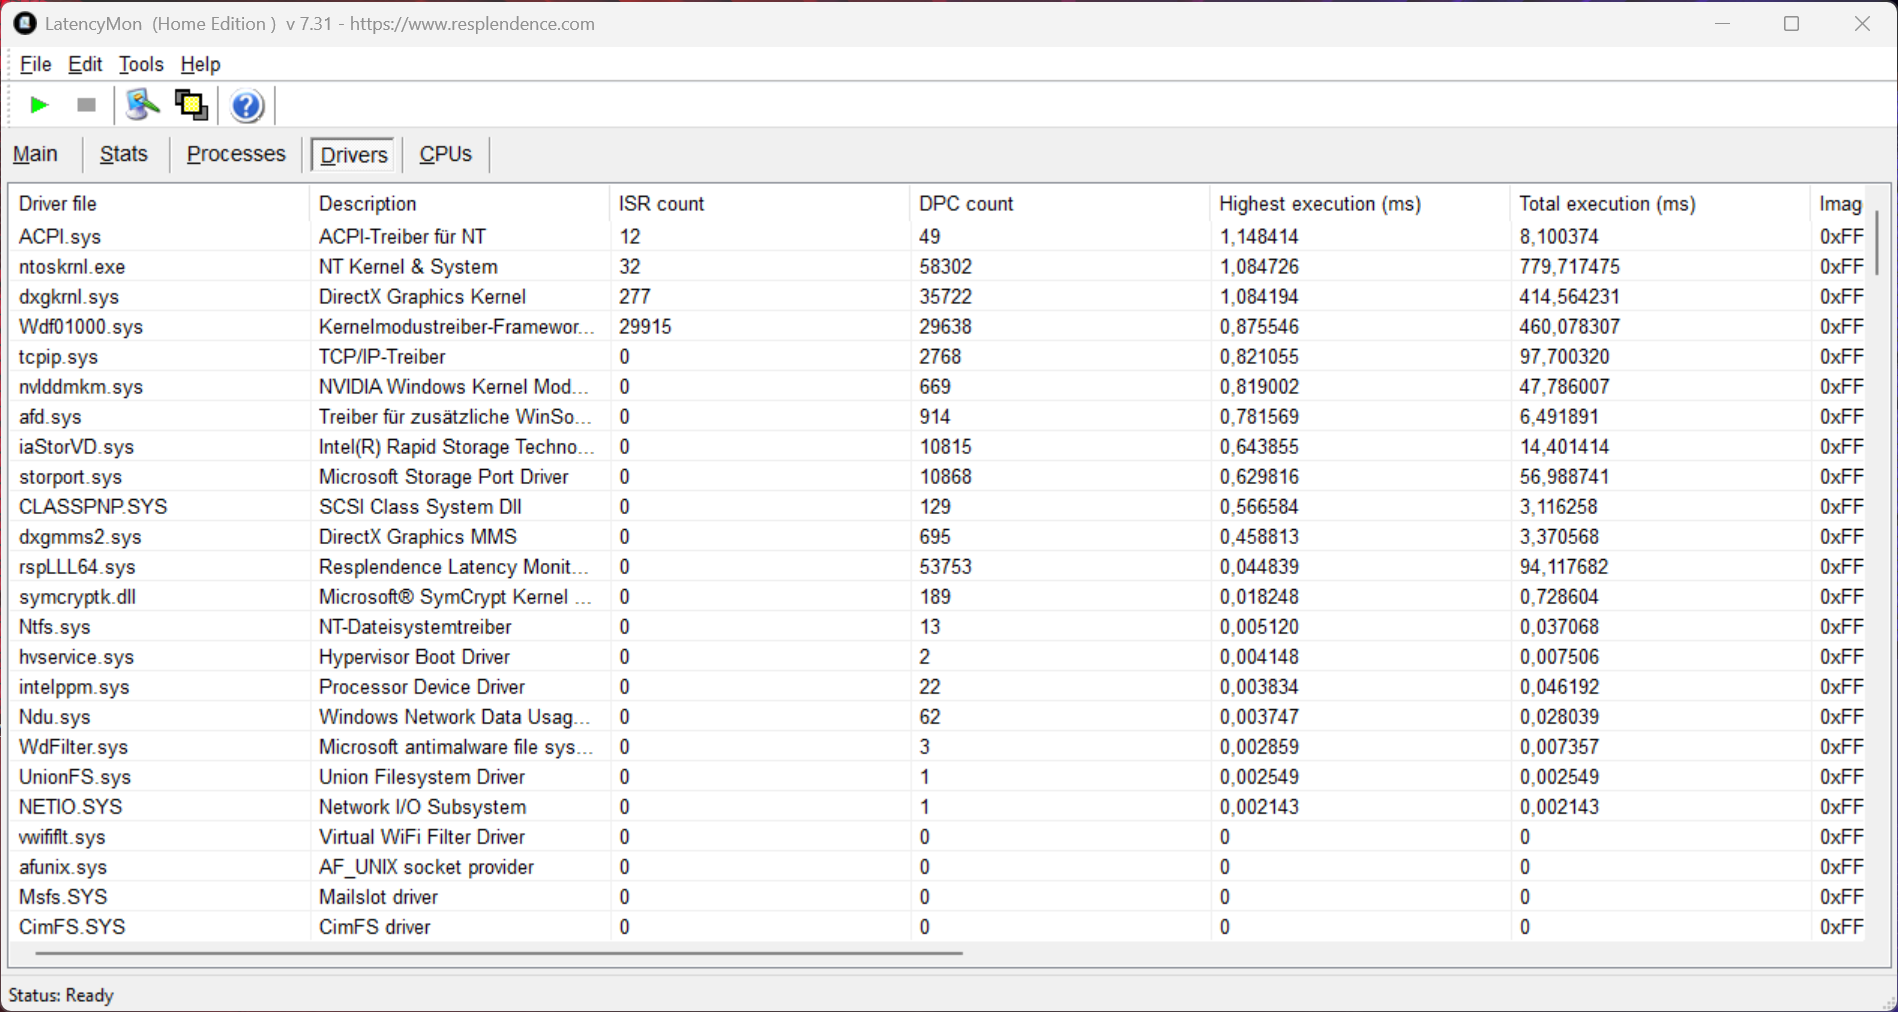
DPC 延迟
在我们的标准化延迟测试(上网、播放 4K YouTube 视频、CPU 负载)中,我们的测试设备在使用实时音频应用程序时,其当前 BIOS 版本显示出一些轻微的限制。
| DPC Latencies / LatencyMon - interrupt to process latency (max), Web, Youtube, Prime95 | |
| Asus ROG Strix Scar 16 G634JZR | |
| SCHENKER XMG Neo 16 (Early 24) | |
| Acer Predator Helios 16 PH16-72 | |
| Asus ROG Strix G16 G615 | |
| Lenovo Legion Pro 7 16IRX9H | |
| HP Omen 16 (2024) | |
| Lenovo Legion Pro 7i 16 Gen 10 | |
* ... smaller is better
存储设备
我们的测试设备使用的是美光 2500 的 1 TB 版本,初始运行后用户仍可使用 840 GB。PCIe 4.0 固态硬盘的性能非常出色和稳定。有了第二个 M.2-2280 插槽,扩展存储空间就不成问题了,而且价格低廉。Strix G16 不支持 PCIe 5.0。

* ... smaller is better
Constant Read Performance: DiskSpd Read Loop, Queue Depth 8
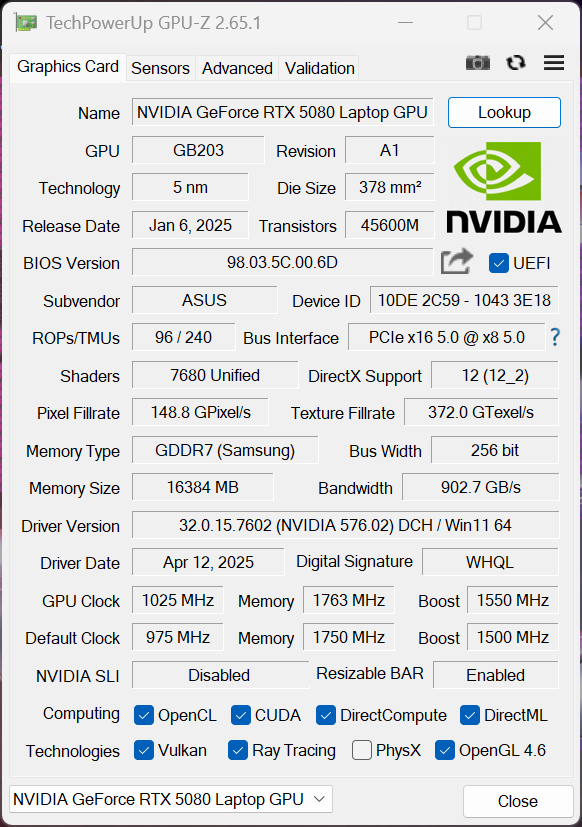
图形卡
我们测试的 Strix G16 配备了新的 GeForce RTX 5080 笔记本电脑(16GB VRAM),这里使用的是最大 TGP 为 175 瓦的最快版本(150 瓦 + 25 瓦 Dynamic Boost)。在合成基准测试中,结果略有不同,我们已经看到新的 5080 笔记本电脑取得了更好的成绩,尽管旧的 RTX 4080 笔记本电脑ROG Strix SCAR 16 中的旧版 RTX 4080 笔记本电脑仍被超越。不过,从新款 4080 笔记本电脑升级到 4090 笔记本电脑意义不大。另一方面,与旧的 3080 Ti 笔记本电脑的优势是显而易见的。在持续负载情况下,GPU 性能保持完全稳定。
| 3DMark 11 Performance | 45056 points | |
| 3DMark Fire Strike Score | 36371 points | |
| 3DMark Time Spy Score | 20753 points | |
| 3DMark Steel Nomad Score | 5156 points | |
| 3DMark Steel Nomad Light Score | 22259 points | |
| 3DMark Steel Nomad Light Unlimited Score | 21869 points | |
Help | ||
| Blender / v3.3 Classroom OPTIX/RTX | |
| Average of class Gaming (10 - 95, n=140, last 2 years) | |
| Acer Predator Helios 16 PH16-72 | |
| HP Omen 16 (2024) | |
| Lenovo Legion Pro 7 16IRX9H | |
| Asus ROG Strix Scar 16 G634JZR | |
| SCHENKER XMG Neo 16 (Early 24) | |
| Average Nvidia GeForce RTX 5080 Laptop (11.6 - 12, n=2) | |
| Asus ROG Strix G16 G615 | |
| Blender / v3.3 Classroom CUDA | |
| Average of class Gaming (15 - 156, n=142, last 2 years) | |
| HP Omen 16 (2024) | |
| Acer Predator Helios 16 PH16-72 | |
| Asus ROG Strix Scar 16 G634JZR | |
| Lenovo Legion Pro 7 16IRX9H | |
| Asus ROG Strix G16 G615 | |
| Average Nvidia GeForce RTX 5080 Laptop (18 - 20, n=2) | |
| SCHENKER XMG Neo 16 (Early 24) | |
| Blender / v3.3 Classroom CPU | |
| Average of class Gaming (123 - 962, n=147, last 2 years) | |
| HP Omen 16 (2024) | |
| Acer Predator Helios 16 PH16-72 | |
| Asus ROG Strix Scar 16 G634JZR | |
| Lenovo Legion Pro 7 16IRX9H | |
| SCHENKER XMG Neo 16 (Early 24) | |
| Average Nvidia GeForce RTX 5080 Laptop (123 - 148, n=3) | |
| Asus ROG Strix G16 G615 | |
* ... smaller is better
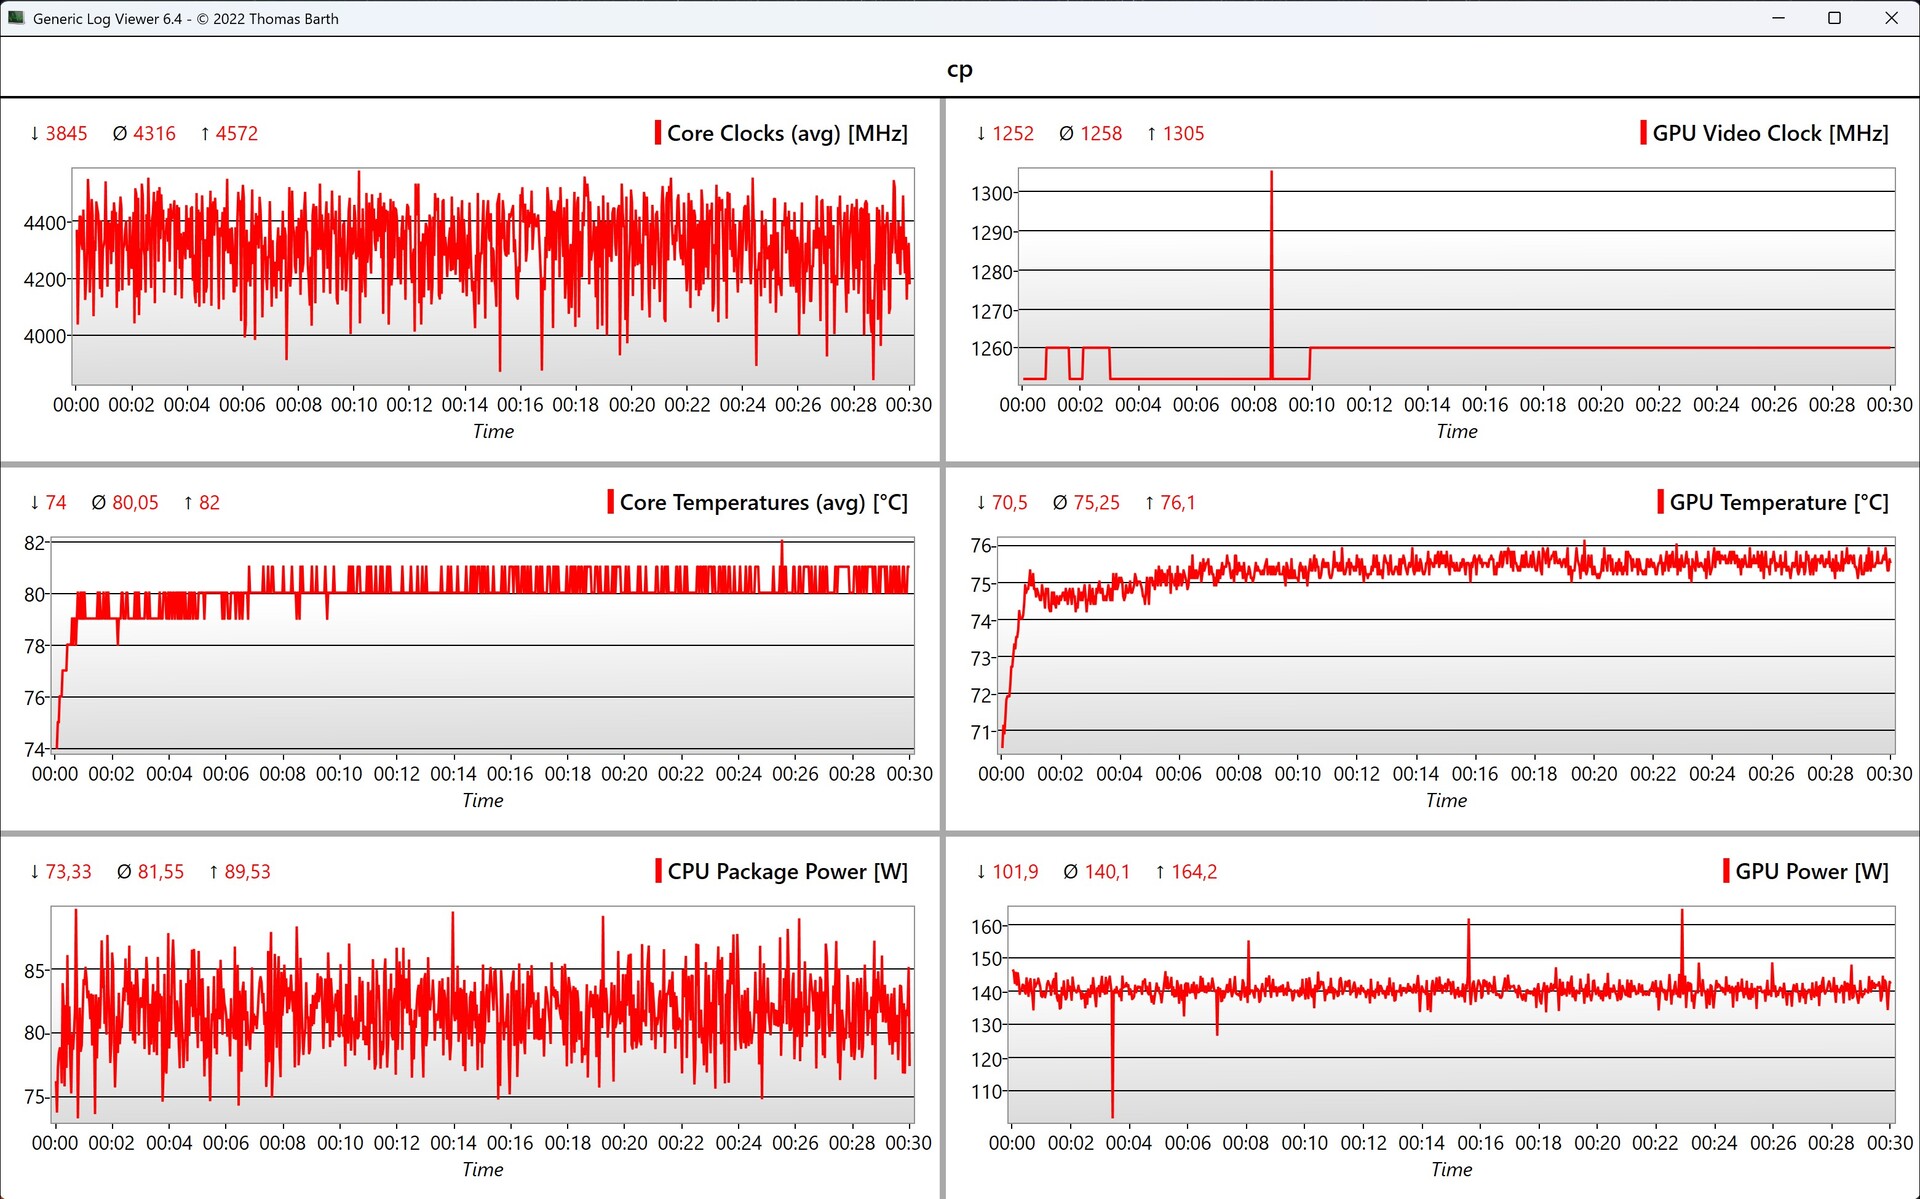
游戏性能
新款 RTX 5080 笔记本电脑的整体游戏性能非常出色,尤其是在原生 WQHD 分辨率下。我们在对新款GeForce GPU 的分析中已经看到,5090 笔记本电脑只有在 4K 分辨率下才能真正展现出其全部实力。在目前的游戏中,游戏性能往往能达到老款 RTX 4090 笔记本电脑的水平,所有现代游戏都能畅玩无阻。但我们也注意到,在核心组件相同的情况下,联想Legion Pro 7i G10 的游戏性能略高一筹。
| Cyberpunk 2077 2.2 Phantom Liberty - 1920x1080 Ultra Preset (FSR off) | |
| Lenovo Legion Pro 7i 16 Gen 10 | |
| SCHENKER XMG Neo 16 A25 5080 Engineering Sample | |
| Asus ROG Strix G16 G615 | |
| SCHENKER XMG Neo 16 (Early 24) | |
| Asus ROG Strix Scar 16 G634JZR | |
| Lenovo Legion Pro 7 16IRX9H | |
| Acer Predator Helios 16 PH16-72 | |
| Average of class Gaming (6.76 - 158, n=93, last 2 years) | |
| HP Omen 16 (2024) | |
| GTA V - 1920x1080 Highest Settings possible AA:4xMSAA + FX AF:16x | |
| SCHENKER XMG Neo 16 A25 5080 Engineering Sample | |
| Asus ROG Strix G16 G615 | |
| SCHENKER XMG Neo 16 (Early 24) | |
| Lenovo Legion Pro 7 16IRX9H | |
| Asus ROG Strix Scar 16 G634JZR | |
| Average of class Gaming (12.1 - 168.2, n=125, last 2 years) | |
| Acer Predator Helios 16 PH16-72 | |
| HP Omen 16 (2024) | |
Cyberpunk 2077 Ultra FPS Chart
但是,如果您想使用包括光线追踪或路径追踪(看起来非常不错)在内的最大细节,即使是 RTX 5080 笔记本电脑也会在不升级的情况下达到极限。下表使用《赛博朋克 2077》和《艾伦觉醒 2》两款游戏清楚地说明了这一点。在支持多帧生成(x4)的游戏中,使用多帧生成可以再次大幅提升性能。
| 设置 | Cyberpunk 2077 Phantom Liberty RT Overdrive |
Alan Wake 2 自定义 (所有高/超高 + PT) |
|---|---|---|
| 原生 | 21.9 FPS | 34.2 FPS |
| DLSS 质量 | 43.1 FPS | 56.9 FPS |
| DLSS 性能 | 63.8 FPS | 75 FPS |
| DLSS 质量 MFG x2 | 77.6 FPS | 98.9 FPS |
| DLSS 质量 MFG x4 | 141.2 FPS | 173.9 FPS |
| low | med. | high | ultra | QHD DLSS | QHD | |
|---|---|---|---|---|---|---|
| GTA V (2015) | 164.1 | 156.2 | ||||
| Dota 2 Reborn (2015) | 228 | 201 | 191.6 | 175.5 | ||
| Final Fantasy XV Benchmark (2018) | 234 | 229 | 189.6 | 149.4 | ||
| X-Plane 11.11 (2018) | 135.7 | 136.3 | 110.6 | |||
| Strange Brigade (2018) | 553 | 406 | 386 | 367 | 283 | |
| Baldur's Gate 3 (2023) | 244.8 | 209.1 | 185.4 | 180.3 | 133.1 | |
| Cyberpunk 2077 2.2 Phantom Liberty (2023) | 187.9 | 180.5 | 160.9 | 144.3 | 110.6 | 99.5 |
| Alan Wake 2 (2023) | 112.6 | 76.5 | ||||
| F1 24 (2024) | 318 | 127.5 | 84.5 | |||
| Assassin's Creed Shadows (2025) | 58 | 60 | 50 |
排放 - 低温
噪音排放
与往常一样,风扇噪音在很大程度上取决于电源配置文件。在静音模式下,Strix G16 给人的印象是非常安静的日常伴侣(在风扇经常关闭的情况下,最大噪音为 36.1 dB(A)),但在游戏时,你肯定需要耳机来开启Turbo模式,因为风扇在空闲运行时几乎总是保持在 30 dB(A)左右。我们的测试设备不会产生任何其他电子噪音。
Noise Level
| Idle |
| 24 / 30.1 / 30.1 dB(A) |
| Load |
| 41.1 / 54.2 dB(A) |
 | ||
30 dB silent 40 dB(A) audible 50 dB(A) loud |
||
min: | ||
| Asus ROG Strix G16 G615 GeForce RTX 5080 Laptop, Ultra 9 275HX, Micron 2500 1TB MTFDKBA1T0QGN | Acer Predator Helios 16 PH16-72 NVIDIA GeForce RTX 4080 Laptop GPU, i9-14900HX, Micron 3400 2TB MTFDKBA2T0TFH | SCHENKER XMG Neo 16 (Early 24) NVIDIA GeForce RTX 4090 Laptop GPU, i9-14900HX, Samsung 990 Pro 1 TB | Asus ROG Strix Scar 16 G634JZR NVIDIA GeForce RTX 4080 Laptop GPU, i9-14900HX, SK hynix PC801 HFS002TEJ9X101N | HP Omen 16 (2024) NVIDIA GeForce RTX 4080 Laptop GPU, i9-14900HX, SK hynix PC801 HFS001TEJ9X101N | Lenovo Legion Pro 7 16IRX9H NVIDIA GeForce RTX 4080 Laptop GPU, i9-14900HX, SK Hynix HFS001TEJ9X115N | Lenovo Legion Pro 7i 16 Gen 10 GeForce RTX 5080 Laptop, Ultra 9 275HX, SK Hynix HFS001TEJ9X115N | |
|---|---|---|---|---|---|---|---|
| Noise | 1% | -9% | -8% | -5% | -13% | 11% | |
| off / environment * | 24 | 26.1 -9% | 26 -8% | 21.07 12% | 25 -4% | 24 -0% | 22.9 5% |
| Idle Minimum * | 24 | 26.1 -9% | 28 -17% | 29.75 -24% | 29 -21% | 25 -4% | 22.9 5% |
| Idle Average * | 30.1 | 29.4 2% | 29 4% | 29.75 1% | 30 -0% | 30 -0% | 22.9 24% |
| Idle Maximum * | 30.1 | 31.9 -6% | 31 -3% | 29.75 1% | 31 -3% | 45 -50% | 26.3 13% |
| Load Average * | 41.1 | 51 -24% | 54.85 -33% | 46 -12% | 50 -22% | 27.8 32% | |
| Cyberpunk 2077 ultra * | 54.2 | 48.2 11% | 54.2 -0% | ||||
| Load Maximum * | 54.2 | 45.6 16% | 56 -3% | 58 -7% | 47 13% | 56 -3% | 53.9 1% |
| Witcher 3 ultra * | 54 | 57.8 | 47 | 54 |
* ... smaller is better
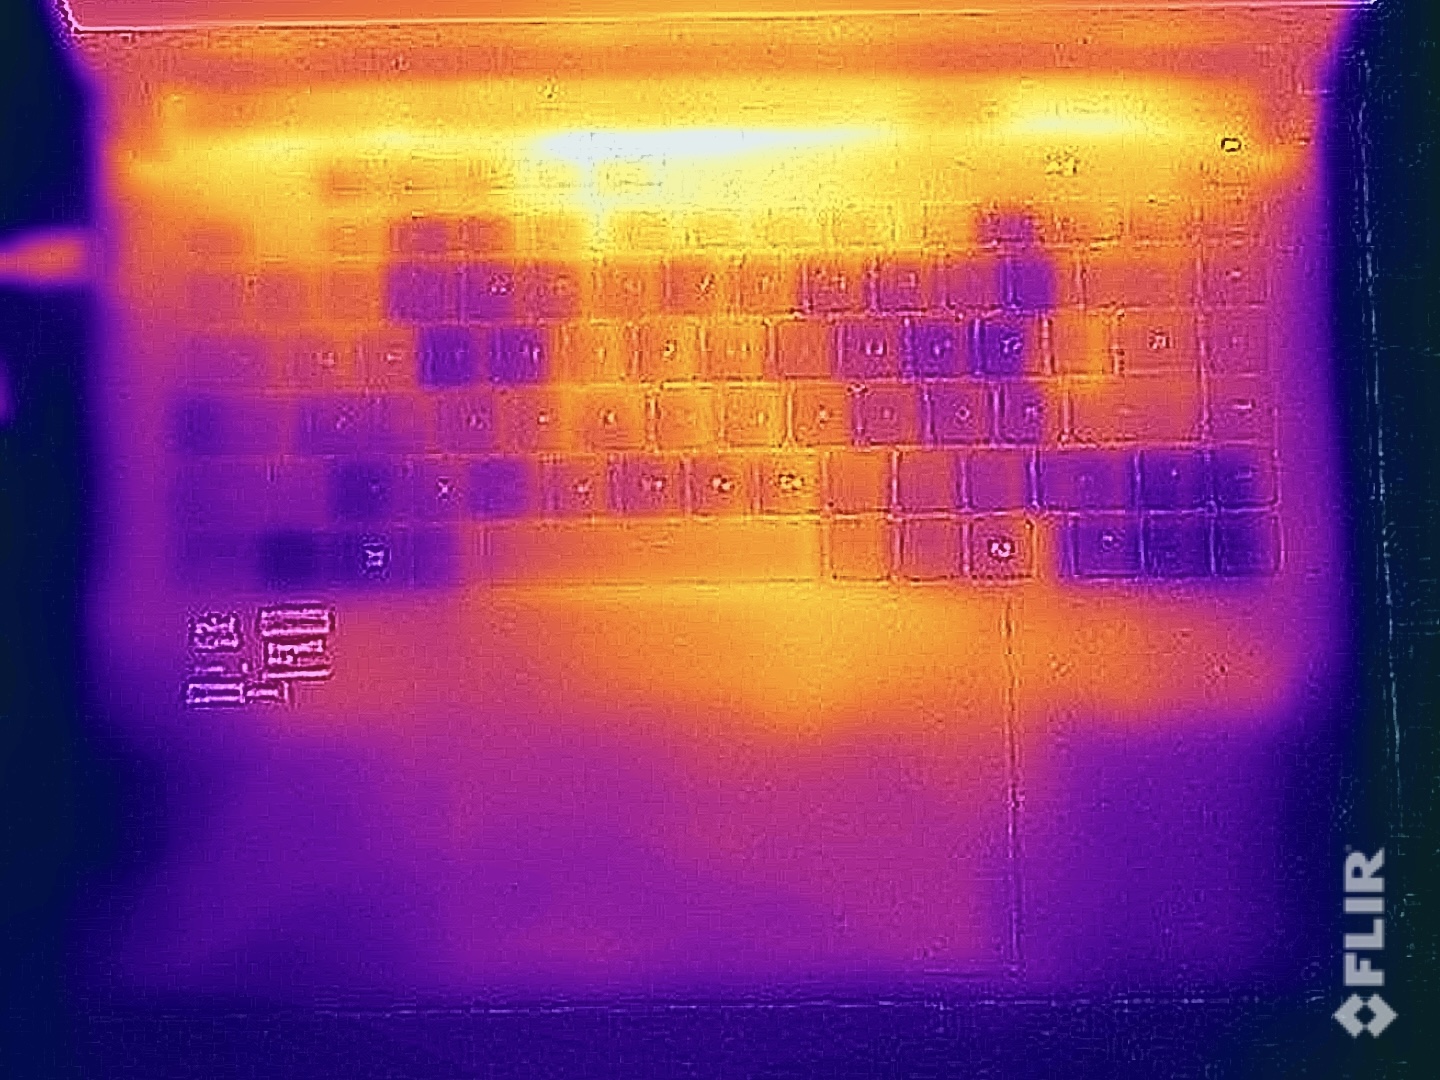
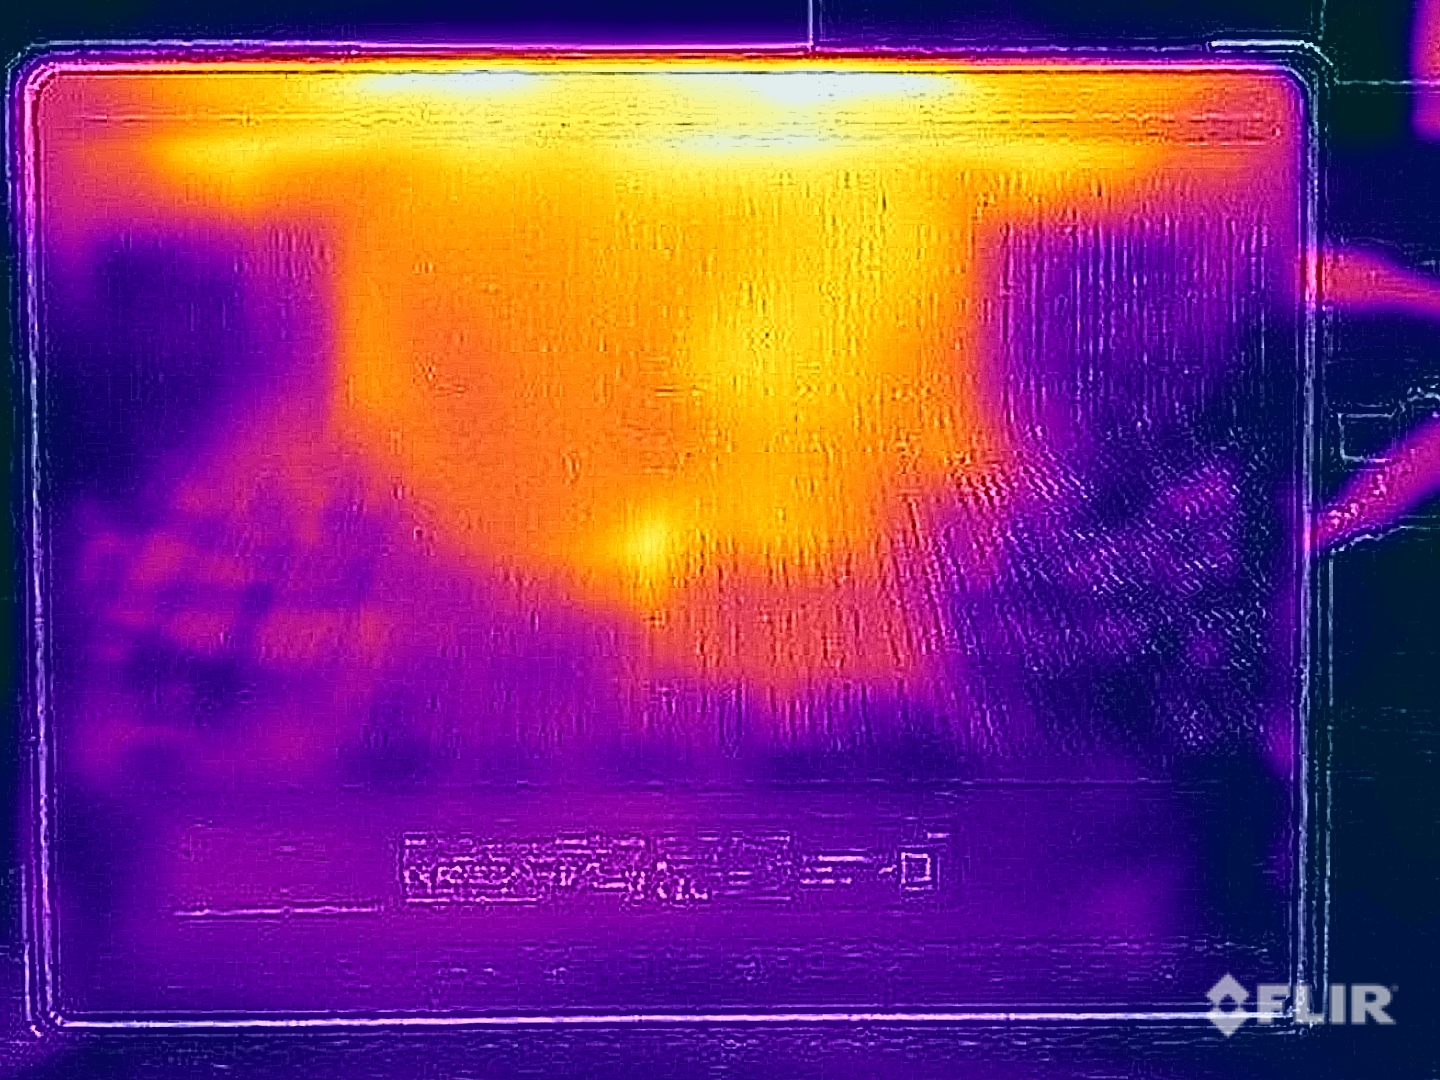
温度
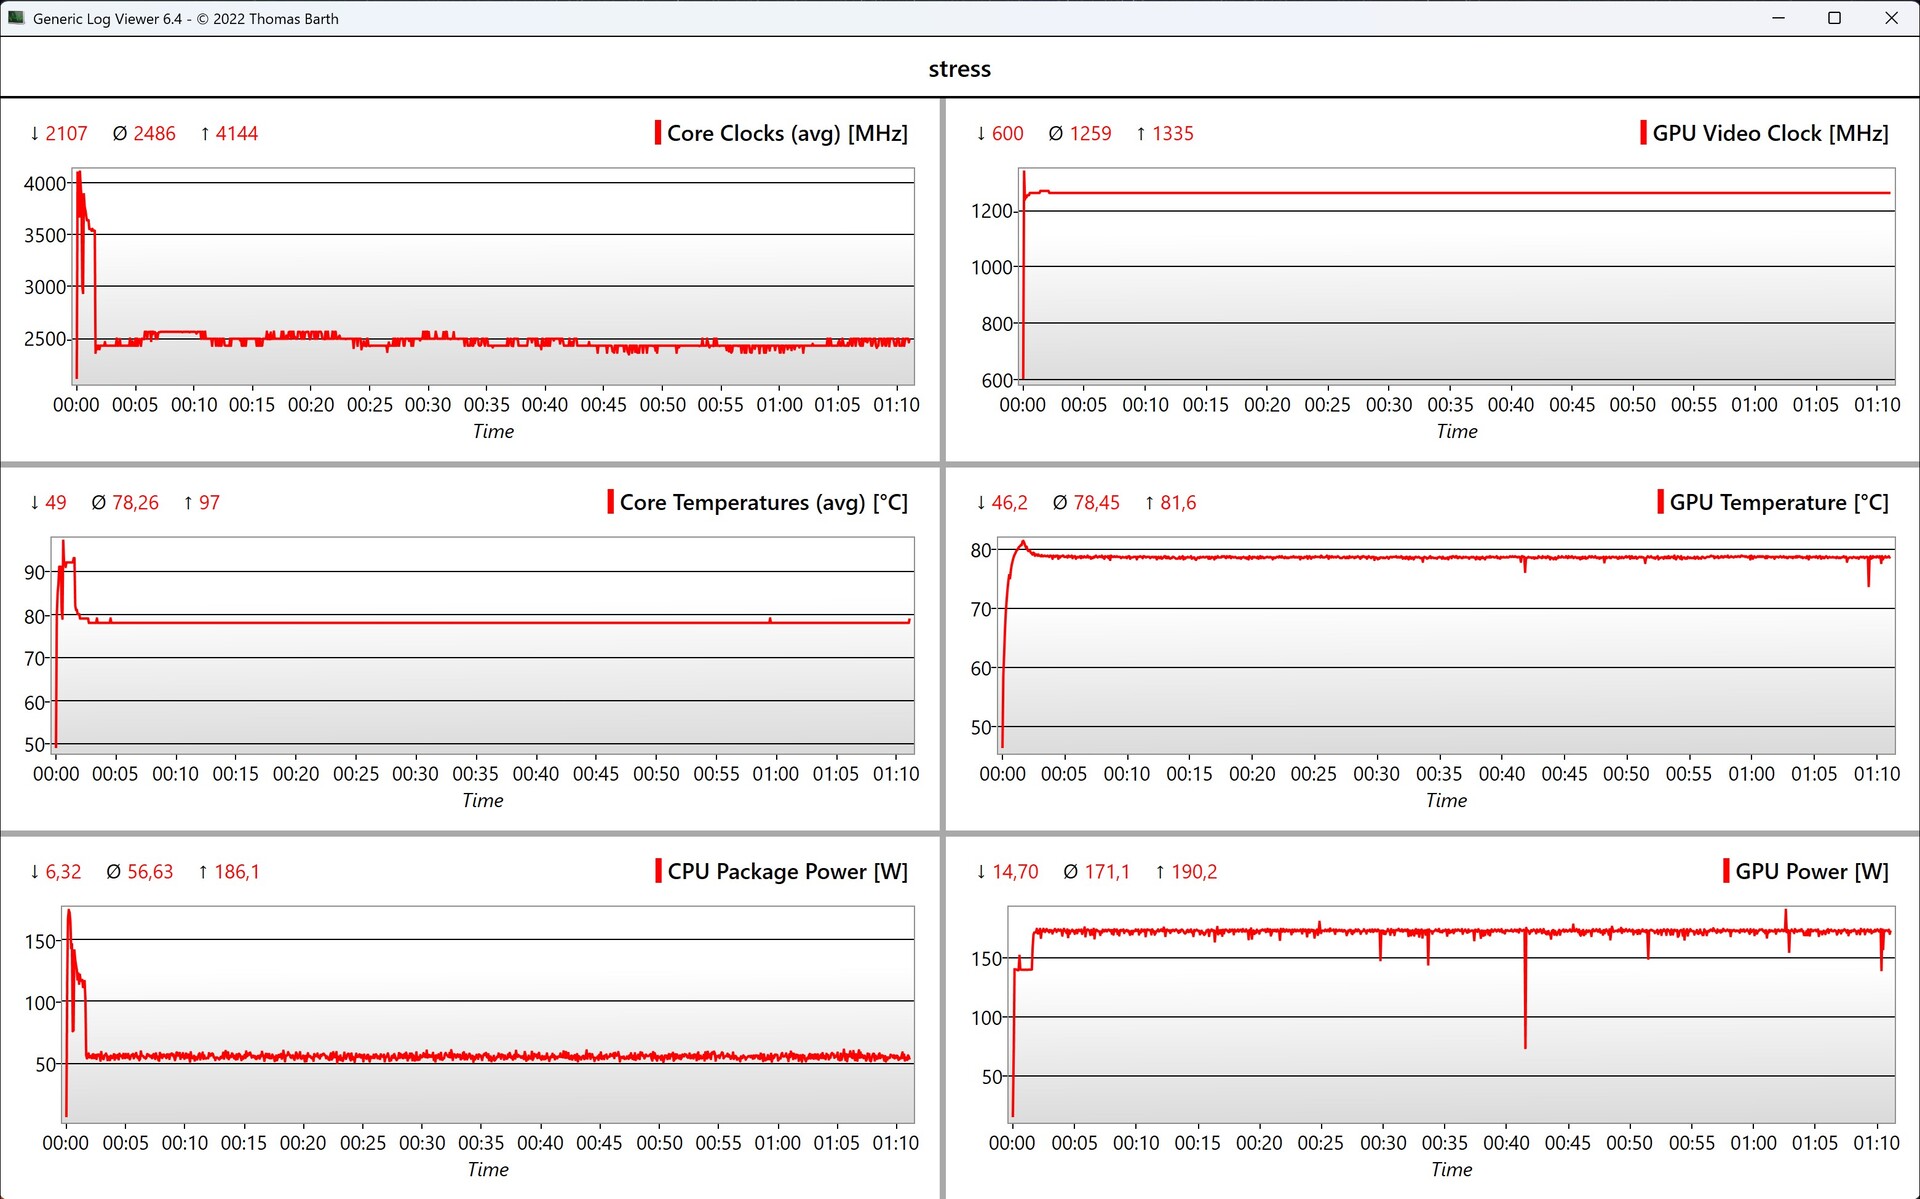
风扇声音大的好处是表面温度低,即使在极端负载的情况下,设备仍然非常凉爽,尤其是底座顶部。不过,底部的后部区域温度较高(接近 50 °C,122 °F),因此不要把 Strix G16 放在膝盖上。在压力测试中,CPU 和 GPU 的功率分别约为 56 瓦和 170 瓦(电池工作时分别为 32 瓦和 44 瓦)。
(+) The maximum temperature on the upper side is 39.6 °C / 103 F, compared to the average of 40.4 °C / 105 F, ranging from 21.2 to 68.8 °C for the class Gaming.
(-) The bottom heats up to a maximum of 49.7 °C / 121 F, compared to the average of 43.2 °C / 110 F
(+) In idle usage, the average temperature for the upper side is 25.8 °C / 78 F, compared to the device average of 33.9 °C / 93 F.
(±) 3: The average temperature for the upper side is 32.5 °C / 91 F, compared to the average of 33.9 °C / 93 F for the class Gaming.
(+) The palmrests and touchpad are cooler than skin temperature with a maximum of 31.3 °C / 88.3 F and are therefore cool to the touch.
(-) The average temperature of the palmrest area of similar devices was 28.9 °C / 84 F (-2.4 °C / -4.3 F).
| Asus ROG Strix G16 G615 Intel Core Ultra 9 275HX, Nvidia GeForce RTX 5080 Laptop | Acer Predator Helios 16 PH16-72 Intel Core i9-14900HX, NVIDIA GeForce RTX 4080 Laptop GPU | SCHENKER XMG Neo 16 (Early 24) Intel Core i9-14900HX, NVIDIA GeForce RTX 4090 Laptop GPU | Asus ROG Strix Scar 16 G634JZR Intel Core i9-14900HX, NVIDIA GeForce RTX 4080 Laptop GPU | HP Omen 16 (2024) Intel Core i9-14900HX, NVIDIA GeForce RTX 4080 Laptop GPU | Lenovo Legion Pro 7 16IRX9H Intel Core i9-14900HX, NVIDIA GeForce RTX 4080 Laptop GPU | Lenovo Legion Pro 7i 16 Gen 10 Intel Core Ultra 9 275HX, Nvidia GeForce RTX 5080 Laptop | |
|---|---|---|---|---|---|---|---|
| Heat | -14% | -9% | -18% | -6% | -24% | -9% | |
| Maximum Upper Side * | 39.6 | 37.5 5% | 47 -19% | 47.8 -21% | 47 -19% | 46 -16% | 42.6 -8% |
| Maximum Bottom * | 49.7 | 43.9 12% | 56 -13% | 52.2 -5% | 57 -15% | 49 1% | 41.2 17% |
| Idle Upper Side * | 26.3 | 31 -18% | 27 -3% | 32.4 -23% | 25 5% | 38 -44% | 32.6 -24% |
| Idle Bottom * | 27.3 | 42 -54% | 27 1% | 33 -21% | 26 5% | 37 -36% | 32.4 -19% |
* ... smaller is better
发言人
立体声扬声器的表现非常出色,在我们的对比领域中属于佼佼者。不过,它们仍然无法抵挡游戏时的风扇噪音。
Asus ROG Strix G16 G615 audio analysis
(+) | speakers can play relatively loud (82.2 dB)
Bass 100 - 315 Hz
(±) | reduced bass - on average 7.5% lower than median
(±) | linearity of bass is average (7.4% delta to prev. frequency)
Mids 400 - 2000 Hz
(+) | balanced mids - only 2.9% away from median
(+) | mids are linear (3.6% delta to prev. frequency)
Highs 2 - 16 kHz
(+) | balanced highs - only 2.8% away from median
(±) | linearity of highs is average (8.3% delta to prev. frequency)
Overall 100 - 16.000 Hz
(+) | overall sound is linear (9.4% difference to median)
Compared to same class
» 3% of all tested devices in this class were better, 2% similar, 95% worse
» The best had a delta of 6%, average was 18%, worst was 132%
Compared to all devices tested
» 3% of all tested devices were better, 1% similar, 96% worse
» The best had a delta of 4%, average was 24%, worst was 134%
Acer Predator Helios 16 PH16-72 audio analysis
(±) | speaker loudness is average but good (81.9 dB)
Bass 100 - 315 Hz
(±) | reduced bass - on average 14.2% lower than median
(±) | linearity of bass is average (11.7% delta to prev. frequency)
Mids 400 - 2000 Hz
(±) | higher mids - on average 8.3% higher than median
(±) | linearity of mids is average (8.8% delta to prev. frequency)
Highs 2 - 16 kHz
(+) | balanced highs - only 4.2% away from median
(+) | highs are linear (6% delta to prev. frequency)
Overall 100 - 16.000 Hz
(±) | linearity of overall sound is average (19% difference to median)
Compared to same class
» 62% of all tested devices in this class were better, 8% similar, 30% worse
» The best had a delta of 6%, average was 18%, worst was 132%
Compared to all devices tested
» 42% of all tested devices were better, 7% similar, 50% worse
» The best had a delta of 4%, average was 24%, worst was 134%
SCHENKER XMG Neo 16 (Early 24) audio analysis
(+) | speakers can play relatively loud (86 dB)
Bass 100 - 315 Hz
(-) | nearly no bass - on average 16.3% lower than median
(±) | linearity of bass is average (8.6% delta to prev. frequency)
Mids 400 - 2000 Hz
(+) | balanced mids - only 3% away from median
(+) | mids are linear (3.6% delta to prev. frequency)
Highs 2 - 16 kHz
(+) | balanced highs - only 2.5% away from median
(+) | highs are linear (4.9% delta to prev. frequency)
Overall 100 - 16.000 Hz
(+) | overall sound is linear (12.4% difference to median)
Compared to same class
» 14% of all tested devices in this class were better, 3% similar, 83% worse
» The best had a delta of 6%, average was 18%, worst was 132%
Compared to all devices tested
» 9% of all tested devices were better, 2% similar, 88% worse
» The best had a delta of 4%, average was 24%, worst was 134%
Asus ROG Strix Scar 16 G634JZR audio analysis
(±) | speaker loudness is average but good (79 dB)
Bass 100 - 315 Hz
(±) | reduced bass - on average 7.1% lower than median
(±) | linearity of bass is average (9% delta to prev. frequency)
Mids 400 - 2000 Hz
(±) | higher mids - on average 5.5% higher than median
(+) | mids are linear (3.3% delta to prev. frequency)
Highs 2 - 16 kHz
(+) | balanced highs - only 1.4% away from median
(+) | highs are linear (2.6% delta to prev. frequency)
Overall 100 - 16.000 Hz
(+) | overall sound is linear (9.8% difference to median)
Compared to same class
» 5% of all tested devices in this class were better, 1% similar, 94% worse
» The best had a delta of 6%, average was 18%, worst was 132%
Compared to all devices tested
» 4% of all tested devices were better, 1% similar, 96% worse
» The best had a delta of 4%, average was 24%, worst was 134%
HP Omen 16 (2024) audio analysis
(±) | speaker loudness is average but good (78 dB)
Bass 100 - 315 Hz
(-) | nearly no bass - on average 15.2% lower than median
(±) | linearity of bass is average (14.3% delta to prev. frequency)
Mids 400 - 2000 Hz
(+) | balanced mids - only 4.8% away from median
(+) | mids are linear (5% delta to prev. frequency)
Highs 2 - 16 kHz
(+) | balanced highs - only 2% away from median
(+) | highs are linear (4.1% delta to prev. frequency)
Overall 100 - 16.000 Hz
(+) | overall sound is linear (14.7% difference to median)
Compared to same class
» 27% of all tested devices in this class were better, 7% similar, 66% worse
» The best had a delta of 6%, average was 18%, worst was 132%
Compared to all devices tested
» 17% of all tested devices were better, 4% similar, 79% worse
» The best had a delta of 4%, average was 24%, worst was 134%
Lenovo Legion Pro 7 16IRX9H audio analysis
(+) | speakers can play relatively loud (84 dB)
Bass 100 - 315 Hz
(±) | reduced bass - on average 9% lower than median
(±) | linearity of bass is average (7.4% delta to prev. frequency)
Mids 400 - 2000 Hz
(+) | balanced mids - only 2.8% away from median
(+) | mids are linear (4% delta to prev. frequency)
Highs 2 - 16 kHz
(+) | balanced highs - only 3% away from median
(+) | highs are linear (5% delta to prev. frequency)
Overall 100 - 16.000 Hz
(+) | overall sound is linear (8.4% difference to median)
Compared to same class
» 1% of all tested devices in this class were better, 1% similar, 97% worse
» The best had a delta of 6%, average was 18%, worst was 132%
Compared to all devices tested
» 2% of all tested devices were better, 1% similar, 98% worse
» The best had a delta of 4%, average was 24%, worst was 134%
电源管理 - 电池寿命长的游戏笔记本电脑
耗电量
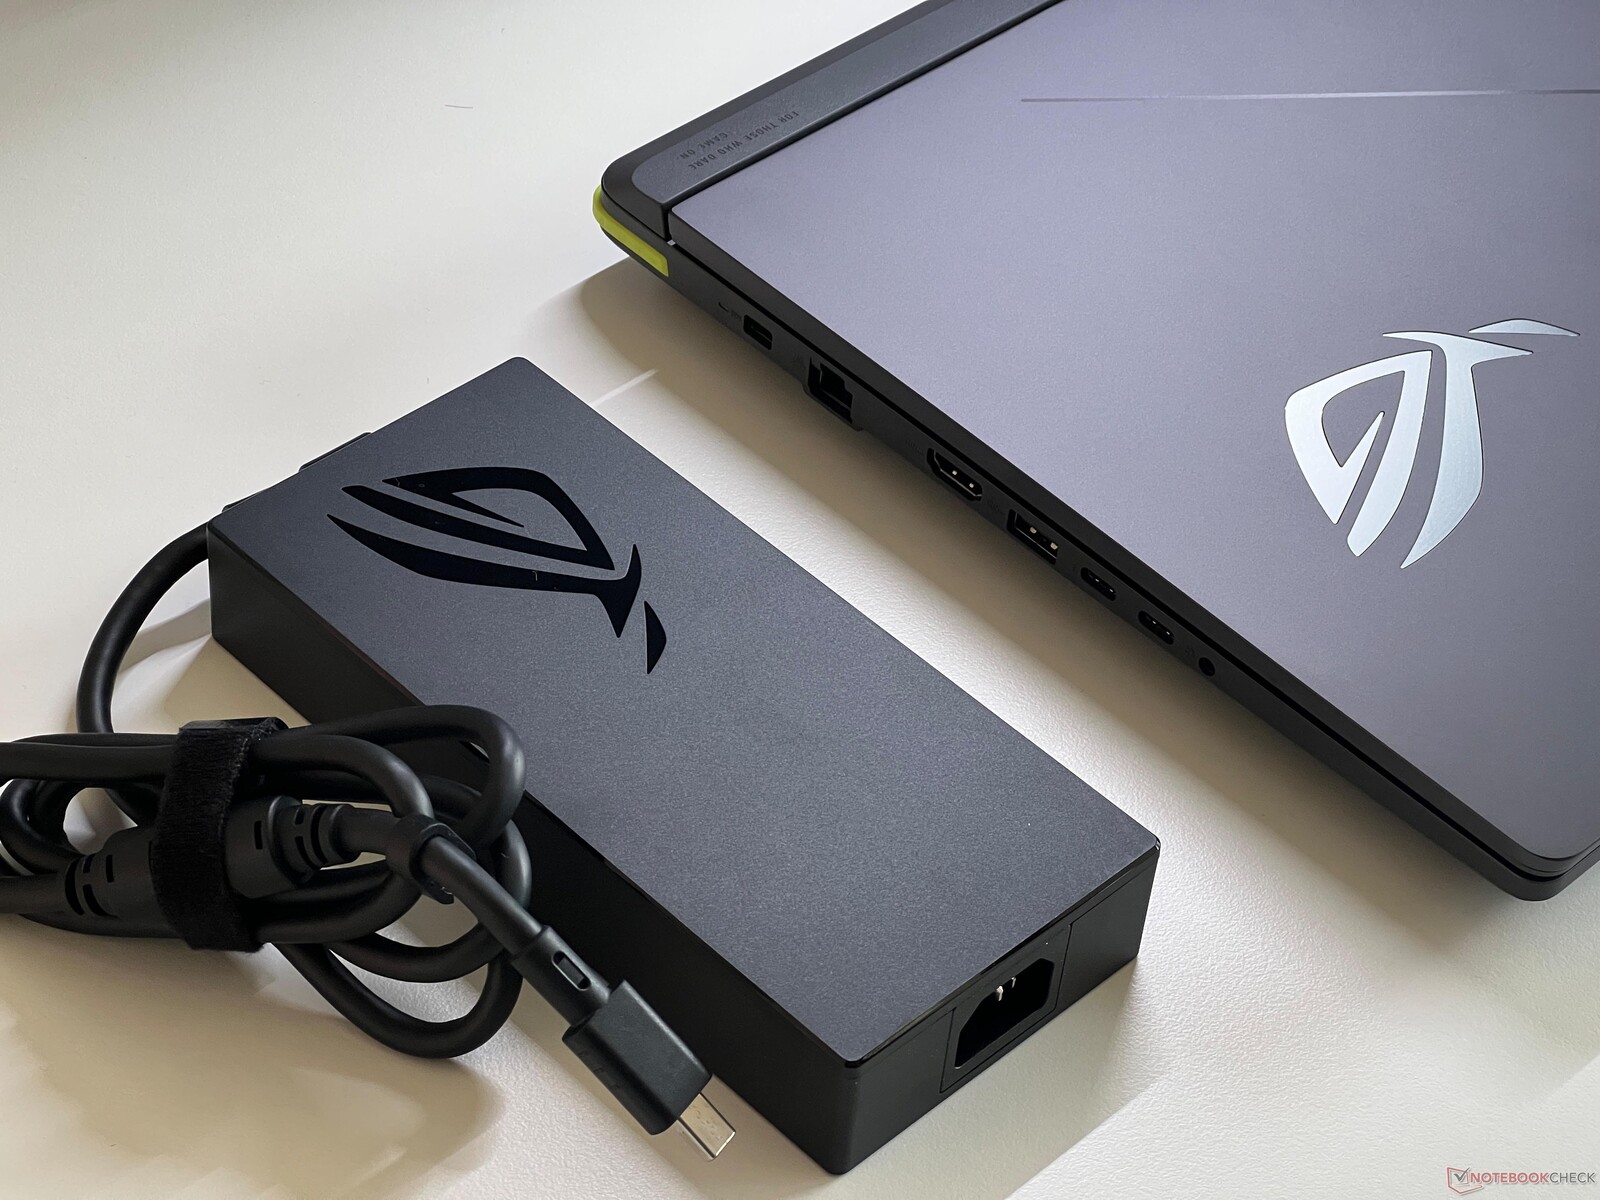
在空闲运行时,Strix G16 的能效相对较高,最大功耗为 18 瓦。但在负载情况下,这种情况就会发生变化,这在高功率限制下并不令人十分惊讶。在压力测试中,我们测量到几秒钟内的功耗约为 360 瓦,然后在 300 瓦左右趋于平稳。在游戏过程中也能达到类似的数值,因此随附的 380 瓦充电器完全足够。1.8 瓦的待机功耗过高,尽管所有照明功能都已关闭(默认情况下,照明灯条在待机时会产生脉动效果)。
| Off / Standby | |
| Idle | |
| Load |
|
Key:
min: | |
| Asus ROG Strix G16 G615 Ultra 9 275HX, GeForce RTX 5080 Laptop, Micron 2500 1TB MTFDKBA1T0QGN, IPS, 2560x1600, 16" | Acer Predator Helios 16 PH16-72 i9-14900HX, NVIDIA GeForce RTX 4080 Laptop GPU, Micron 3400 2TB MTFDKBA2T0TFH, IPS, 2560x1600, 16" | SCHENKER XMG Neo 16 (Early 24) i9-14900HX, NVIDIA GeForce RTX 4090 Laptop GPU, Samsung 990 Pro 1 TB, IPS, 2560x1600, 16" | Asus ROG Strix Scar 16 G634JZR i9-14900HX, NVIDIA GeForce RTX 4080 Laptop GPU, SK hynix PC801 HFS002TEJ9X101N, Mini LED, 2560x1600, 16" | HP Omen 16 (2024) i9-14900HX, NVIDIA GeForce RTX 4080 Laptop GPU, SK hynix PC801 HFS001TEJ9X101N, IPS, 2560x1440, 16.1" | Lenovo Legion Pro 7 16IRX9H i9-14900HX, NVIDIA GeForce RTX 4080 Laptop GPU, SK Hynix HFS001TEJ9X115N, IPS, 2560x1600, 16" | Lenovo Legion Pro 7i 16 Gen 10 Ultra 9 275HX, GeForce RTX 5080 Laptop, SK Hynix HFS001TEJ9X115N, OLED, 2560x1600, 16" | Average Nvidia GeForce RTX 5080 Laptop | Average of class Gaming | |
|---|---|---|---|---|---|---|---|---|---|
| Power Consumption | -64% | 2% | -5% | -6% | -31% | -75% | -50% | -4% | |
| Idle Minimum * | 10.8 | 31.5 -192% | 6 44% | 10.71 1% | 9 17% | 16 -48% | 36.8 -241% | 23.8 ? -120% | 13.7 ? -27% |
| Idle Average * | 17.7 | 31.5 -78% | 16 10% | 14.75 17% | 16 10% | 21 -19% | 38.8 -119% | 28.3 ? -60% | 19.3 ? -9% |
| Idle Maximum * | 18.8 | 47.5 -153% | 28 -49% | 30 -60% | 35 -86% | 36 -91% | 45.6 -143% | 32.2 ? -71% | 26.9 ? -43% |
| Load Average * | 139.4 | 130 7% | 135 3% | 129 7% | 132 5% | 132.2 5% | 135.8 ? 3% | 102.8 ? 26% | |
| Cyberpunk 2077 ultra * | 295 | 231 22% | 318 -8% | ||||||
| Cyberpunk 2077 ultra external monitor * | 291 | 270 7% | 319 -10% | ||||||
| Load Maximum * | 359.3 | 313 13% | 361 -0% | 307 15% | 285 21% | 360 -0% | 384 -7% | 372 ? -4% | 247 ? 31% |
| Witcher 3 ultra * | 302 | 286 | 150.8 | 267 |
* ... smaller is better
Power Consumption Cyberpunk / Stress Test
Power Consumption with External Monitor
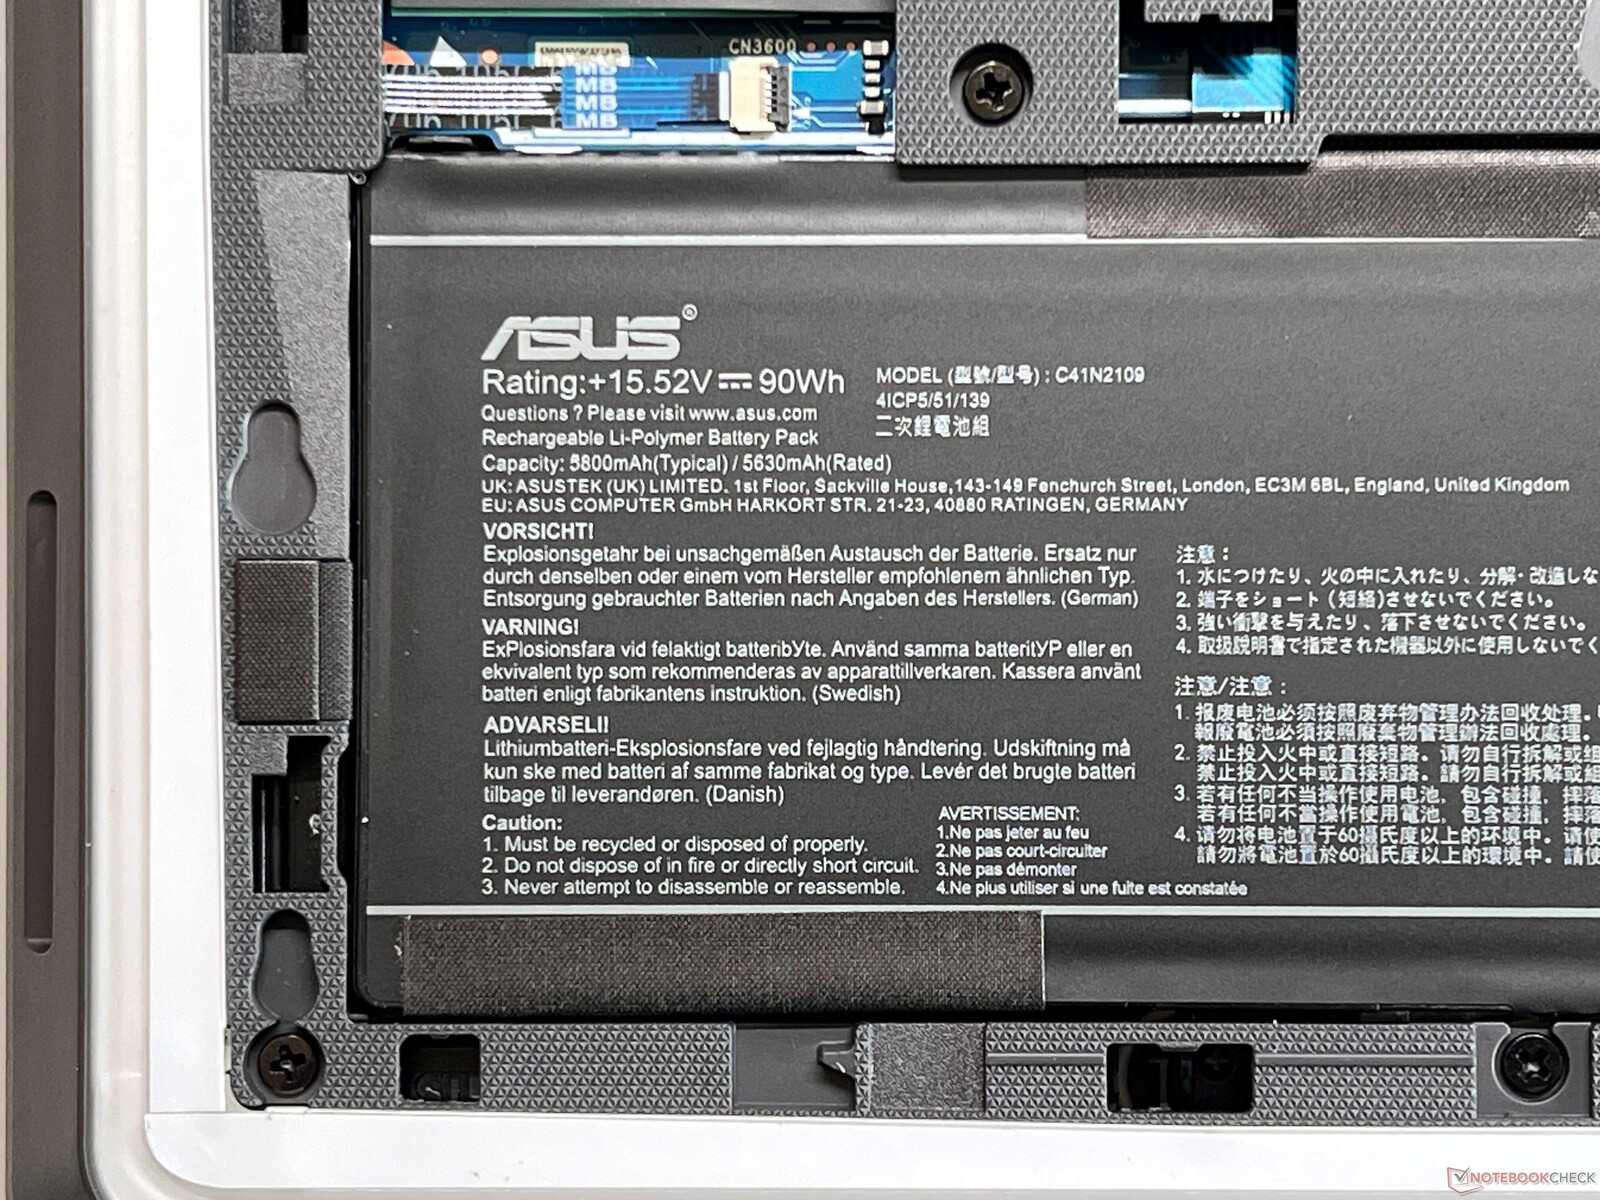
电池寿命
游戏笔记本电脑并不以电池续航时间长而著称,但 Strix G16(90 Wh 电池)却给人带来了惊喜,而且还超越了竞争对手。在我们的无线局域网测试中,它的续航时间将近 8 小时(全亮时 6.5 小时),播放视频时将近 11 小时。不过,在游戏测试中,大约 48 分钟后电池就会耗尽。
| Asus ROG Strix G16 G615 Ultra 9 275HX, GeForce RTX 5080 Laptop, 90 Wh | Acer Predator Helios 16 PH16-72 i9-14900HX, NVIDIA GeForce RTX 4080 Laptop GPU, 90 Wh | SCHENKER XMG Neo 16 (Early 24) i9-14900HX, NVIDIA GeForce RTX 4090 Laptop GPU, 99.8 Wh | Asus ROG Strix Scar 16 G634JZR i9-14900HX, NVIDIA GeForce RTX 4080 Laptop GPU, 90 Wh | HP Omen 16 (2024) i9-14900HX, NVIDIA GeForce RTX 4080 Laptop GPU, 83 Wh | Lenovo Legion Pro 7 16IRX9H i9-14900HX, NVIDIA GeForce RTX 4080 Laptop GPU, 99.9 Wh | Lenovo Legion Pro 7i 16 Gen 10 Ultra 9 275HX, GeForce RTX 5080 Laptop, 99 Wh | Average of class Gaming | |
|---|---|---|---|---|---|---|---|---|
| Battery Runtime | -24% | -7% | -27% | -25% | -20% | -38% | -17% | |
| H.264 | 658 | 418 -36% | 451 -31% | 462 ? -30% | ||||
| WiFi v1.3 | 469 | 277 -41% | 350 -25% | 434 -7% | 352 -25% | 373 -20% | 323 -31% | 389 ? -17% |
| Cyberpunk 2077 ultra 150cd | 48 | 45 -6% | ||||||
| Load | 88 | 122 39% | 51 -42% | 48 -45% | 84.3 ? -4% | |||
| Witcher 3 ultra | 57 | 76.3 ? |
Notebookcheck 总体评分
Asus ROG Strix G16 G615
- 04/25/2025 v8
Andreas Osthoff
 Total Sustainability Score:
 Possible Alternatives in Comparison
Image | Model / Review | Price | Weight | Height | Display |
|---|---|---|---|---|---|
1. 87.3%  | Asus ROG Strix G16 G615 Intel Core Ultra 9 275HX ⎘ Nvidia GeForce RTX 5080 Laptop ⎘ 32 GB Memory, 1024 GB SSD | Amazon: 1. $1,199.99 ASUS ROG Strix G16 Gaming La... 2. $1,899.00 ASUS ROG Strix G16 (2024) Ga... 3. $1,499.99 ASUS ROG Strix G16 Gaming La... List Price: 3299€ | 2.6 kg | 30.8 mm | 16.00" 2560x1600 189 PPI IPS |
2. 86%  | Acer Predator Helios 16 PH16-72 Intel Core i9-14900HX ⎘ NVIDIA GeForce RTX 4080 Laptop GPU ⎘ 32 GB Memory, 2048 GB SSD | Amazon: 1. $1,469.00 acer Predator Helios Neo 16 ... 2. $2,237.40 acer Predator Helios 16 PH16... 3. $2,577.04 acer Predator Helios 16 PH16... | 2.7 kg | 29.6 mm | 16.00" 2560x1600 189 PPI IPS |
3. 85.5%  | SCHENKER XMG Neo 16 (Early 24) Intel Core i9-14900HX ⎘ NVIDIA GeForce RTX 4090 Laptop GPU ⎘ 32 GB Memory, 1024 GB SSD | Amazon: 1. $143.00 16.0" for Schenker XMG Neo 1... 2. $150.00 16.0" Screen Replacement for... 3. $145.00 16.0" WQXGA 2560(RGB)×1600 ... List Price: 3800 Euro | 2.5 kg | 26.6 mm | 16.00" 2560x1600 189 PPI IPS |
4. 87.6% v7 (old)  | Asus ROG Strix Scar 16 G634JZR Intel Core i9-14900HX ⎘ NVIDIA GeForce RTX 4080 Laptop GPU ⎘ 32 GB Memory, 2048 GB SSD | Amazon: $2,899.00 List Price: 3199 EUR | 2.7 kg | 30.4 mm | 16.00" 2560x1600 189 PPI Mini LED |
5. 86.7% v7 (old) 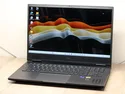 | HP Omen 16 (2024) Intel Core i9-14900HX ⎘ NVIDIA GeForce RTX 4080 Laptop GPU ⎘ 32 GB Memory, 1024 GB SSD | Amazon: 1. $1,169.09 HP OMEN 16 inch Laptop, FHD ... 2. $1,329.00 HP Omen 16 Gaming Laptop 16.... 3. $1,164.21 HP OMEN 16 inch Laptop, FHD ... List Price: 3200 Euro | 2.4 kg | 23.5 mm | 16.10" 2560x1440 182 PPI IPS |
6. 89.5% v7 (old)  | Lenovo Legion Pro 7 16IRX9H Intel Core i9-14900HX ⎘ NVIDIA GeForce RTX 4080 Laptop GPU ⎘ 32 GB Memory, 1024 GB SSD | Amazon: List Price: 2999 Euro | 2.7 kg | 21.95 mm | 16.00" 2560x1600 189 PPI IPS |
Transparency
The selection of devices to be reviewed is made by our editorial team. The test sample was provided to the author as a loan by the manufacturer or retailer for the purpose of this review. The lender had no influence on this review, nor did the manufacturer receive a copy of this review before publication. There was no obligation to publish this review. We never accept compensation or payment in return for our reviews. As an independent media company, Notebookcheck is not subjected to the authority of manufacturers, retailers or publishers.
This is how Notebookcheck is testing
Every year, Notebookcheck independently reviews hundreds of laptops and smartphones using standardized procedures to ensure that all results are comparable. We have continuously developed our test methods for around 20 years and set industry standards in the process. In our test labs, high-quality measuring equipment is utilized by experienced technicians and editors. These tests involve a multi-stage validation process. Our complex rating system is based on hundreds of well-founded measurements and benchmarks, which maintains objectivity. Further information on our test methods can be found here.

