

联想Legion Pro 7i 16 代 10 笔记本电脑评测:几乎无损的 400 W 电源
全功率。
今年,最新的Legion Pro 7i 16 并没有越做越薄,而是加厚了机身,以便从英特尔 Arrow Lake 和 Nvidia Blackwell 硬件中榨取更多性能。功耗可能较高,但原始性能毋庸置疑。Allen Ngo, 👁 Allen Ngo (translated by DeepL / Ninh Duy) Published 🇺🇸 🇫🇷 ...
结论 - Arrow Lake 让英特尔强势回归
第 10 代Legion Pro 7 16 是该系列中最精致的机型。与最新的 Razer Blade 16 不同,这款联想产品不怕比上一代产品更大、更厚,以支持更高的功率包络和更强的冷却解决方案。与竞争对手不断变薄的设计相比,性能猎手们可能会特别欣赏这种做法,因为他们必须更巧妙地平衡 CPU 和 GPU 的性能水平。
这款显示器也值得称赞,因为它是为数不多的同时支持高原始刷新率、Windows VRR、DisplayHDR1000 和 G-Sync 的 OLED 面板之一。HDR 模式下 1000 尼特的最大亮度在配备 Mini-LED 的笔记本电脑上更为常见,而其他大多数 OLED 面板仅为 HDR600 或更低。因此,它的观看体验在 16 英寸游戏机中是最好的。
为 16 英寸笔记本电脑提供 400 瓦功率有其不利之处。除了功耗较高之外,更薄、更轻的替代品,如华硕 ROG Zephyrus G16。 华硕 ROG Zephyrus G16或 雷蛇刀锋 16等更轻薄的替代品可能对旅行者更有吸引力,即使它们的速度稍慢。尽管采用了大型散热解决方案,但联想的核心温度在游戏时可能会相当高,而在性能模式下,风扇噪音并不比竞争对手小。
如果买家知道自己需要什么--以更大的尺寸为代价获得最高的性能--那么他们会发现Legion Pro 7i Gen 10 是一个强大的选择。
Pros
Cons
价格和供应情况
RTX 5080 配置现在直接从联想发货,起价为 3400 美元,而 RTX 5090 配置将在晚些时候推出。
Legion Pro 7i 16 Gen 10(或 Pro 7 16 G10)是继去年的Legion Legion Pro 7i 16 Gen 9Pro 7i 16 Gen 10 的继任者。更新后的机型几乎一切都是新的,包括 CPU 从 Raptor Lake-HX 升级到 Arrow Lake-HX,Nvidia Ada Lovelace 升级到 Blackwell,以及外观和显示屏。
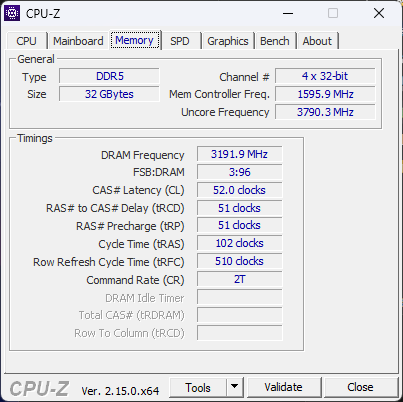
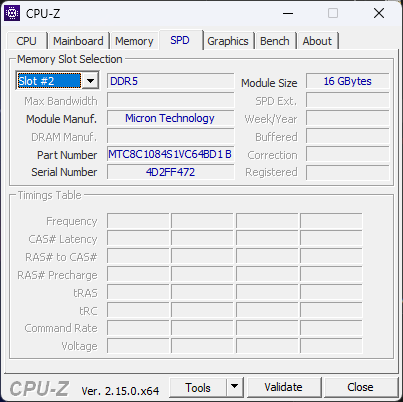
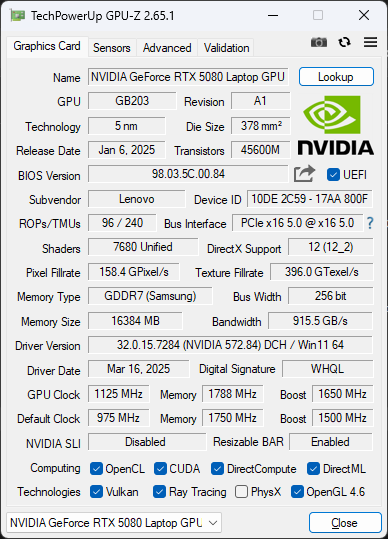
我们的测试机是高端配置,配备酷睿至尊 9 275HX CPU、175 WGeForce RTX 5080 GPU 和 1600p 240 Hz 16:10 OLED 显示屏,零售价约为 3400 美元。其他 SKU 可能会配备 RTX 5090、RTX 5080 或 RTX 5070 Ti,而 CPU 和显示屏则完全相同。
Legion Pro 7 16 G10 的竞争对手包括其他高端 16 英寸游戏笔记本电脑,如 微星 Vector 16 HX, 华硕 ROG Zephyrus G16或 雷蛇刀锋 16.联想还推出了价格更高的发烧友系列Legion Pro 9 16,与Legion Pro 7 16 相比具有更多功能,但截至本文撰写之时,该系列尚未更新至 2025 年。
更多联想评论:
规格
案例
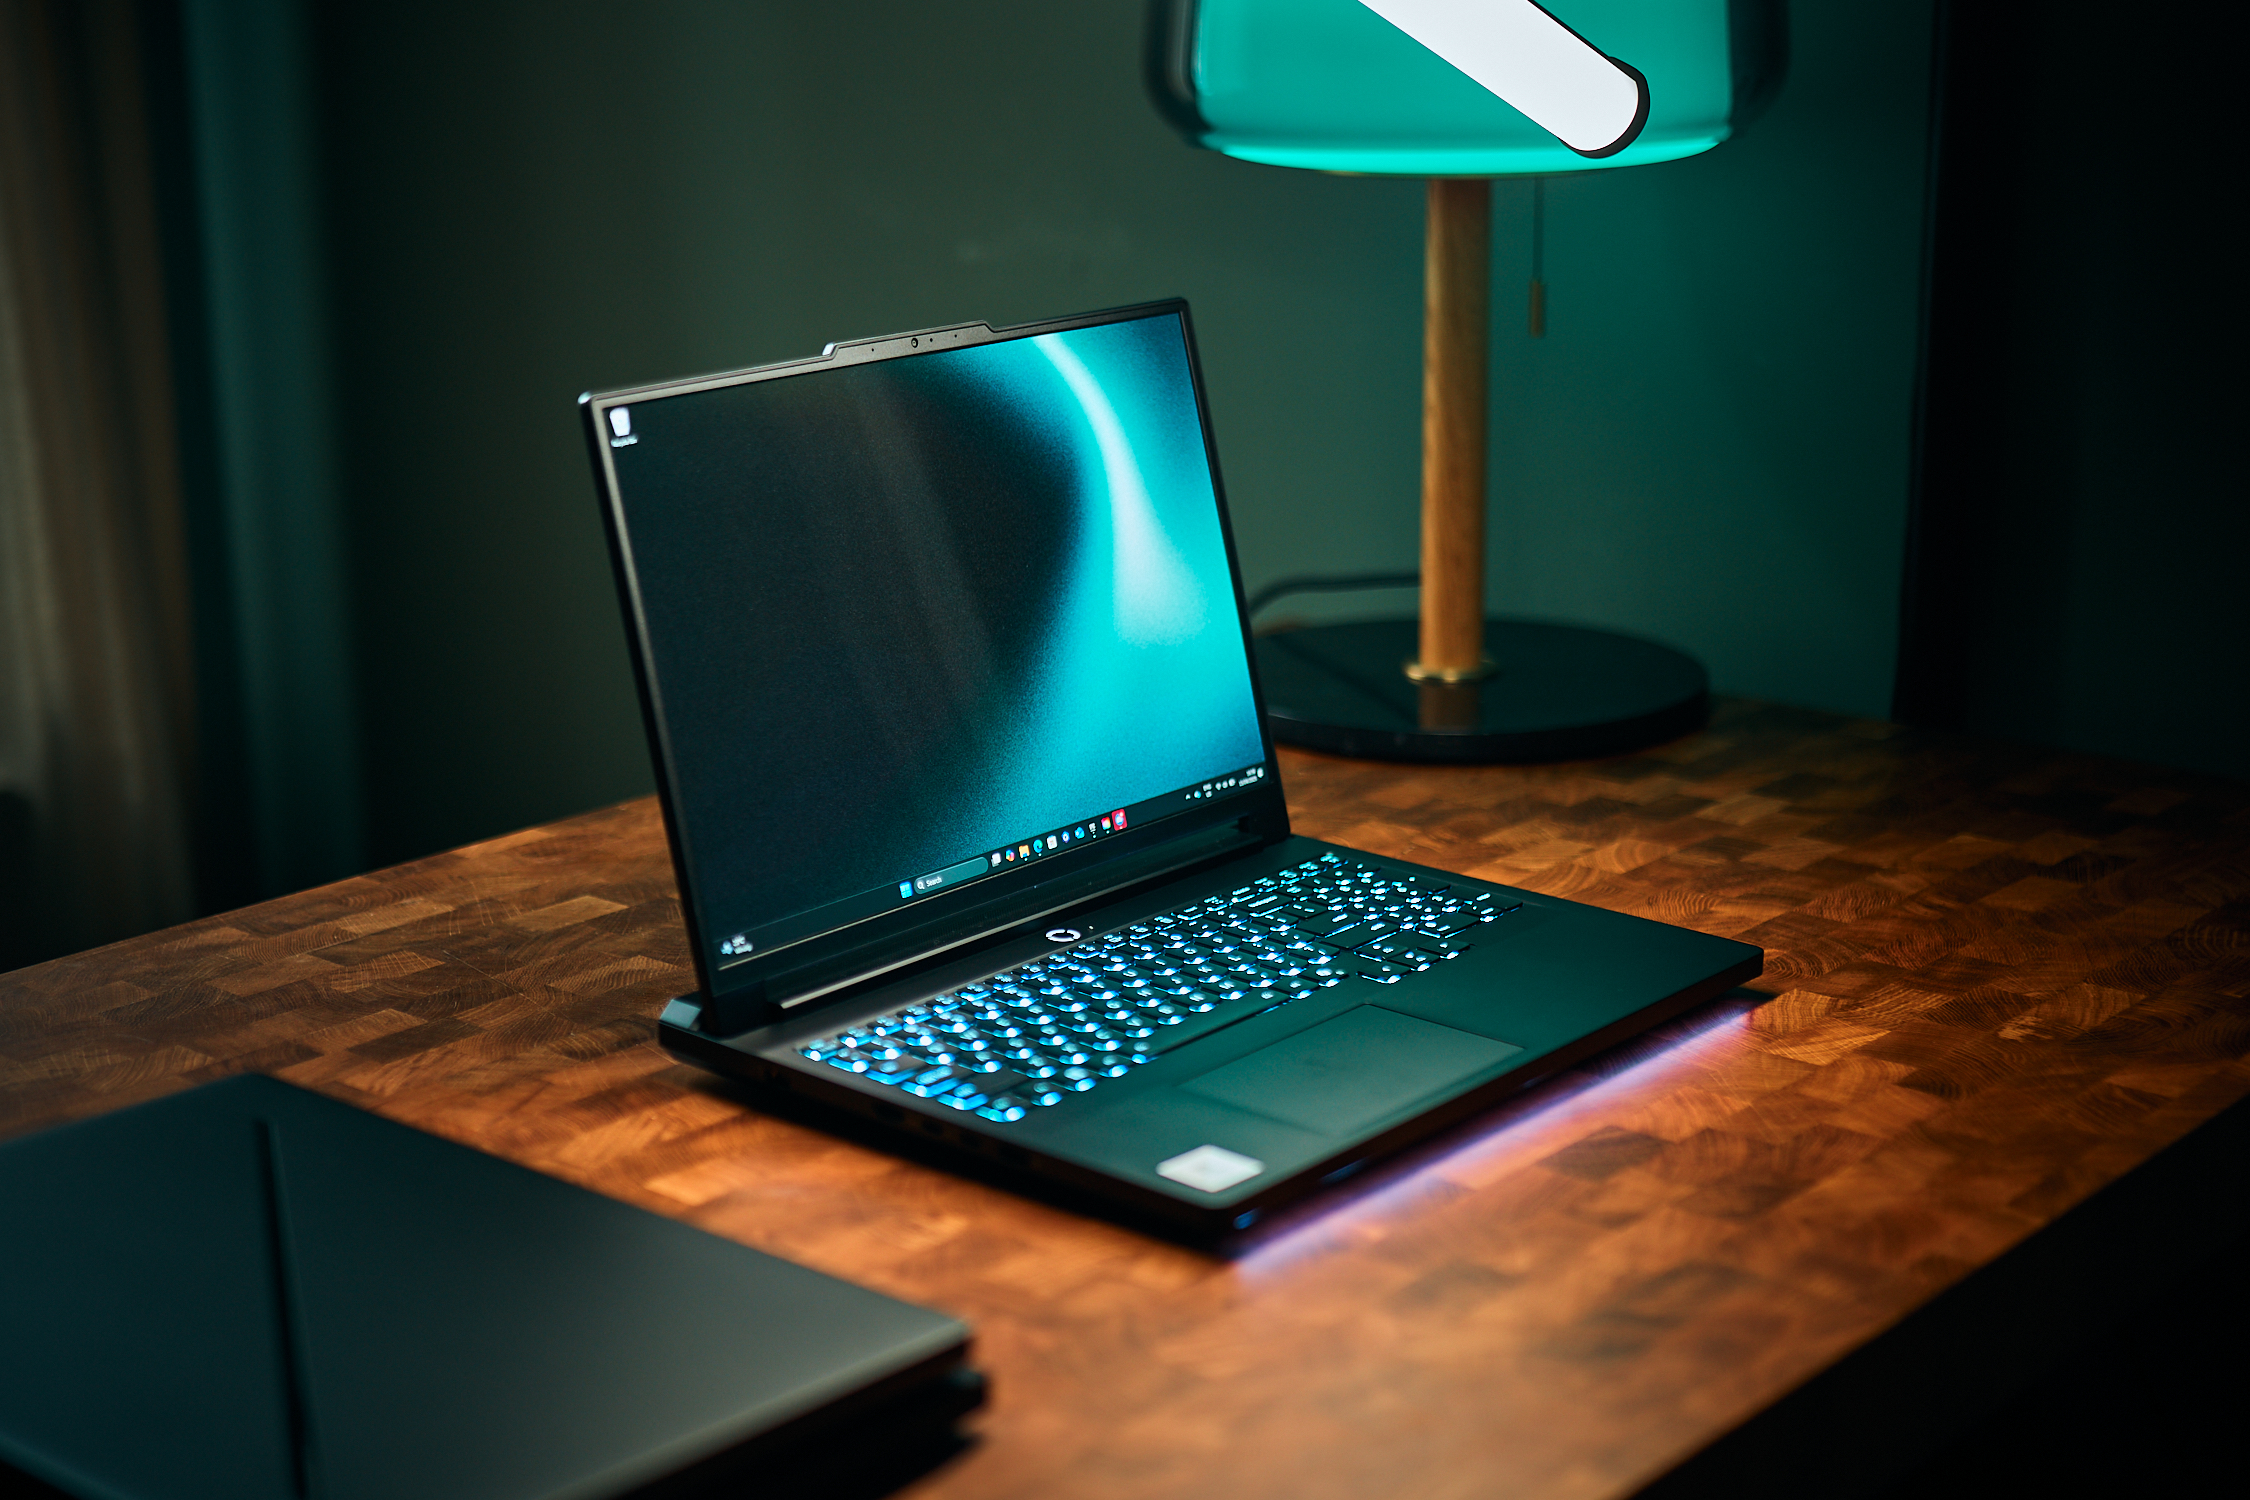
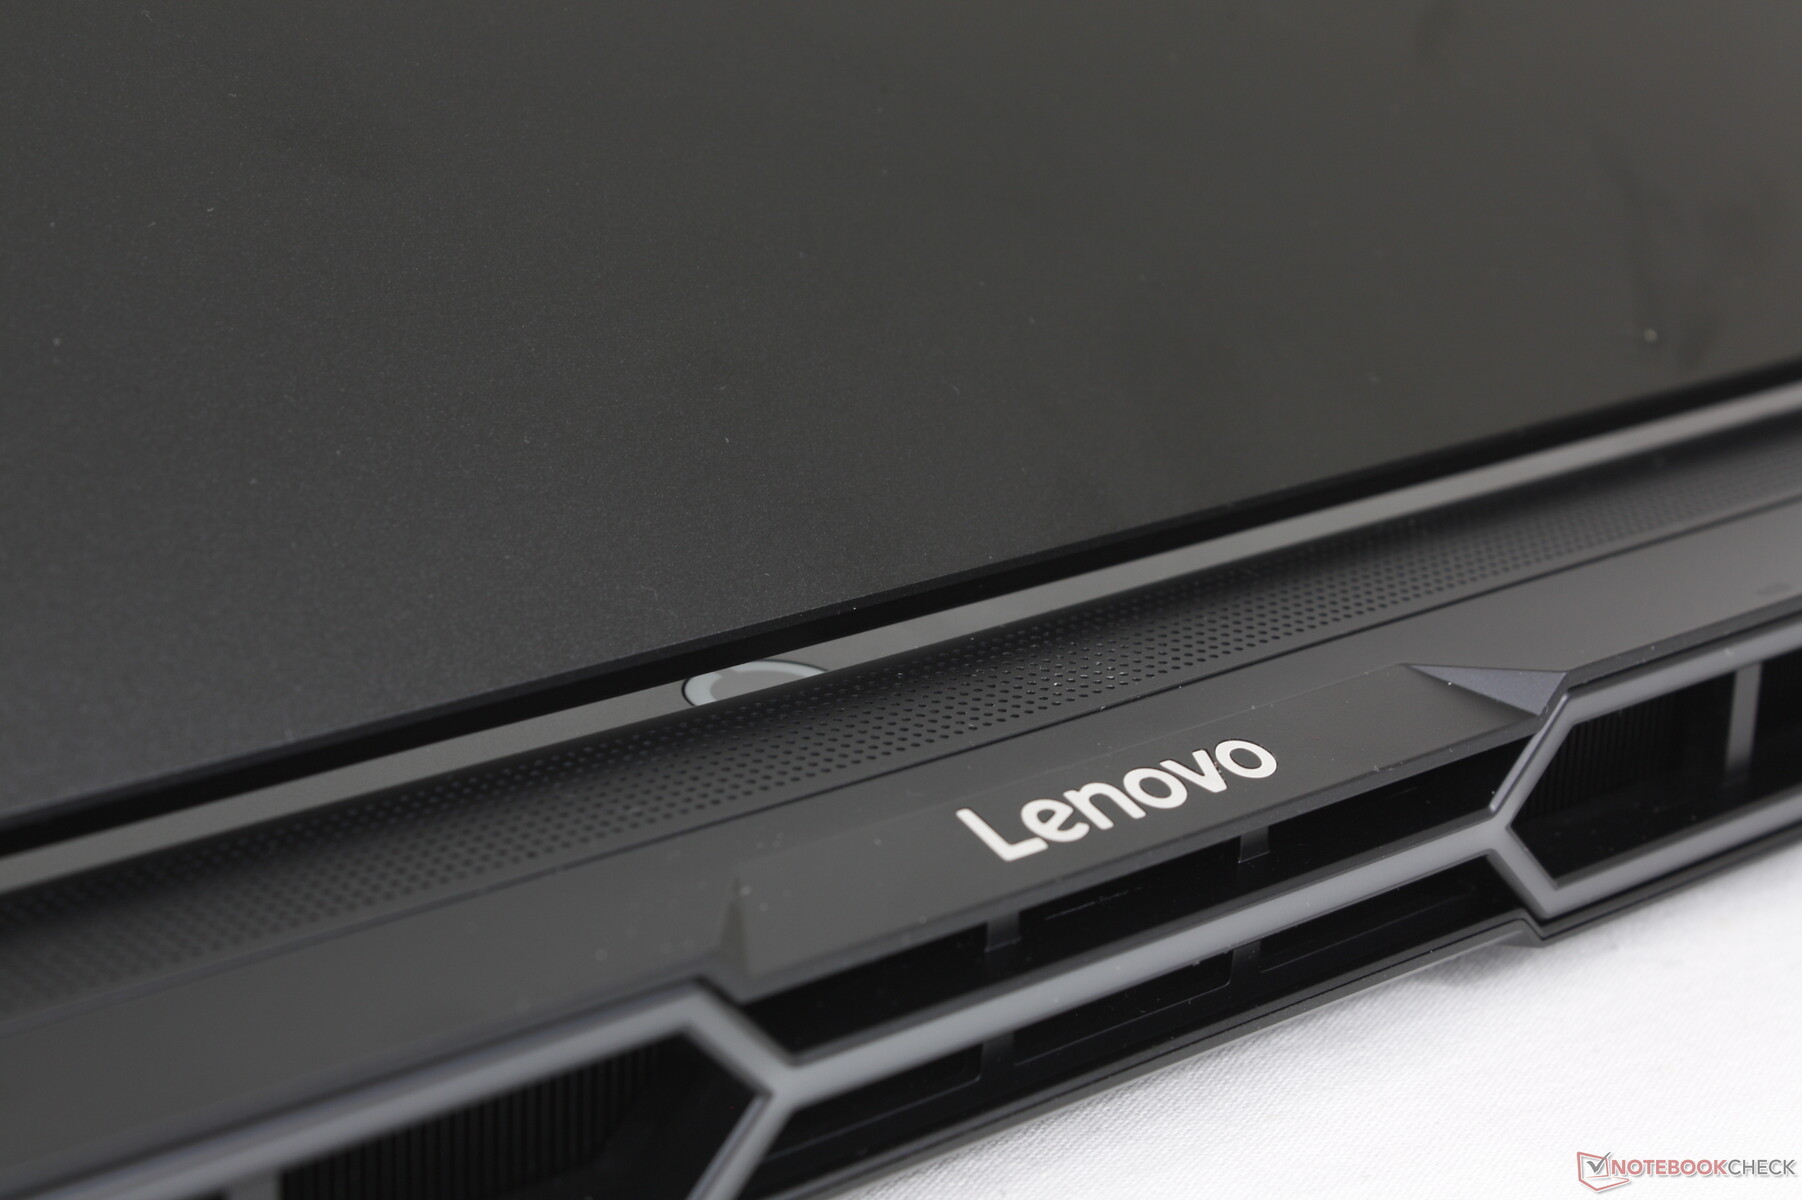
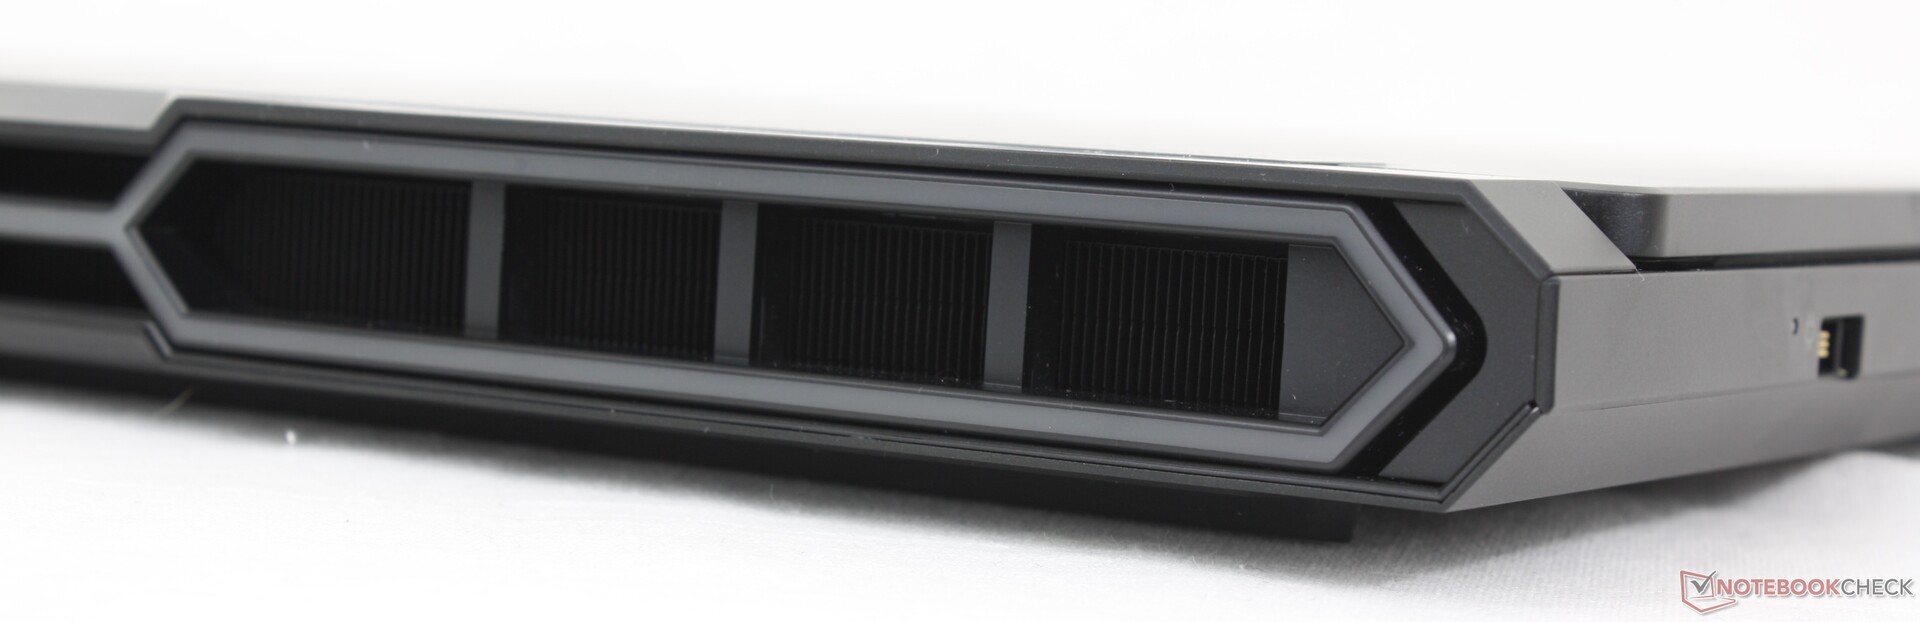
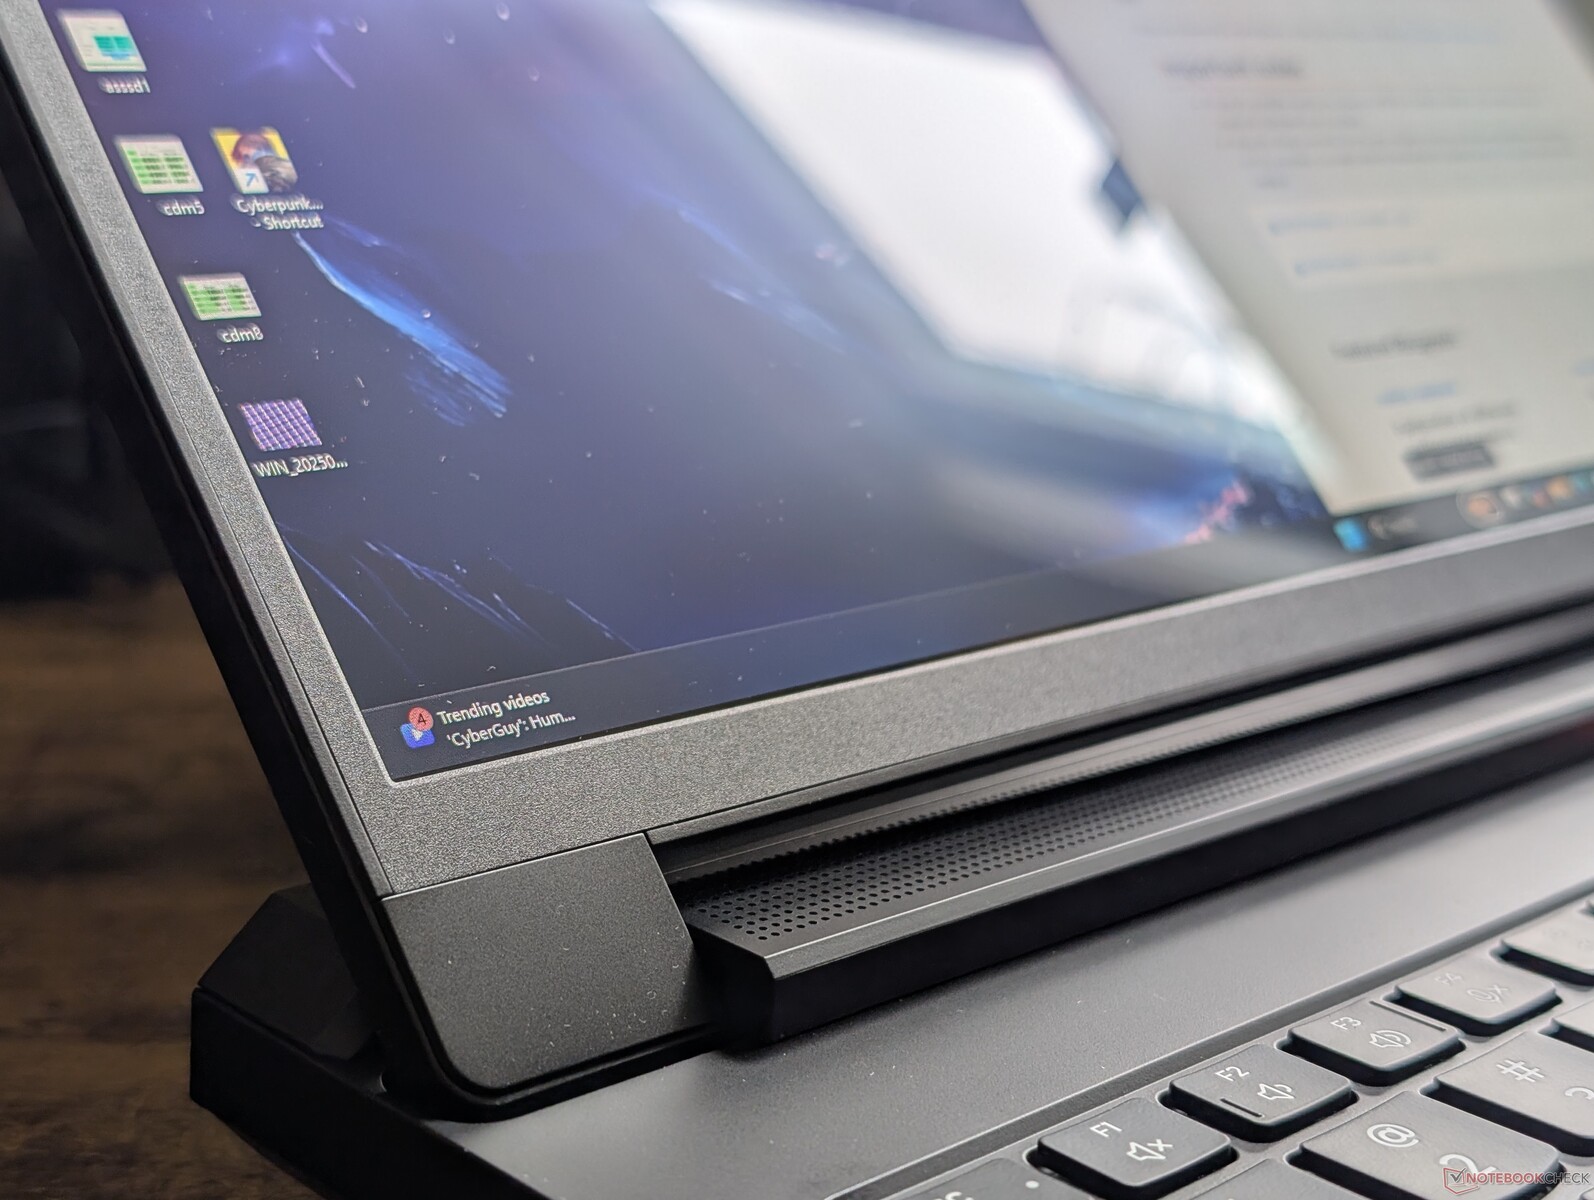
重新设计的机箱比以前更锋利、更坚固,前后边缘的新 LED 灯条也更 "玩家"。不过,深黑色的机身避免了一些竞争对手(如五颜六色的 Alienware 或微星)的华而不实。从各方面来看,这是联想迄今为止设计较好的游戏笔记本电脑之一。
遗憾的是,在这款全黑笔记本电脑上,几乎所有地方都很容易积累指纹,这一点与 雷蛇刀锋 16.
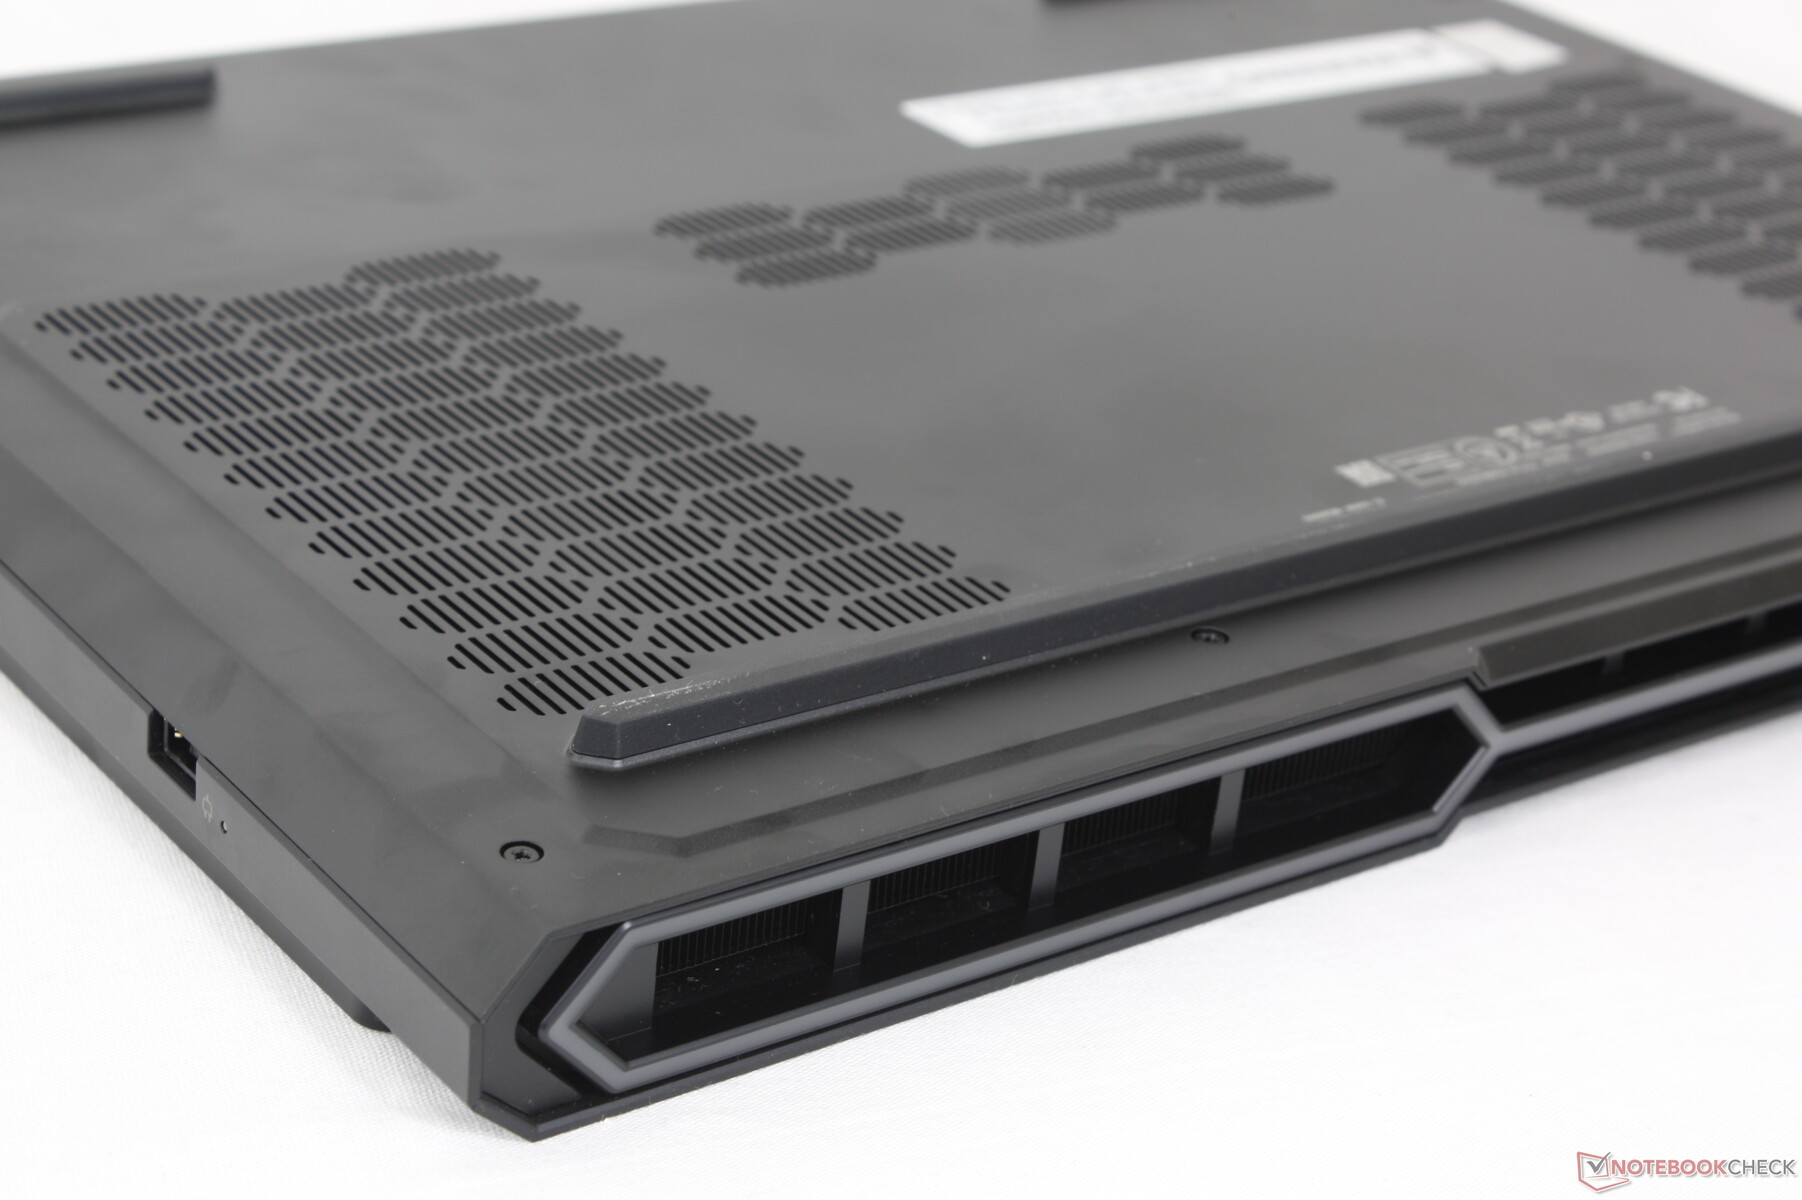
与去年的设计相比,这款机型的占地面积更大,因为后部的散热解决方案扩大了,而整体重量和厚度几乎与去年相同。 它当然不是 Blade 16 或 Zephyrus G16 那样的轻薄型游戏机,但仍比微星 Vector 16 HX 等其他一些 16 英寸游戏机更小更轻。
连接性
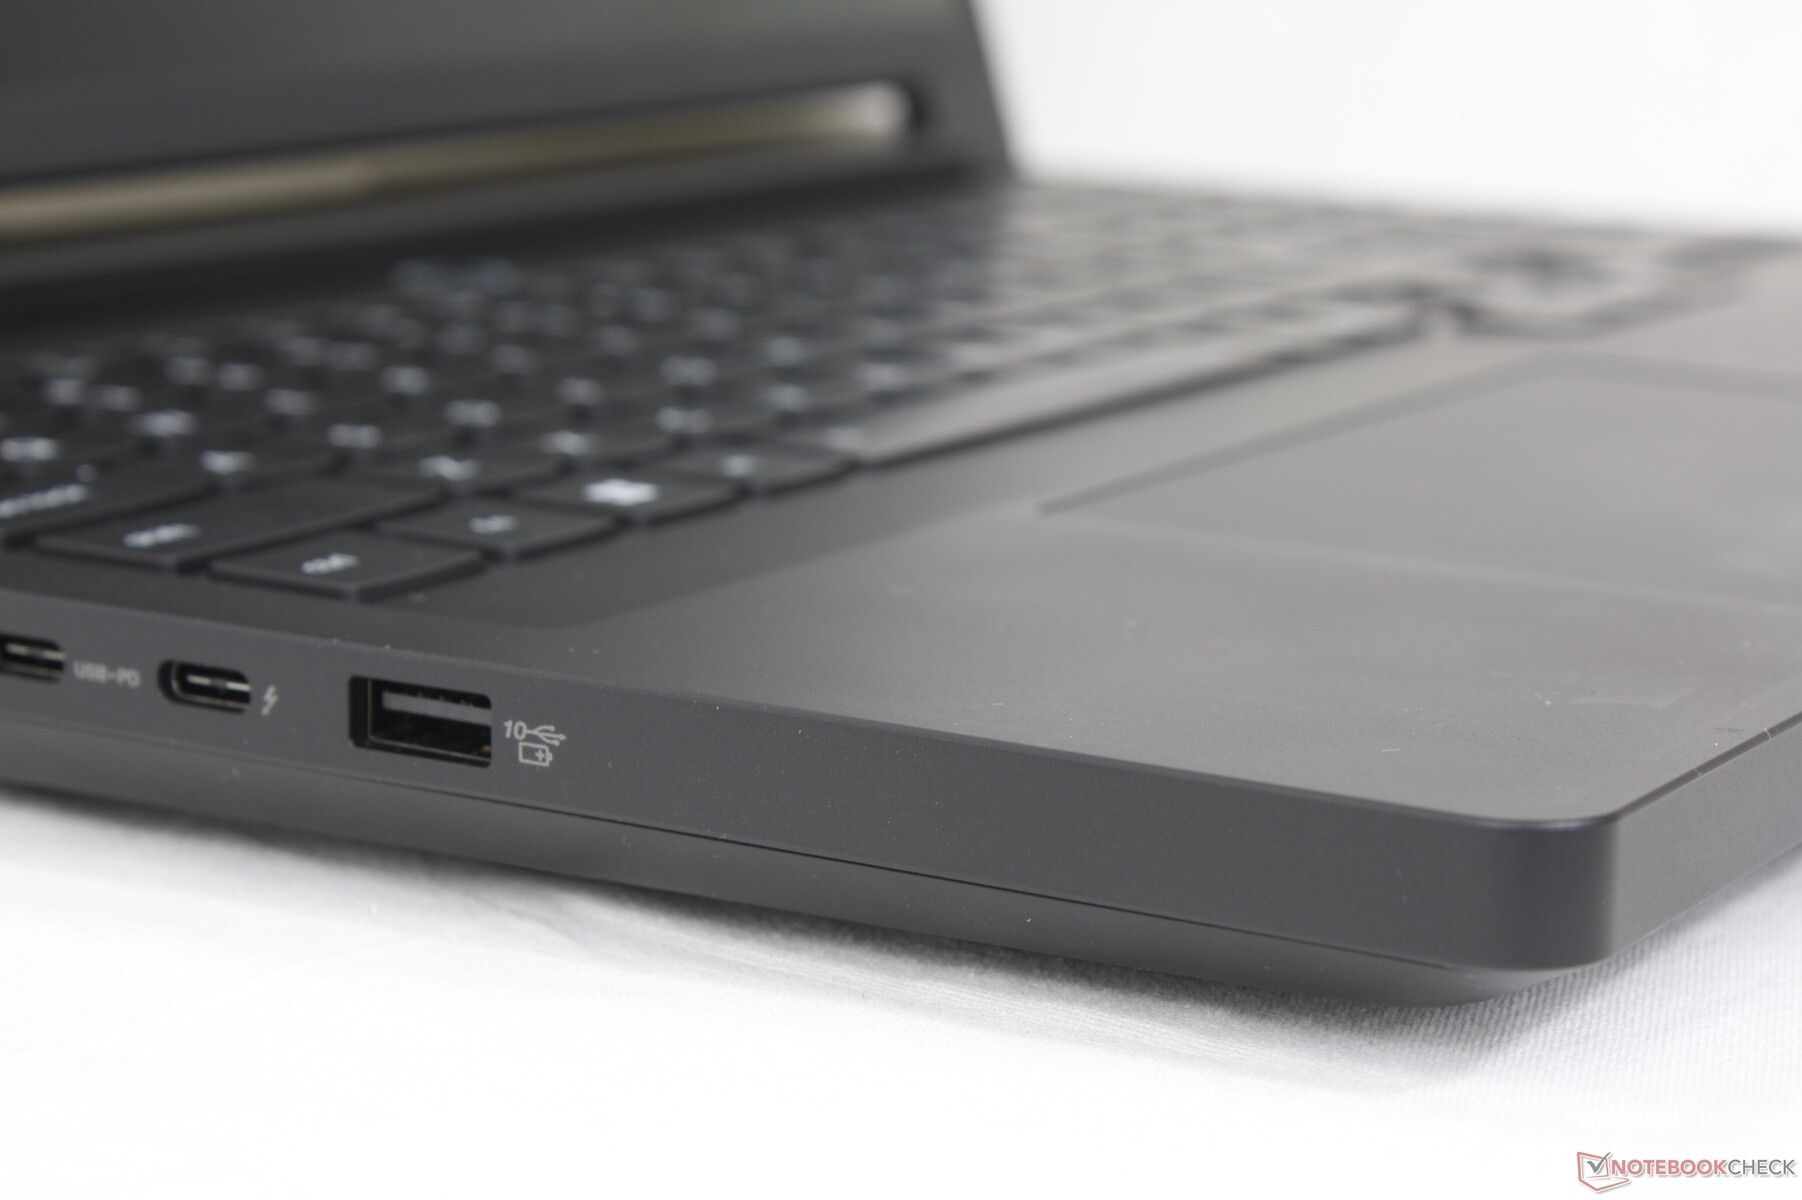
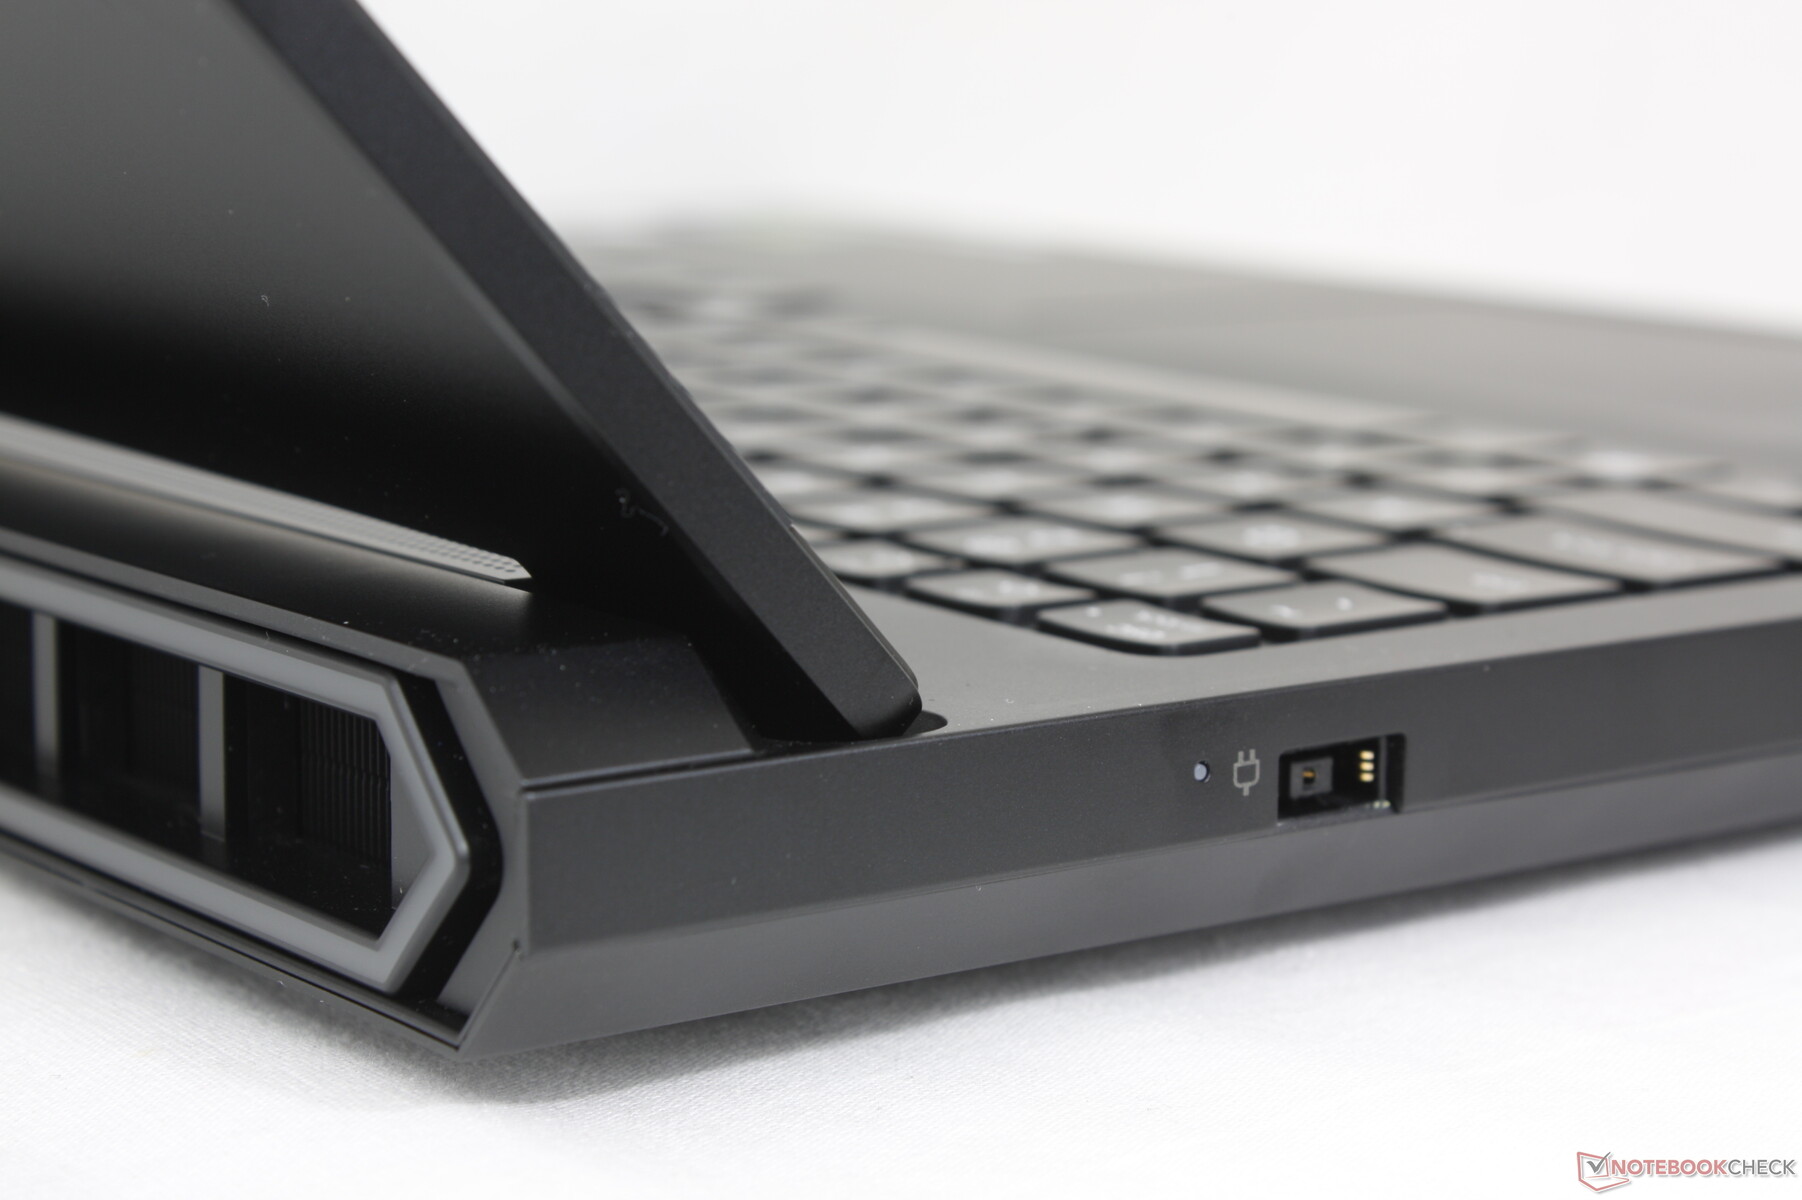
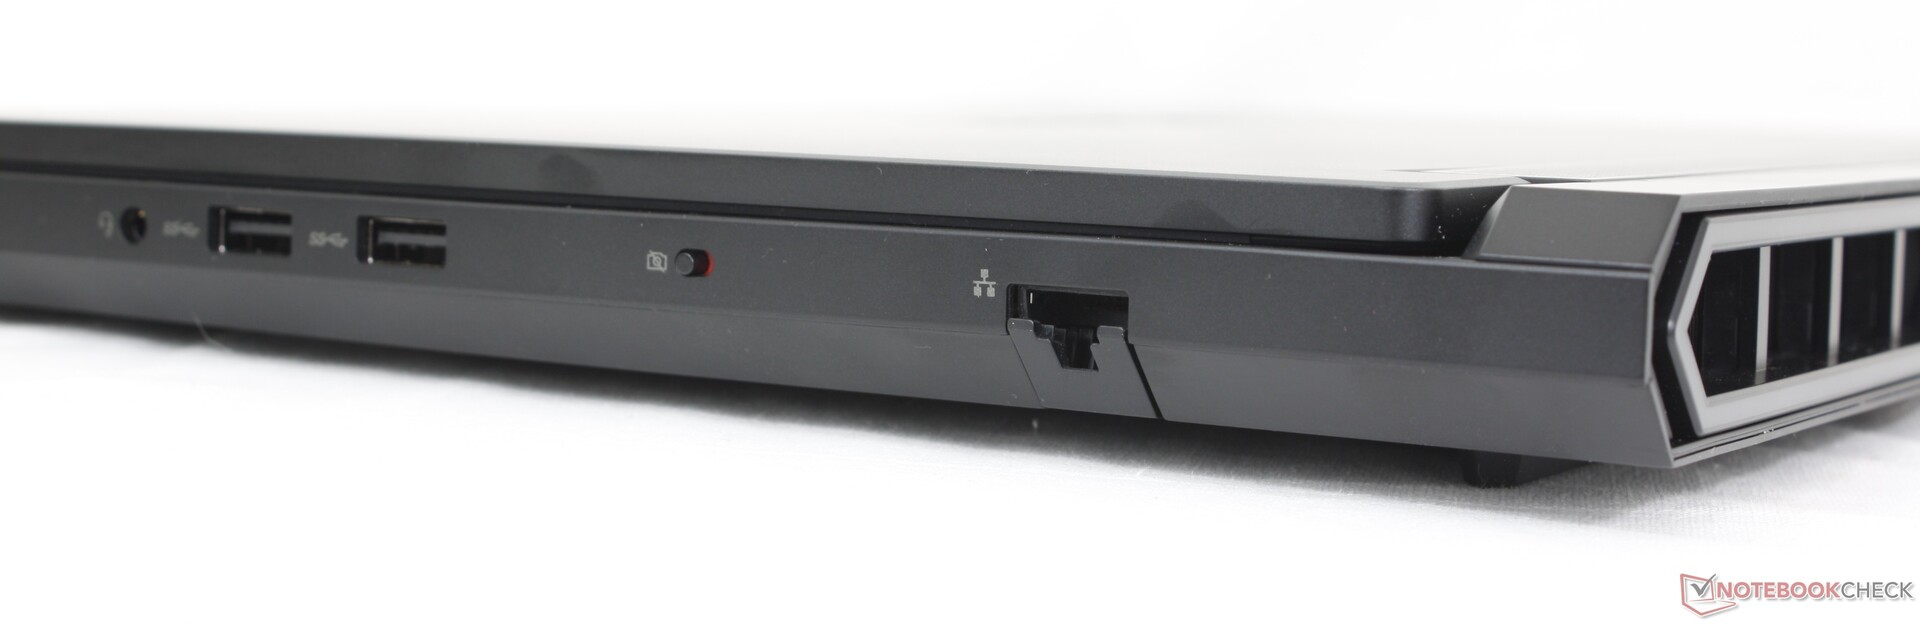
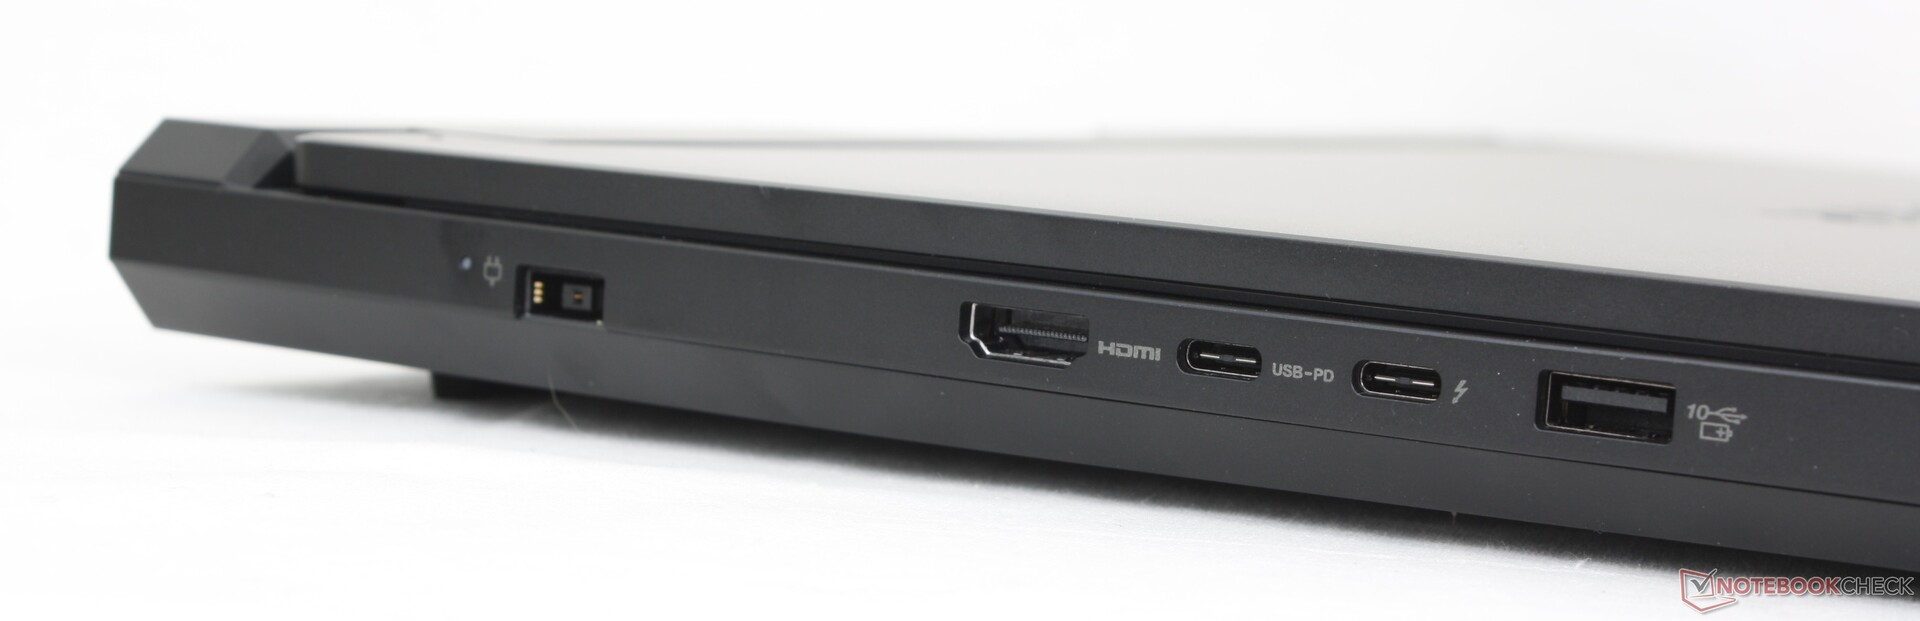
端口选项和定位与去年相比进行了全面修改 Legion 9 16IRX9或Legion 7 16 G9。集成的 SD 读卡器和第三个 usb-c 端口不见了,取而代之的是一个 RJ-45 端口和一个额外的 usb-a 端口。为了方便用户使用,机身背面没有设置任何端口。
请记住,两个 USB-C 端口中只有一个支持 DisplayPort 2.1 和 Thunderbolt 4 连接,而另一个 USB-C 端口(离用户最远的那个)支持 140 W PD 充电。
交流
英特尔 BE200 标配 Wi-Fi 7 和蓝牙 5.4 连接功能。
网络摄像头
标配 500 万像素网络摄像头,采用电子快门,无红外传感器。


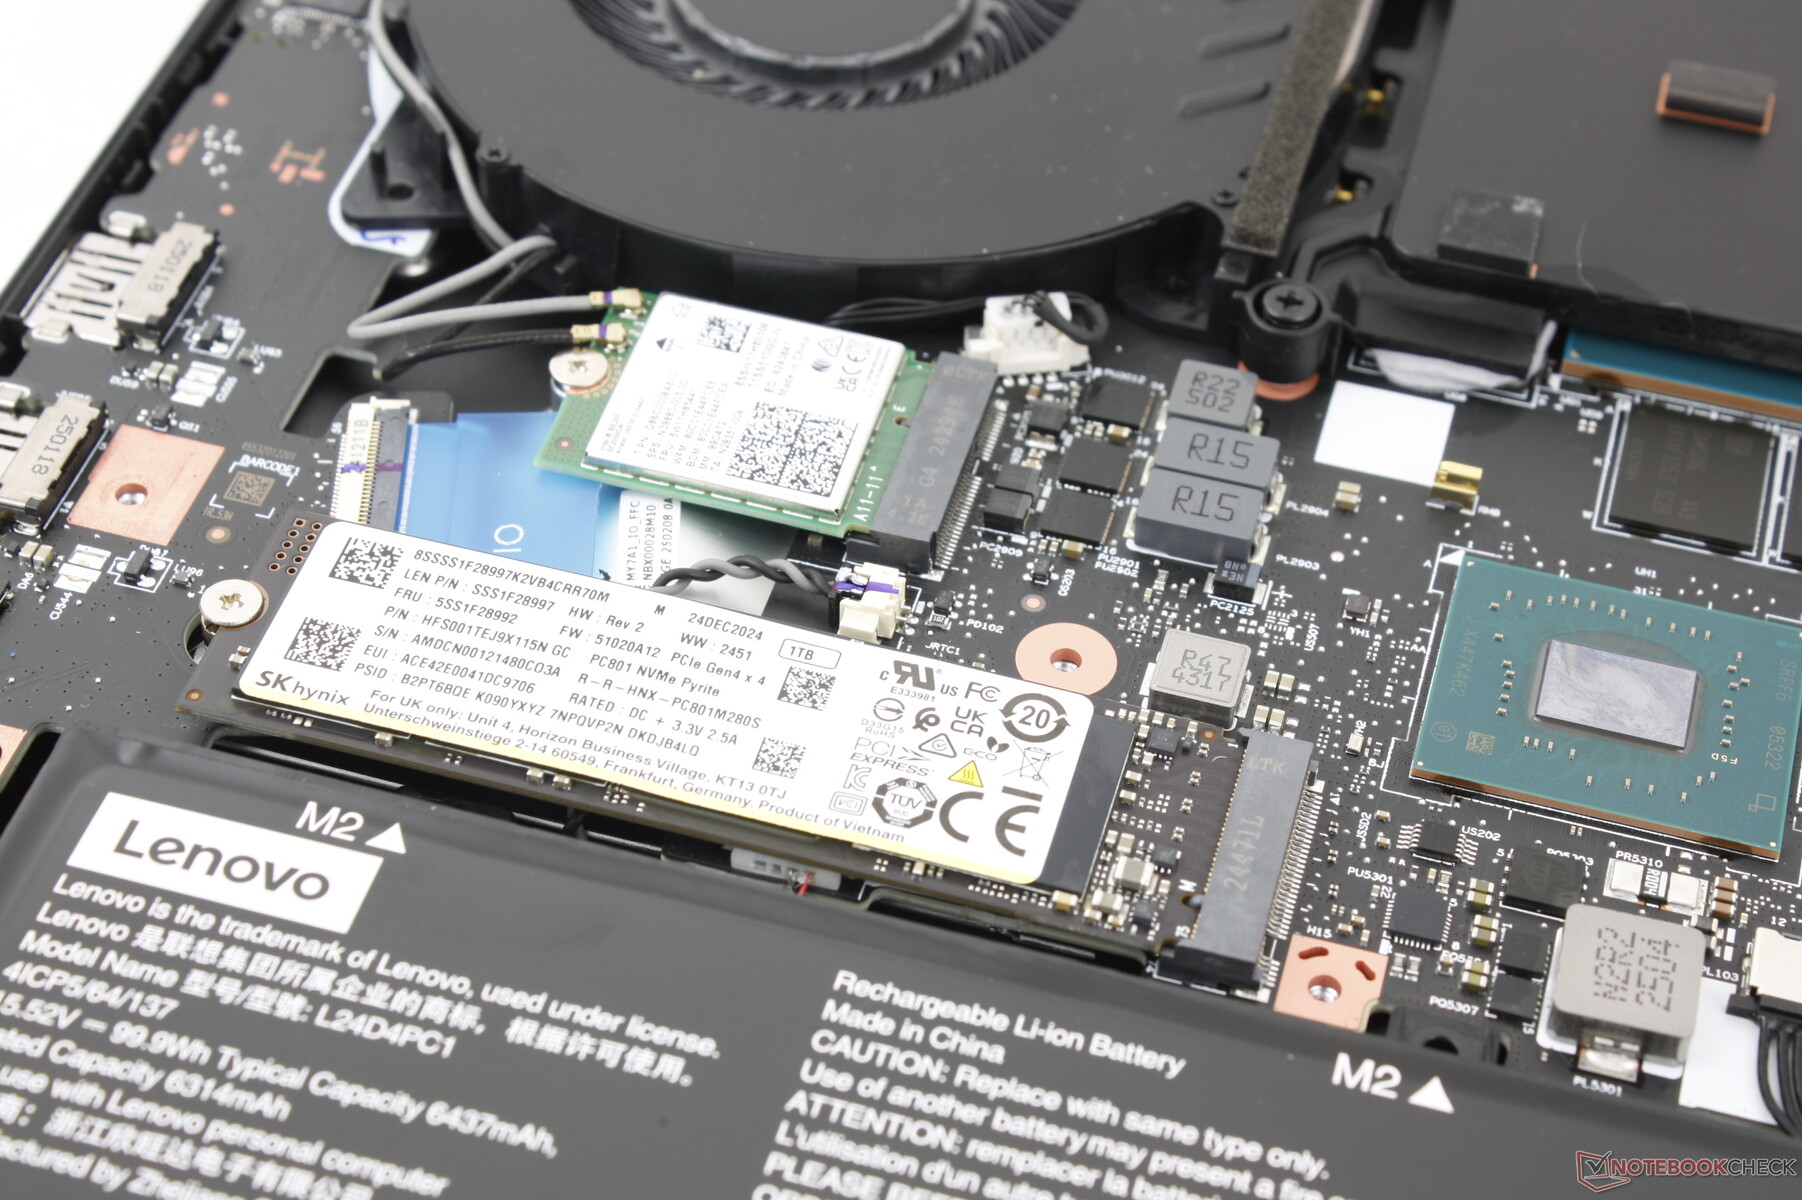
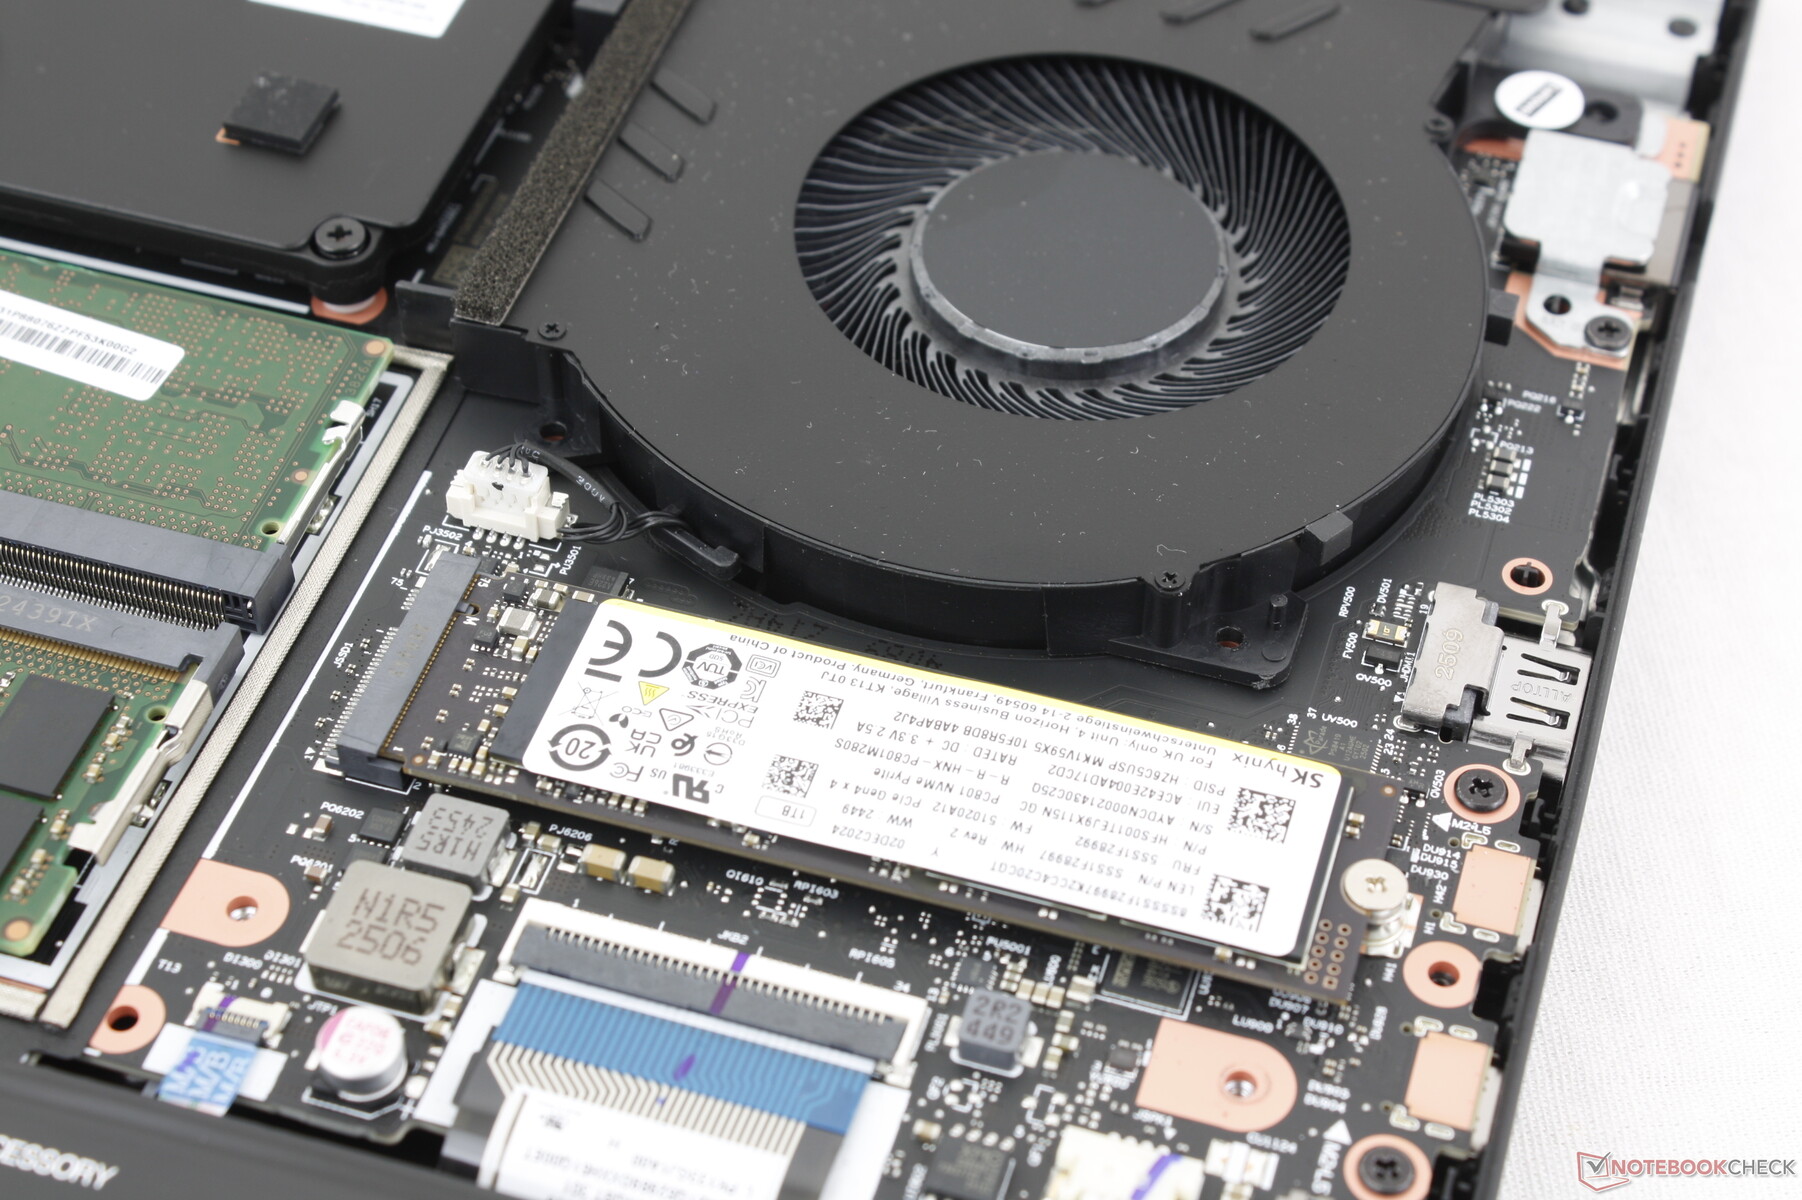
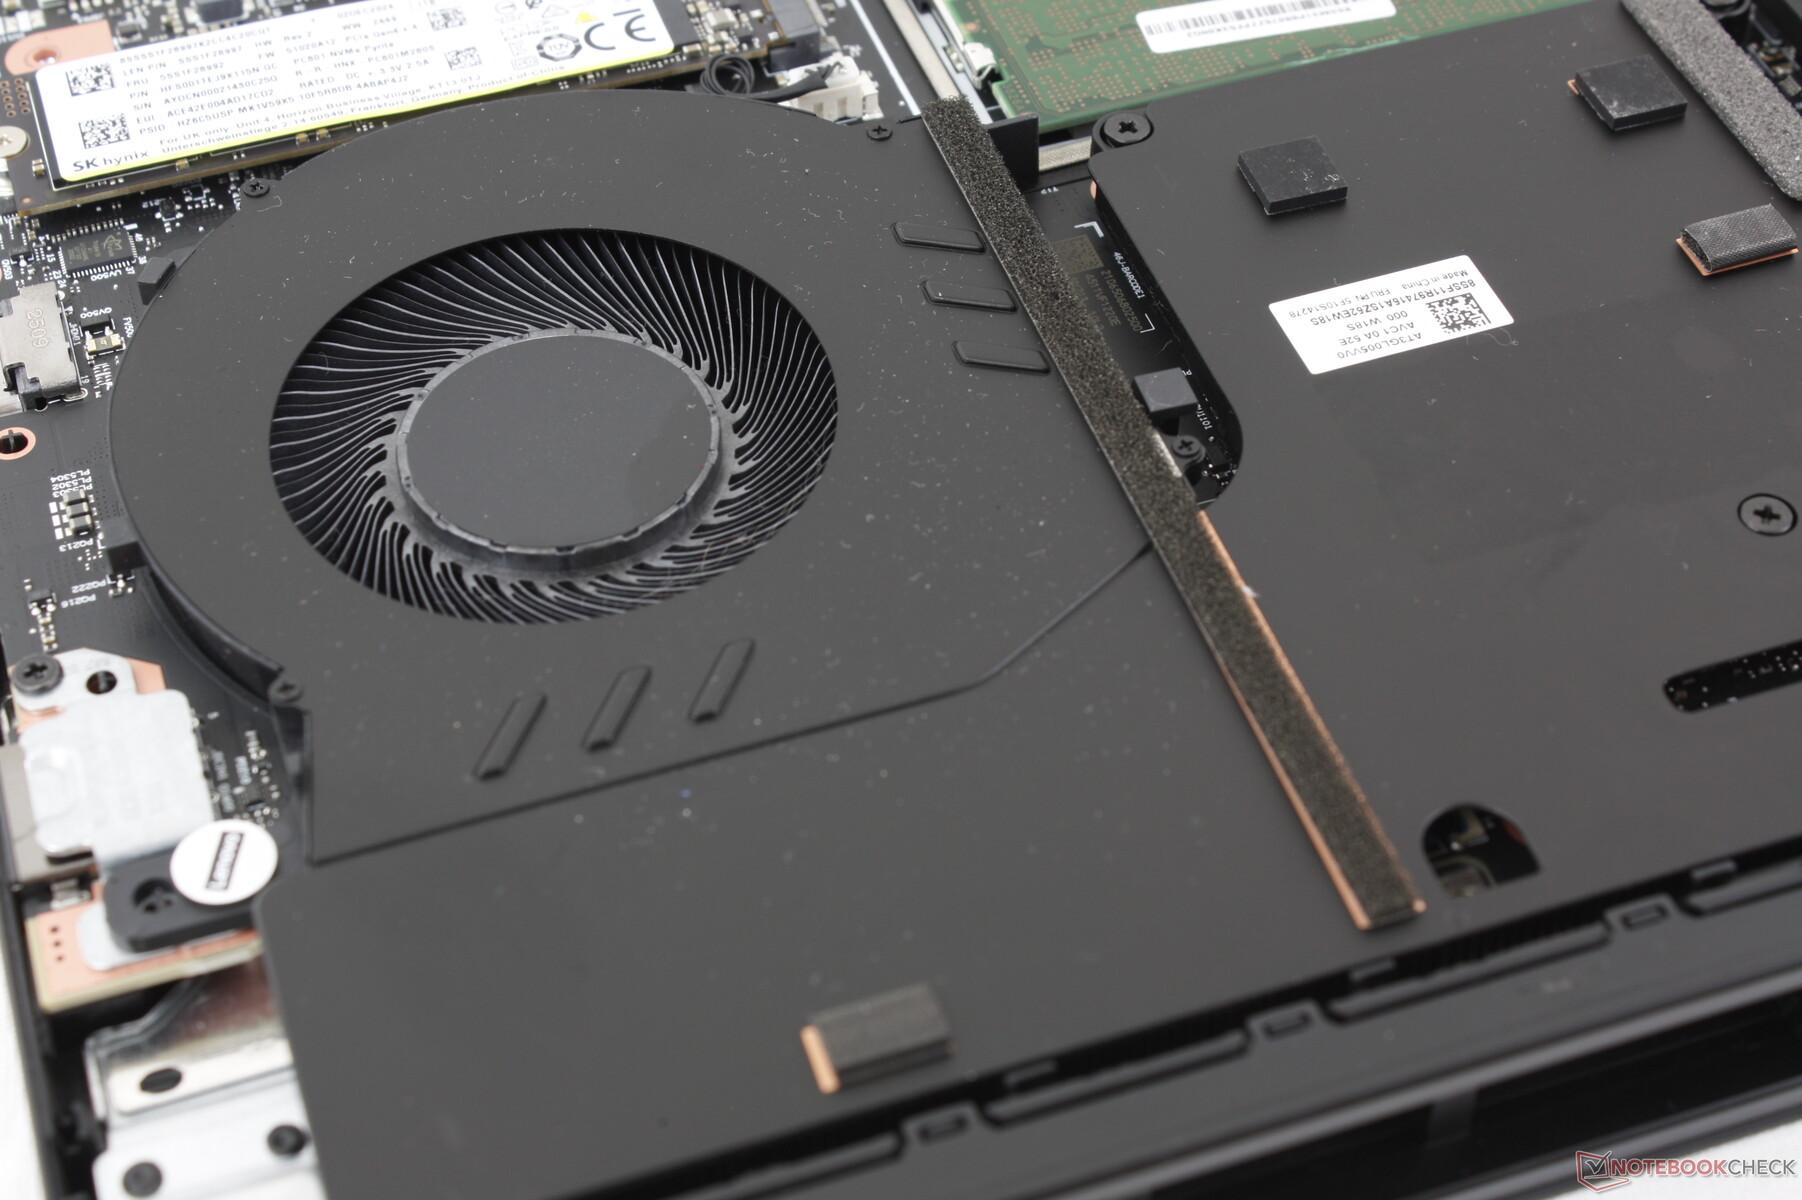
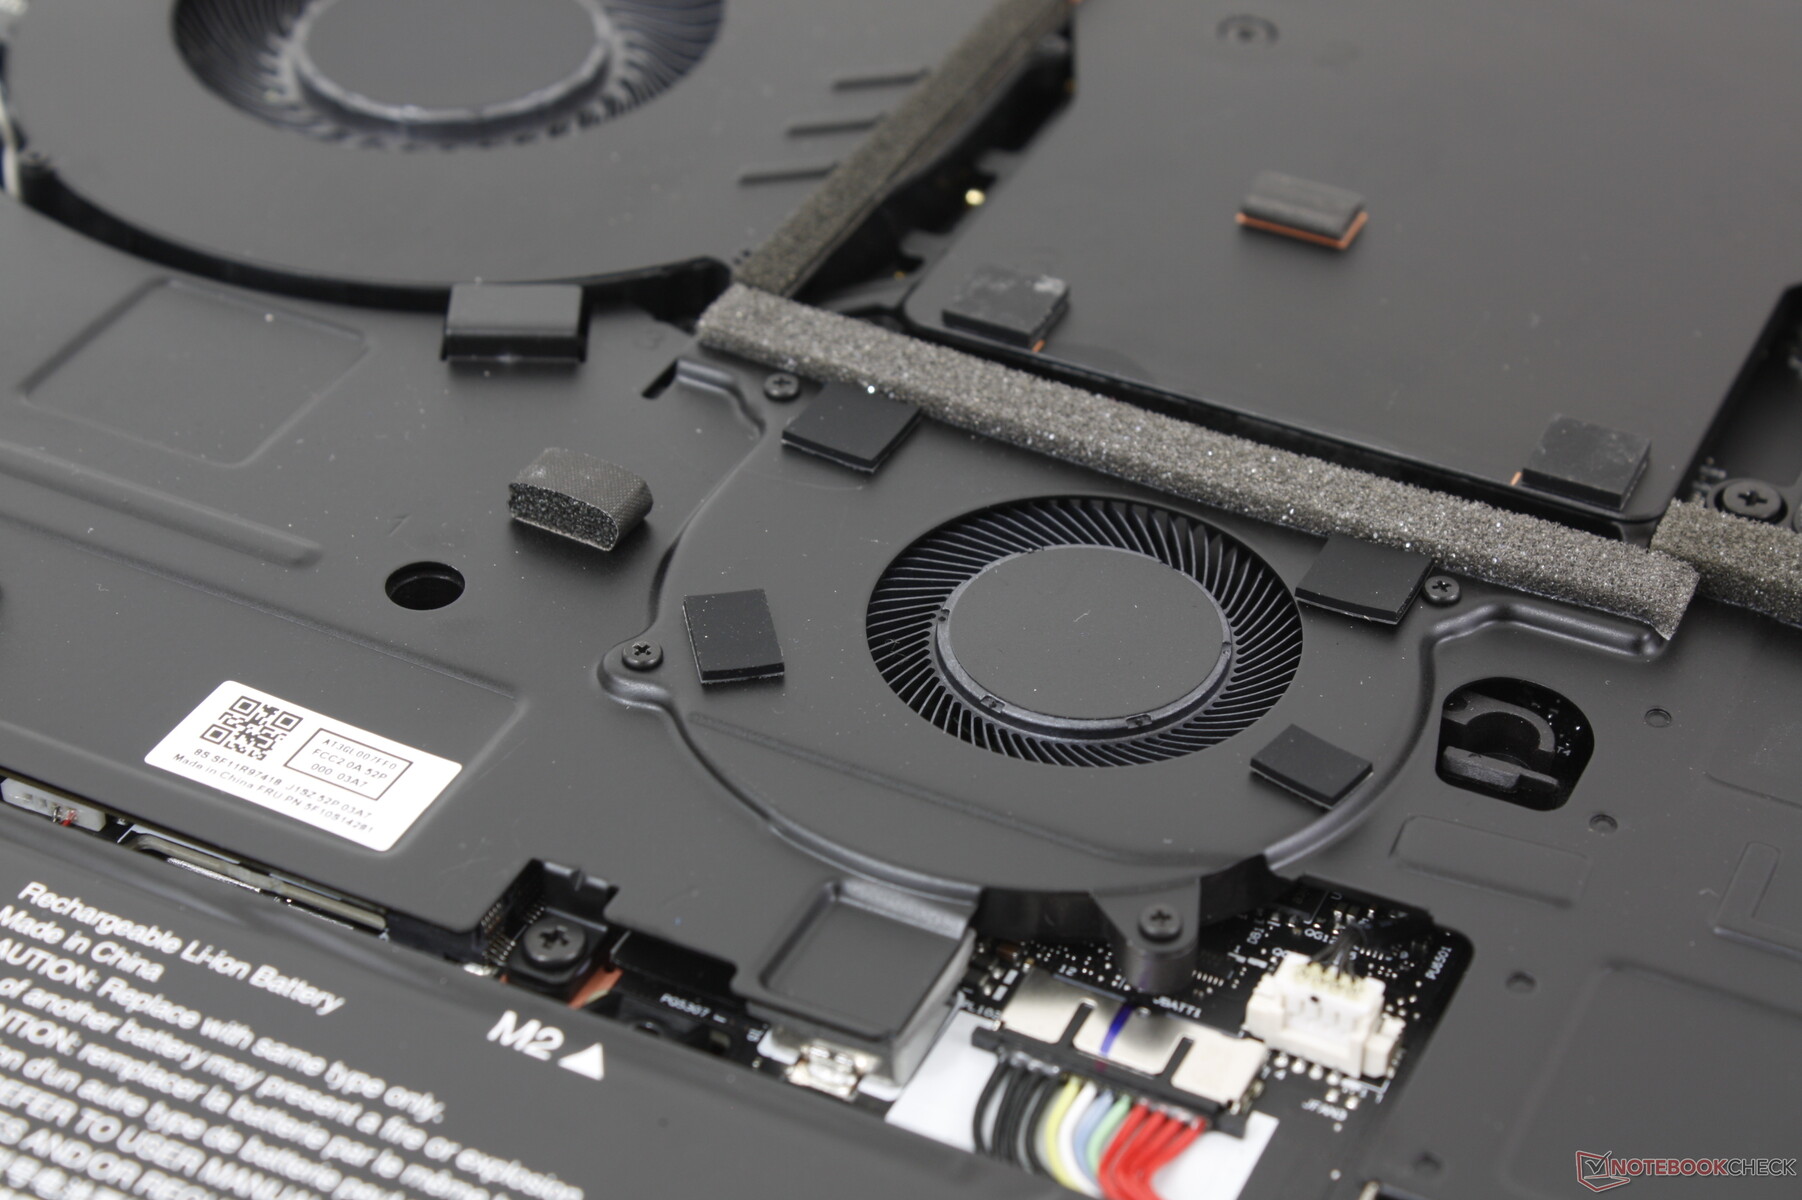
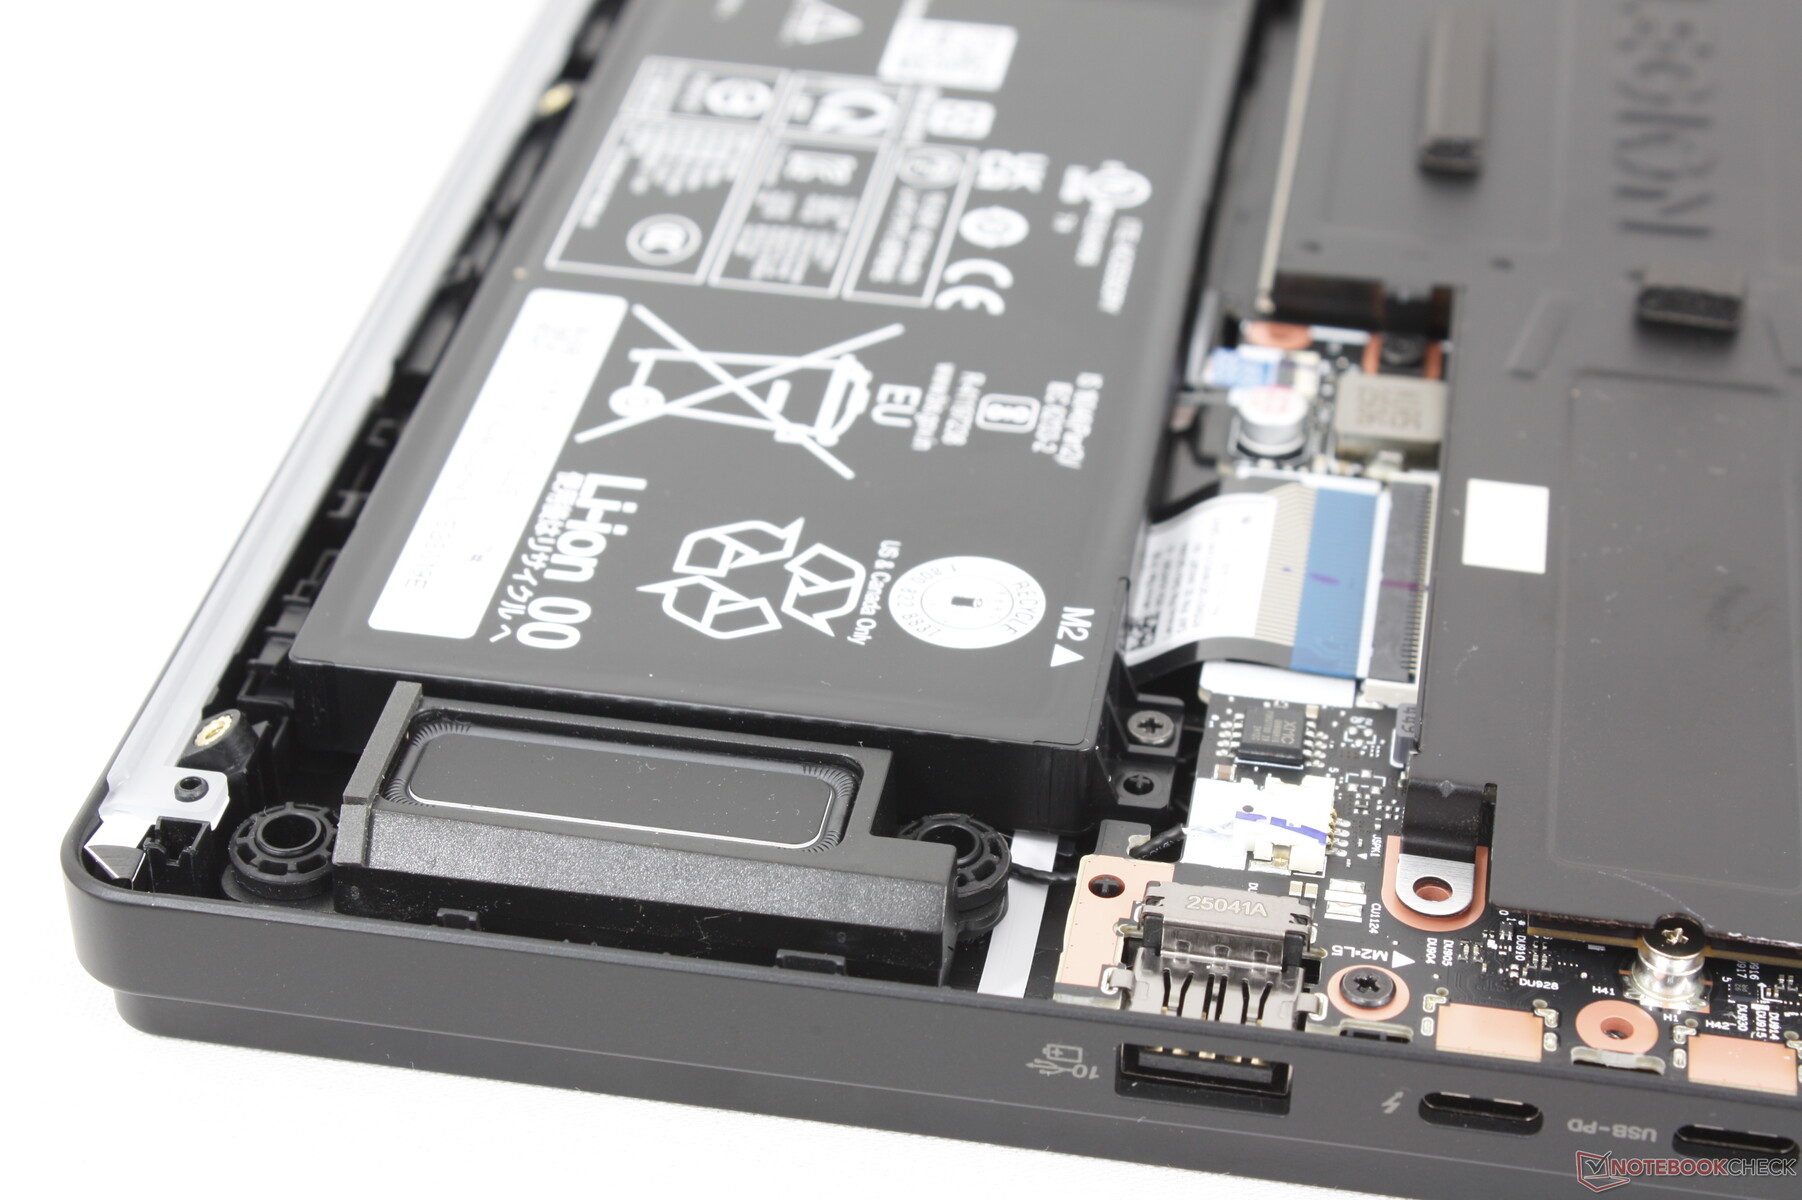
维护
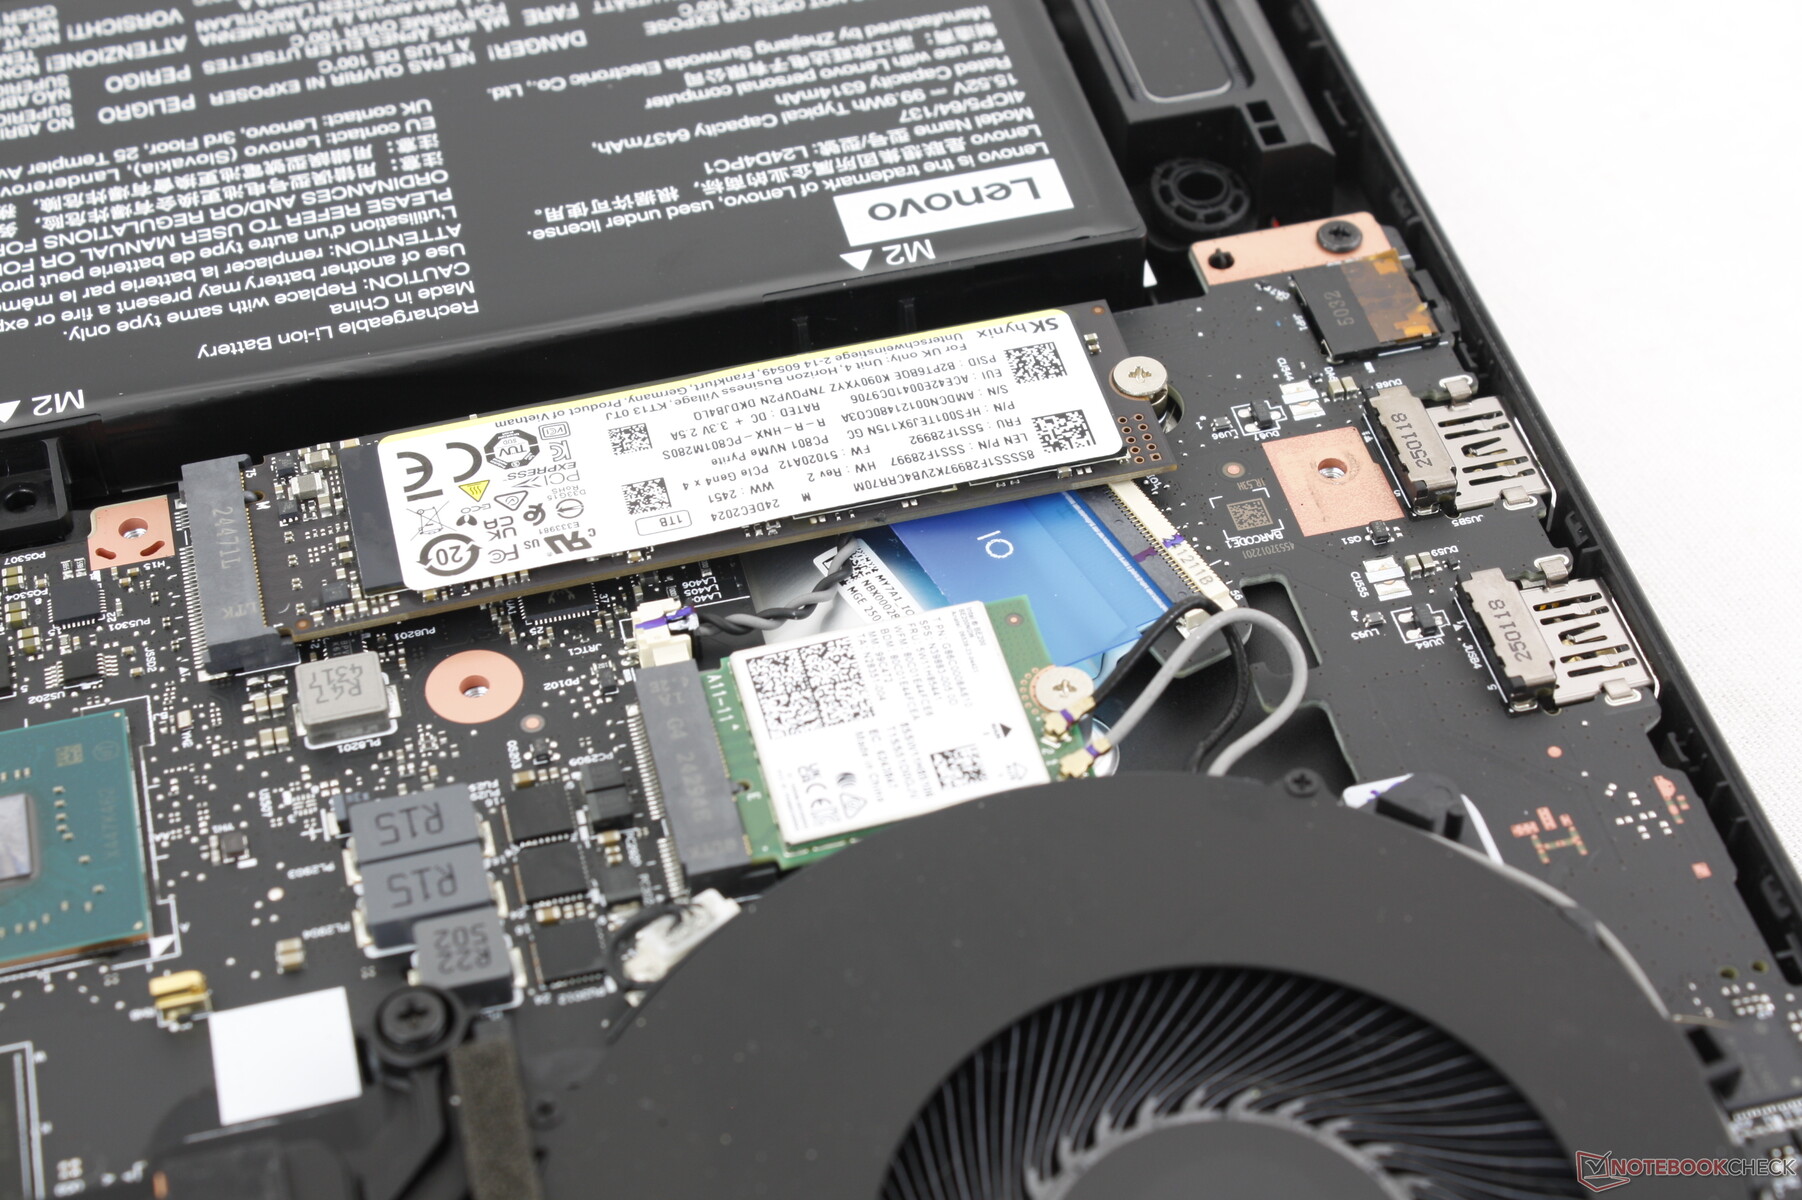
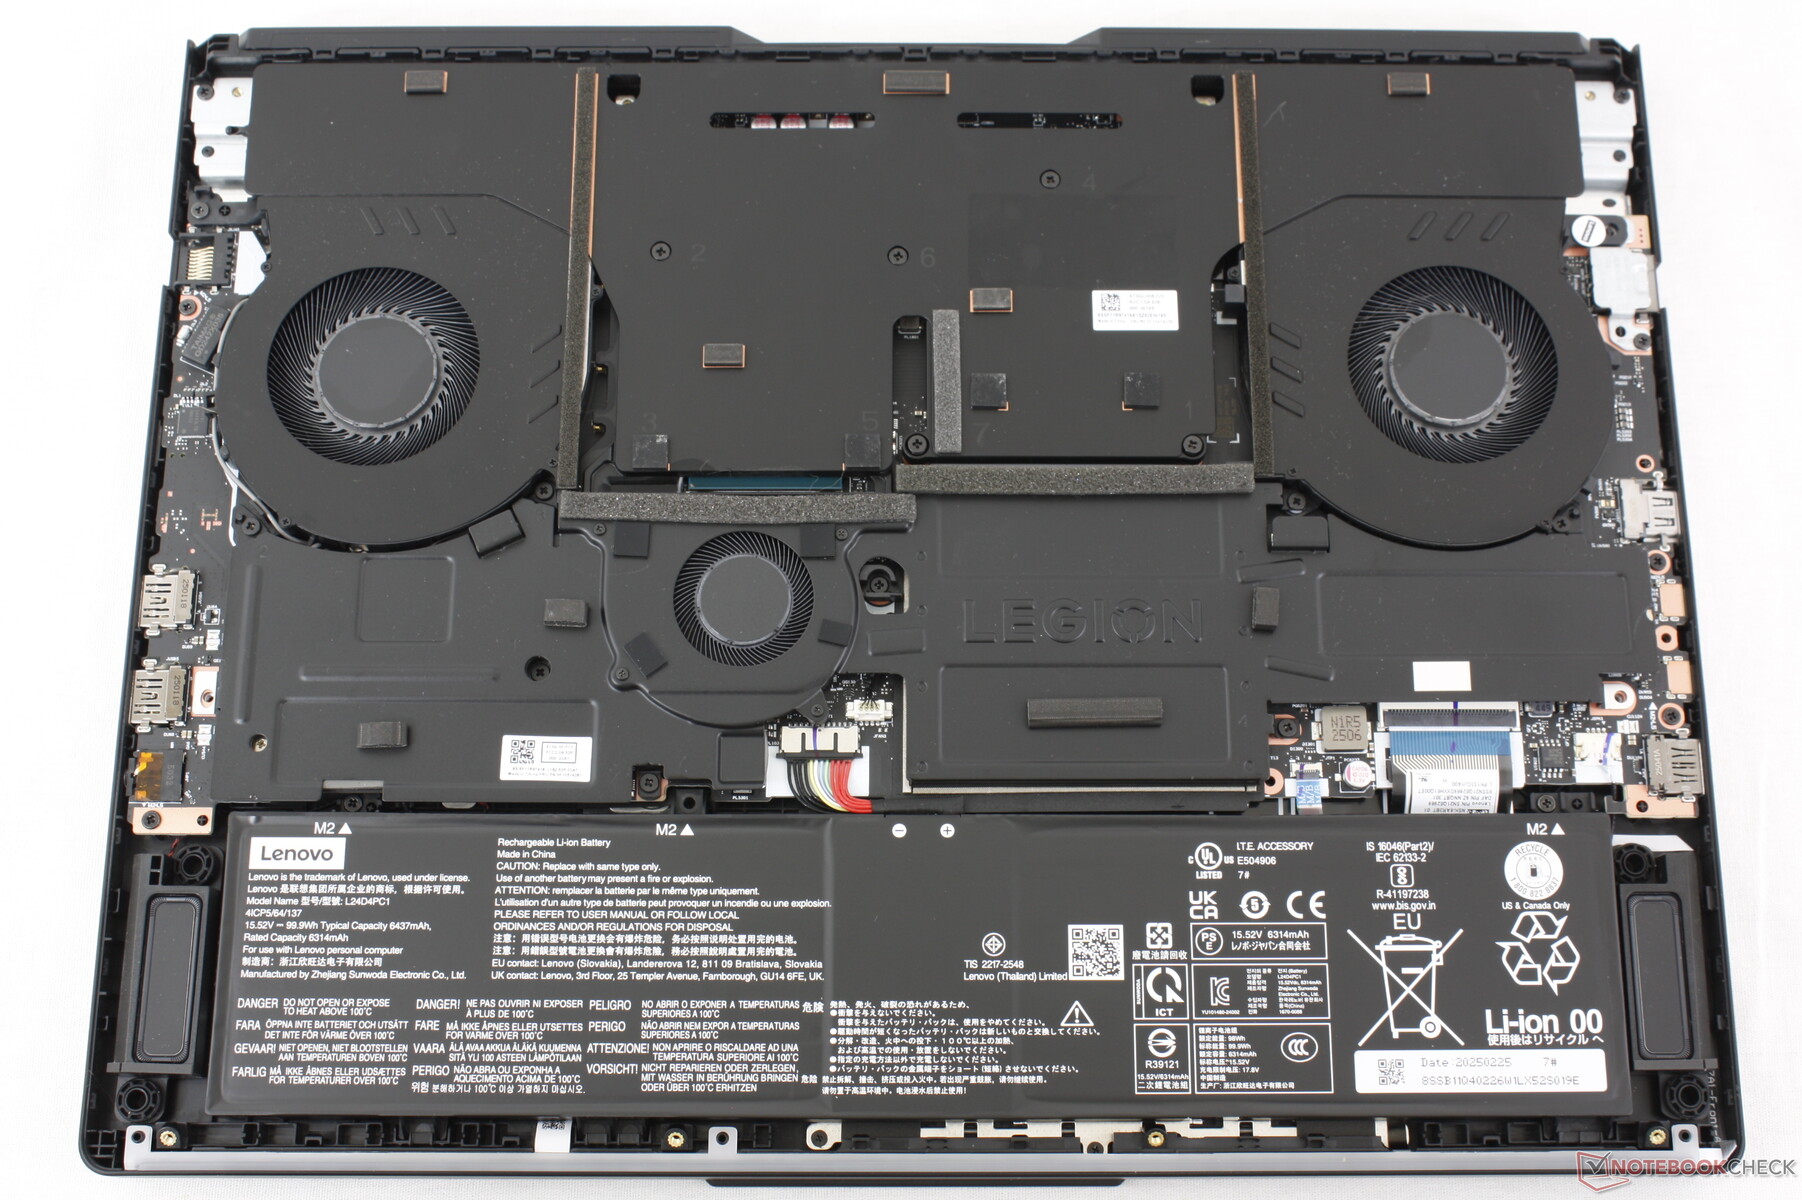
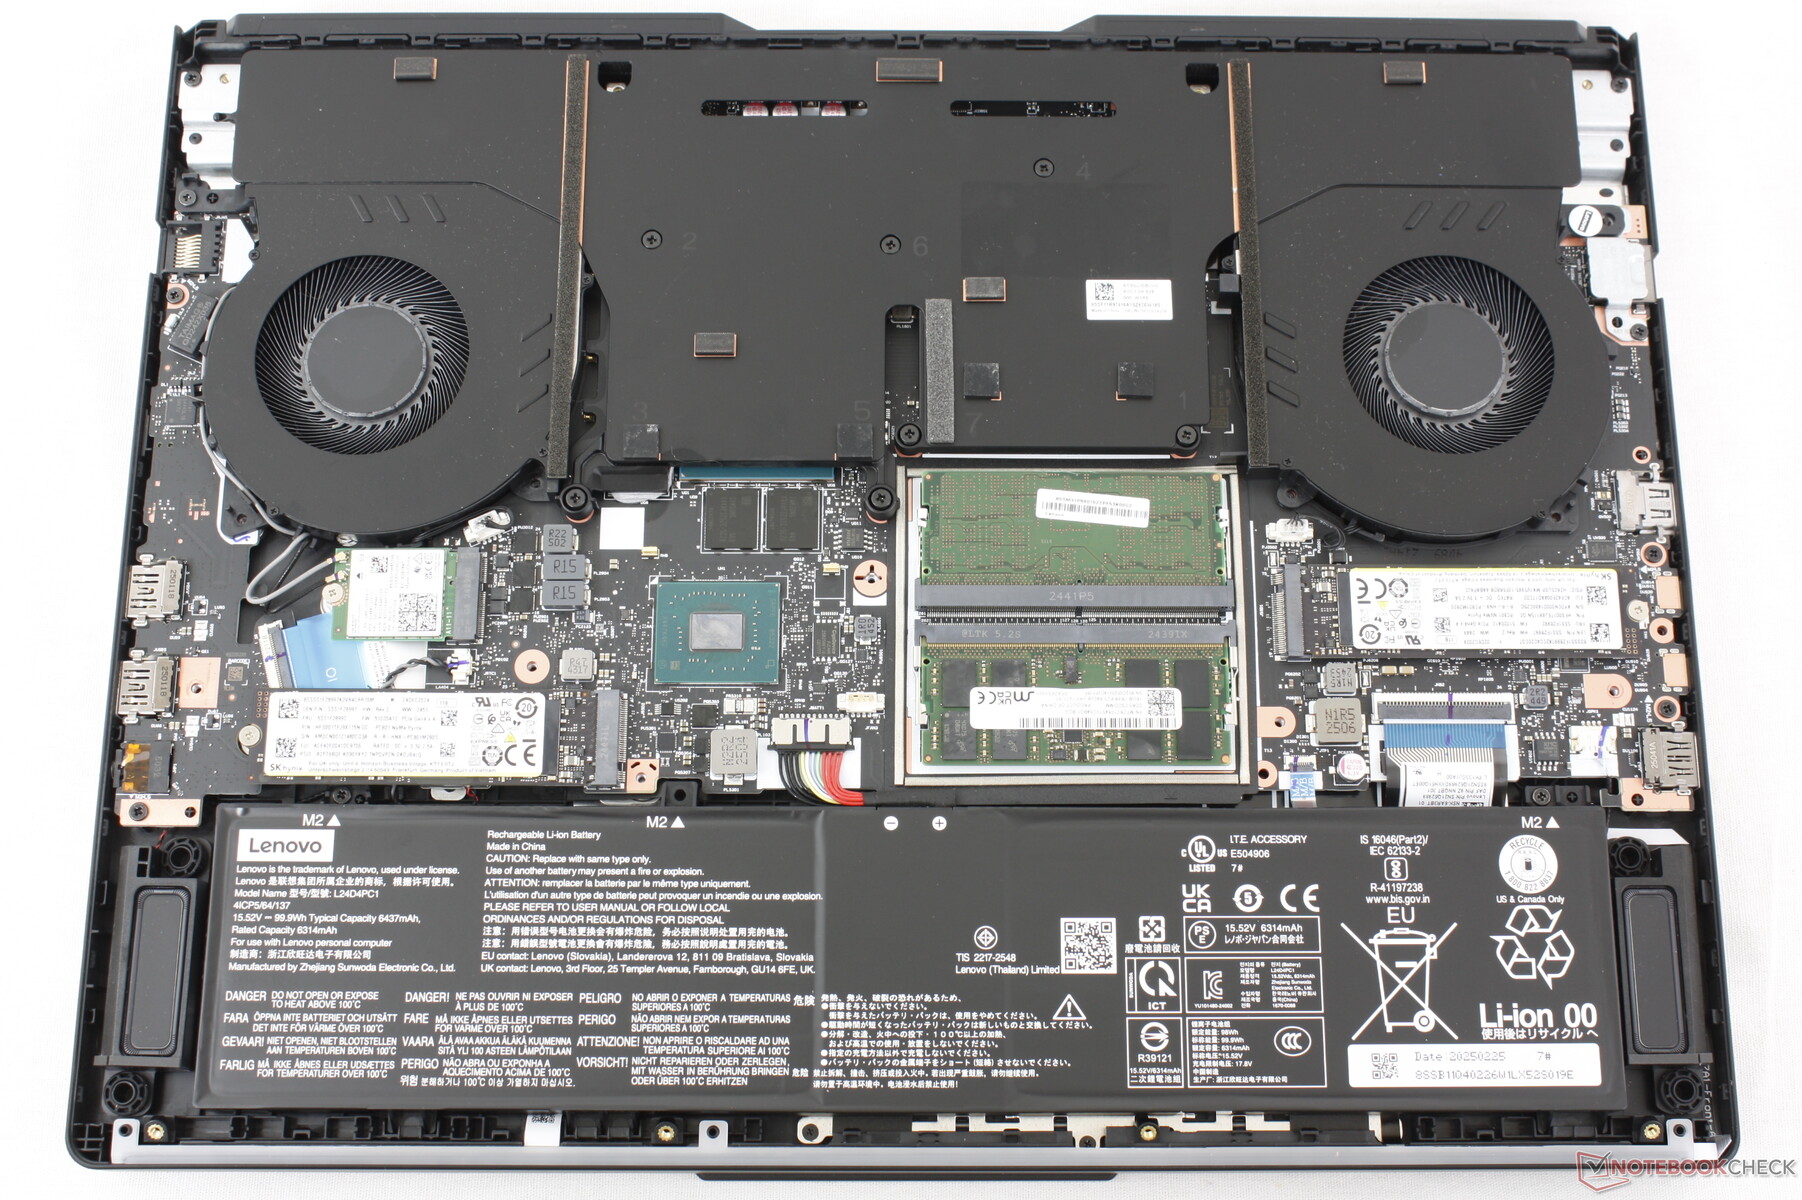
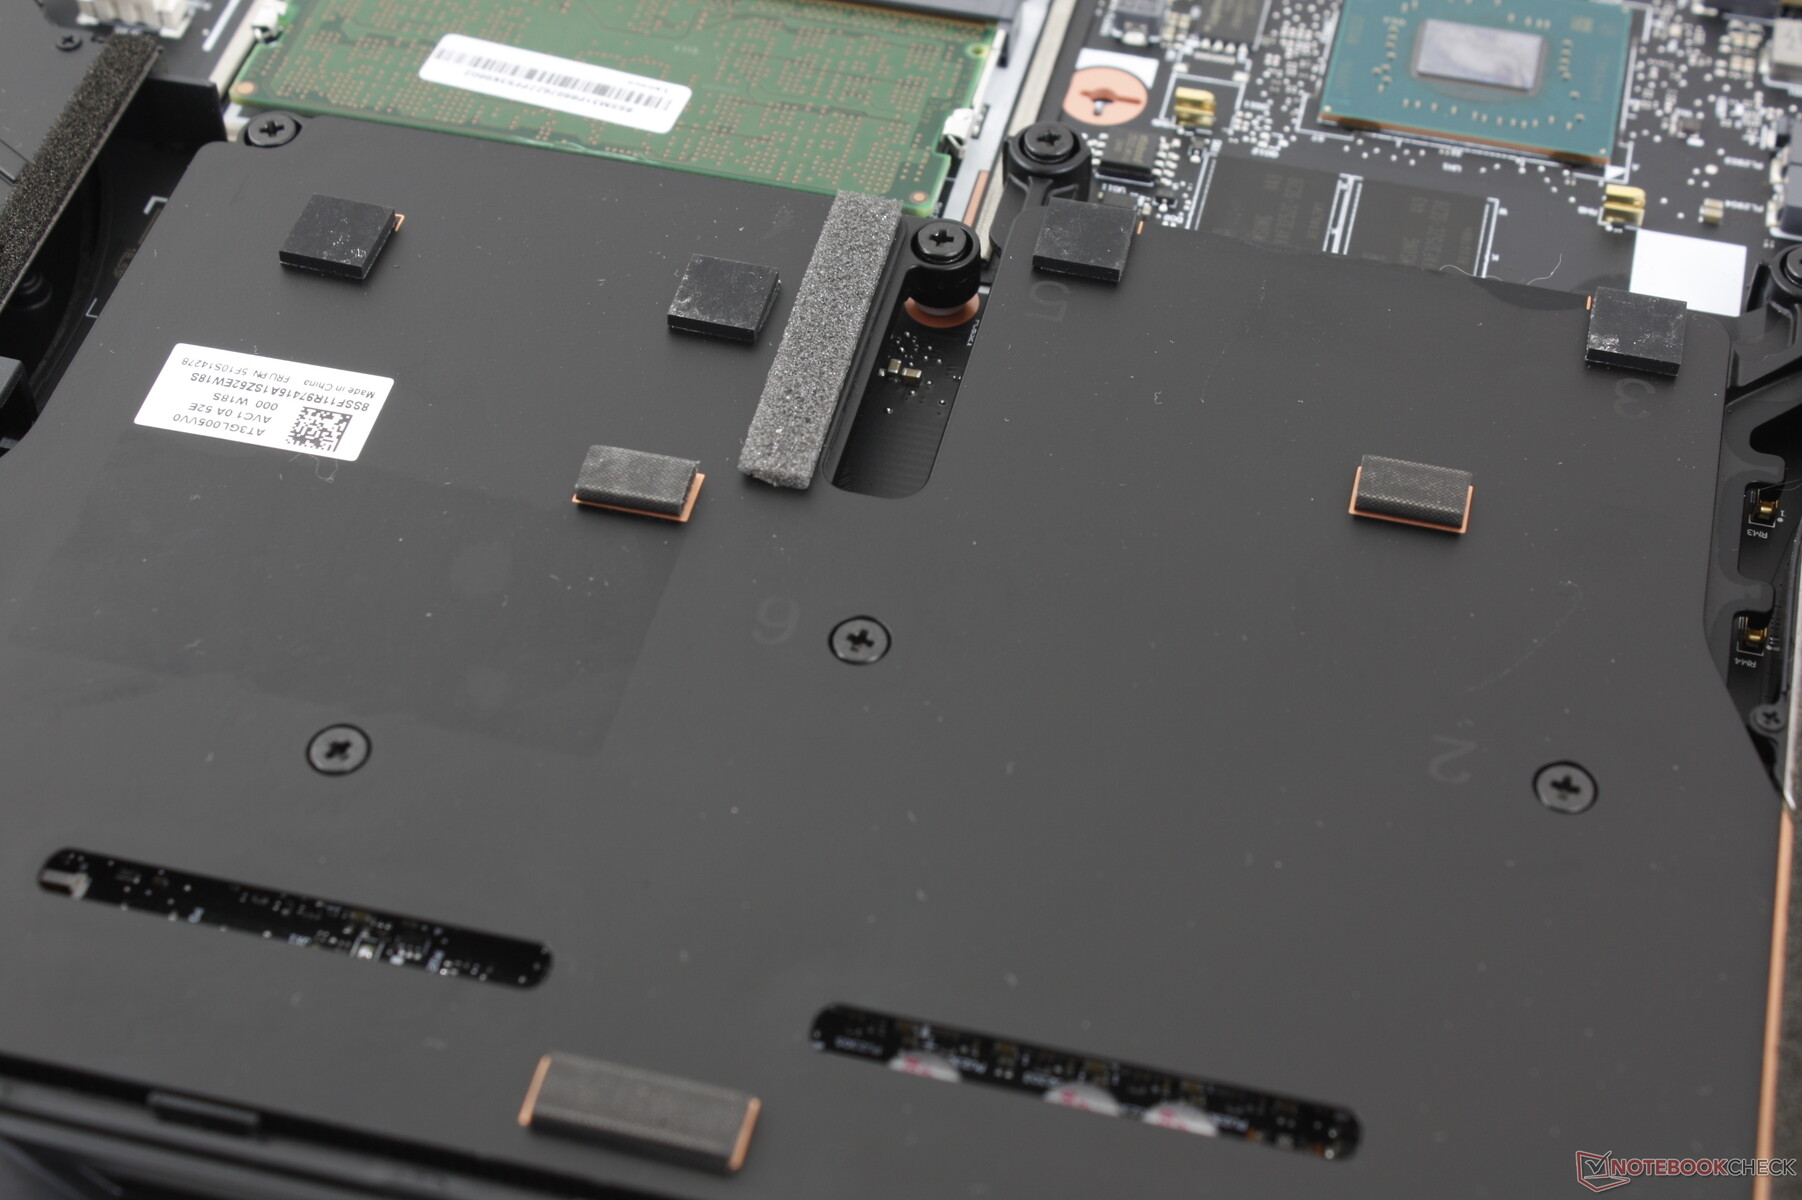
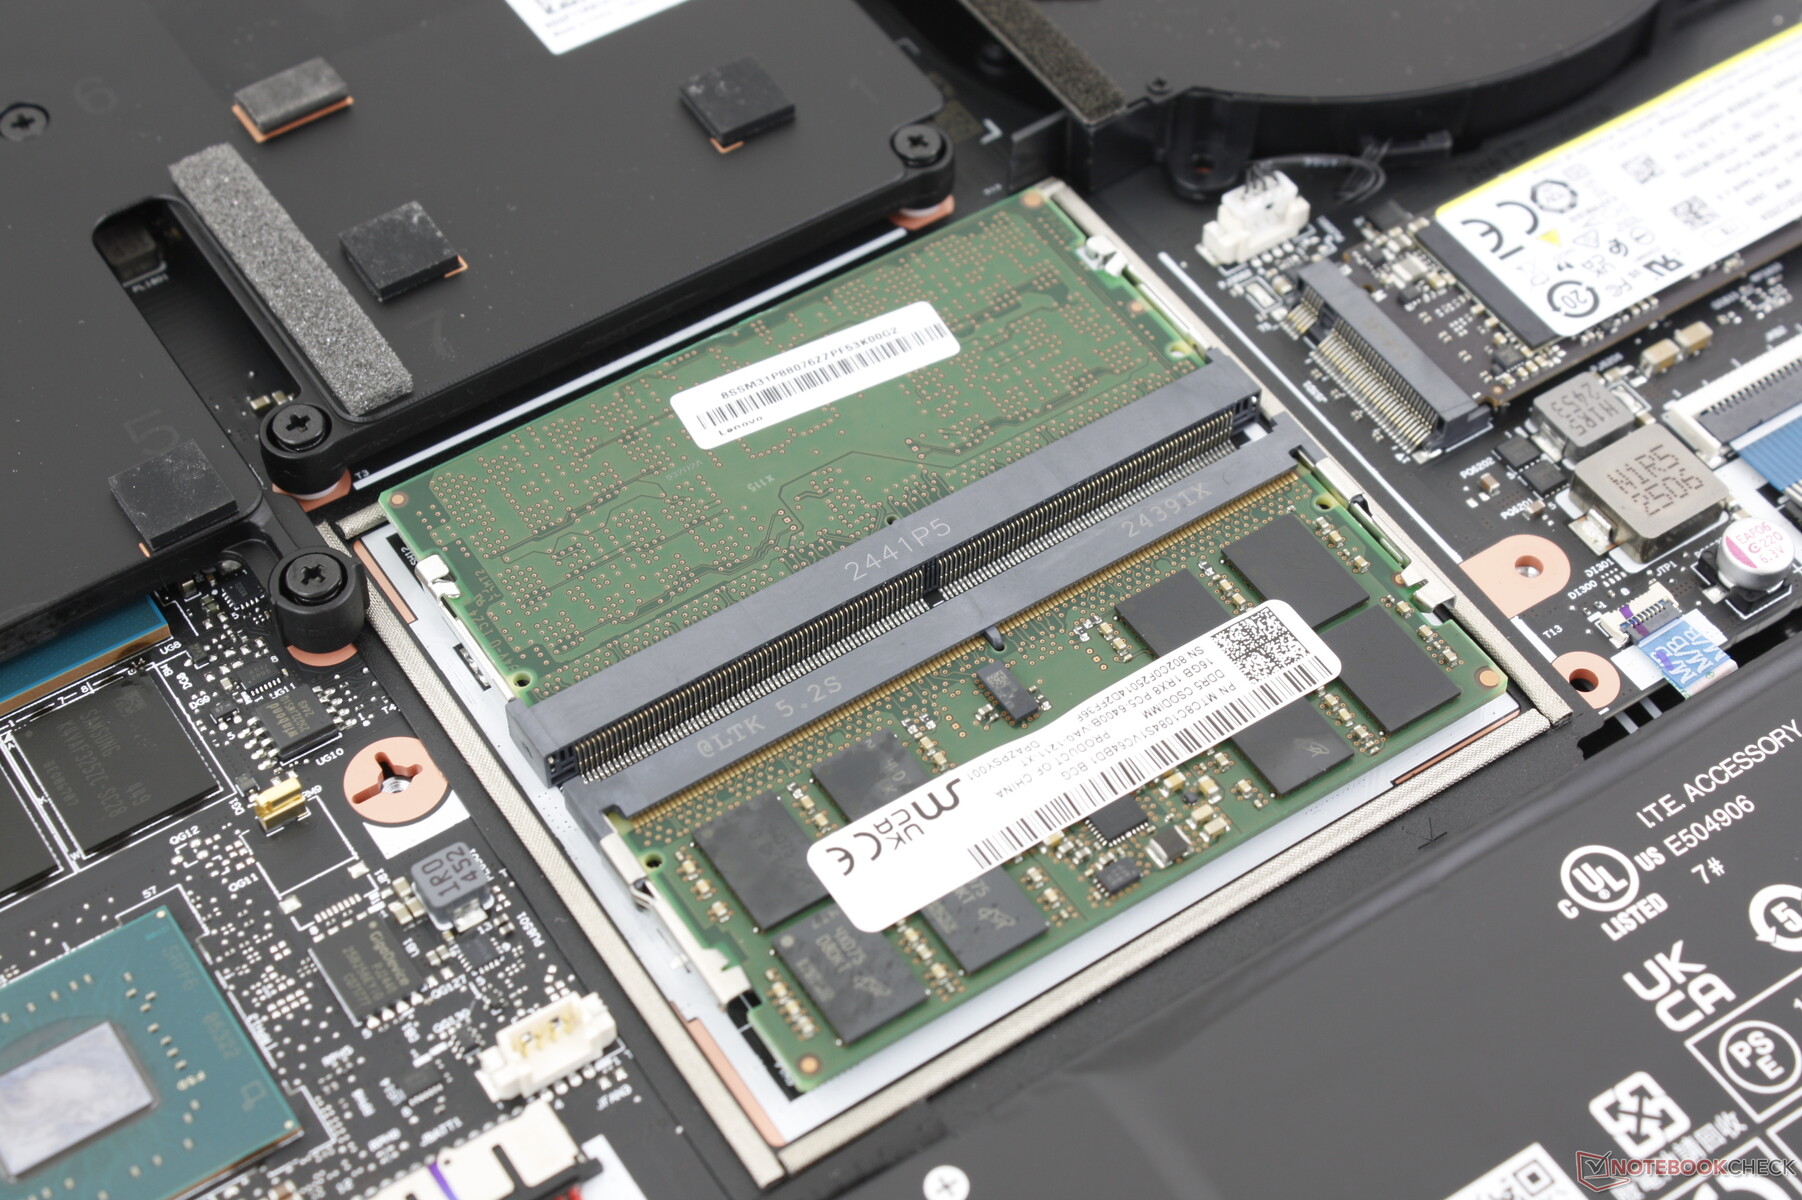
维修工作比平常略微繁琐。与大多数其他笔记本电脑不同的是,除了外盖外,两个 sodimm 插槽、两个 m.2 固态硬盘插槽和 wlan 模块还被一块大铝板覆盖,如下图所示。只要用户小心不要扯断连接第三个风扇和主板的带状电缆,就能很容易地拆下该装置。
可持续性
虽然联想有一个二氧化碳可持续发展计划,但我们找不到任何关于生产Legion Pro 7i 16 Gen 10 时使用了多少可回收材料(如果有的话)的信息。零售包装盒主要是纸张和纸板,90% 的包装都是海洋塑料。
配件和保修
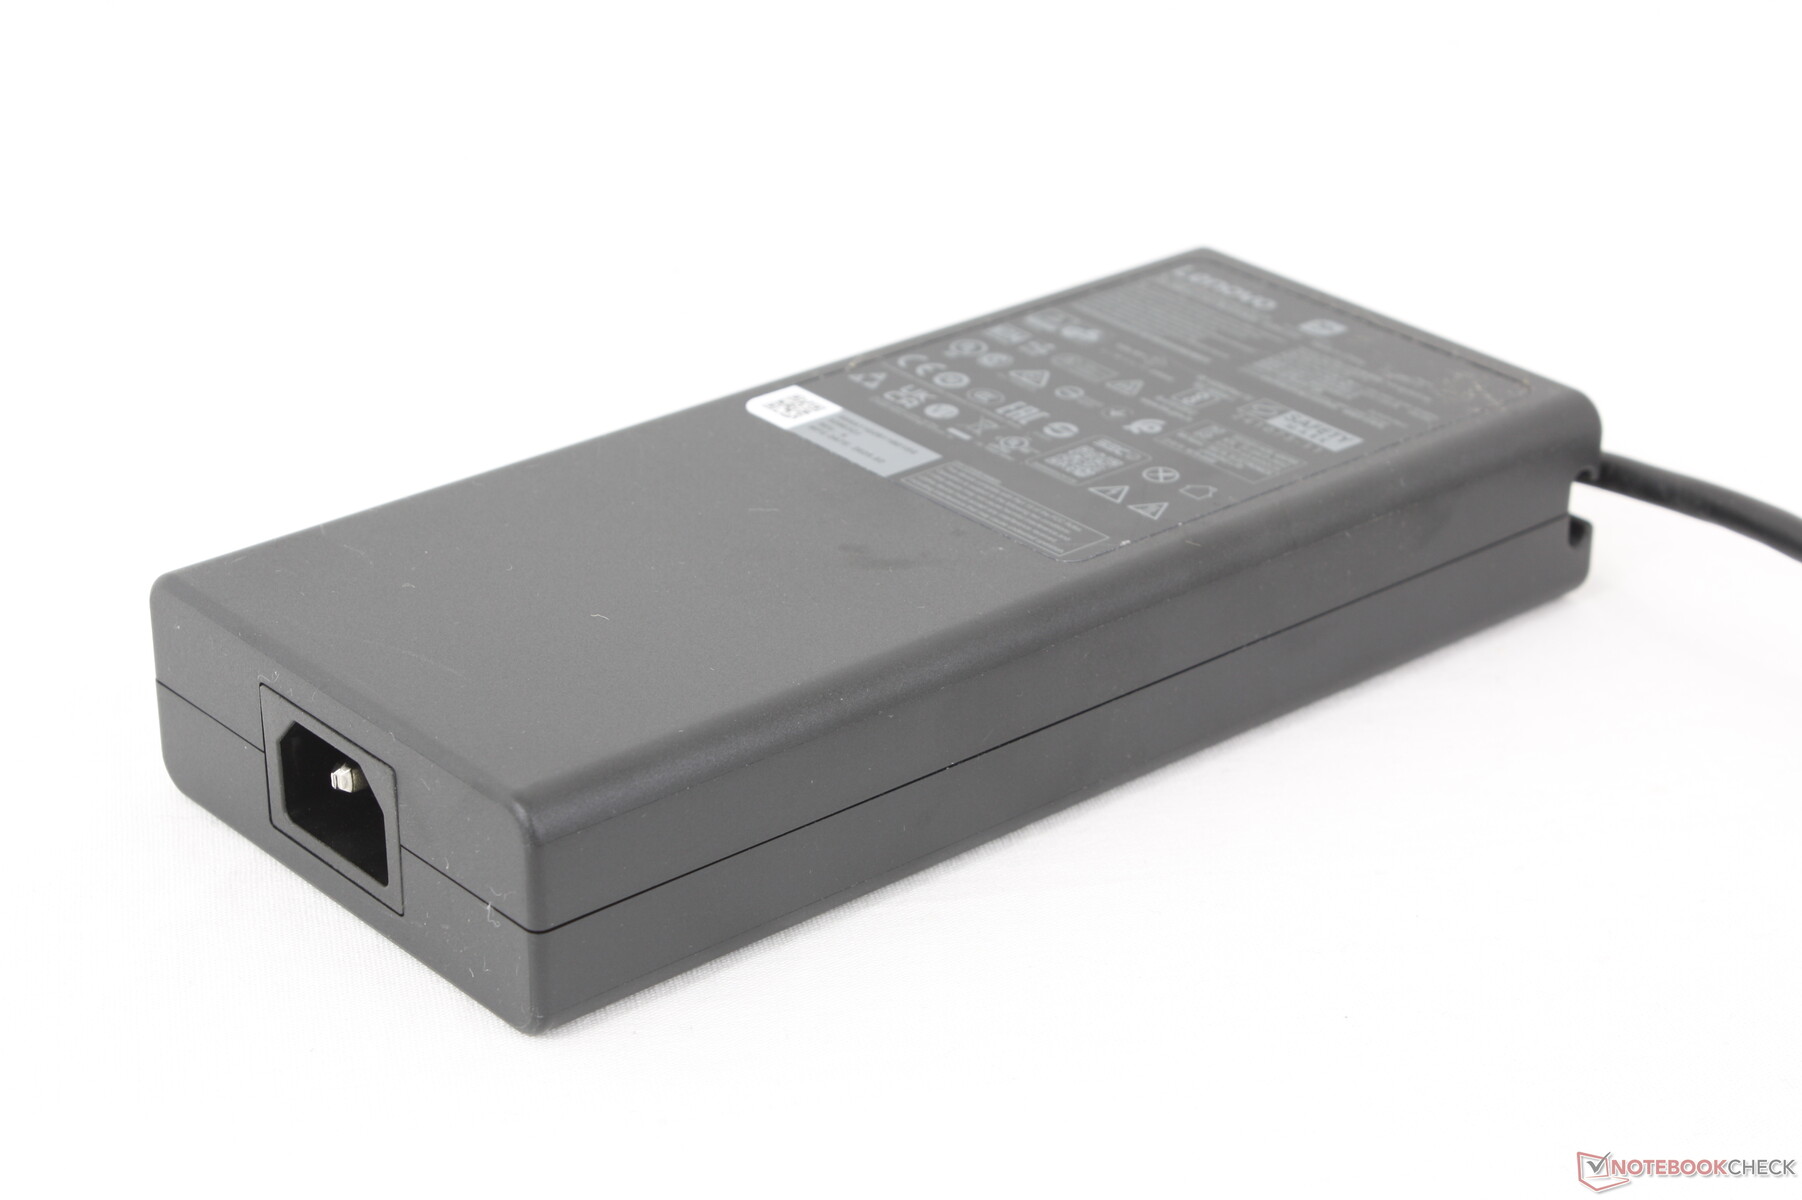
包装盒中除了 400 瓦(!)交流适配器和文件外,没有任何其他附件。制造商通常提供一年有限保修。
输入设备 - 宽敞而不花哨
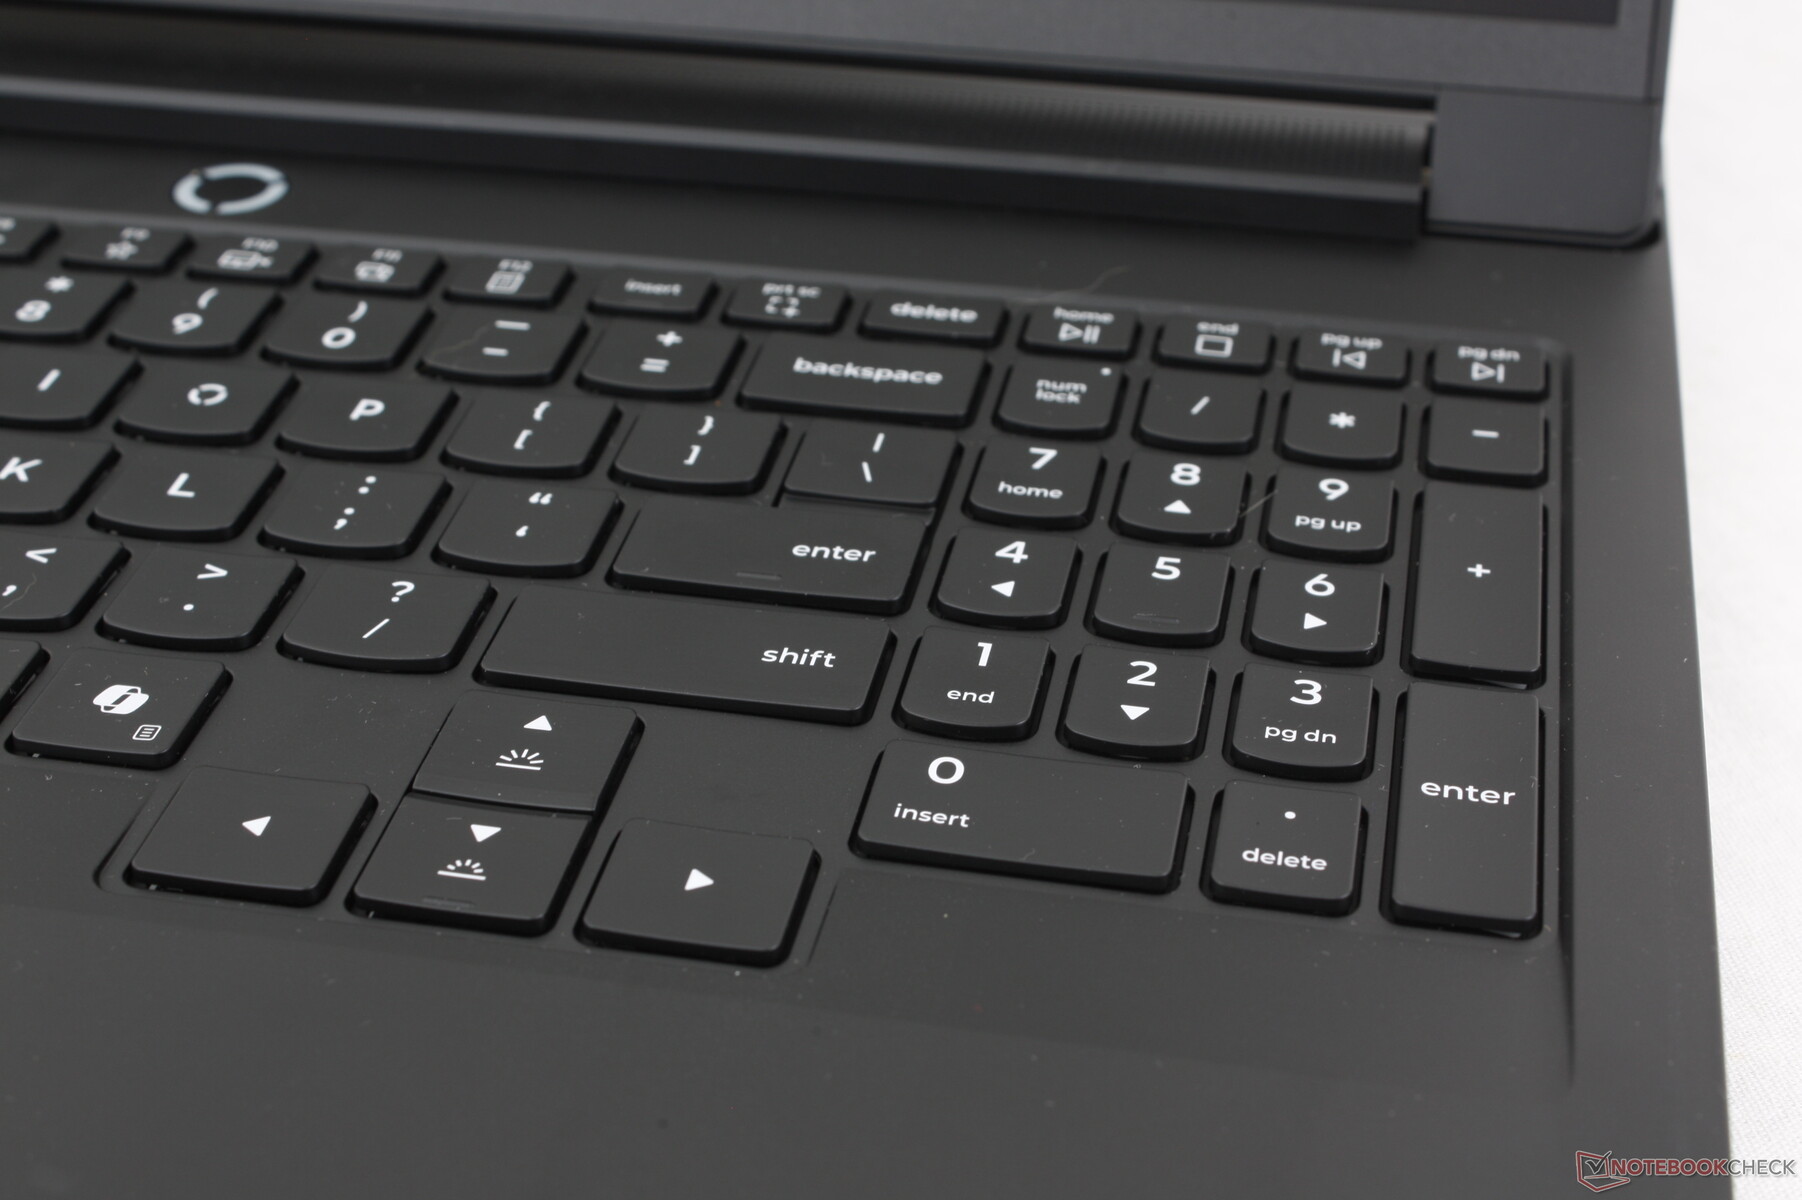
键盘
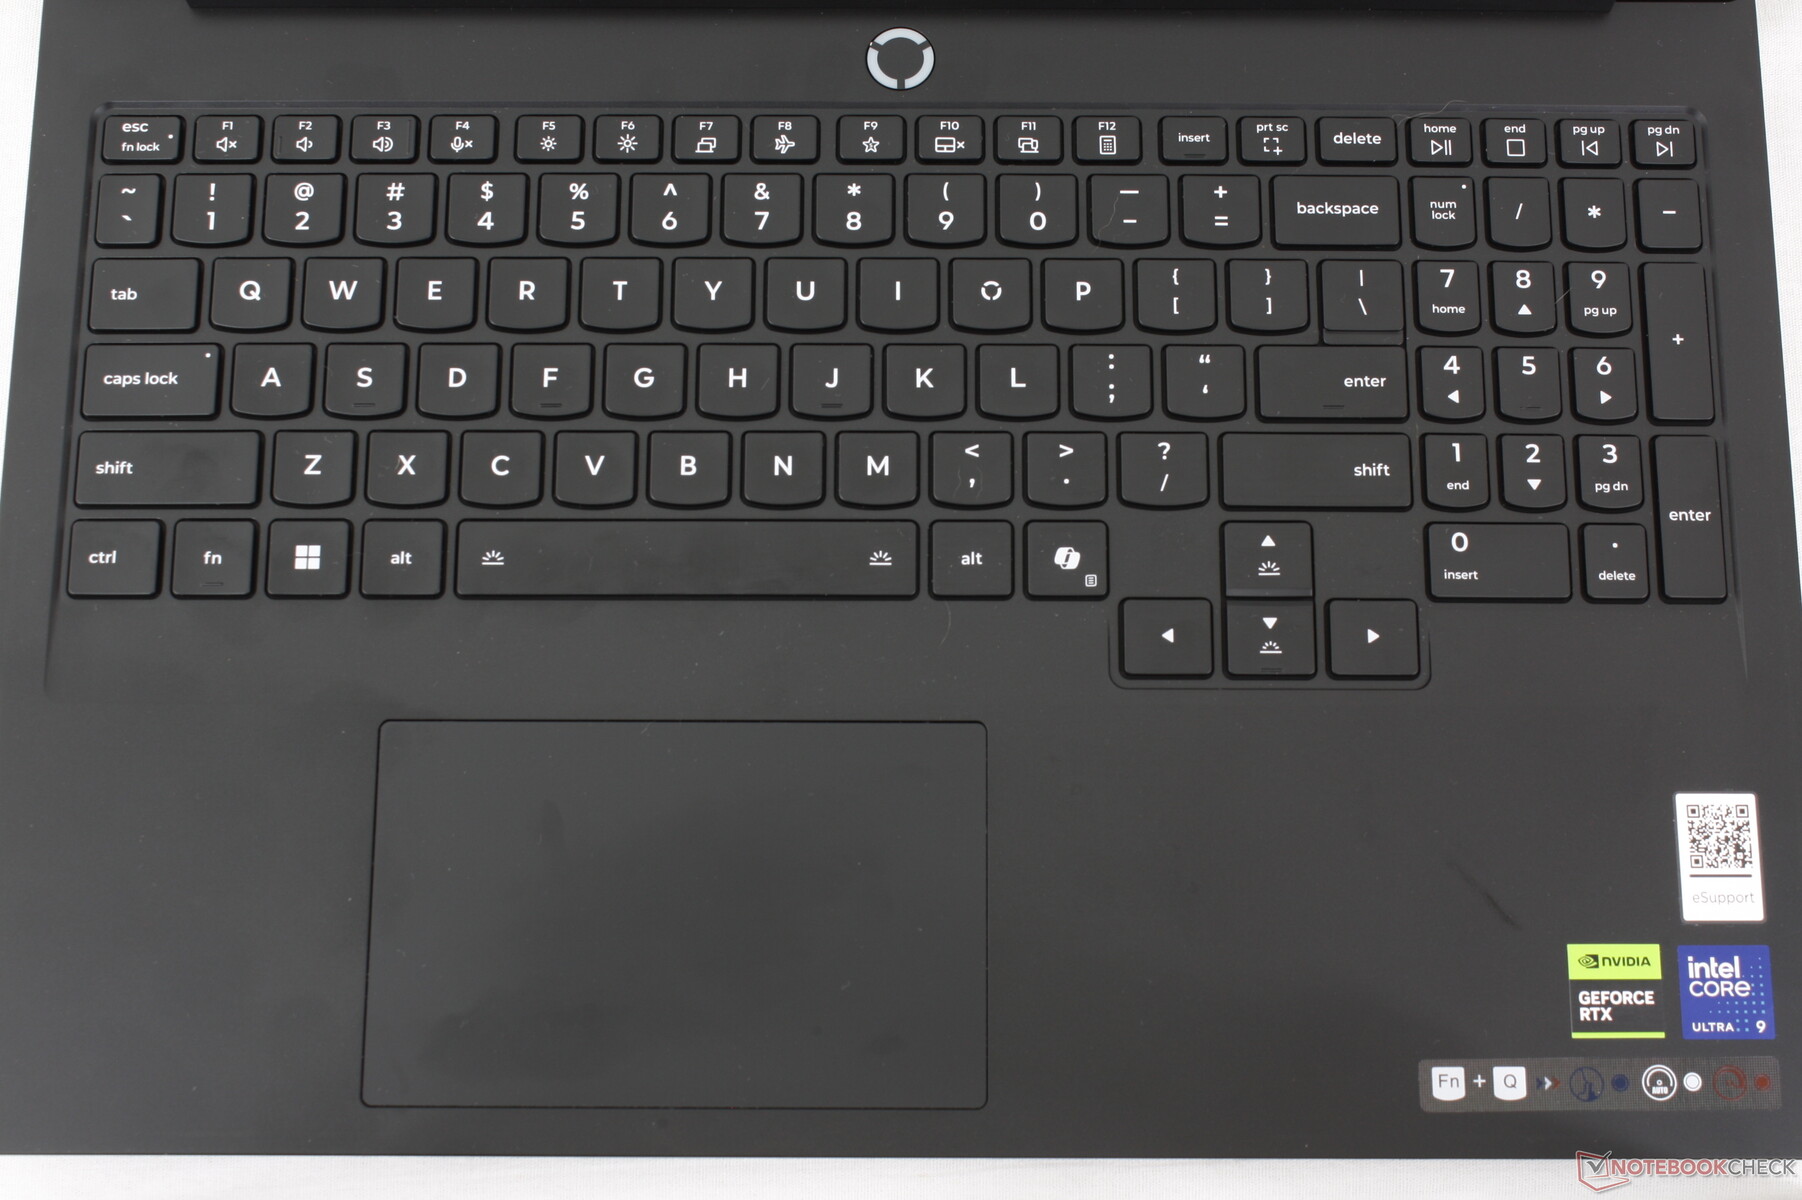
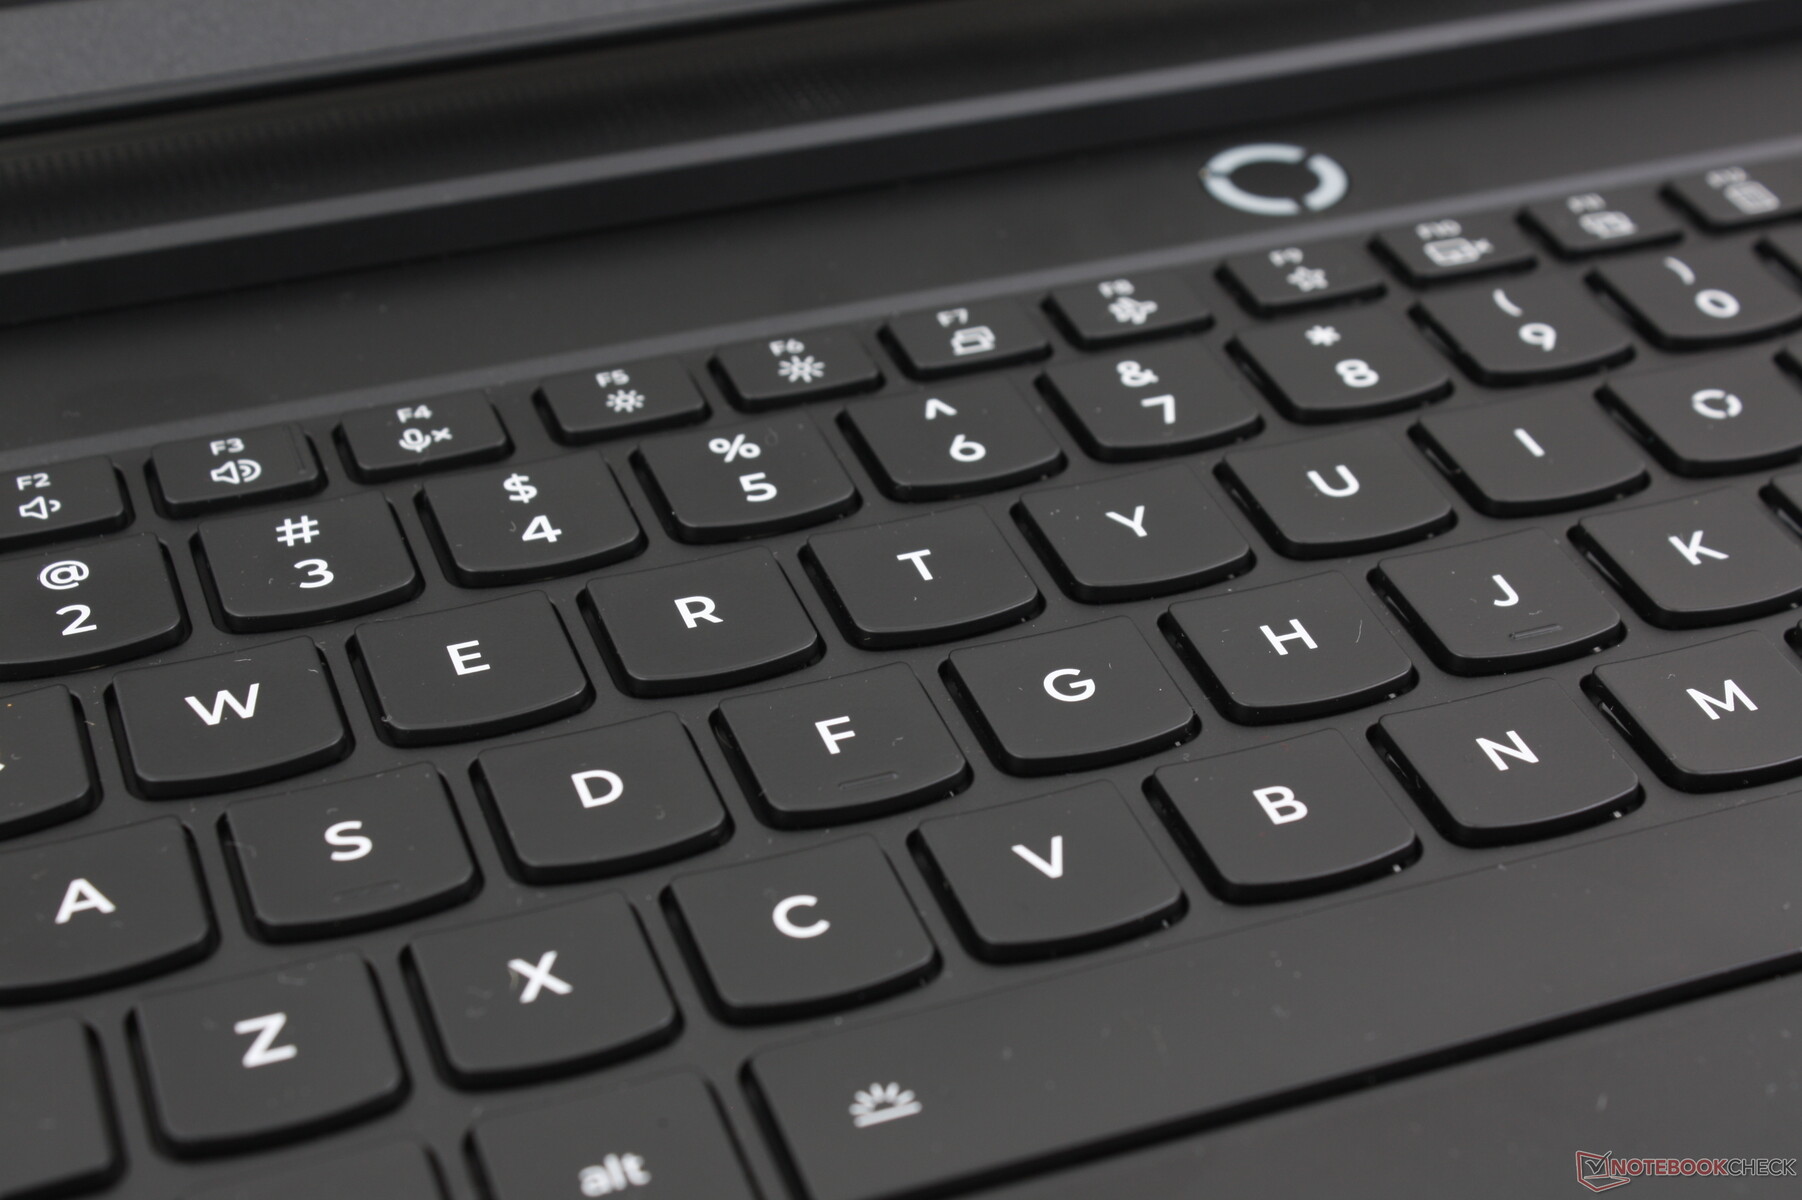
除了字体略有变化外,薄膜按键与去年的产品基本相同 Legion 7 16 G9或Legion 9i 16 上的按键基本相同,带来熟悉的键入体验。与大多数较薄的笔记本电脑(包括刀锋 16)的按键相比,它的键程更深,反馈更有力。刀锋 16.
我们非常欣赏全尺寸方向键,因为在包括 Omen Max 16 在内的许多其他游戏笔记本电脑上,方向键通常更小更拥挤。
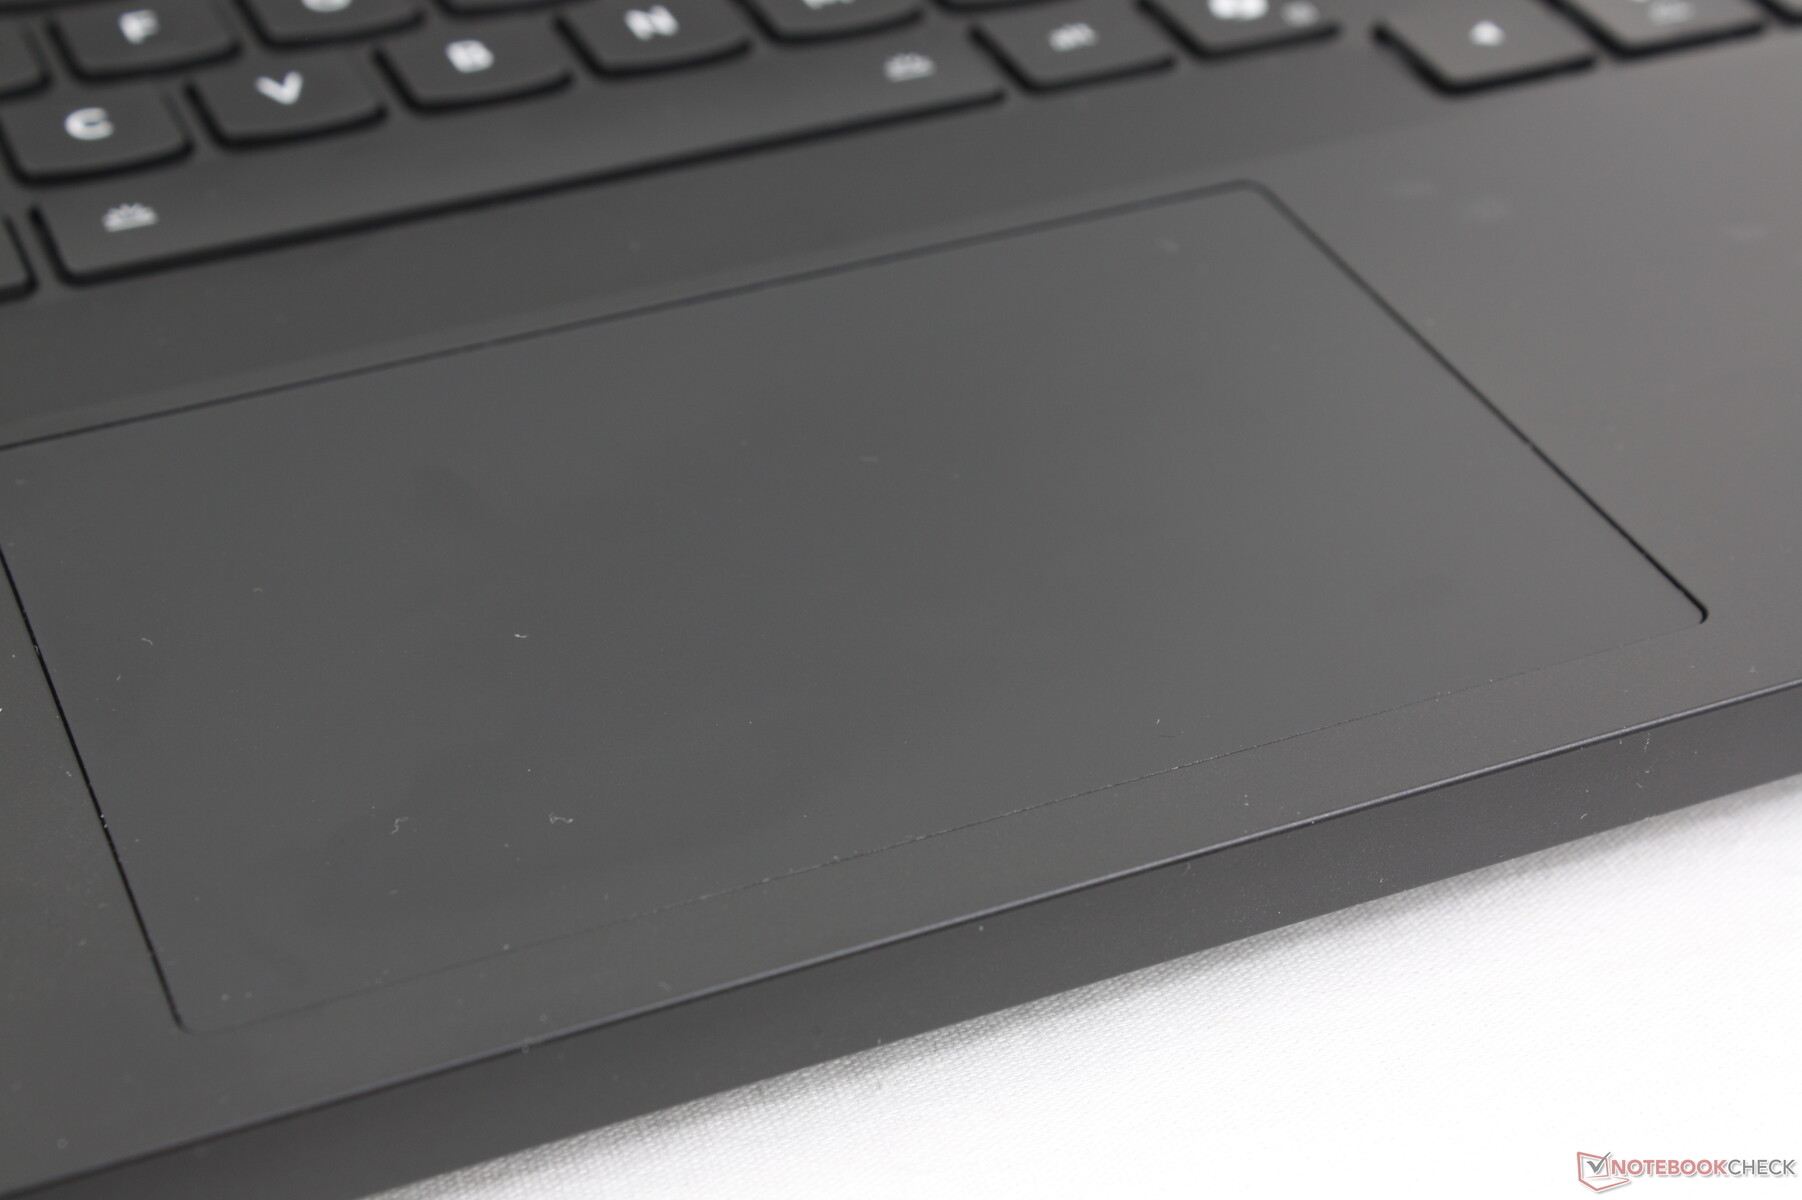
触摸板
点击板的尺寸与去年的型号相同,为 12 x 7.5 厘米。我们希望它能再高一些,以便更好地控制垂直方向的光标,但移动依然流畅准确,没有任何可靠性问题。遗憾的是,点击键盘的力度仍然偏浅、偏软。
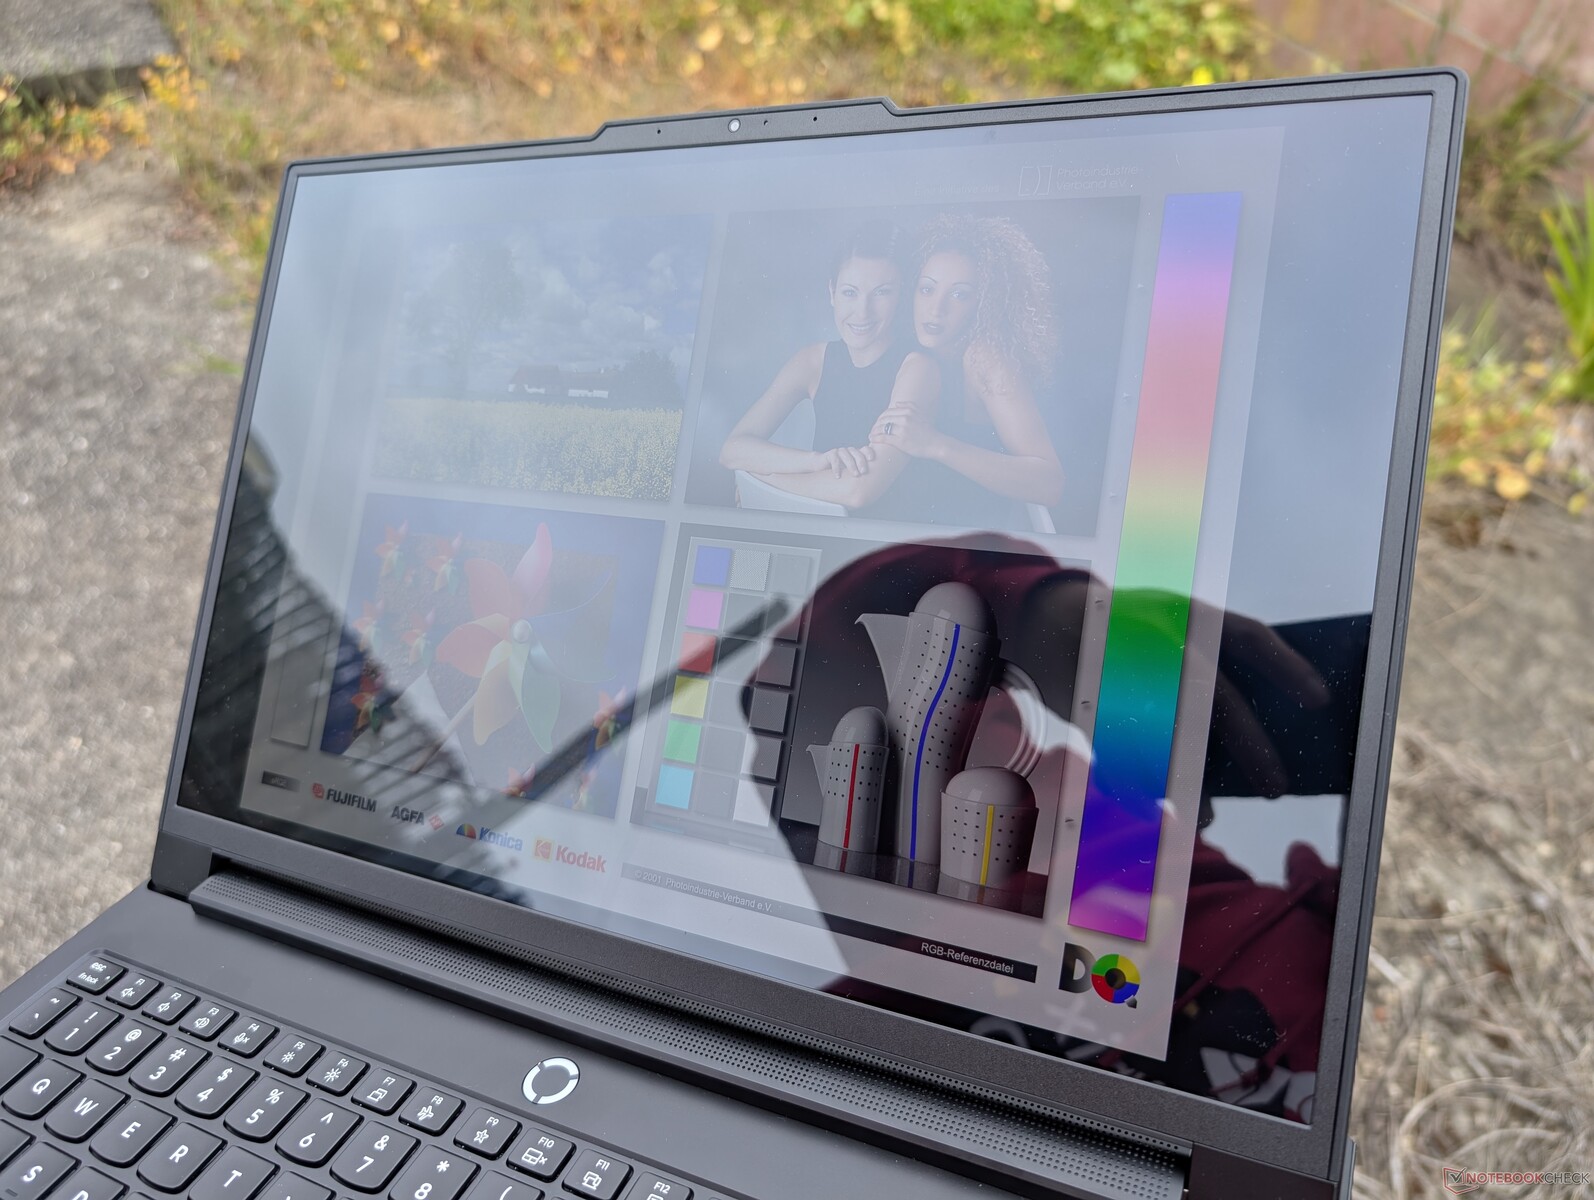
显示屏 - 几乎应有尽有

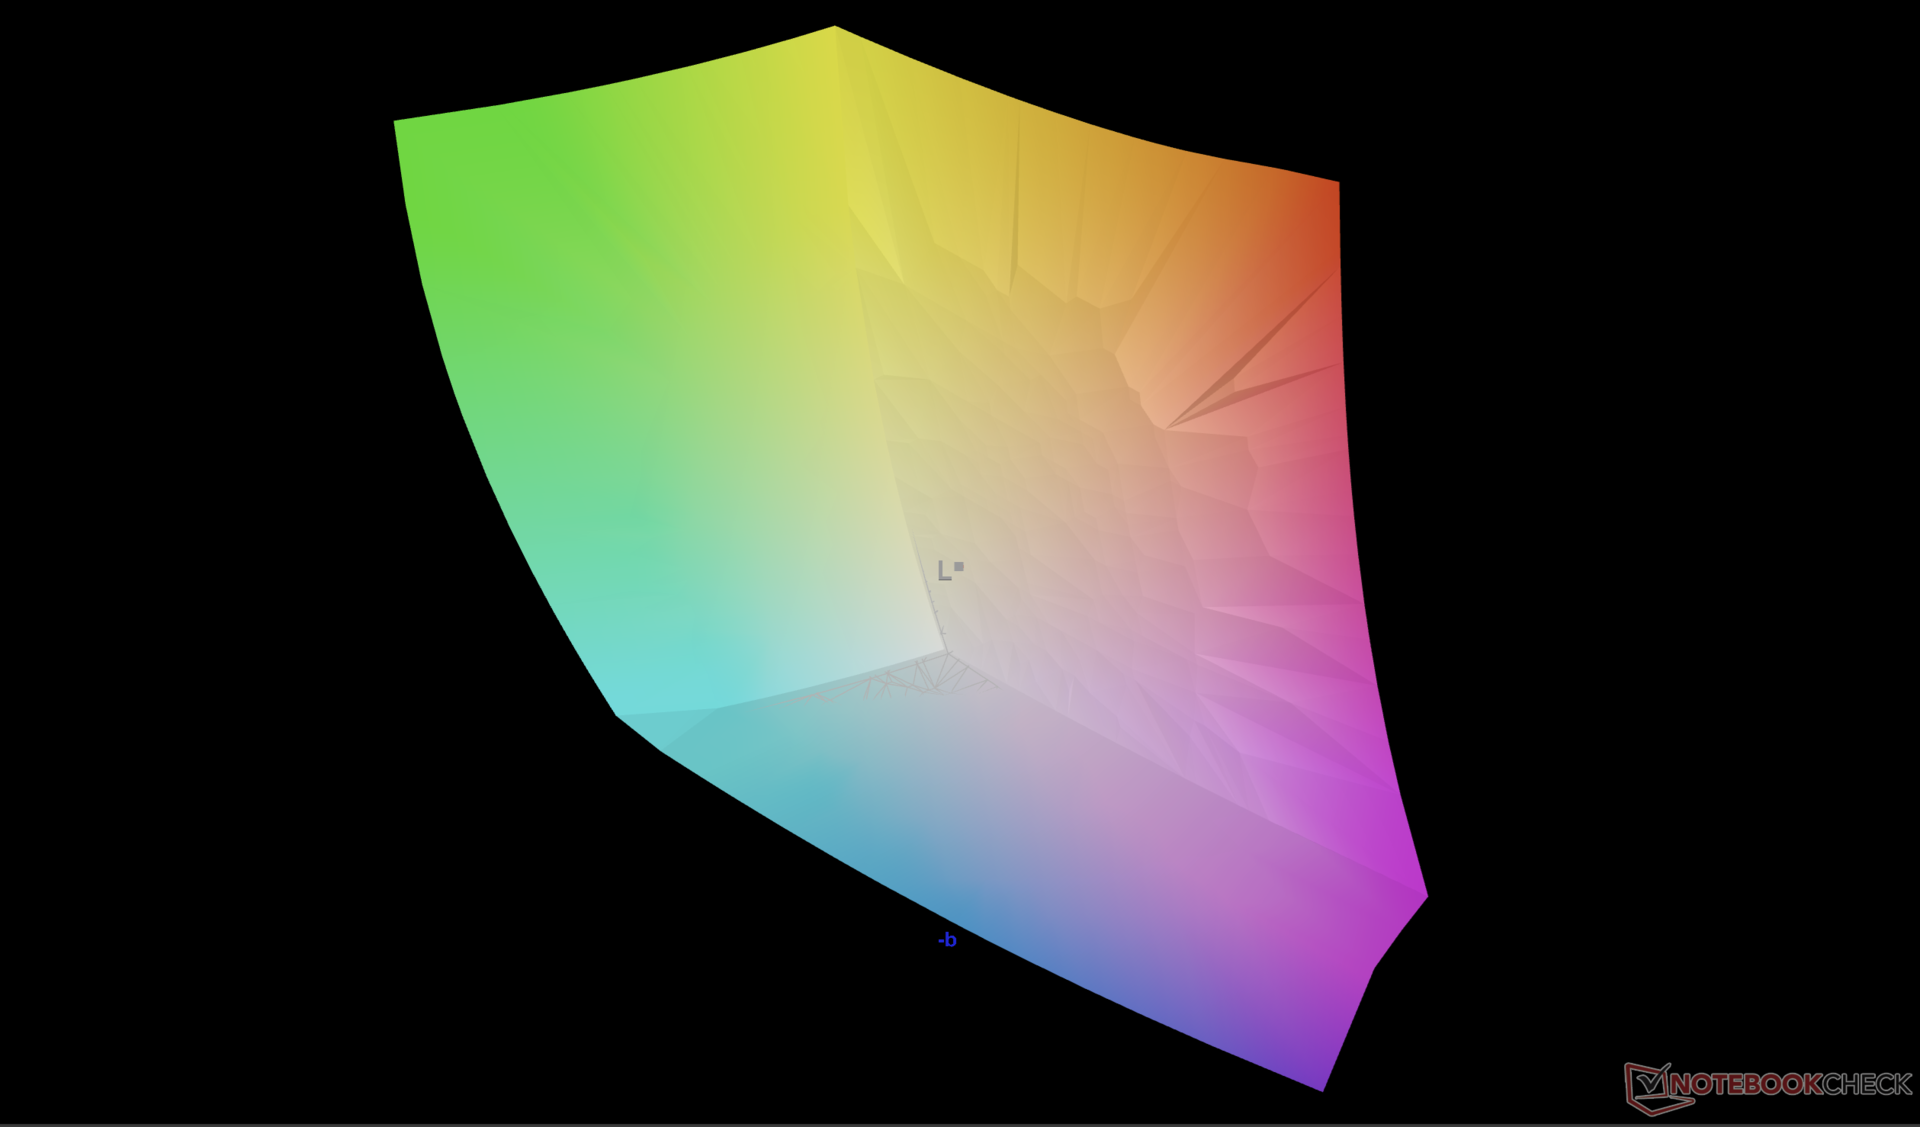
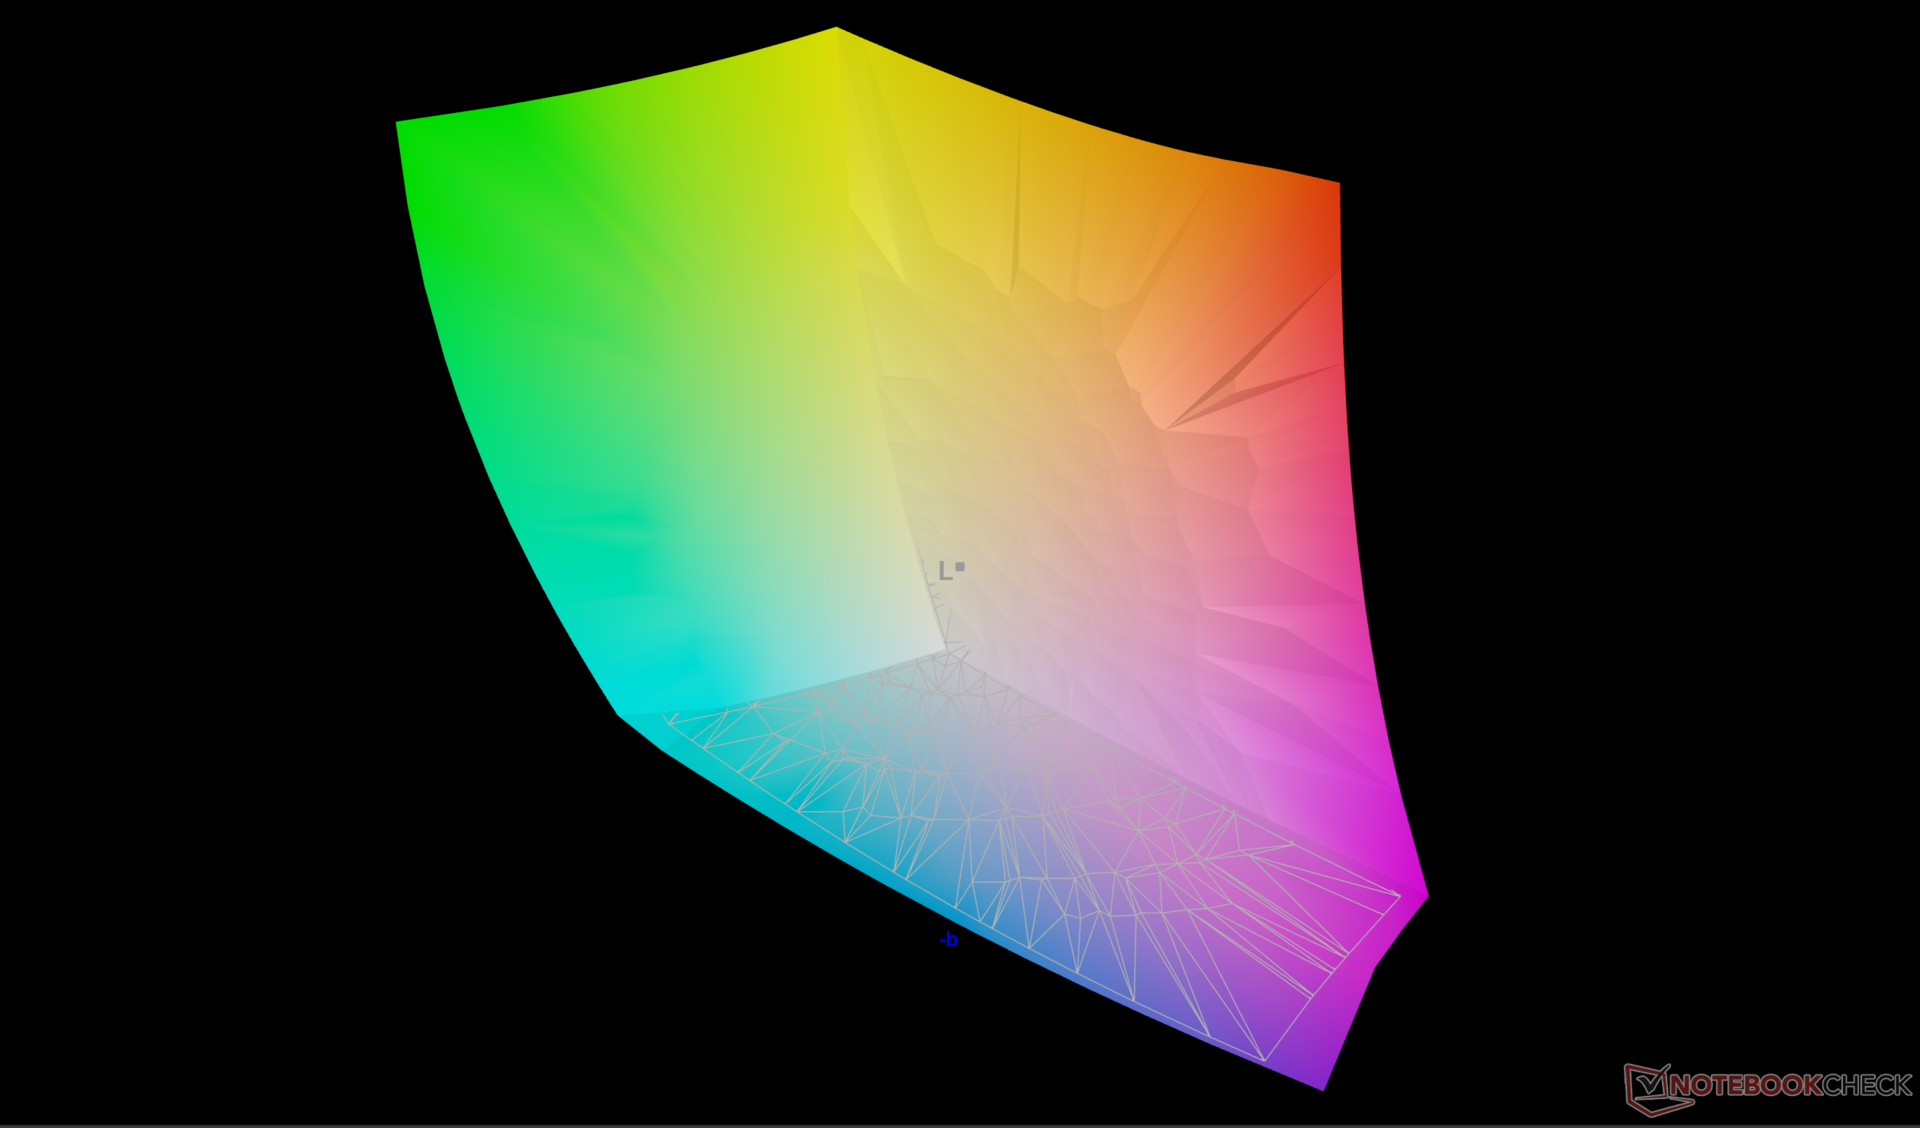
联想设备上的三星 ATNA60HU01-0 OLED 面板与竞争对手 Zephyrus G16 上的 ATNA60DL01-0 OLED 面板非常相似。 Zephyrus G16两款面板都提供 240 Hz 原生刷新率、1600p 原生分辨率和 P3 色彩。同时还支持 G-Sync 和高级 Optimus,是一款适合游戏和图形编辑的高端面板。尽管不提供任何 4K 选项,但主观感觉非常清晰。
支持 Windows VRR,以节省电能,尽管只能达到 60 Hz。我们可以确认,在 HDR 模式下,它还支持 DisplayHDR1000,实测最大亮度为 970 尼特。如果在 SDR 模式下,最大亮度会达到 500 尼特,这仍然比许多 IPS 面板,甚至前面提到的 Zephyrus G16 还要亮。

| |||||||||||||||||||||||||
Brightness Distribution: 97 %
Center on Battery: 490.4 cd/m²
Contrast: ∞:1 (Black: 0 cd/m²)
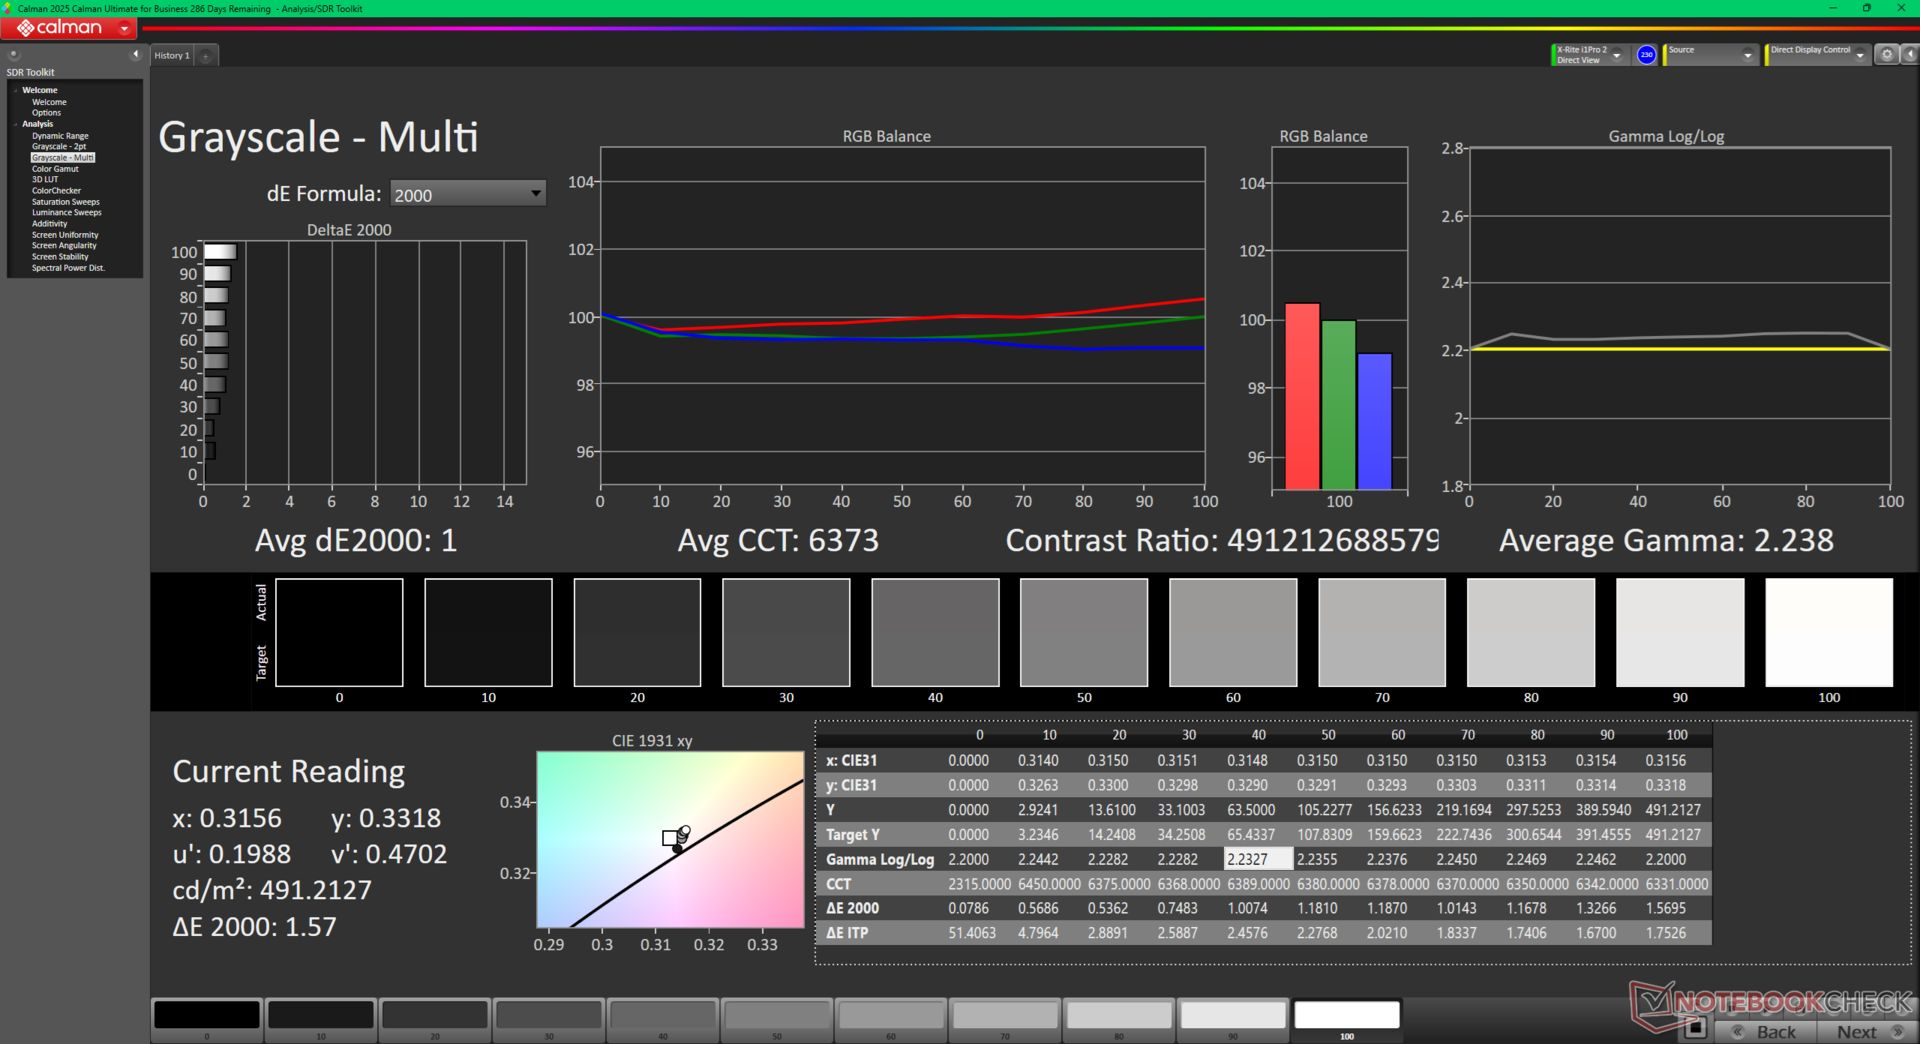
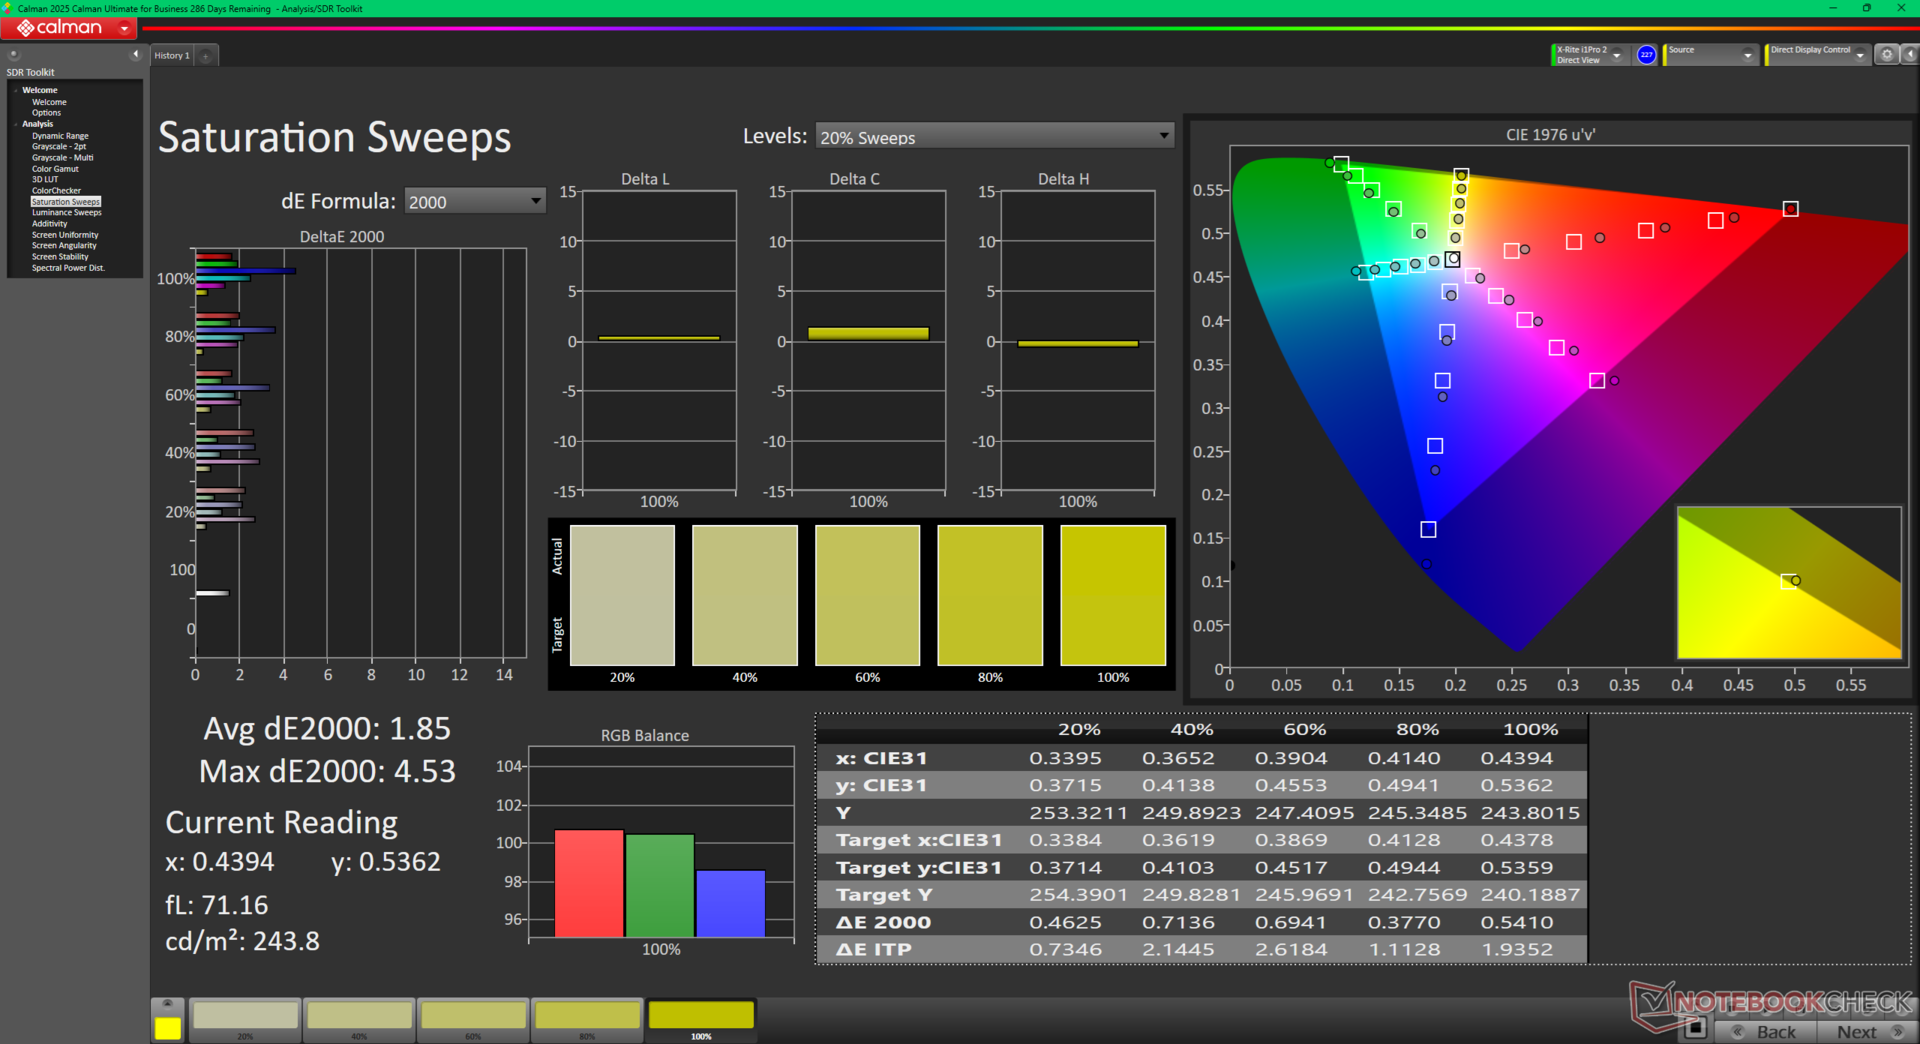
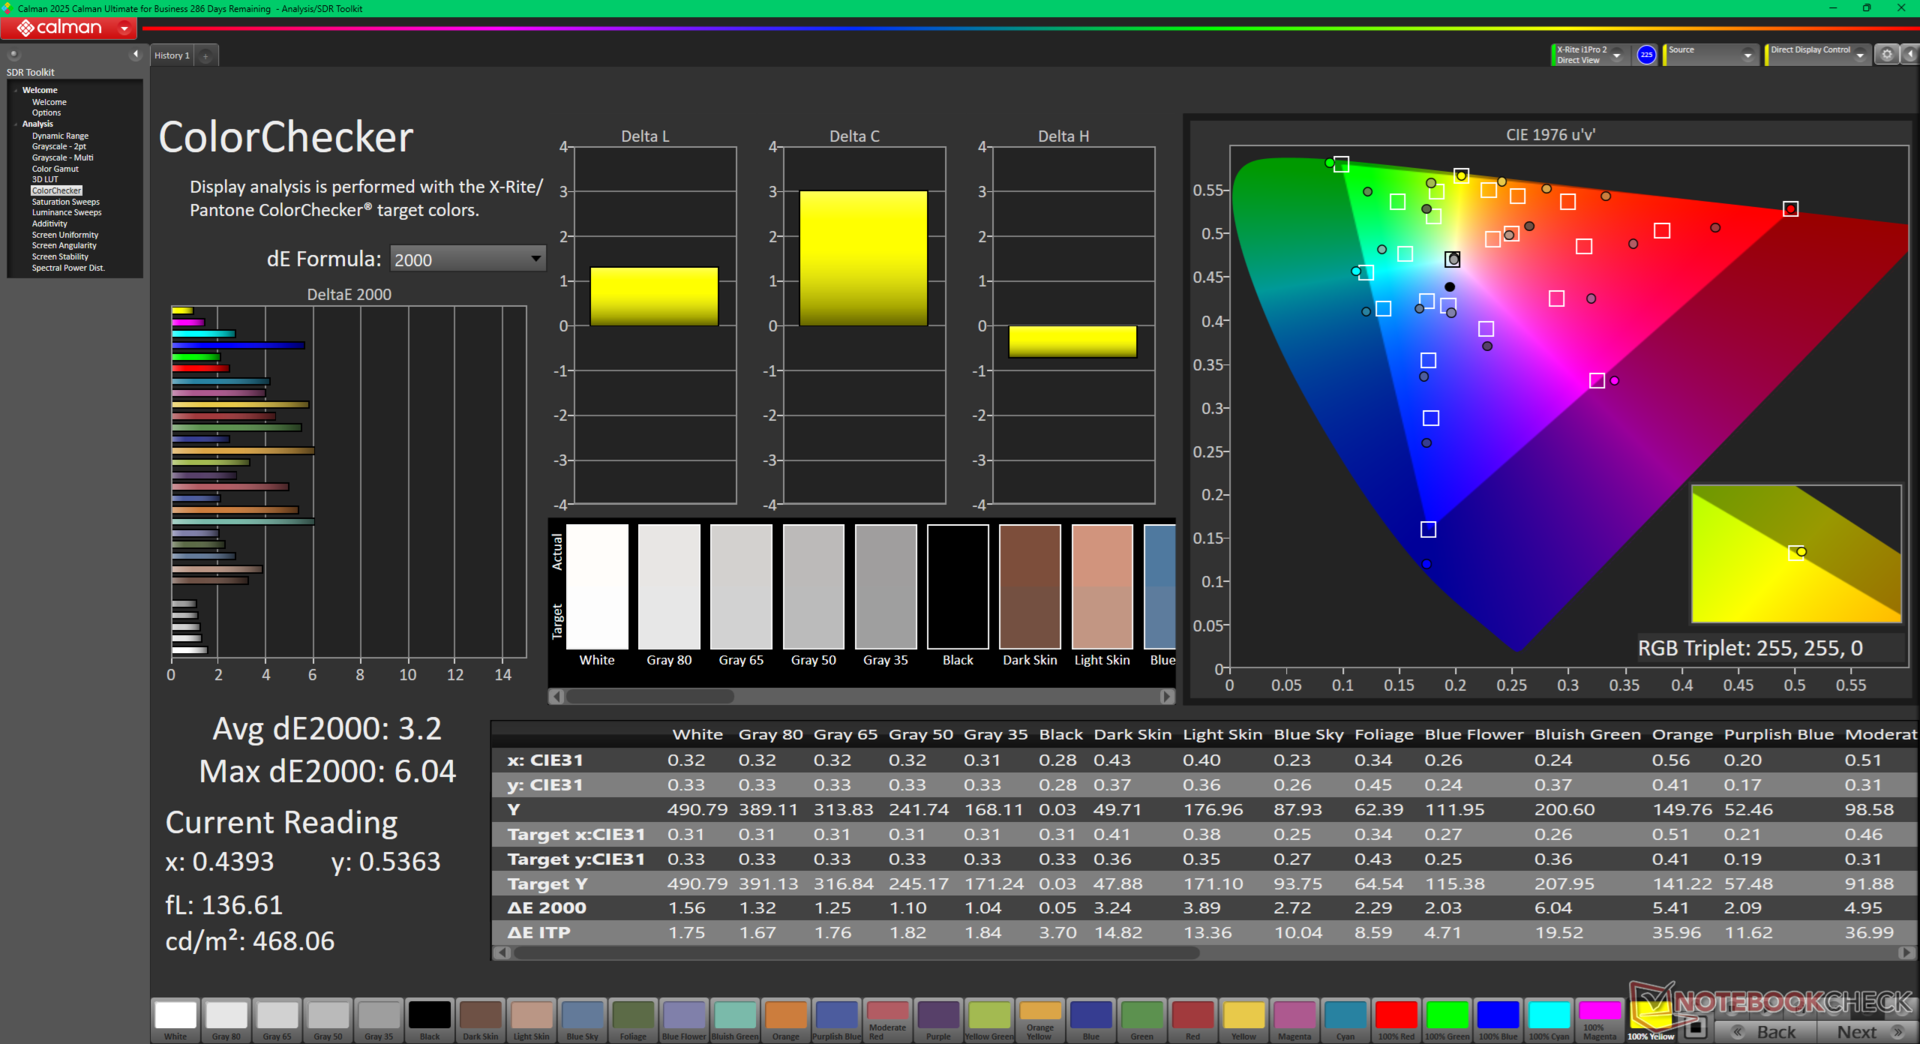
ΔE Color 3.2 | 0.5-29.43 Ø4.86, calibrated: 0.84
ΔE Greyscale 1 | 0.5-98 Ø5.1
94.4% AdobeRGB 1998 (Argyll 2.2.0 3D)
100% sRGB (Argyll 2.2.0 3D)
99.5% Display P3 (Argyll 2.2.0 3D)
Gamma: 2.24
| Lenovo Legion Pro 7i 16 Gen 10 Samsung ATNA60HU01-0, OLED, 2560x1600, 16", 240 Hz | Lenovo Legion 9 16IRX9, RTX 4090 CSOT T3 MNG007ZA2-2, MiniLED, 3200x2000, 16", 165 Hz | Razer Blade 16 2025 RTX 5090 ATNA60DL04-0, OLED, 2560x1600, 16", 240 Hz | Asus ROG Zephyrus G16 GU605MY ATNA60DL01-0, OLED, 2560x1600, 16", 240 Hz | MSI Vector 16 HX A14V Chi Mei N160GME-GTB, IPS, 2560x1600, 16", 240 Hz | Alienware x16 R2 P120F BOE B160QAN, IPS, 2560x1600, 16", 240 Hz | |
|---|---|---|---|---|---|---|
| Display | -4% | -4% | 1% | -5% | -2% | |
| Display P3 Coverage | 99.5 | 95.3 -4% | 96.1 -3% | 99.9 0% | 95.4 -4% | 98.3 -1% |
| sRGB Coverage | 100 | 99.9 0% | 99.9 0% | 100 0% | 99.7 0% | 100 0% |
| AdobeRGB 1998 Coverage | 94.4 | 86.6 -8% | 85 -10% | 96.9 3% | 85.4 -10% | 88.8 -6% |
| Response Times | -2116% | 13% | 10% | -2244% | -1504% | |
| Response Time Grey 50% / Grey 80% * | 0.28 ? | 12.6 ? -4400% | 0.2 ? 29% | 0.22 ? 21% | 5.7 ? -1936% | 3.9 ? -1293% |
| Response Time Black / White * | 0.43 ? | 10 ? -2226% | 0.25 ? 42% | 0.25 ? 42% | 11.4 ? -2551% | 7.8 ? -1714% |
| PWM Frequency | 1438 ? | 5430 278% | 960 ? -33% | 960 ? -33% | ||
| Screen | -46% | -2% | -15% | -52% | -30% | |
| Brightness middle | 490.4 | 631 29% | 391 -20% | 416 -15% | 557.2 14% | 348.4 -29% |
| Brightness | 498 | 664 33% | 393 -21% | 418 -16% | 506 2% | 340 -32% |
| Brightness Distribution | 97 | 91 -6% | 98 1% | 96 -1% | 83 -14% | 90 -7% |
| Black Level * | 0.03 | 0.41 | 0.33 | |||
| Colorchecker dE 2000 * | 3.2 | 2.68 16% | 1.2 62% | 1.6 50% | 2.91 9% | 2.68 16% |
| Colorchecker dE 2000 max. * | 6.04 | 6.41 -6% | 3.2 47% | 2.1 65% | 5.94 2% | 4.14 31% |
| Colorchecker dE 2000 calibrated * | 0.84 | 2.68 -219% | 1.63 -94% | 0.42 50% | ||
| Greyscale dE 2000 * | 1 | 2.71 -171% | 1.8 -80% | 2.7 -170% | 3.8 -280% | 3.4 -240% |
| Gamma | 2.24 98% | 2.27 97% | 2.2 100% | 2.16 102% | 2.23 99% | 2.41 91% |
| CCT | 6373 102% | 6135 106% | 6493 100% | 6331 103% | 6408 101% | 6083 107% |
| Contrast | 21033 | 1359 | 1056 | |||
| Total Average (Program / Settings) | -722% /
-514% | 2% /
1% | -1% /
-5% | -767% /
-405% | -512% /
-269% |
* ... smaller is better
显示屏根据 P3 标准进行了适当校准,平均灰度和色彩 deltaE 值分别仅为 1.0 和 3.2,这意味着大多数情况下无需进行最终用户校准。
Display Response Times
| ↔ Response Time Black to White | ||
|---|---|---|
| 0.43 ms ... rise ↗ and fall ↘ combined | ↗ 0.22 ms rise | 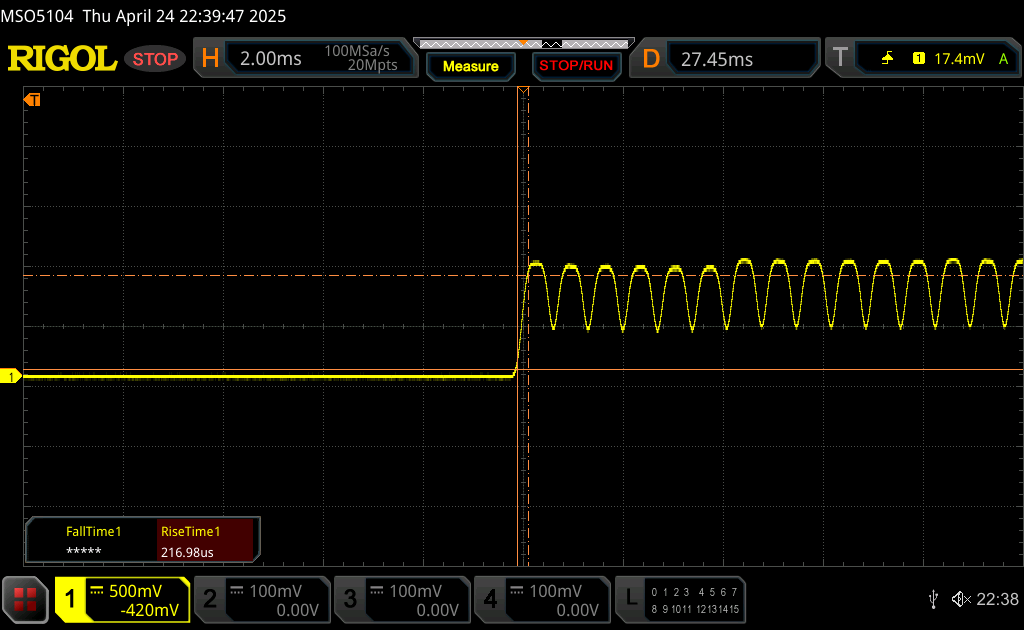 |
| ↘ 0.21 ms fall | ||
| The screen shows very fast response rates in our tests and should be very well suited for fast-paced gaming. In comparison, all tested devices range from 0.1 (minimum) to 240 (maximum) ms. » 0 % of all devices are better. This means that the measured response time is better than the average of all tested devices (20.7 ms). | ||
| ↔ Response Time 50% Grey to 80% Grey | ||
| 0.28 ms ... rise ↗ and fall ↘ combined | ↗ 0.14 ms rise | 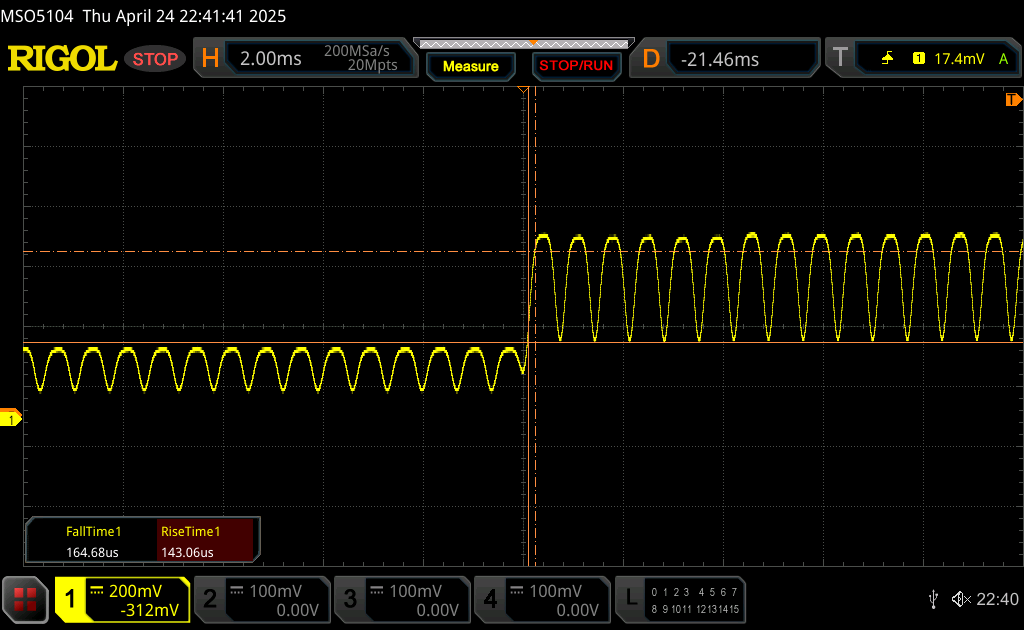 |
| ↘ 0.14 ms fall | ||
| The screen shows very fast response rates in our tests and should be very well suited for fast-paced gaming. In comparison, all tested devices range from 0.165 (minimum) to 636 (maximum) ms. » 0 % of all devices are better. This means that the measured response time is better than the average of all tested devices (32.4 ms). | ||
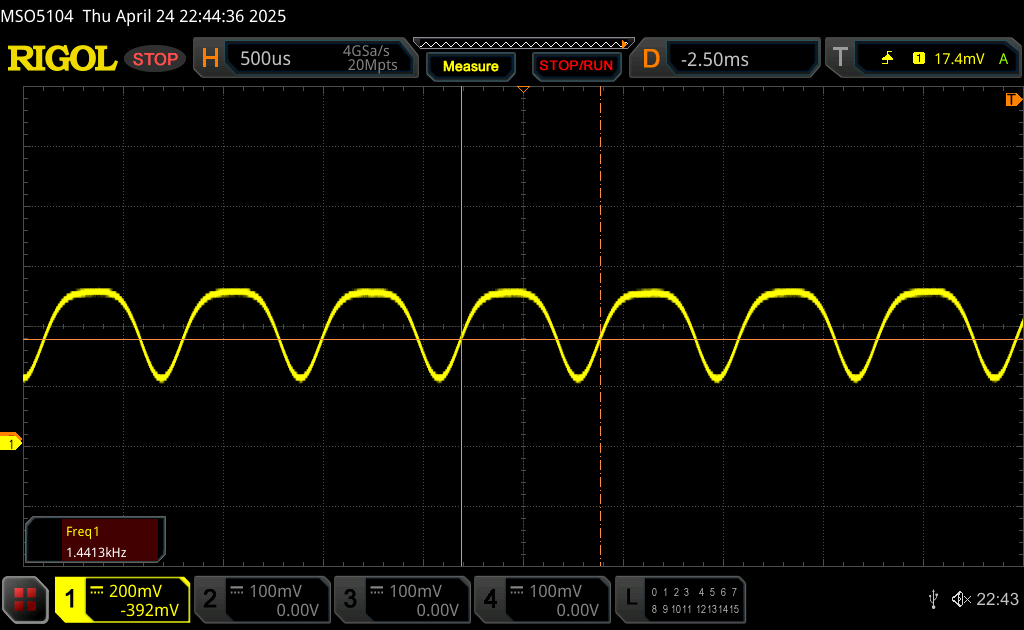
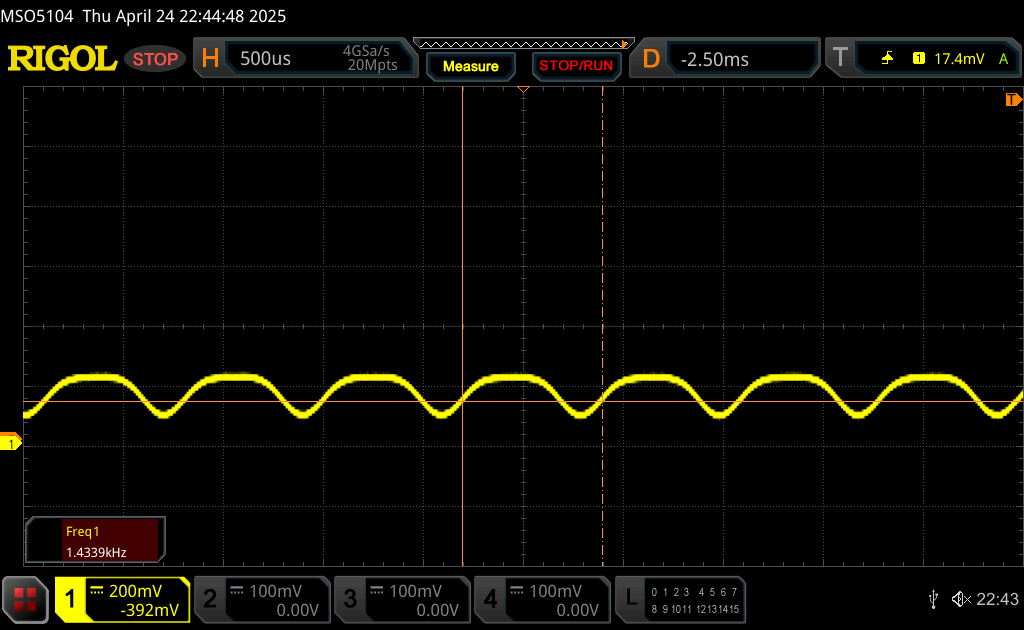
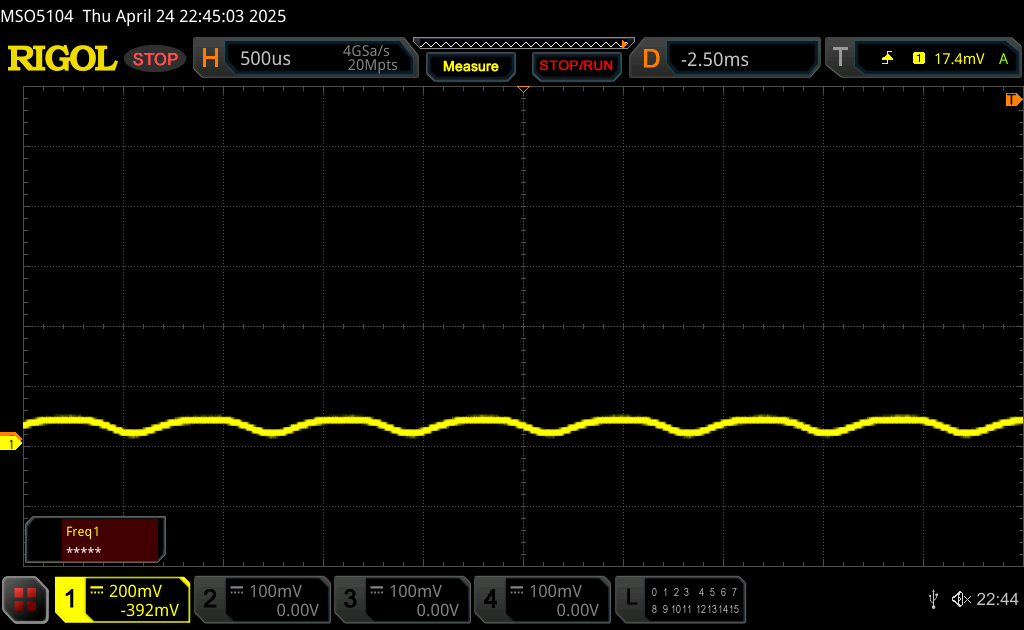
Screen Flickering / PWM (Pulse-Width Modulation)
| Screen flickering / PWM detected | 1438 Hz Amplitude: 29 % | ≤ 100 % brightness setting | 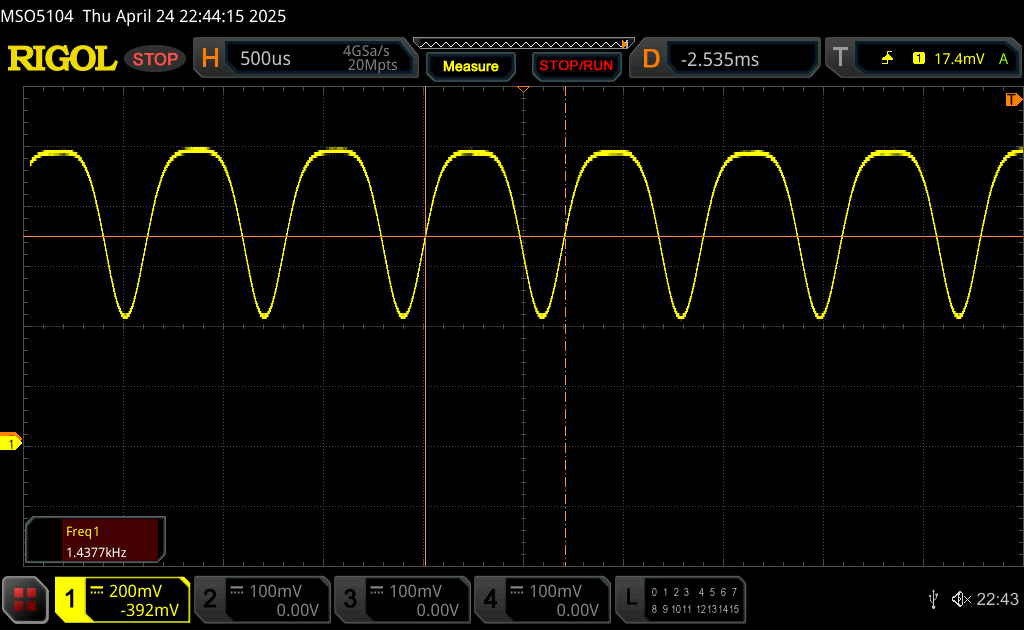 |
The display backlight flickers at 1438 Hz (worst case, e.g., utilizing PWM) Flickering detected at a brightness setting of 100 % and below. There should be no flickering or PWM above this brightness setting. The frequency of 1438 Hz is quite high, so most users sensitive to PWM should not notice any flickering. In comparison: 53 % of all tested devices do not use PWM to dim the display. If PWM was detected, an average of 8482 (minimum: 5 - maximum: 343500) Hz was measured. | |||

500 尼特的显示屏在室内可能很亮,但它并不是为室外环境设计的。光面显示屏带来的眩光在这里仍然不可避免。


性能 - 配备 175 W TGP 图形的箭湖


测试条件
在运行以下基准测试之前,我们将 LegionSpace 设置为性能模式,并将 GPU 设置为独立模式。建议用户熟悉使用 LegionSpace,以便对系统的性能、GPU 或 LED 效果进行调整。同时,联想 Vantage 仍已预装,可用于调整电池充电、网络摄像头或键盘行为等非游戏功能。
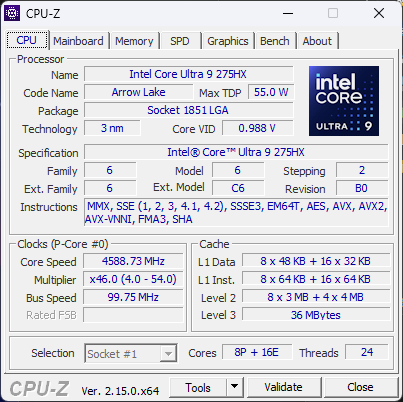
处理器
酷睿至尊 9 275HX 酷睿至尊 9 275HX是英特尔 Arrow Lake-HX 系列中速度最快的处理器之一。它集成了 Meteor Lake-H 系列的 NPU(如酷睿至尊 9 185HX 酷睿至尊 9 185H的性能(如酷睿 i9-14900HX 酷睿 i9-14900HX),实现了两全其美,而以前的购买者不得不牺牲其中一个来换取另一个。原始多线程性能明显快于酷睿至尊 9 285HX。 酷睿至尊 9 285H或 Ryzen AI 9 HX 370与旗舰产品 Ryzen 9 9955HX.
可以说,这款新处理器最显著的缺点是功耗高,下面的 "能源管理 "部分将介绍这一点。
Cinebench R15 Multi Loop
Cinebench R23: Multi Core | Single Core
Cinebench R20: CPU (Multi Core) | CPU (Single Core)
Cinebench R15: CPU Multi 64Bit | CPU Single 64Bit
Blender: v2.79 BMW27 CPU
7-Zip 18.03: 7z b 4 | 7z b 4 -mmt1
Geekbench 6.4: Multi-Core | Single-Core
Geekbench 5.5: Multi-Core | Single-Core
HWBOT x265 Benchmark v2.2: 4k Preset
LibreOffice : 20 Documents To PDF
R Benchmark 2.5: Overall mean
* ... smaller is better
AIDA64: FP32 Ray-Trace | FPU Julia | CPU SHA3 | CPU Queen | FPU SinJulia | FPU Mandel | CPU AES | CPU ZLib | FP64 Ray-Trace | CPU PhotoWorxx
| Performance Rating | |
| Average Intel Core Ultra 9 275HX | |
| Lenovo Legion Pro 7i 16 Gen 10 | |
| MSI Vector 16 HX A14V | |
| Lenovo Legion 9 16IRX9, RTX 4090 | |
| Razer Blade 16 2025 RTX 5090 | |
| Asus ROG Zephyrus G16 GU605CX | |
| Alienware x16 R2 P120F | |
| AIDA64 / FP32 Ray-Trace | |
| Average Intel Core Ultra 9 275HX (32615 - 39551, n=6) | |
| Razer Blade 16 2025 RTX 5090 | |
| Lenovo Legion Pro 7i 16 Gen 10 | |
| MSI Vector 16 HX A14V | |
| Lenovo Legion 9 16IRX9, RTX 4090 | |
| Asus ROG Zephyrus G16 GU605CX | |
| Alienware x16 R2 P120F | |
| AIDA64 / FPU Julia | |
| Average Intel Core Ultra 9 275HX (166245 - 194867, n=6) | |
| Lenovo Legion Pro 7i 16 Gen 10 | |
| MSI Vector 16 HX A14V | |
| Razer Blade 16 2025 RTX 5090 | |
| Lenovo Legion 9 16IRX9, RTX 4090 | |
| Asus ROG Zephyrus G16 GU605CX | |
| Alienware x16 R2 P120F | |
| AIDA64 / CPU SHA3 | |
| Average Intel Core Ultra 9 275HX (7829 - 9482, n=6) | |
| Lenovo Legion Pro 7i 16 Gen 10 | |
| MSI Vector 16 HX A14V | |
| Lenovo Legion 9 16IRX9, RTX 4090 | |
| Razer Blade 16 2025 RTX 5090 | |
| Asus ROG Zephyrus G16 GU605CX | |
| Alienware x16 R2 P120F | |
| AIDA64 / CPU Queen | |
| MSI Vector 16 HX A14V | |
| Lenovo Legion Pro 7i 16 Gen 10 | |
| Average Intel Core Ultra 9 275HX (125013 - 139608, n=6) | |
| Lenovo Legion 9 16IRX9, RTX 4090 | |
| Alienware x16 R2 P120F | |
| Razer Blade 16 2025 RTX 5090 | |
| Asus ROG Zephyrus G16 GU605CX | |
| AIDA64 / FPU SinJulia | |
| Razer Blade 16 2025 RTX 5090 | |
| MSI Vector 16 HX A14V | |
| Lenovo Legion 9 16IRX9, RTX 4090 | |
| Lenovo Legion Pro 7i 16 Gen 10 | |
| Average Intel Core Ultra 9 275HX (13238 - 14112, n=6) | |
| Alienware x16 R2 P120F | |
| Asus ROG Zephyrus G16 GU605CX | |
| AIDA64 / FPU Mandel | |
| Average Intel Core Ultra 9 275HX (87156 - 104057, n=6) | |
| Lenovo Legion Pro 7i 16 Gen 10 | |
| Razer Blade 16 2025 RTX 5090 | |
| MSI Vector 16 HX A14V | |
| Lenovo Legion 9 16IRX9, RTX 4090 | |
| Asus ROG Zephyrus G16 GU605CX | |
| Alienware x16 R2 P120F | |
| AIDA64 / CPU AES | |
| MSI Vector 16 HX A14V | |
| Lenovo Legion Pro 7i 16 Gen 10 | |
| Lenovo Legion 9 16IRX9, RTX 4090 | |
| Average Intel Core Ultra 9 275HX (119356 - 134920, n=6) | |
| Alienware x16 R2 P120F | |
| Razer Blade 16 2025 RTX 5090 | |
| Asus ROG Zephyrus G16 GU605CX | |
| AIDA64 / CPU ZLib | |
| Average Intel Core Ultra 9 275HX (1898 - 2220, n=6) | |
| MSI Vector 16 HX A14V | |
| Lenovo Legion Pro 7i 16 Gen 10 | |
| Lenovo Legion 9 16IRX9, RTX 4090 | |
| Razer Blade 16 2025 RTX 5090 | |
| Alienware x16 R2 P120F | |
| Asus ROG Zephyrus G16 GU605CX | |
| AIDA64 / FP64 Ray-Trace | |
| Razer Blade 16 2025 RTX 5090 | |
| Average Intel Core Ultra 9 275HX (17631 - 21372, n=6) | |
| Lenovo Legion Pro 7i 16 Gen 10 | |
| MSI Vector 16 HX A14V | |
| Lenovo Legion 9 16IRX9, RTX 4090 | |
| Asus ROG Zephyrus G16 GU605CX | |
| Alienware x16 R2 P120F | |
| AIDA64 / CPU PhotoWorxx | |
| Asus ROG Zephyrus G16 GU605CX | |
| Lenovo Legion 9 16IRX9, RTX 4090 | |
| Lenovo Legion Pro 7i 16 Gen 10 | |
| Alienware x16 R2 P120F | |
| Average Intel Core Ultra 9 275HX (47726 - 56613, n=6) | |
| Razer Blade 16 2025 RTX 5090 | |
| MSI Vector 16 HX A14V | |
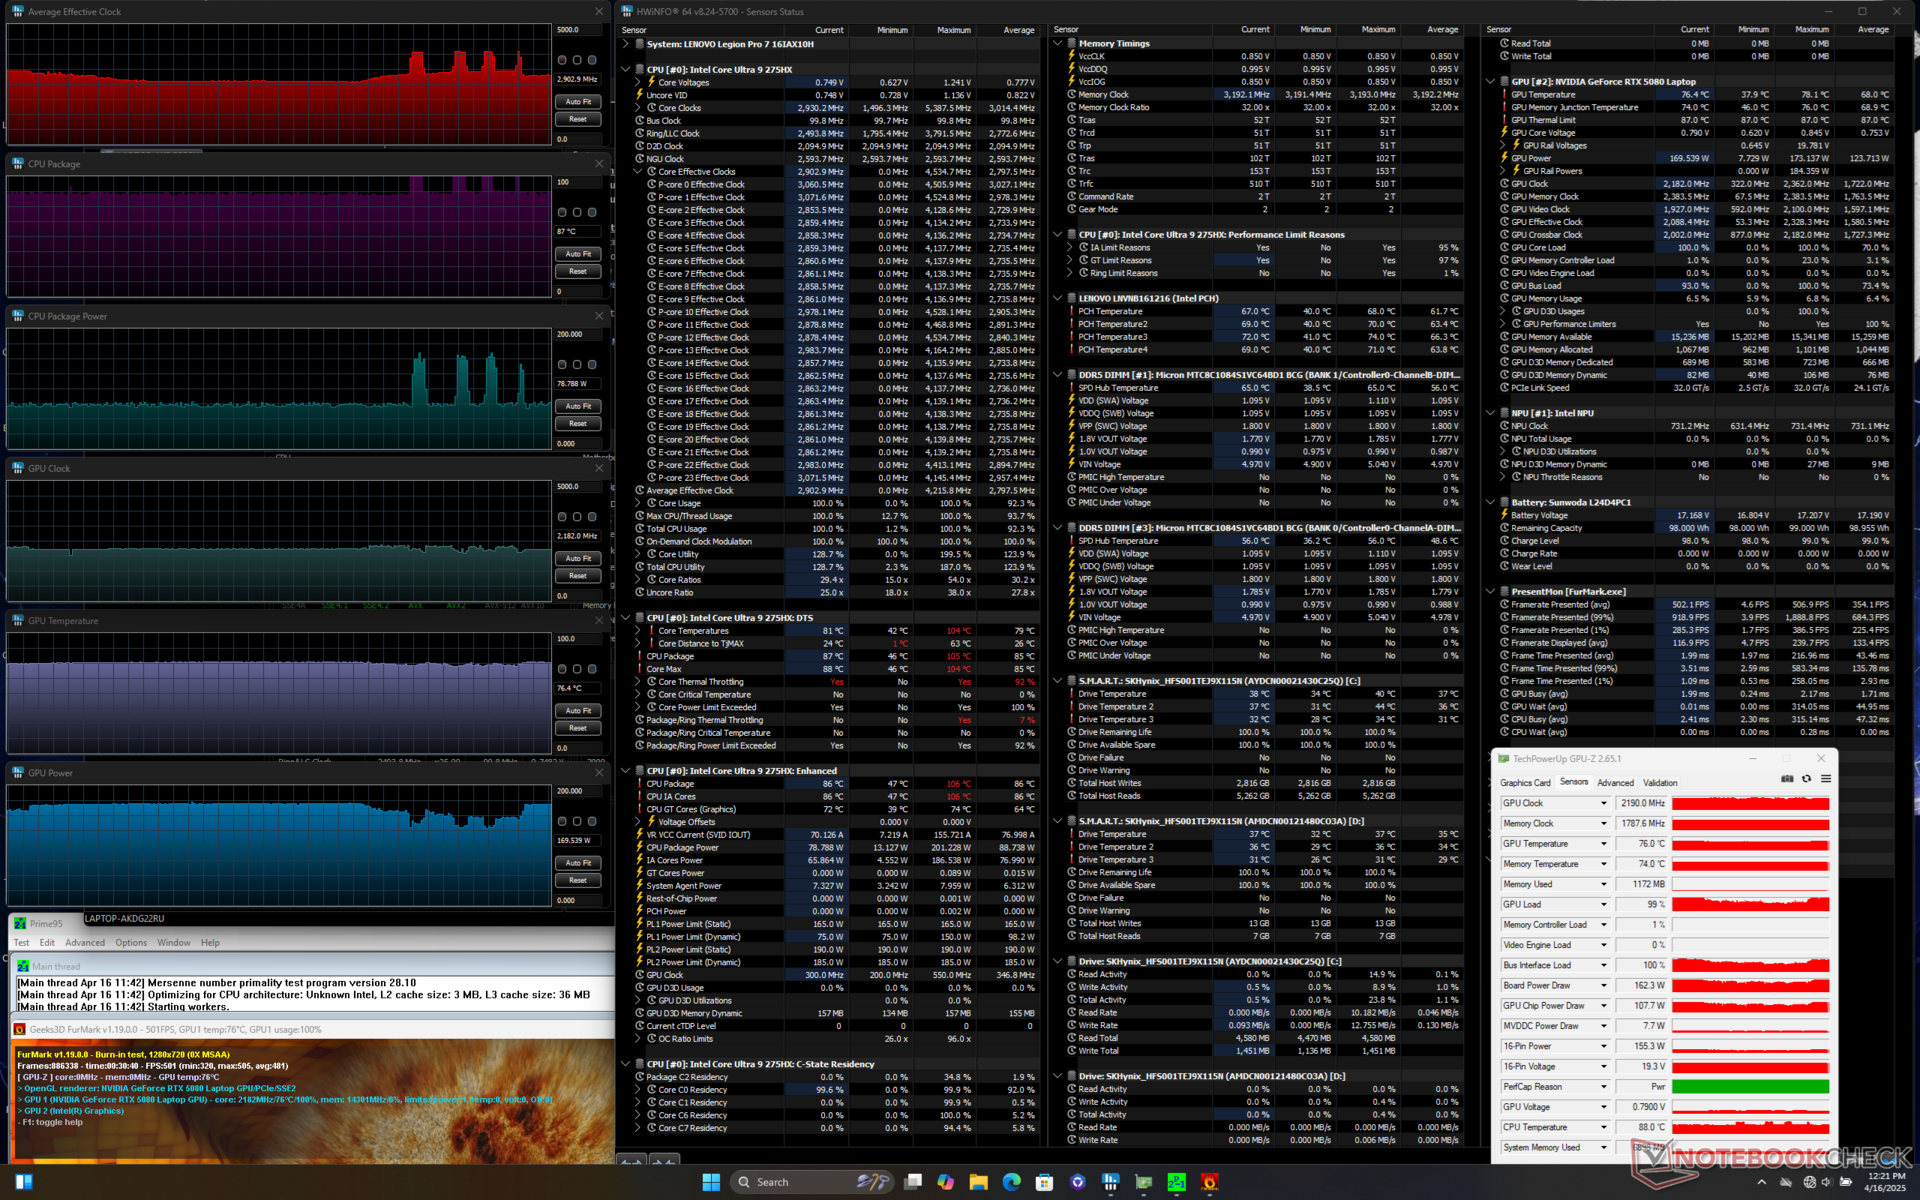
压力测试
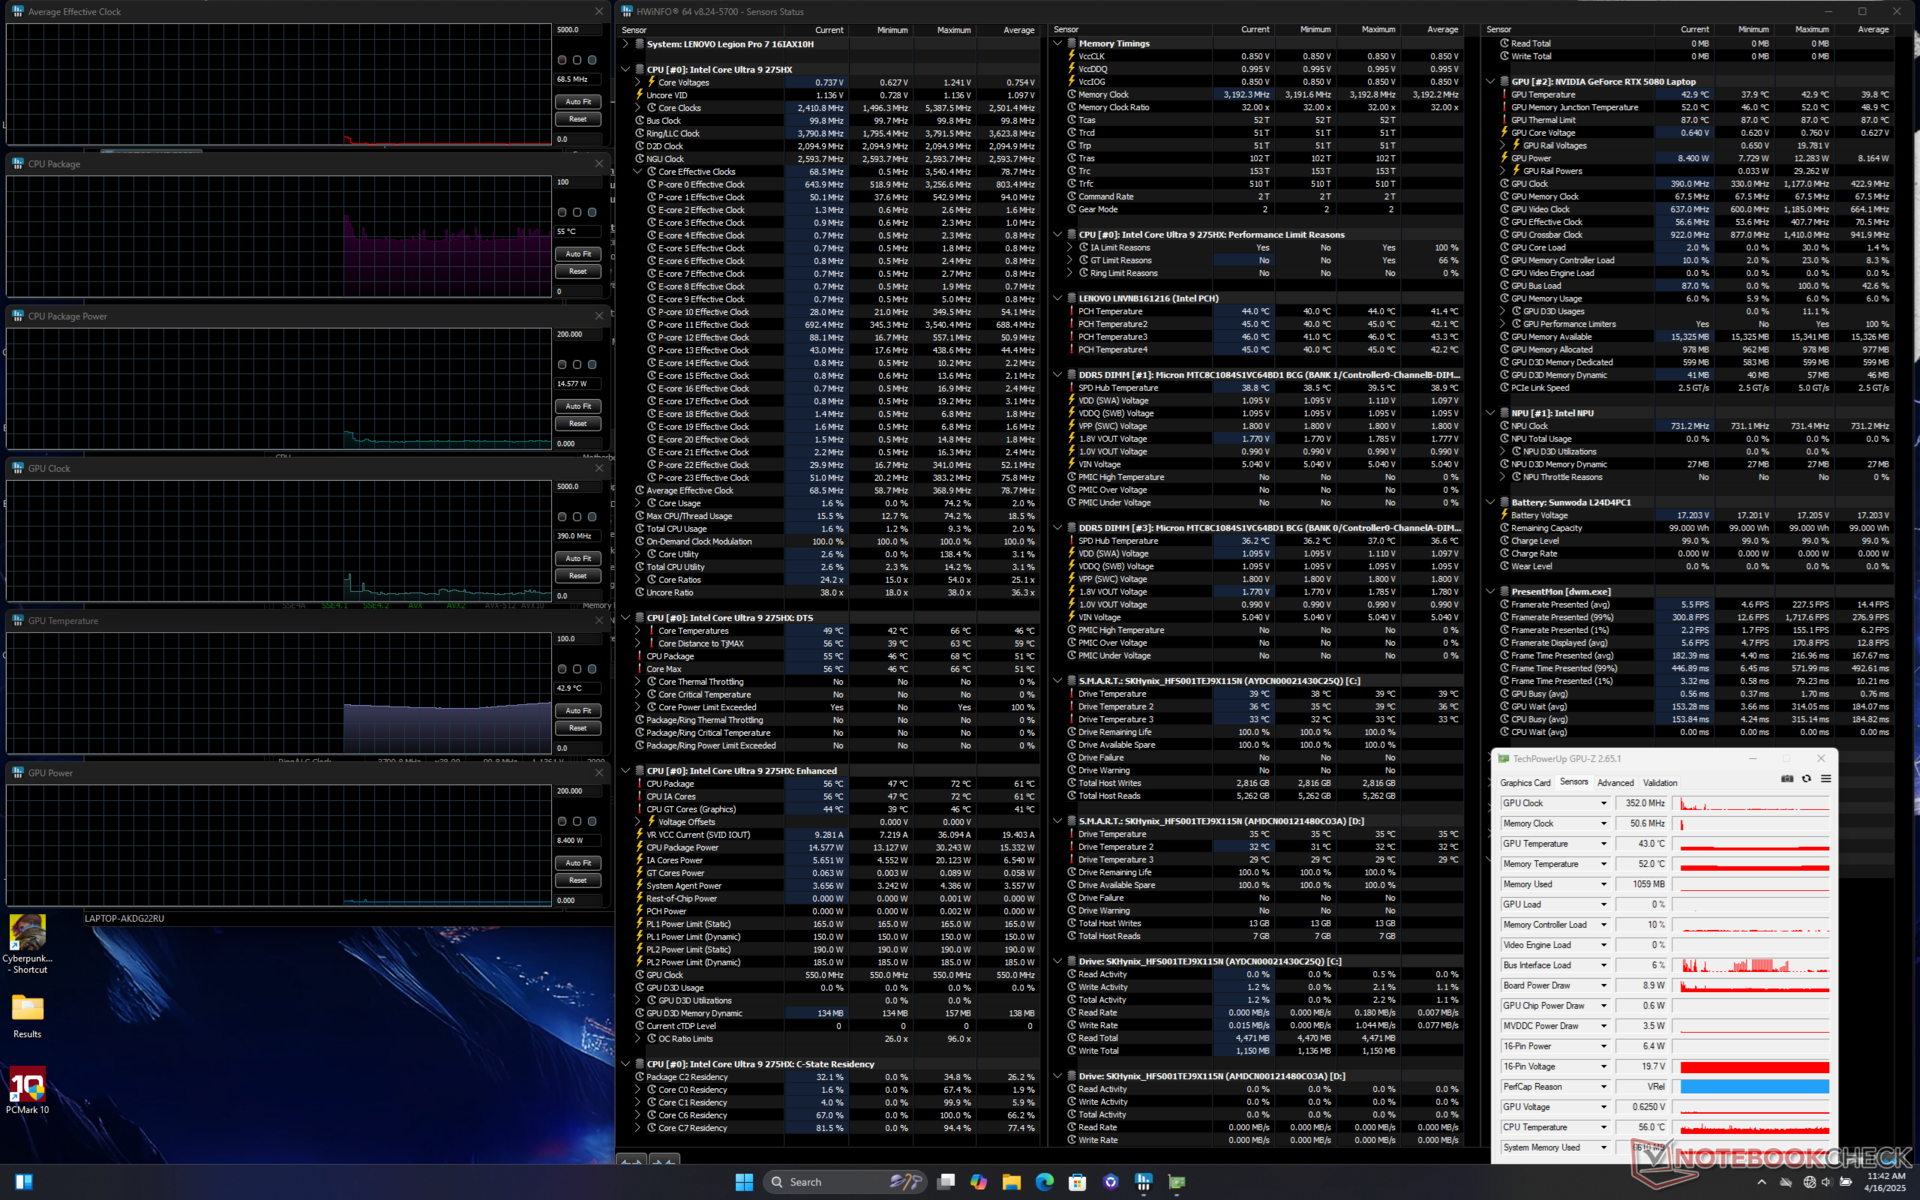
尽管采用了超大汽室冷却解决方案,但核心温度仍然很高,尤其是 CPU。在运行 Prime95 时,CPU 的频率稳定在 3.9 GHz,功耗约为 156 W,温度为 95 C,比已经很热的 Pro 5 16IRX9 还要高。 Legion Pro 5 16IRX9的温度还要高。
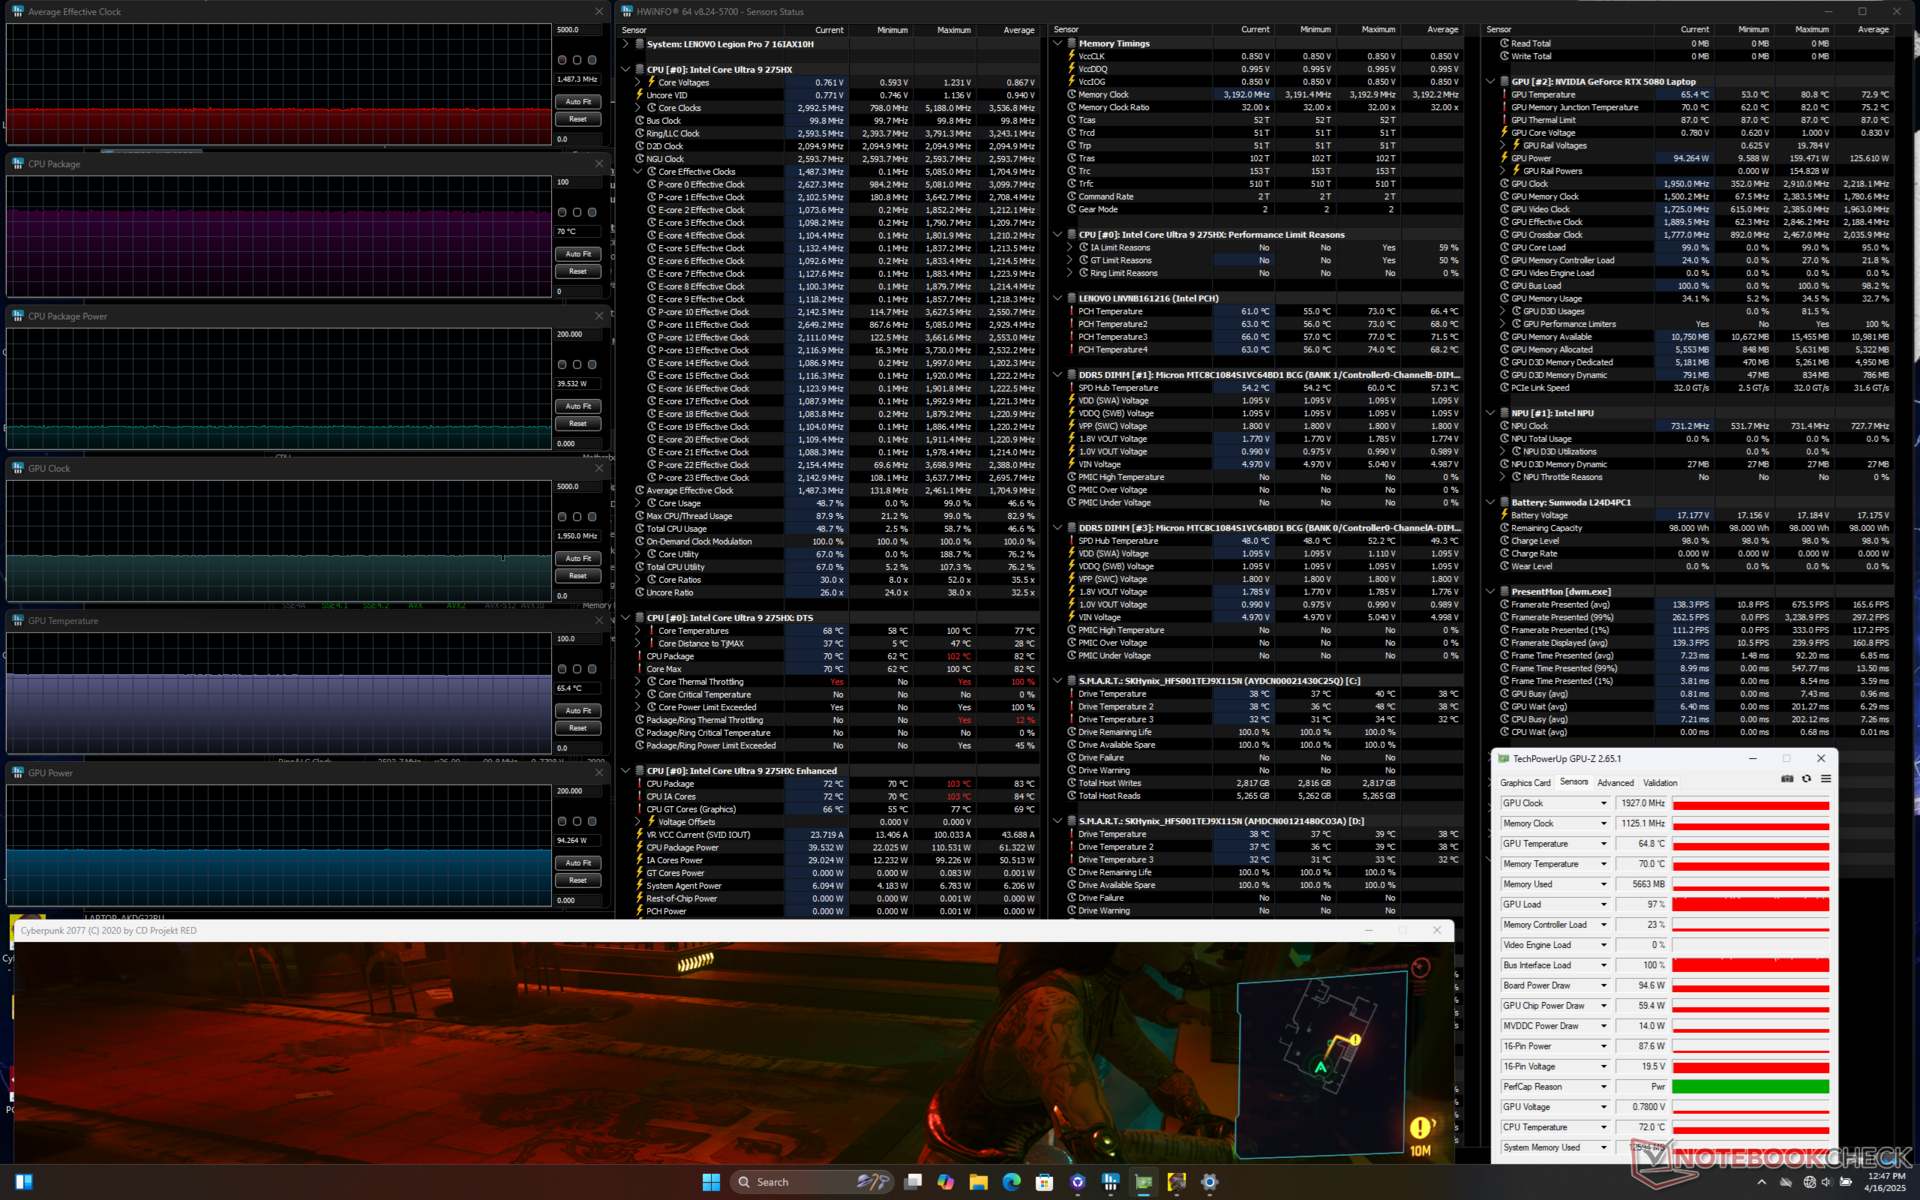
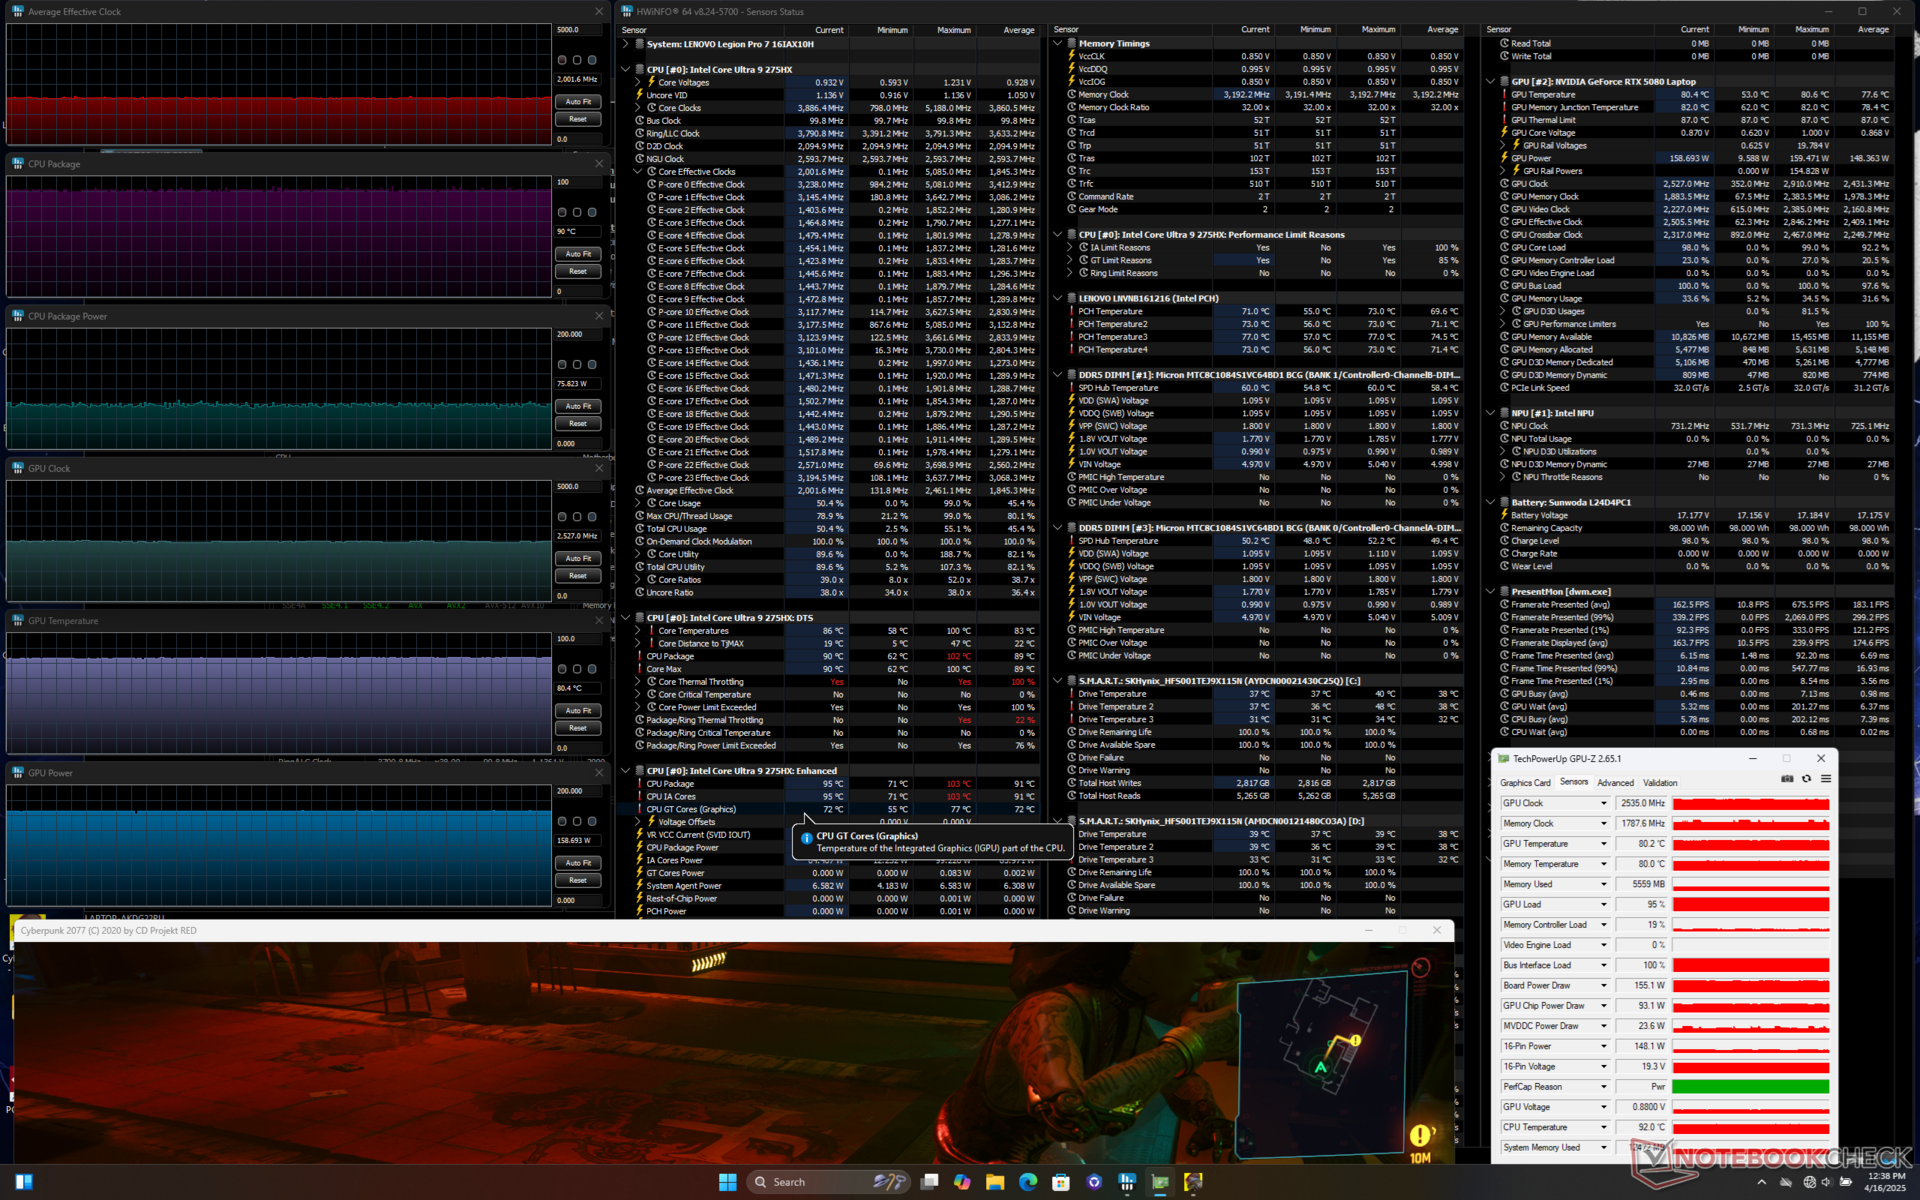
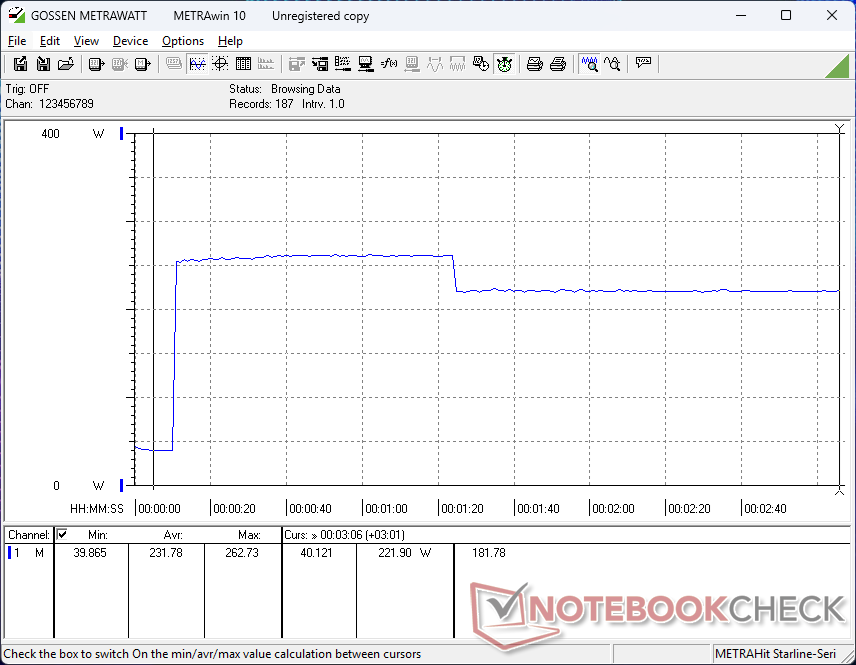
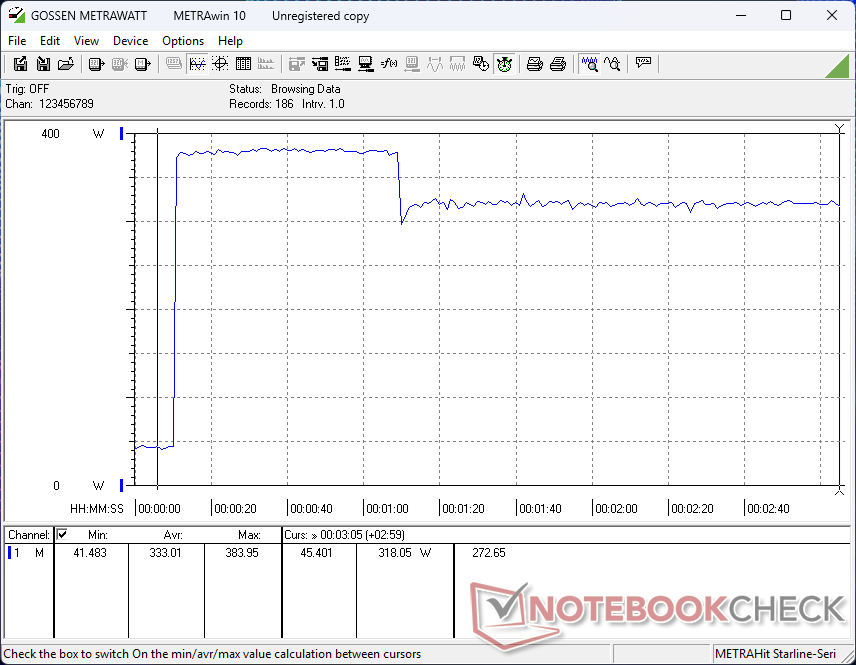
在性能模式下运行《赛博朋克2077》(代表典型的游戏压力)时,NvidiaGPU 将稳定在 80 C 和 155 W,而 CPU 将稳定在 90 C 和 76 W。降到平衡模式后,GPU 将降至 65 C 和 95 W,CPU 将降至 70 C 和 40 W,处理器和内存时钟全面降低,如下图所示。因此,平衡模式和性能模式之间的功耗节省相当可观。
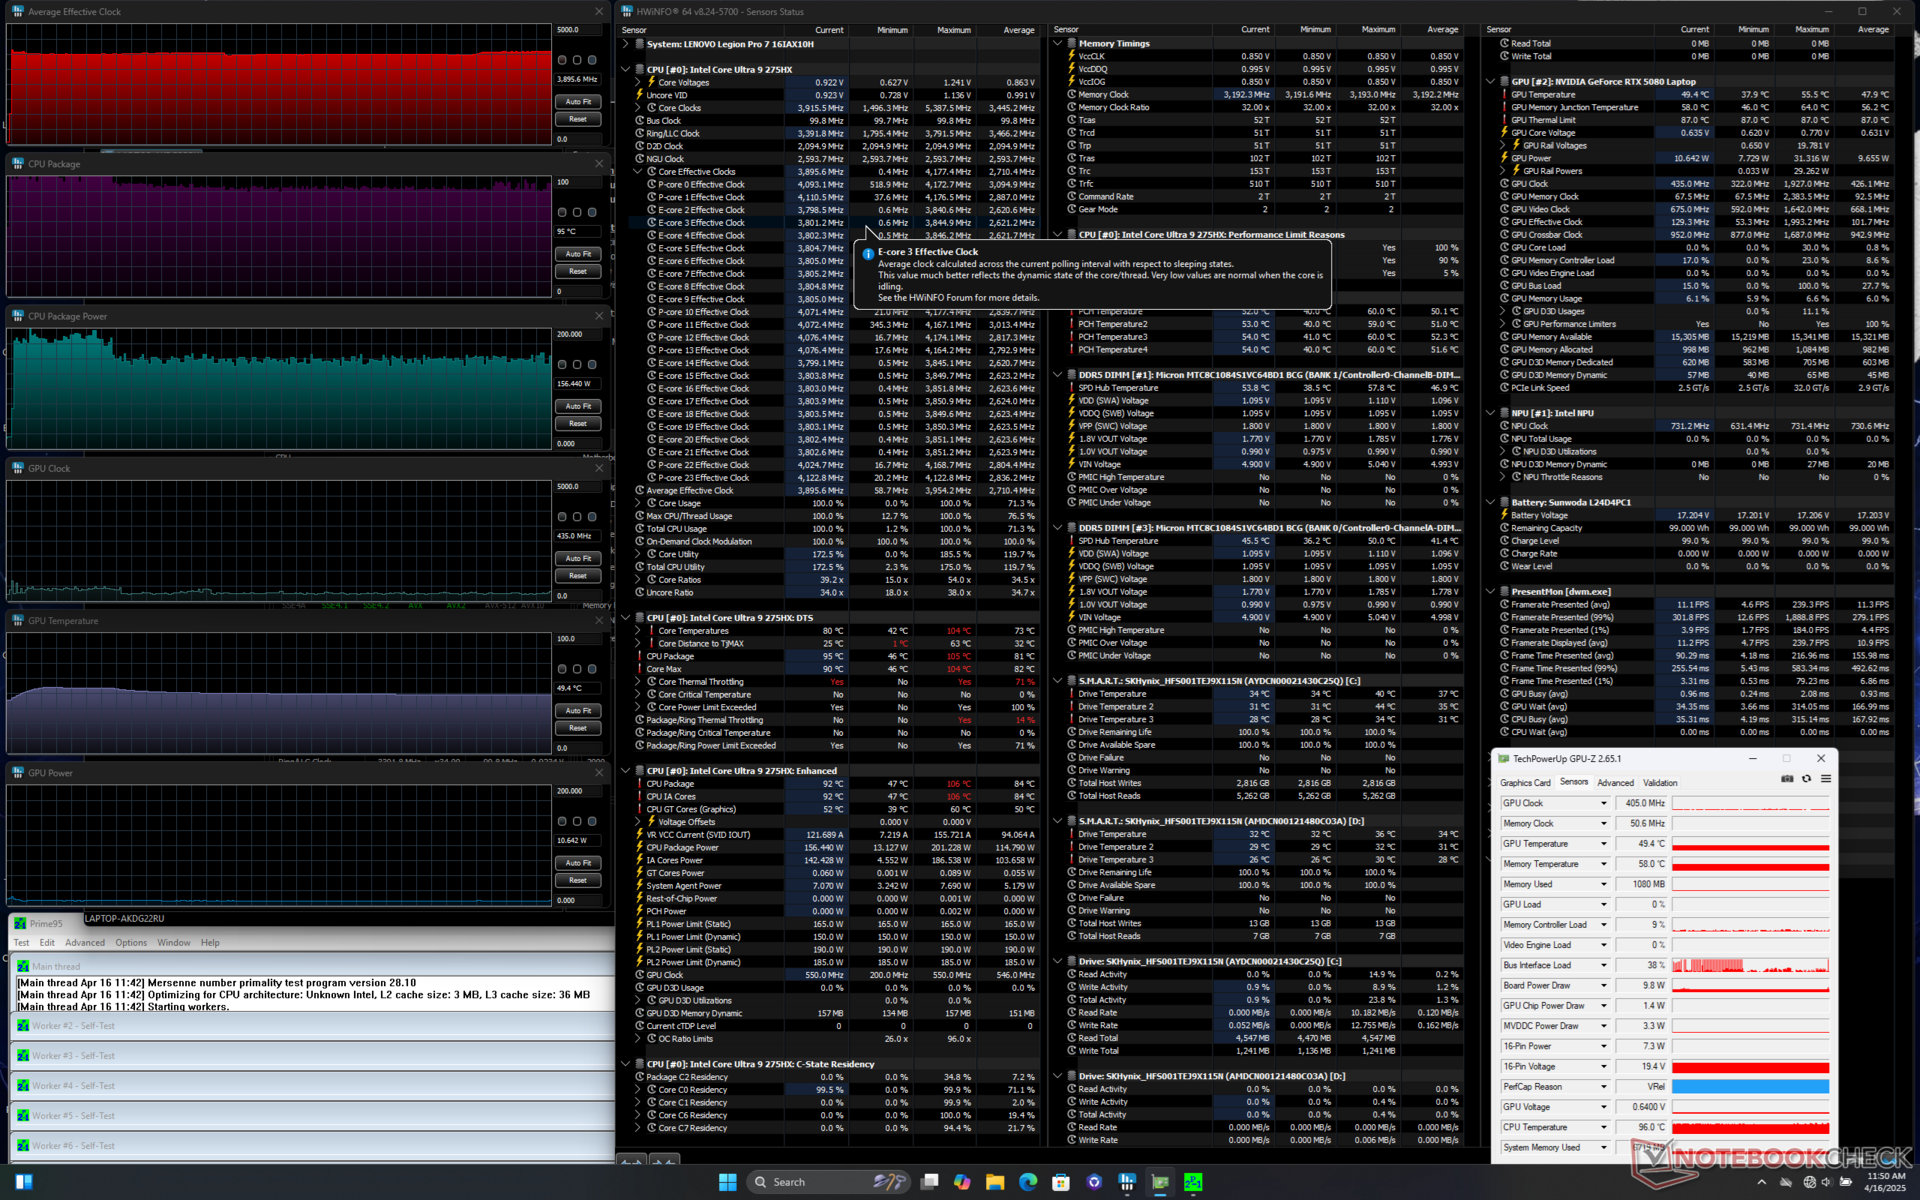
| 平均CPU 时钟 (GHz) | GPU 时钟 (MHz) | 平均 CPU 温度 (°C) | 平均 GPU 温度 (°C) | |
| 系统闲置 | -- | -- | 55 | 43 |
| Prime95 压力 | 3.9 | -- | 95 | 49 |
| Prime95 + FurMark 压力 | 2.9 | 2190 | 87 | 76 |
| 赛博朋克2077》压力(性能模式) | 2.0 | 2535 | 90 | 80 赛博朋克2077 |
| 赛博朋克2077》压力(平衡模式) | 1.5 | 1927 | 70 | 65 |
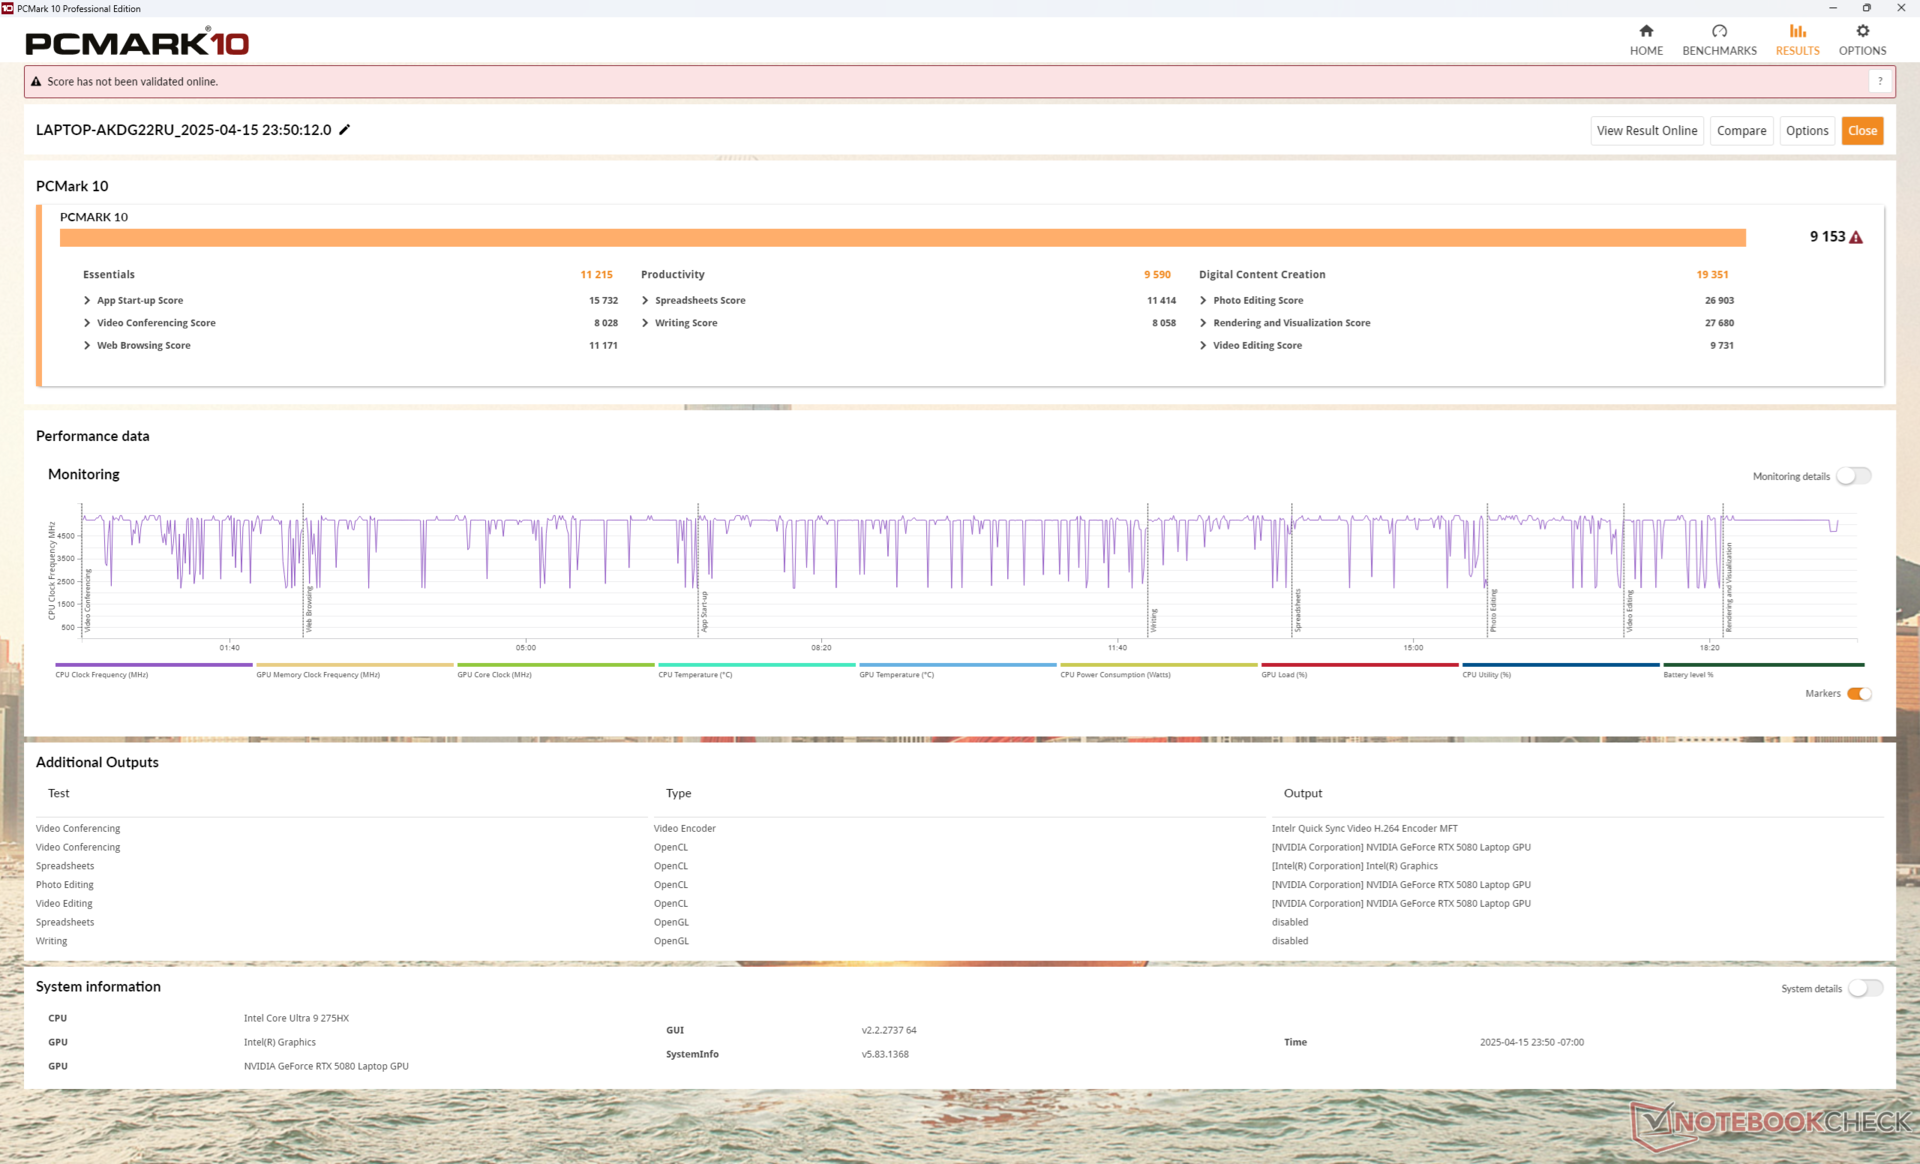
系统性能
PCMark 平均得分高于我们迄今为止测试过的大多数其他 16 英寸 RTX 5090 笔记本电脑,包括 Razer Blade 16 和华硕 ROG Zephyrus G16。只有申克 Neo 16 A25。 申克 Neo 16 A25能够超越我们的联想系统,部分原因在于其 Ryzen 9 9955HX CPU 和 PCIe5 Samsung 9100 Pro SSD。
CrossMark: Overall | Productivity | Creativity | Responsiveness
WebXPRT 3: Overall
WebXPRT 4: Overall
Mozilla Kraken 1.1: Total
| PCMark 10 / Score | |
| Lenovo Legion Pro 7i 16 Gen 10 | |
| Average Intel Core Ultra 9 275HX, Nvidia GeForce RTX 5080 Laptop (8856 - 9153, n=2) | |
| Asus ROG Zephyrus G16 GU605CX | |
| MSI Vector 16 HX A14V | |
| Razer Blade 16 2025 RTX 5090 | |
| Lenovo Legion 9 16IRX9, RTX 4090 | |
| Alienware x16 R2 P120F | |
| PCMark 10 / Essentials | |
| MSI Vector 16 HX A14V | |
| Lenovo Legion Pro 7i 16 Gen 10 | |
| Average Intel Core Ultra 9 275HX, Nvidia GeForce RTX 5080 Laptop (11177 - 11215, n=2) | |
| Lenovo Legion 9 16IRX9, RTX 4090 | |
| Asus ROG Zephyrus G16 GU605CX | |
| Razer Blade 16 2025 RTX 5090 | |
| Alienware x16 R2 P120F | |
| PCMark 10 / Productivity | |
| Asus ROG Zephyrus G16 GU605CX | |
| Razer Blade 16 2025 RTX 5090 | |
| Lenovo Legion 9 16IRX9, RTX 4090 | |
| MSI Vector 16 HX A14V | |
| Lenovo Legion Pro 7i 16 Gen 10 | |
| Average Intel Core Ultra 9 275HX, Nvidia GeForce RTX 5080 Laptop (9212 - 9590, n=2) | |
| Alienware x16 R2 P120F | |
| PCMark 10 / Digital Content Creation | |
| Lenovo Legion Pro 7i 16 Gen 10 | |
| Average Intel Core Ultra 9 275HX, Nvidia GeForce RTX 5080 Laptop (18305 - 19351, n=2) | |
| MSI Vector 16 HX A14V | |
| Asus ROG Zephyrus G16 GU605CX | |
| Razer Blade 16 2025 RTX 5090 | |
| Lenovo Legion 9 16IRX9, RTX 4090 | |
| Alienware x16 R2 P120F | |
| CrossMark / Overall | |
| MSI Vector 16 HX A14V | |
| Average Intel Core Ultra 9 275HX, Nvidia GeForce RTX 5080 Laptop (2017 - 2165, n=2) | |
| Asus ROG Zephyrus G16 GU605CX | |
| Lenovo Legion Pro 7i 16 Gen 10 | |
| Lenovo Legion 9 16IRX9, RTX 4090 | |
| Alienware x16 R2 P120F | |
| CrossMark / Productivity | |
| MSI Vector 16 HX A14V | |
| Average Intel Core Ultra 9 275HX, Nvidia GeForce RTX 5080 Laptop (1922 - 2014, n=2) | |
| Lenovo Legion Pro 7i 16 Gen 10 | |
| Asus ROG Zephyrus G16 GU605CX | |
| Lenovo Legion 9 16IRX9, RTX 4090 | |
| Alienware x16 R2 P120F | |
| CrossMark / Creativity | |
| MSI Vector 16 HX A14V | |
| Asus ROG Zephyrus G16 GU605CX | |
| Average Intel Core Ultra 9 275HX, Nvidia GeForce RTX 5080 Laptop (2288 - 2451, n=2) | |
| Lenovo Legion Pro 7i 16 Gen 10 | |
| Lenovo Legion 9 16IRX9, RTX 4090 | |
| Alienware x16 R2 P120F | |
| CrossMark / Responsiveness | |
| MSI Vector 16 HX A14V | |
| Lenovo Legion 9 16IRX9, RTX 4090 | |
| Average Intel Core Ultra 9 275HX, Nvidia GeForce RTX 5080 Laptop (1597 - 1853, n=2) | |
| Alienware x16 R2 P120F | |
| Asus ROG Zephyrus G16 GU605CX | |
| Lenovo Legion Pro 7i 16 Gen 10 | |
| WebXPRT 3 / Overall | |
| Lenovo Legion Pro 7i 16 Gen 10 | |
| Average Intel Core Ultra 9 275HX, Nvidia GeForce RTX 5080 Laptop (347 - 359, n=2) | |
| Asus ROG Zephyrus G16 GU605CX | |
| MSI Vector 16 HX A14V | |
| Razer Blade 16 2025 RTX 5090 | |
| Lenovo Legion 9 16IRX9, RTX 4090 | |
| Alienware x16 R2 P120F | |
| WebXPRT 4 / Overall | |
| Average Intel Core Ultra 9 275HX, Nvidia GeForce RTX 5080 Laptop (333 - 336, n=2) | |
| Lenovo Legion Pro 7i 16 Gen 10 | |
| Asus ROG Zephyrus G16 GU605CX | |
| MSI Vector 16 HX A14V | |
| Razer Blade 16 2025 RTX 5090 | |
| Lenovo Legion 9 16IRX9, RTX 4090 | |
| Alienware x16 R2 P120F | |
| Mozilla Kraken 1.1 / Total | |
| Alienware x16 R2 P120F | |
| Lenovo Legion 9 16IRX9, RTX 4090 | |
| Asus ROG Zephyrus G16 GU605CX | |
| MSI Vector 16 HX A14V | |
| Razer Blade 16 2025 RTX 5090 | |
| Lenovo Legion Pro 7i 16 Gen 10 | |
| Average Intel Core Ultra 9 275HX, Nvidia GeForce RTX 5080 Laptop (405 - 408, n=2) | |
* ... smaller is better
| PCMark 10 Score | 9153 points | |
Help | ||
| AIDA64 / Memory Copy | |
| Asus ROG Zephyrus G16 GU605CX | |
| Razer Blade 16 2025 RTX 5090 | |
| Alienware x16 R2 P120F | |
| Lenovo Legion Pro 7i 16 Gen 10 | |
| Lenovo Legion 9 16IRX9, RTX 4090 | |
| Average Intel Core Ultra 9 275HX (74558 - 86549, n=6) | |
| MSI Vector 16 HX A14V | |
| AIDA64 / Memory Read | |
| Razer Blade 16 2025 RTX 5090 | |
| Lenovo Legion Pro 7i 16 Gen 10 | |
| MSI Vector 16 HX A14V | |
| Alienware x16 R2 P120F | |
| Average Intel Core Ultra 9 275HX (74094 - 95542, n=6) | |
| Lenovo Legion 9 16IRX9, RTX 4090 | |
| Asus ROG Zephyrus G16 GU605CX | |
| AIDA64 / Memory Write | |
| Razer Blade 16 2025 RTX 5090 | |
| Lenovo Legion Pro 7i 16 Gen 10 | |
| Lenovo Legion 9 16IRX9, RTX 4090 | |
| Average Intel Core Ultra 9 275HX (72929 - 84581, n=6) | |
| MSI Vector 16 HX A14V | |
| Asus ROG Zephyrus G16 GU605CX | |
| Alienware x16 R2 P120F | |
| AIDA64 / Memory Latency | |
| Alienware x16 R2 P120F | |
| Asus ROG Zephyrus G16 GU605CX | |
| Average Intel Core Ultra 9 275HX (108.9 - 125.1, n=6) | |
| Lenovo Legion Pro 7i 16 Gen 10 | |
| Razer Blade 16 2025 RTX 5090 | |
| Lenovo Legion 9 16IRX9, RTX 4090 | |
| MSI Vector 16 HX A14V | |
* ... smaller is better
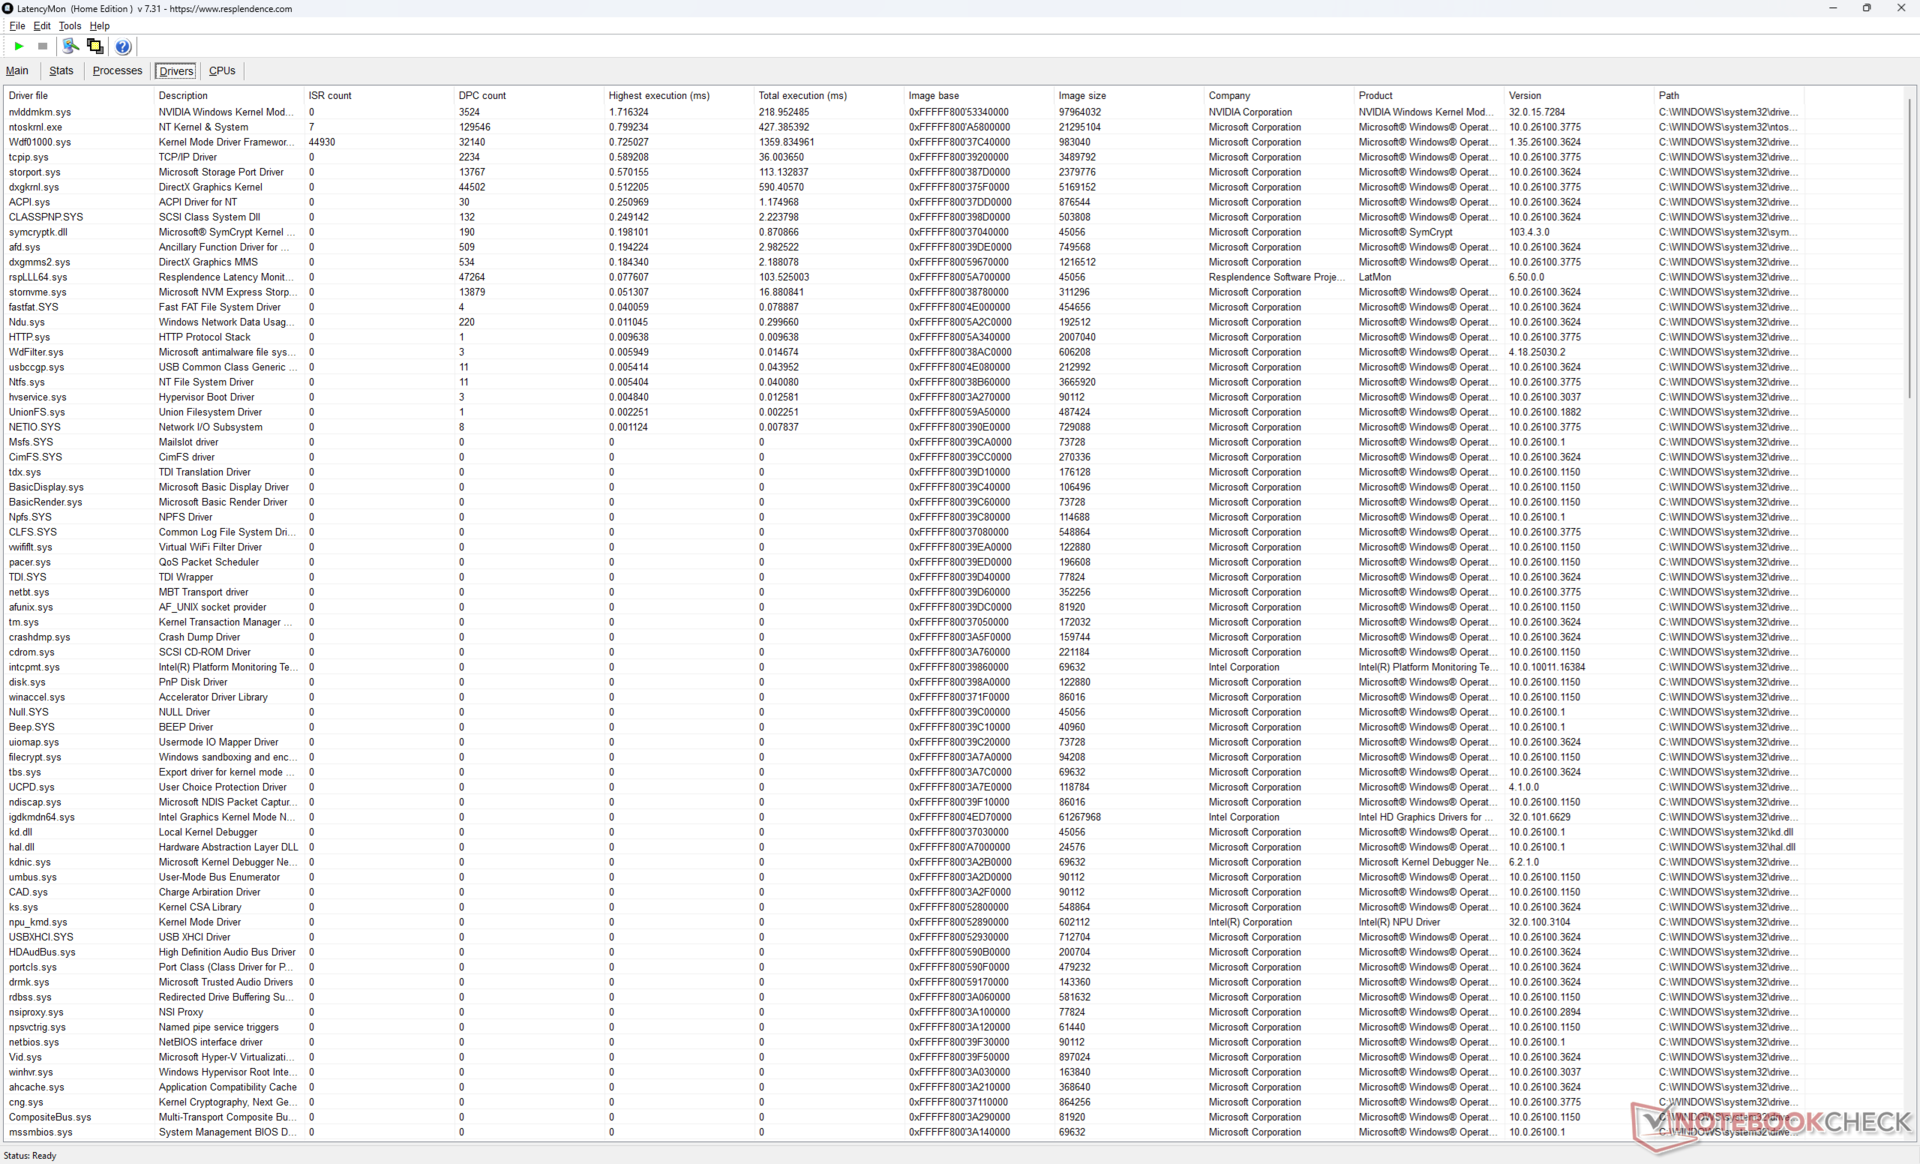
DPC 延迟
LatencyMon 仅在打开主页的多个浏览器标签页时显示了轻微的 DPC 问题,在 4K60 视频播放测试中仅记录了一个丢帧。

| DPC Latencies / LatencyMon - interrupt to process latency (max), Web, Youtube, Prime95 | |
| Alienware x16 R2 P120F | |
| Asus ROG Zephyrus G16 GU605CX | |
| Lenovo Legion 9 16IRX9, RTX 4090 | |
| MSI Vector 16 HX A14V | |
| Razer Blade 16 2025 RTX 5090 | |
| Lenovo Legion Pro 7i 16 Gen 10 | |
* ... smaller is better
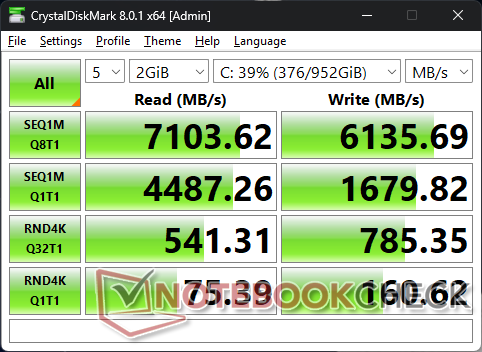
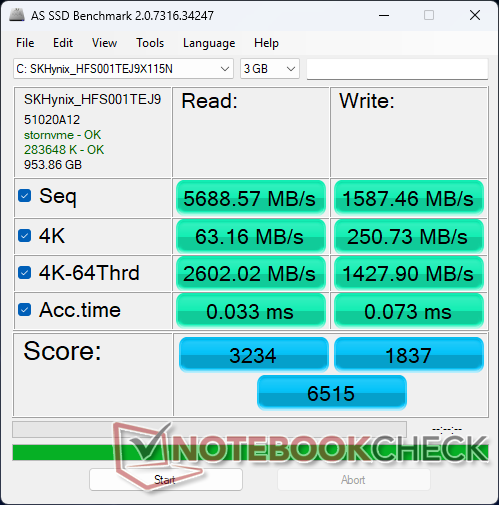
存储设备
该机型最多支持两个 M.2 2280 固态硬盘,其中一个插槽支持 PCIe5 硬盘。不过,我们的测试机仅配备了 PCIe4 硬盘,因此无法测试 PCIe5 硬盘的运行效率。 SK Hynix 硬盘不过,与去年Legion 9 16IRX9 上的美光 3400 相比,我们的 PCIe4 SK Hynix 硬盘运行更稳定,速度更高。

| Drive Performance Rating - Percent | |
| Alienware x16 R2 P120F | |
| Razer Blade 16 2025 RTX 5090 | |
| Lenovo Legion Pro 7i 16 Gen 10 | |
| Lenovo Legion 9 16IRX9, RTX 4090 | |
| Asus ROG Zephyrus G16 GU605CX | |
| MSI Vector 16 HX A14V | |
* ... smaller is better
Disk Throttling: DiskSpd Read Loop, Queue Depth 8
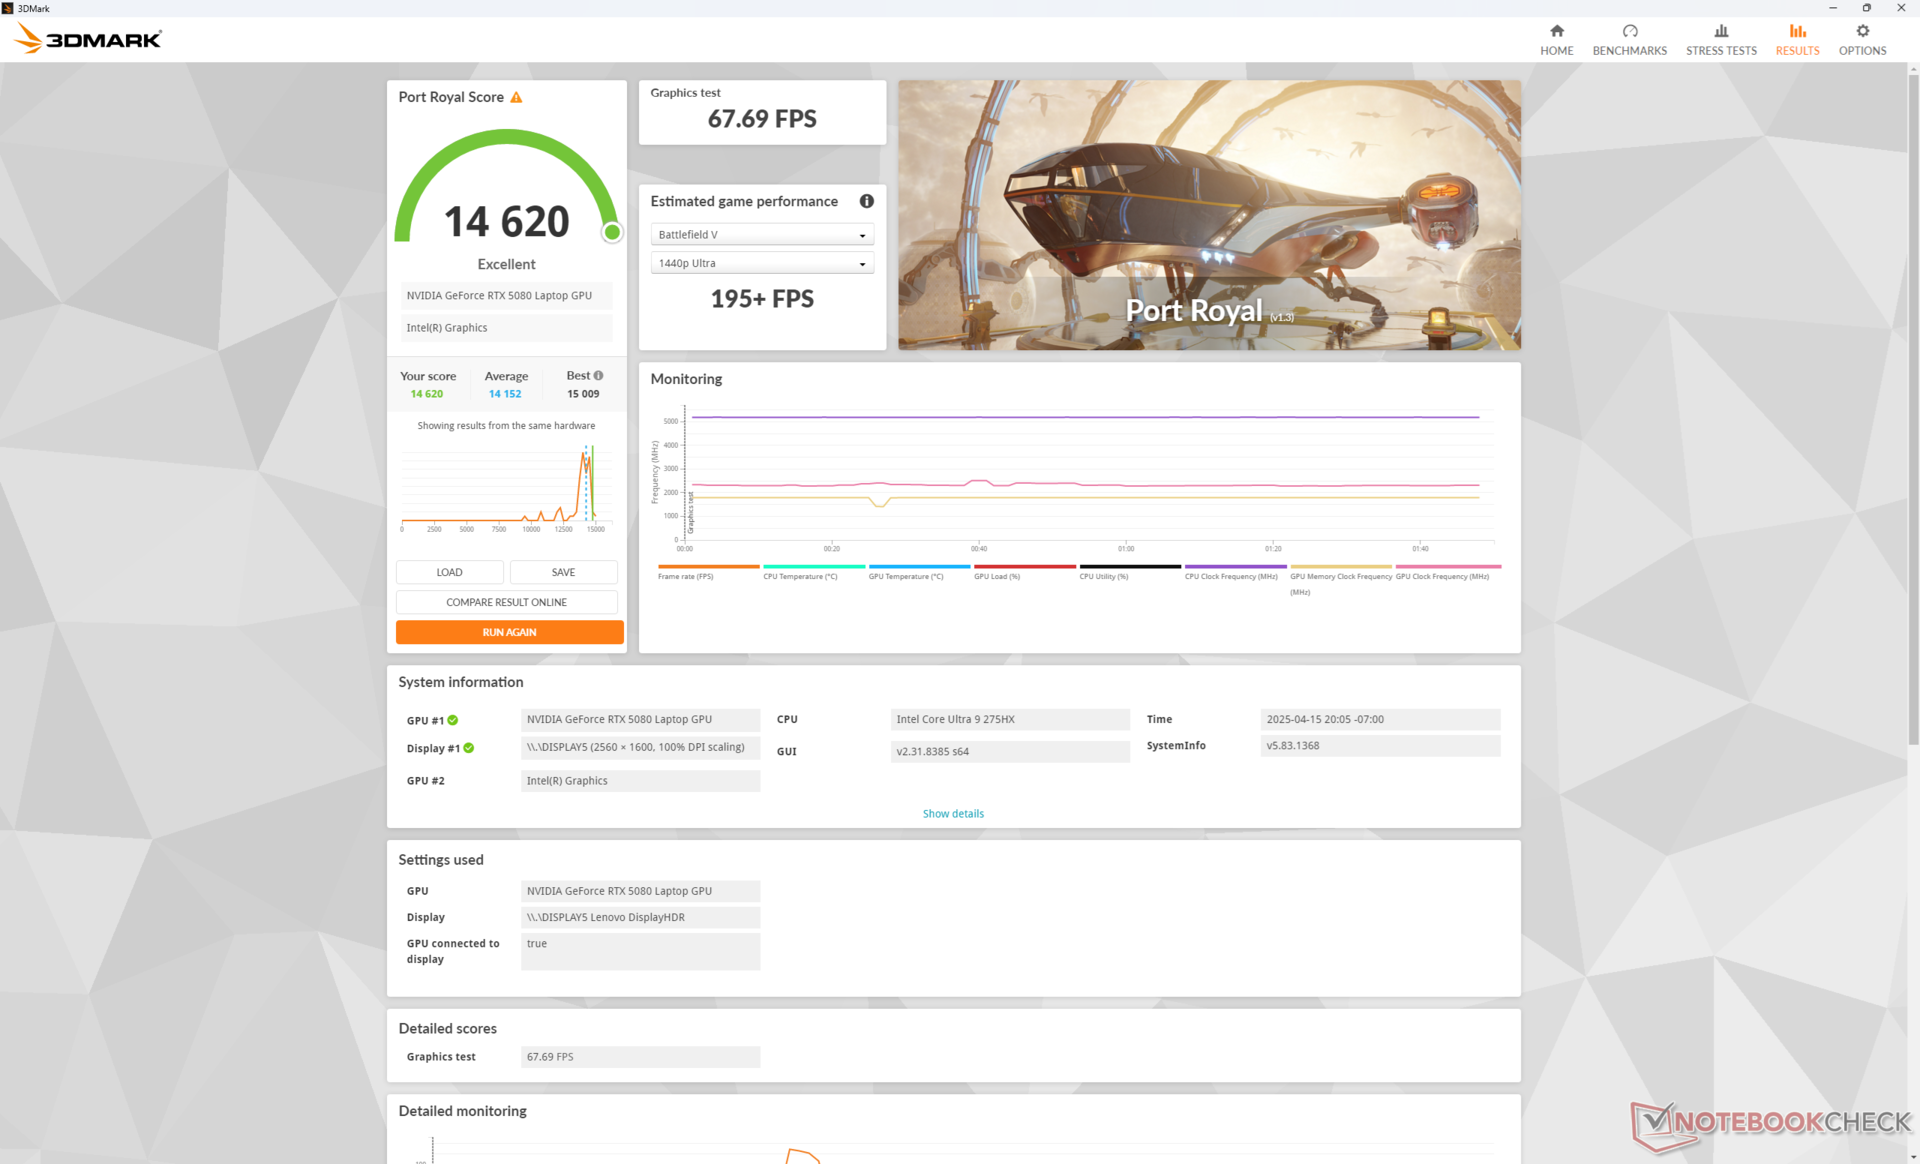
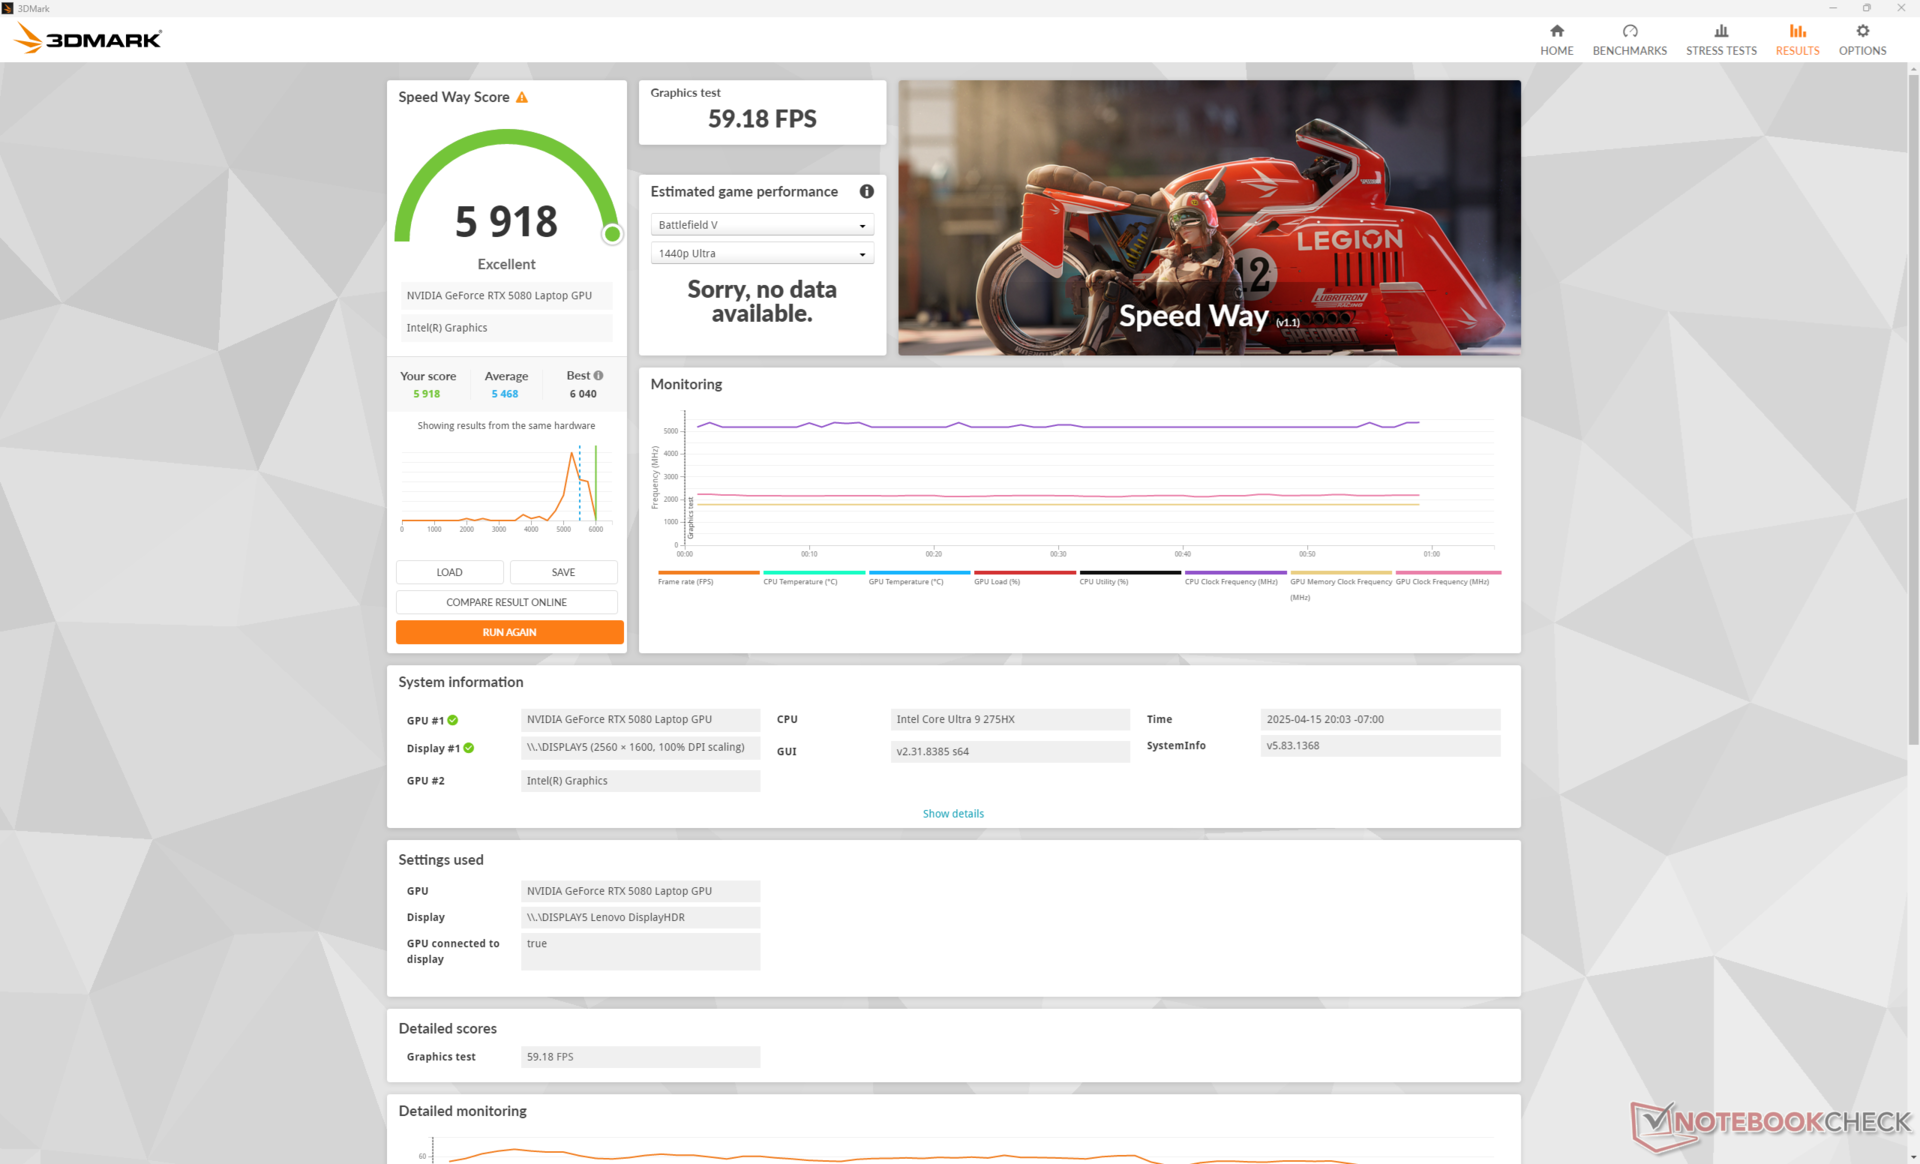
图形处理器性能
我们对 移动版GeForce RTX 5080可以在 这里可以在 了解有关 gpu 及其预期性能的更多信息。 移动 RTX 4080在光栅化方面,微星 Vector 16 HX 的主要优势在于其更高效的张量内核、对多帧生成的支持以及 4:2:2 编码/解码。
| 性能参数 | 图形得分 | 物理得分 | 综合得分 |
| 性能模式 | 49153 | 47850 | 13127 |
| 均衡模式 | 42534 (-13%) | 47090 (-2%) | 13080 (-0%) |
| 电池电量 | 28253 (-43%) | 26031 (-46%) | 7548 (-43%) |
在平衡模式而非性能模式下进行游戏,图形性能将降低约 13%。
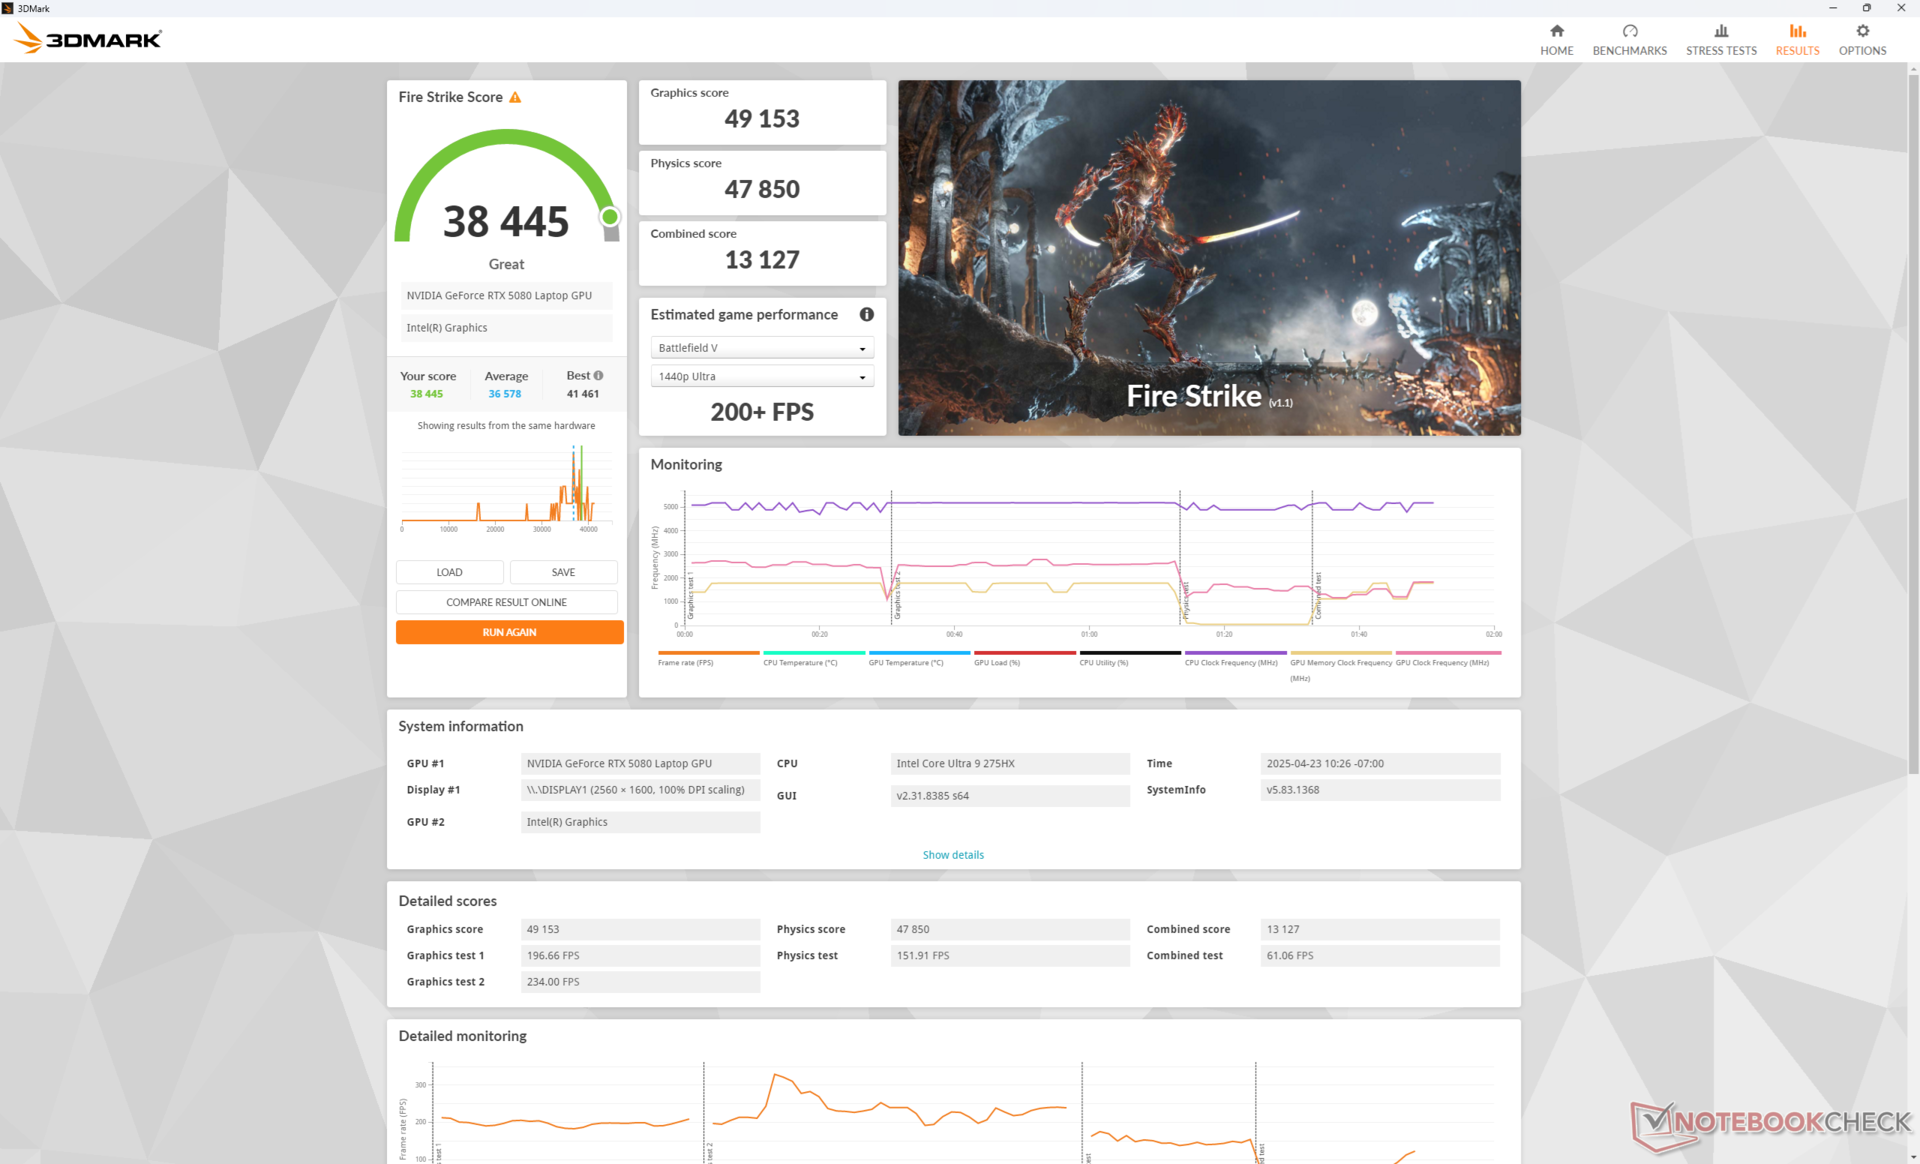
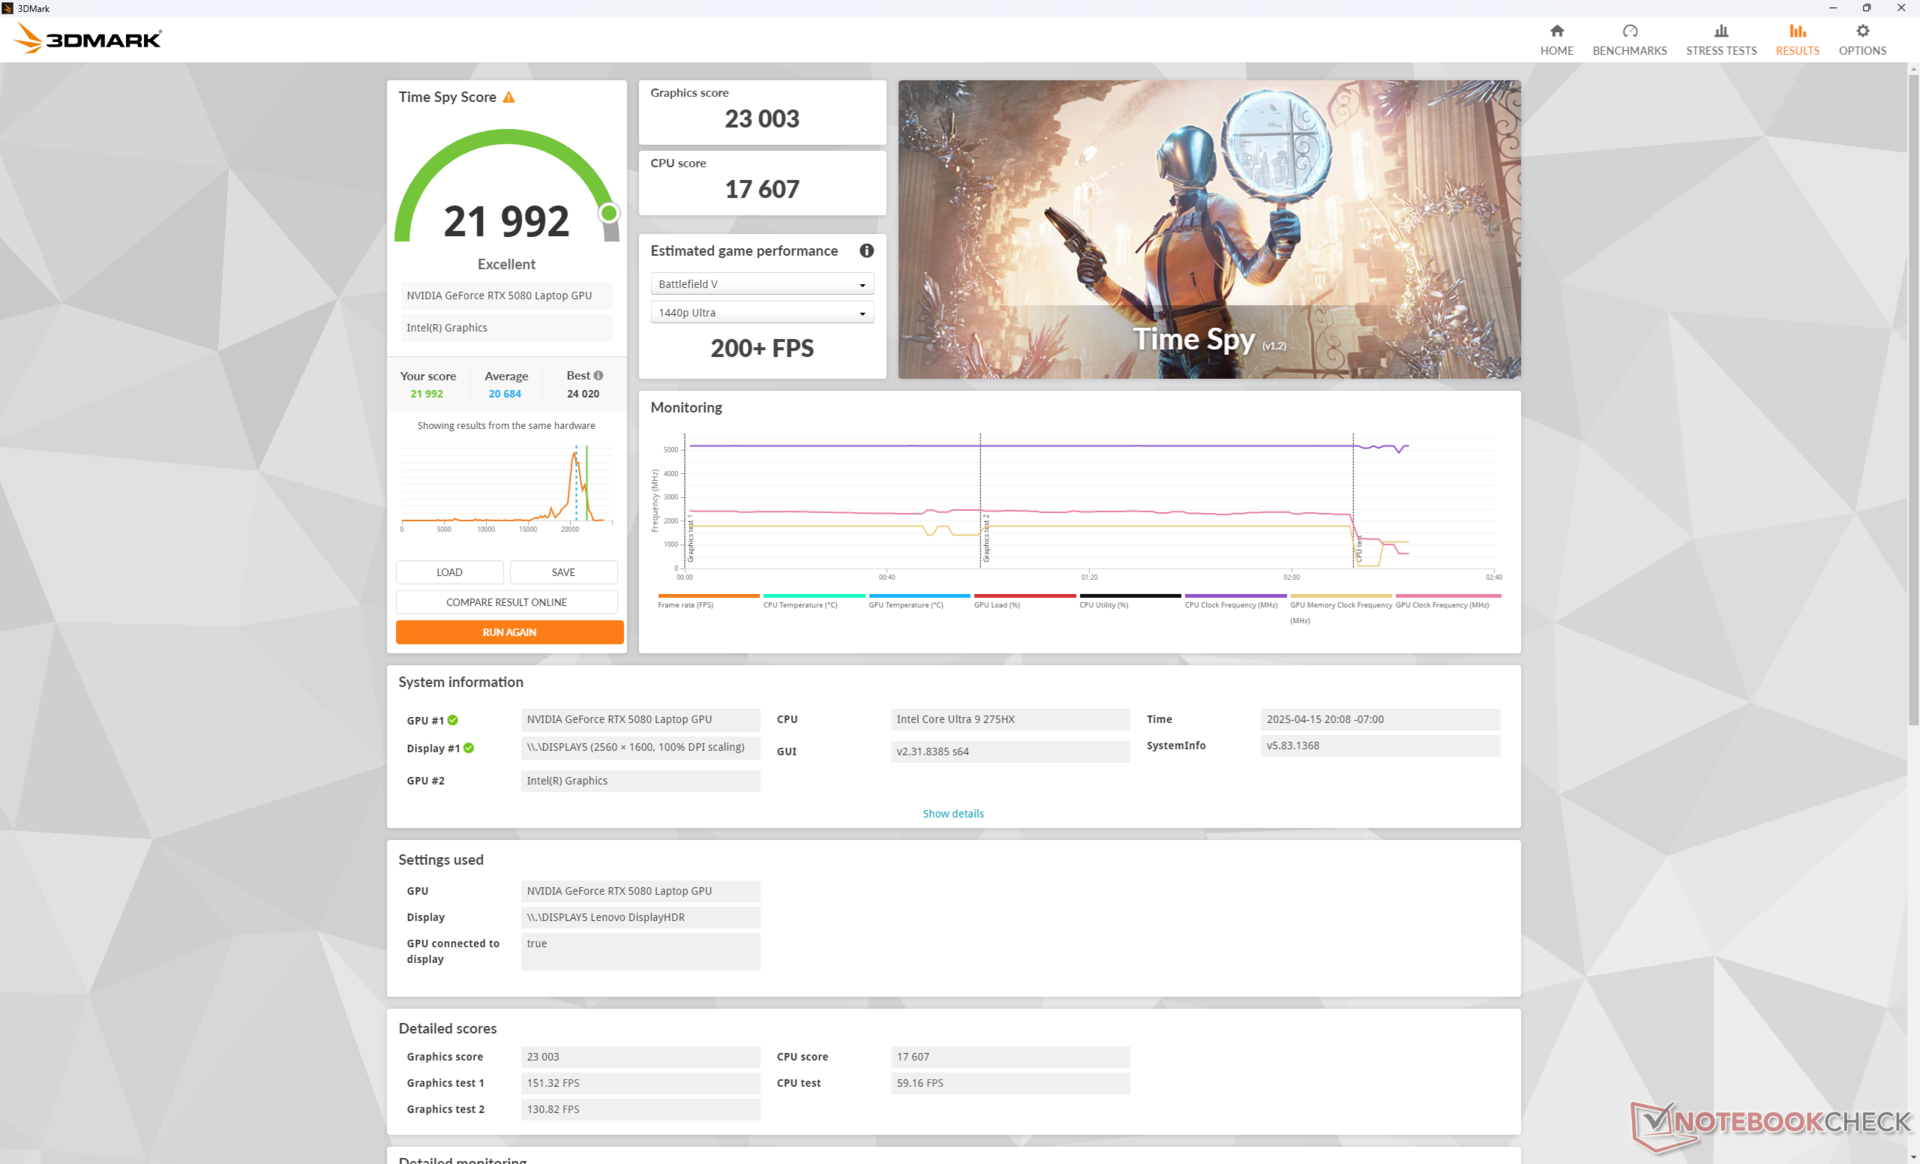
| 3DMark 11 Performance | 51894 points | |
| 3DMark Fire Strike Score | 38445 points | |
| 3DMark Time Spy Score | 21992 points | |
Help | ||
* ... smaller is better
游戏性能
我们的移动版即使在激活 dlss 的情况下,也很难在外部 4k 显示器上进行游戏;例如,在 dlss 质量模式下,《黑色神话悟空传》在最大 4k 设置下的平均帧数仅为 45fps。不过,对于原生 2k oled 显示屏来说,移动版 rtx 5080 非常适合。
| 赛博朋克 2077》幻影自由设置(原生 1600p 下的最大快速预设值) | DLSS 画质 | DLSS 性能 | DLSS 画质(2 倍帧生成 | DLSS 画质(含 4 倍帧生成 | DLAA |
| 平均 FPS | 47.4 | 69.1 | 83.4 | 151 | 23 |
Cyberpunk 2077 ultra FPS Chart
| low | med. | high | ultra | QHD DLSS | QHD | 4K DLSS | 4K FSR | 4K | |
|---|---|---|---|---|---|---|---|---|---|
| Dota 2 Reborn (2015) | 240 | 216 | 203 | 188.9 | 182.1 | ||||
| Final Fantasy XV Benchmark (2018) | 210 | 173.1 | 101.3 | ||||||
| X-Plane 11.11 (2018) | 156.6 | 153.7 | 124.5 | 100.7 | |||||
| Strange Brigade (2018) | 481 | 434 | 304 | 169.7 | |||||
| Baldur's Gate 3 (2023) | 276.1 | 250.5 | 220.1 | 211.5 | 155.8 | 132.4 | 81.1 | ||
| Cyberpunk 2077 2.2 Phantom Liberty (2023) | 198.4 | 192 | 172.5 | 156.2 | 119 | 99.8 | 73.4 | 43 | 47.1 |
| Alan Wake 2 (2023) | 135.6 | 131.9 | 124.2 | 83.8 | 43.1 | ||||
| Black Myth: Wukong (2024) | 171 | 128 | 99 | 58 | 62 | 44 | 45 | 26 | |
| Indiana Jones and the Great Circle (2024) | 187.9 | 145.9 | 129.2 | 120.1 | 102.4 | 63.2 | |||
| Monster Hunter Wilds (2025) | 110.1 | 104.4 | 90 | 87.7 | 73.2 | 61.8 | 45.2 | ||
| Assassin's Creed Shadows (2025) | 111 | 104 | 90 | 64 | 65 | 55 | 55 | 40 |
排放 - 只在需要时才发出声音
噪音系统
风扇噪音的最大值几乎与 9 16irx9 相同。Legion 9 16IRX9 的最大值几乎与 9 16IRX9 相同。因此,尽管体积相对较大,但它并不比其他大多数游戏笔记本电脑更安静。另一方面,风扇会迅速熄灭,在运行负载要求不高时保持低转速,以避免出现任何脉动行为,即使在性能模式下也是如此。换句话说,风扇只在需要时才会发出响声。
需要注意的是,在平衡模式下进行游戏时,风扇噪音会从 54 dB(A) 显著降低到 40 dB(A),如上所述,图形性能只降低了 15%。
Noise Level
| Idle |
| 22.9 / 22.9 / 26.3 dB(A) |
| Load |
| 27.8 / 53.9 dB(A) |
 | ||
30 dB silent 40 dB(A) audible 50 dB(A) loud |
||
min: | ||
| Lenovo Legion Pro 7i 16 Gen 10 GeForce RTX 5080 Laptop, Ultra 9 275HX, SK Hynix HFS001TEJ9X115N | Lenovo Legion 9 16IRX9, RTX 4090 NVIDIA GeForce RTX 4090 Laptop GPU, i9-14900HX, Micron 3400 2TB MTFDKBA2T0TFH | Asus ROG Zephyrus G16 GU605CX GeForce RTX 5090 Laptop, Ultra 9 285H, Western Digital PC SN5000S SDEPNSJ-2T00-1006 | Razer Blade 16 2025 RTX 5090 GeForce RTX 5090 Laptop, Ryzen AI 9 HX 370, SSSTC CA6-8D2048 | MSI Vector 16 HX A14V NVIDIA GeForce RTX 4080 Laptop GPU, i9-14900HX, WD PC SN560 SDDPNQE-1T00 | Alienware x16 R2 P120F NVIDIA GeForce RTX 4080 Laptop GPU, Ultra 9 185H, WDC PC SN810 1TB | |
|---|---|---|---|---|---|---|
| Noise | -5% | -16% | -16% | -37% | -7% | |
| off / environment * | 22.9 | 23 -0% | 23.8 -4% | 24.1 -5% | 23.2 -1% | 23.4 -2% |
| Idle Minimum * | 22.9 | 23 -0% | 23.8 -4% | 24.1 -5% | 33.5 -46% | 23.8 -4% |
| Idle Average * | 22.9 | 23 -0% | 27.2 -19% | 30.6 -34% | 33.5 -46% | 28.5 -24% |
| Idle Maximum * | 26.3 | 23 13% | 31.3 -19% | 30.6 -16% | 33.5 -27% | 28.5 -8% |
| Load Average * | 27.8 | 39 -40% | 47.6 -71% | 45.5 -64% | 52.1 -87% | 28.8 -4% |
| Cyberpunk 2077 ultra * | 54.2 | 51.3 5% | 48.2 11% | |||
| Load Maximum * | 53.9 | 55.56 -3% | 53.3 1% | 53.4 1% | 62 -15% | 54.2 -1% |
| Witcher 3 ultra * | 55.32 | 62 | 49.5 |
* ... smaller is better
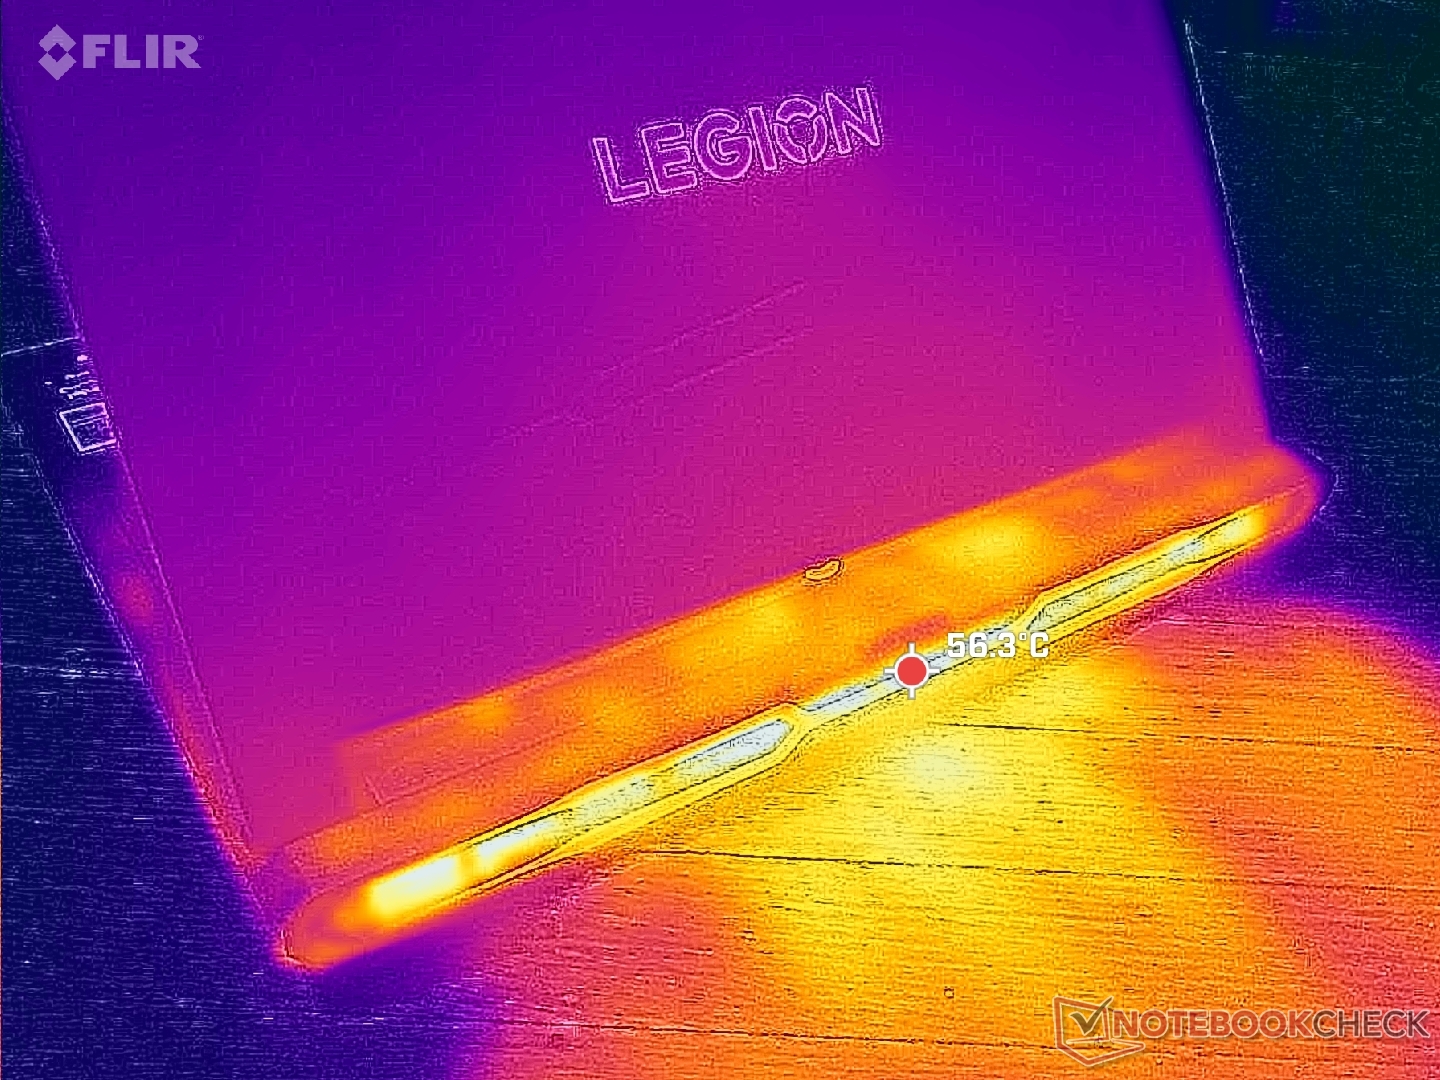
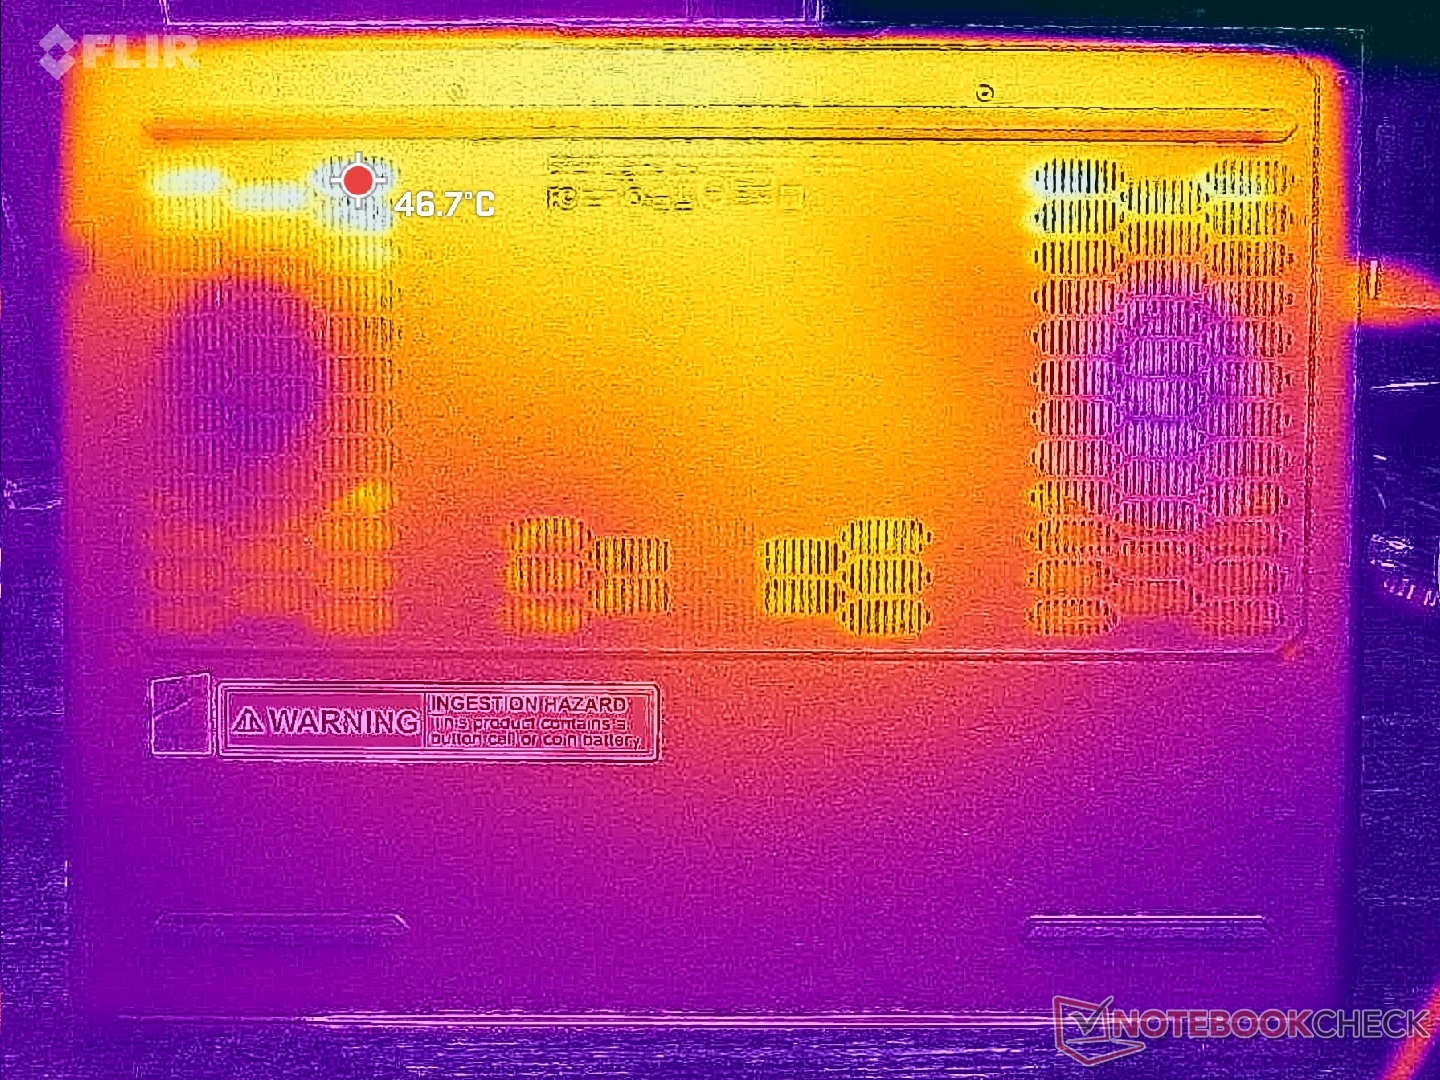
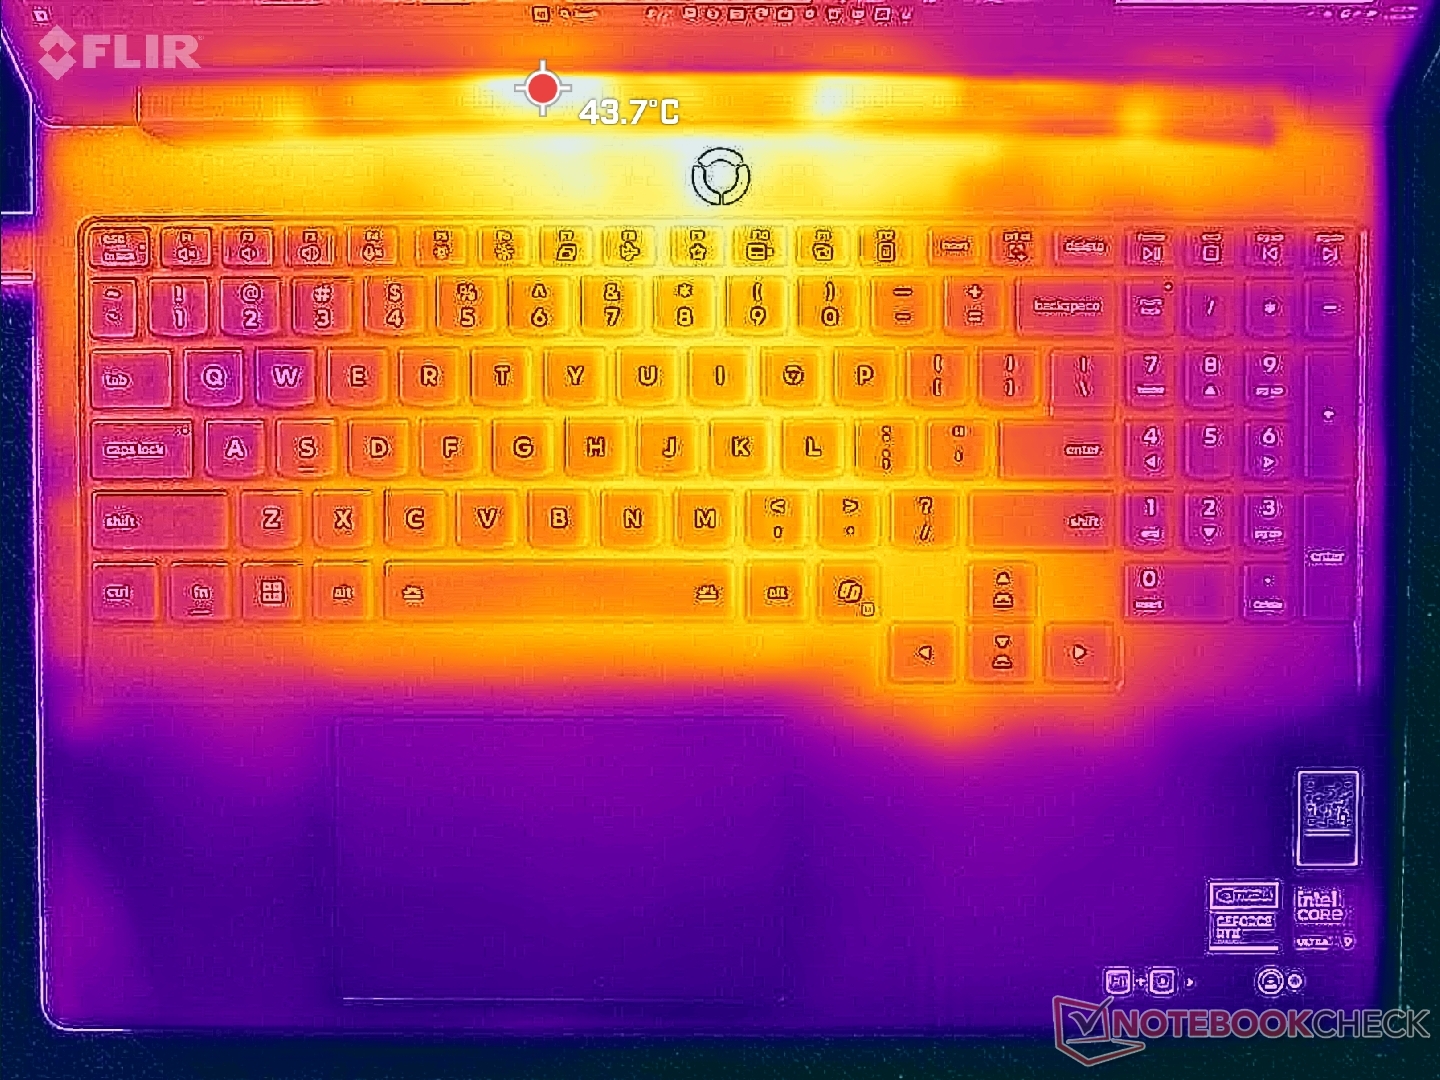
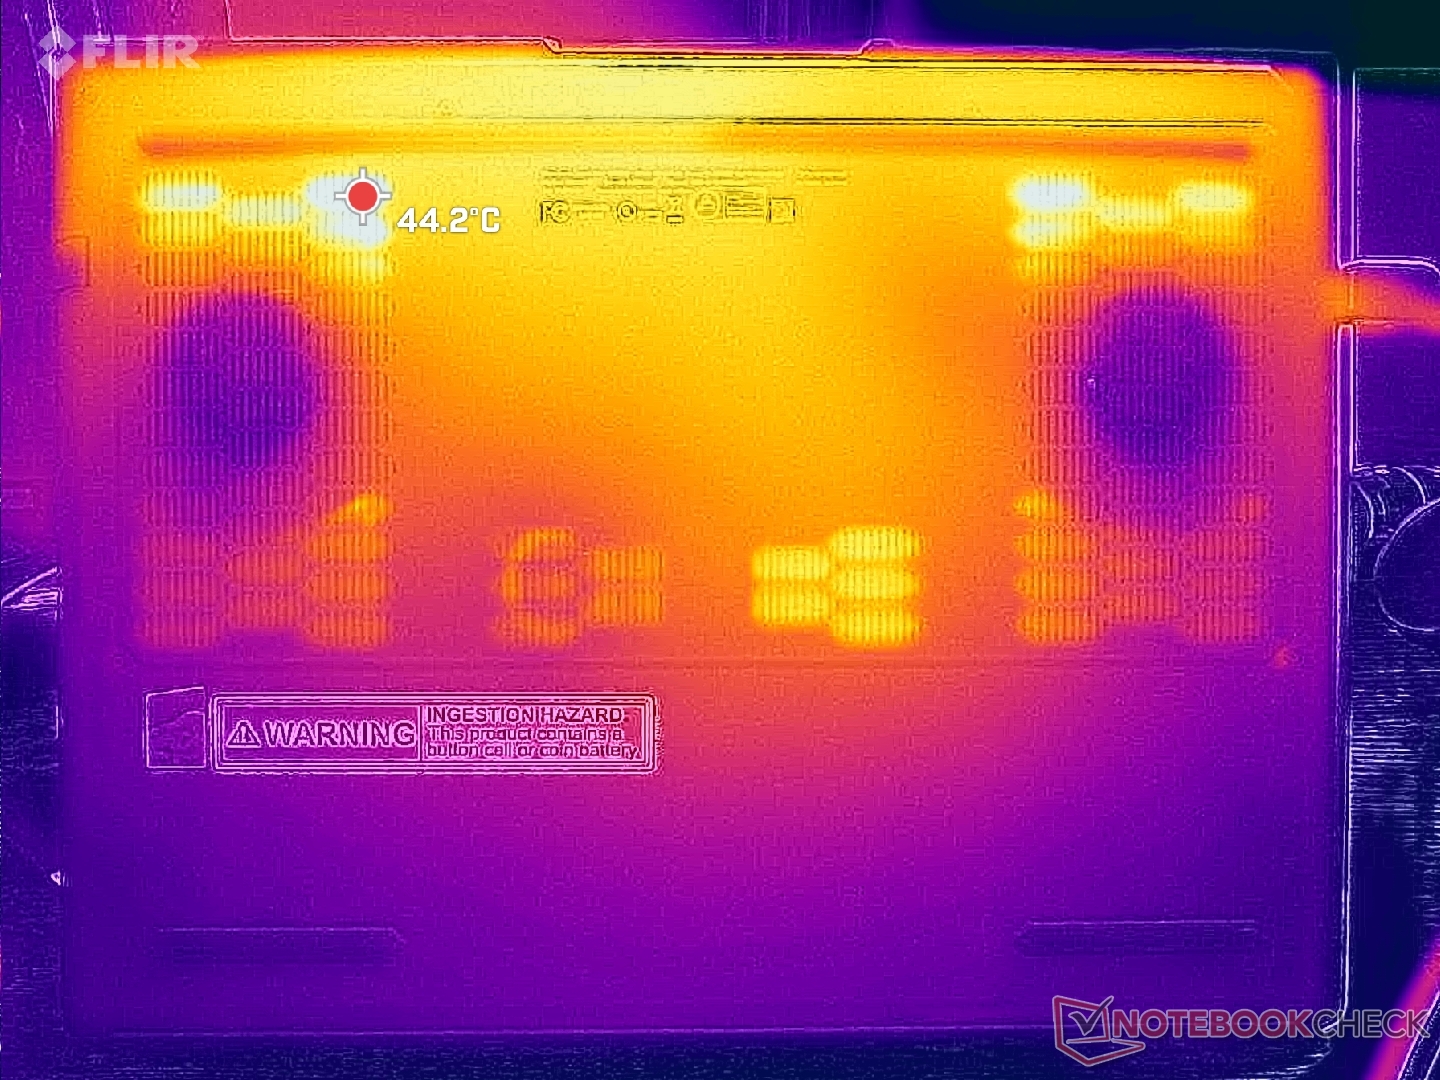
温度
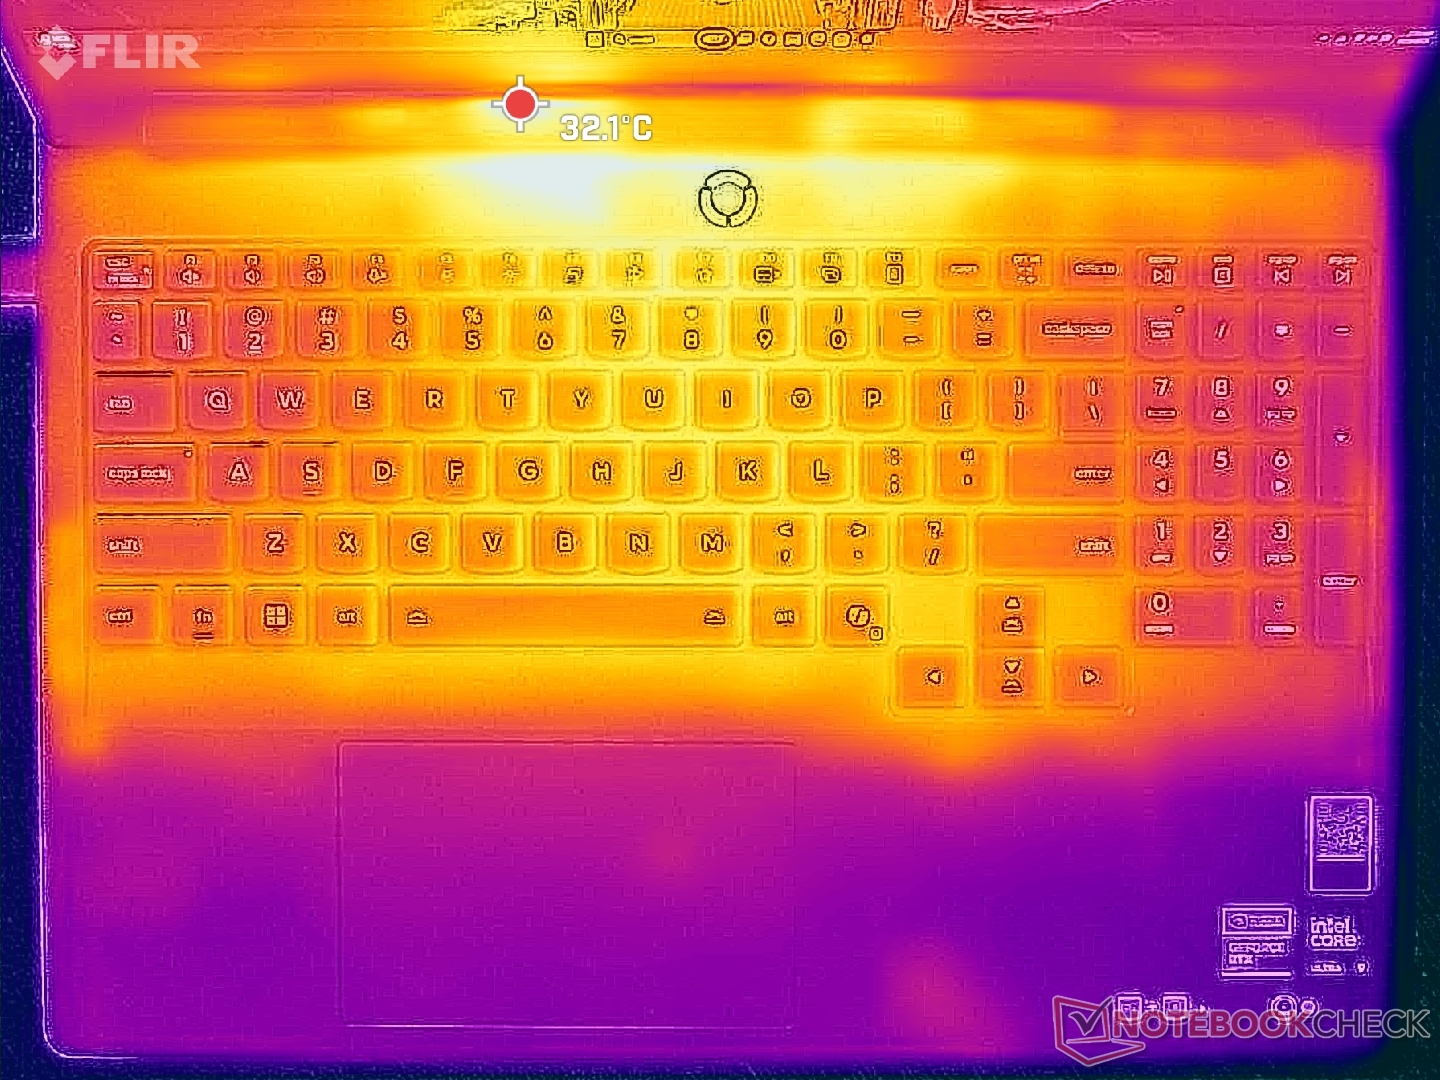
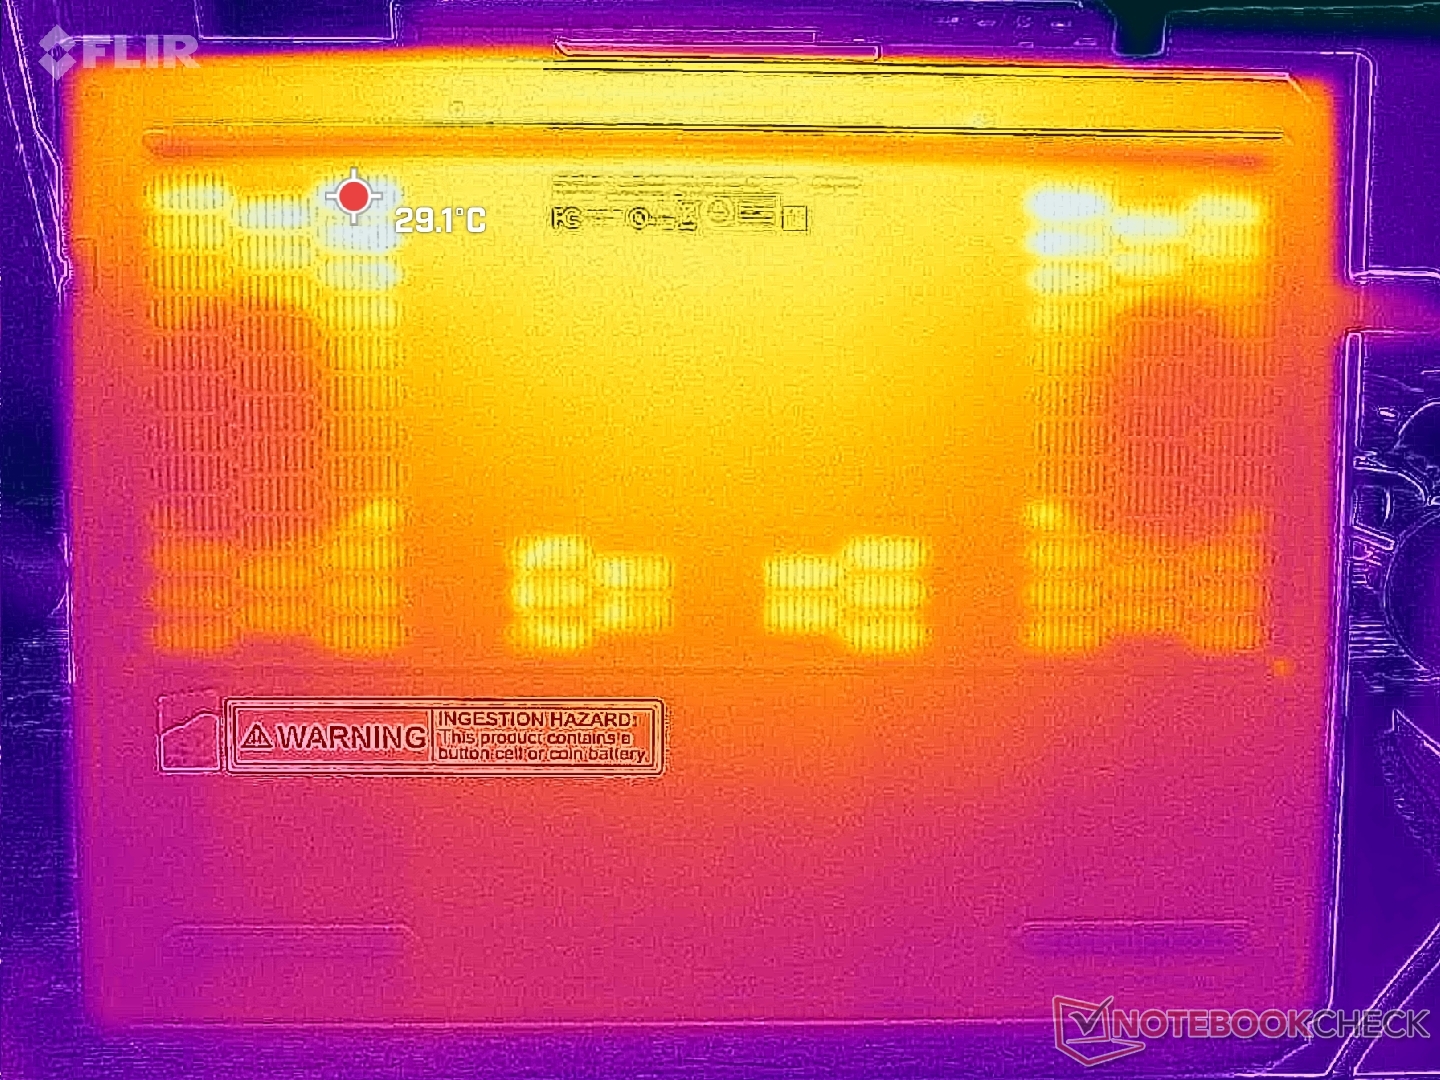
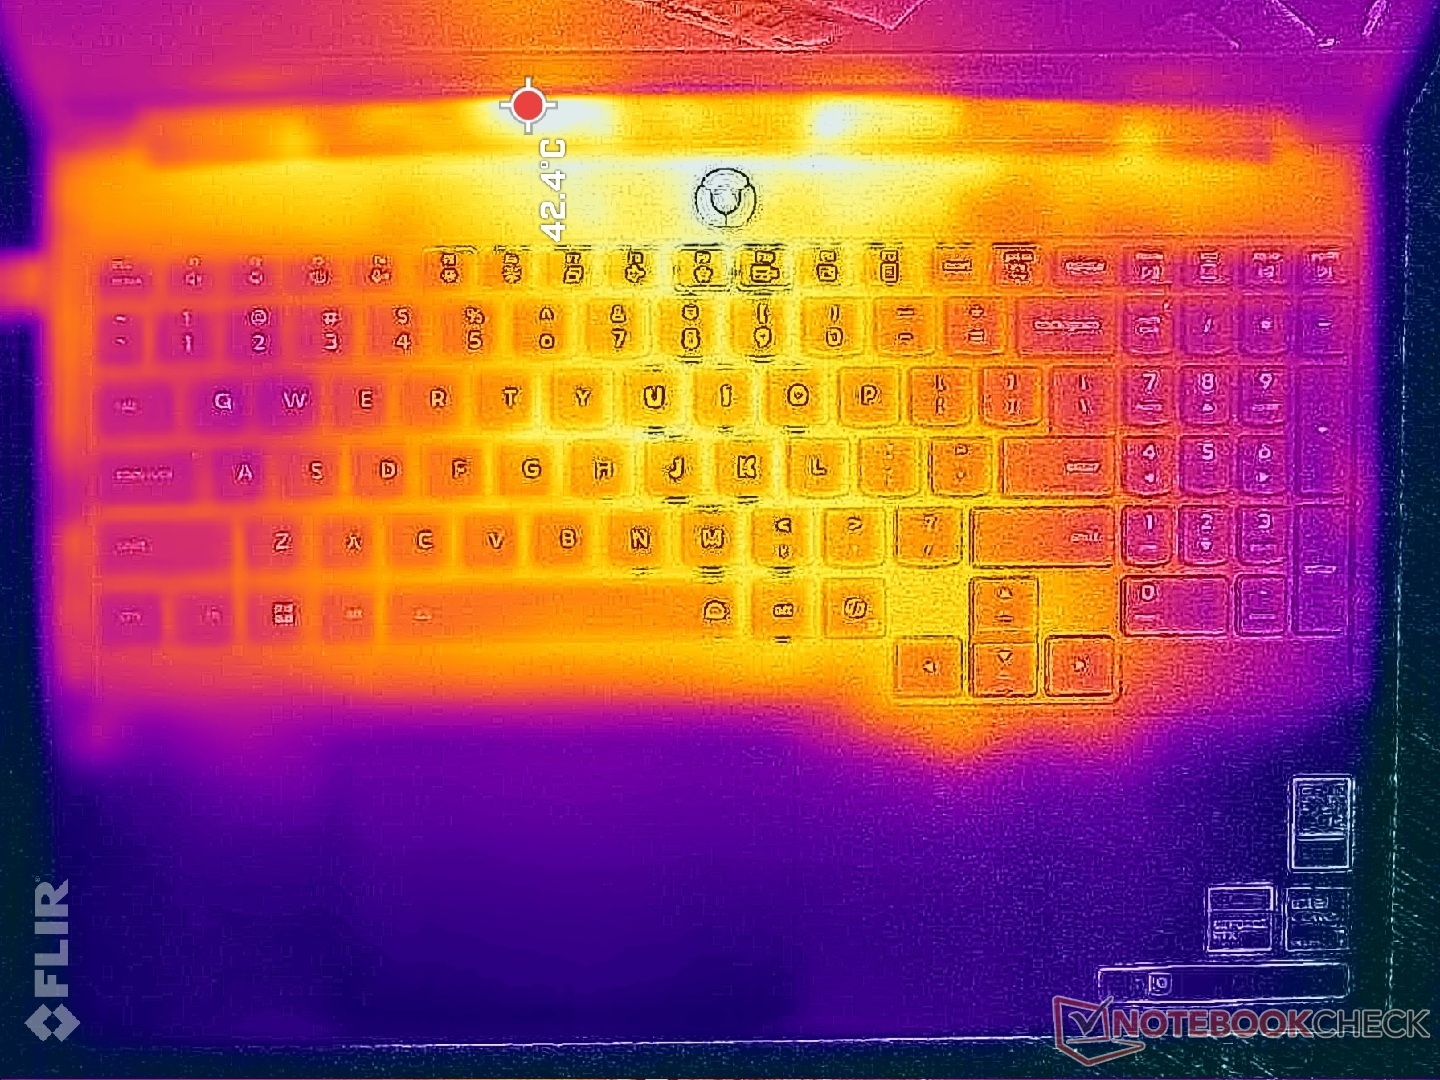
表面温度不如刀片 16 上的温度高 刀锋 16由于联想采用了更大的通风栅和加长的后部设计。键盘中心的热点温度可高达 40 摄氏度,而 wasd 键、方向键和掌托都保持较低的温度,让游戏更加舒适。
(±) The maximum temperature on the upper side is 42.6 °C / 109 F, compared to the average of 40.4 °C / 105 F, ranging from 21.2 to 68.8 °C for the class Gaming.
(±) The bottom heats up to a maximum of 41.2 °C / 106 F, compared to the average of 43.2 °C / 110 F
(+) In idle usage, the average temperature for the upper side is 27.4 °C / 81 F, compared to the device average of 33.9 °C / 93 F.
(±) 3: The average temperature for the upper side is 33.4 °C / 92 F, compared to the average of 33.9 °C / 93 F for the class Gaming.
(+) The palmrests and touchpad are cooler than skin temperature with a maximum of 25.4 °C / 77.7 F and are therefore cool to the touch.
(+) The average temperature of the palmrest area of similar devices was 28.9 °C / 84 F (+3.5 °C / 6.3 F).
| Lenovo Legion Pro 7i 16 Gen 10 Intel Core Ultra 9 275HX, Nvidia GeForce RTX 5080 Laptop | Lenovo Legion 9 16IRX9, RTX 4090 Intel Core i9-14900HX, NVIDIA GeForce RTX 4090 Laptop GPU | Asus ROG Zephyrus G16 GU605CX Intel Core Ultra 9 285H, Nvidia GeForce RTX 5090 Laptop | Razer Blade 16 2025 RTX 5090 AMD Ryzen AI 9 HX 370, Nvidia GeForce RTX 5090 Laptop | MSI Vector 16 HX A14V Intel Core i9-14900HX, NVIDIA GeForce RTX 4080 Laptop GPU | Alienware x16 R2 P120F Intel Core Ultra 9 185H, NVIDIA GeForce RTX 4080 Laptop GPU | |
|---|---|---|---|---|---|---|
| Heat | -24% | 8% | -6% | 16% | -16% | |
| Maximum Upper Side * | 42.6 | 56 -31% | 44 -3% | 48.3 -13% | 36.4 15% | 51 -20% |
| Maximum Bottom * | 41.2 | 53 -29% | 44.1 -7% | 53.3 -29% | 35.6 14% | 50.8 -23% |
| Idle Upper Side * | 32.6 | 38 -17% | 26.1 20% | 28.3 13% | 26.6 18% | 36.6 -12% |
| Idle Bottom * | 32.4 | 39 -20% | 25.5 21% | 30.3 6% | 27 17% | 35.2 -9% |
* ... smaller is better
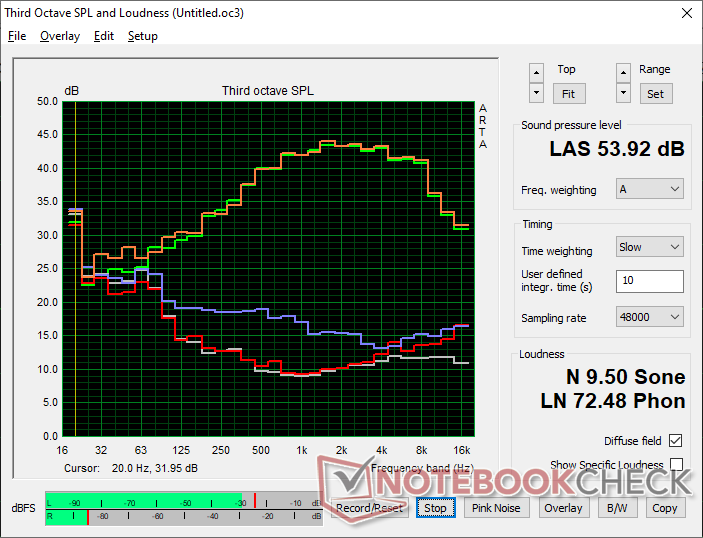
发言人
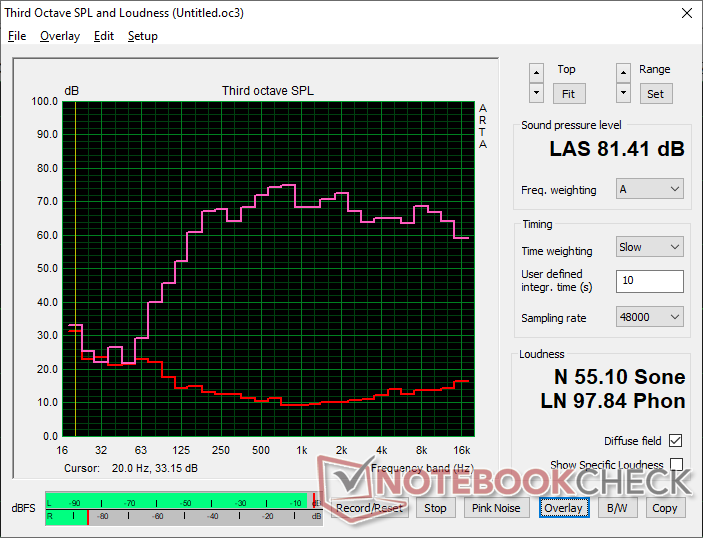
Lenovo Legion Pro 7i 16 Gen 10 audio analysis
(±) | speaker loudness is average but good (81.4 dB)
Bass 100 - 315 Hz
(±) | reduced bass - on average 7.6% lower than median
(±) | linearity of bass is average (9.4% delta to prev. frequency)
Mids 400 - 2000 Hz
(+) | balanced mids - only 4.1% away from median
(+) | mids are linear (4.8% delta to prev. frequency)
Highs 2 - 16 kHz
(+) | balanced highs - only 1.9% away from median
(+) | highs are linear (4.8% delta to prev. frequency)
Overall 100 - 16.000 Hz
(+) | overall sound is linear (9.4% difference to median)
Compared to same class
» 3% of all tested devices in this class were better, 2% similar, 95% worse
» The best had a delta of 6%, average was 18%, worst was 132%
Compared to all devices tested
» 3% of all tested devices were better, 1% similar, 96% worse
» The best had a delta of 4%, average was 24%, worst was 134%
Apple MacBook Pro 16 2021 M1 Pro audio analysis
(+) | speakers can play relatively loud (84.7 dB)
Bass 100 - 315 Hz
(+) | good bass - only 3.8% away from median
(+) | bass is linear (5.2% delta to prev. frequency)
Mids 400 - 2000 Hz
(+) | balanced mids - only 1.3% away from median
(+) | mids are linear (2.1% delta to prev. frequency)
Highs 2 - 16 kHz
(+) | balanced highs - only 1.9% away from median
(+) | highs are linear (2.7% delta to prev. frequency)
Overall 100 - 16.000 Hz
(+) | overall sound is linear (4.6% difference to median)
Compared to same class
» 0% of all tested devices in this class were better, 0% similar, 100% worse
» The best had a delta of 5%, average was 18%, worst was 45%
Compared to all devices tested
» 0% of all tested devices were better, 0% similar, 100% worse
» The best had a delta of 4%, average was 24%, worst was 134%
能源管理
耗电量
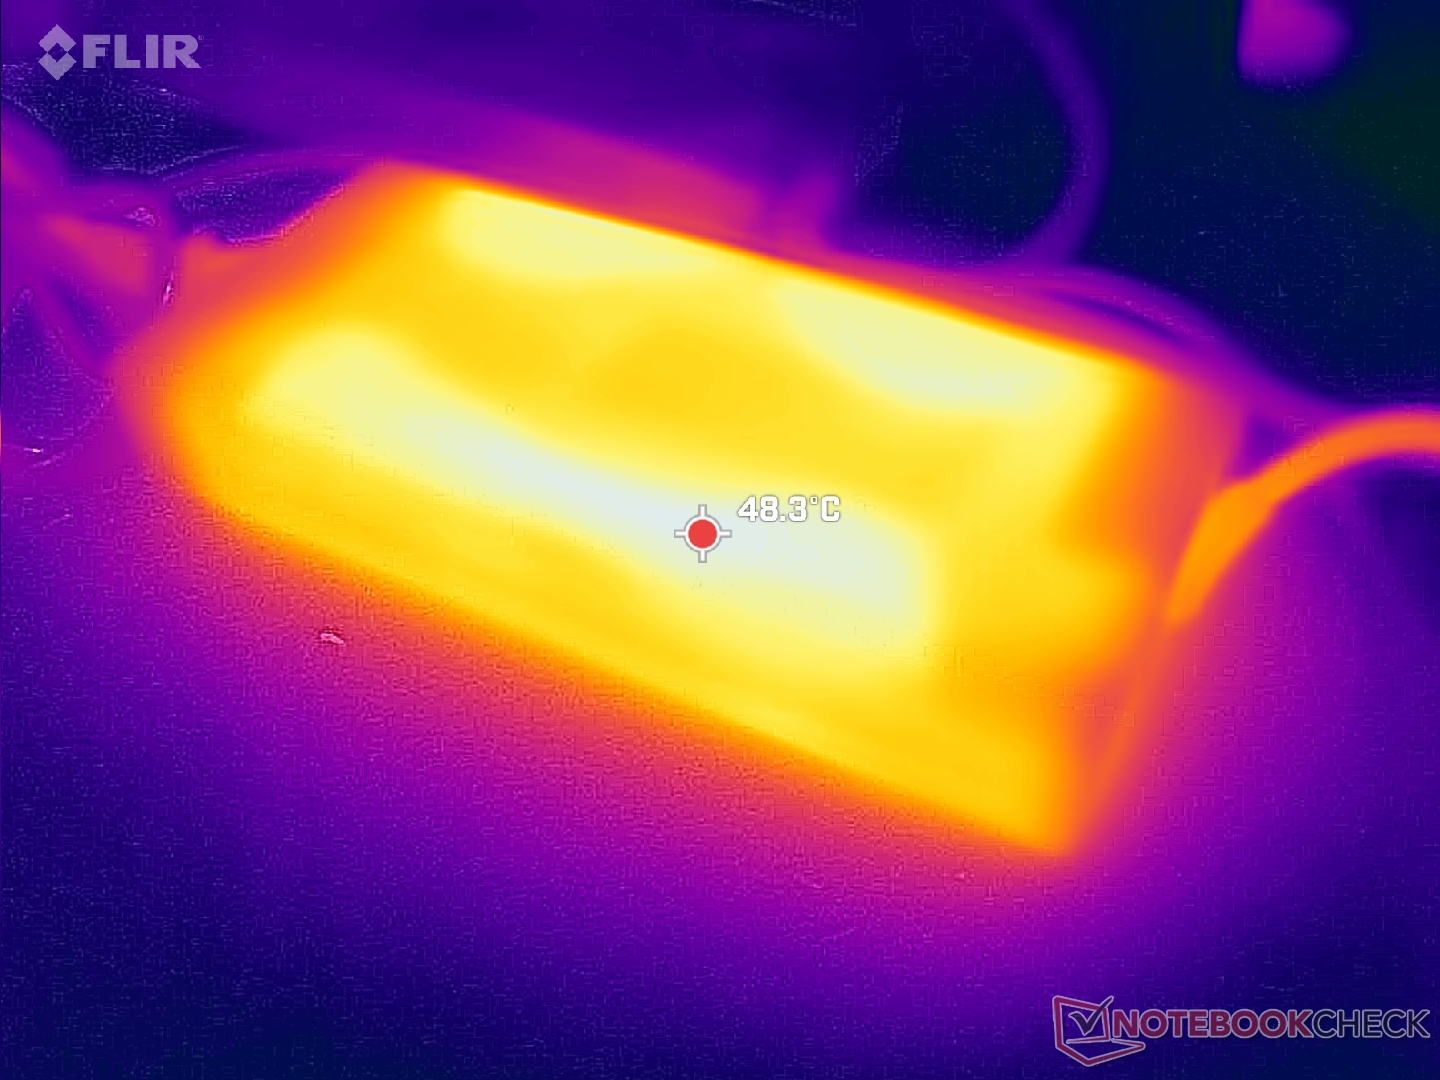
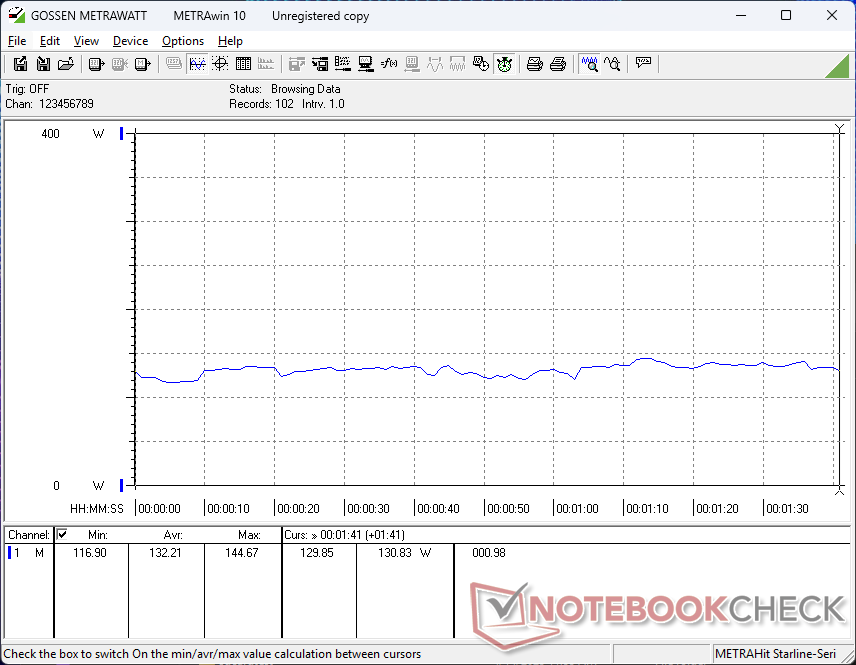
Legion Pro 7i G10 是为数不多配备 400 W 电源模块的游戏笔记本电脑之一,而其他大多数笔记本电脑的最大功耗通常为 280 W 或 300 W。不出所料,它的功耗相当高,即使在最低亮度设置下在桌面上空转,也比其他大多数游戏笔记本电脑的功耗更高,如下表所示。运行95 的功耗约为 222 瓦,而采用 AMD 处理器的 Razer Blade 16 功耗仅为 98 瓦。换句话说,我们的英特尔系统对功耗的要求是 Razer Blade 16 功耗仅为 98 瓦。
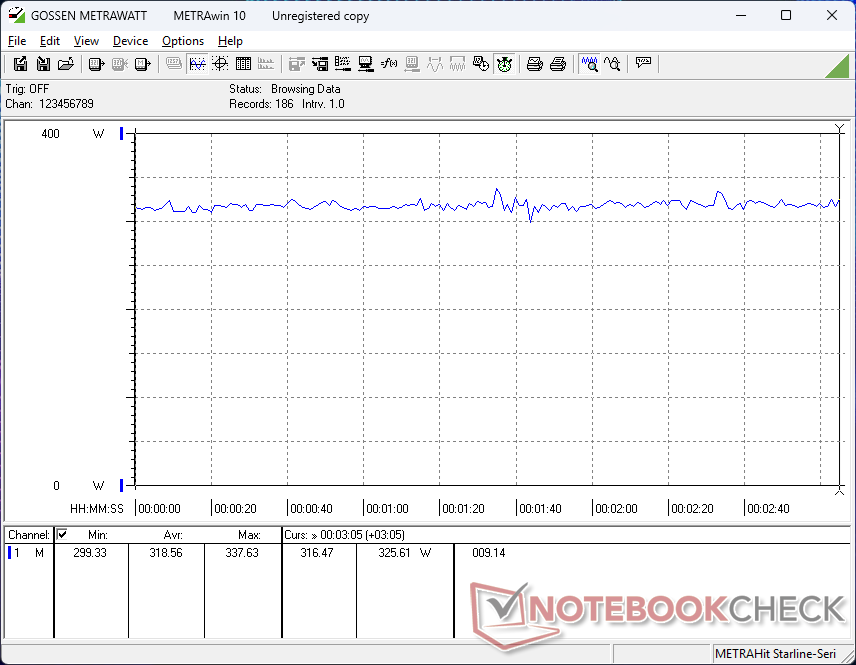
运行 Prime95 的功耗约为 222 瓦,而采用 AMD 处理器的 Razer Blade 16 功耗仅为 98 瓦。换句话说,我们的英特尔系统对功耗的要求是 Razer 的 2.2 倍,而多线程性能提升了 1.5 倍,但每瓦性能却普遍较低。在运行《赛博朋克2077》 等游戏时,联想的功耗约为 320 瓦,而上述雷蛇的功耗仅为 178 瓦。
与许多轻薄型笔记本电脑相比,400 瓦交流适配器的体积(19.5 x 8.8 x 3.3 厘米)和重量(1206 克)都是意料之中的。
| Off / Standby | |
| Idle | |
| Load |
|
Key:
min: | |
| Lenovo Legion Pro 7i 16 Gen 10 Ultra 9 275HX, GeForce RTX 5080 Laptop, SK Hynix HFS001TEJ9X115N, OLED, 2560x1600, 16" | Lenovo Legion 9 16IRX9, RTX 4090 i9-14900HX, NVIDIA GeForce RTX 4090 Laptop GPU, Micron 3400 2TB MTFDKBA2T0TFH, MiniLED, 3200x2000, 16" | Asus ROG Zephyrus G16 GU605CX Ultra 9 285H, GeForce RTX 5090 Laptop, Western Digital PC SN5000S SDEPNSJ-2T00-1006, OLED, 2560x1600, 16" | Razer Blade 16 2025 RTX 5090 Ryzen AI 9 HX 370, GeForce RTX 5090 Laptop, SSSTC CA6-8D2048, OLED, 2560x1600, 16" | MSI Vector 16 HX A14V i9-14900HX, NVIDIA GeForce RTX 4080 Laptop GPU, WD PC SN560 SDDPNQE-1T00, IPS, 2560x1600, 16" | Alienware x16 R2 P120F Ultra 9 185H, NVIDIA GeForce RTX 4080 Laptop GPU, WDC PC SN810 1TB, IPS, 2560x1600, 16" | |
|---|---|---|---|---|---|---|
| Power Consumption | 28% | 51% | 48% | 31% | 41% | |
| Idle Minimum * | 36.8 | 20.5 44% | 9.4 74% | 10.9 70% | 15.8 57% | 9.9 73% |
| Idle Average * | 38.8 | 27.7 29% | 13.6 65% | 13.5 65% | 23.3 40% | 14.5 63% |
| Idle Maximum * | 45.6 | 32.1 30% | 15.8 65% | 13.7 70% | 30 34% | 33.5 27% |
| Load Average * | 132.2 | 105 21% | 115.4 13% | 120.2 9% | 123.9 6% | 97.5 26% |
| Cyberpunk 2077 ultra external monitor * | 319 | 160.4 50% | 177.6 44% | |||
| Cyberpunk 2077 ultra * | 318 | 164.5 48% | 178.2 44% | |||
| Load Maximum * | 384 | 323 16% | 216.7 44% | 246.1 36% | 306 20% | 315.2 18% |
| Witcher 3 ultra * | 246 | 285 | 230 |
* ... smaller is better
Power Consumption Cyberpunk / Stress Test
Power Consumption external Monitor
寿命
即使设置为平衡和 iGPU 模式,无线局域网的运行时间也仅比去年的Legion 9 16IRX9 略好。使用 Razer Blade 16 或 Zephyrus G16至少各延长一两个小时。
使用随附的交流适配器,从空电充至满电只需 90 分钟。支持通过第三方 usb-c 接口以更慢的速度充电。
| Lenovo Legion Pro 7i 16 Gen 10 Ultra 9 275HX, GeForce RTX 5080 Laptop, 99 Wh | Lenovo Legion 9 16IRX9, RTX 4090 i9-14900HX, NVIDIA GeForce RTX 4090 Laptop GPU, 99.99 Wh | Asus ROG Zephyrus G16 GU605CX Ultra 9 285H, GeForce RTX 5090 Laptop, 90 Wh | Razer Blade 16 2025 RTX 5090 Ryzen AI 9 HX 370, GeForce RTX 5090 Laptop, 90 Wh | MSI Vector 16 HX A14V i9-14900HX, NVIDIA GeForce RTX 4080 Laptop GPU, 90 Wh | Alienware x16 R2 P120F Ultra 9 185H, NVIDIA GeForce RTX 4080 Laptop GPU, 90 Wh | |
|---|---|---|---|---|---|---|
| Battery Runtime | 80% | 67% | 47% | 39% | -40% | |
| WiFi v1.3 | 323 | 290 -10% | 540 67% | 475 47% | 332 3% | 193 -40% |
| Load | 48 | 129 169% | 84 75% | |||
| H.264 | 294 | 592 | ||||
| Cyberpunk 2077 ultra 150cd | 71 | |||||
| Reader / Idle | 641 |
笔记本检查评级
Lenovo Legion Pro 7i 16 Gen 10
- 04/25/2025 v8
Allen Ngo
 Total Sustainability Score:
 Potential Competitors in Comparison
Image | Model / Review | Price | Weight | Height | Display |
|---|---|---|---|---|---|
1. 87.5%  | Lenovo Legion Pro 7i 16 Gen 10 Intel Core Ultra 9 275HX ⎘ Nvidia GeForce RTX 5080 Laptop ⎘ 32 GB Memory, 1024 GB SSD | Amazon: $3,799.95 List Price: 4200 USD | 2.6 kg | 26.65 mm | 16.00" 2560x1600 189 PPI OLED |
2. 83.9%  | Lenovo Legion 9 16IRX9, RTX 4090 Intel Core i9-14900HX ⎘ NVIDIA GeForce RTX 4090 Laptop GPU ⎘ 64 GB Memory, 2048 GB SSD | Amazon: $4,799.00 List Price: 4899 Euro | 2.5 kg | 22.7 mm | 16.00" 3200x2000 236 PPI MiniLED |
3. 90%  | Asus ROG Zephyrus G16 GU605CX Intel Core Ultra 9 285H ⎘ Nvidia GeForce RTX 5090 Laptop ⎘ 64 GB Memory, 2048 GB SSD | Amazon: 1. $20.98 Puccy 2 Pack Film Protector,... 2. $99.99 240W Rectangle Conn Charger ... 3. $1,479.00 ASUS ROG Zephyrus G16 Gaming... List Price: 4799€ | 1.9 kg | 17.4 mm | 16.00" 2560x1600 189 PPI OLED |
4. 87%  | Razer Blade 16 2025 RTX 5090 AMD Ryzen AI 9 HX 370 ⎘ Nvidia GeForce RTX 5090 Laptop ⎘ 32 GB Memory, 2048 GB SSD | Amazon: 1. $4,159.99 Razer Blade 16 Gaming Laptop... 2. $5,495.00 Razer Blade 18 Gaming Laptop... 3. $5,698.00 Razer Blade 16 Gaming Laptop... List Price: 4399€ | 2.1 kg | 17.4 mm | 16.00" 2560x1600 189 PPI OLED |
5. 88% v7 (old)  | MSI Vector 16 HX A14V Intel Core i9-14900HX ⎘ NVIDIA GeForce RTX 4080 Laptop GPU ⎘ 32 GB Memory, 1024 GB SSD | Amazon: 1. $2,419.99 MSI Vector 16 HX 16” 240Hz... 2. $45.99 Smatree Hard EVA Protective ... 3. $59.99 Smatree 16 inch Laptop Sleev... List Price: 2700 USD | 2.7 kg | 28.55 mm | 16.00" 2560x1600 189 PPI IPS |
6. 88.4% v7 (old)  | Alienware x16 R2 P120F Intel Core Ultra 9 185H ⎘ NVIDIA GeForce RTX 4080 Laptop GPU ⎘ 32 GB Memory, 1024 GB SSD | Amazon: $3,099.99 List Price: 3200 USD | 2.7 kg | 18.57 mm | 16.00" 2560x1600 189 PPI IPS |
Transparency
The selection of devices to be reviewed is made by our editorial team. The test sample was provided to the author as a loan by the manufacturer or retailer for the purpose of this review. The lender had no influence on this review, nor did the manufacturer receive a copy of this review before publication. There was no obligation to publish this review. We never accept compensation or payment in return for our reviews. As an independent media company, Notebookcheck is not subjected to the authority of manufacturers, retailers or publishers.
This is how Notebookcheck is testing
Every year, Notebookcheck independently reviews hundreds of laptops and smartphones using standardized procedures to ensure that all results are comparable. We have continuously developed our test methods for around 20 years and set industry standards in the process. In our test labs, high-quality measuring equipment is utilized by experienced technicians and editors. These tests involve a multi-stage validation process. Our complex rating system is based on hundreds of well-founded measurements and benchmarks, which maintains objectivity. Further information on our test methods can be found here.

