XMG Neo 16(早期 24)评测:在小巧的游戏笔记本电脑中充分发挥 RTX 4090 的威力
申克公司推出的 Neo 16 服务于高端市场,因此没有半点马虎:酷睿 i9 处理器、GeForce RTX 4090 和 32GB 内存使这款笔记本电脑能够应对苛刻的应用场景(流媒体、渲染、游戏)。但是,这是有代价的:您需要支付约 4000 美元(当前美元/欧元汇率)购买评测机型,不过也有 2000 美元起的廉价机型。同方裸机(GM6IX9B)为您提供了基础。竞争对手包括 雷蛇刀锋 16、 Medion Erazer Beast X40和 华硕 ROG Strix Scar 17.
该设备与 2023 型号相似,但具有一些新功能:更亮的显示屏、经过全面改进的散热系统和更大的开孔角度。前代产品中的机械键盘(可选)不在 2024 型号的产品范围内。
潜在的竞争对手比较
Rating | Version | Date | Model | Weight | Height | Size | Resolution | Price |
|---|---|---|---|---|---|---|---|---|
| 85.5 % | v8 | 06 / 2024 | Schenker XMG Neo 16 (Early 24) i9-14900HX, GeForce RTX 4090 Laptop GPU | 2.5 kg | 26.6 mm | 16.00" | 2560x1600 | |
| 91.1 % v7 (old) | v7 (old) | 02 / 2024 | Razer Blade 16 2024, RTX 4090 i9-14900HX, GeForce RTX 4090 Laptop GPU | 2.5 kg | 22 mm | 16.00" | 2560x1600 | |
| 89.2 % v7 (old) | v7 (old) | 02 / 2024 | Medion Erazer Beast X40 2024 i9-14900HX, GeForce RTX 4090 Laptop GPU | 2.9 kg | 36 mm | 17.00" | 2560x1600 | |
| 87.2 % v7 (old) | v7 (old) | 08 / 2023 | Asus ROG Strix Scar 17 G733PYV-LL053X R9 7945HX3D, GeForce RTX 4090 Laptop GPU | 2.9 kg | 28.3 mm | 17.30" | 2560x1440 |
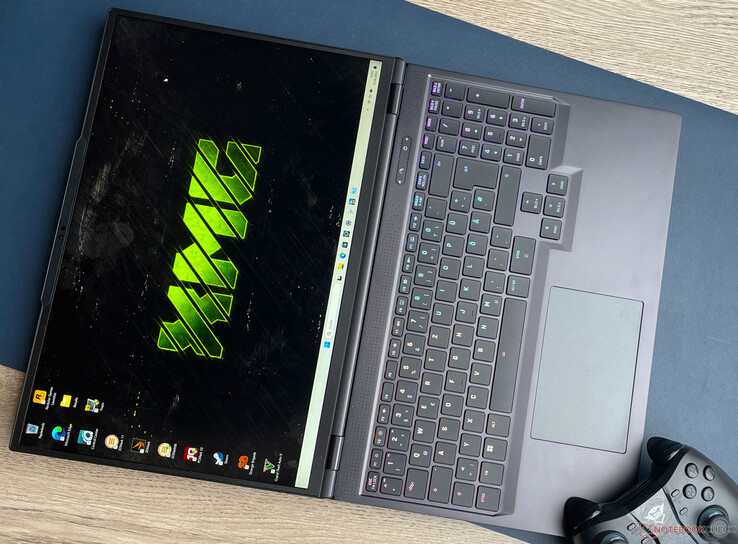
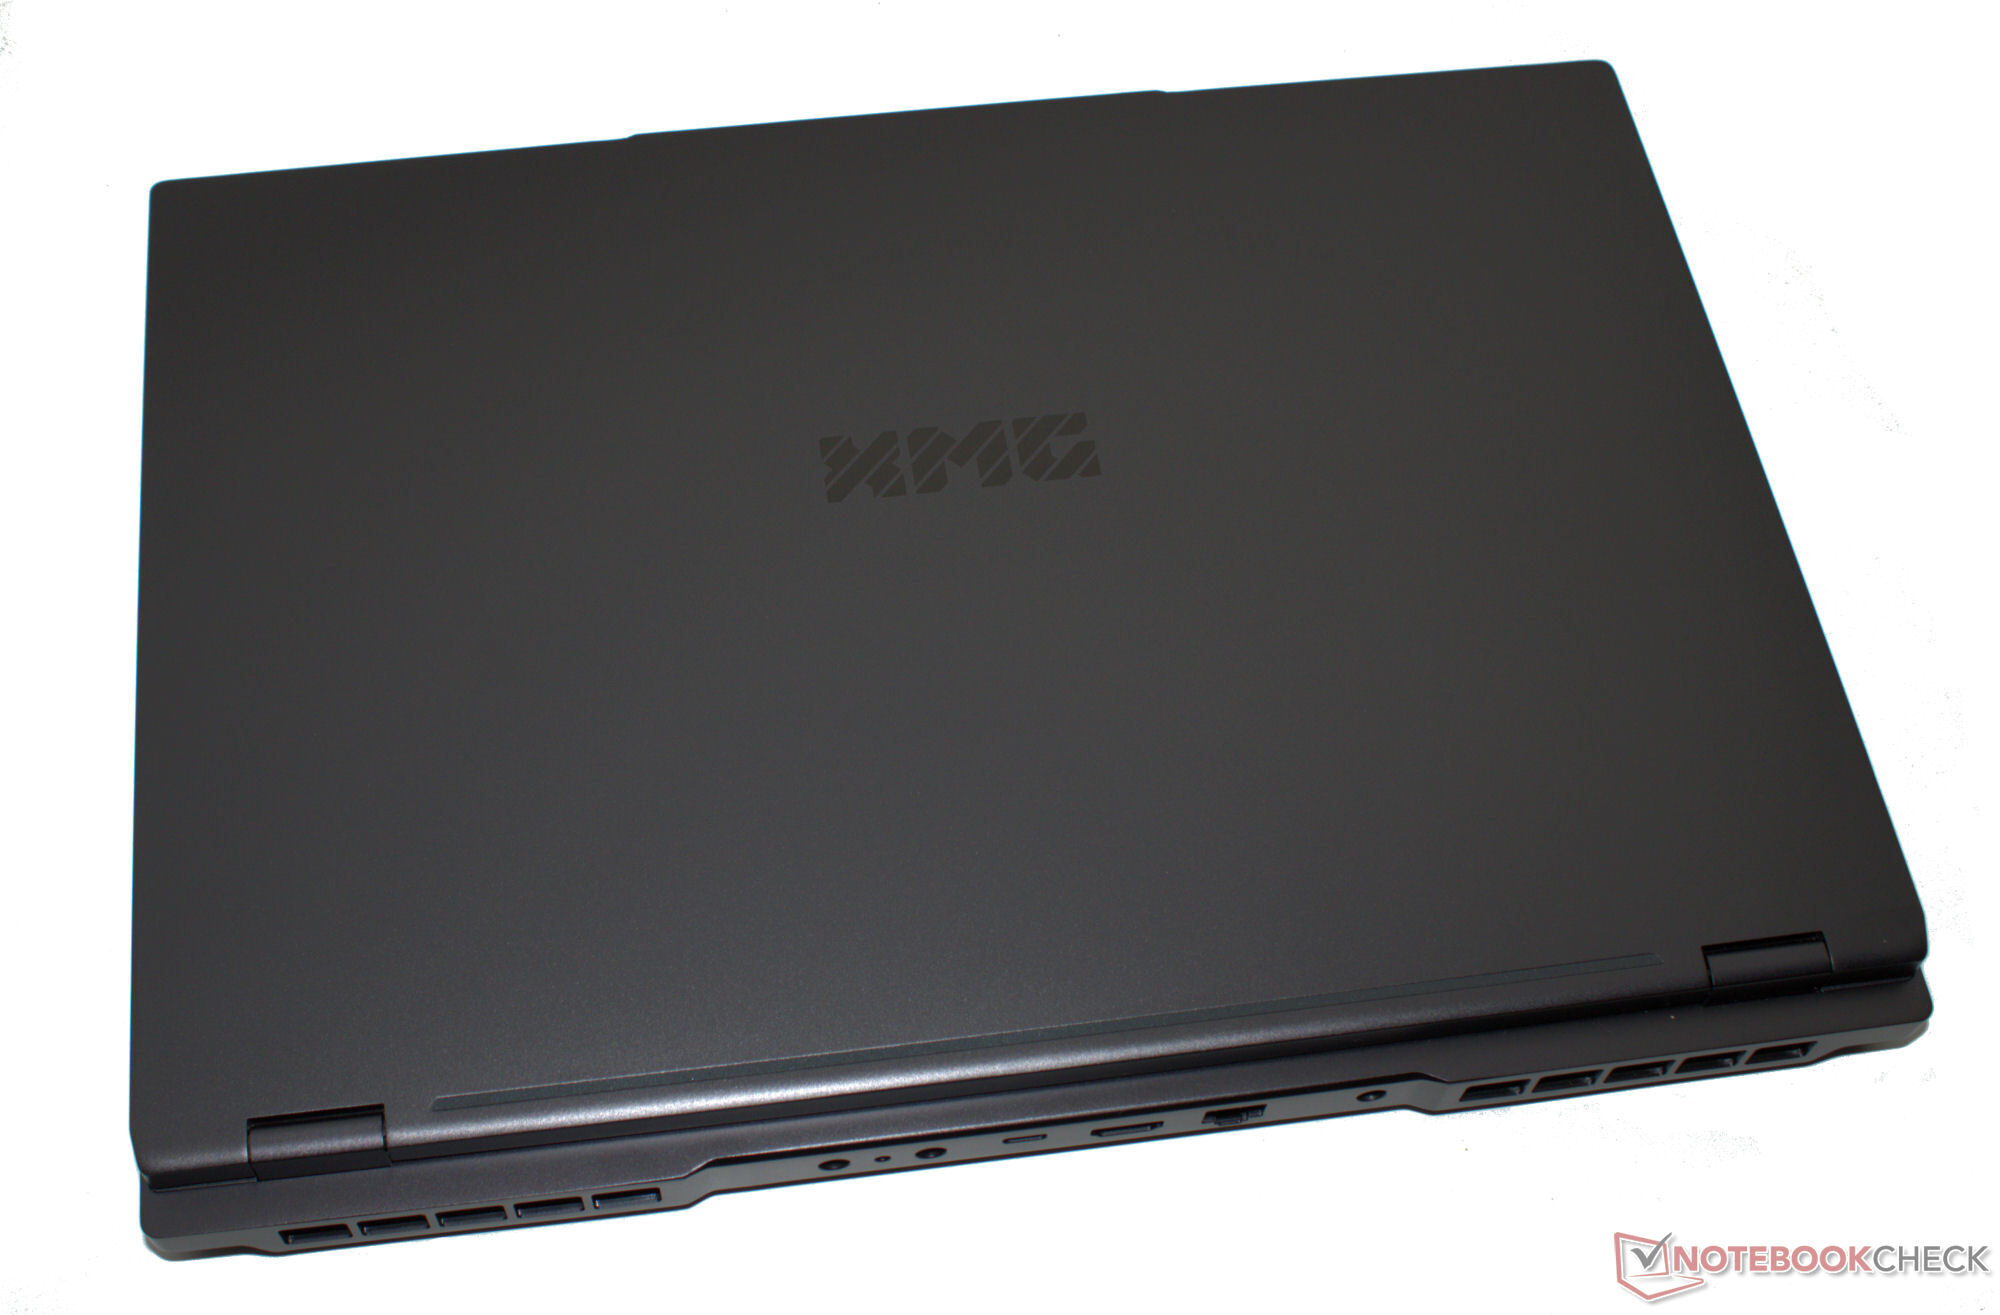
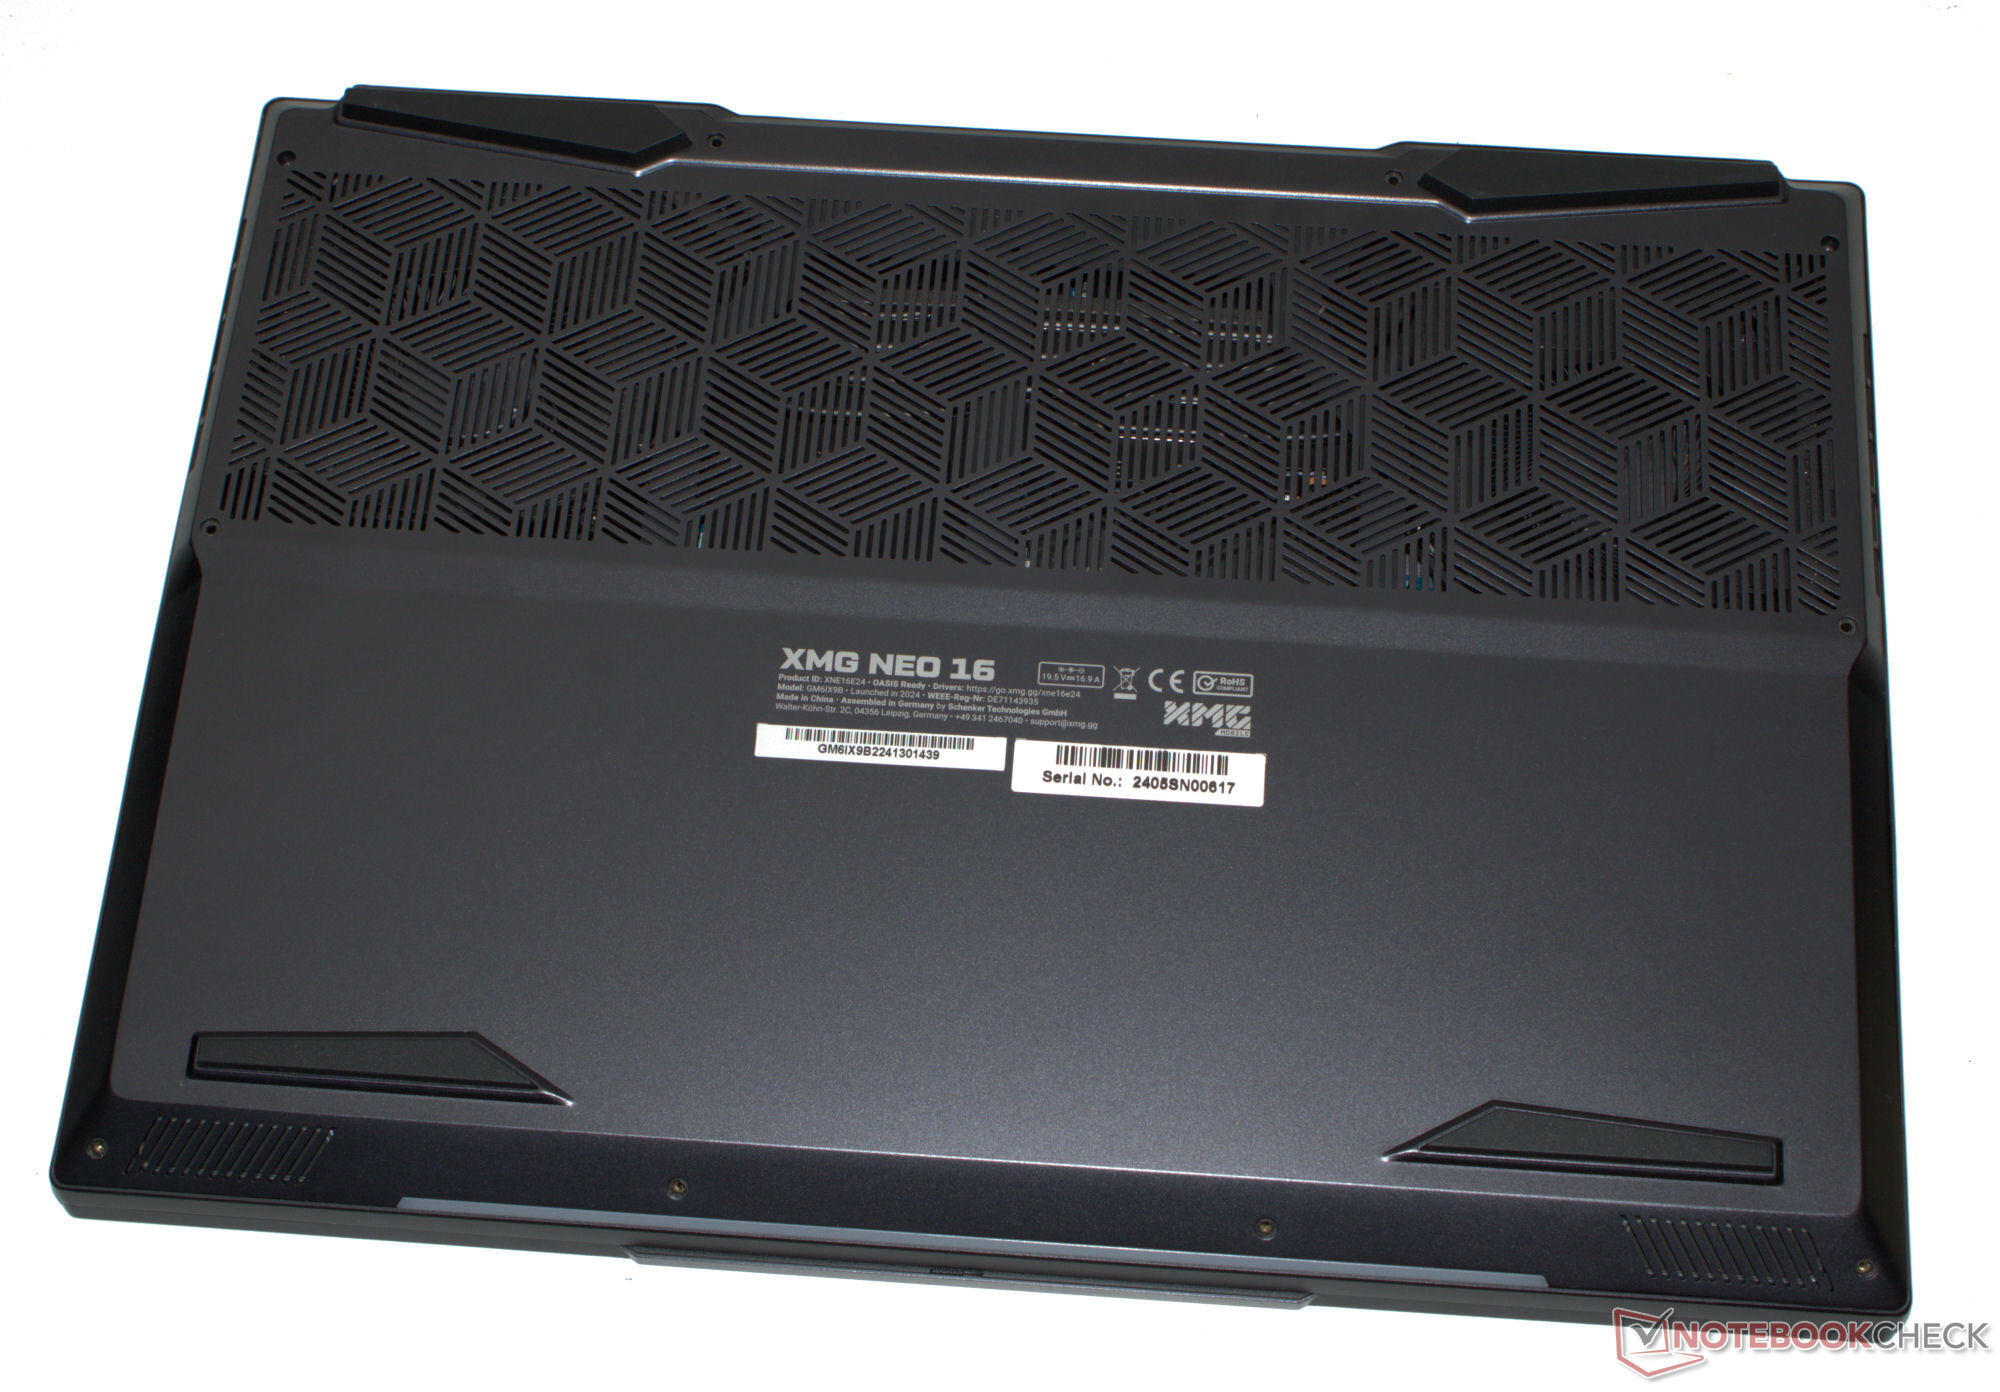
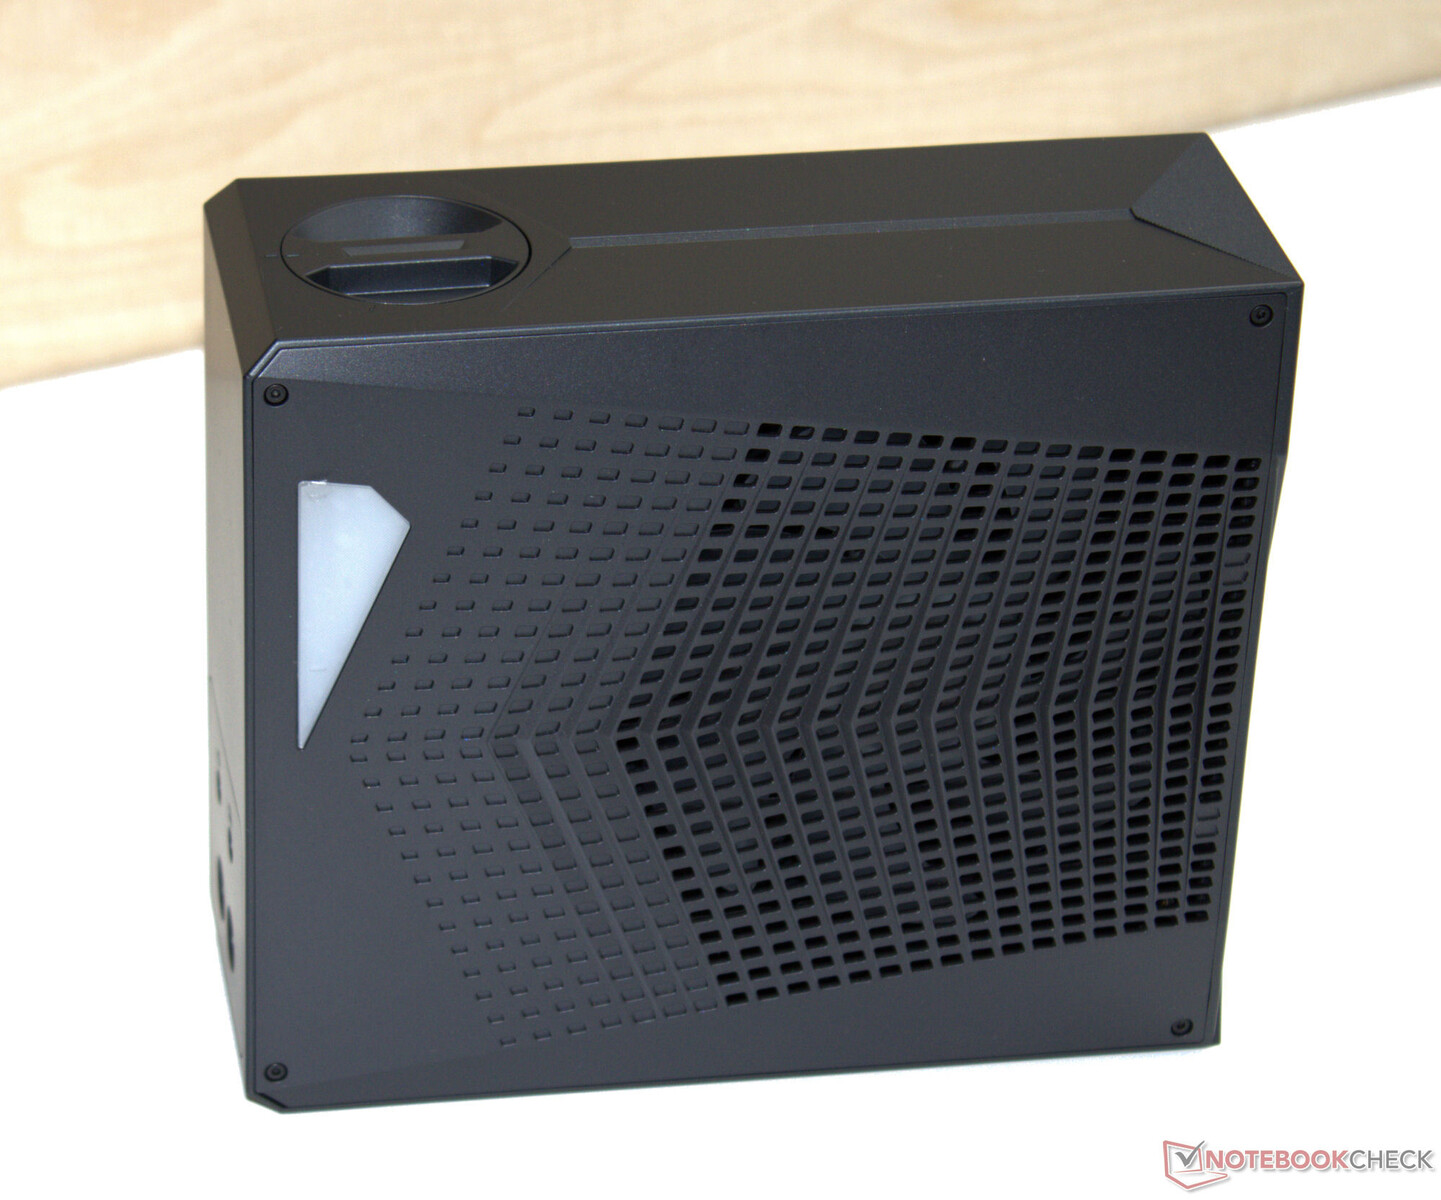
机箱 - XMG 笔记本电脑采用铝制机箱
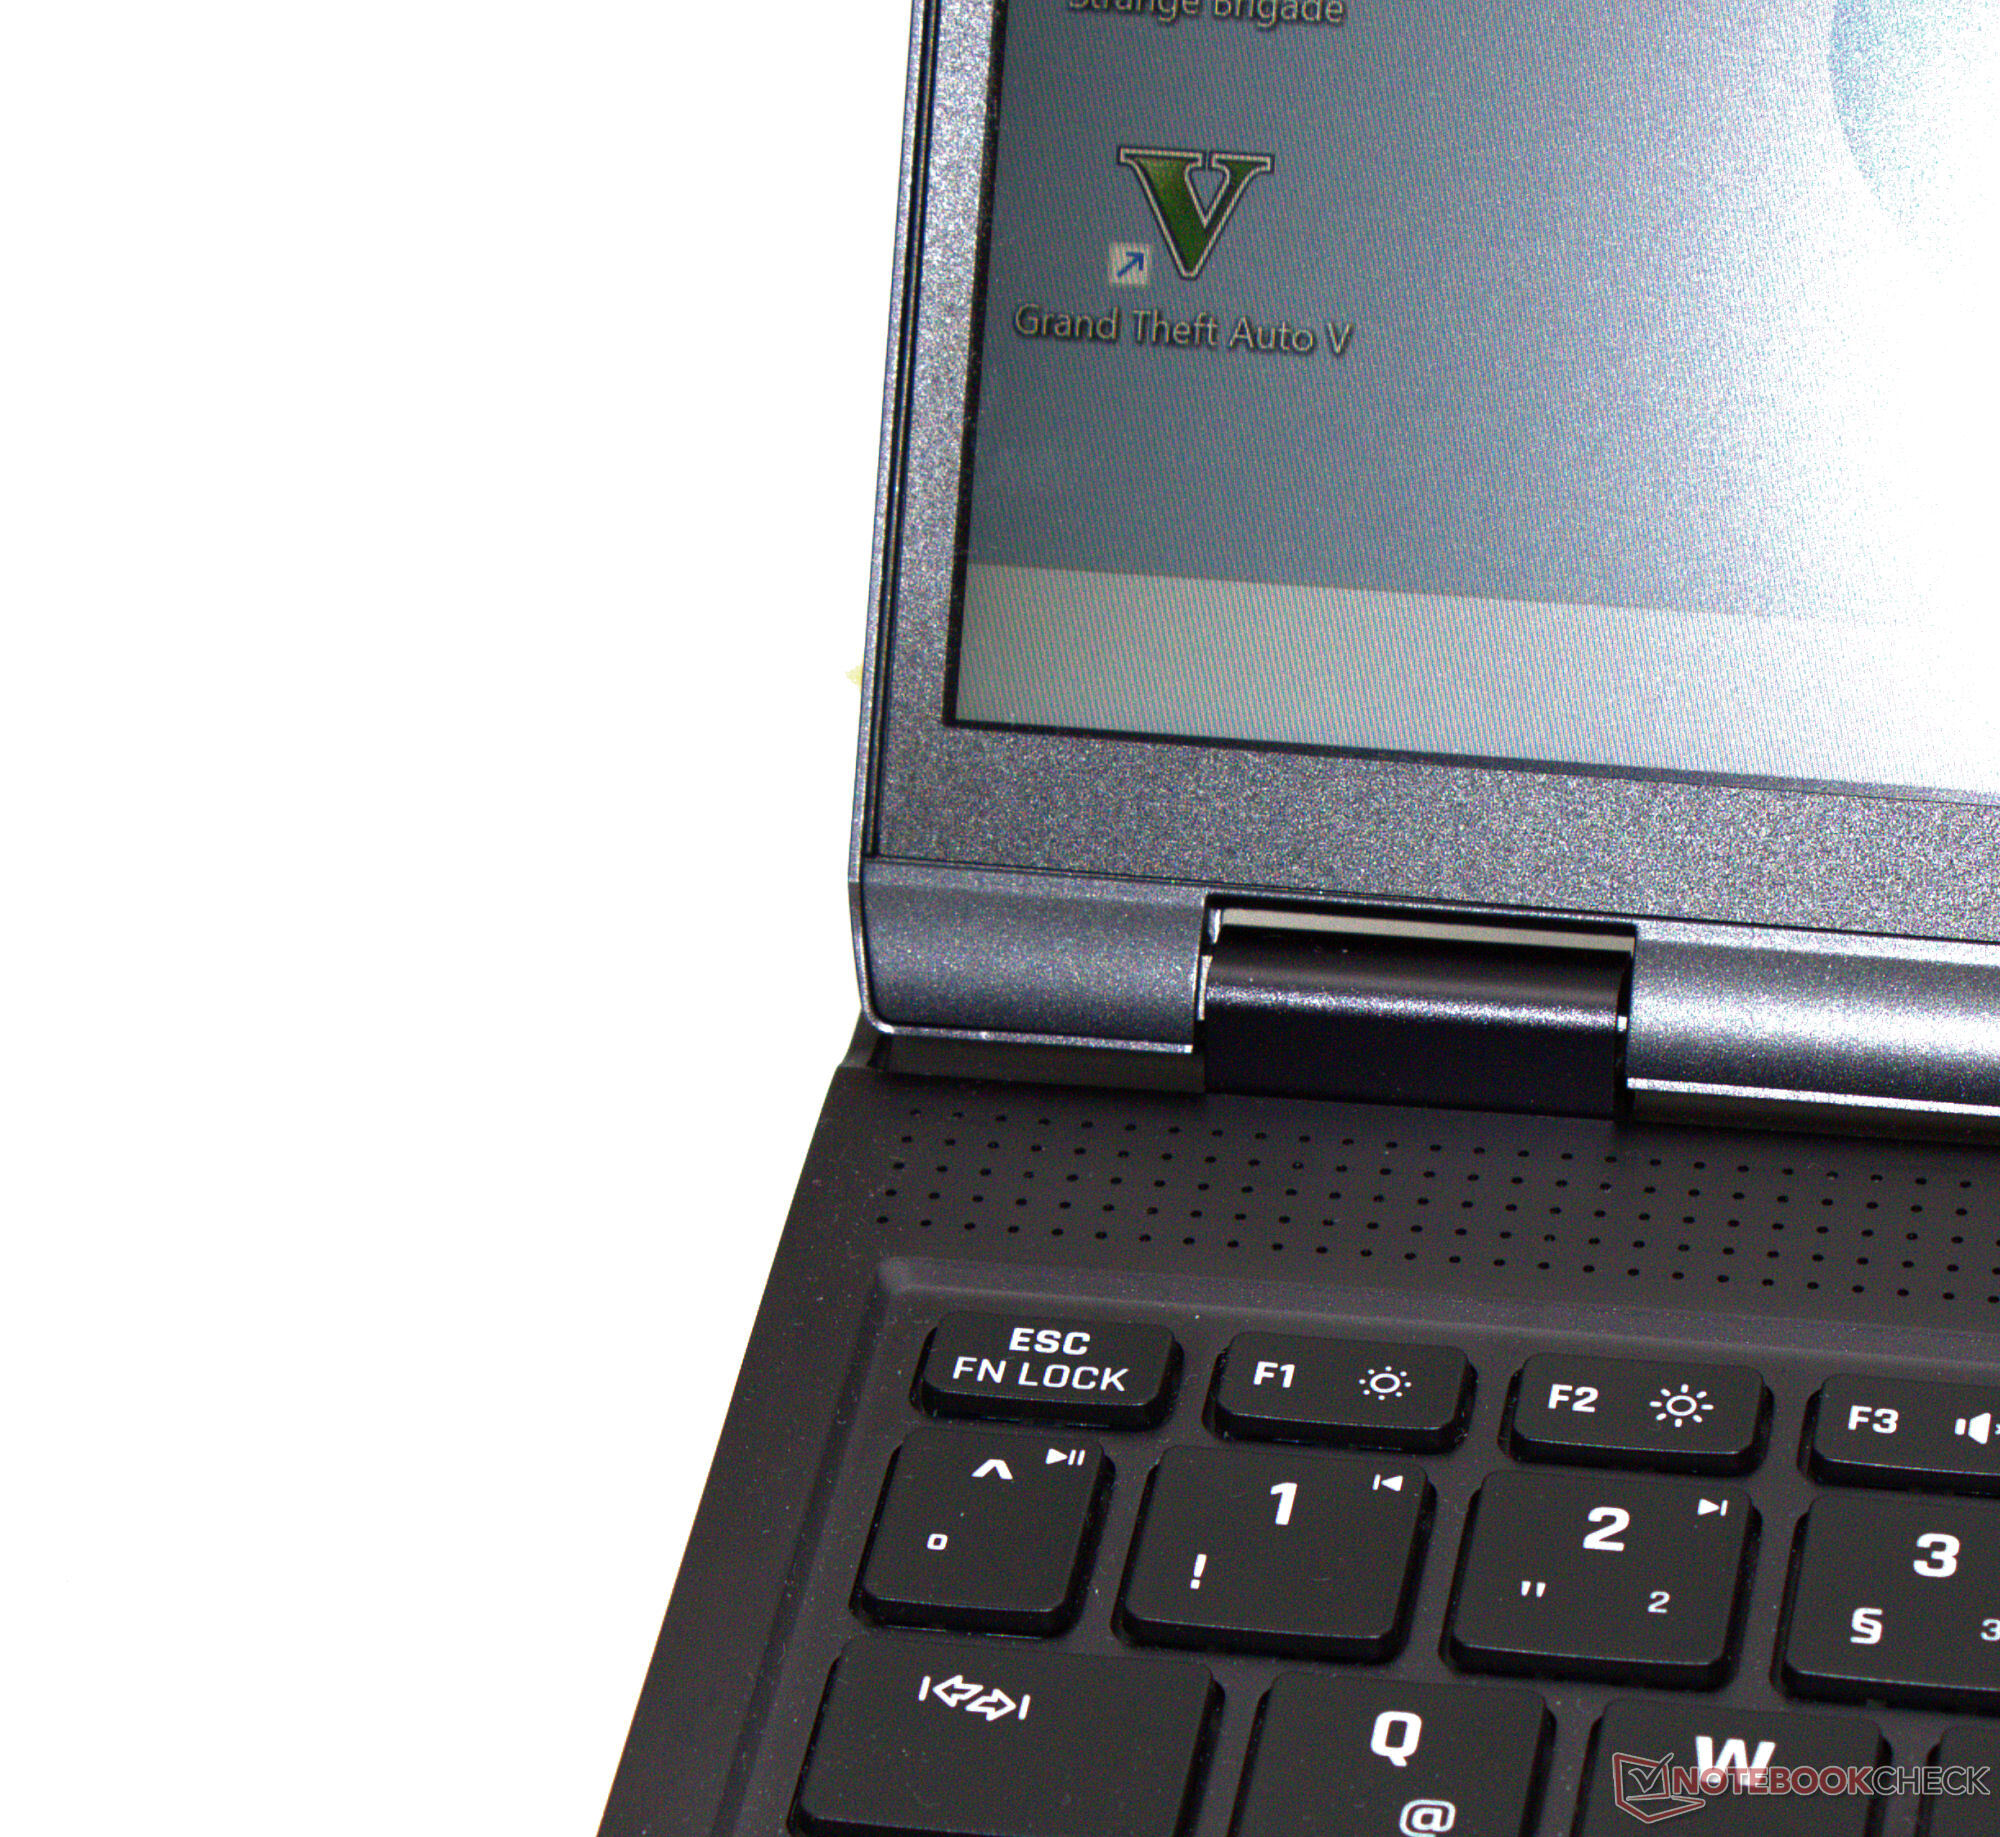
目前的 Neo 机型并未采用 2023 机型的机箱。新的外壳与最新的 XMG 笔记本电脑的外壳更为相似,这是朝着正确方向迈出的一步:制造商不再混合使用塑料和金属,而是采用了完全由金属制成的机箱(例外:显示屏边框由塑料制成)。机箱的稳定性与你所期望的一样好。底座和盖子只能轻微扭动。盖子的开启角度可达 180 度(2023 型号:135 度)。当有几个人在场时,可以更方便地查看内容。紧密的铰链使盖子在几乎任何角度都能牢牢固定。单手即可打开设备。
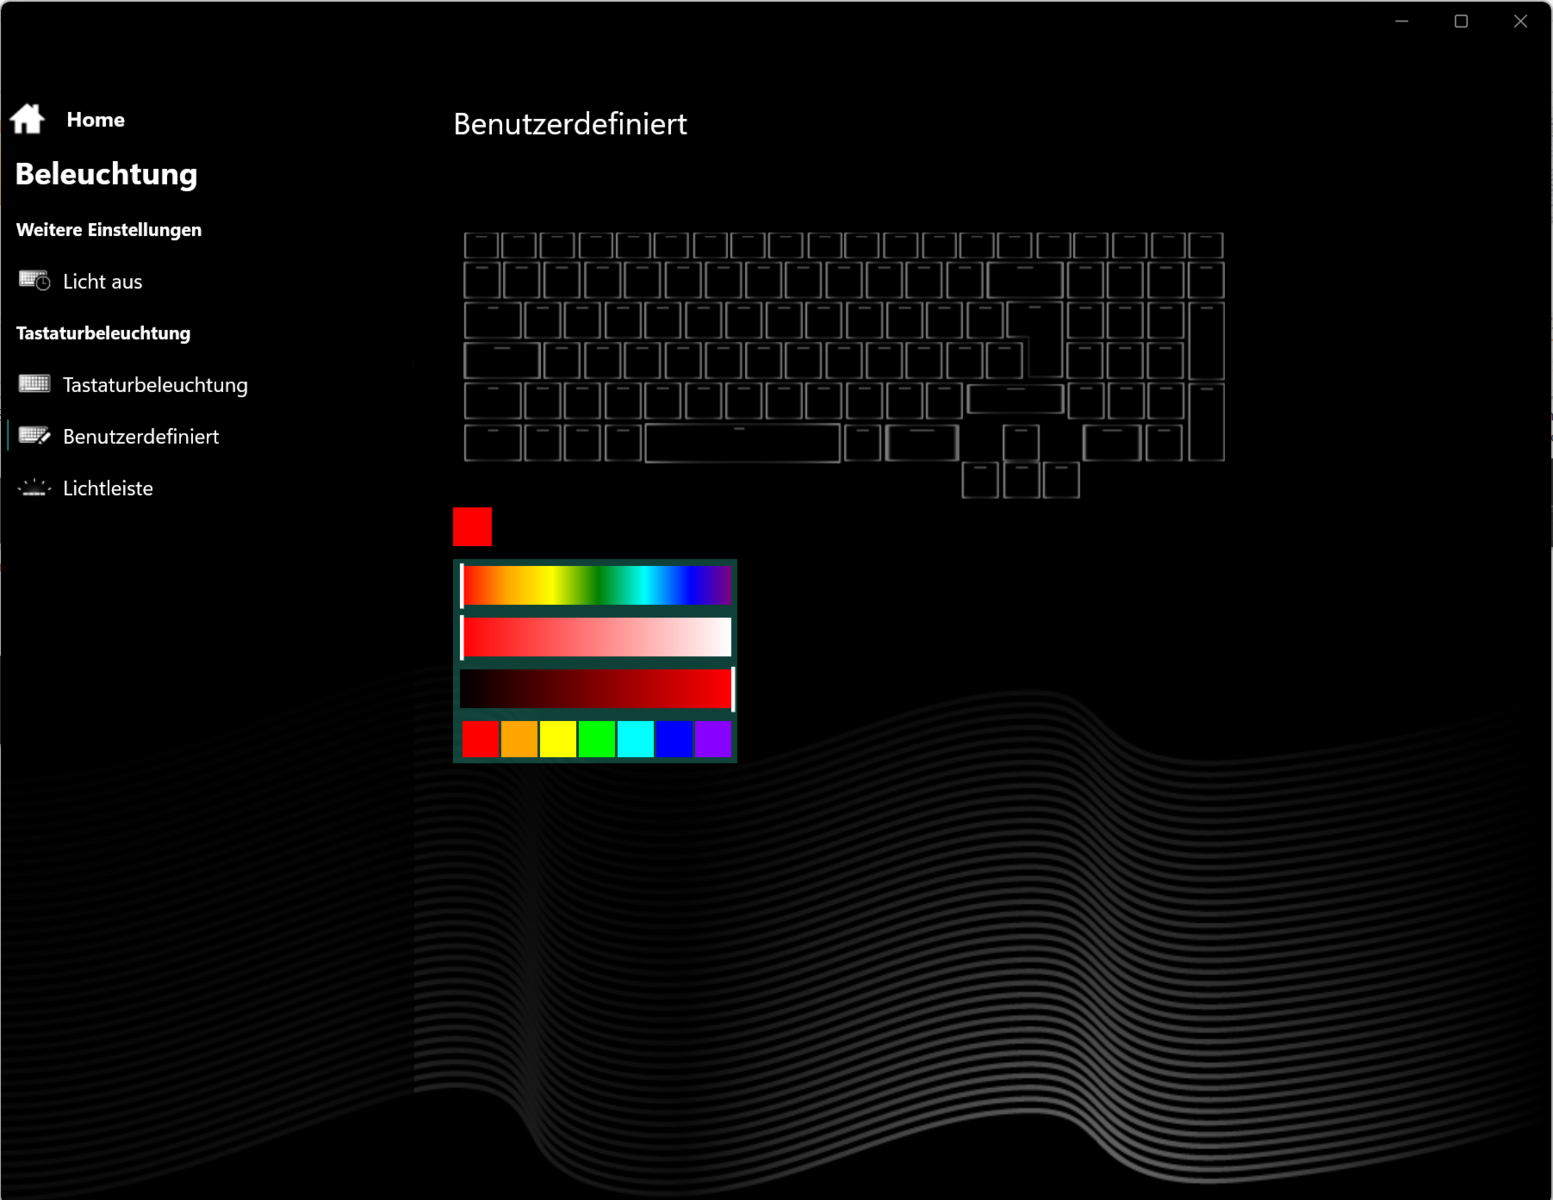
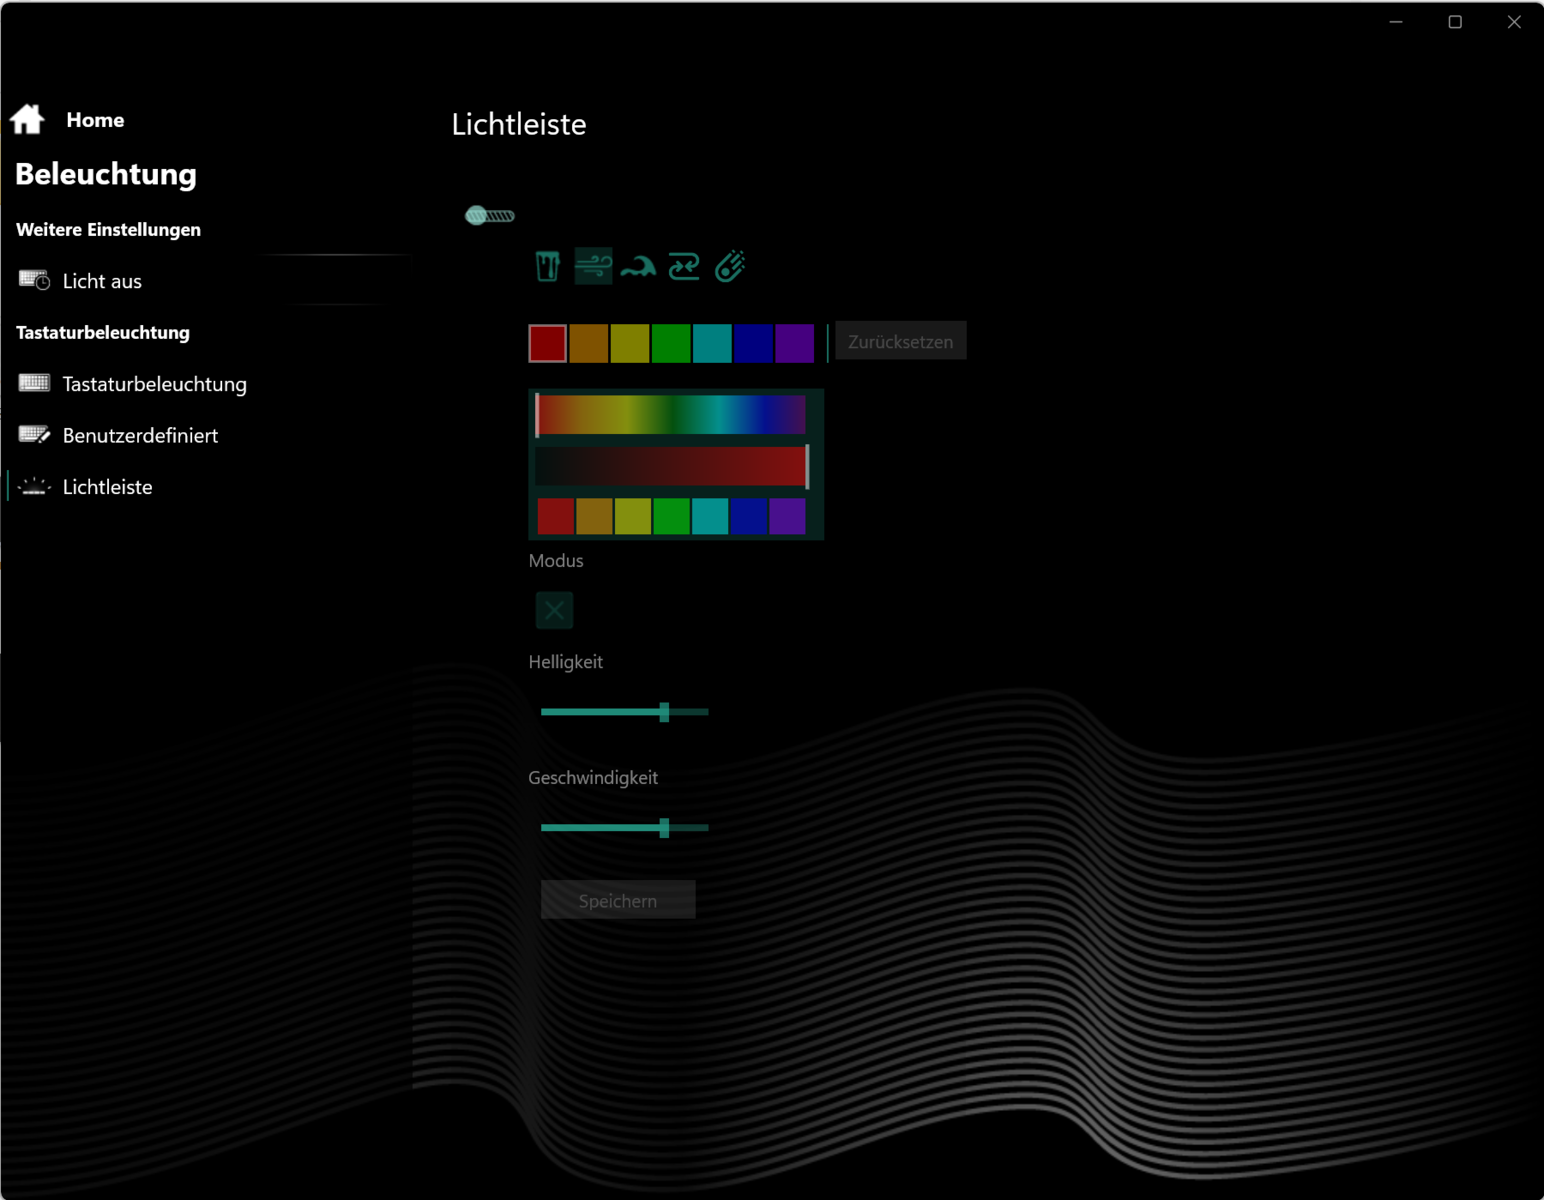
引人注目的设计元素不见踪影,这意味着这款哑光黑色电脑显得相当严肃。除了背光按键(RGB)外,用户还可以自定义 LED 灯带,从而实现多彩的灯光效果。
最新的 Neo 16 看起来比前代产品更小巧一些,但在重量方面,这两款笔记本电脑并无区别。只有 刀锋 16更小巧,而且重量几乎相同。
功能 - 内置 USB 4
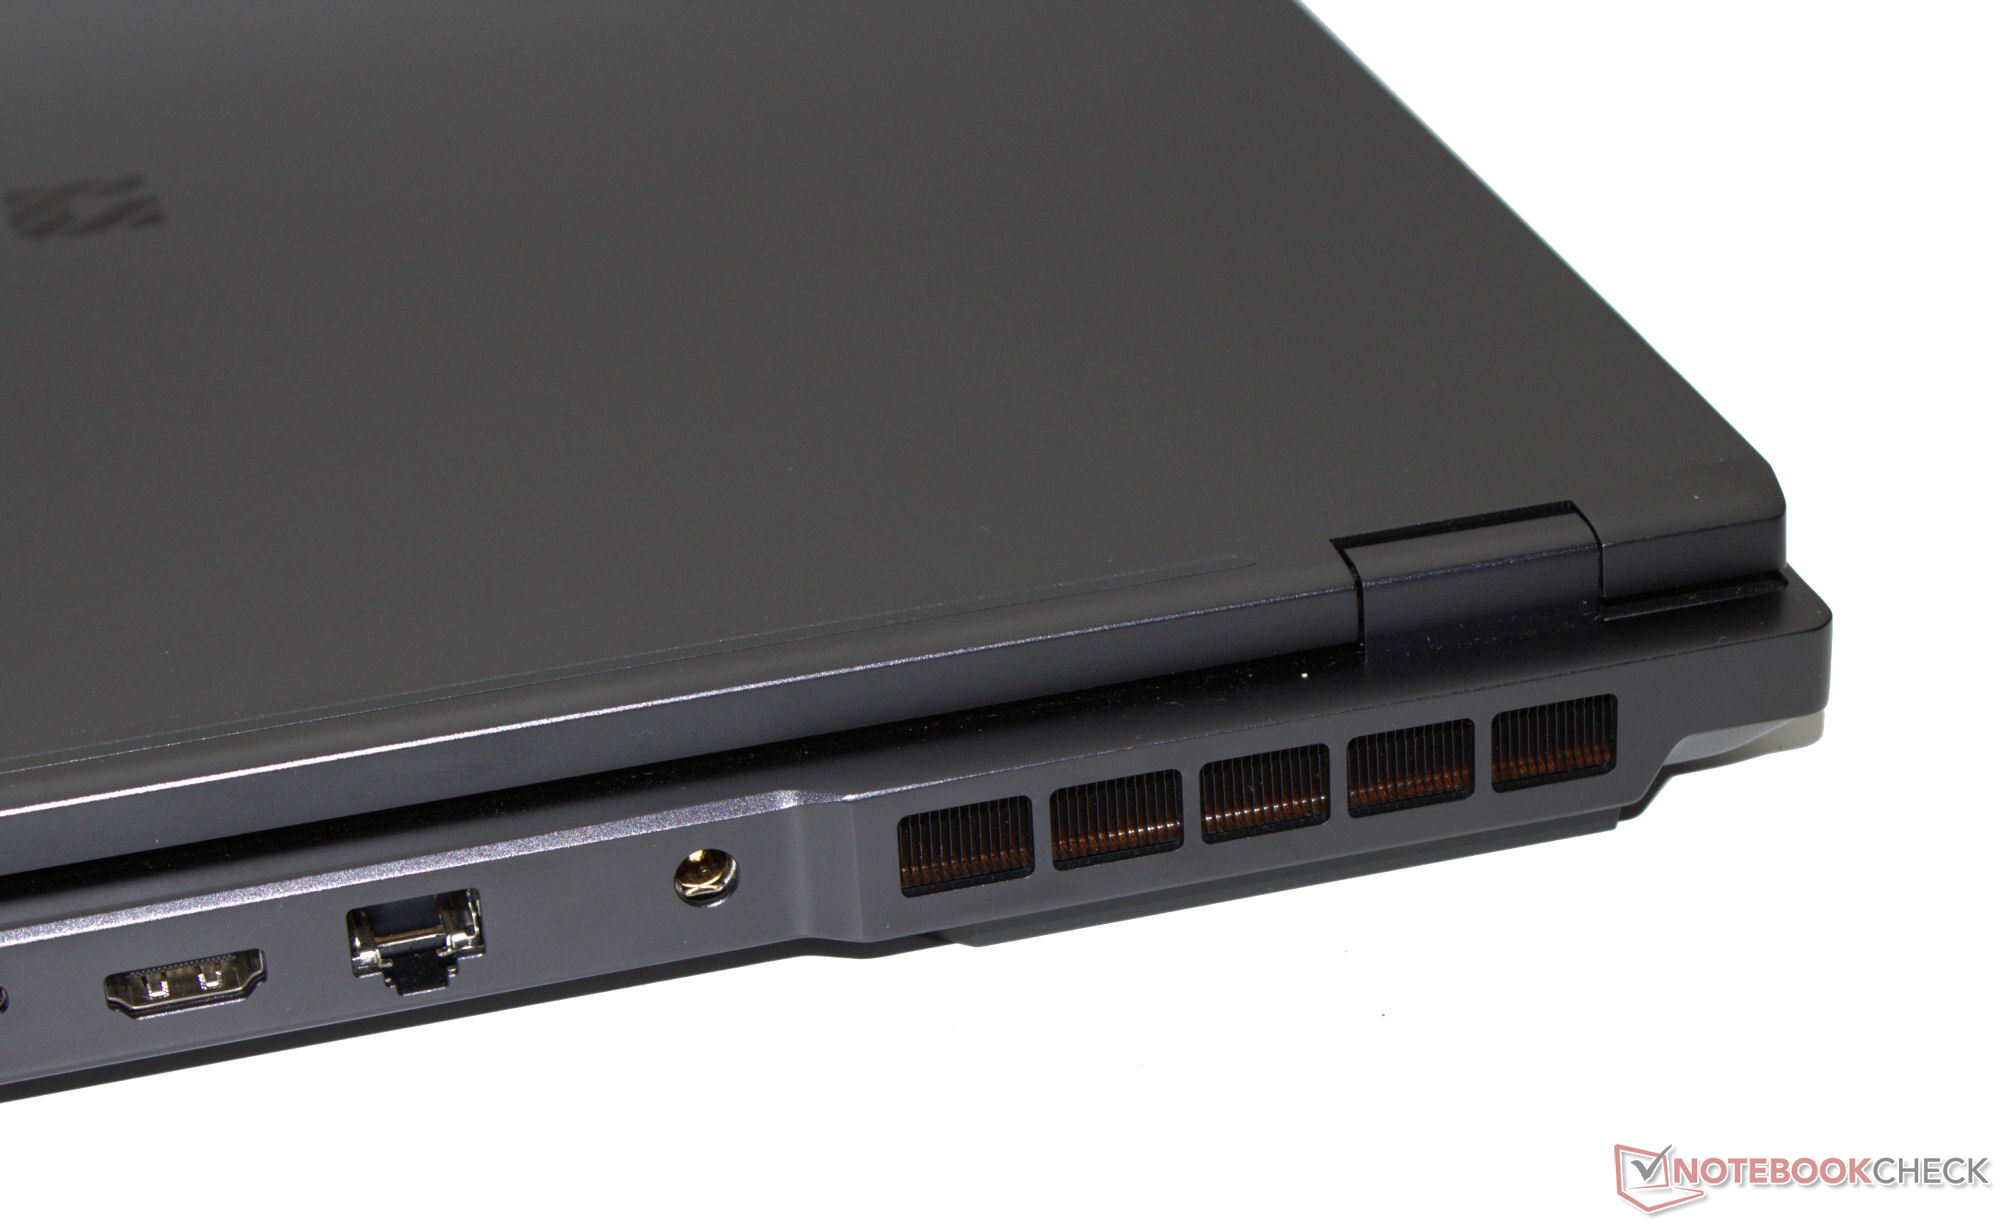
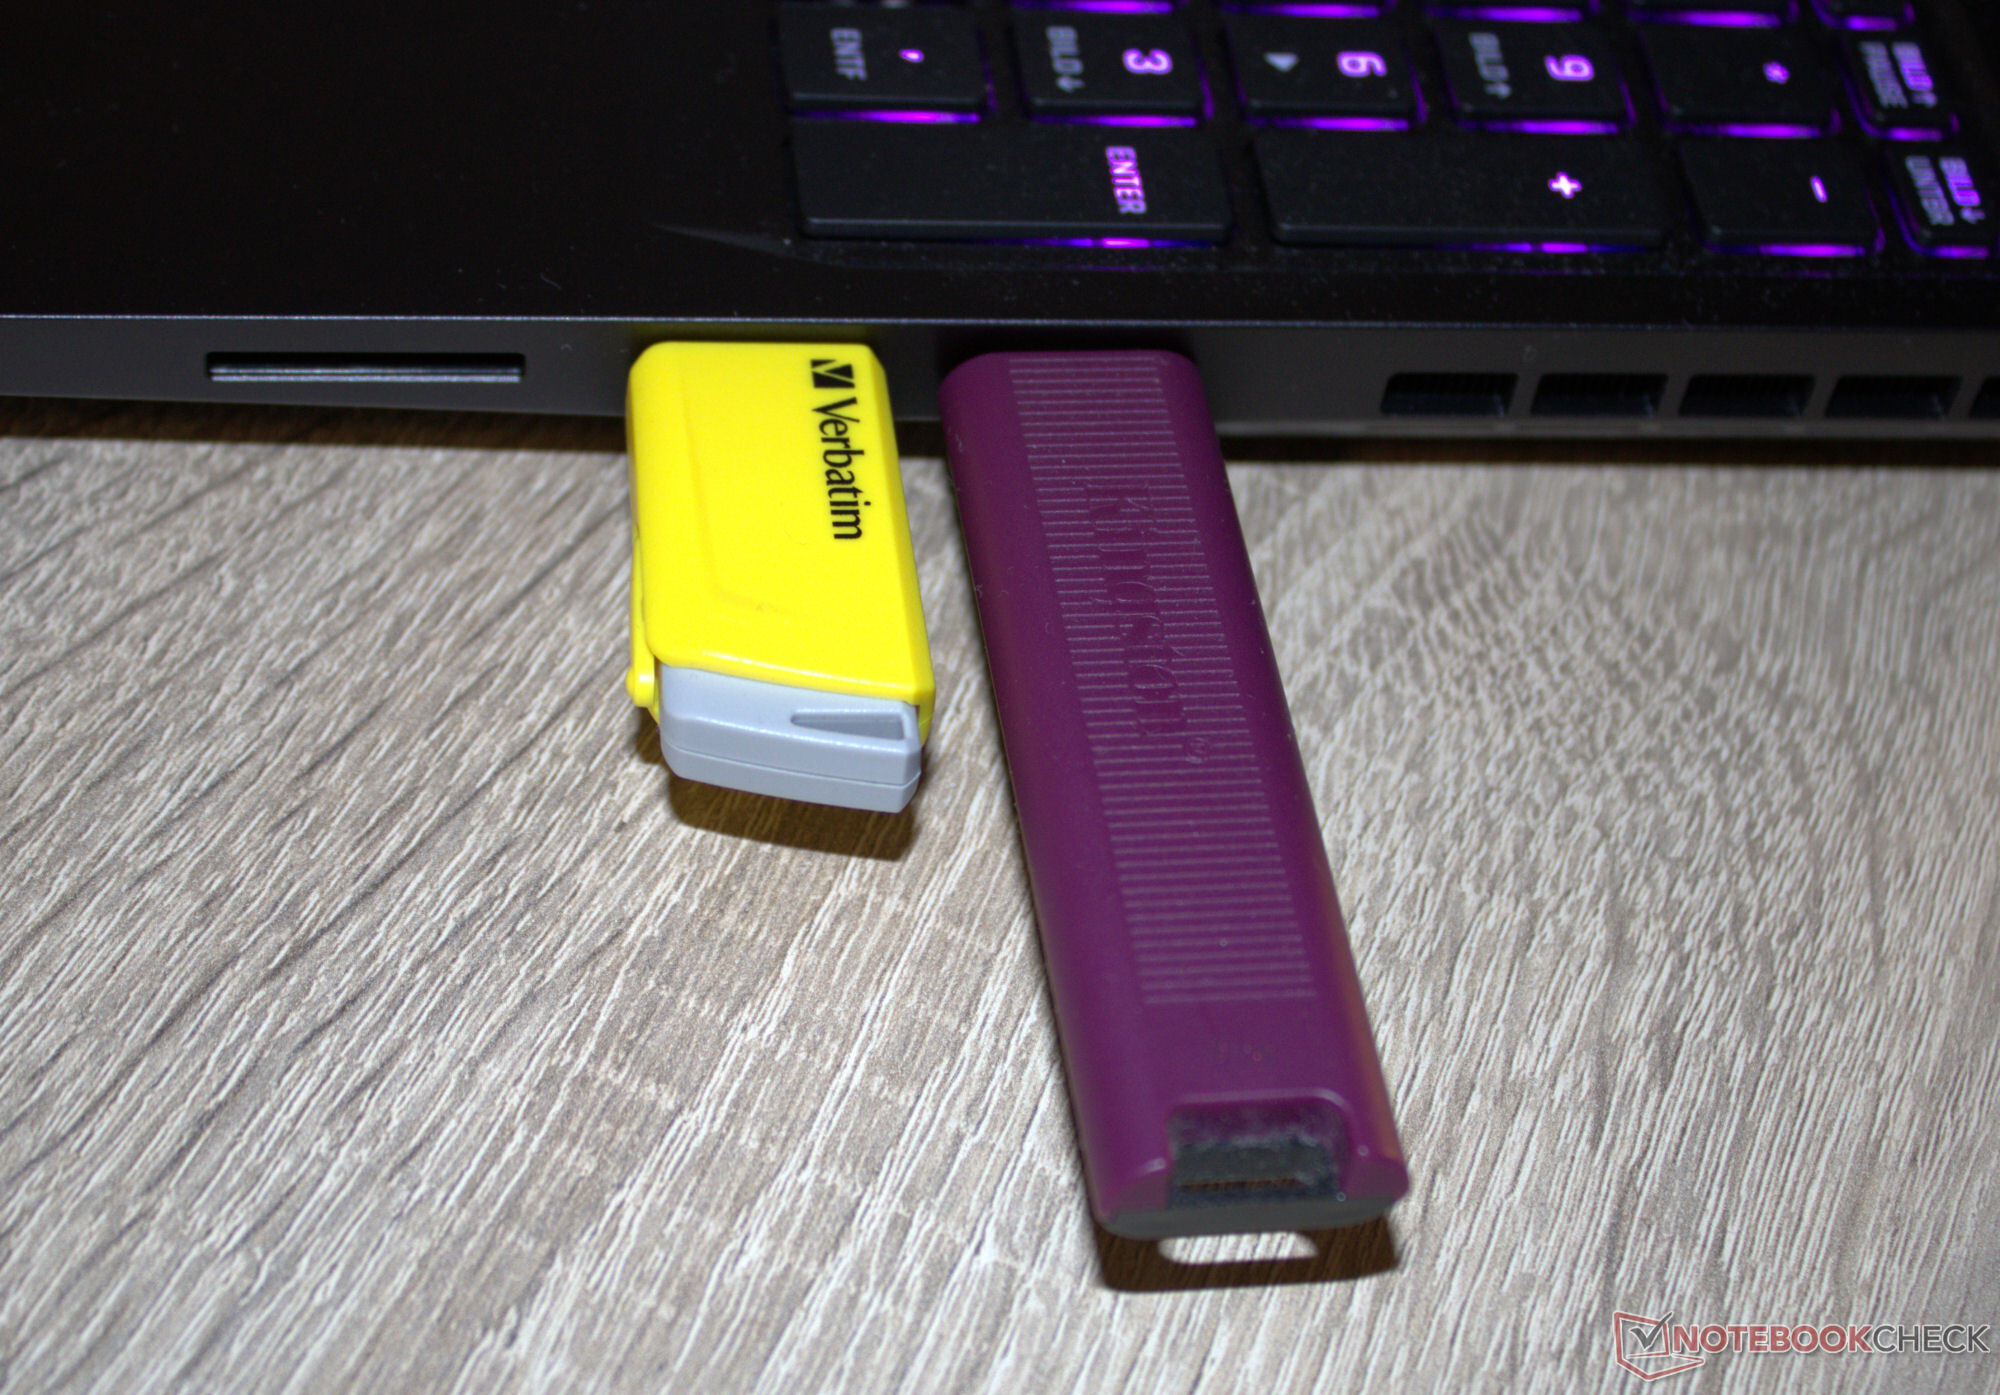
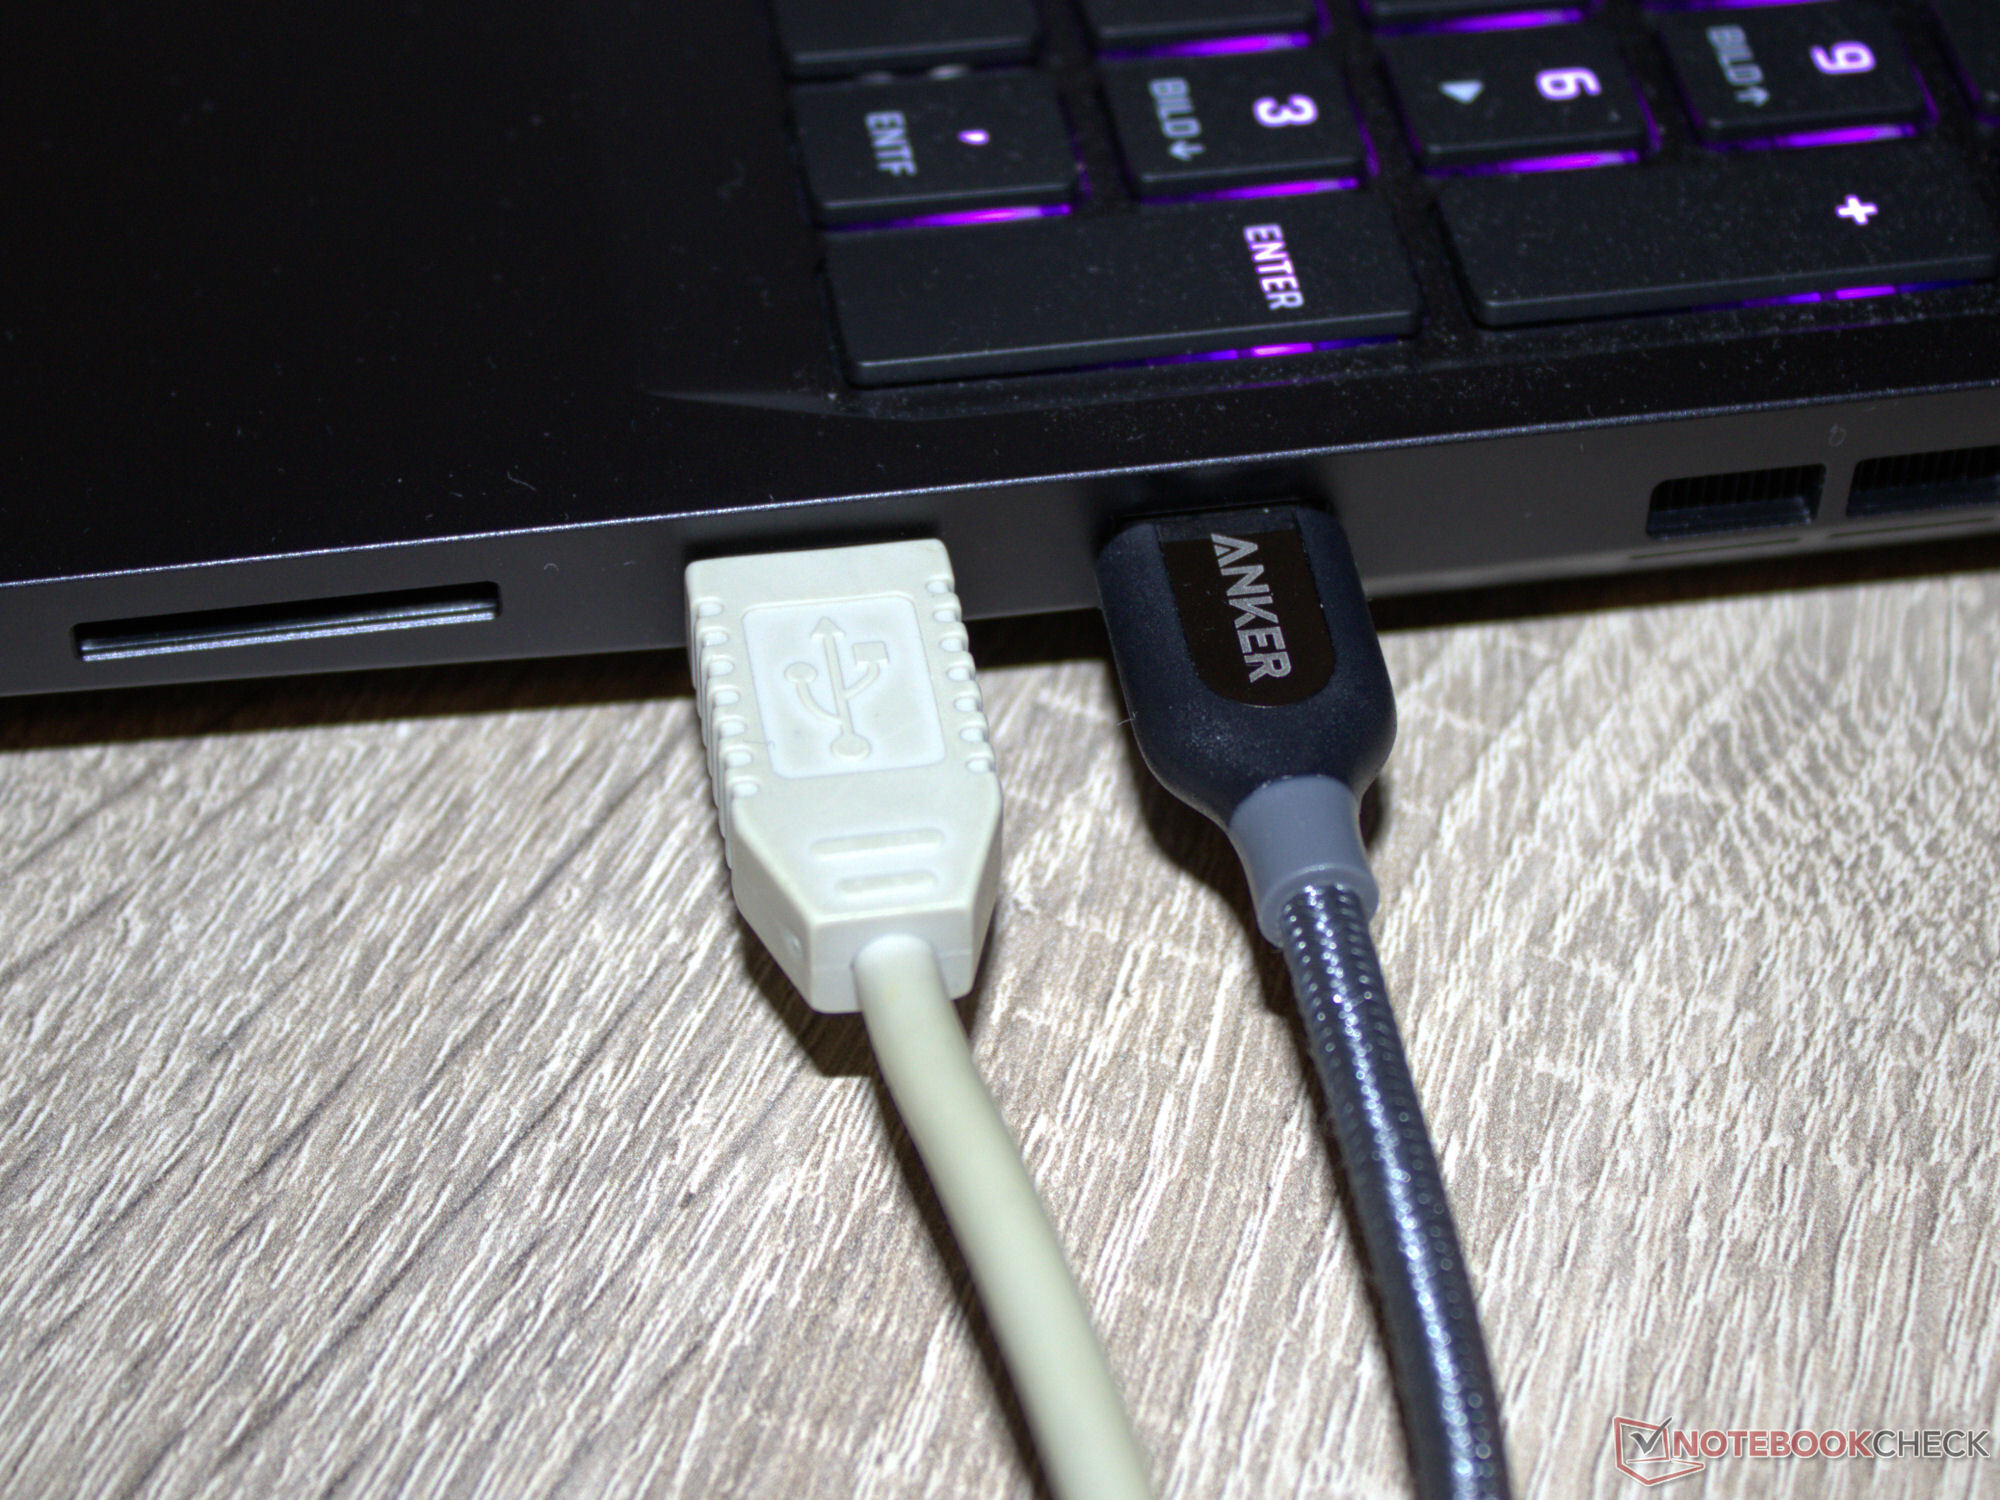
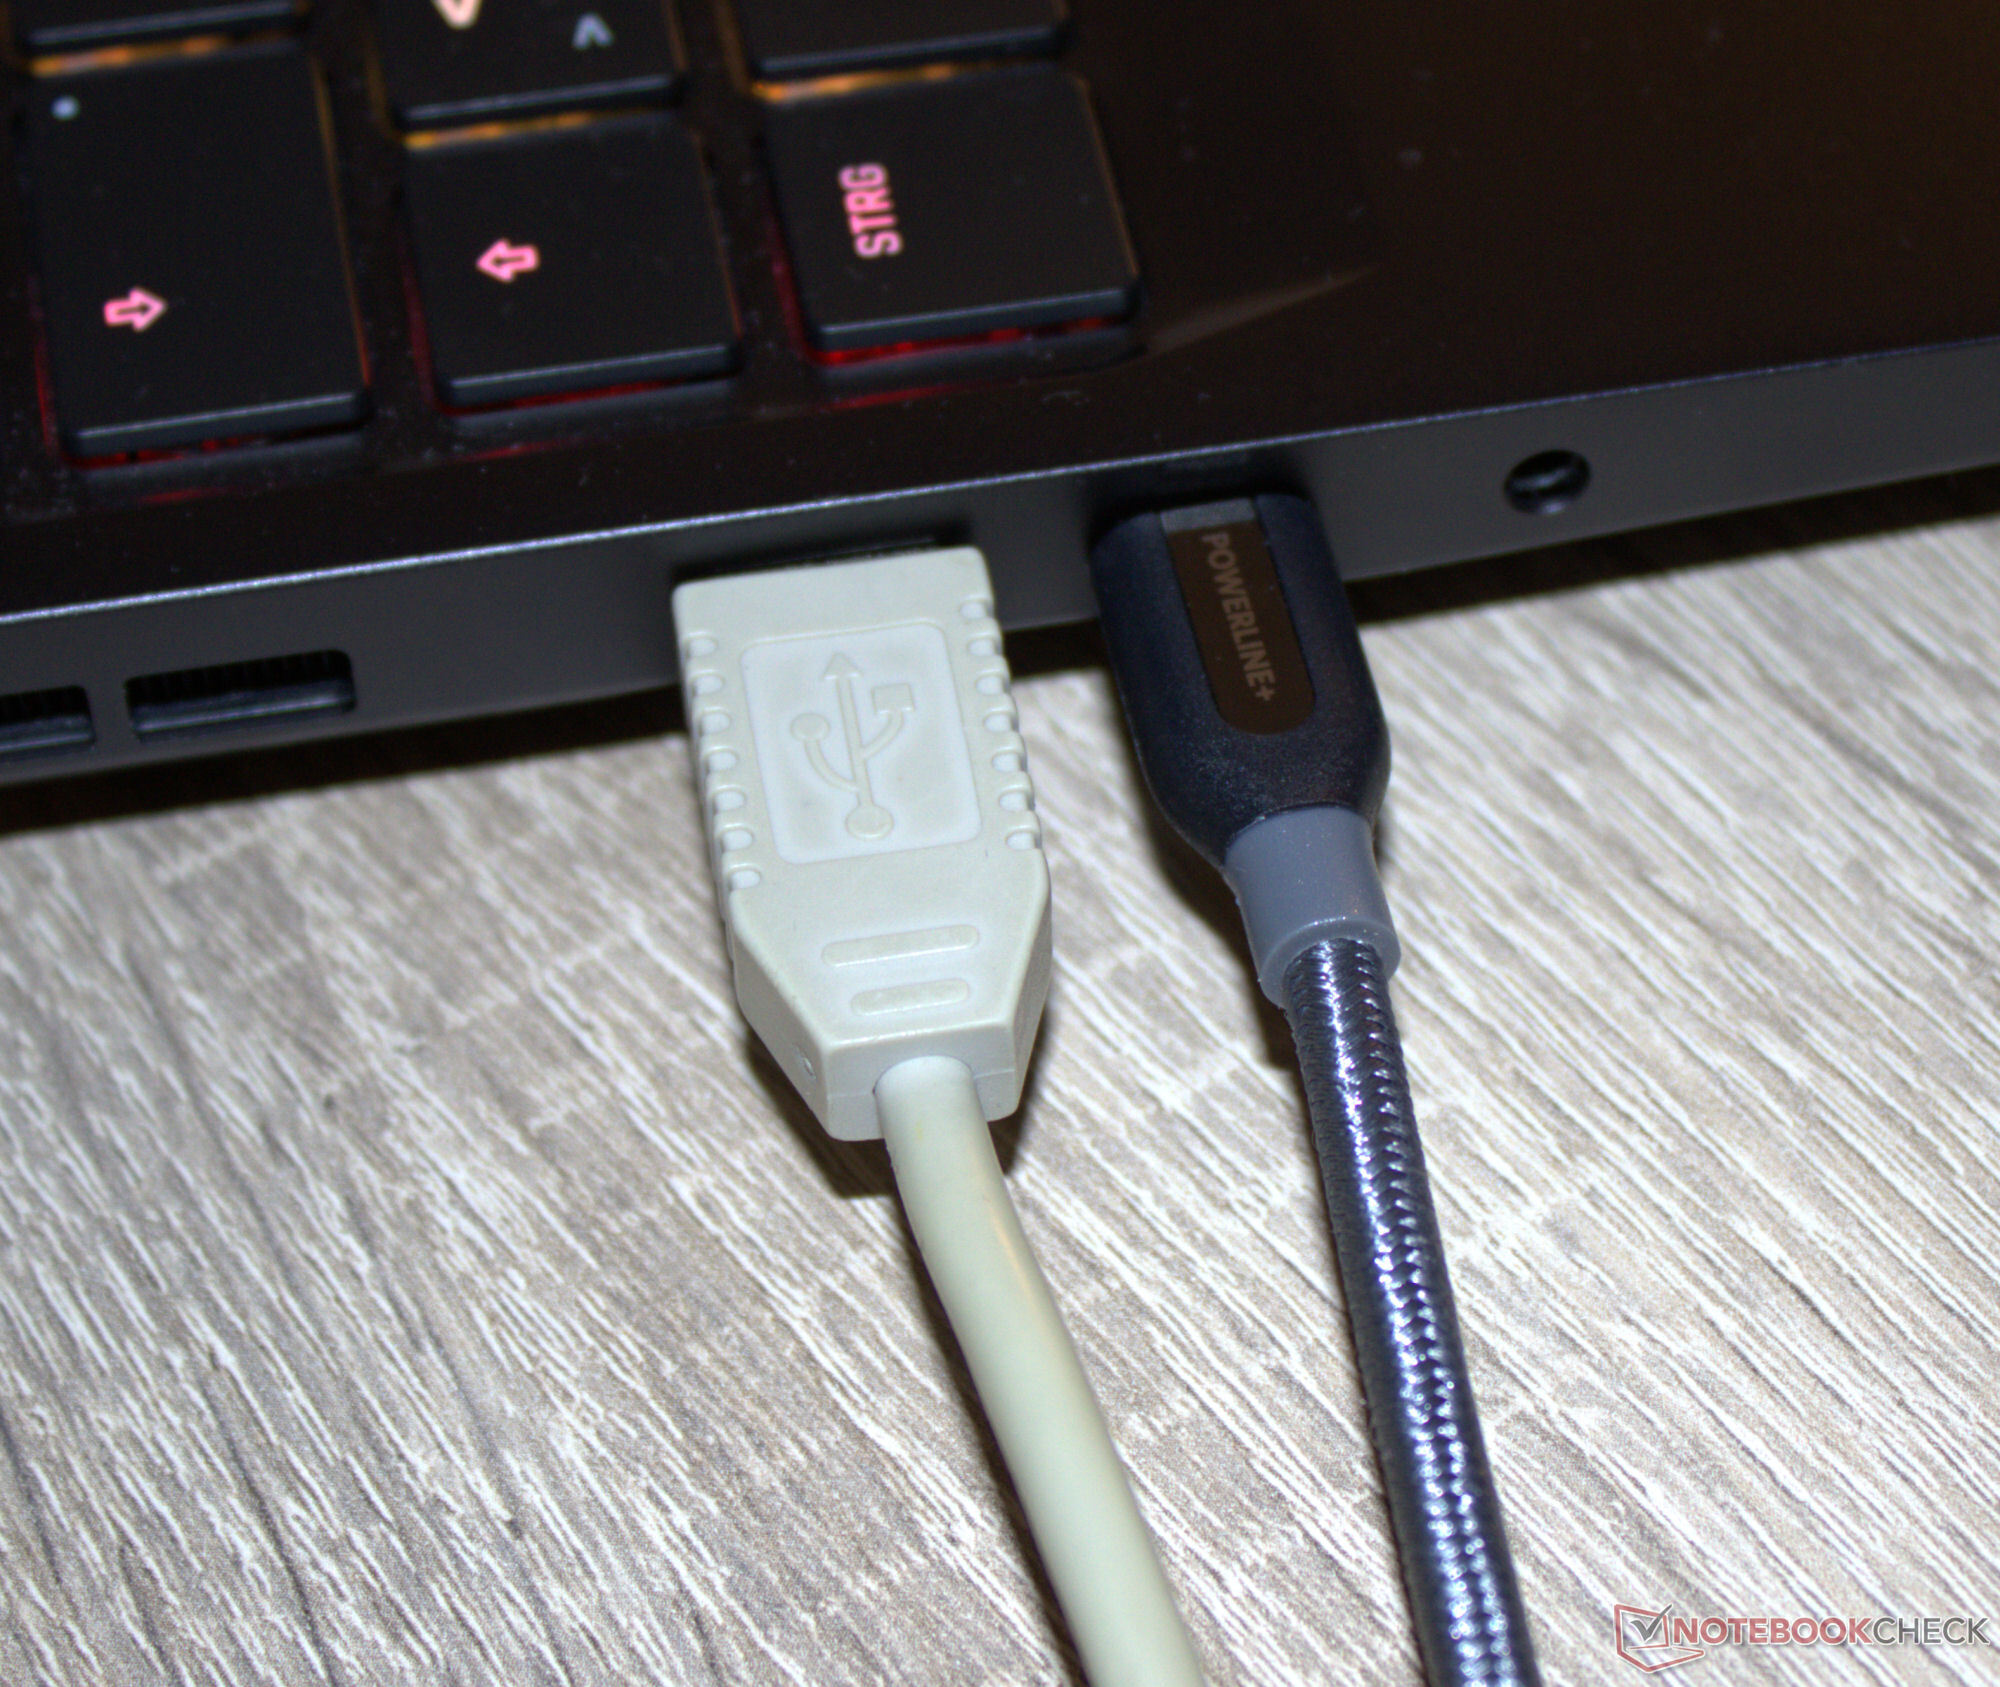
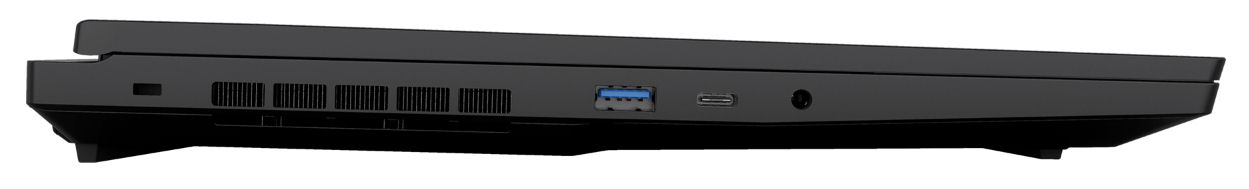
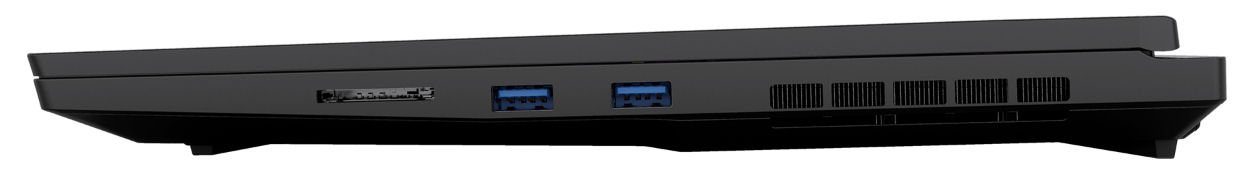
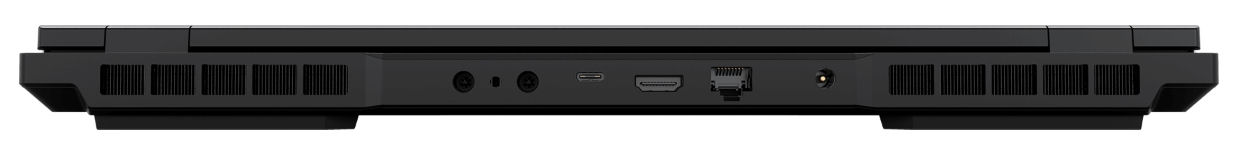
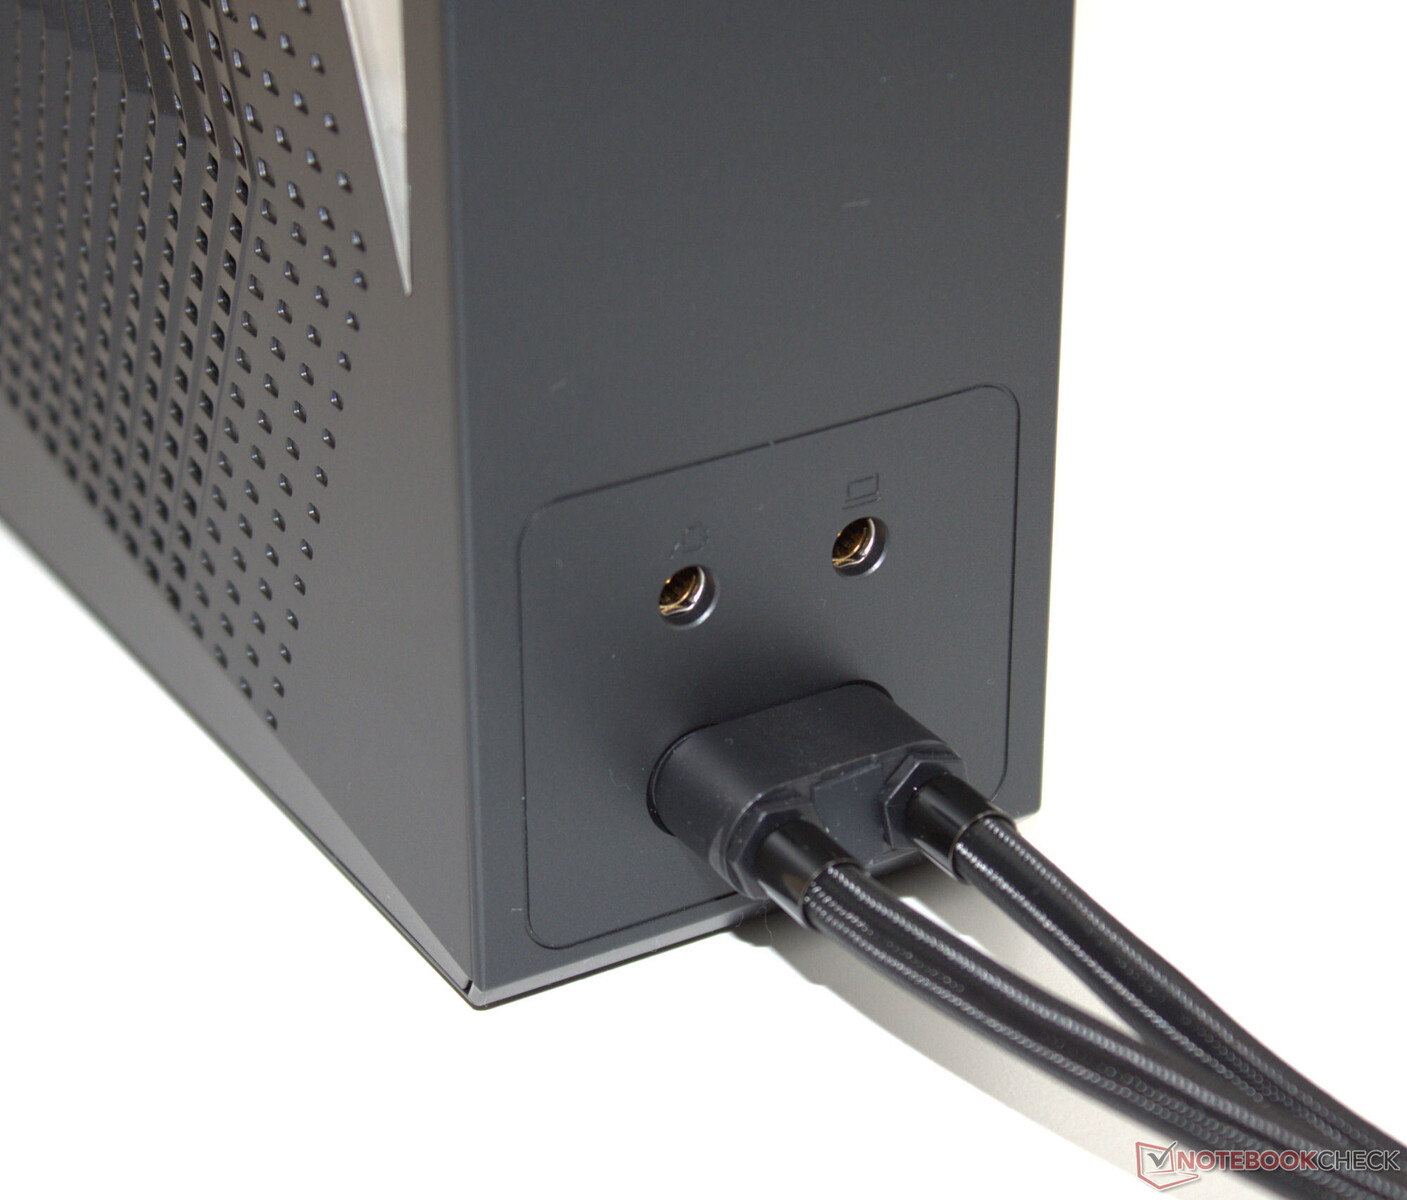
Neo 16 的 5 个 USB 端口中有 4 个(3 个 USB-A、2 个 USB-C)按照 USB 3.2 Gen 1 标准工作。只有后部的 USB-C 端口采用了 Thunderbolt 4(USB 4),包括支持 Power Delivery 和 Display Alt 模式。共有两个视频输出接口(1x HDMI、1x DP)。一个音频接口和一个千兆以太网端口(2.5 GBit/s)使产品更加完善。
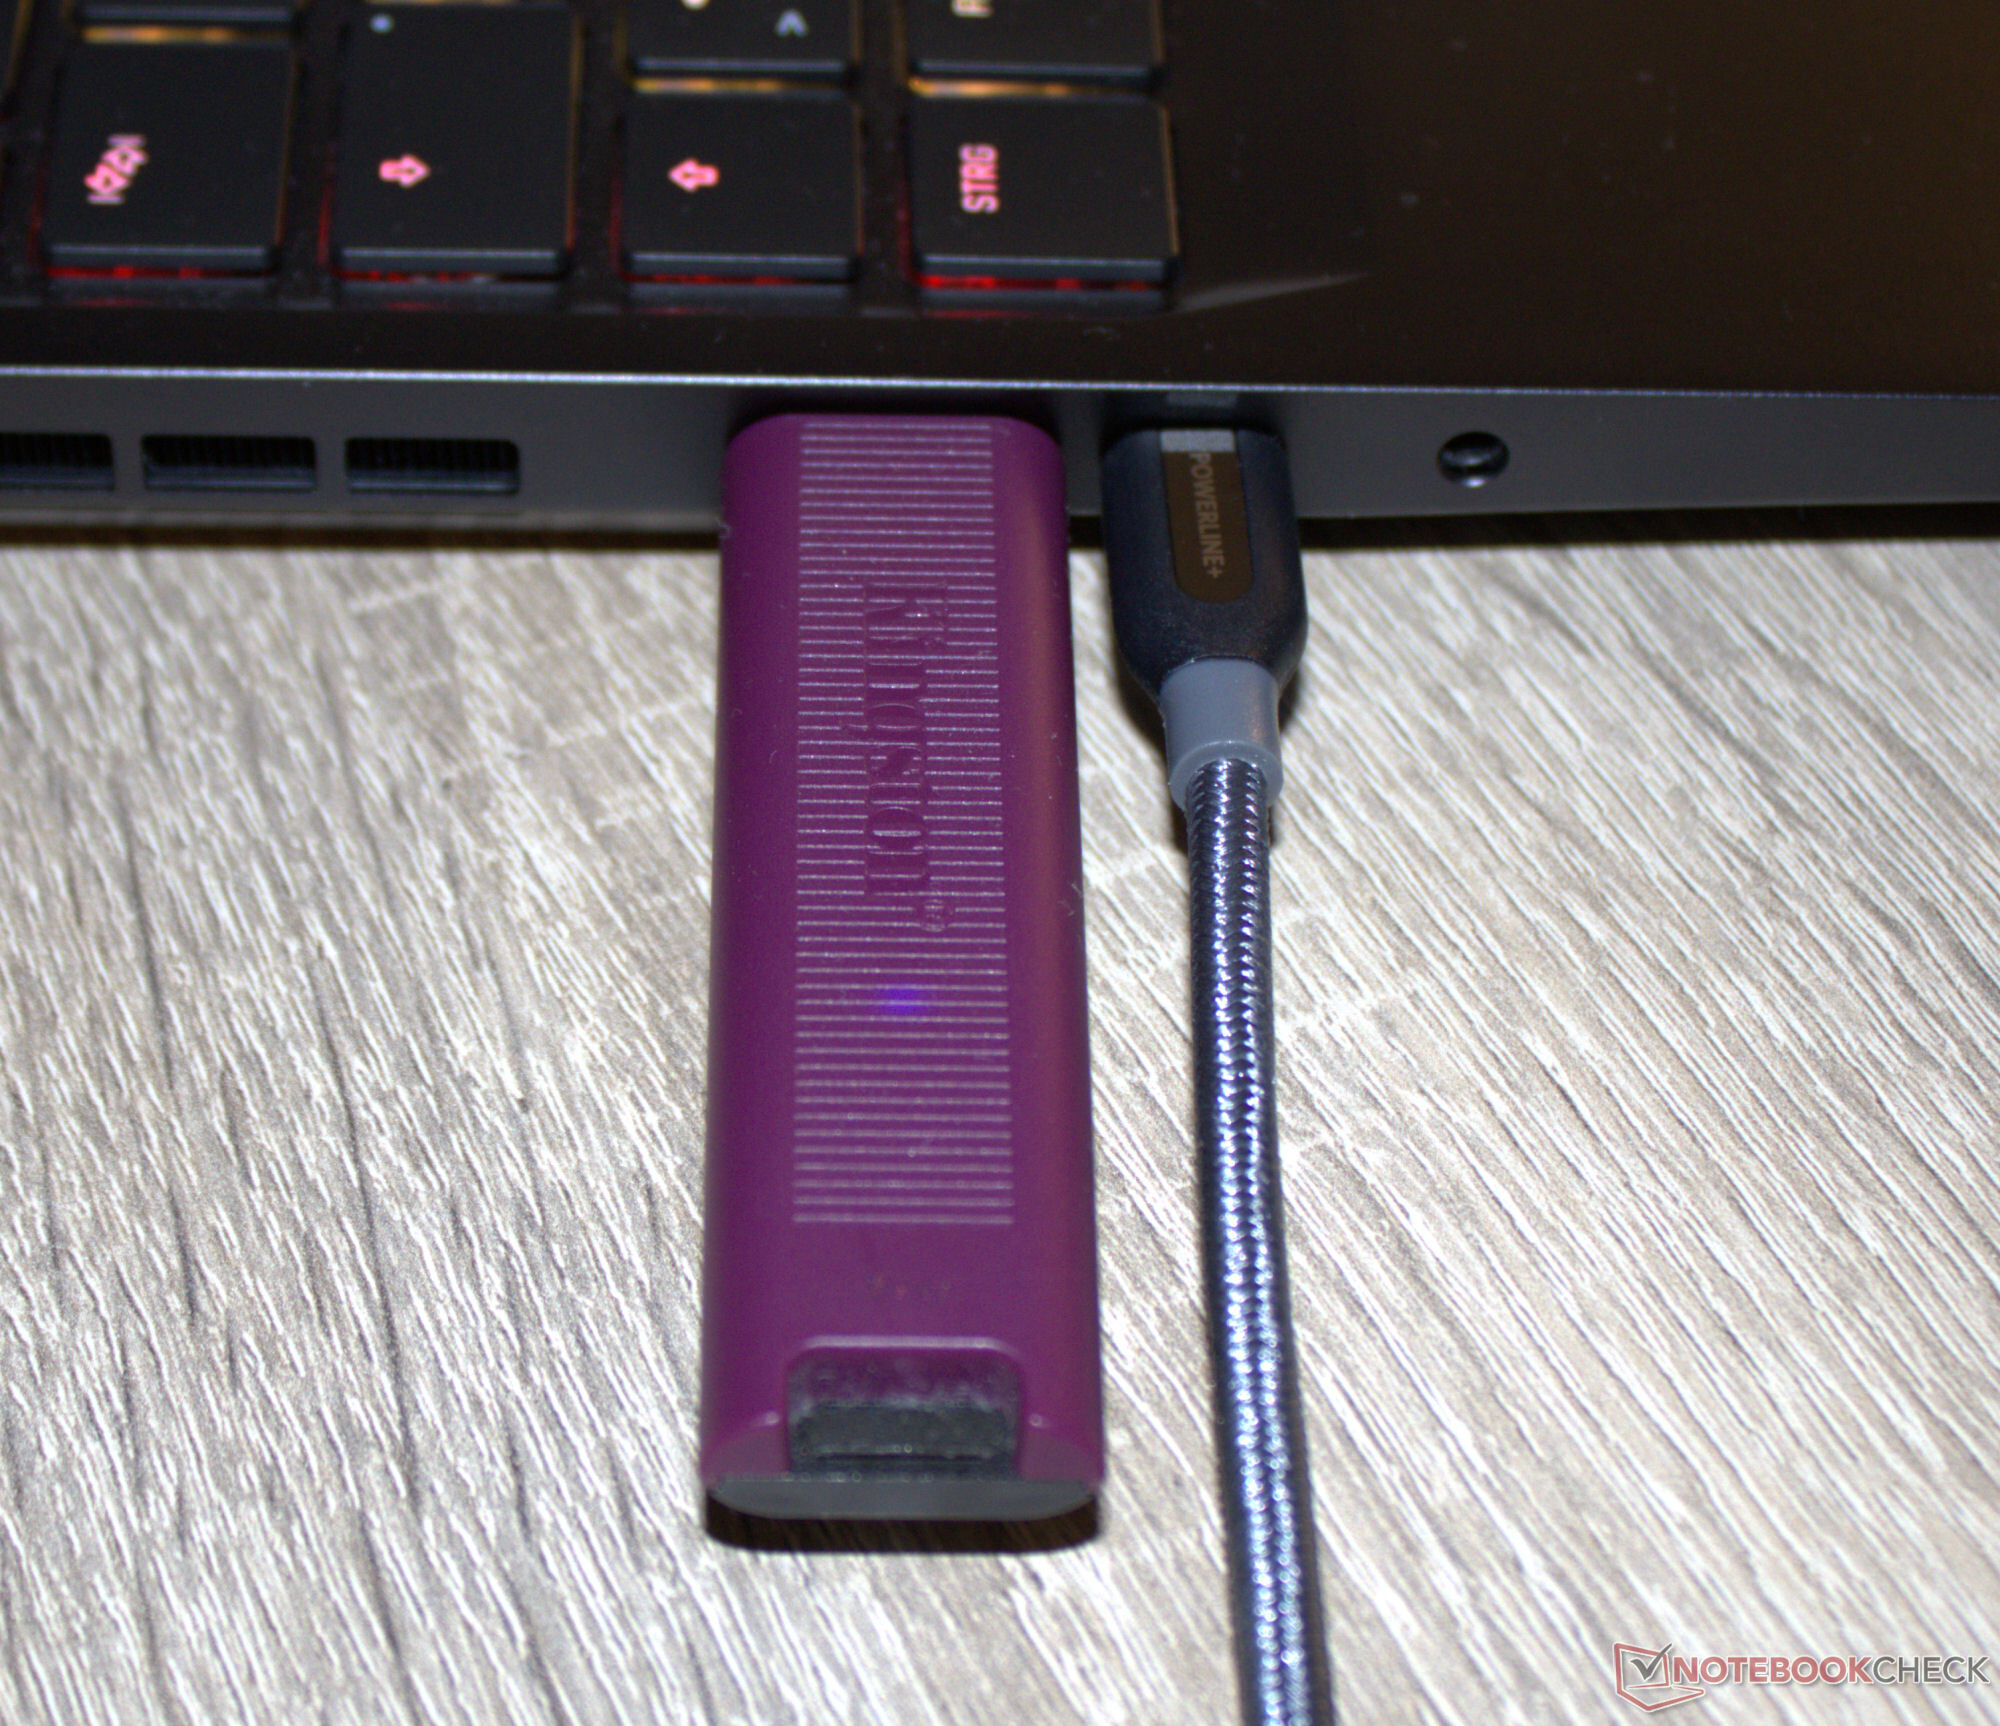
USB 端口之间的距离(右侧:12 毫米,左侧:8 毫米)似乎比例适当:可同时插入两个典型尺寸的数据棒(连接器)(见图库图片)。视频输出和电源接口位于设备后部。相关的电缆都在背面,因此不会碍事。
SD 读卡器
SD 读卡器(参考型号:AV PRO microSD 128 GB V60)属于中等速度型号:76 MB/s(传输 250 张 jpg 图像,每个文件 5 MB)和 87 MB/s(复制大数据块)的传输速度可以接受。该型号 Razer Blade 16显示可以达到更高的速度。
| SD Card Reader | |
| average JPG Copy Test (av. of 3 runs) | |
| Razer Blade 16 2024, RTX 4090 | |
| Average of class Gaming (20.9 - 210, n=61, last 2 years) | |
| Medion Erazer Beast X40 2024 (AV PRO microSD 128 GB V60) | |
| Schenker XMG Neo 16 (Early 24) (AV PRO microSD 128 GB V60) | |
| Schenker XMG Neo 16 E23 (AV PRO microSD 128 GB V60) | |
| maximum AS SSD Seq Read Test (1GB) | |
| Razer Blade 16 2024, RTX 4090 | |
| Average of class Gaming (25.5 - 261, n=58, last 2 years) | |
| Medion Erazer Beast X40 2024 (AV PRO microSD 128 GB V60) | |
| Schenker XMG Neo 16 (Early 24) (AV PRO microSD 128 GB V60) | |
| Schenker XMG Neo 16 E23 (AV PRO microSD 128 GB V60) | |
交流
在最佳条件下(附近没有 Wi-Fi 设备,笔记本电脑与服务器电脑之间的距离较短),可以达到很好甚至极佳的数据传输速度 - WiFi 6E 芯片(英特尔 AX211)使之成为可能。有线连接由 Realtek 千兆以太网控制器(RTL8125,2.5 GBit/s)执行。
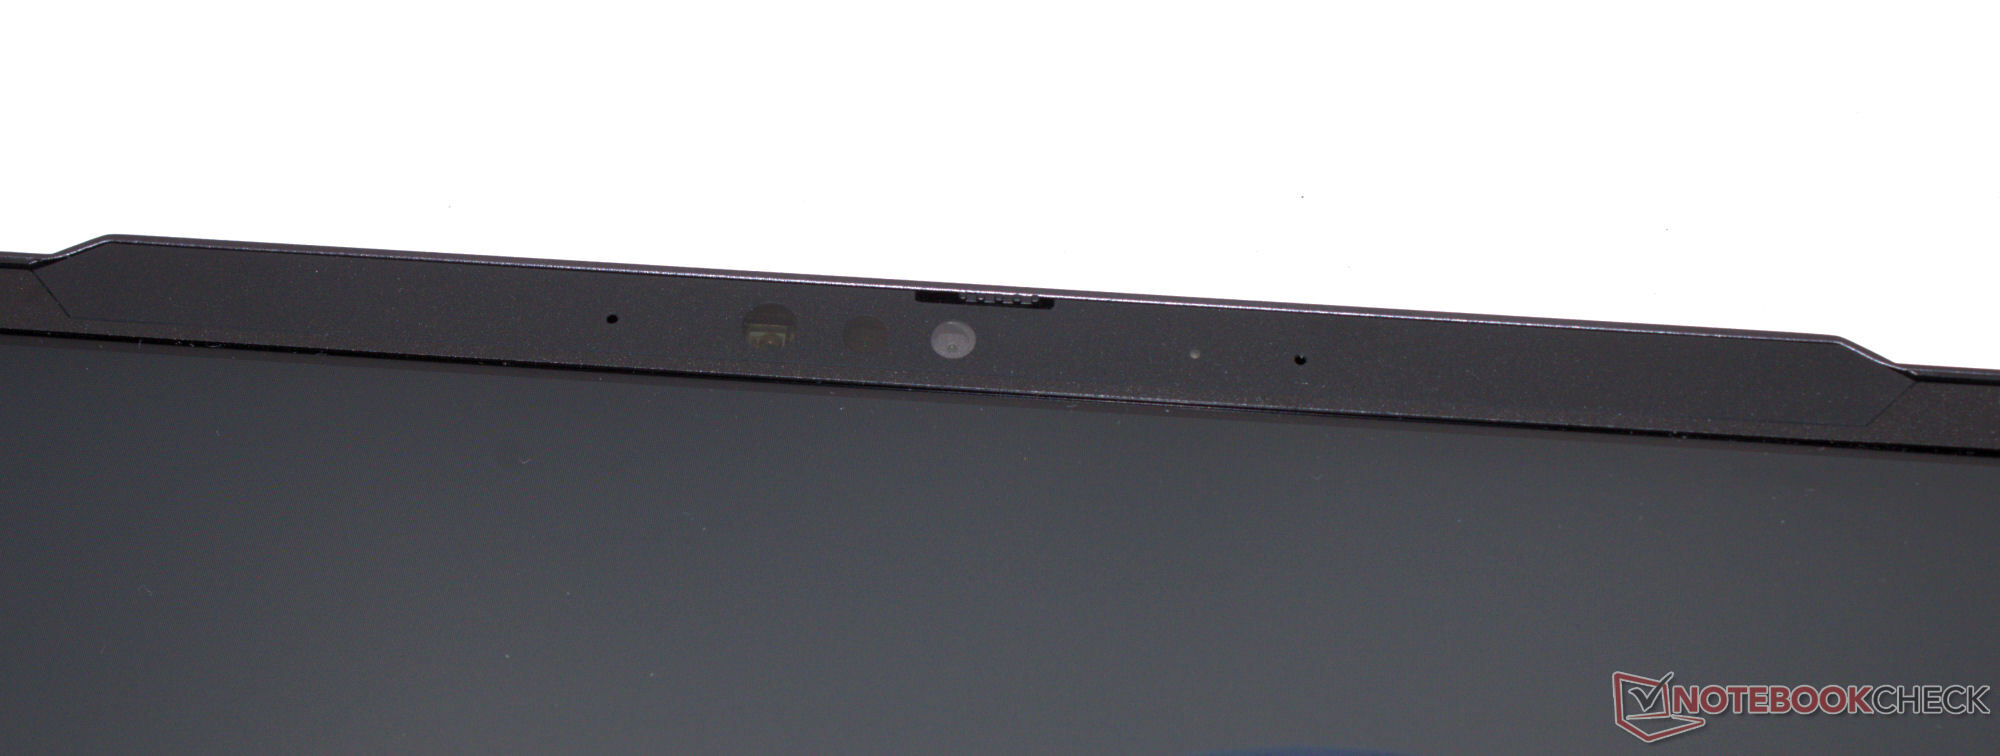
网络摄像头
网络摄像头(210 万像素)质量一般,支持 Windows Hello。此外,还有一个机械快门。

 GeForce RTX 4090 Laptop GPU, i9-14900HX, Samsung 990 Pro 1 TB")
 GeForce RTX 4090 Laptop GPU, i9-14900HX, Samsung 990 Pro 1 TB")
配件
笔记本电脑附带一个 USB 记忆棒(驱动程序、说明书)、贴纸和鼠标垫。可选配件包括外置水冷系统(230 美元)。($230).

维护
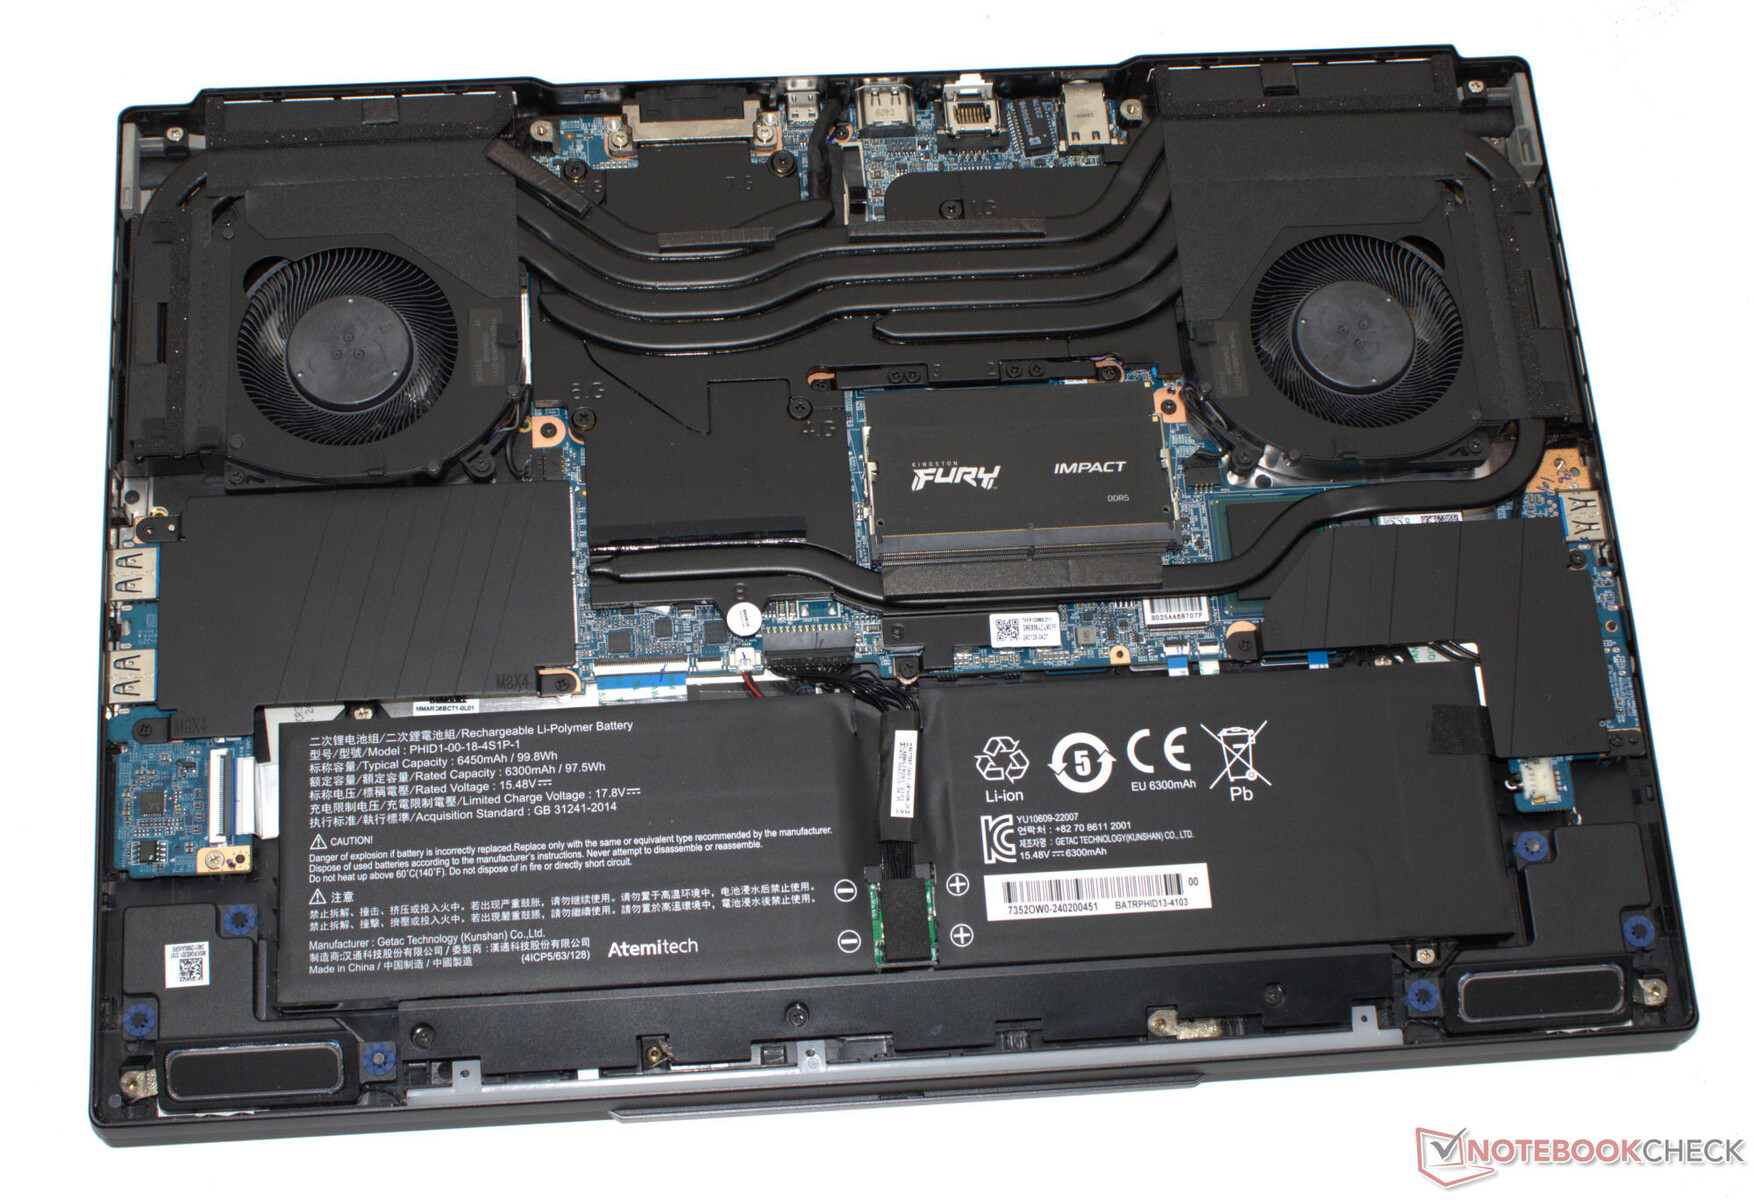
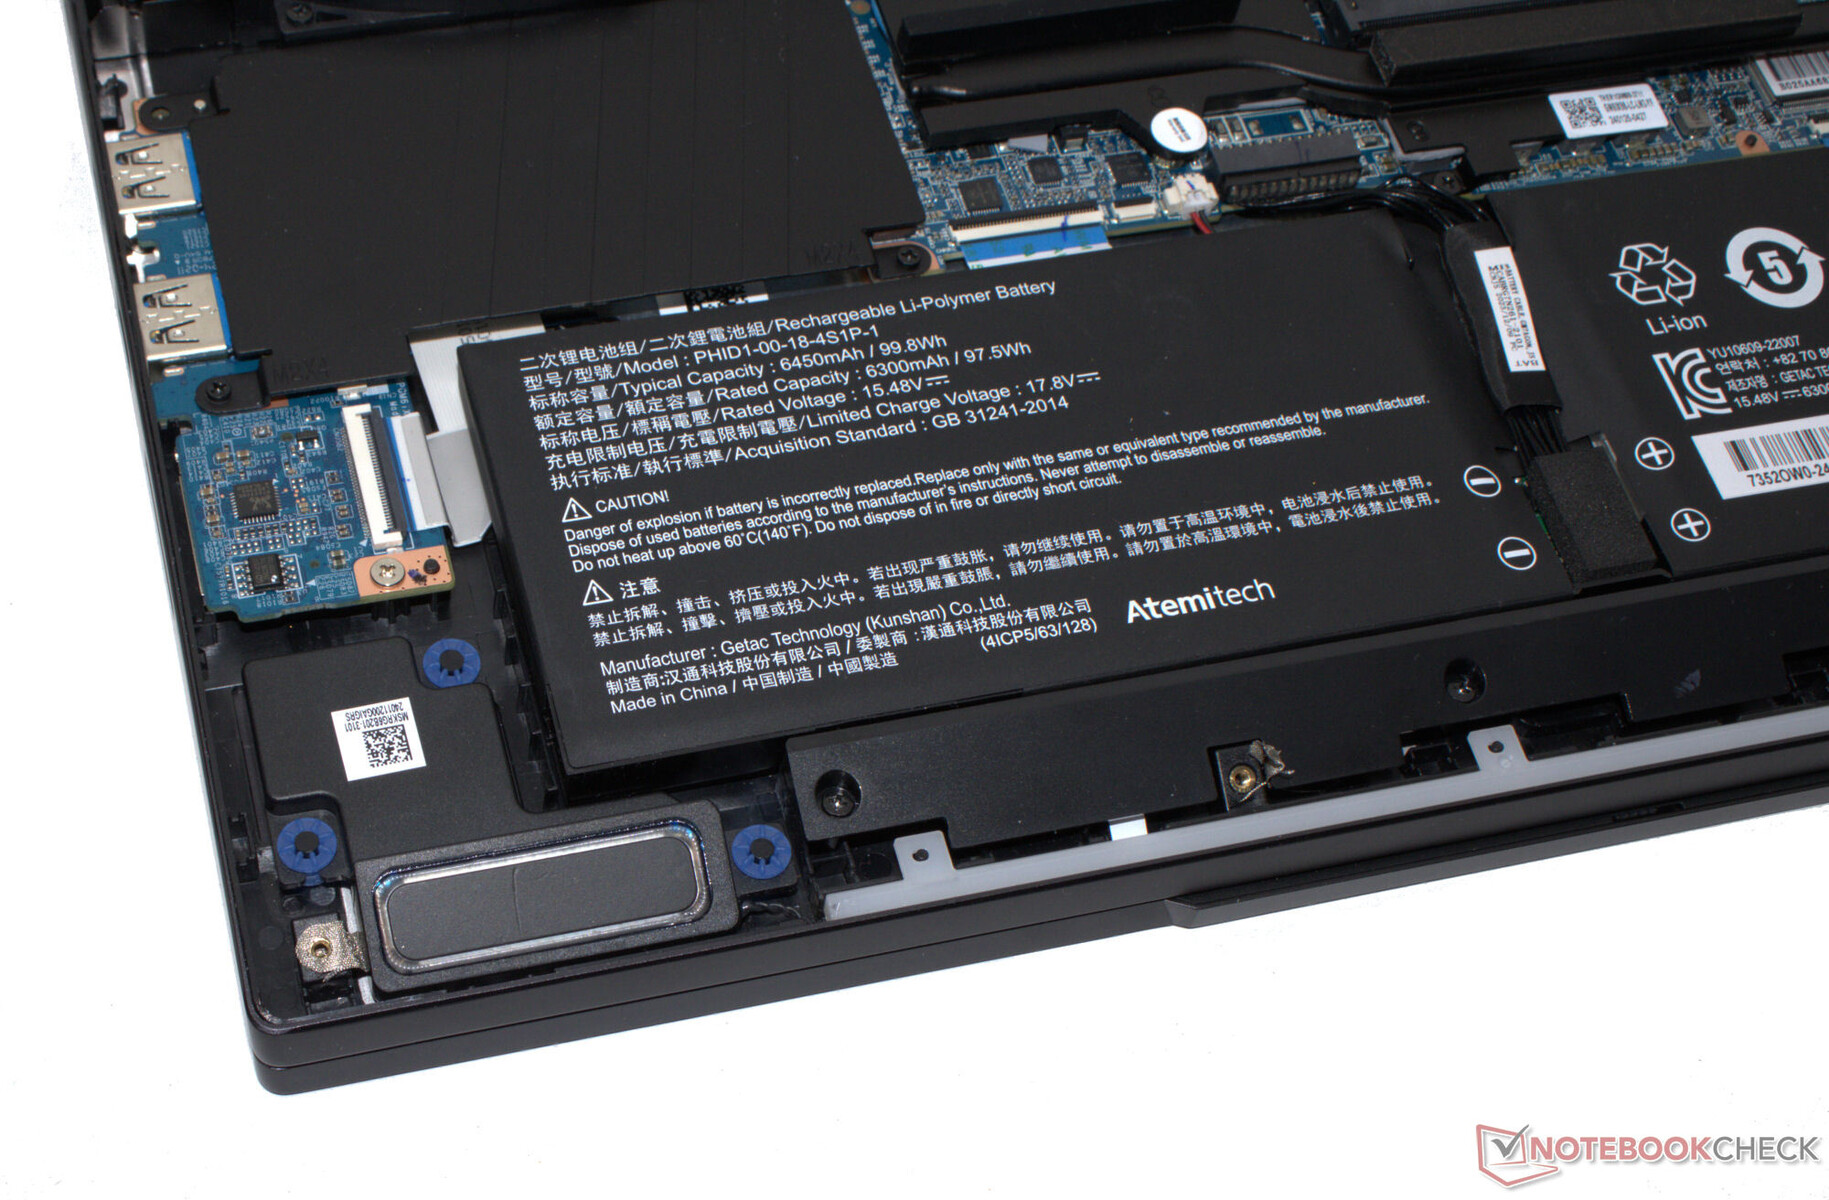
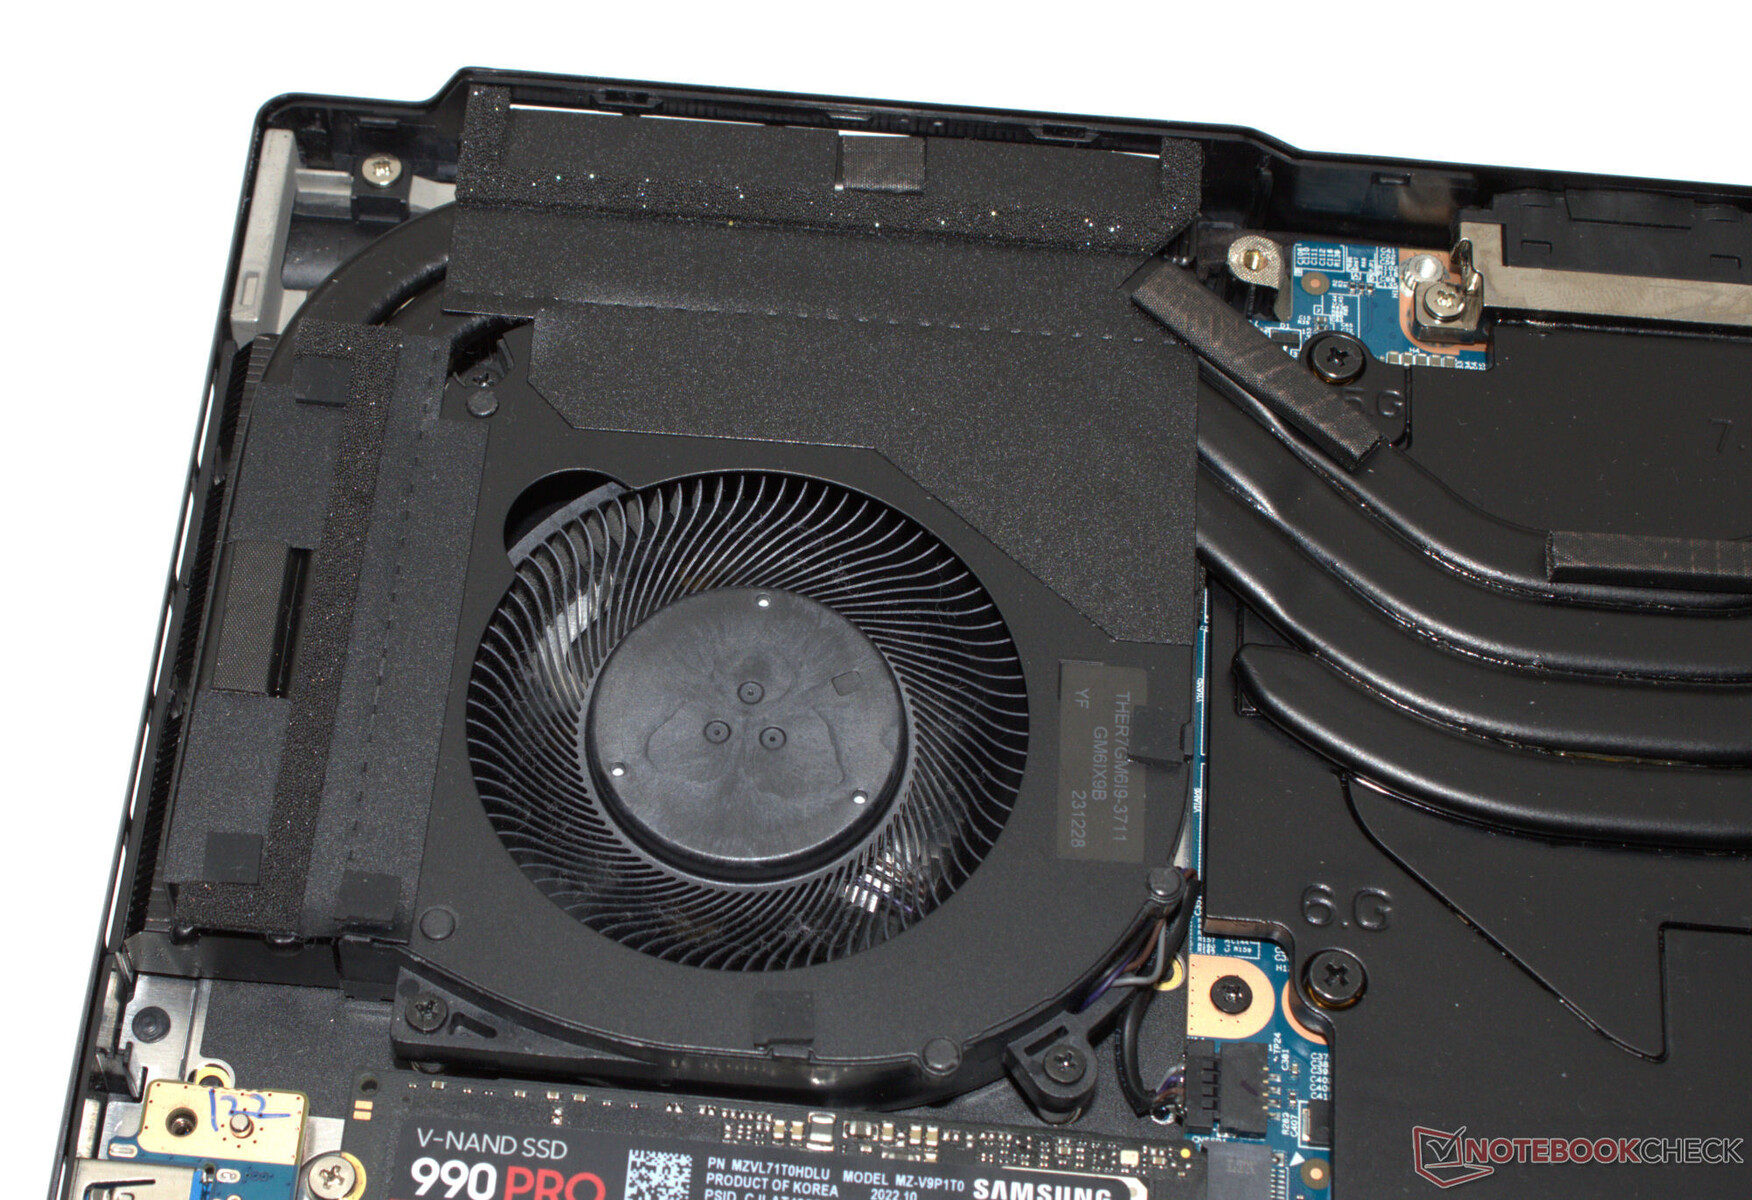
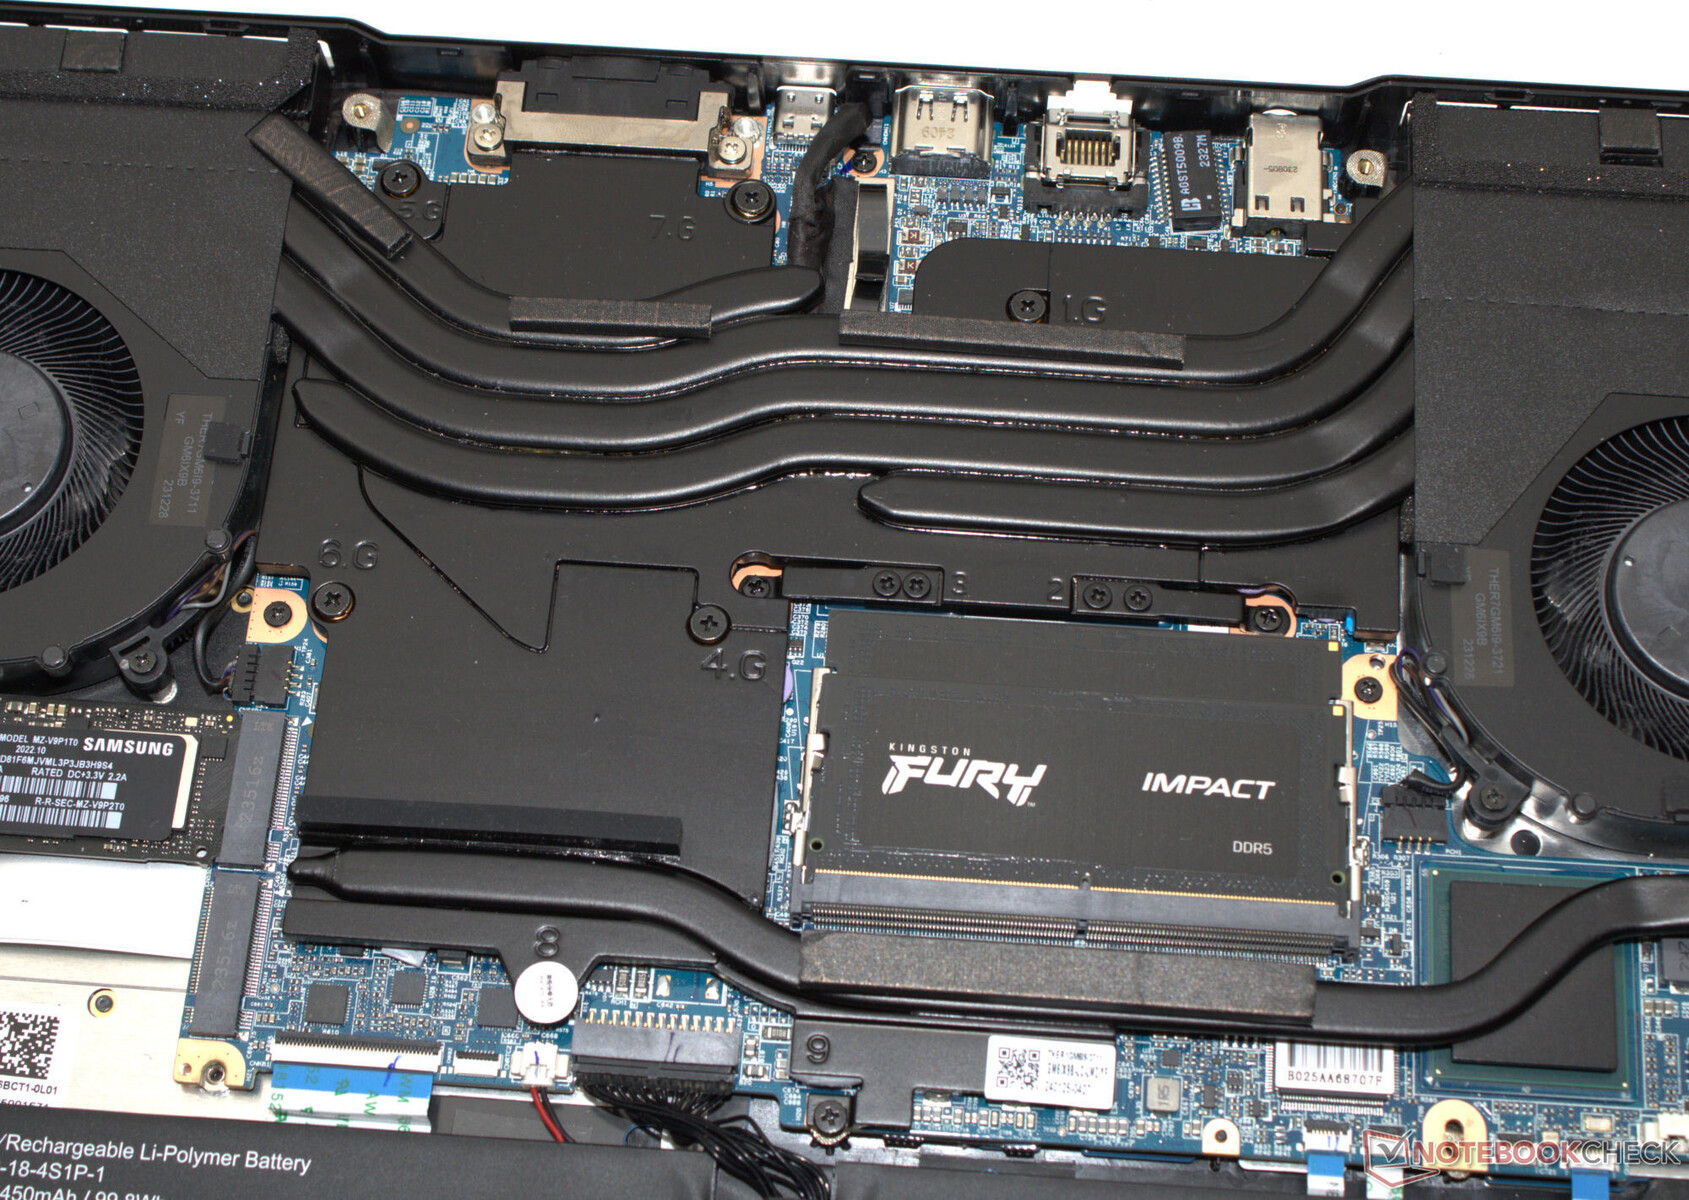
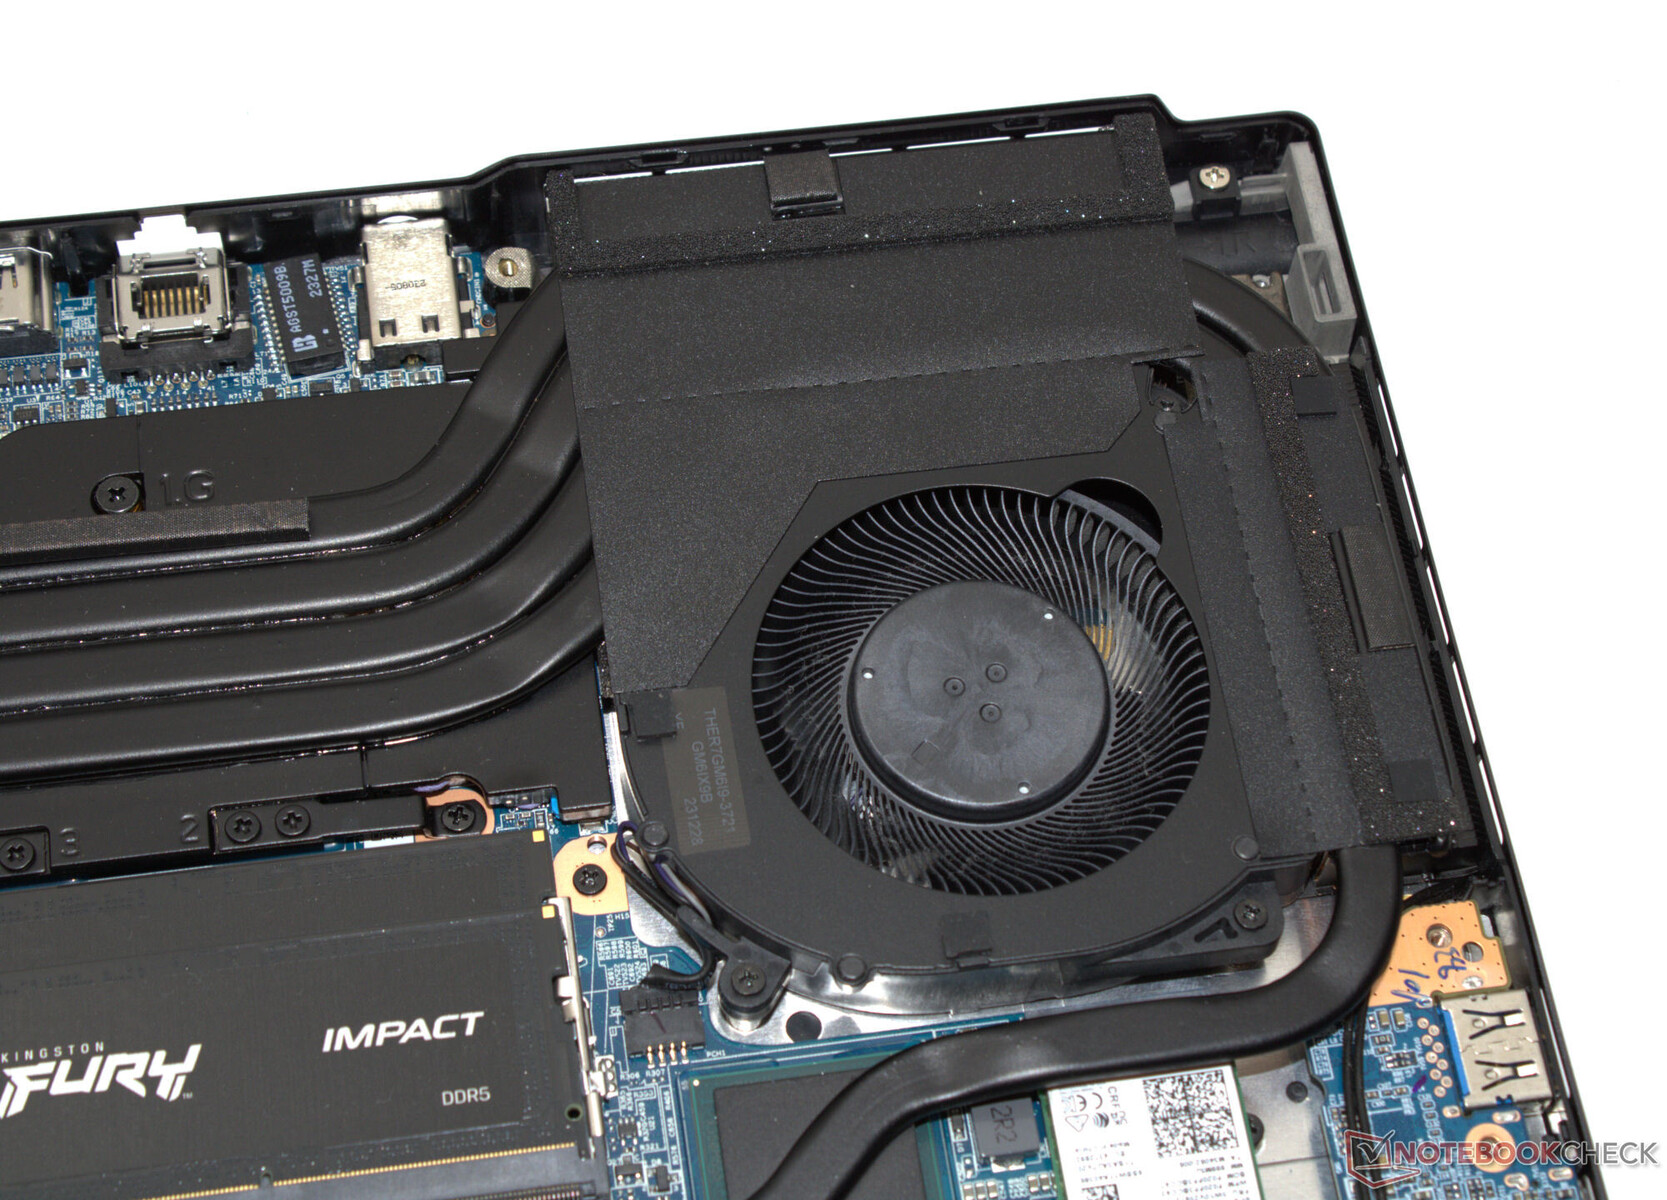
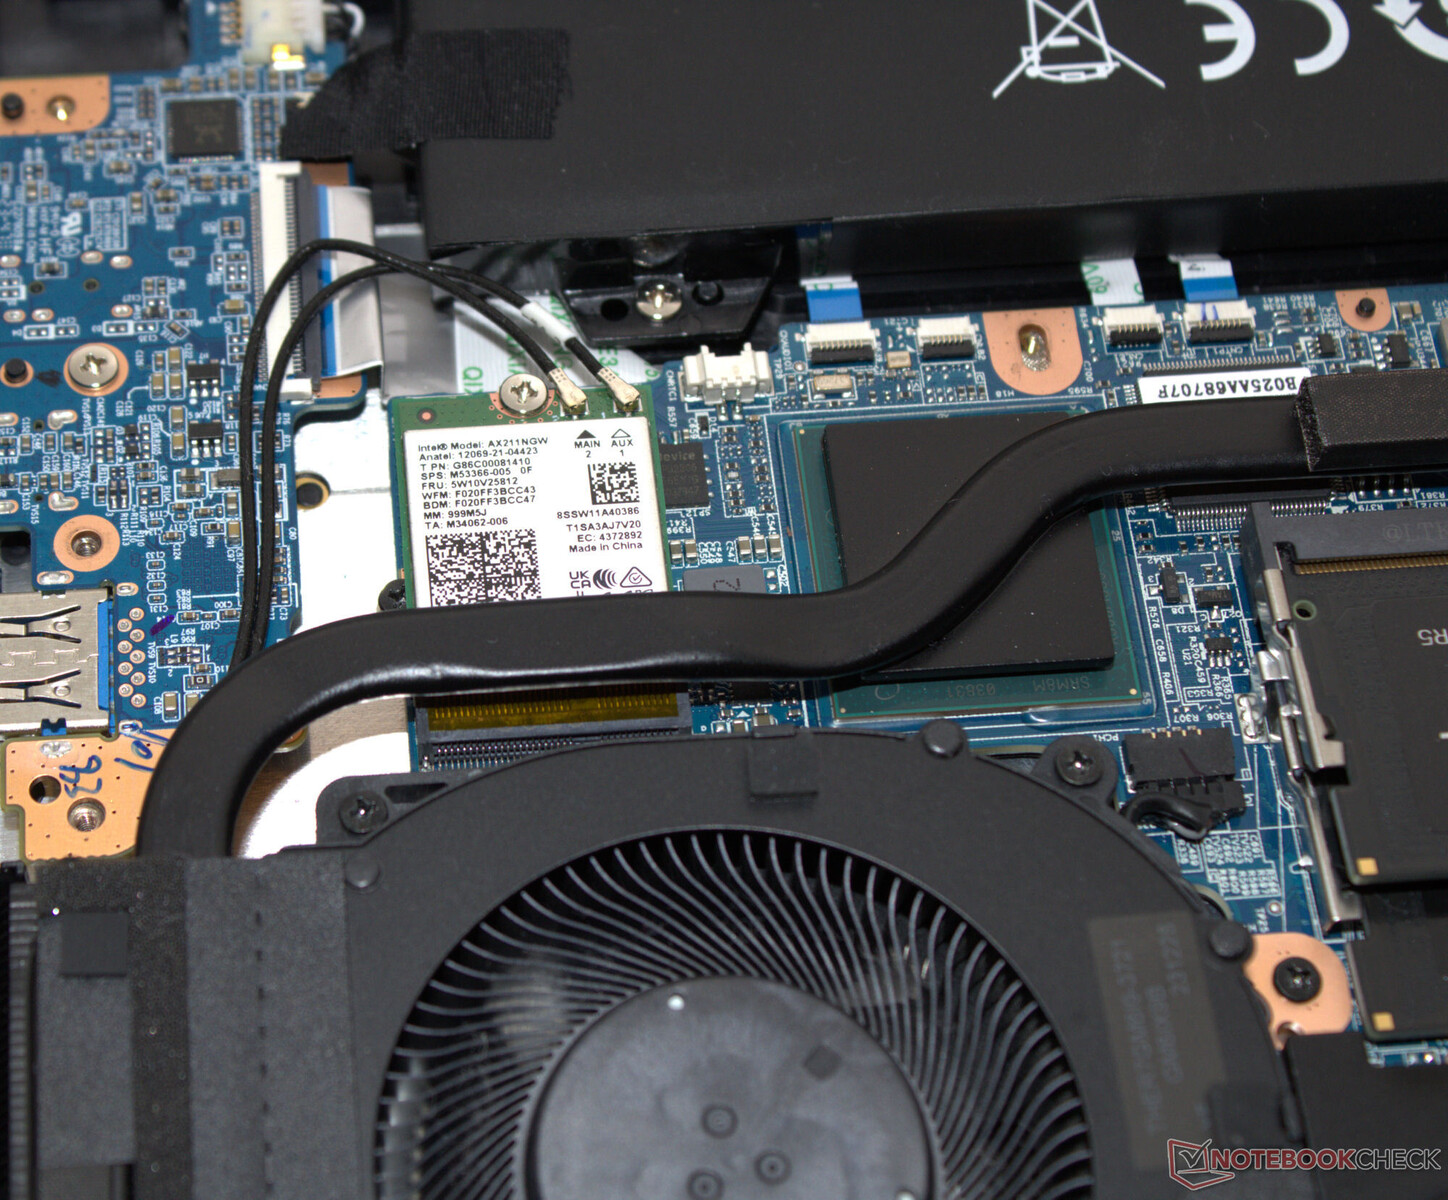
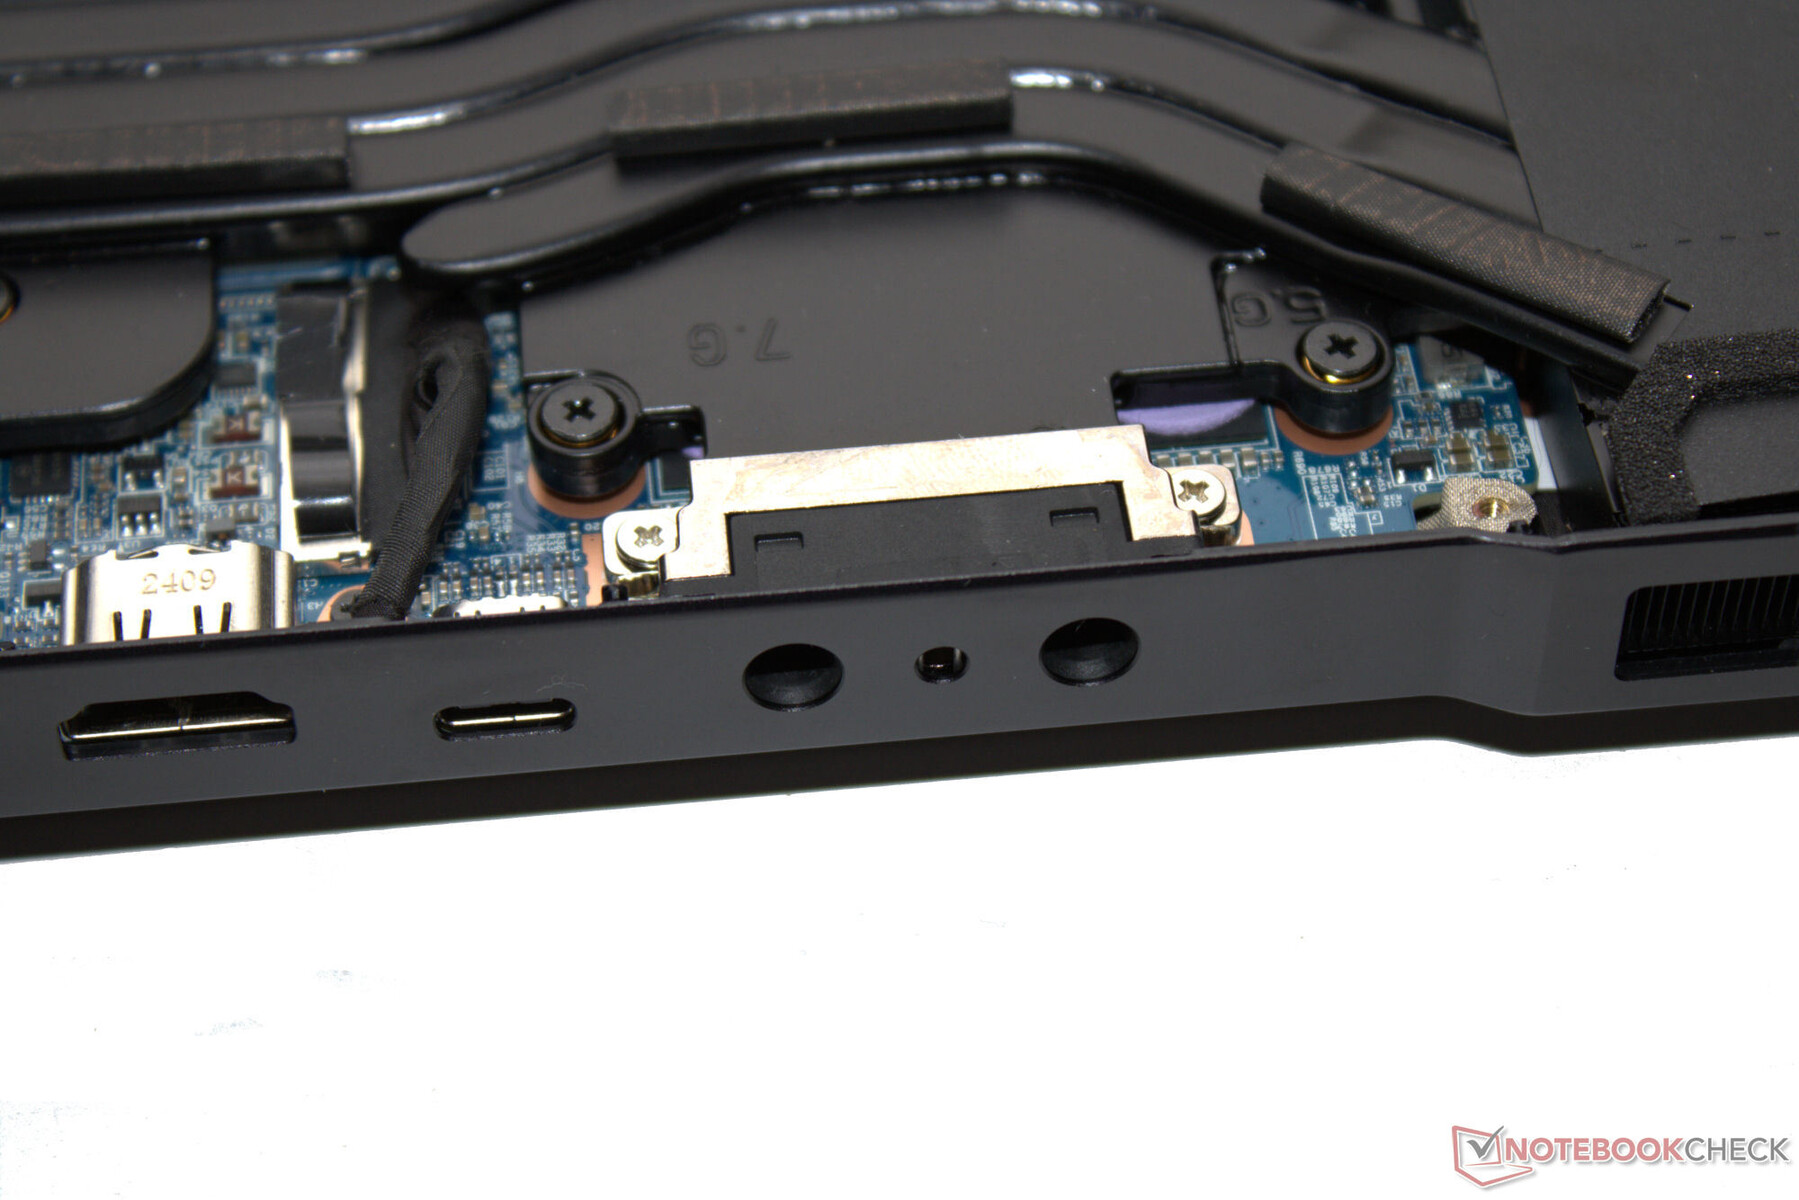
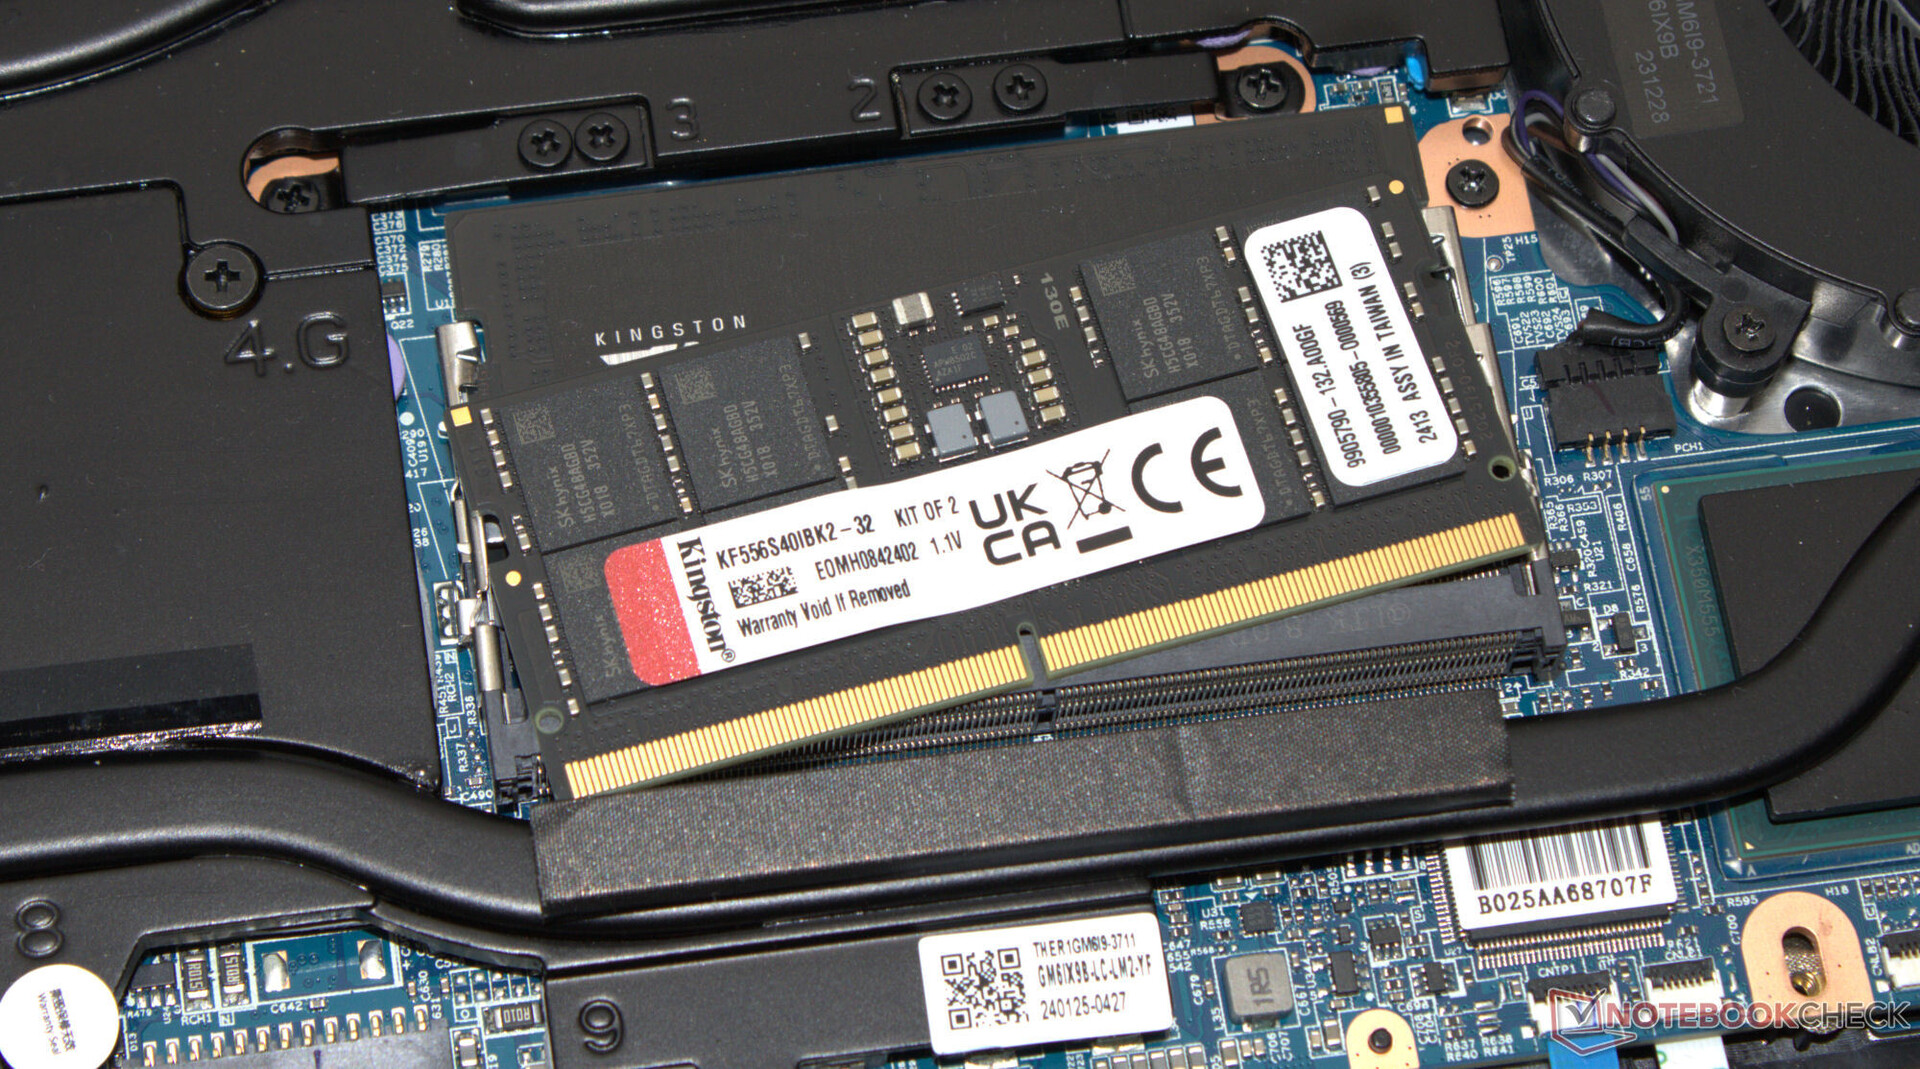
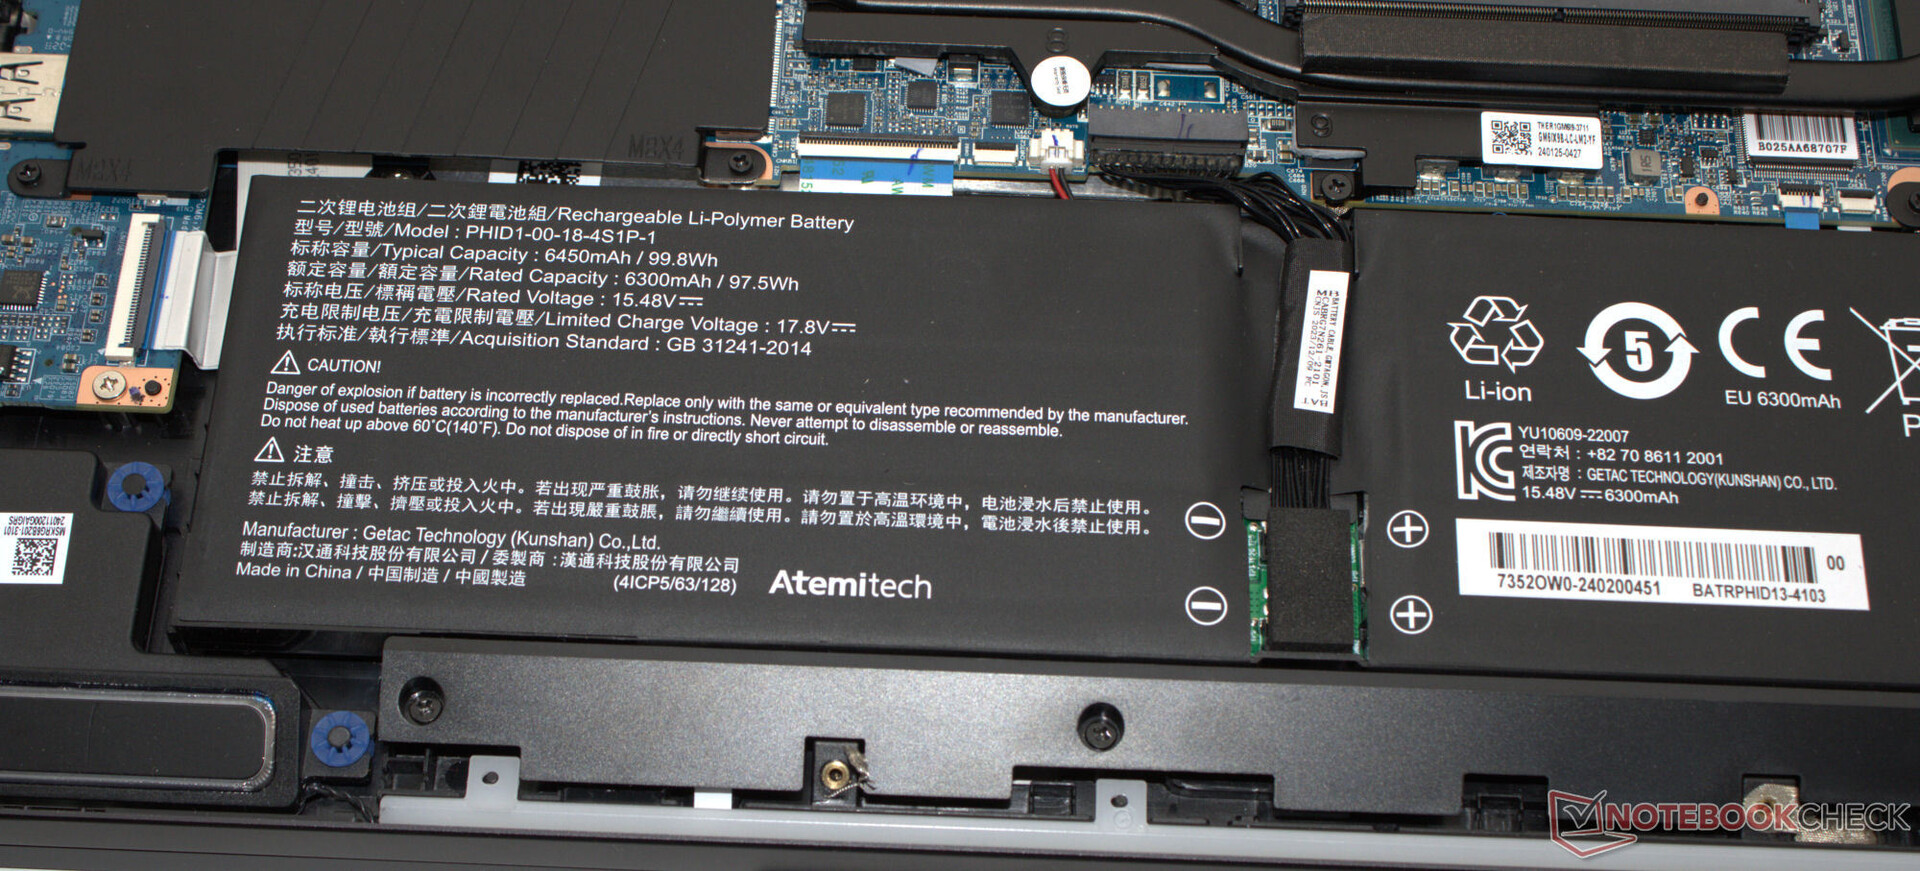
卸下设备底座上的所有螺丝后,可以用拨子弹或扁平刮刀将底盖分开。这样就可以看到内存组(两个都被占用)、风扇和电池。固态硬盘和固态硬盘插槽(PCIe 4、M.2 2280)以及 Wi-Fi 模块则由额外的螺纹板覆盖。

保修
在欧盟,全球国际货运提供两年基本保修服务,包括取件服务和 6 个月快速维修服务(48 小时内维修)。36 个月的保修服务费用大约在 100 美元到 160 美元之间,具体取决于所选的快速维修期限。
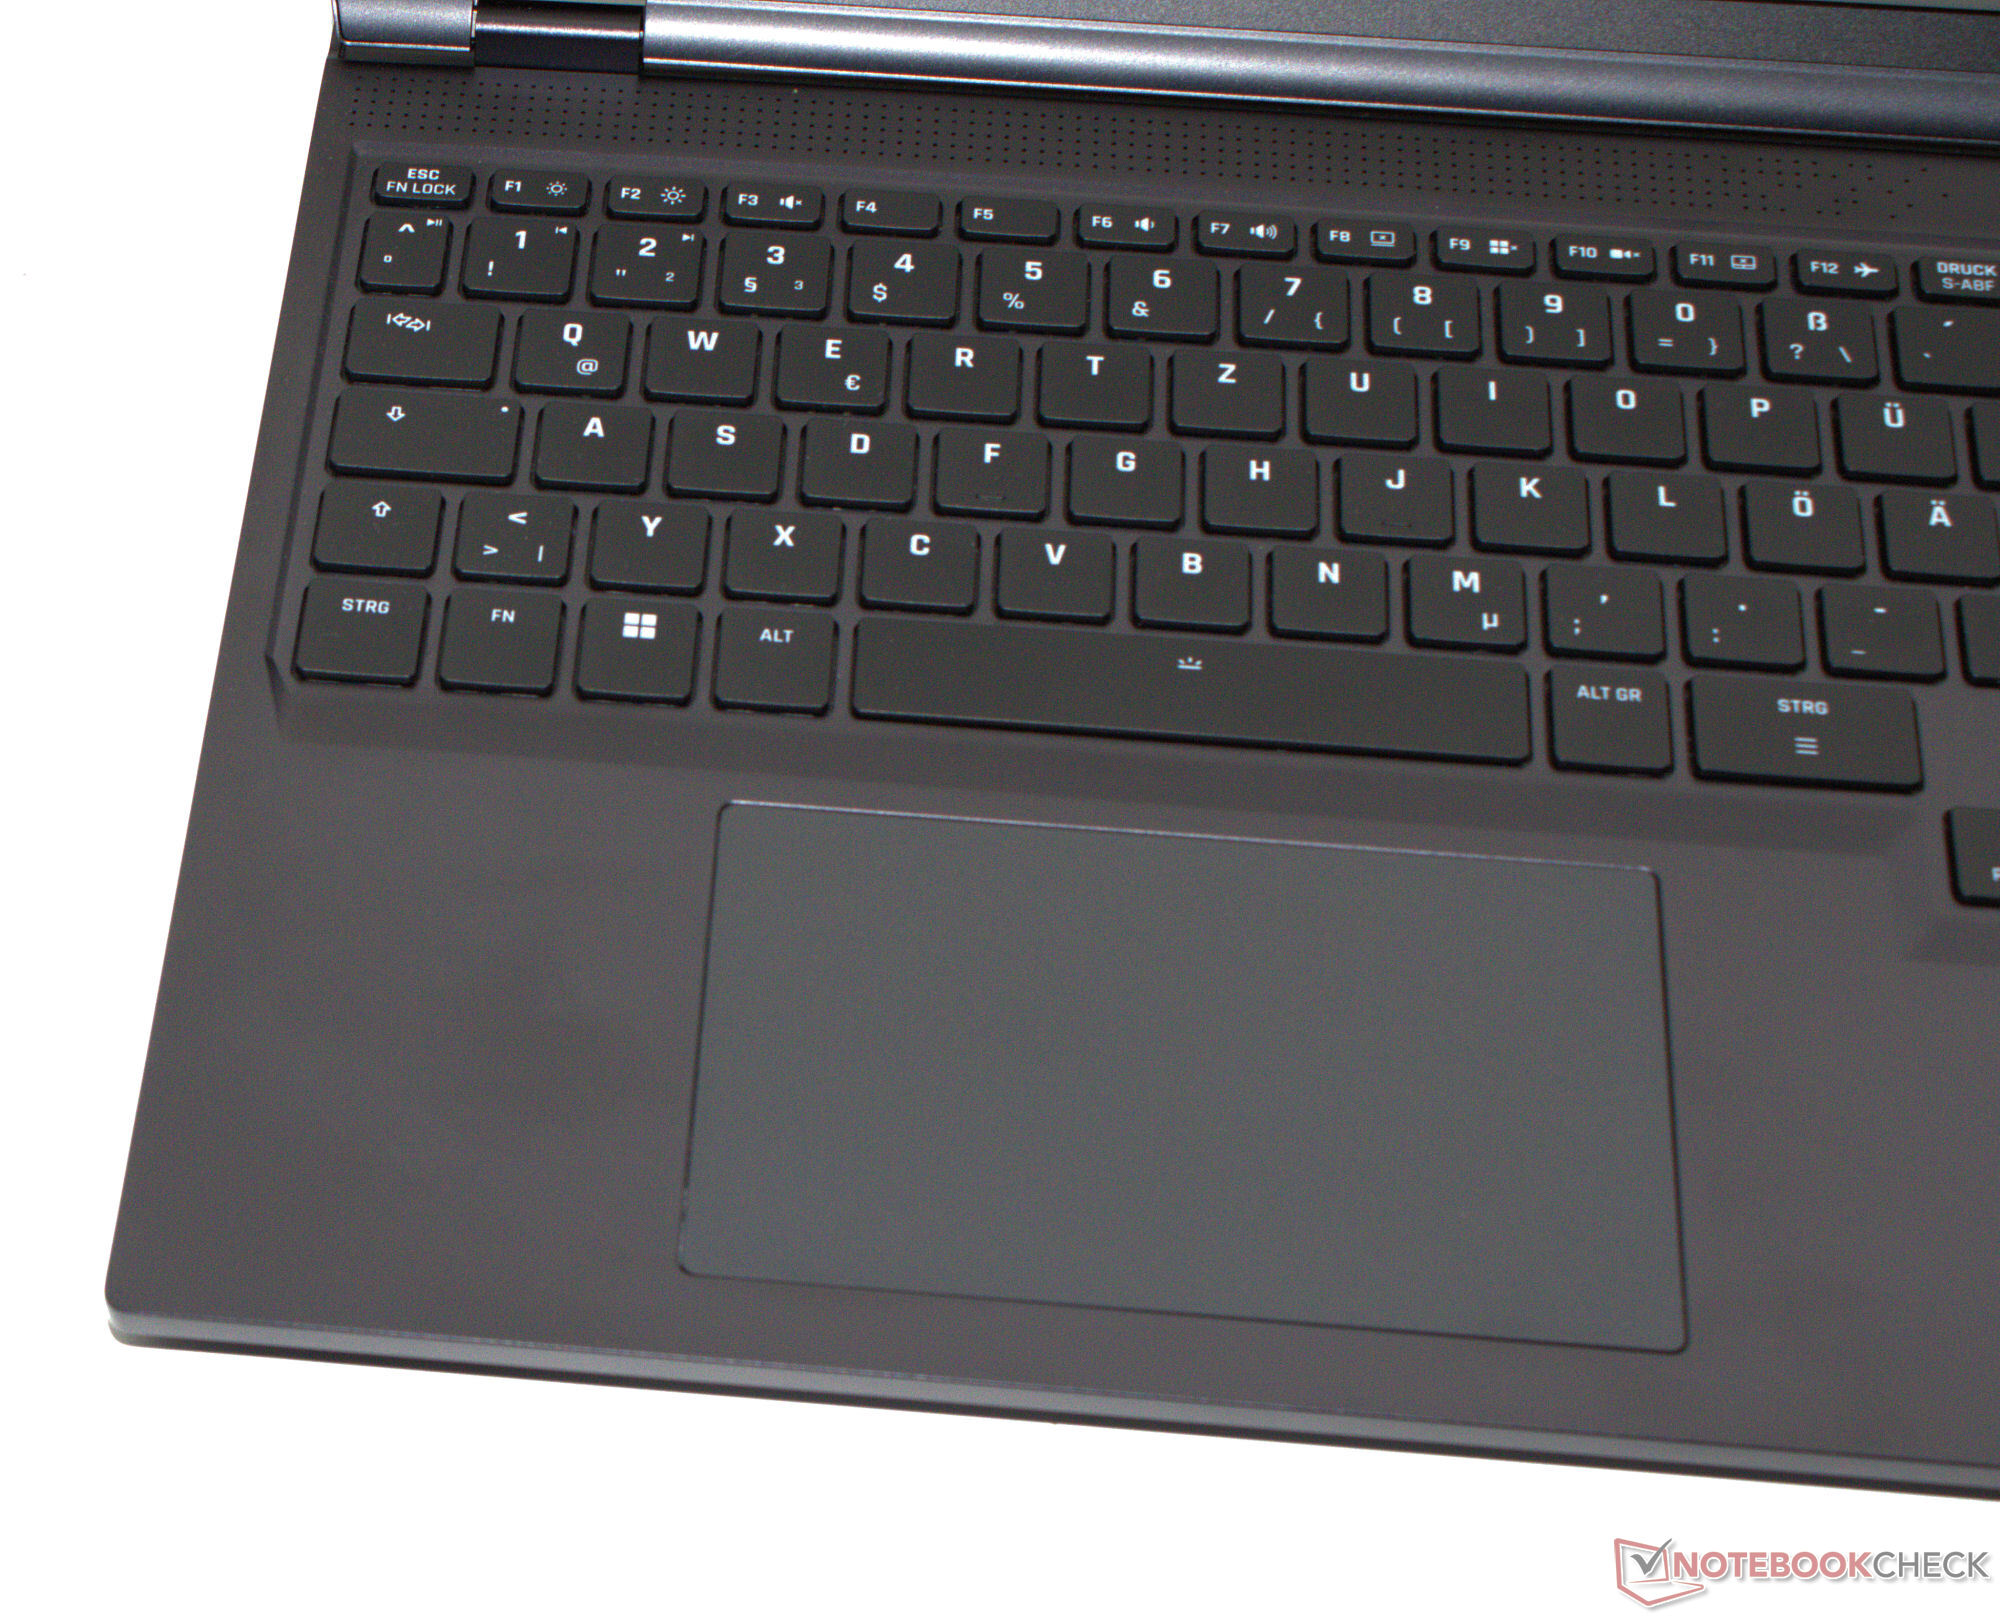
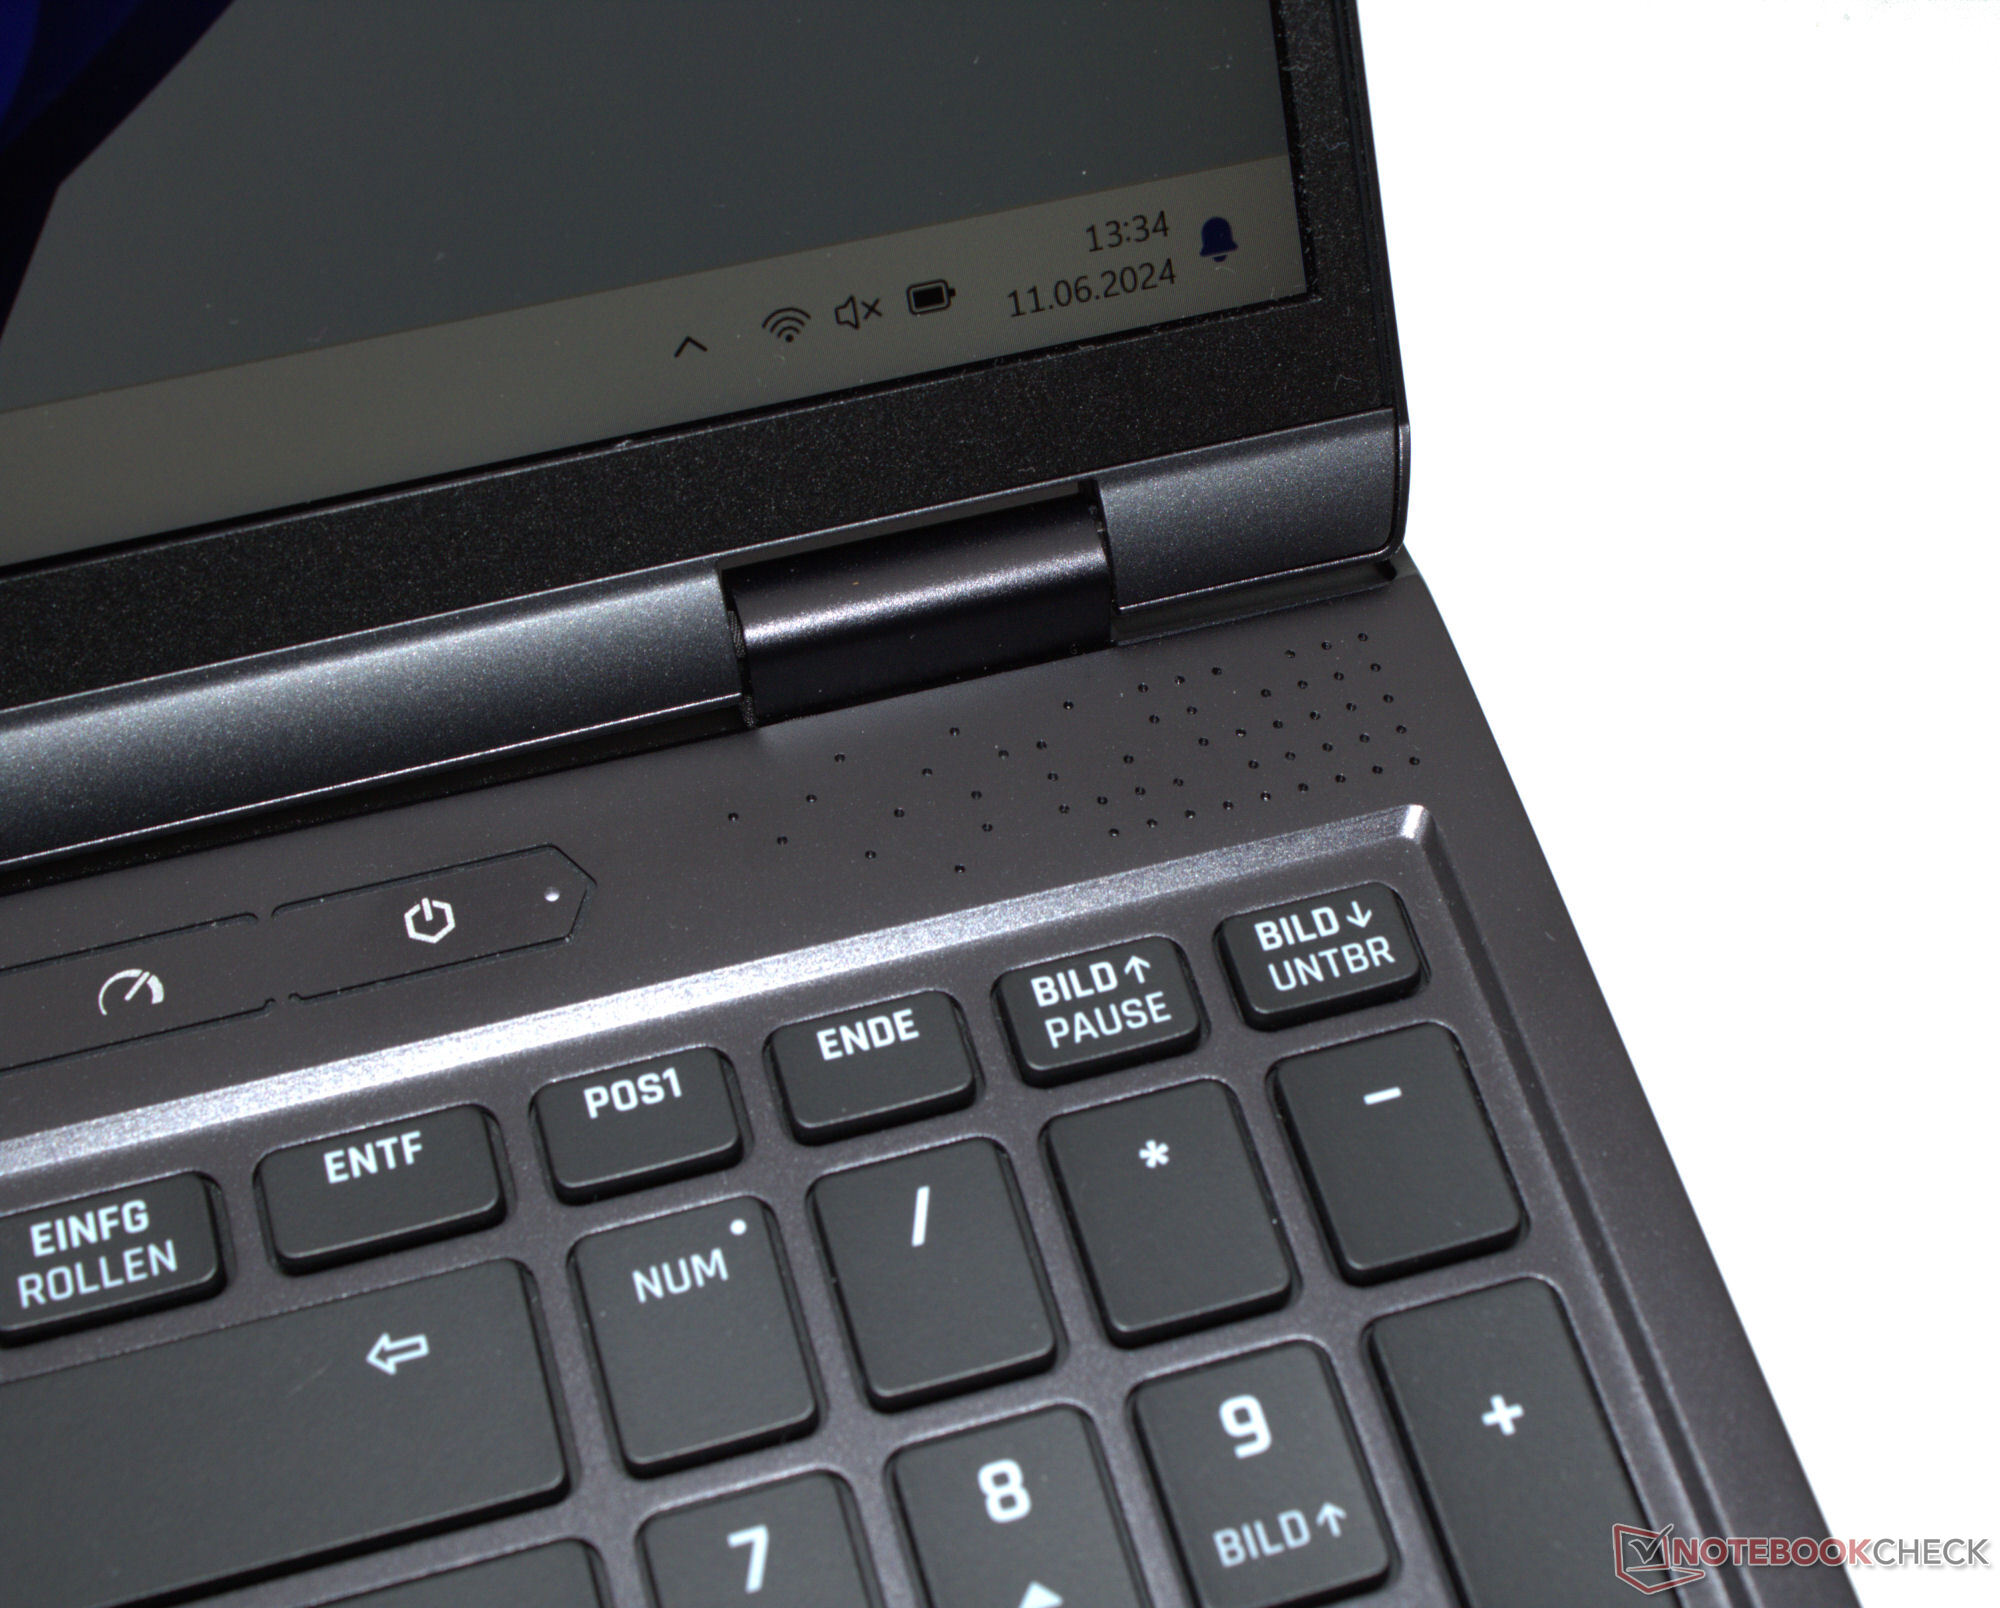
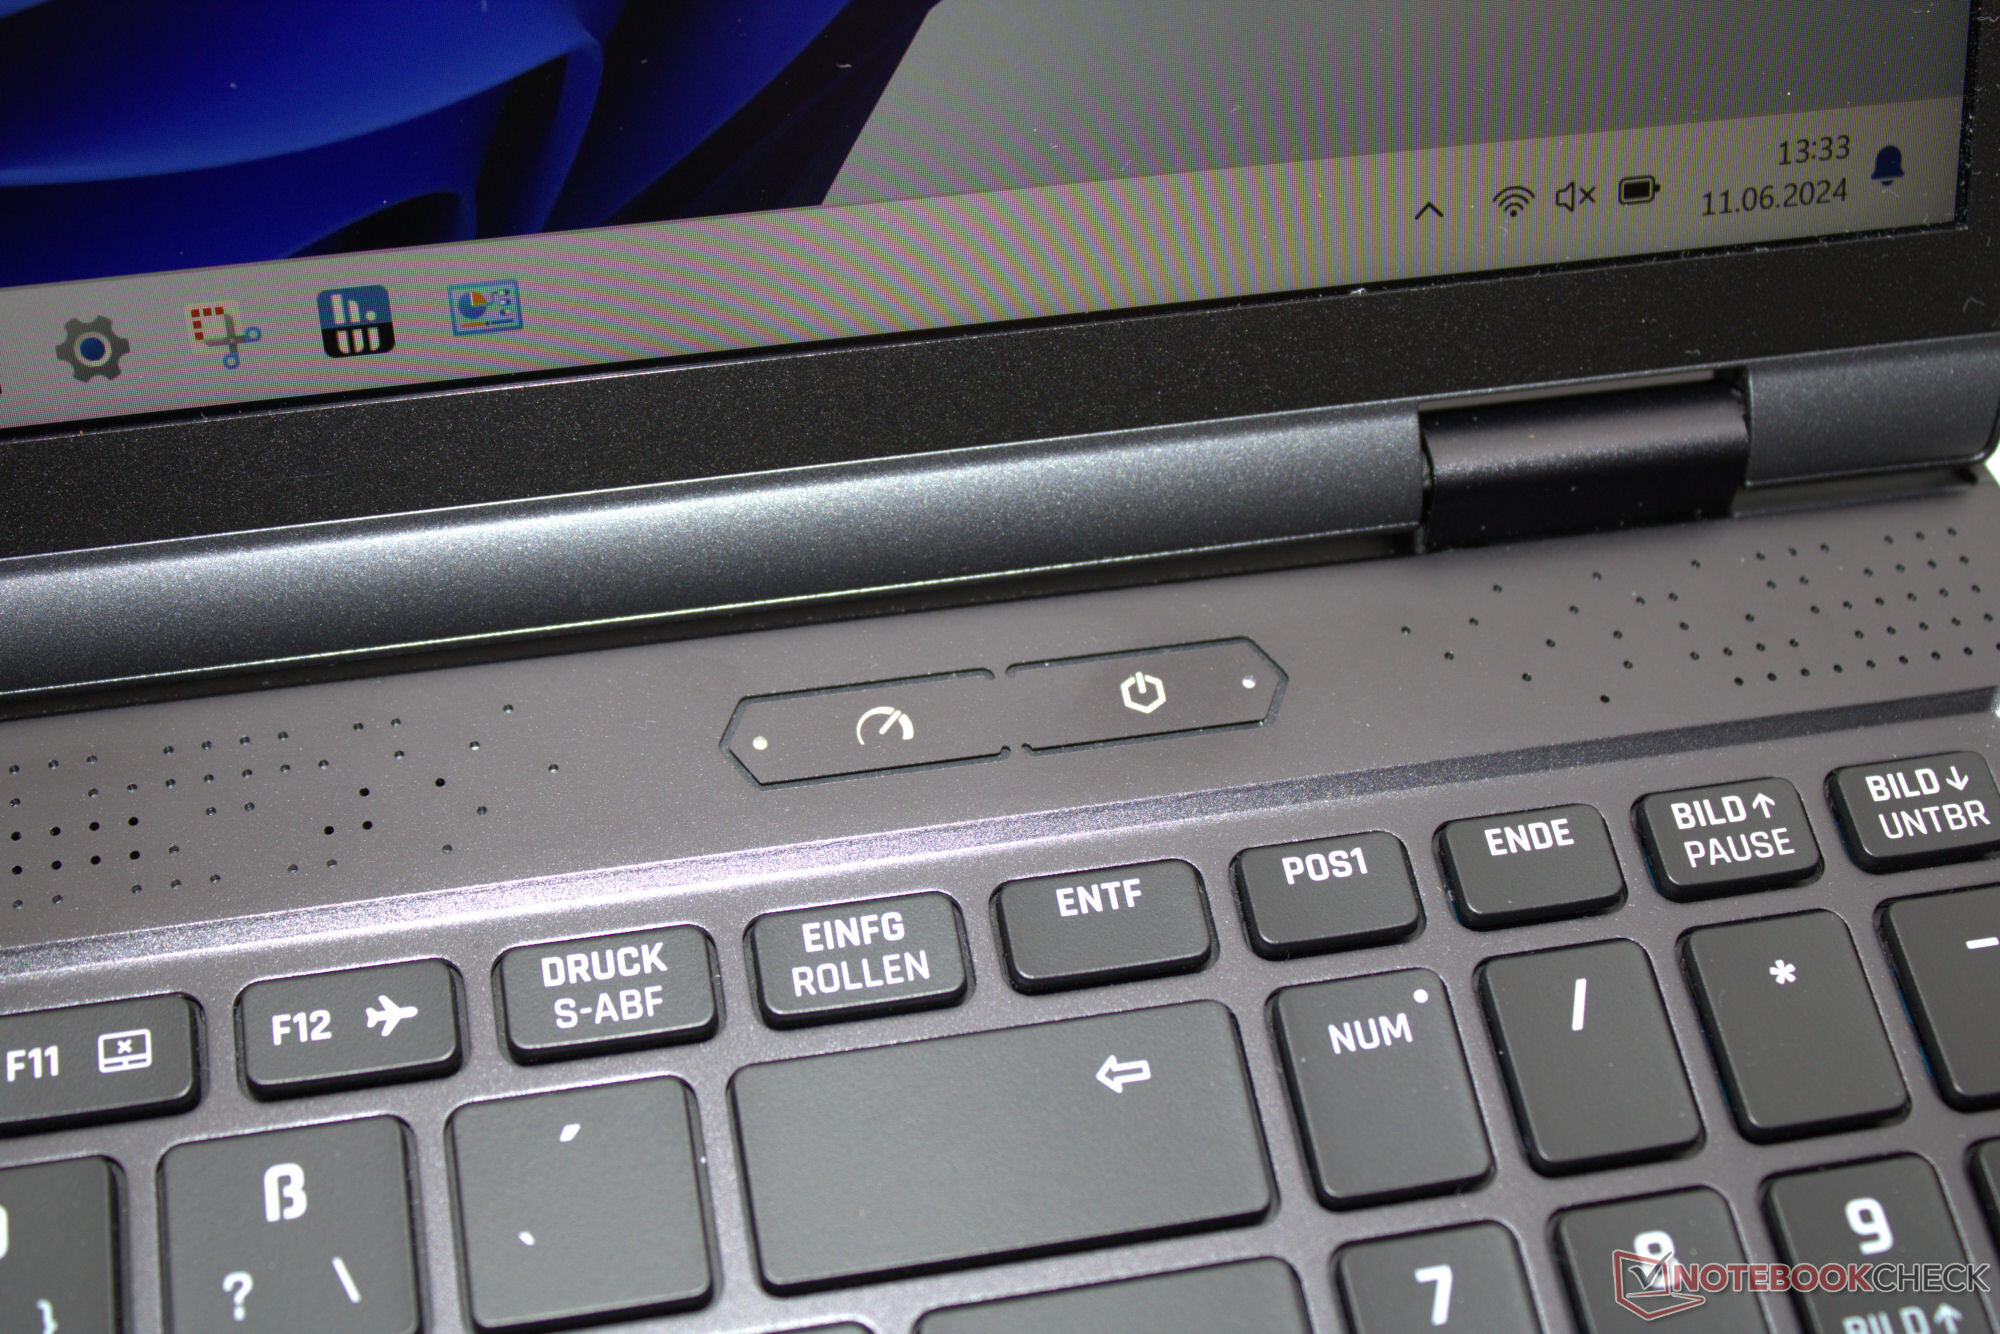
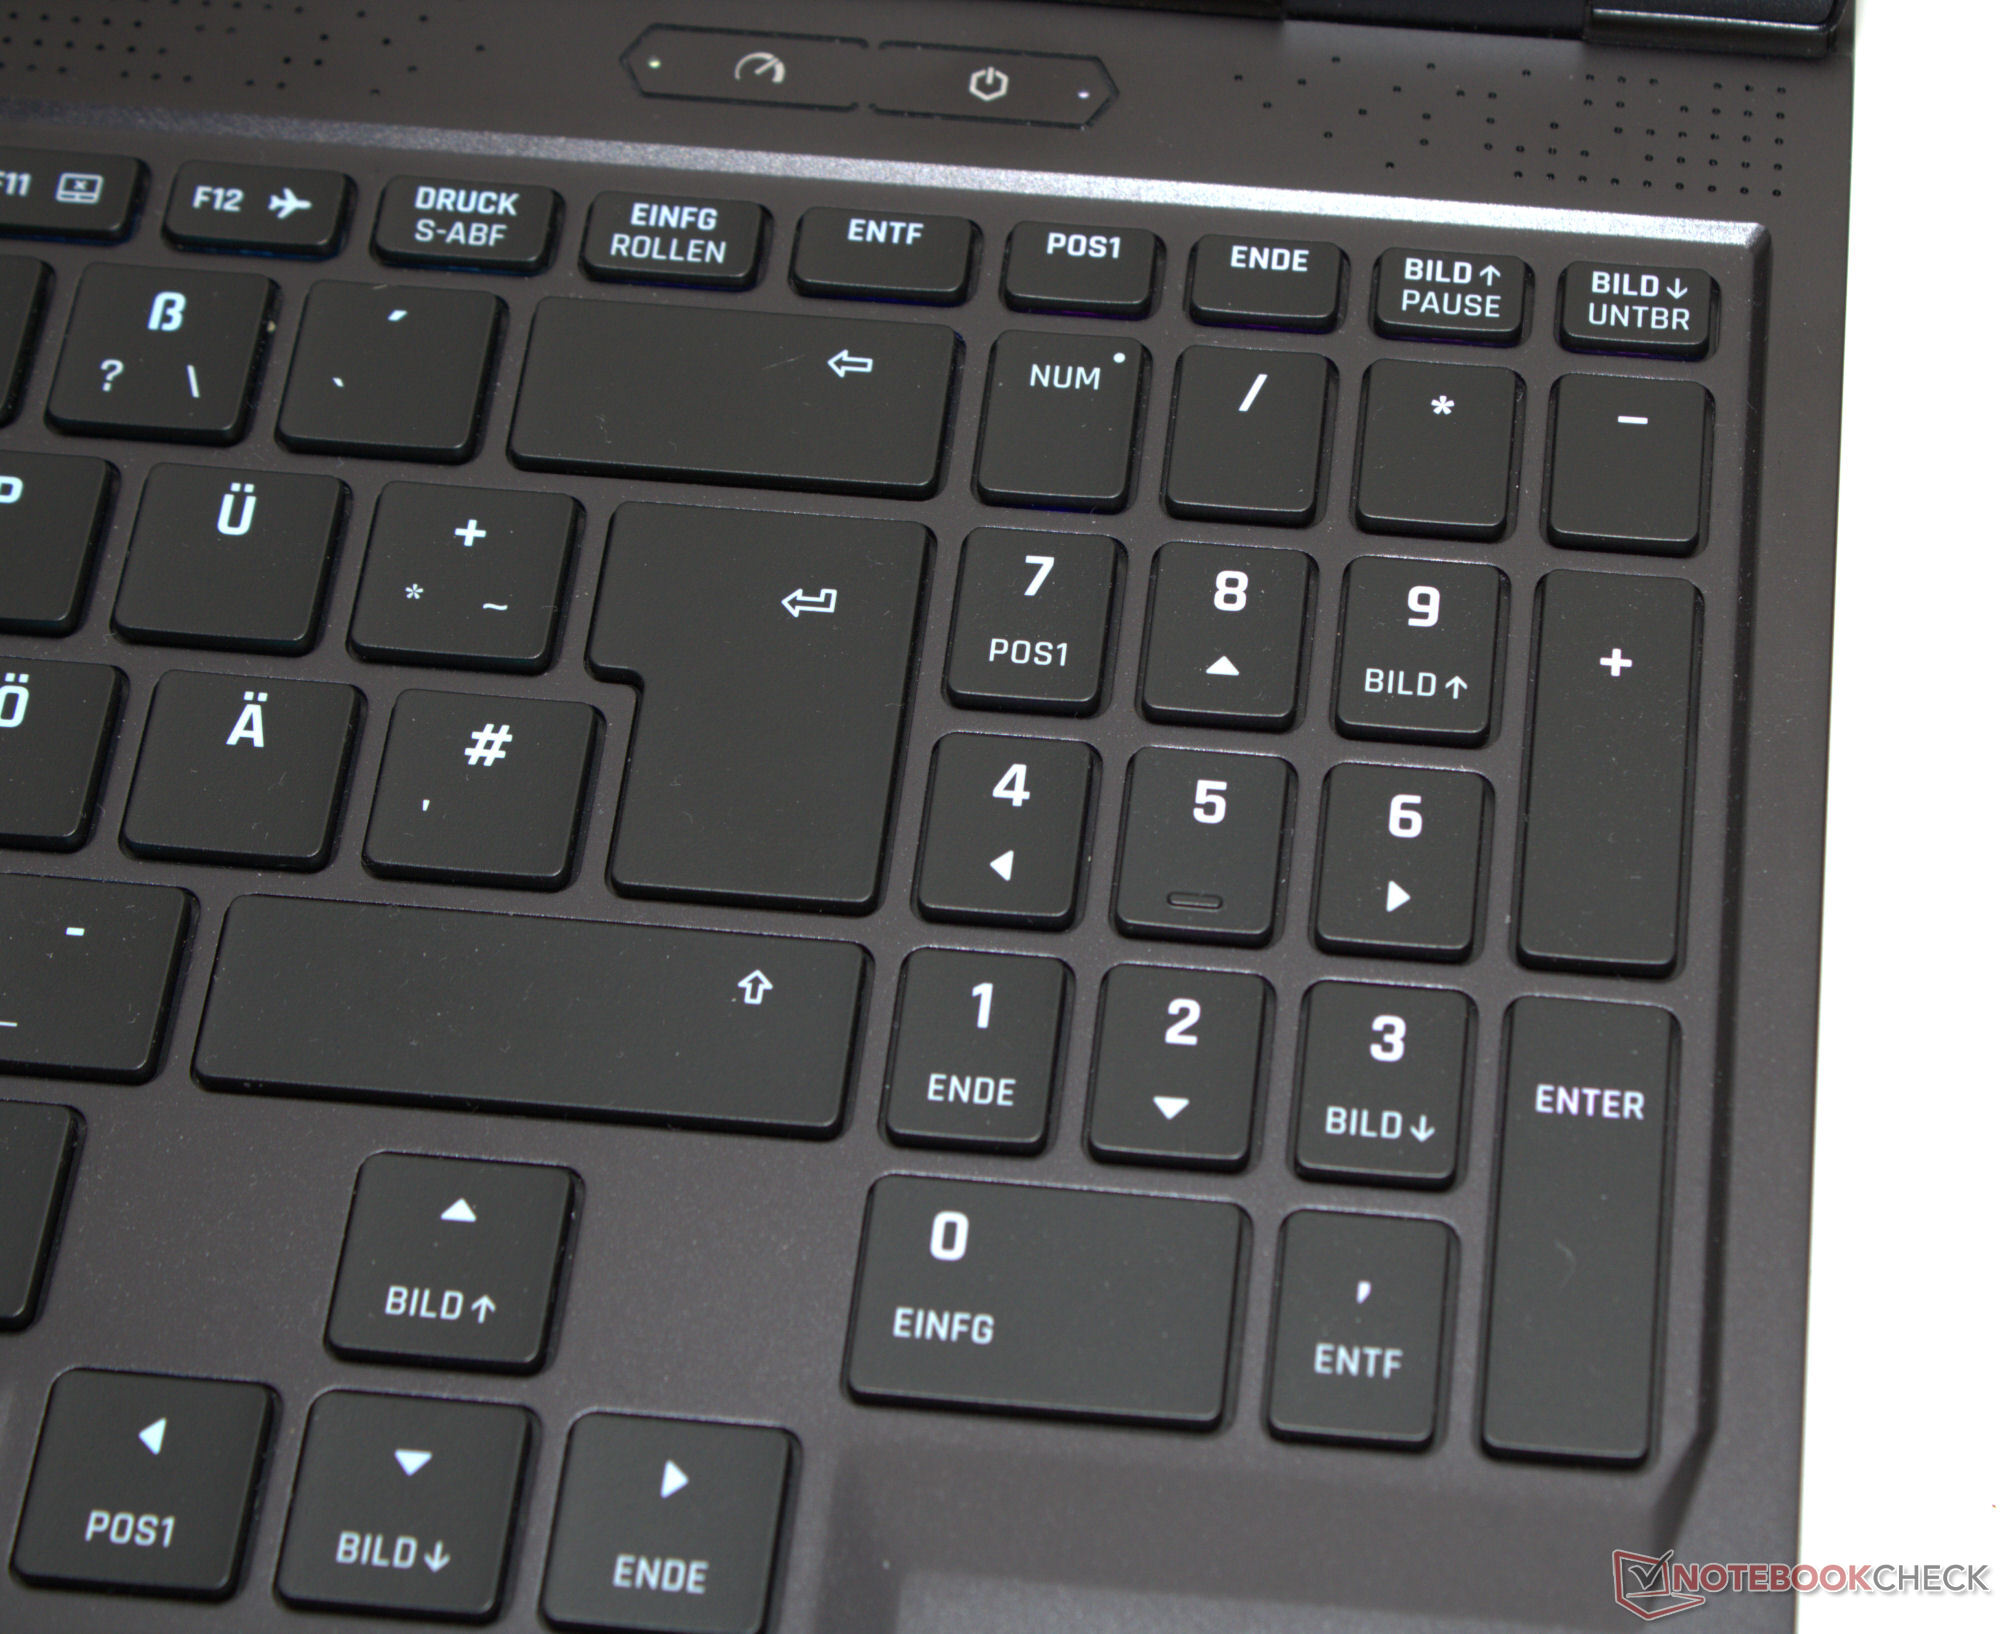
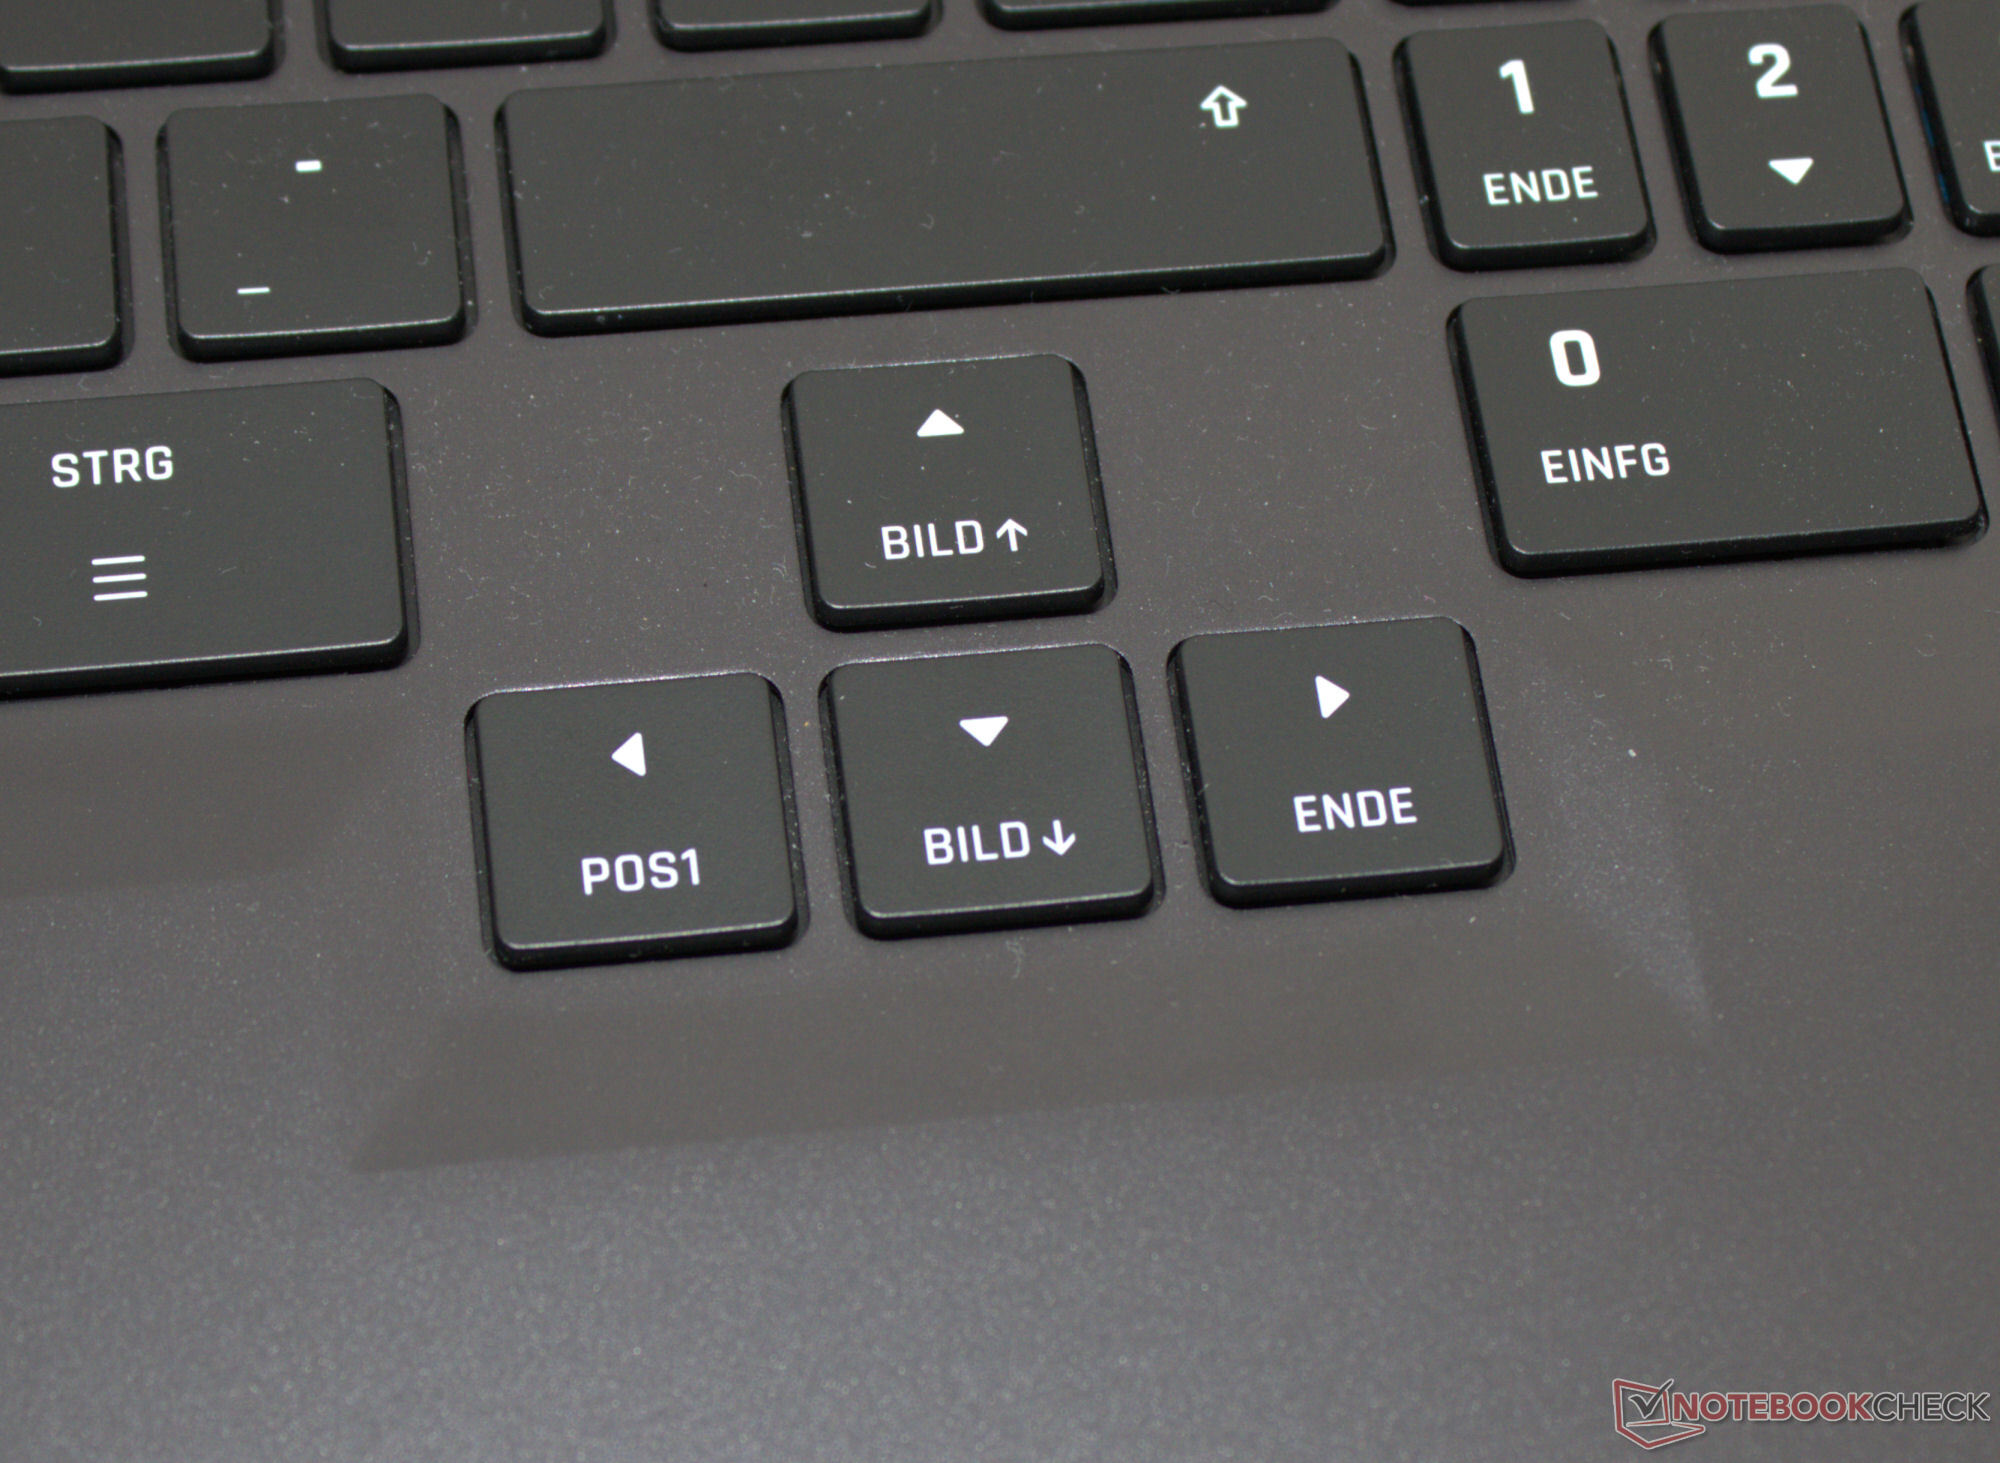
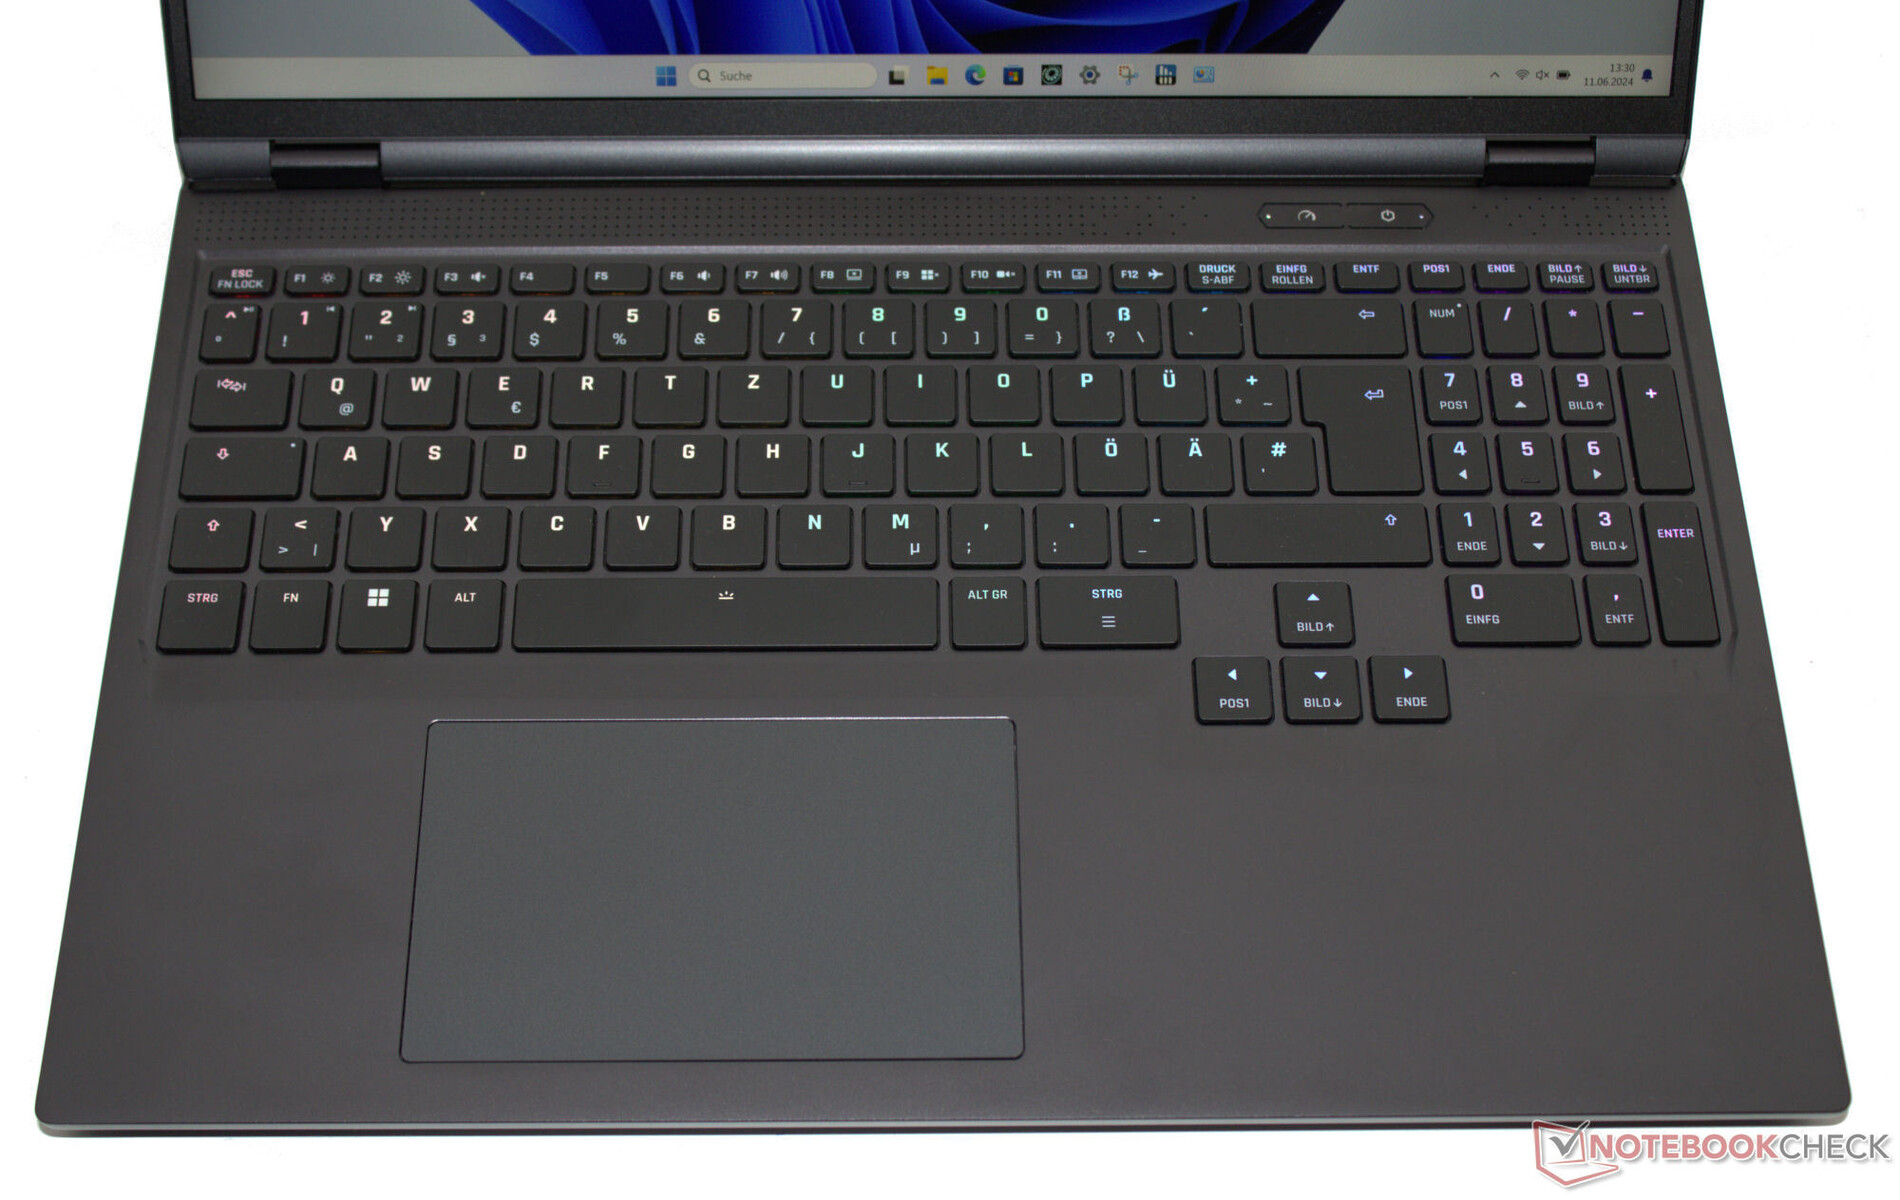
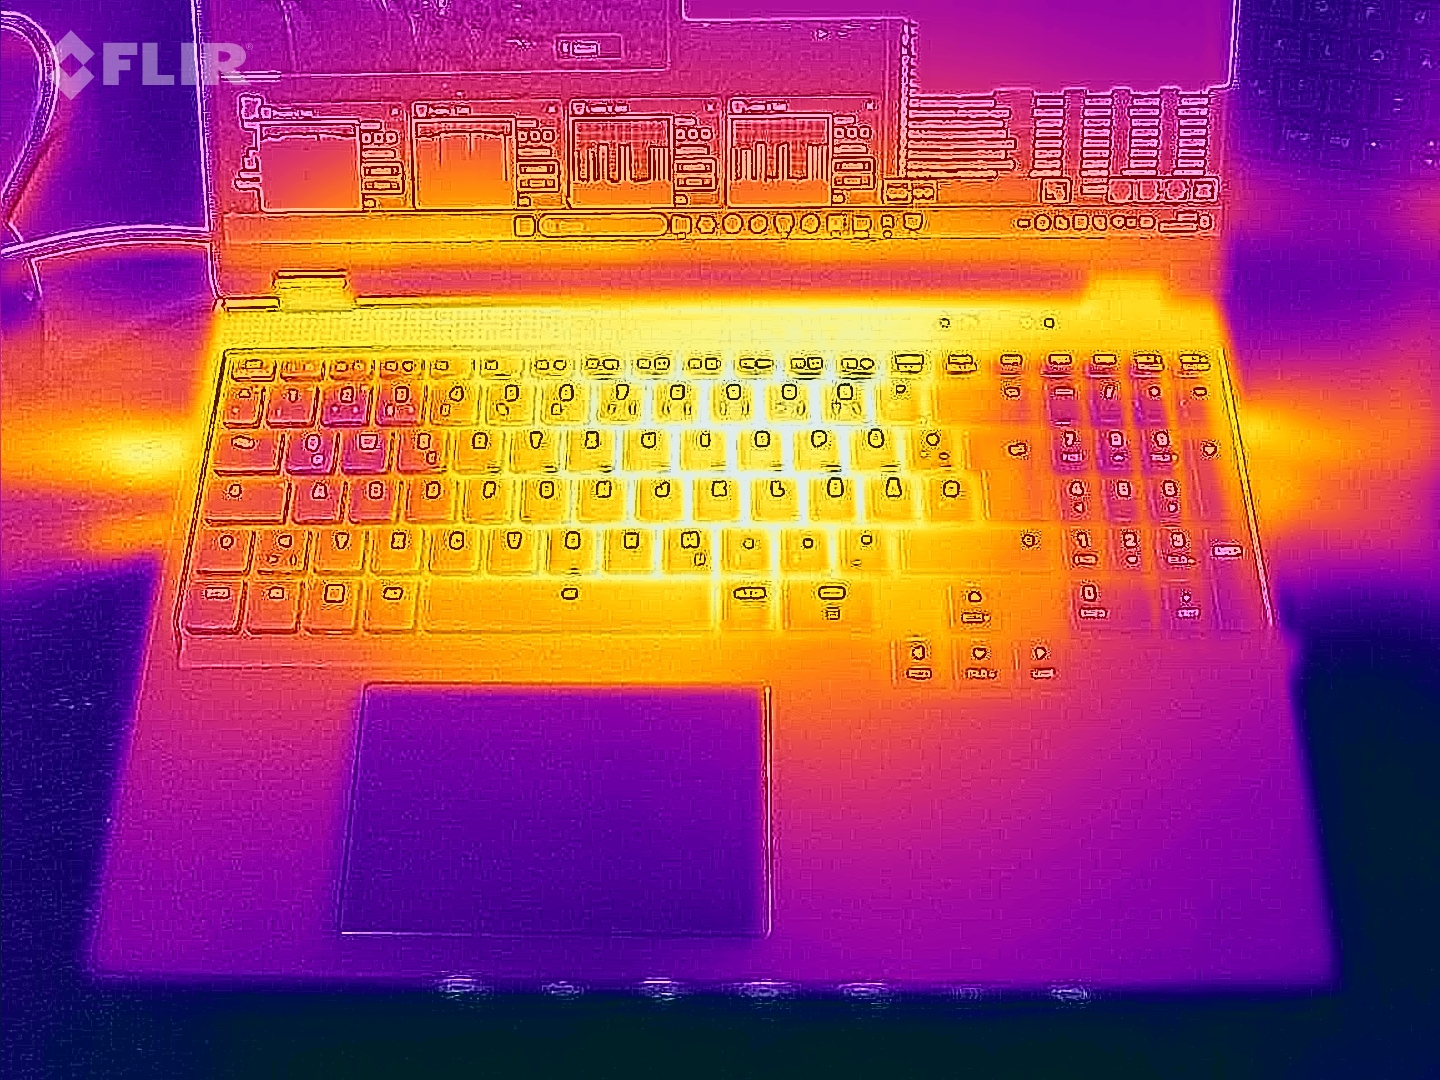
输入设备 - 带有独立按键照明的键盘
键盘
去年的 Neo 16 可以选配机械键盘,但现在的机型只配备了chiclet 键盘。键盘覆盖了笔记本电脑的整个宽度,还配备了数字键盘和独立按键照明(RGB)。凹面弧形按键的键程适中,按压点清晰,阻力适中。键入时键盘不会弯曲。值得注意的是,偏离中心的全尺寸方向键使用起来非常舒适,这是对去年机型的改进。
触摸板
具有多点触控功能的点击板(约 12.3 x 7.7 厘米)是鼠标的替代品,其光滑的表面让执行轻扫手势变得易如反掌。它的行程短,压力点明显。
显示屏 - 申克选择了明亮的 IPS 面板
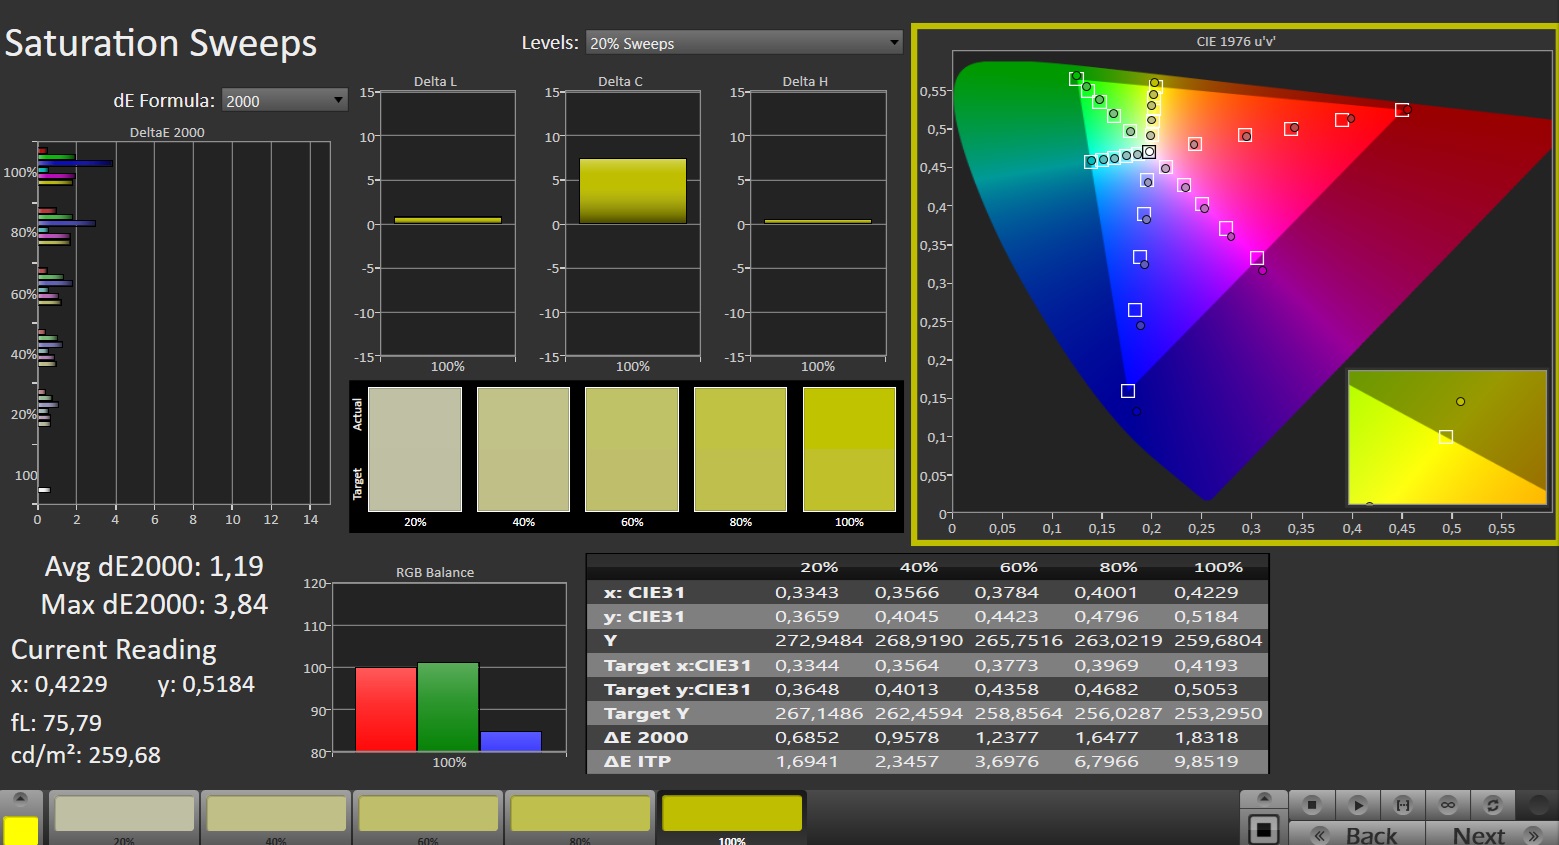
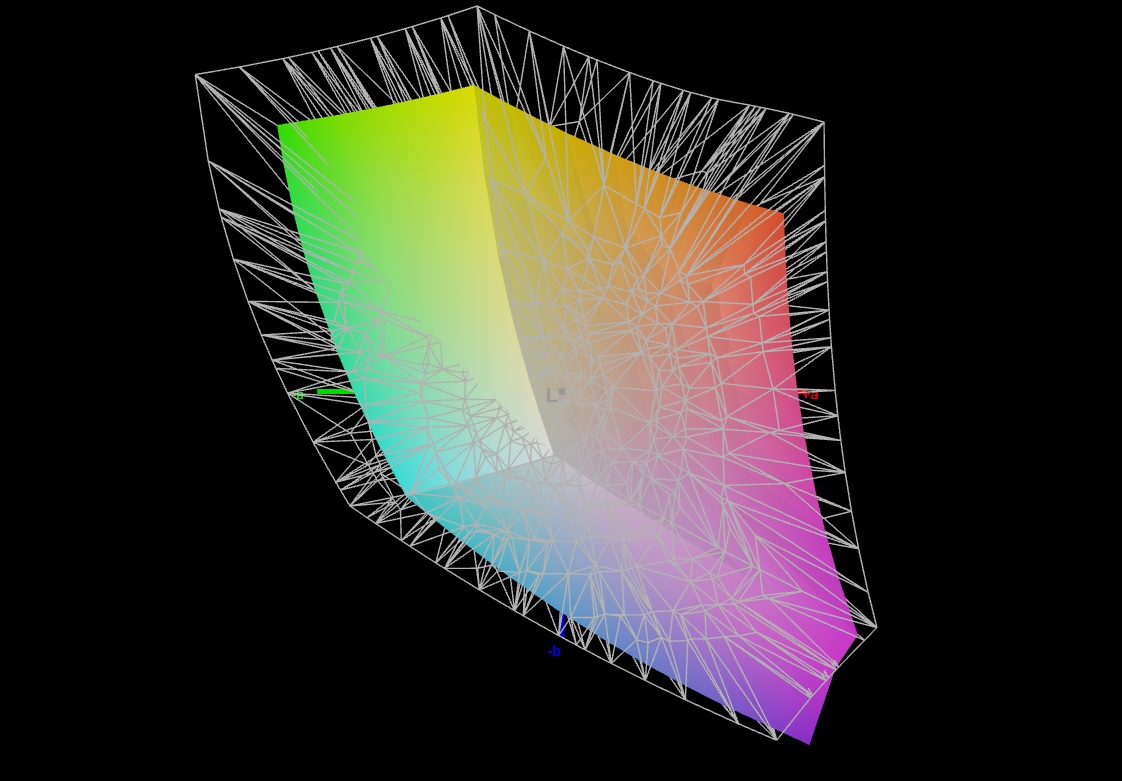
安装的 16 英寸显示屏(2,560 x 1,600 像素)在亮度(约 500 cd/m²)方面没有任何不足,但对比度(1.000:1)可以更高一些。在这方面 刀锋 16 的OLED 面板提供了更好的整体解决方案--由于其设计,它能提供出色的黑色值和对比度。一般来说,Neo 16 所达到的数据足以满足在室内使用该设备的需要。在室外,只要阳光不是太强烈,显示屏也是清晰可读的。一些积极的方面是,16:10、240 Hz 的面板(IPS、G-Sync)反应灵敏、视角稳定,无论亮度设置如何,都不会出现 PWM 闪烁。没有其他显示屏可供选择。

| |||||||||||||||||||||||||
Brightness Distribution: 85 %
Center on Battery: 530 cd/m²
Contrast: 1000:1 (Black: 0.53 cd/m²)
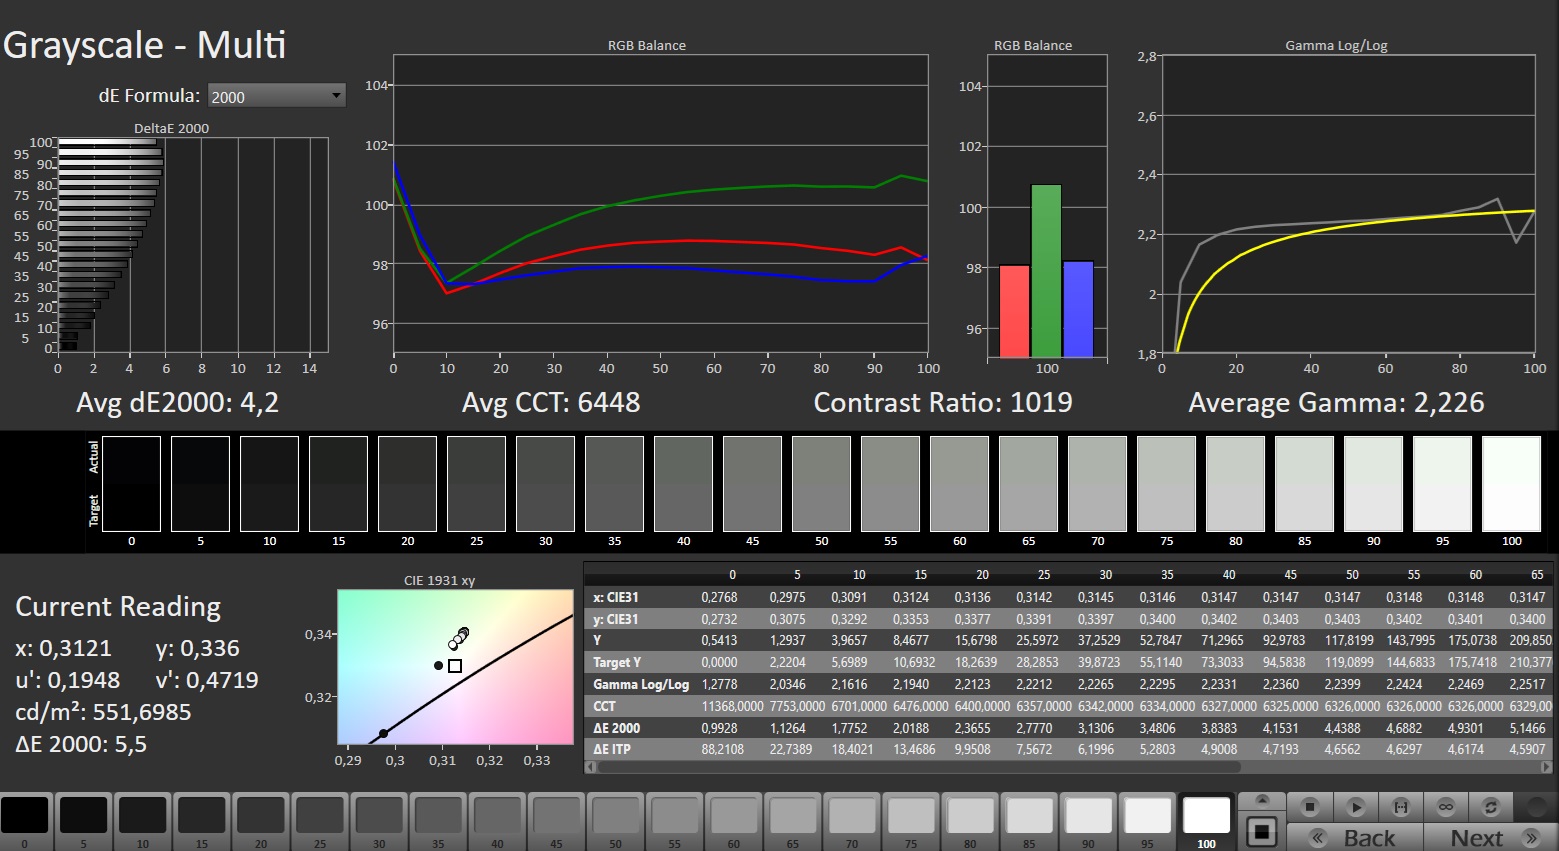
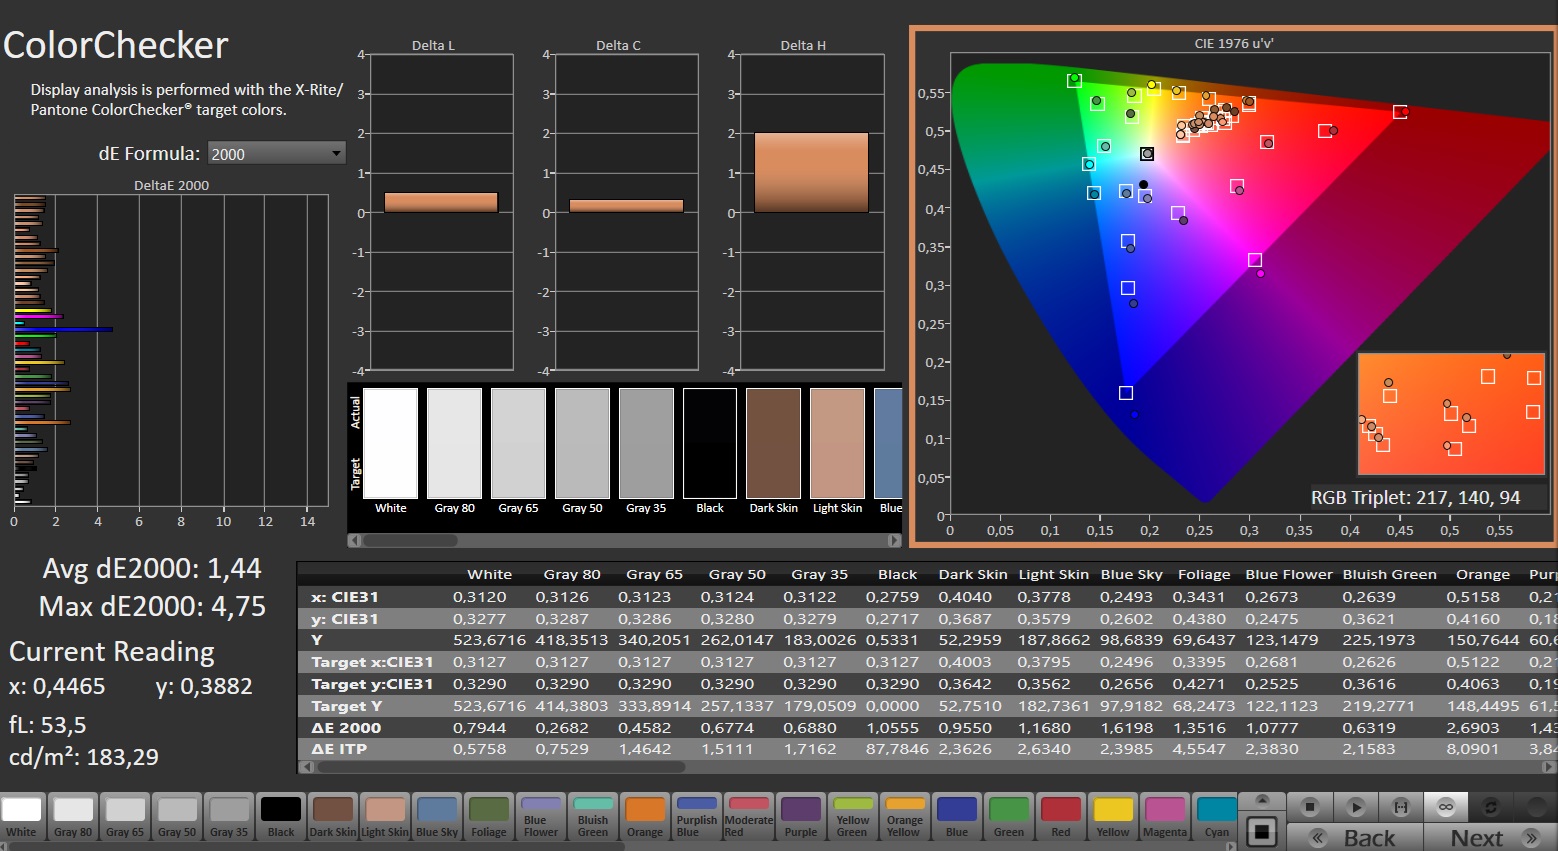
ΔE ColorChecker Calman: 3.21 | ∀{0.5-29.43 Ø4.75}
calibrated: 1.44
ΔE Greyscale Calman: 4.2 | ∀{0.09-98 Ø4.99}
70.6% AdobeRGB 1998 (Argyll 3D)
98% sRGB (Argyll 3D)
70.2% Display P3 (Argyll 3D)
Gamma: 2.226
CCT: 6448 K
| Schenker XMG Neo 16 (Early 24) BOE NE160QDM-NZA, IPS, 2560x1600, 16" | Razer Blade 16 2024, RTX 4090 Samsung SDC41AB (ATNA60DL03-0), OLED, 2560x1600, 16" | Medion Erazer Beast X40 2024 BOE NE170QDM-NZ1, IPS, 2560x1600, 17" | Schenker XMG Neo 16 E23 BOE0AF0 NE160QDM-NZ1, IPS, 2560x1600, 16" | |
|---|---|---|---|---|
| Display | 26% | -1% | -2% | |
| Display P3 Coverage (%) | 70.2 | 99.1 41% | 68.1 -3% | 67.3 -4% |
| sRGB Coverage (%) | 98 | 99.9 2% | 99.5 2% | 96.7 -1% |
| AdobeRGB 1998 Coverage (%) | 70.6 | 95.6 35% | 69 -2% | 68.9 -2% |
| Response Times | 95% | -20% | -49% | |
| Response Time Grey 50% / Grey 80% * (ms) | 11.2 ? | 0.24 ? 98% | 11.7 ? -4% | 14.5 ? -29% |
| Response Time Black / White * (ms) | 5.1 ? | 0.4 ? 92% | 6.9 ? -35% | 8.6 ? -69% |
| PWM Frequency (Hz) | 960 | |||
| Screen | 251% | 25% | 15% | |
| Brightness middle (cd/m²) | 530 | 418 -21% | 422 -20% | 372 -30% |
| Brightness (cd/m²) | 497 | 420 -15% | 388 -22% | 349 -30% |
| Brightness Distribution (%) | 85 | 98 15% | 87 2% | 88 4% |
| Black Level * (cd/m²) | 0.53 | 0.02 96% | 0.42 21% | 0.32 40% |
| Contrast (:1) | 1000 | 20900 1990% | 1005 0% | 1163 16% |
| Colorchecker dE 2000 * | 3.21 | 1.07 67% | 1.42 56% | 2.06 36% |
| Colorchecker dE 2000 max. * | 5.8 | 4.04 30% | 1.97 66% | 3 48% |
| Colorchecker dE 2000 calibrated * | 1.44 | 1.07 26% | 0.7 51% | 1.5 -4% |
| Greyscale dE 2000 * | 4.2 | 1.12 73% | 1.2 71% | 1.9 55% |
| Gamma | 2.226 99% | 2.29 96% | 2.078 106% | 2.312 95% |
| CCT | 6448 101% | 6417 101% | 6581 99% | 6747 96% |
| Total Average (Program / Settings) | 124% /
181% | 1% /
13% | -12% /
2% |
* ... smaller is better
开箱即用,显示屏的色彩再现效果不错:DeltaE 为 3.2,偏离目标值(DeltaE < 3)。校准后,偏差值降至 1.44,这是一个不错的数字。在所有标准色彩空间(AdobeRGB、sRGB、DCI P3)中,该面板与 Erazer Beast X40 的显示屏一样,几乎只能完全显示 sRGB 空间。能显示所有三种色彩空间的是 Blade 16 的 OLED 面板。 刀锋 16.
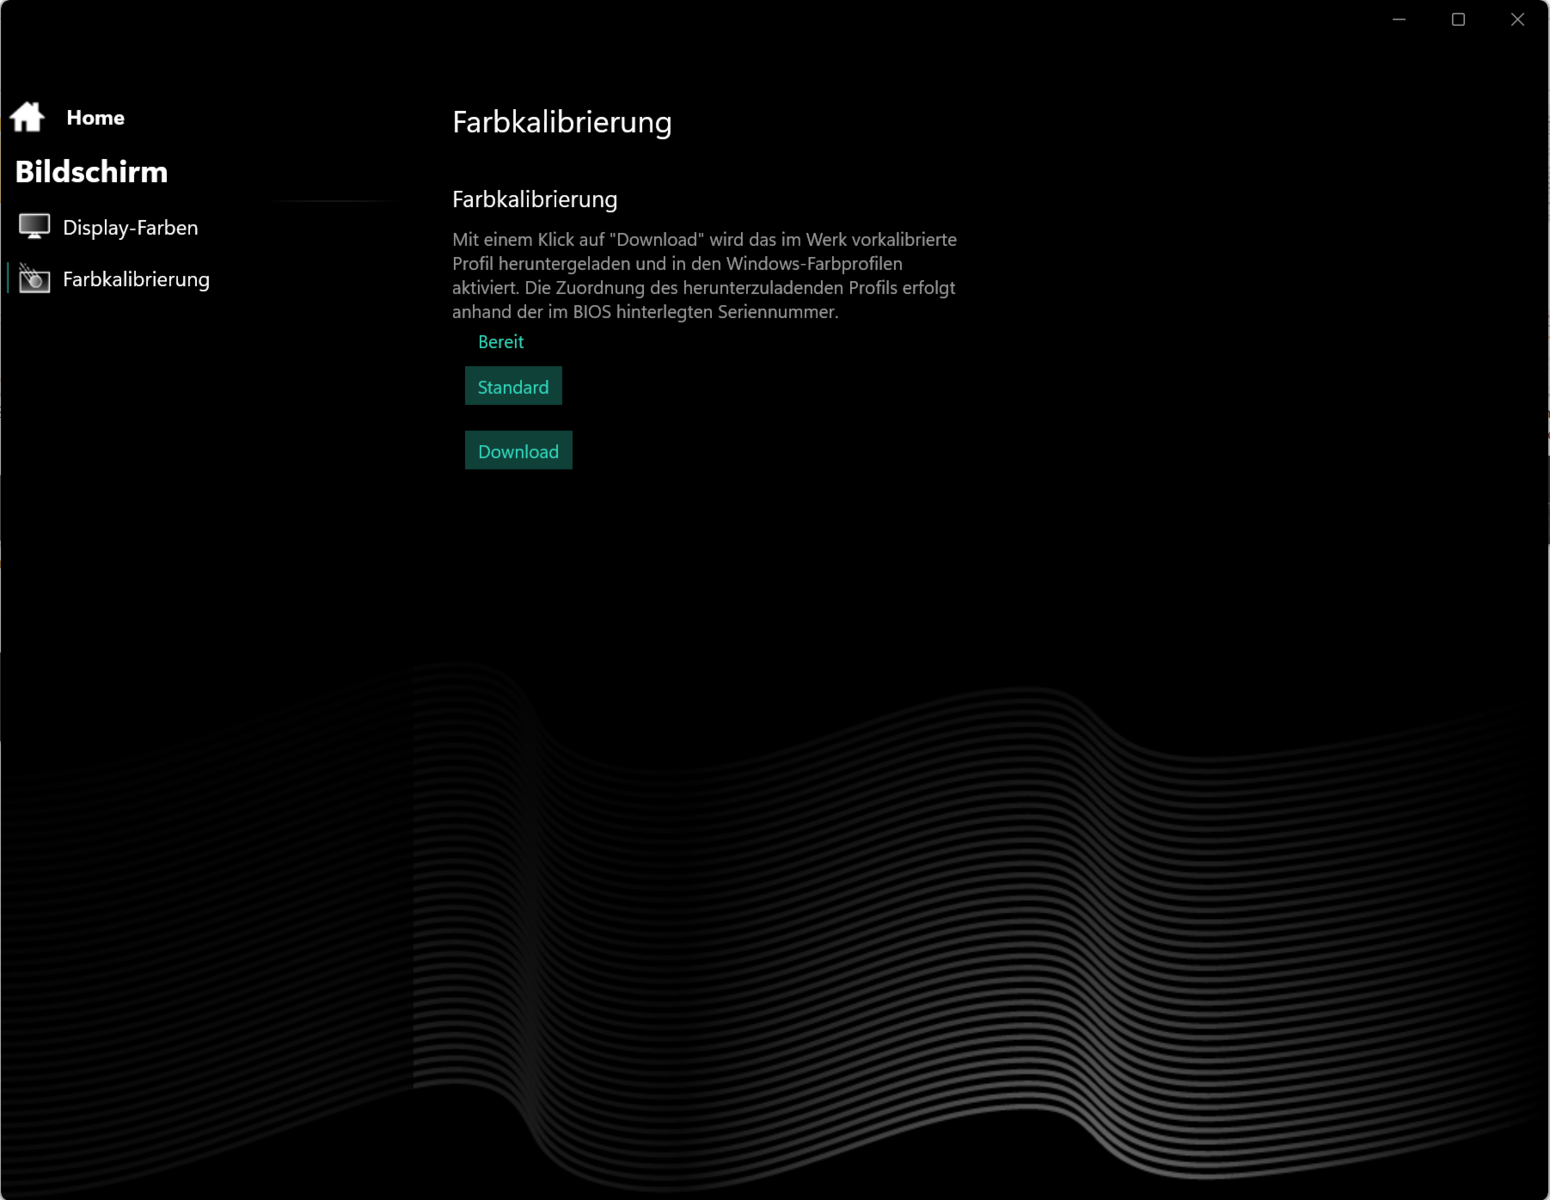
我们创建的色彩配置文件可以免费下载和使用。在显示屏的信息框中可以找到链接。
Display Response Times
| ↔ Response Time Black to White | ||
|---|---|---|
| 5.1 ms ... rise ↗ and fall ↘ combined | ↗ 1.6 ms rise | 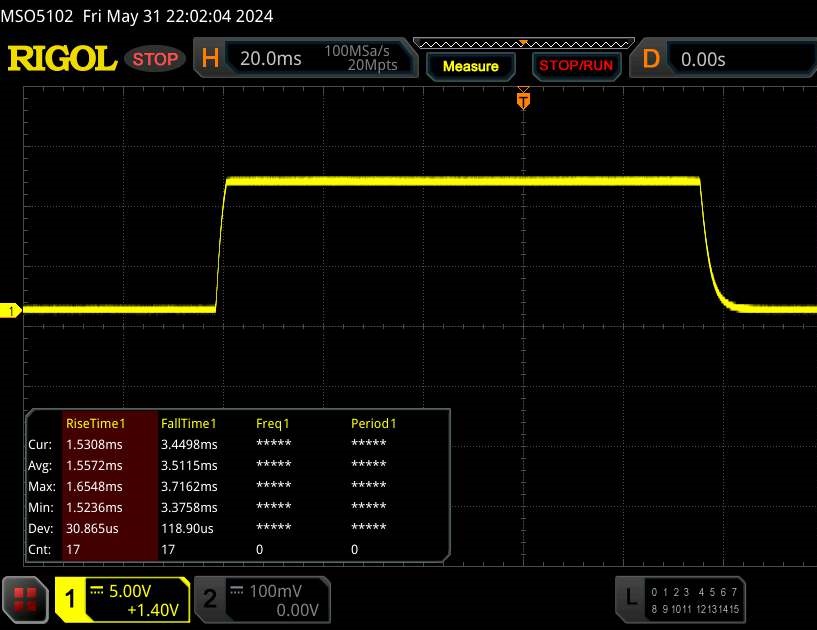 |
| ↘ 3.5 ms fall | ||
| The screen shows very fast response rates in our tests and should be very well suited for fast-paced gaming. In comparison, all tested devices range from 0.1 (minimum) to 240 (maximum) ms. » 17 % of all devices are better. This means that the measured response time is better than the average of all tested devices (20 ms). | ||
| ↔ Response Time 50% Grey to 80% Grey | ||
| 11.2 ms ... rise ↗ and fall ↘ combined | ↗ 5.2 ms rise | 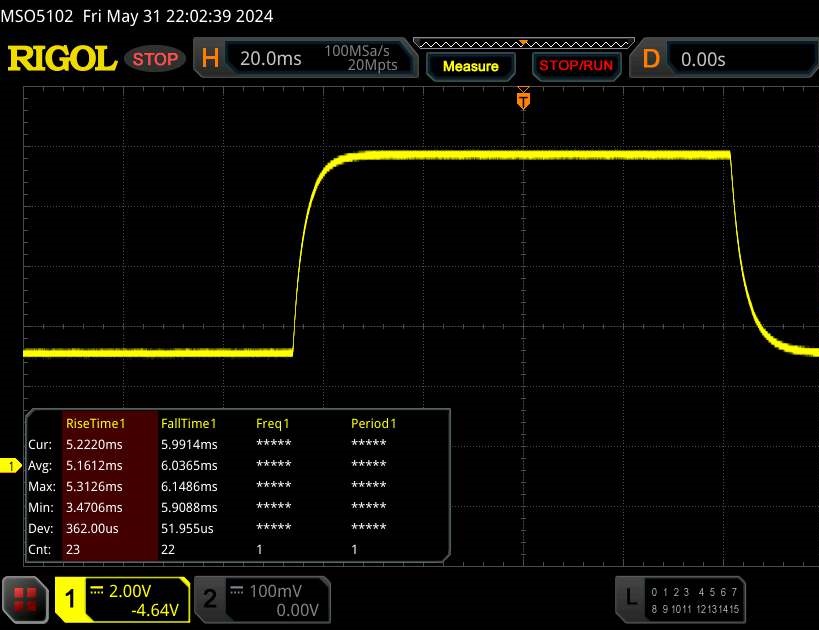 |
| ↘ 6 ms fall | ||
| The screen shows good response rates in our tests, but may be too slow for competitive gamers. In comparison, all tested devices range from 0.165 (minimum) to 636 (maximum) ms. » 24 % of all devices are better. This means that the measured response time is better than the average of all tested devices (31.3 ms). | ||
Screen Flickering / PWM (Pulse-Width Modulation)
| Screen flickering / PWM not detected | 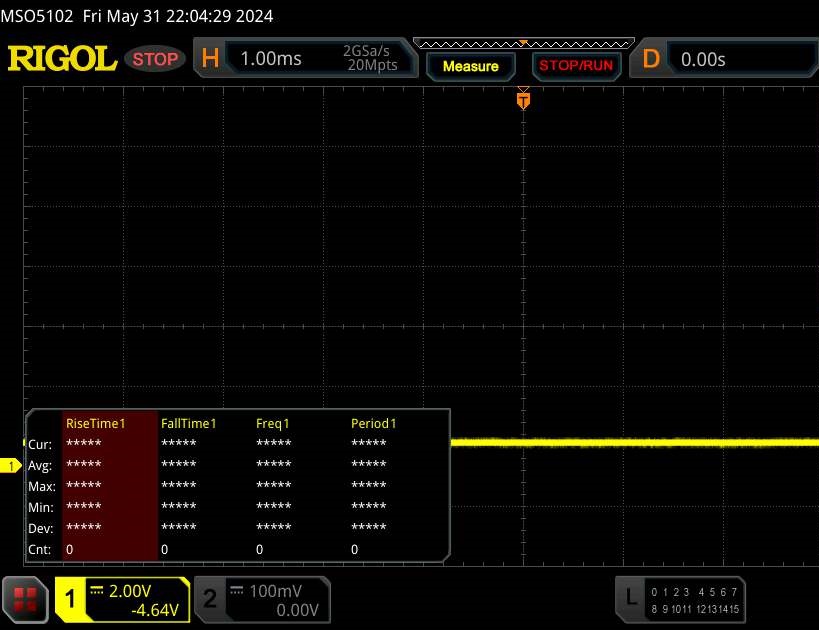 | ||
In comparison: 53 % of all tested devices do not use PWM to dim the display. If PWM was detected, an average of 7940 (minimum: 5 - maximum: 343500) Hz was measured. | |||
性能 - 猛禽湖和艾达-拉芙蕾丝确保了强大的动力
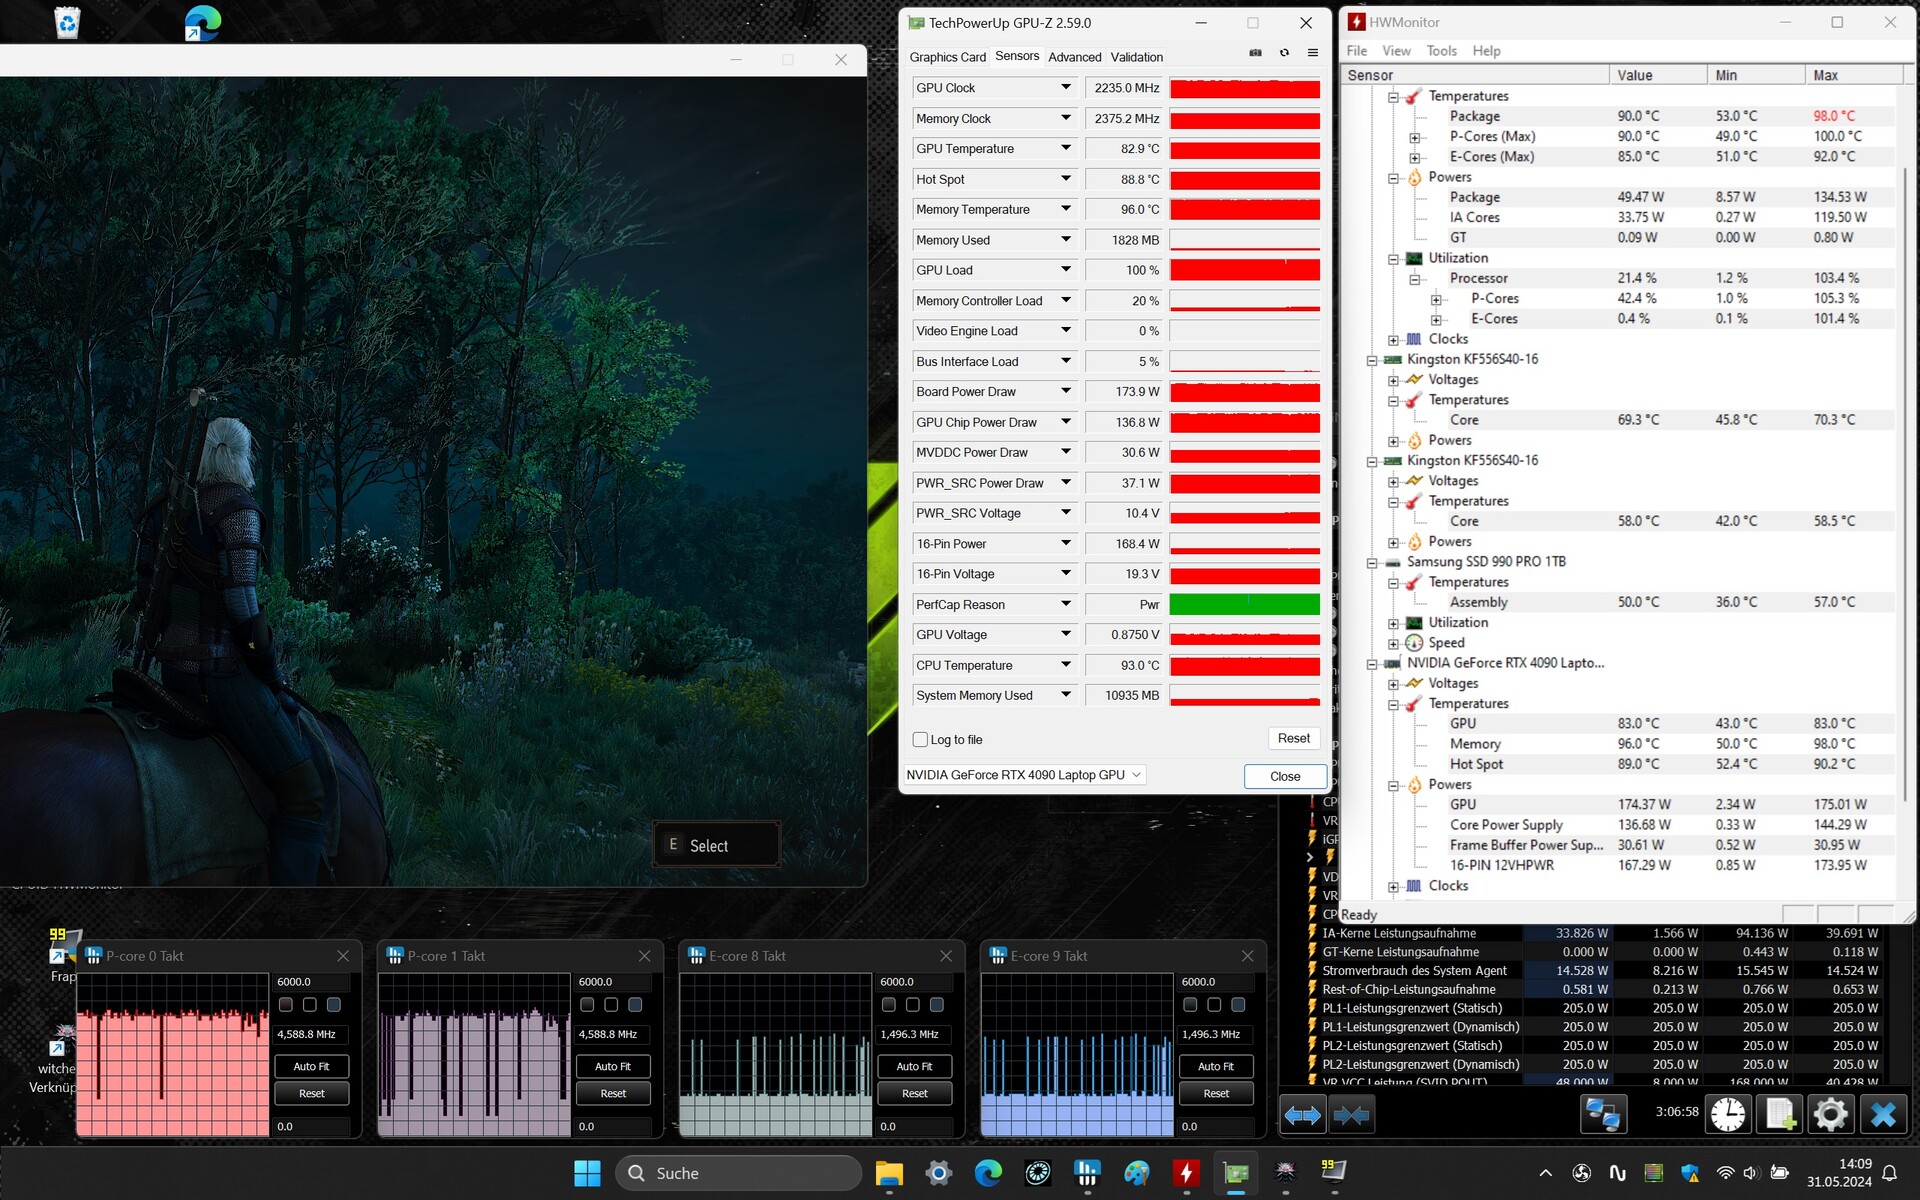
Neo 16(早期 24)面向游戏玩家、创作者以及所有需要强大性能的用户群体。每种规格都配备了酷睿 i9 14900HX,图形处理器从 RTX 4060 到 RTX 4090 不等,我们的型号是 RTX 4090。通过 Bestware.com(德语)可以进行个性化配置和购买笔记本电脑。我们这里的评测设备售价约为 4000 美元,入门级型号(RTX 4060)约为 2000 美元。RTX 4080 或 RTX 4090 Neo 16 型号可选配水冷系统(Oasis MK2)。
测试条件
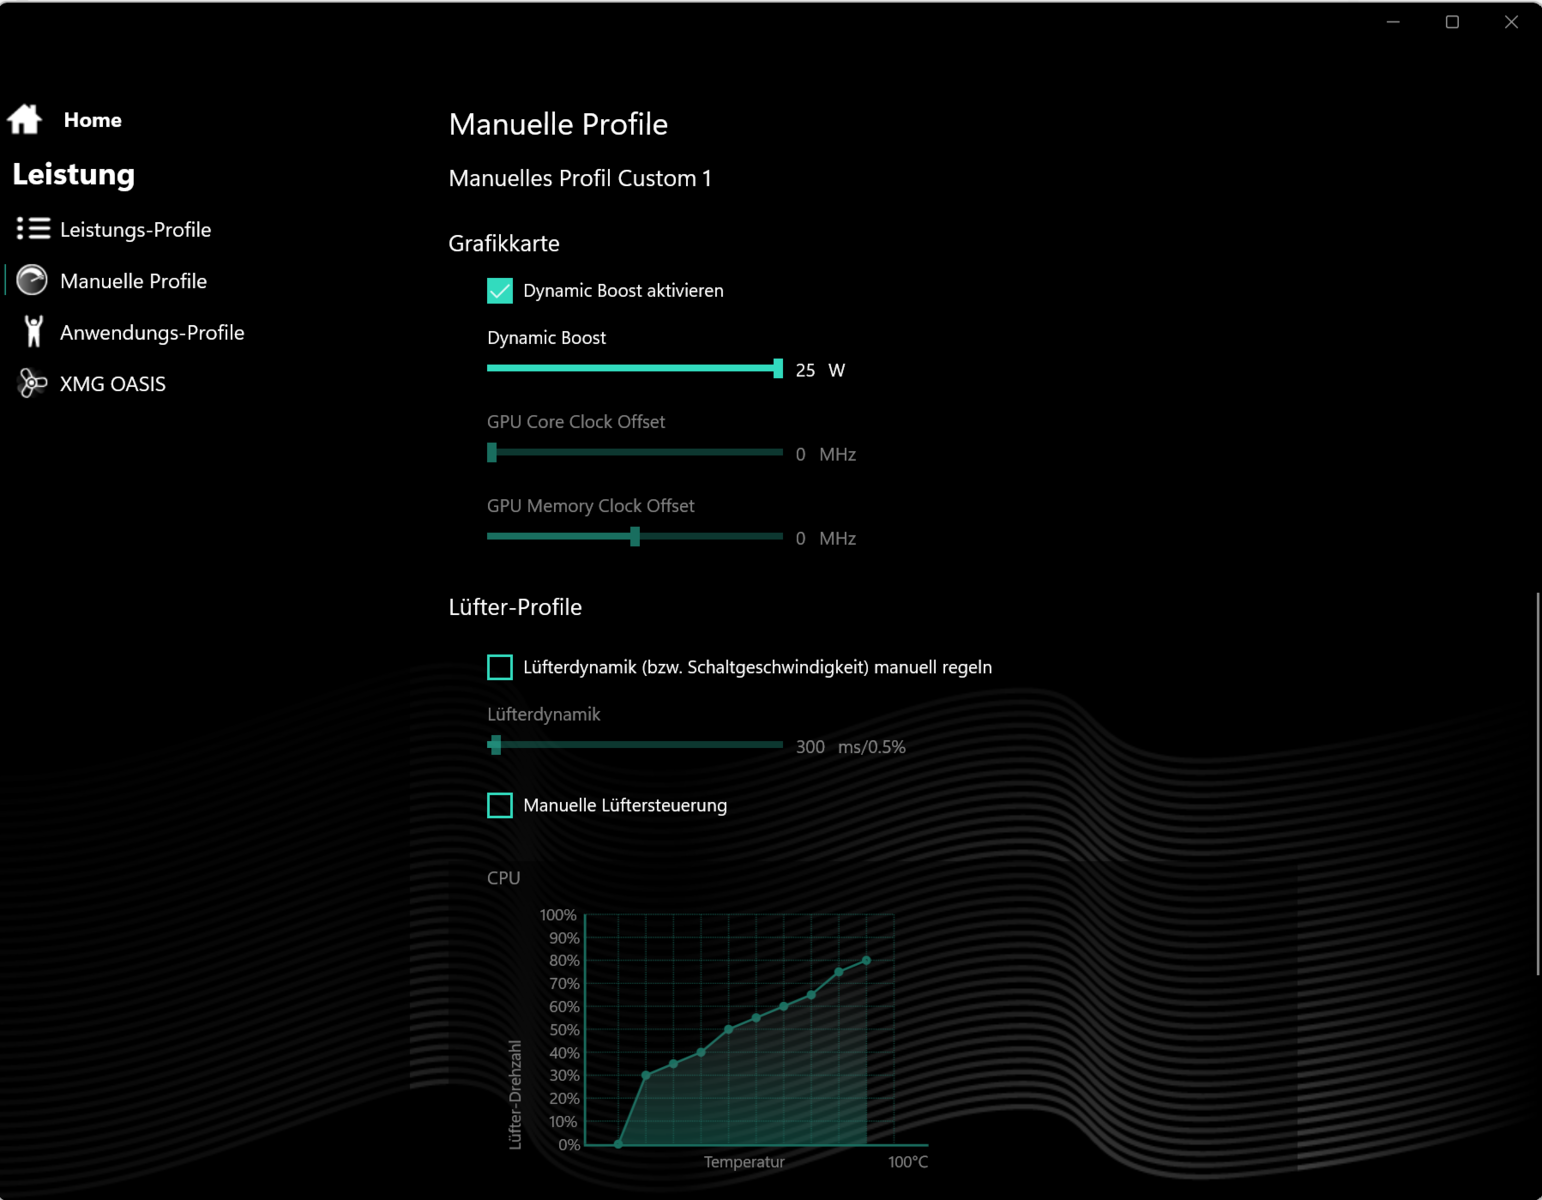
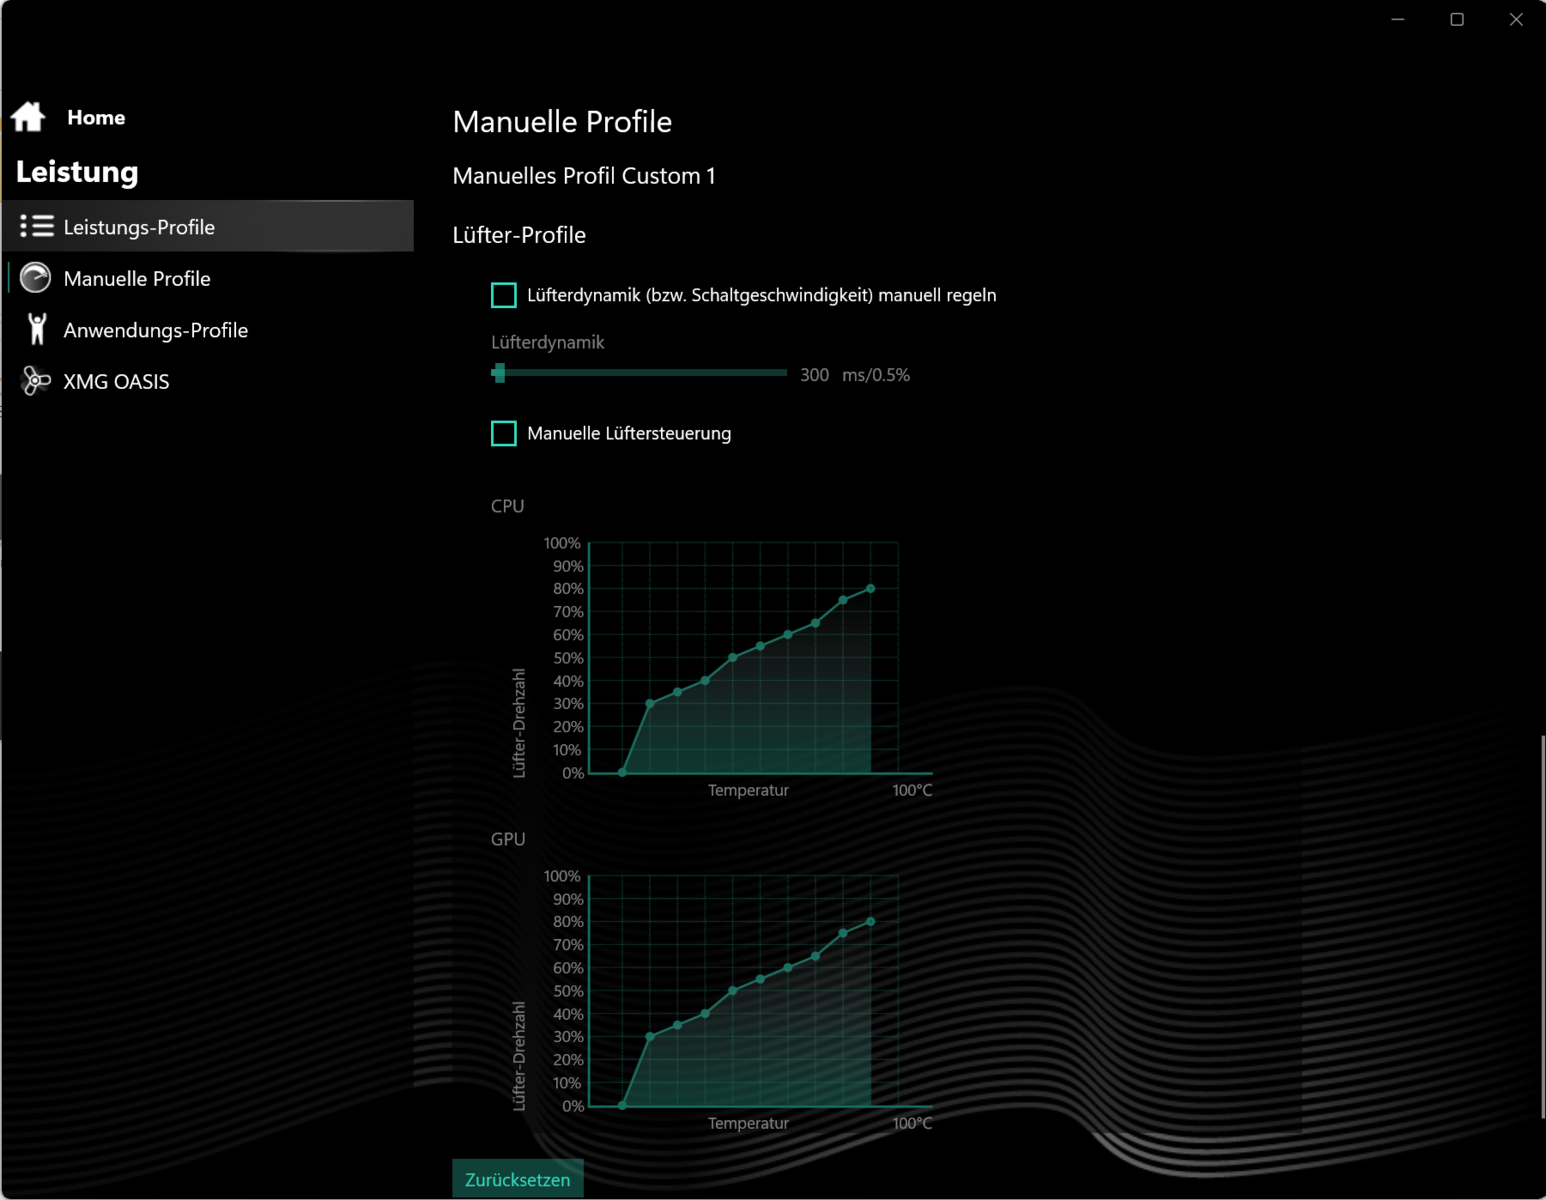
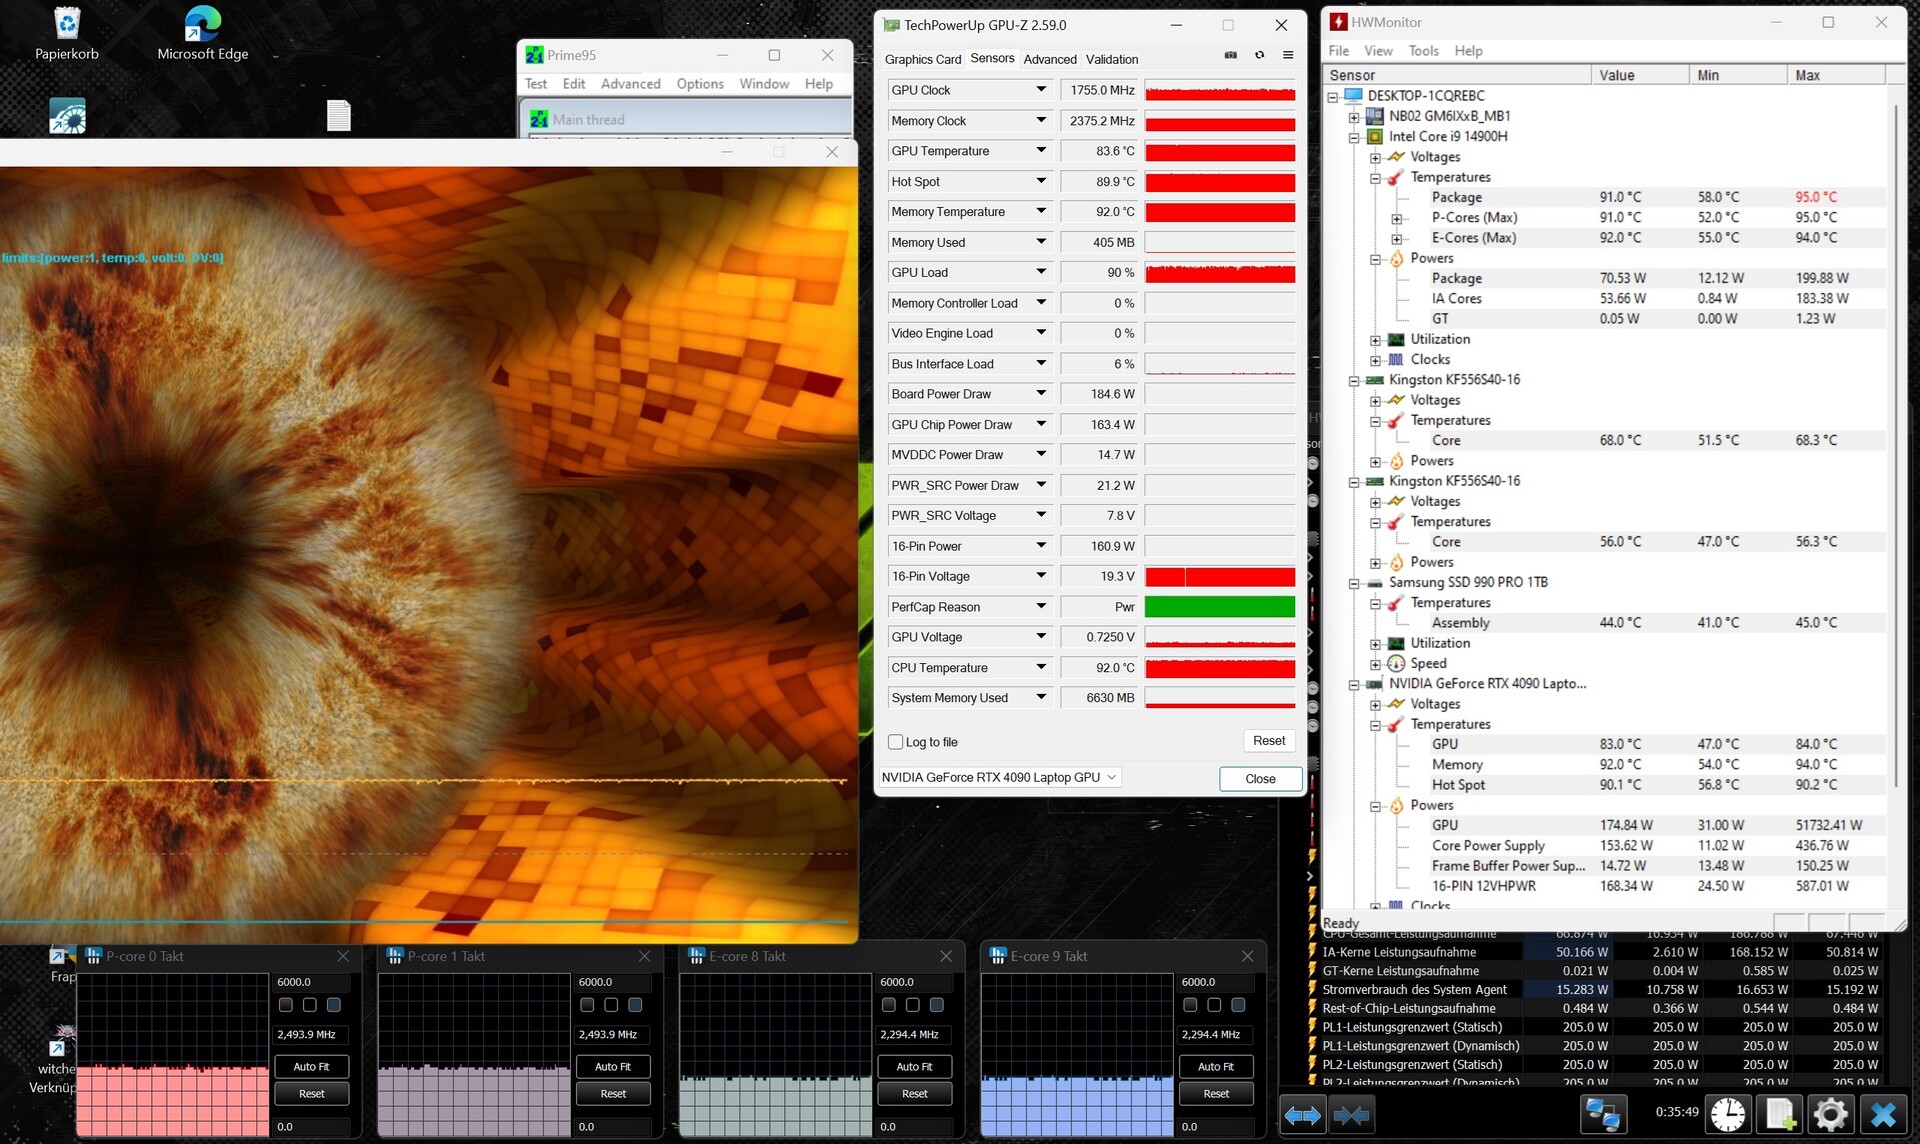
您可以选择三种制造商特定的性能模式(见表)。在测试过程中,我们使用了 "Overboost"(基准测试)和 "Balanced"(电池测试)模式。GPU 模式设置为 "混合"(= Optimus)。您可以通过控制中心管理各个配置文件。这意味着你可以调整 CPU 功率限制、GPU 的 TGP 和/或温度上限。 一个单独的按键(在电源按钮旁边)可以在不同模式之间快速切换。
我们可以选配外置水冷(Oasis Mk2),但在测试过程中并未使用。不过,我们还是进行了一些独立于官方测试的测量(见对比表)。
| 功率限制 1 (HWInfo) | 205 瓦 | 205 瓦 205 瓦 | |
|---|---|---|---|
| 功率限制 1 (HWInfo) | 205 瓦 | 205 瓦 | 205 瓦 |
| 功率限制 2 (HWInfo) | 205 瓦 | 205 瓦 | 205 瓦 |
| 噪音 (Witcher 3) | 54 dB(A) | 51 dB(A) | 32 dB(A) |
| 性能 (Witcher 3) | 214fps | 198fps | 30fps (锁定) |

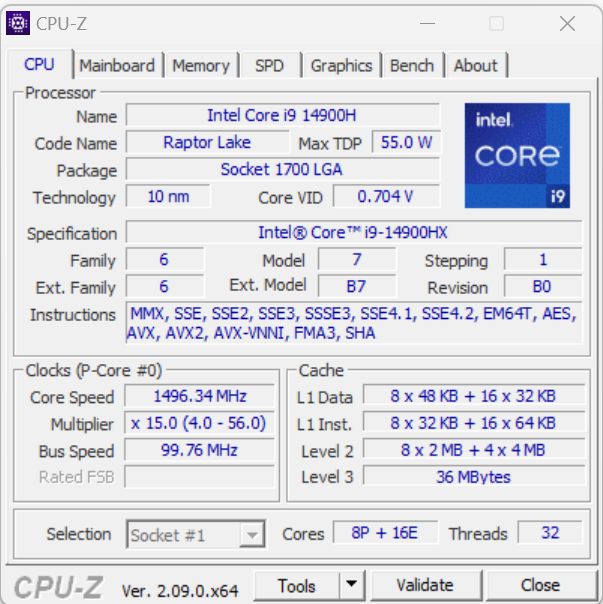
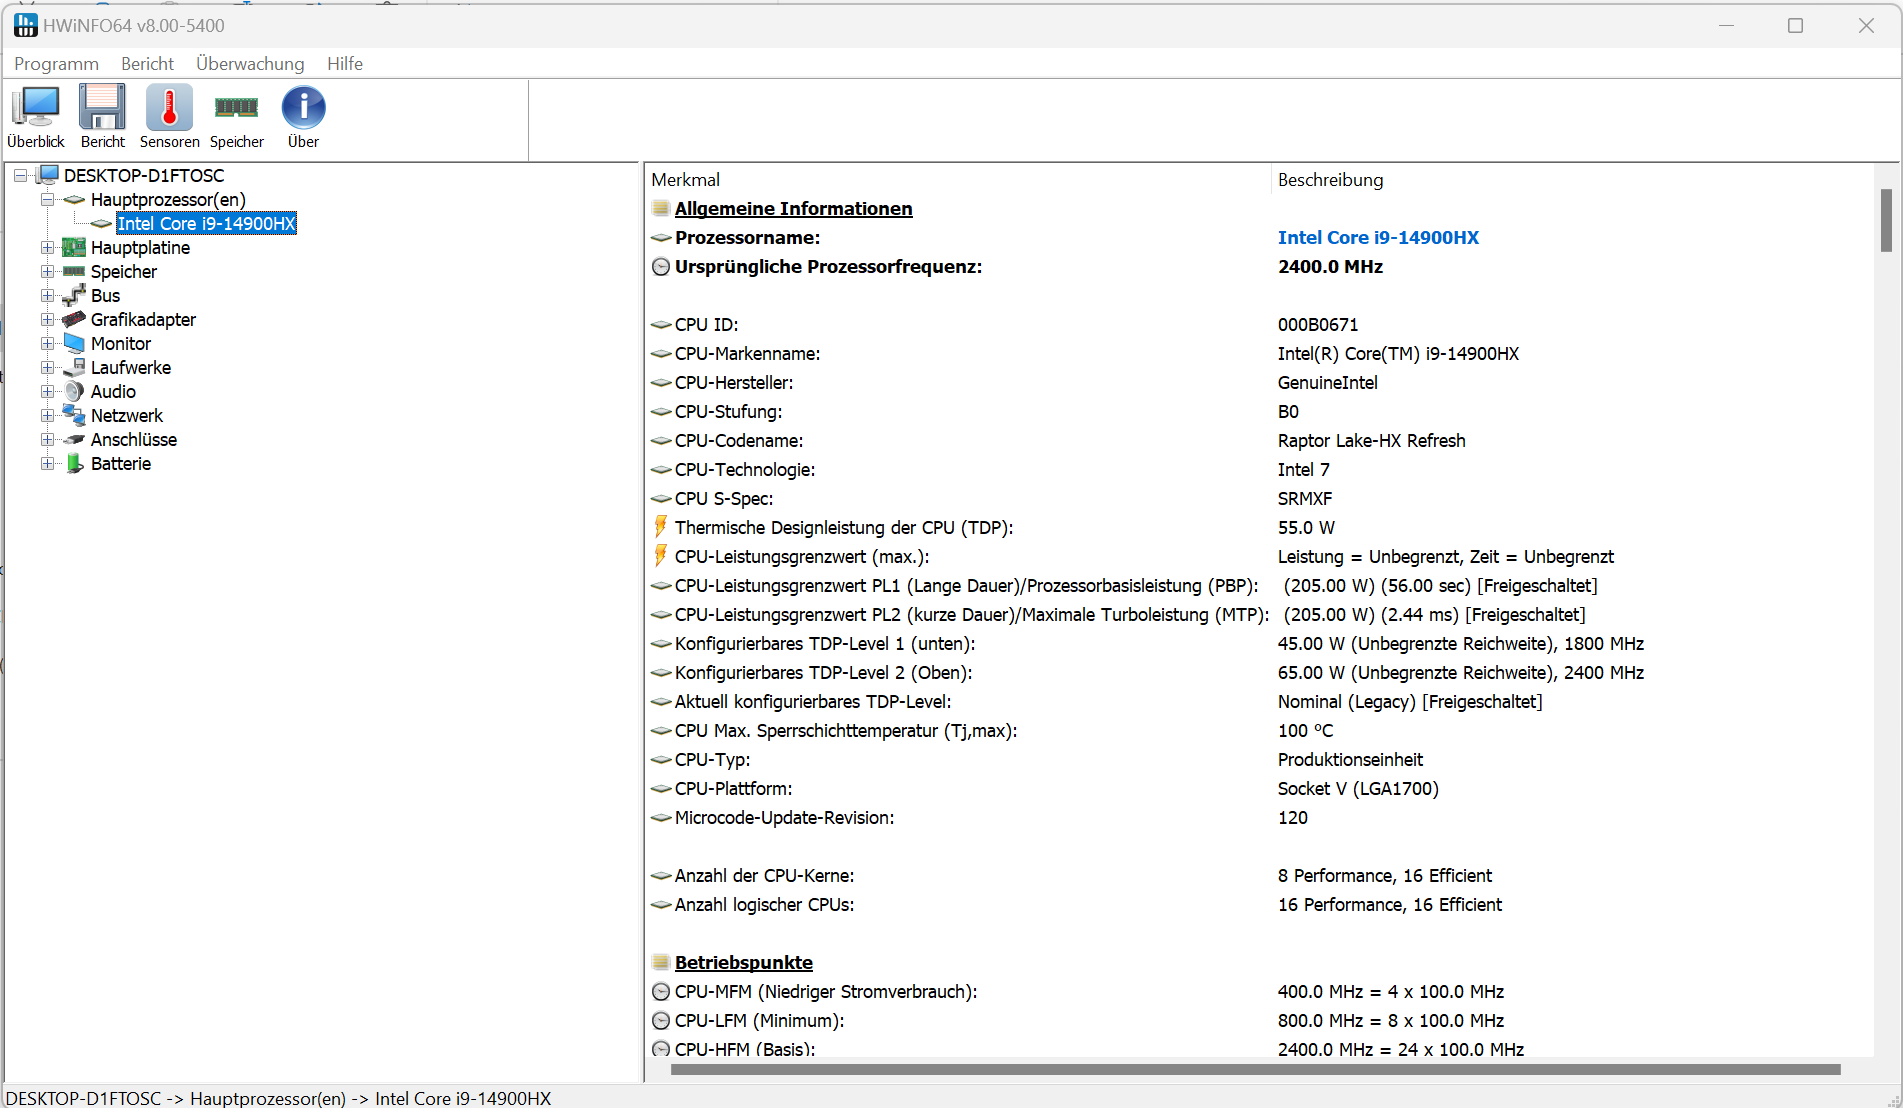
处理器
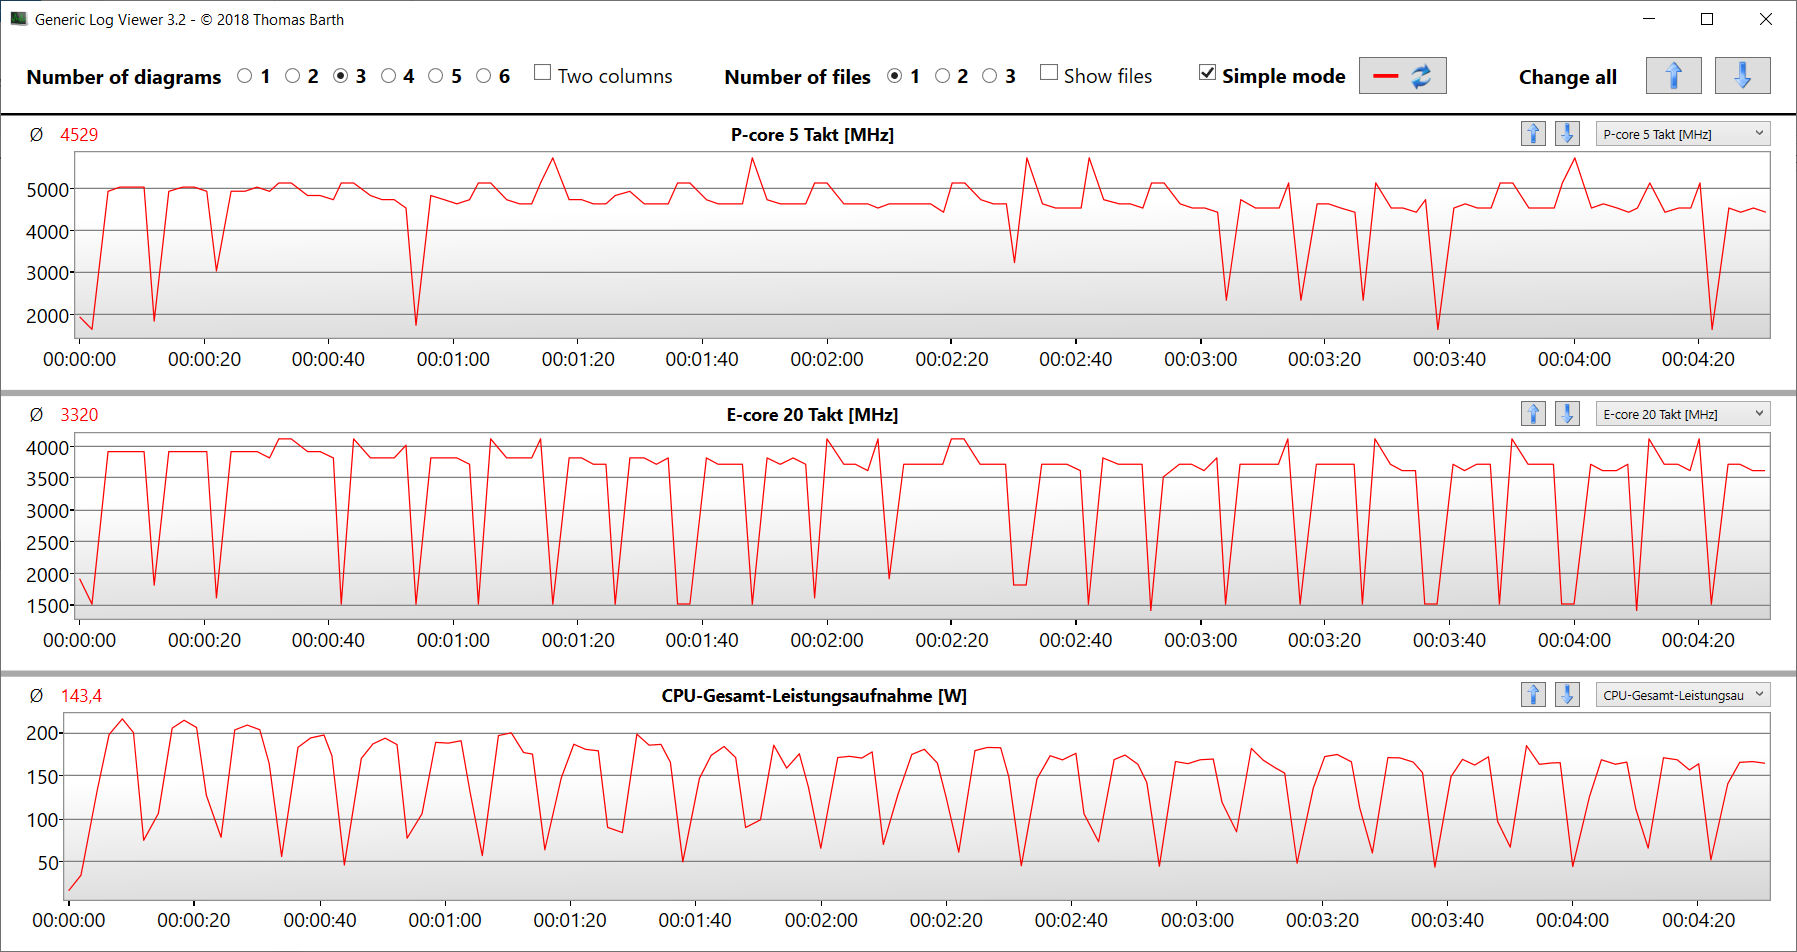
这款笔记本搭载了 酷睿 i9 14900HX(Raptor Lake)--其他 CPU 不可用。酷睿 i9 提供整整 24 个内核(8P + 16E = 32 个线程),最高主频为 5.8 GHz(P)和 4.1 GHz(E)。持续的多线程负载(CB15 循环)会导致性能持续但略有下降(超增压)--使用 Oasis 水冷系统可消除这种影响。其他两种电源模式即使不使用水冷也能确保稳定的性能--当然,是在较低水平上。
"超频 "模式的 CPU 性能高于平均水平,而 "发烧友 "模式则略低于平均水平--这主要体现在多线程性能上。在这三种配置文件中,单线程性能同样处于较高水平。可选的水冷系统(Oasis)可带来微弱的性能提升。
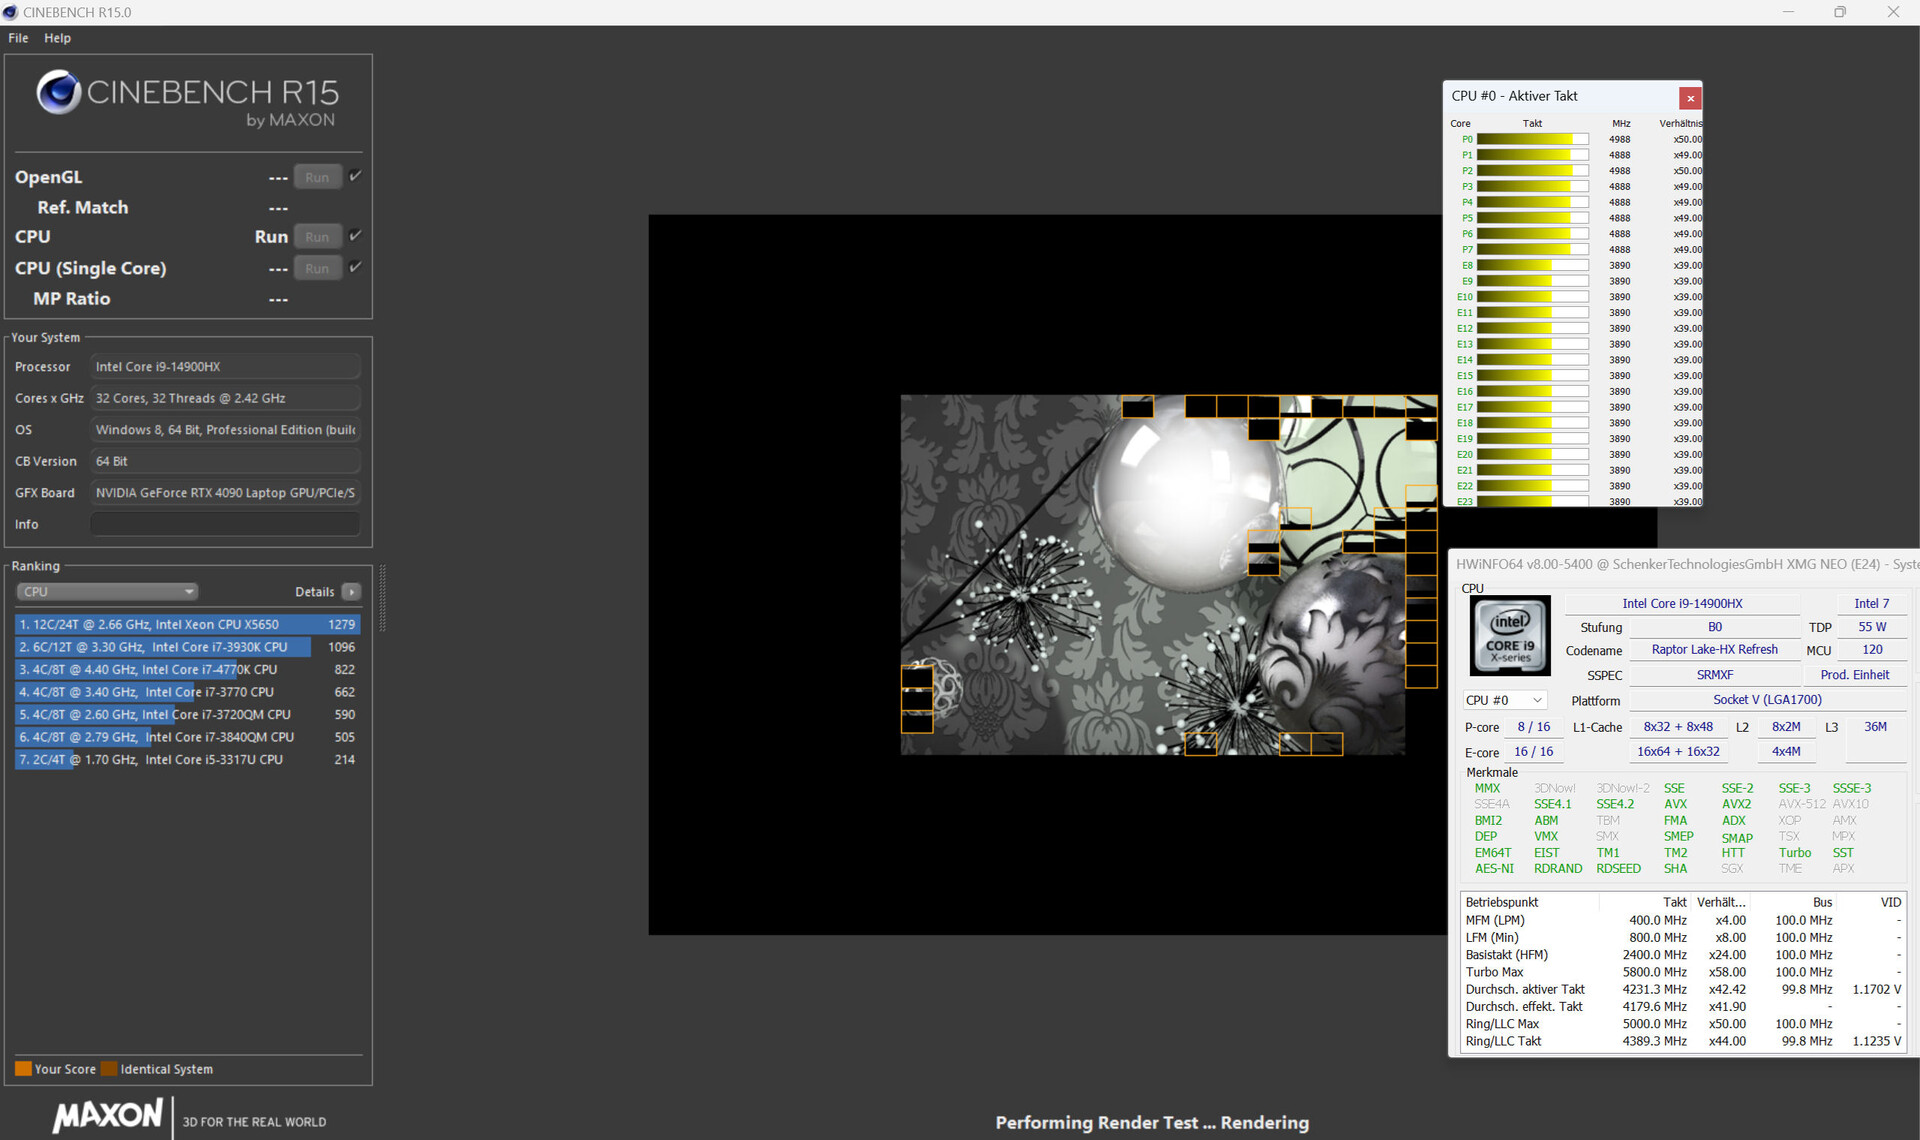
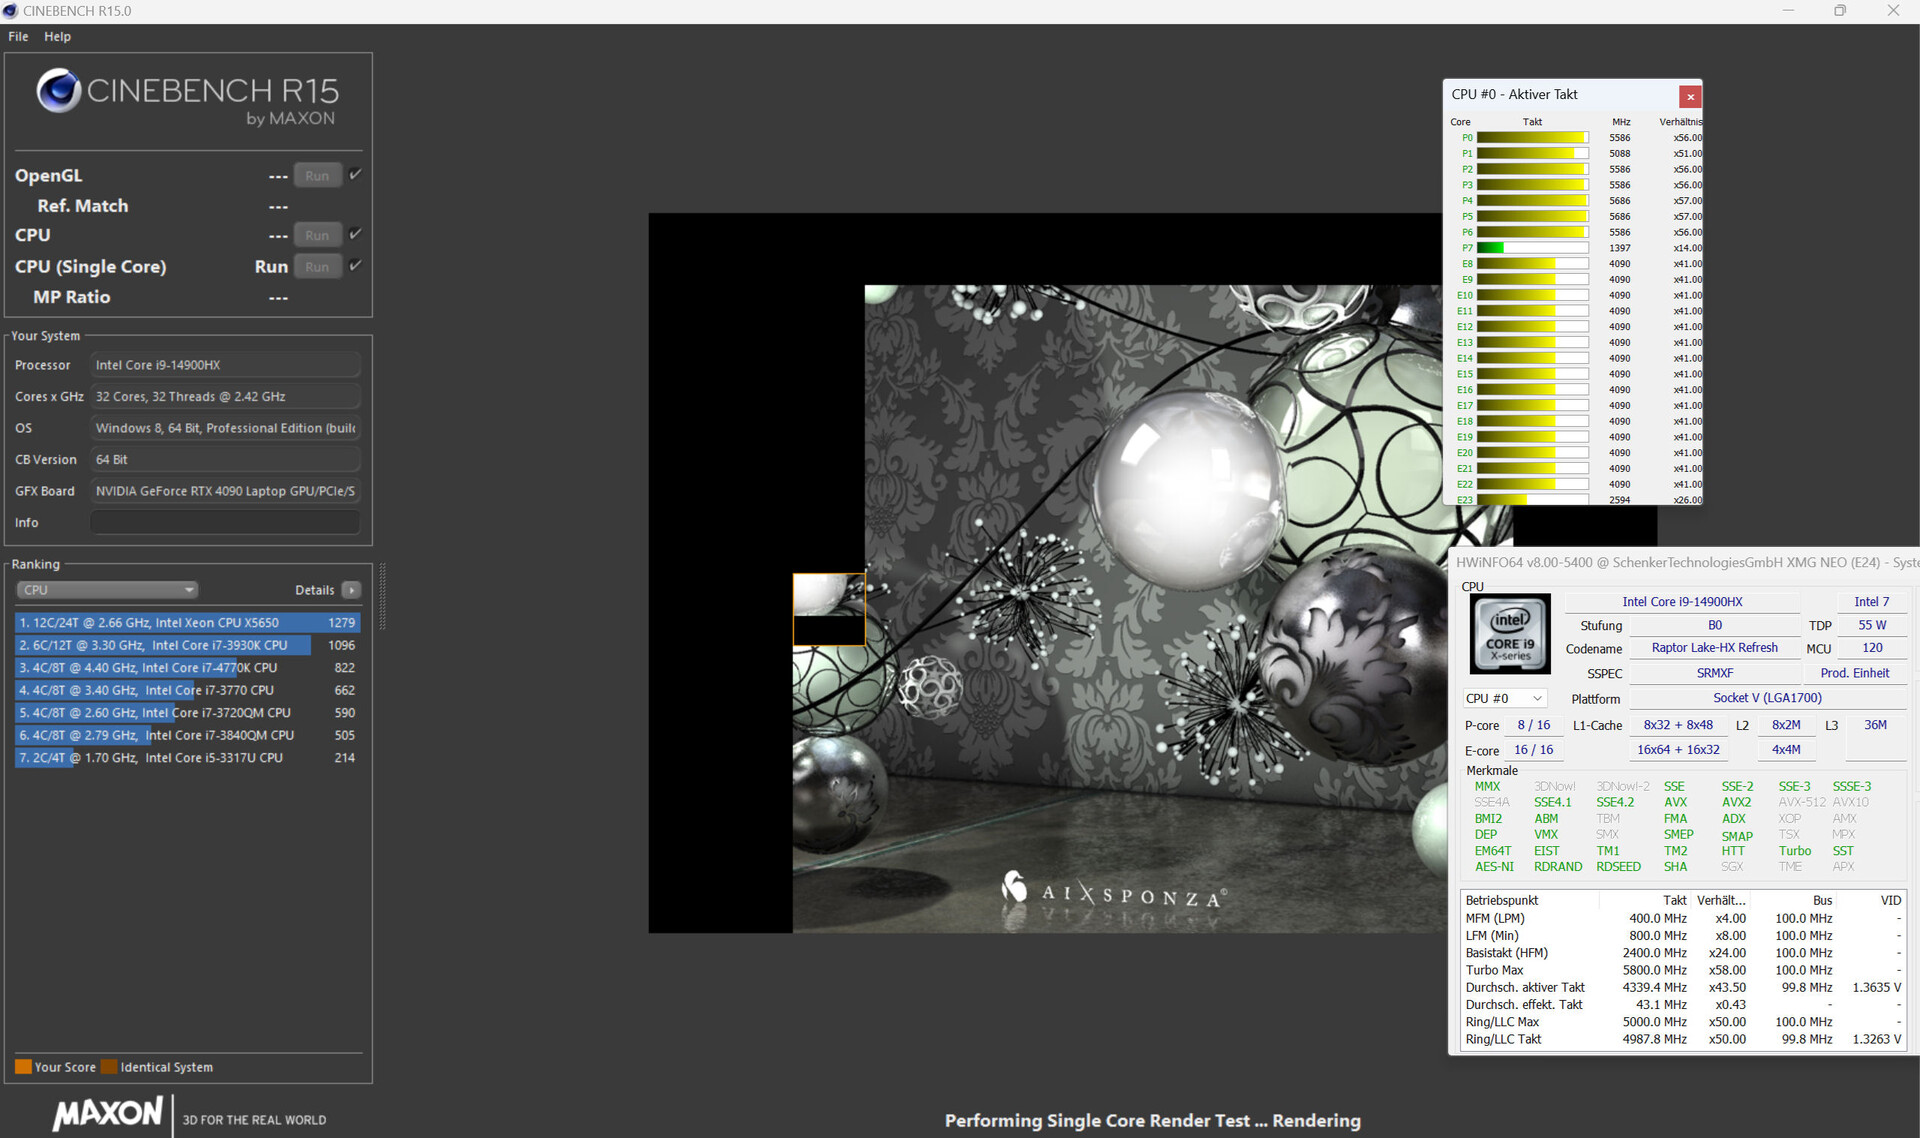
Cinebench R15 Multi Continuous Test
| Cinebench R20 | |
| CPU (Multi Core) | |
| Schenker XMG Neo 16 (Early 24) (Overboost, Oasis, Overboost, Oasis) | |
| Schenker XMG Neo 16 (Early 24) | |
| Asus ROG Strix Scar 17 G733PYV-LL053X | |
| Lenovo Legion 9 16IRX9, RTX 4090 | |
| Lenovo Legion Pro 7 RTX4090 | |
| Asus ROG Strix Scar 16 G634JZR | |
| Schenker XMG Neo 16 E23 | |
| Average Intel Core i9-14900HX (6579 - 13832, n=37) | |
| Razer Blade 16 2024, RTX 4090 | |
| Average of class Gaming (4029 - 16108, n=125, last 2 years) | |
| Medion Erazer Beast X40 2024 | |
| Alienware x16 R2 P120F | |
| CPU (Single Core) | |
| Medion Erazer Beast X40 2024 | |
| Schenker XMG Neo 16 (Early 24) (Overboost, Oasis, Overboost, Oasis) | |
| Schenker XMG Neo 16 (Early 24) | |
| Asus ROG Strix Scar 16 G634JZR | |
| Average Intel Core i9-14900HX (657 - 859, n=37) | |
| Razer Blade 16 2024, RTX 4090 | |
| Schenker XMG Neo 16 E23 | |
| Lenovo Legion Pro 7 RTX4090 | |
| Average of class Gaming (442 - 870, n=125, last 2 years) | |
| Asus ROG Strix Scar 17 G733PYV-LL053X | |
| Lenovo Legion 9 16IRX9, RTX 4090 | |
| Alienware x16 R2 P120F | |
| Geekbench 6.6 | |
| Multi-Core | |
| Schenker XMG Neo 16 (Early 24) (6.2.1, Overboost, Oasis) | |
| Schenker XMG Neo 16 (Early 24) (6.2.1) | |
| Asus ROG Strix Scar 16 G634JZR (6.2.1) | |
| Razer Blade 16 2024, RTX 4090 (6.2.1) | |
| Lenovo Legion 9 16IRX9, RTX 4090 (6.2.1) | |
| Average Intel Core i9-14900HX (13158 - 19665, n=37) | |
| Asus ROG Strix Scar 17 G733PYV-LL053X | |
| Medion Erazer Beast X40 2024 (6.2.1) | |
| Average of class Gaming (6625 - 22104, n=124, last 2 years) | |
| Alienware x16 R2 P120F (6.2.1) | |
| Single-Core | |
| Schenker XMG Neo 16 (Early 24) (6.2.1) | |
| Schenker XMG Neo 16 (Early 24) (6.2.1, Overboost, Oasis) | |
| Medion Erazer Beast X40 2024 (6.2.1) | |
| Asus ROG Strix Scar 16 G634JZR (6.2.1) | |
| Average Intel Core i9-14900HX (2419 - 3129, n=37) | |
| Razer Blade 16 2024, RTX 4090 (6.2.1) | |
| Asus ROG Strix Scar 17 G733PYV-LL053X | |
| Average of class Gaming (1490 - 3259, n=124, last 2 years) | |
| Lenovo Legion 9 16IRX9, RTX 4090 (6.2.1) | |
| Alienware x16 R2 P120F (6.2.1) | |
| HWBOT x265 Benchmark v2.2 - 4k Preset | |
| Schenker XMG Neo 16 (Early 24) (Overboost, Oasis) | |
| Asus ROG Strix Scar 17 G733PYV-LL053X | |
| Schenker XMG Neo 16 (Early 24) | |
| Lenovo Legion Pro 7 RTX4090 | |
| Asus ROG Strix Scar 16 G634JZR | |
| Schenker XMG Neo 16 E23 | |
| Lenovo Legion 9 16IRX9, RTX 4090 | |
| Razer Blade 16 2024, RTX 4090 | |
| Average Intel Core i9-14900HX (16.8 - 38.9, n=37) | |
| Average of class Gaming (11.5 - 44.3, n=123, last 2 years) | |
| Medion Erazer Beast X40 2024 | |
| Alienware x16 R2 P120F | |
| LibreOffice - 20 Documents To PDF | |
| Lenovo Legion 9 16IRX9, RTX 4090 (6.3.4.2) | |
| Average of class Gaming (19 - 88.8, n=123, last 2 years) | |
| Asus ROG Strix Scar 16 G634JZR (6.3.4.2) | |
| Razer Blade 16 2024, RTX 4090 (6.3.4.2) | |
| Alienware x16 R2 P120F (6.3.4.2) | |
| Medion Erazer Beast X40 2024 (6.3.4.2) | |
| Average Intel Core i9-14900HX (19 - 85.1, n=37) | |
| Lenovo Legion Pro 7 RTX4090 | |
| Asus ROG Strix Scar 17 G733PYV-LL053X | |
| Schenker XMG Neo 16 E23 | |
| Schenker XMG Neo 16 (Early 24) (6.3.4.2) | |
| Schenker XMG Neo 16 (Early 24) (6.3.4.2, Overboost, Oasis) | |
| R Benchmark 2.5 - Overall mean | |
| Alienware x16 R2 P120F | |
| Lenovo Legion 9 16IRX9, RTX 4090 | |
| Average of class Gaming (0.3439 - 0.759, n=124, last 2 years) | |
| Asus ROG Strix Scar 17 G733PYV-LL053X | |
| Lenovo Legion Pro 7 RTX4090 | |
| Average Intel Core i9-14900HX (0.3604 - 0.4859, n=37) | |
| Schenker XMG Neo 16 (Early 24) (Overboost, Oasis, Overboost, Oasis) | |
| Razer Blade 16 2024, RTX 4090 | |
| Schenker XMG Neo 16 E23 | |
| Medion Erazer Beast X40 2024 | |
| Asus ROG Strix Scar 16 G634JZR | |
| Schenker XMG Neo 16 (Early 24) | |
* ... smaller is better
AIDA64: FP32 Ray-Trace | FPU Julia | CPU SHA3 | CPU Queen | FPU SinJulia | FPU Mandel | CPU AES | CPU ZLib | FP64 Ray-Trace | CPU PhotoWorxx
| Performance rating | |
| Asus ROG Strix Scar 17 G733PYV-LL053X | |
| Schenker XMG Neo 16 (Early 24) | |
| Schenker XMG Neo 16 (Early 24) | |
| Asus ROG Strix Scar 16 G634JZR | |
| Lenovo Legion 9 16IRX9, RTX 4090 | |
| Lenovo Legion Pro 7 RTX4090 | |
| Razer Blade 16 2024, RTX 4090 | |
| Schenker XMG Neo 16 E23 | |
| Average Intel Core i9-14900HX | |
| Average of class Gaming | |
| Medion Erazer Beast X40 2024 | |
| Alienware x16 R2 P120F | |
| AIDA64 / FP32 Ray-Trace | |
| Asus ROG Strix Scar 17 G733PYV-LL053X (v6.88.6413 Beta) | |
| Schenker XMG Neo 16 (Early 24) (v6.92.6600, Overboost, Oasis) | |
| Schenker XMG Neo 16 (Early 24) (v6.92.6600) | |
| Average of class Gaming (10227 - 85542, n=123, last 2 years) | |
| Lenovo Legion 9 16IRX9, RTX 4090 (v6.92.6600) | |
| Lenovo Legion Pro 7 RTX4090 (v6.85.6300) | |
| Asus ROG Strix Scar 16 G634JZR (v6.92.6600) | |
| Razer Blade 16 2024, RTX 4090 (v6.92.6600) | |
| Average Intel Core i9-14900HX (13098 - 33474, n=36) | |
| Schenker XMG Neo 16 E23 (v6.75.6100) | |
| Medion Erazer Beast X40 2024 (v6.92.6600) | |
| Alienware x16 R2 P120F (v6.92.6600) | |
| AIDA64 / FPU Julia | |
| Asus ROG Strix Scar 17 G733PYV-LL053X (v6.88.6413 Beta) | |
| Schenker XMG Neo 16 (Early 24) (v6.92.6600, Overboost, Oasis) | |
| Schenker XMG Neo 16 (Early 24) (v6.92.6600) | |
| Lenovo Legion 9 16IRX9, RTX 4090 (v6.92.6600) | |
| Lenovo Legion Pro 7 RTX4090 (v6.85.6300) | |
| Average of class Gaming (51376 - 238426, n=123, last 2 years) | |
| Razer Blade 16 2024, RTX 4090 (v6.92.6600) | |
| Asus ROG Strix Scar 16 G634JZR (v6.92.6600) | |
| Average Intel Core i9-14900HX (67573 - 166040, n=36) | |
| Schenker XMG Neo 16 E23 (v6.75.6100) | |
| Medion Erazer Beast X40 2024 (v6.92.6600) | |
| Alienware x16 R2 P120F (v6.92.6600) | |
| AIDA64 / CPU SHA3 | |
| Asus ROG Strix Scar 17 G733PYV-LL053X (v6.88.6413 Beta) | |
| Schenker XMG Neo 16 (Early 24) (v6.92.6600, Overboost, Oasis) | |
| Schenker XMG Neo 16 (Early 24) (v6.92.6600) | |
| Lenovo Legion 9 16IRX9, RTX 4090 (v6.92.6600) | |
| Lenovo Legion Pro 7 RTX4090 (v6.85.6300) | |
| Asus ROG Strix Scar 16 G634JZR (v6.92.6600) | |
| Razer Blade 16 2024, RTX 4090 (v6.92.6600) | |
| Average Intel Core i9-14900HX (3589 - 7979, n=36) | |
| Schenker XMG Neo 16 E23 (v6.75.6100) | |
| Average of class Gaming (2180 - 9817, n=123, last 2 years) | |
| Medion Erazer Beast X40 2024 (v6.92.6600) | |
| Alienware x16 R2 P120F (v6.92.6600) | |
| AIDA64 / CPU Queen | |
| Asus ROG Strix Scar 17 G733PYV-LL053X (v6.88.6413 Beta) | |
| Schenker XMG Neo 16 (Early 24) (v6.92.6600) | |
| Schenker XMG Neo 16 (Early 24) (v6.92.6600, Overboost, Oasis) | |
| Asus ROG Strix Scar 16 G634JZR (v6.92.6600) | |
| Razer Blade 16 2024, RTX 4090 (v6.92.6600) | |
| Average Intel Core i9-14900HX (118405 - 148966, n=36) | |
| Schenker XMG Neo 16 E23 (v6.75.6100) | |
| Lenovo Legion Pro 7 RTX4090 (v6.85.6300) | |
| Medion Erazer Beast X40 2024 (v6.92.6600) | |
| Lenovo Legion 9 16IRX9, RTX 4090 (v6.92.6600) | |
| Average of class Gaming (49785 - 173351, n=120, last 2 years) | |
| Alienware x16 R2 P120F (v6.92.6600) | |
| AIDA64 / FPU SinJulia | |
| Asus ROG Strix Scar 17 G733PYV-LL053X (v6.88.6413 Beta) | |
| Schenker XMG Neo 16 (Early 24) (v6.92.6600, Overboost, Oasis) | |
| Schenker XMG Neo 16 (Early 24) (v6.92.6600) | |
| Lenovo Legion 9 16IRX9, RTX 4090 (v6.92.6600) | |
| Asus ROG Strix Scar 16 G634JZR (v6.92.6600) | |
| Razer Blade 16 2024, RTX 4090 (v6.92.6600) | |
| Lenovo Legion Pro 7 RTX4090 (v6.85.6300) | |
| Average Intel Core i9-14900HX (10475 - 18517, n=36) | |
| Schenker XMG Neo 16 E23 (v6.75.6100) | |
| Average of class Gaming (4424 - 33636, n=123, last 2 years) | |
| Medion Erazer Beast X40 2024 (v6.92.6600) | |
| Alienware x16 R2 P120F (v6.92.6600) | |
| AIDA64 / FPU Mandel | |
| Asus ROG Strix Scar 17 G733PYV-LL053X (v6.88.6413 Beta) | |
| Schenker XMG Neo 16 (Early 24) (v6.92.6600, Overboost, Oasis) | |
| Schenker XMG Neo 16 (Early 24) (v6.92.6600) | |
| Lenovo Legion 9 16IRX9, RTX 4090 (v6.92.6600) | |
| Average of class Gaming (25115 - 128721, n=123, last 2 years) | |
| Lenovo Legion Pro 7 RTX4090 (v6.85.6300) | |
| Asus ROG Strix Scar 16 G634JZR (v6.92.6600) | |
| Razer Blade 16 2024, RTX 4090 (v6.92.6600) | |
| Average Intel Core i9-14900HX (32543 - 83662, n=36) | |
| Schenker XMG Neo 16 E23 (v6.75.6100) | |
| Medion Erazer Beast X40 2024 | |
| Alienware x16 R2 P120F (v6.92.6600) | |
| AIDA64 / CPU AES | |
| Asus ROG Strix Scar 17 G733PYV-LL053X (v6.88.6413 Beta) | |
| Asus ROG Strix Scar 16 G634JZR (v6.92.6600) | |
| Schenker XMG Neo 16 E23 (v6.75.6100) | |
| Schenker XMG Neo 16 (Early 24) (v6.92.6600, Overboost, Oasis) | |
| Schenker XMG Neo 16 (Early 24) (v6.92.6600) | |
| Average Intel Core i9-14900HX (86964 - 241777, n=36) | |
| Lenovo Legion 9 16IRX9, RTX 4090 (v6.92.6600) | |
| Lenovo Legion Pro 7 RTX4090 (v6.85.6300) | |
| Razer Blade 16 2024, RTX 4090 (v6.92.6600) | |
| Average of class Gaming (39258 - 247074, n=123, last 2 years) | |
| Medion Erazer Beast X40 2024 (v6.92.6600) | |
| Alienware x16 R2 P120F (v6.92.6600) | |
| AIDA64 / CPU ZLib | |
| Schenker XMG Neo 16 (Early 24) (v6.92.6600, Overboost, Oasis) | |
| Schenker XMG Neo 16 (Early 24) (v6.92.6600) | |
| Asus ROG Strix Scar 17 G733PYV-LL053X (v6.88.6413 Beta) | |
| Lenovo Legion 9 16IRX9, RTX 4090 (v6.92.6600) | |
| Lenovo Legion Pro 7 RTX4090 (v6.85.6300) | |
| Razer Blade 16 2024, RTX 4090 (v6.92.6600) | |
| Asus ROG Strix Scar 16 G634JZR (v6.92.6600) | |
| Average Intel Core i9-14900HX (1054 - 2292, n=36) | |
| Schenker XMG Neo 16 E23 (v6.75.6100) | |
| Average of class Gaming (574 - 2531, n=123, last 2 years) | |
| Medion Erazer Beast X40 2024 (v6.92.6600) | |
| Alienware x16 R2 P120F (v6.92.6600) | |
| AIDA64 / FP64 Ray-Trace | |
| Asus ROG Strix Scar 17 G733PYV-LL053X (v6.88.6413 Beta) | |
| Schenker XMG Neo 16 (Early 24) (v6.92.6600, Overboost, Oasis) | |
| Schenker XMG Neo 16 (Early 24) (v6.92.6600) | |
| Average of class Gaming (5509 - 45446, n=123, last 2 years) | |
| Lenovo Legion 9 16IRX9, RTX 4090 (v6.92.6600) | |
| Lenovo Legion Pro 7 RTX4090 (v6.85.6300) | |
| Asus ROG Strix Scar 16 G634JZR (v6.92.6600) | |
| Razer Blade 16 2024, RTX 4090 (v6.92.6600) | |
| Average Intel Core i9-14900HX (6809 - 18349, n=36) | |
| Schenker XMG Neo 16 E23 (v6.75.6100) | |
| Medion Erazer Beast X40 2024 (v6.92.6600) | |
| Alienware x16 R2 P120F (v6.92.6600) | |
| AIDA64 / CPU PhotoWorxx | |
| Lenovo Legion 9 16IRX9, RTX 4090 (v6.92.6600) | |
| Alienware x16 R2 P120F (v6.92.6600) | |
| Lenovo Legion Pro 7 RTX4090 (v6.85.6300) | |
| Asus ROG Strix Scar 16 G634JZR (v6.92.6600) | |
| Razer Blade 16 2024, RTX 4090 (v6.92.6600) | |
| Schenker XMG Neo 16 (Early 24) (v6.92.6600, Overboost, Oasis) | |
| Schenker XMG Neo 16 (Early 24) (v6.92.6600) | |
| Medion Erazer Beast X40 2024 (v6.92.6600) | |
| Schenker XMG Neo 16 E23 (v6.75.6100) | |
| Average Intel Core i9-14900HX (23903 - 54702, n=36) | |
| Average of class Gaming (12271 - 62916, n=123, last 2 years) | |
| Asus ROG Strix Scar 17 G733PYV-LL053X (v6.88.6413 Beta) | |
系统性能
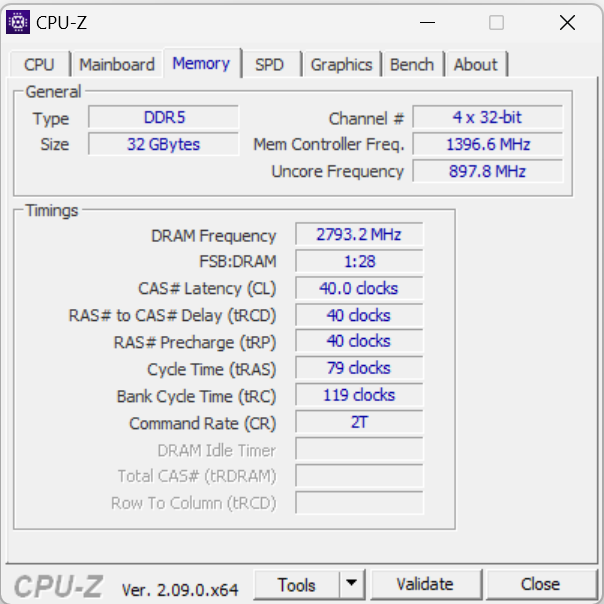
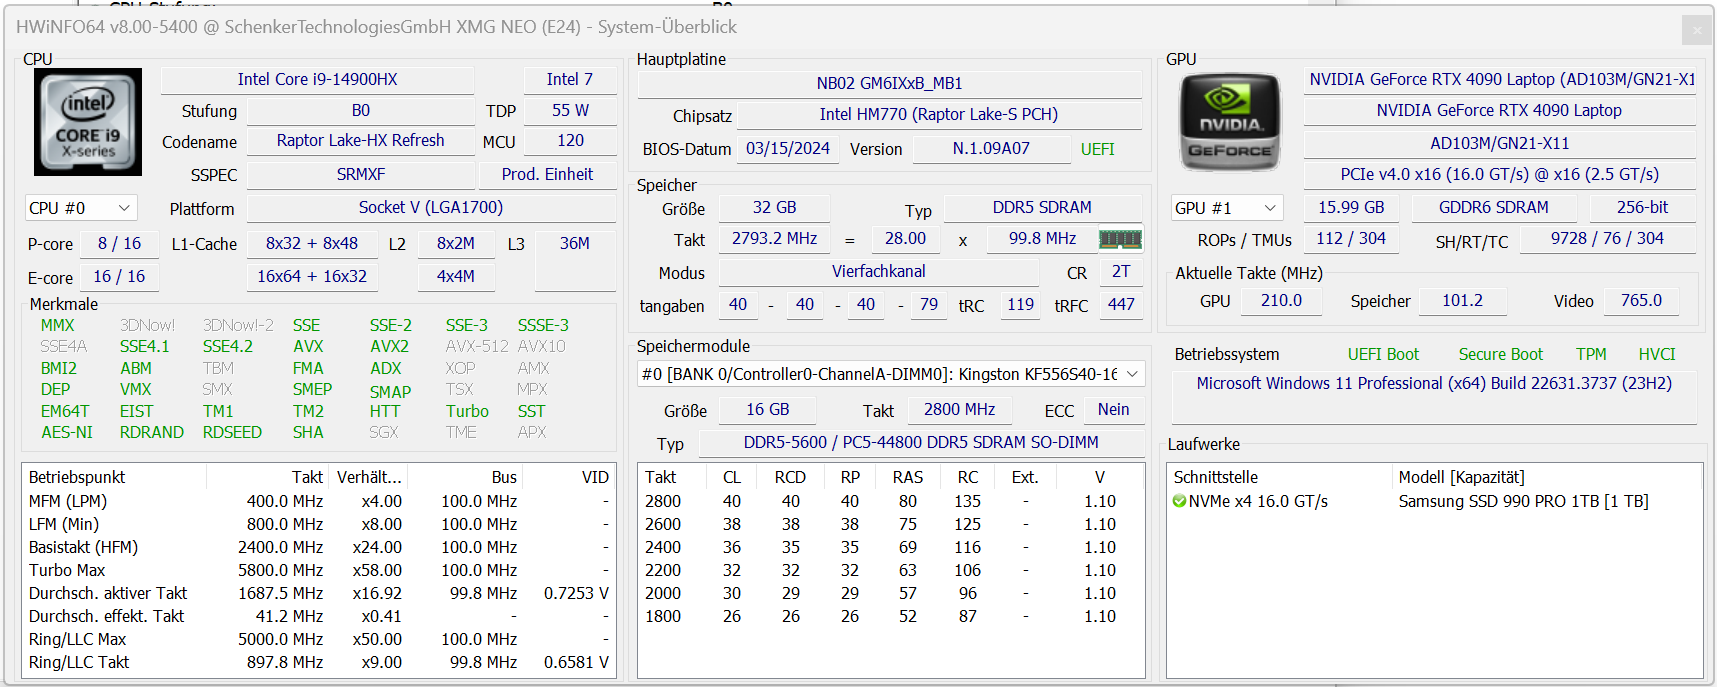
从规格列表中就能看出这一点:它不乏强大的计算能力--PCMark 的优异成绩也证明了这一点。游戏、流媒体和渲染应该是这款高速电脑的主要工作领域。内存的传输速度符合 DDR5 5600 内存的正常水平。
CrossMark: Overall | Productivity | Creativity | Responsiveness
WebXPRT 3: Overall
WebXPRT 4: Overall
Mozilla Kraken 1.1: Total
| PCMark 10 / Score | |
| Asus ROG Strix Scar 17 G733PYV-LL053X | |
| Schenker XMG Neo 16 (Early 24) | |
| Medion Erazer Beast X40 2024 | |
| Average Intel Core i9-14900HX, NVIDIA GeForce RTX 4090 Laptop GPU (8230 - 9234, n=13) | |
| Razer Blade 16 2024, RTX 4090 | |
| Schenker XMG Neo 16 E23 | |
| Lenovo Legion 9 16IRX9, RTX 4090 | |
| Average of class Gaming (5828 - 10060, n=105, last 2 years) | |
| Lenovo Legion Pro 7 RTX4090 | |
| Asus ROG Strix Scar 16 G634JZR | |
| Alienware x16 R2 P120F | |
| PCMark 10 / Essentials | |
| Asus ROG Strix Scar 16 G634JZR | |
| Asus ROG Strix Scar 17 G733PYV-LL053X | |
| Average Intel Core i9-14900HX, NVIDIA GeForce RTX 4090 Laptop GPU (10778 - 11628, n=13) | |
| Lenovo Legion Pro 7 RTX4090 | |
| Schenker XMG Neo 16 (Early 24) | |
| Lenovo Legion 9 16IRX9, RTX 4090 | |
| Schenker XMG Neo 16 E23 | |
| Razer Blade 16 2024, RTX 4090 | |
| Medion Erazer Beast X40 2024 | |
| Average of class Gaming (8810 - 12600, n=109, last 2 years) | |
| Alienware x16 R2 P120F | |
| PCMark 10 / Productivity | |
| Medion Erazer Beast X40 2024 | |
| Schenker XMG Neo 16 (Early 24) | |
| Razer Blade 16 2024, RTX 4090 | |
| Asus ROG Strix Scar 17 G733PYV-LL053X | |
| Average Intel Core i9-14900HX, NVIDIA GeForce RTX 4090 Laptop GPU (9458 - 11759, n=13) | |
| Average of class Gaming (6662 - 16716, n=107, last 2 years) | |
| Lenovo Legion 9 16IRX9, RTX 4090 | |
| Schenker XMG Neo 16 E23 | |
| Lenovo Legion Pro 7 RTX4090 | |
| Alienware x16 R2 P120F | |
| Asus ROG Strix Scar 16 G634JZR | |
| PCMark 10 / Digital Content Creation | |
| Asus ROG Strix Scar 17 G733PYV-LL053X | |
| Asus ROG Strix Scar 16 G634JZR | |
| Schenker XMG Neo 16 (Early 24) | |
| Medion Erazer Beast X40 2024 | |
| Average Intel Core i9-14900HX, NVIDIA GeForce RTX 4090 Laptop GPU (13219 - 16462, n=13) | |
| Schenker XMG Neo 16 E23 | |
| Lenovo Legion Pro 7 RTX4090 | |
| Average of class Gaming (7602 - 19351, n=107, last 2 years) | |
| Lenovo Legion 9 16IRX9, RTX 4090 | |
| Razer Blade 16 2024, RTX 4090 | |
| Alienware x16 R2 P120F | |
| CrossMark / Overall | |
| Schenker XMG Neo 16 (Early 24) | |
| Razer Blade 16 2024, RTX 4090 | |
| Medion Erazer Beast X40 2024 | |
| Average Intel Core i9-14900HX, NVIDIA GeForce RTX 4090 Laptop GPU (1877 - 2344, n=10) | |
| Schenker XMG Neo 16 E23 | |
| Asus ROG Strix Scar 17 G733PYV-LL053X | |
| Asus ROG Strix Scar 16 G634JZR | |
| Average of class Gaming (1366 - 2344, n=107, last 2 years) | |
| Lenovo Legion 9 16IRX9, RTX 4090 | |
| Alienware x16 R2 P120F | |
| CrossMark / Productivity | |
| Schenker XMG Neo 16 (Early 24) | |
| Medion Erazer Beast X40 2024 | |
| Razer Blade 16 2024, RTX 4090 | |
| Average Intel Core i9-14900HX, NVIDIA GeForce RTX 4090 Laptop GPU (1738 - 2162, n=10) | |
| Schenker XMG Neo 16 E23 | |
| Asus ROG Strix Scar 17 G733PYV-LL053X | |
| Asus ROG Strix Scar 16 G634JZR | |
| Average of class Gaming (1386 - 2211, n=107, last 2 years) | |
| Lenovo Legion 9 16IRX9, RTX 4090 | |
| Alienware x16 R2 P120F | |
| CrossMark / Creativity | |
| Schenker XMG Neo 16 (Early 24) | |
| Schenker XMG Neo 16 E23 | |
| Razer Blade 16 2024, RTX 4090 | |
| Asus ROG Strix Scar 17 G733PYV-LL053X | |
| Average Intel Core i9-14900HX, NVIDIA GeForce RTX 4090 Laptop GPU (2195 - 2660, n=10) | |
| Asus ROG Strix Scar 16 G634JZR | |
| Medion Erazer Beast X40 2024 | |
| Average of class Gaming (1343 - 2729, n=107, last 2 years) | |
| Lenovo Legion 9 16IRX9, RTX 4090 | |
| Alienware x16 R2 P120F | |
| CrossMark / Responsiveness | |
| Schenker XMG Neo 16 (Early 24) | |
| Medion Erazer Beast X40 2024 | |
| Average Intel Core i9-14900HX, NVIDIA GeForce RTX 4090 Laptop GPU (1478 - 2327, n=10) | |
| Razer Blade 16 2024, RTX 4090 | |
| Lenovo Legion 9 16IRX9, RTX 4090 | |
| Asus ROG Strix Scar 16 G634JZR | |
| Schenker XMG Neo 16 E23 | |
| Average of class Gaming (1226 - 2330, n=107, last 2 years) | |
| Asus ROG Strix Scar 17 G733PYV-LL053X | |
| Alienware x16 R2 P120F | |
| WebXPRT 3 / Overall | |
| Asus ROG Strix Scar 17 G733PYV-LL053X | |
| Schenker XMG Neo 16 (Early 24) | |
| Schenker XMG Neo 16 E23 | |
| Razer Blade 16 2024, RTX 4090 | |
| Medion Erazer Beast X40 2024 | |
| Average Intel Core i9-14900HX, NVIDIA GeForce RTX 4090 Laptop GPU (279 - 339, n=10) | |
| Average of class Gaming (237 - 532, n=110, last 2 years) | |
| Asus ROG Strix Scar 16 G634JZR | |
| Lenovo Legion 9 16IRX9, RTX 4090 | |
| Lenovo Legion Pro 7 RTX4090 | |
| Alienware x16 R2 P120F | |
| WebXPRT 4 / Overall | |
| Asus ROG Strix Scar 17 G733PYV-LL053X | |
| Asus ROG Strix Scar 16 G634JZR | |
| Schenker XMG Neo 16 (Early 24) | |
| Schenker XMG Neo 16 E23 | |
| Medion Erazer Beast X40 2024 | |
| Average Intel Core i9-14900HX, NVIDIA GeForce RTX 4090 Laptop GPU (246 - 309, n=8) | |
| Average of class Gaming (176.4 - 345, n=108, last 2 years) | |
| Lenovo Legion Pro 7 RTX4090 | |
| Lenovo Legion 9 16IRX9, RTX 4090 | |
| Alienware x16 R2 P120F | |
| Mozilla Kraken 1.1 / Total | |
| Alienware x16 R2 P120F | |
| Lenovo Legion 9 16IRX9, RTX 4090 | |
| Lenovo Legion Pro 7 RTX4090 | |
| Average of class Gaming (397 - 594, n=116, last 2 years) | |
| Average Intel Core i9-14900HX, NVIDIA GeForce RTX 4090 Laptop GPU (428 - 535, n=11) | |
| Schenker XMG Neo 16 E23 | |
| Razer Blade 16 2024, RTX 4090 | |
| Asus ROG Strix Scar 16 G634JZR | |
| Medion Erazer Beast X40 2024 | |
| Schenker XMG Neo 16 (Early 24) | |
| Asus ROG Strix Scar 17 G733PYV-LL053X | |
* ... smaller is better
| PCMark 10 Score | 9017 points | |
Help | ||
| AIDA64 / Memory Copy | |
| Alienware x16 R2 P120F | |
| Lenovo Legion 9 16IRX9, RTX 4090 | |
| Schenker XMG Neo 16 (Early 24) | |
| Asus ROG Strix Scar 16 G634JZR | |
| Razer Blade 16 2024, RTX 4090 | |
| Schenker XMG Neo 16 (Early 24) | |
| Lenovo Legion Pro 7 RTX4090 | |
| Medion Erazer Beast X40 2024 | |
| Schenker XMG Neo 16 E23 | |
| Average Intel Core i9-14900HX (38028 - 83392, n=36) | |
| Average of class Gaming (21750 - 108104, n=123, last 2 years) | |
| Asus ROG Strix Scar 17 G733PYV-LL053X | |
| AIDA64 / Memory Read | |
| Asus ROG Strix Scar 16 G634JZR | |
| Schenker XMG Neo 16 (Early 24) | |
| Lenovo Legion Pro 7 RTX4090 | |
| Schenker XMG Neo 16 (Early 24) | |
| Razer Blade 16 2024, RTX 4090 | |
| Medion Erazer Beast X40 2024 | |
| Alienware x16 R2 P120F | |
| Schenker XMG Neo 16 E23 | |
| Lenovo Legion 9 16IRX9, RTX 4090 | |
| Average Intel Core i9-14900HX (43306 - 87568, n=36) | |
| Average of class Gaming (22956 - 104349, n=123, last 2 years) | |
| Asus ROG Strix Scar 17 G733PYV-LL053X | |
| AIDA64 / Memory Write | |
| Lenovo Legion 9 16IRX9, RTX 4090 | |
| Schenker XMG Neo 16 (Early 24) | |
| Schenker XMG Neo 16 (Early 24) | |
| Asus ROG Strix Scar 16 G634JZR | |
| Medion Erazer Beast X40 2024 | |
| Lenovo Legion Pro 7 RTX4090 | |
| Razer Blade 16 2024, RTX 4090 | |
| Average of class Gaming (22297 - 133486, n=123, last 2 years) | |
| Alienware x16 R2 P120F | |
| Average Intel Core i9-14900HX (37146 - 80589, n=36) | |
| Schenker XMG Neo 16 E23 | |
| Asus ROG Strix Scar 17 G733PYV-LL053X | |
| AIDA64 / Memory Latency | |
| Alienware x16 R2 P120F | |
| Average of class Gaming (75.3 - 259, n=123, last 2 years) | |
| Lenovo Legion 9 16IRX9, RTX 4090 | |
| Asus ROG Strix Scar 17 G733PYV-LL053X | |
| Schenker XMG Neo 16 E23 | |
| Lenovo Legion Pro 7 RTX4090 | |
| Average Intel Core i9-14900HX (76.1 - 105, n=36) | |
| Razer Blade 16 2024, RTX 4090 | |
| Medion Erazer Beast X40 2024 | |
| Asus ROG Strix Scar 16 G634JZR | |
| Schenker XMG Neo 16 (Early 24) | |
| Schenker XMG Neo 16 (Early 24) | |
* ... smaller is better
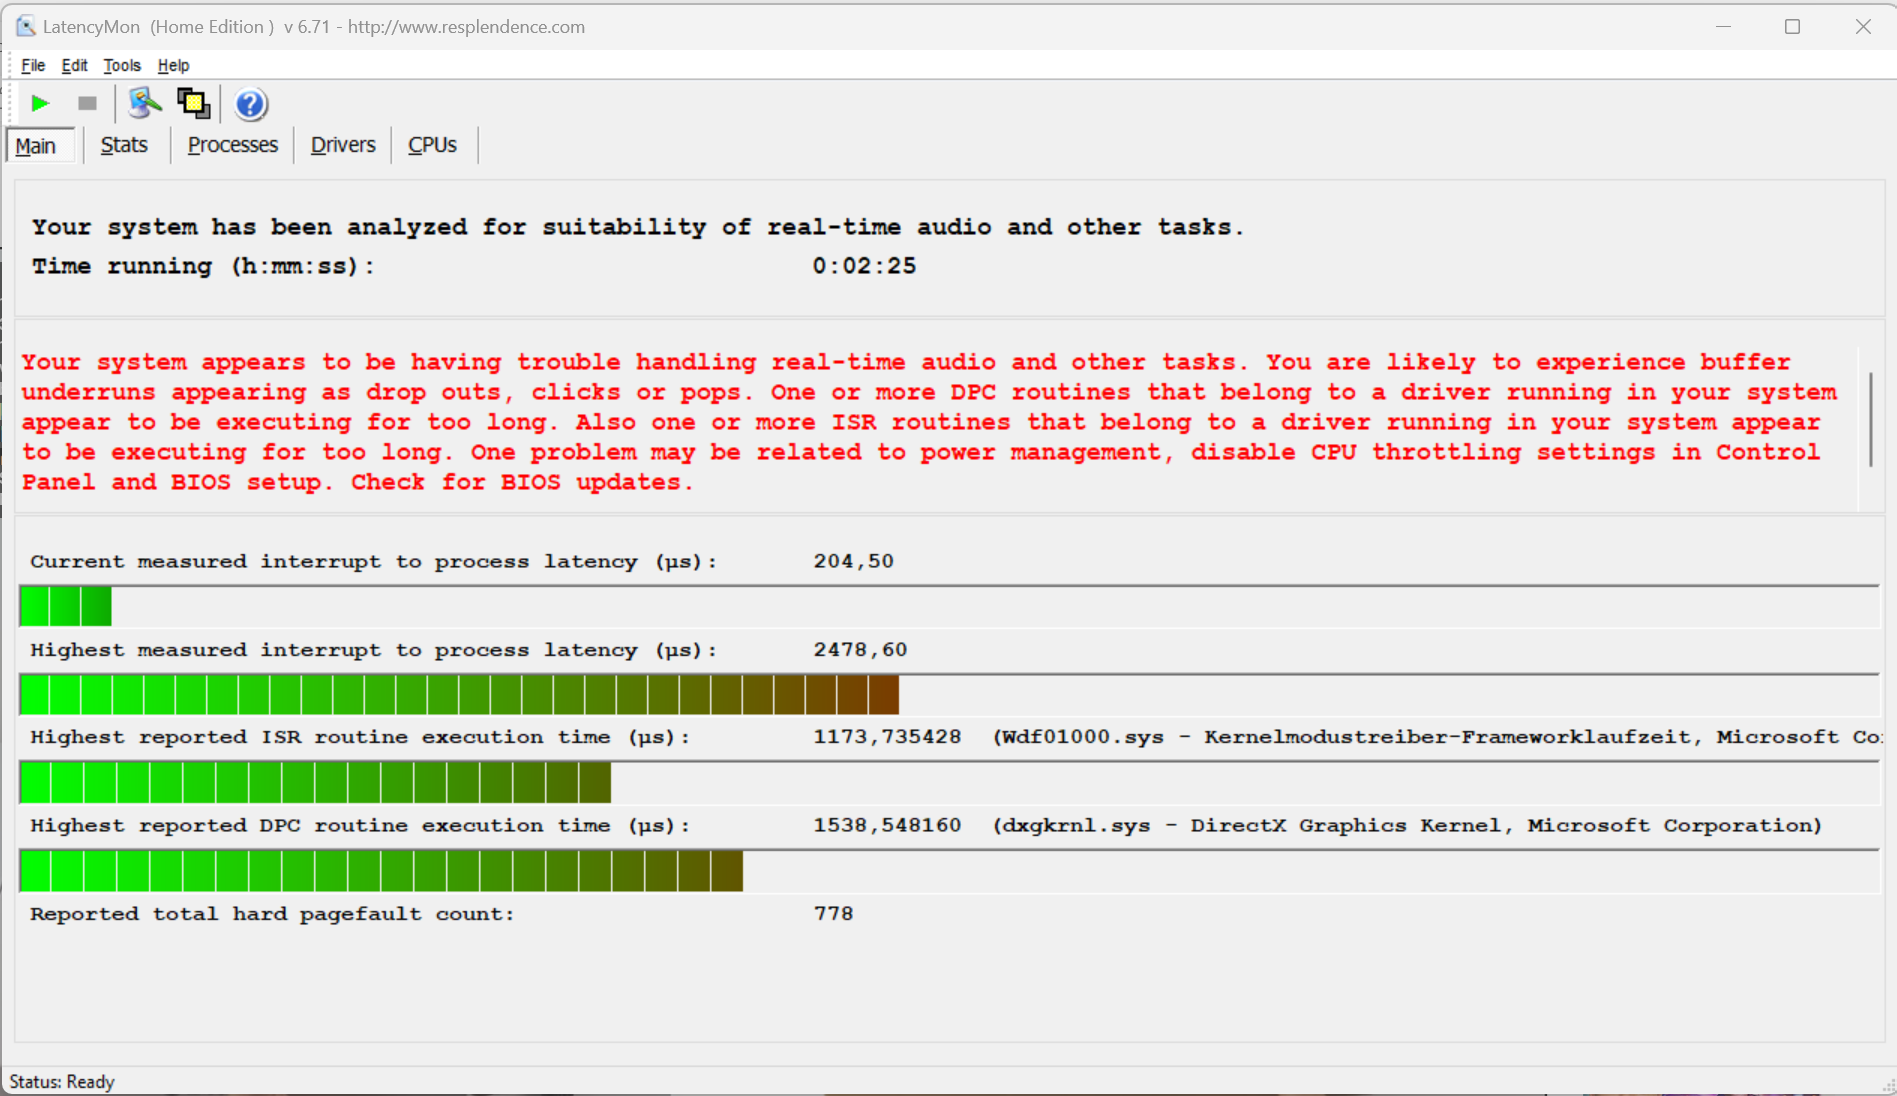
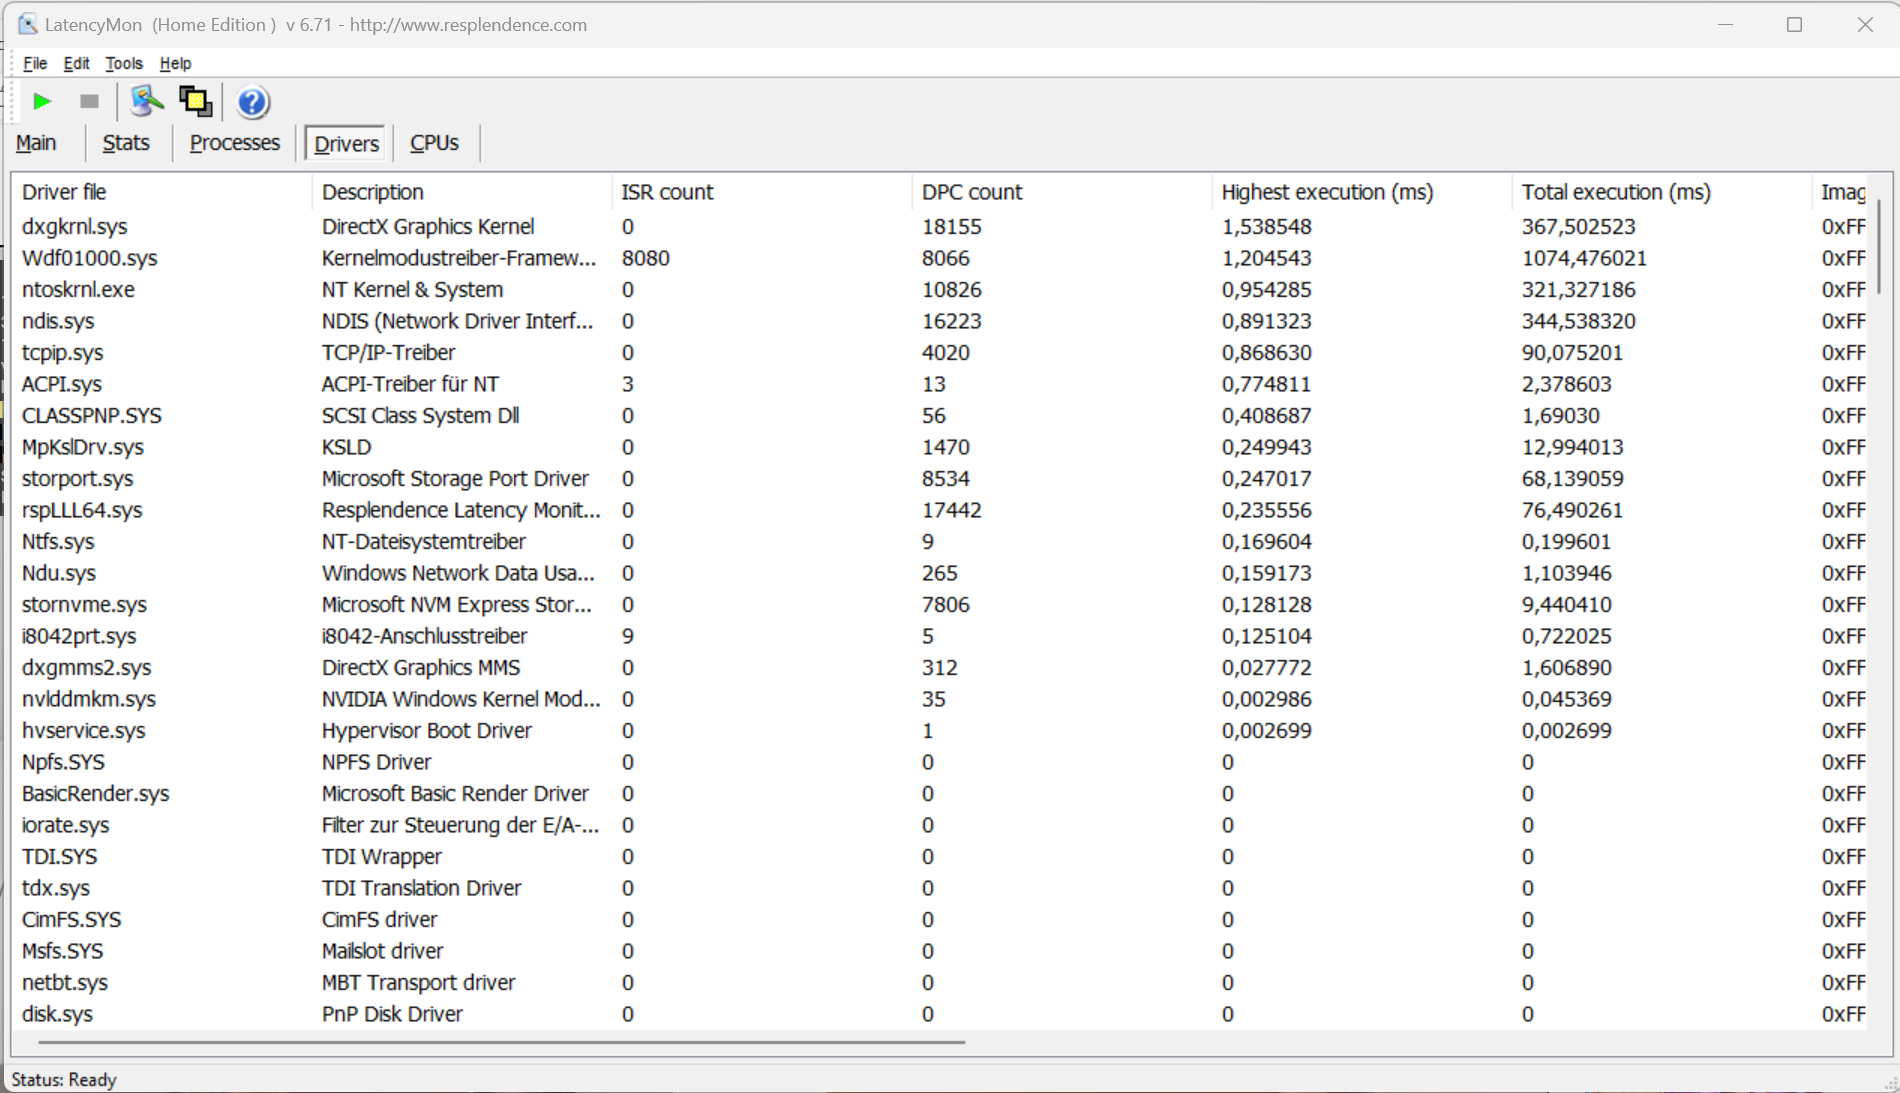
DPC 延迟
标准延迟监控器测试(上网、4K 视频播放、Prime95 高负载)发现了一些异常。该系统似乎不适合实时视频和音频编辑。未来的软件更新可能会对此产生影响。
| DPC Latencies / LatencyMon - interrupt to process latency (max), Web, Youtube, Prime95 | |
| Schenker XMG Neo 16 E23 | |
| Schenker XMG Neo 16 (Early 24) | |
| Razer Blade 16 2024, RTX 4090 | |
| Medion Erazer Beast X40 2024 | |
| Asus ROG Strix Scar 17 G733PYV-LL053X | |
* ... smaller is better
大容量存储器
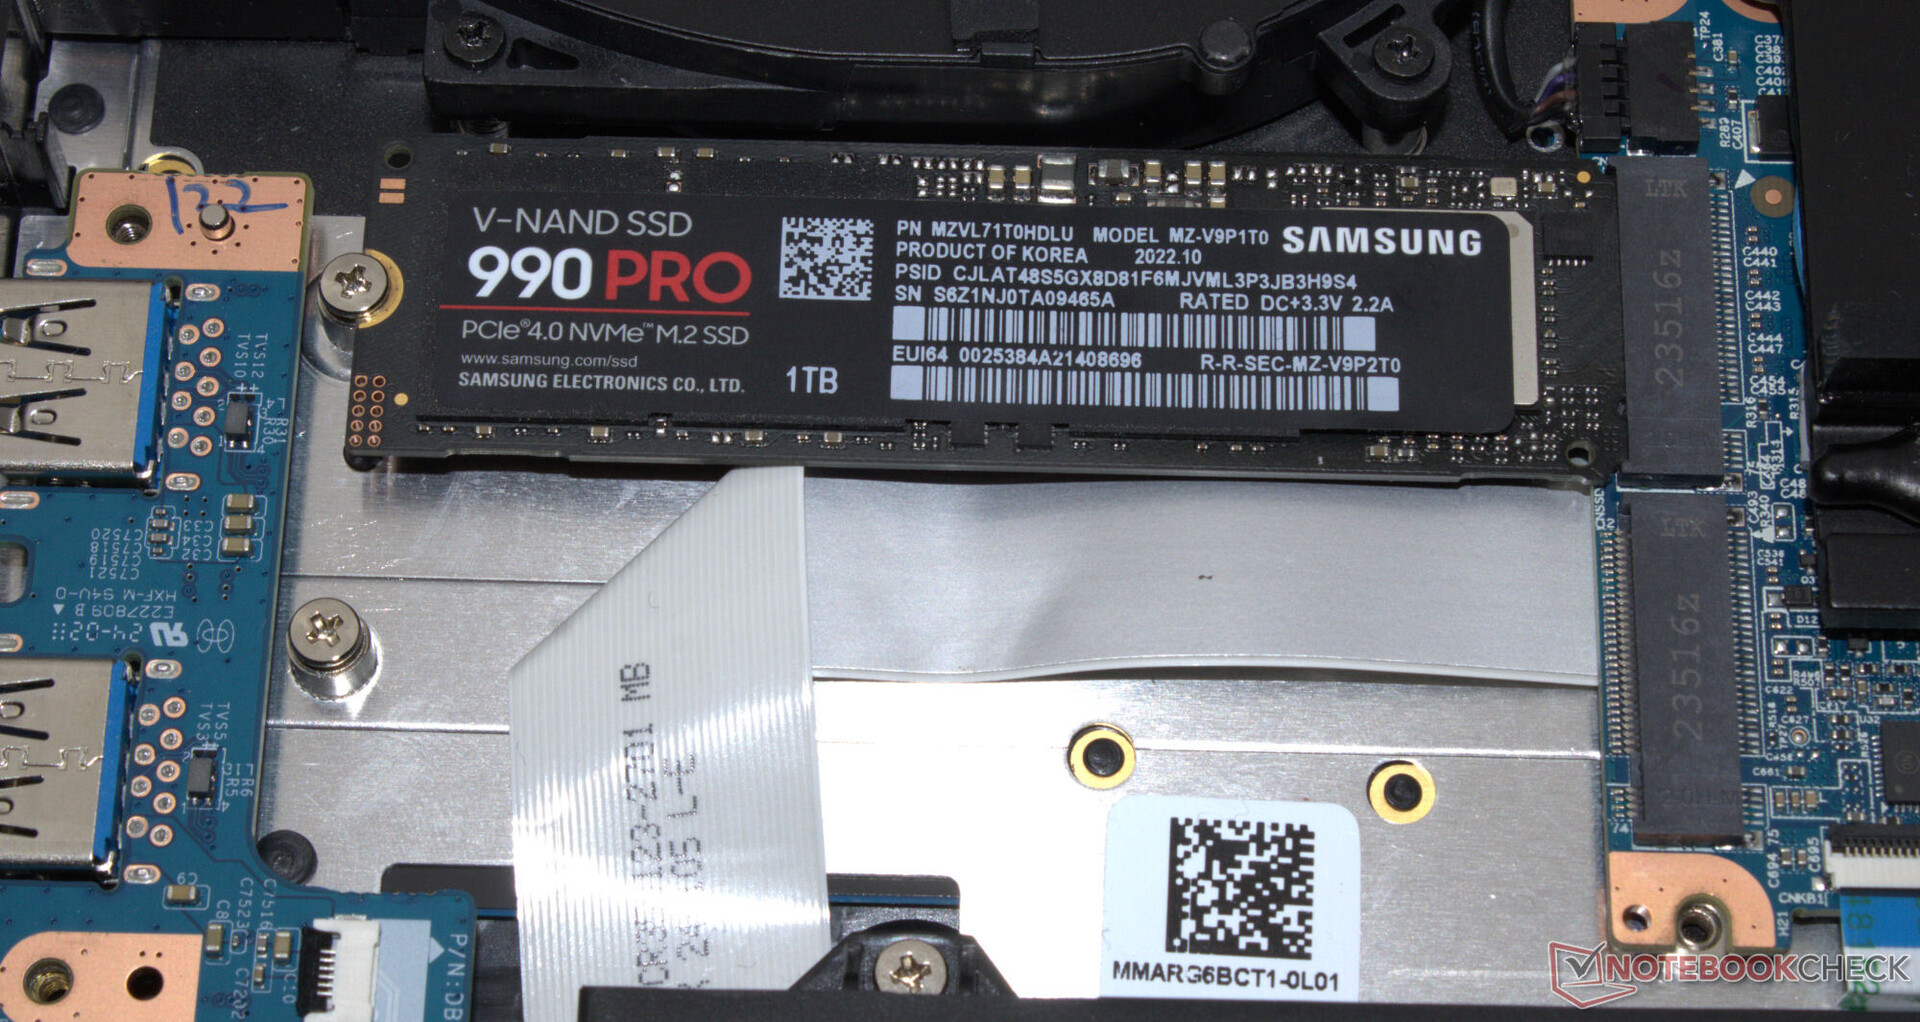
与往常一样,申克公司在其网上商店为客户提供了多种固态硬盘选择--Neo 内部有两个固态硬盘空间。提供 RAID 0/1 支持。评测设备的三星固态硬盘(1 TB、PCIe 4、M.2 2280)传输速度良好。一个积极的特点是没有热节流。

* ... smaller is better
Continuous Performance: DiskSpd Read Loop, Queue Depth 8
图形卡
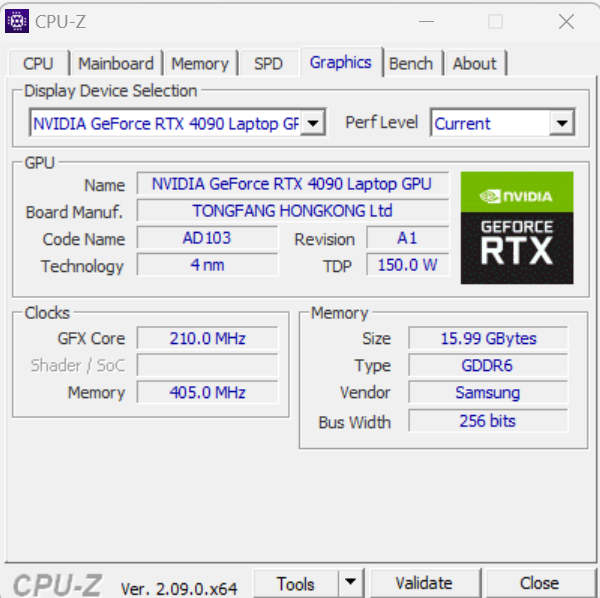
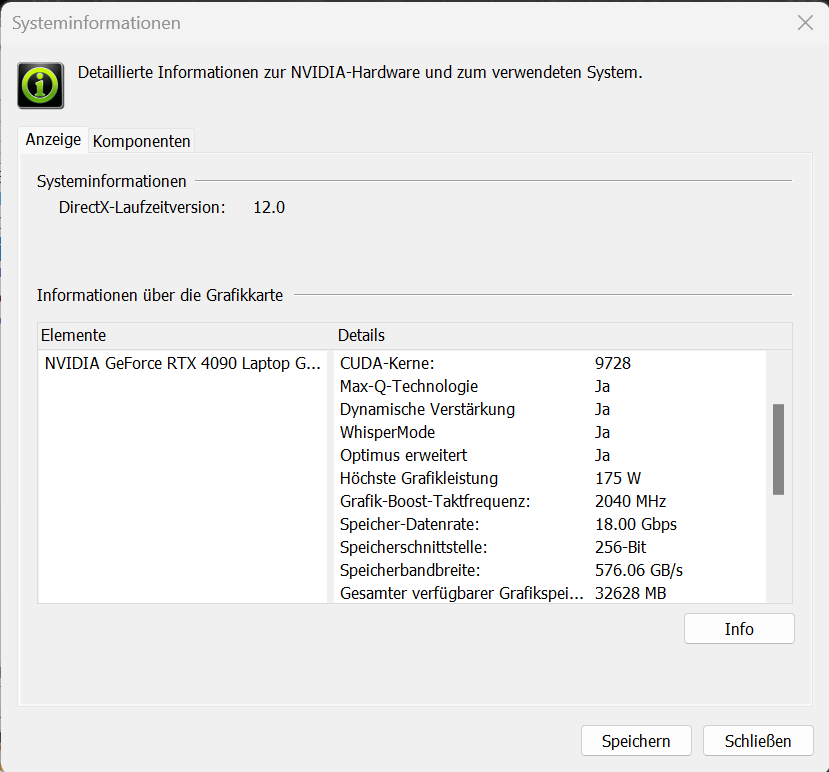
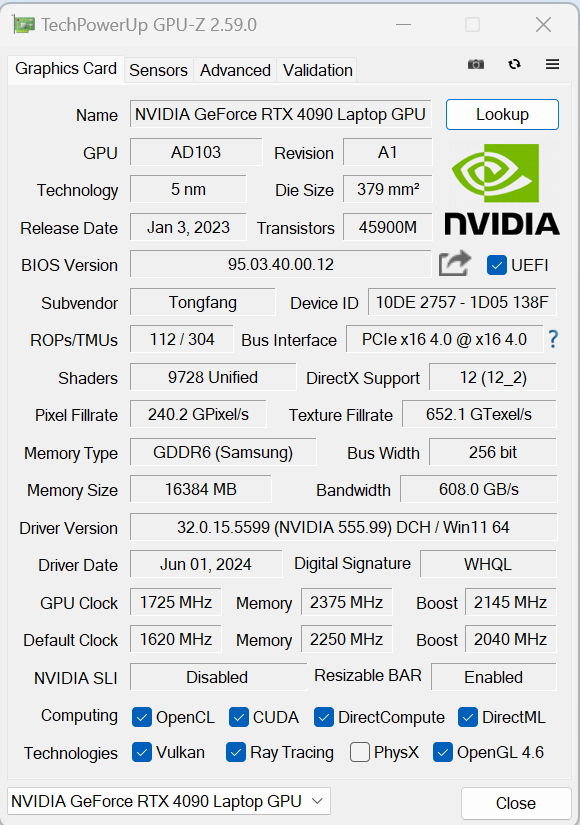
目前 GeForce RTX 4090是 Nvidia 移动 GPU 中性能最高的。9,728 个着色器、256 位总线以及快速 GDDR6 RAM(16,384 MB)是这款像素加速器的特点。最大 TGP 为 175 瓦(150 瓦 + 25 瓦动态提升),不可能更高。
到目前为止,基准测试结果高于(超频)和低于(发烧级、平衡级)RTX 4090 的平均水平。绿洲 "水冷系统帮助实现了性能的小幅提升。无论如何,主要竞争对手 刀锋 16与之保持一定距离。在 dGPU 和 Optimus 之间切换无需重启:支持高级 Optimus。
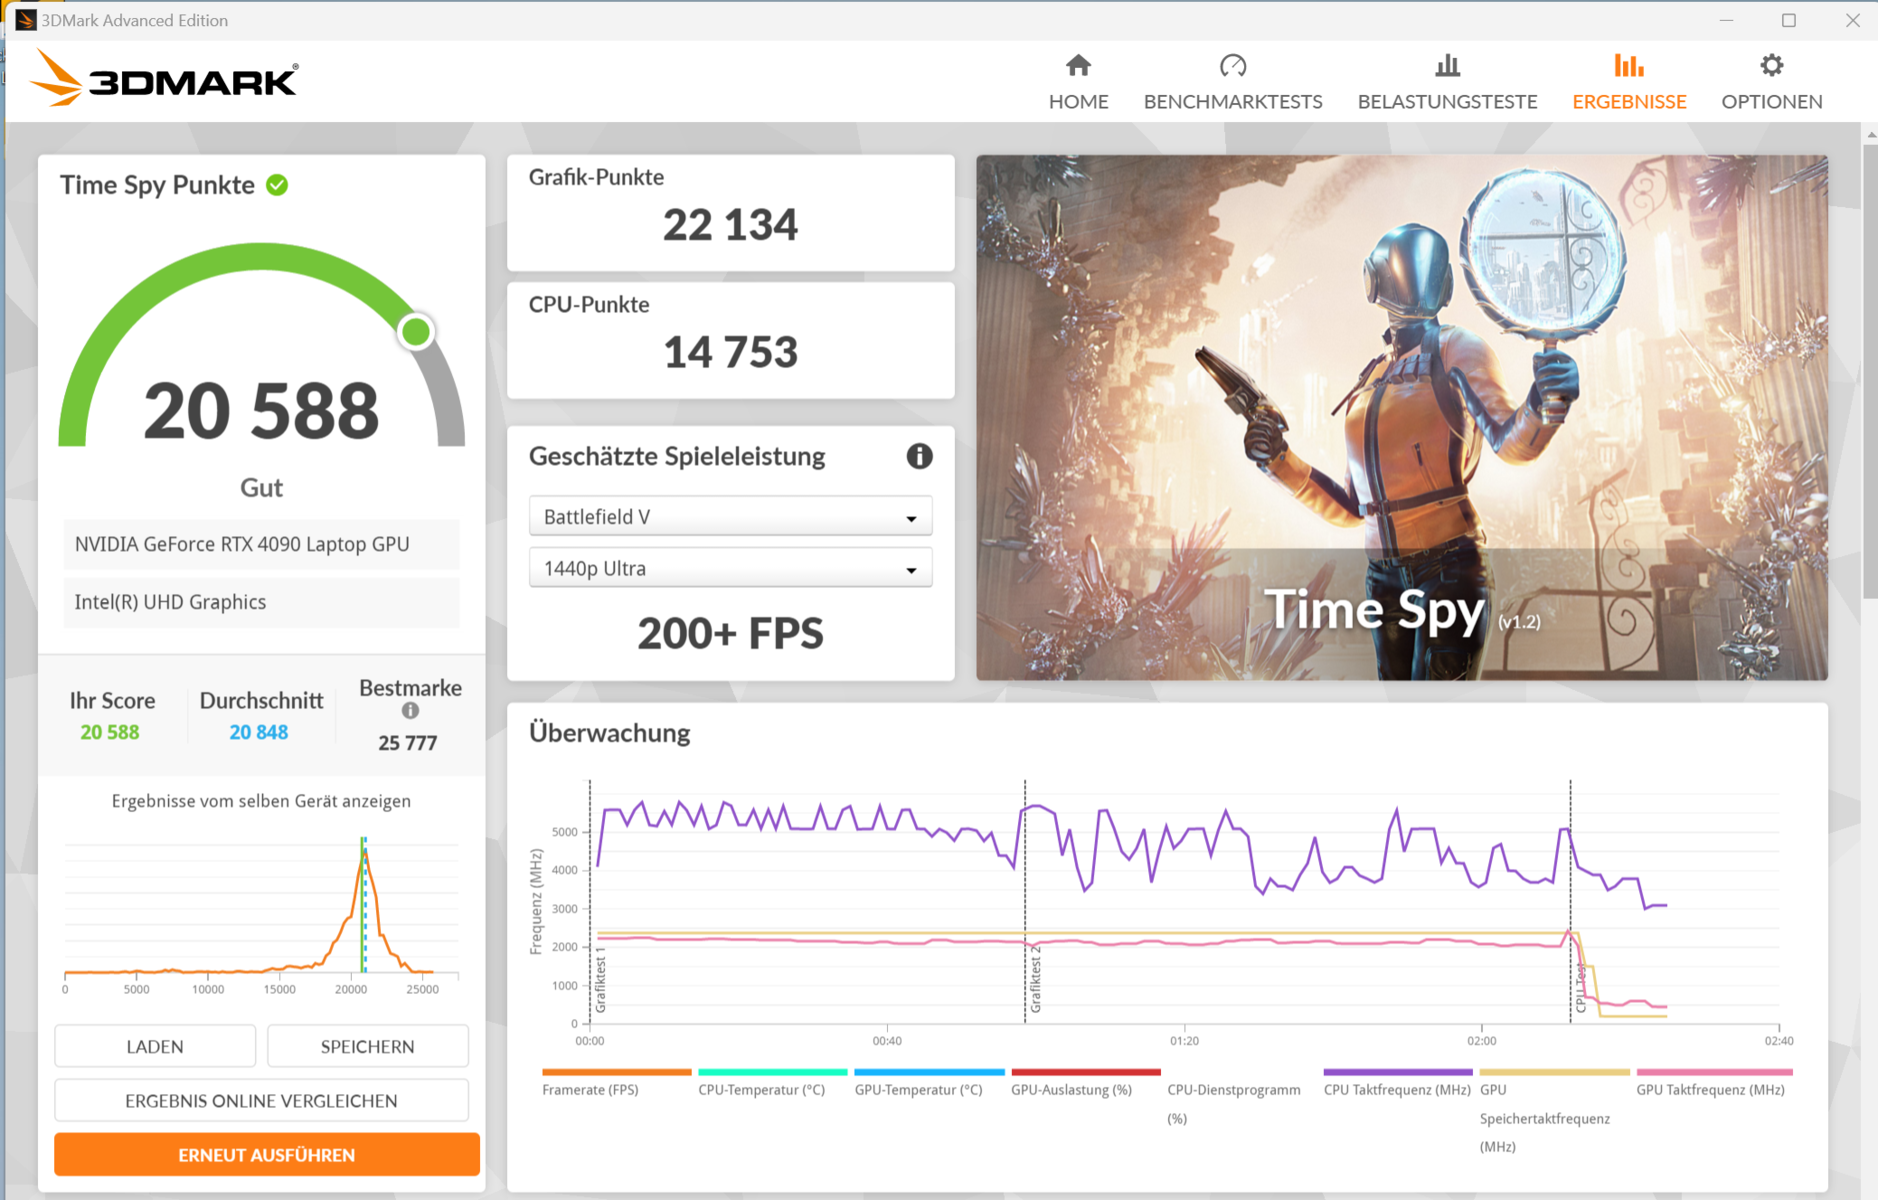
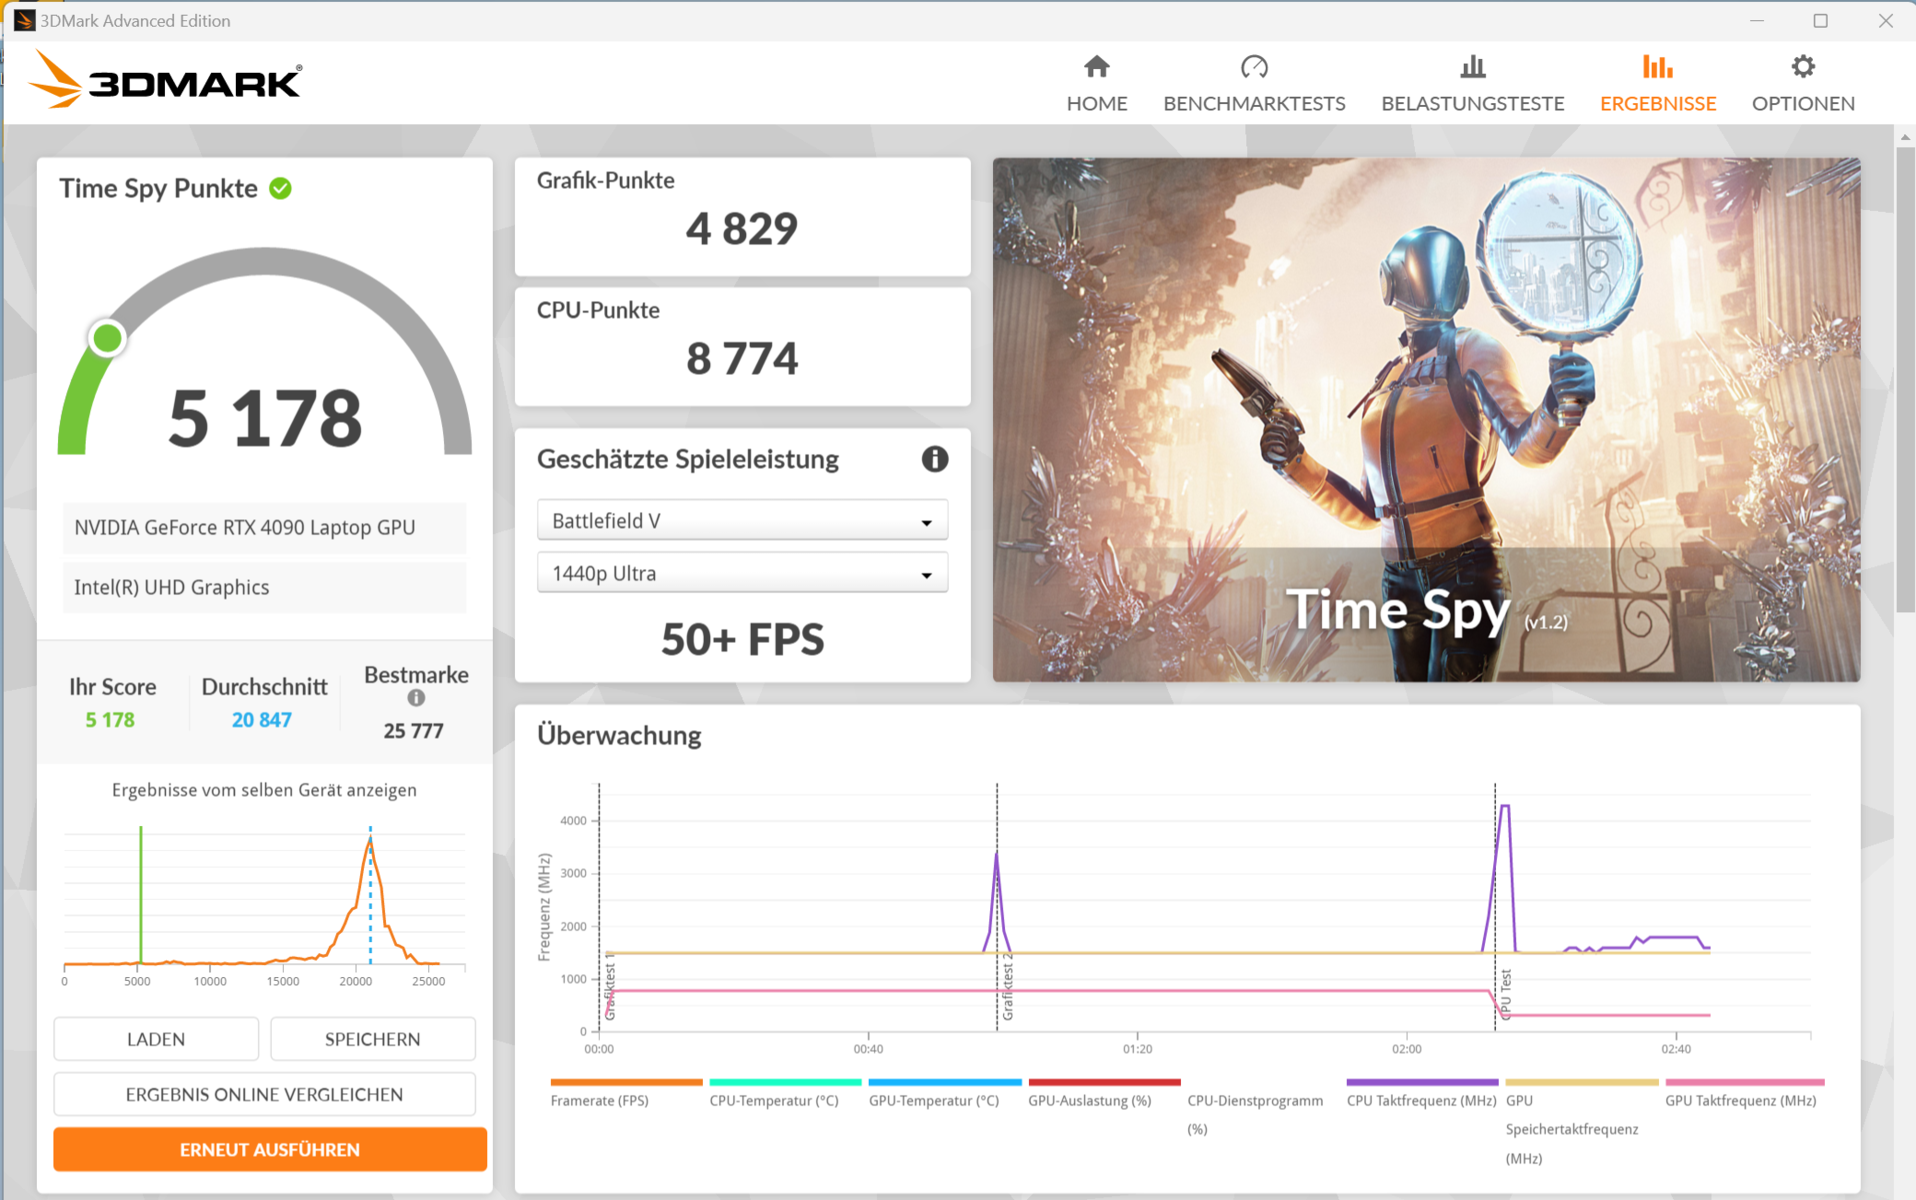
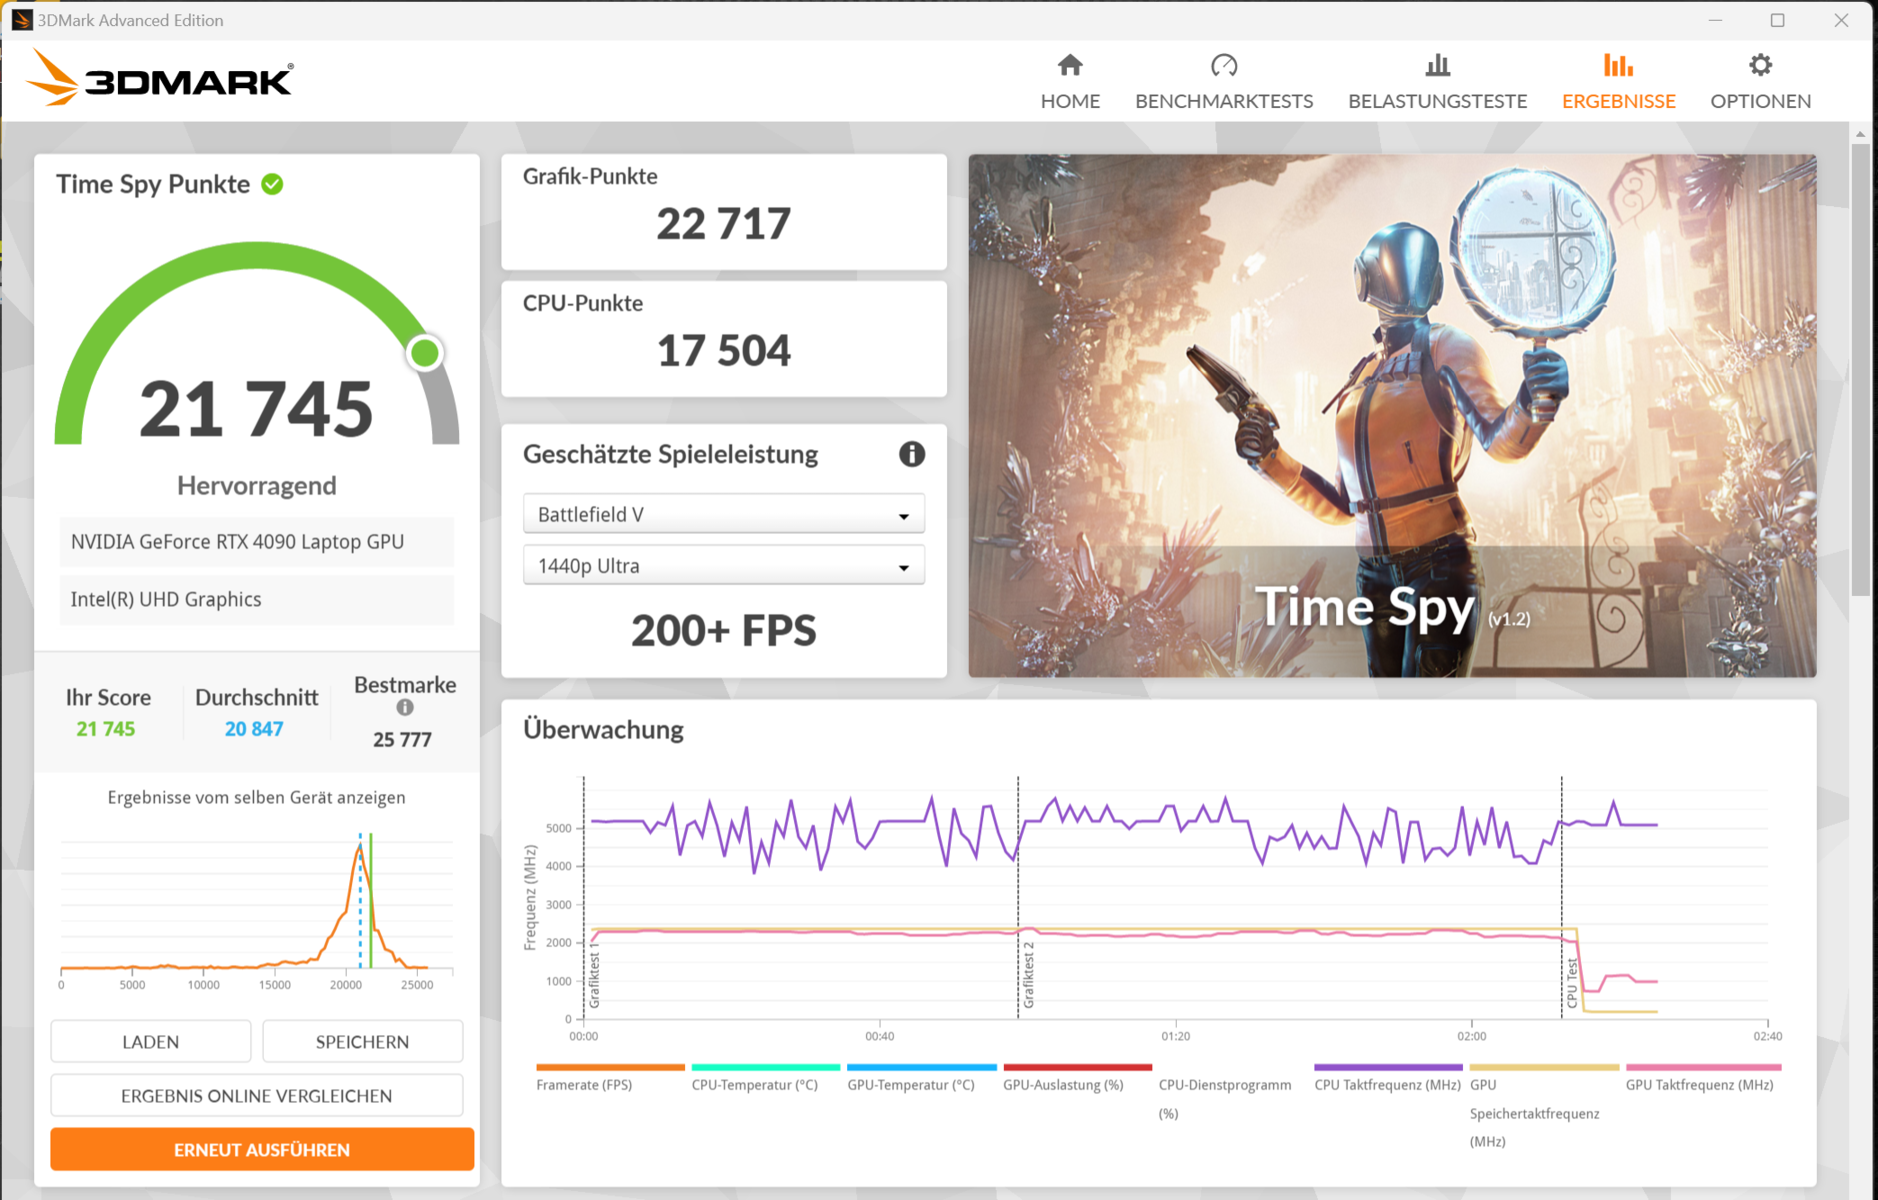
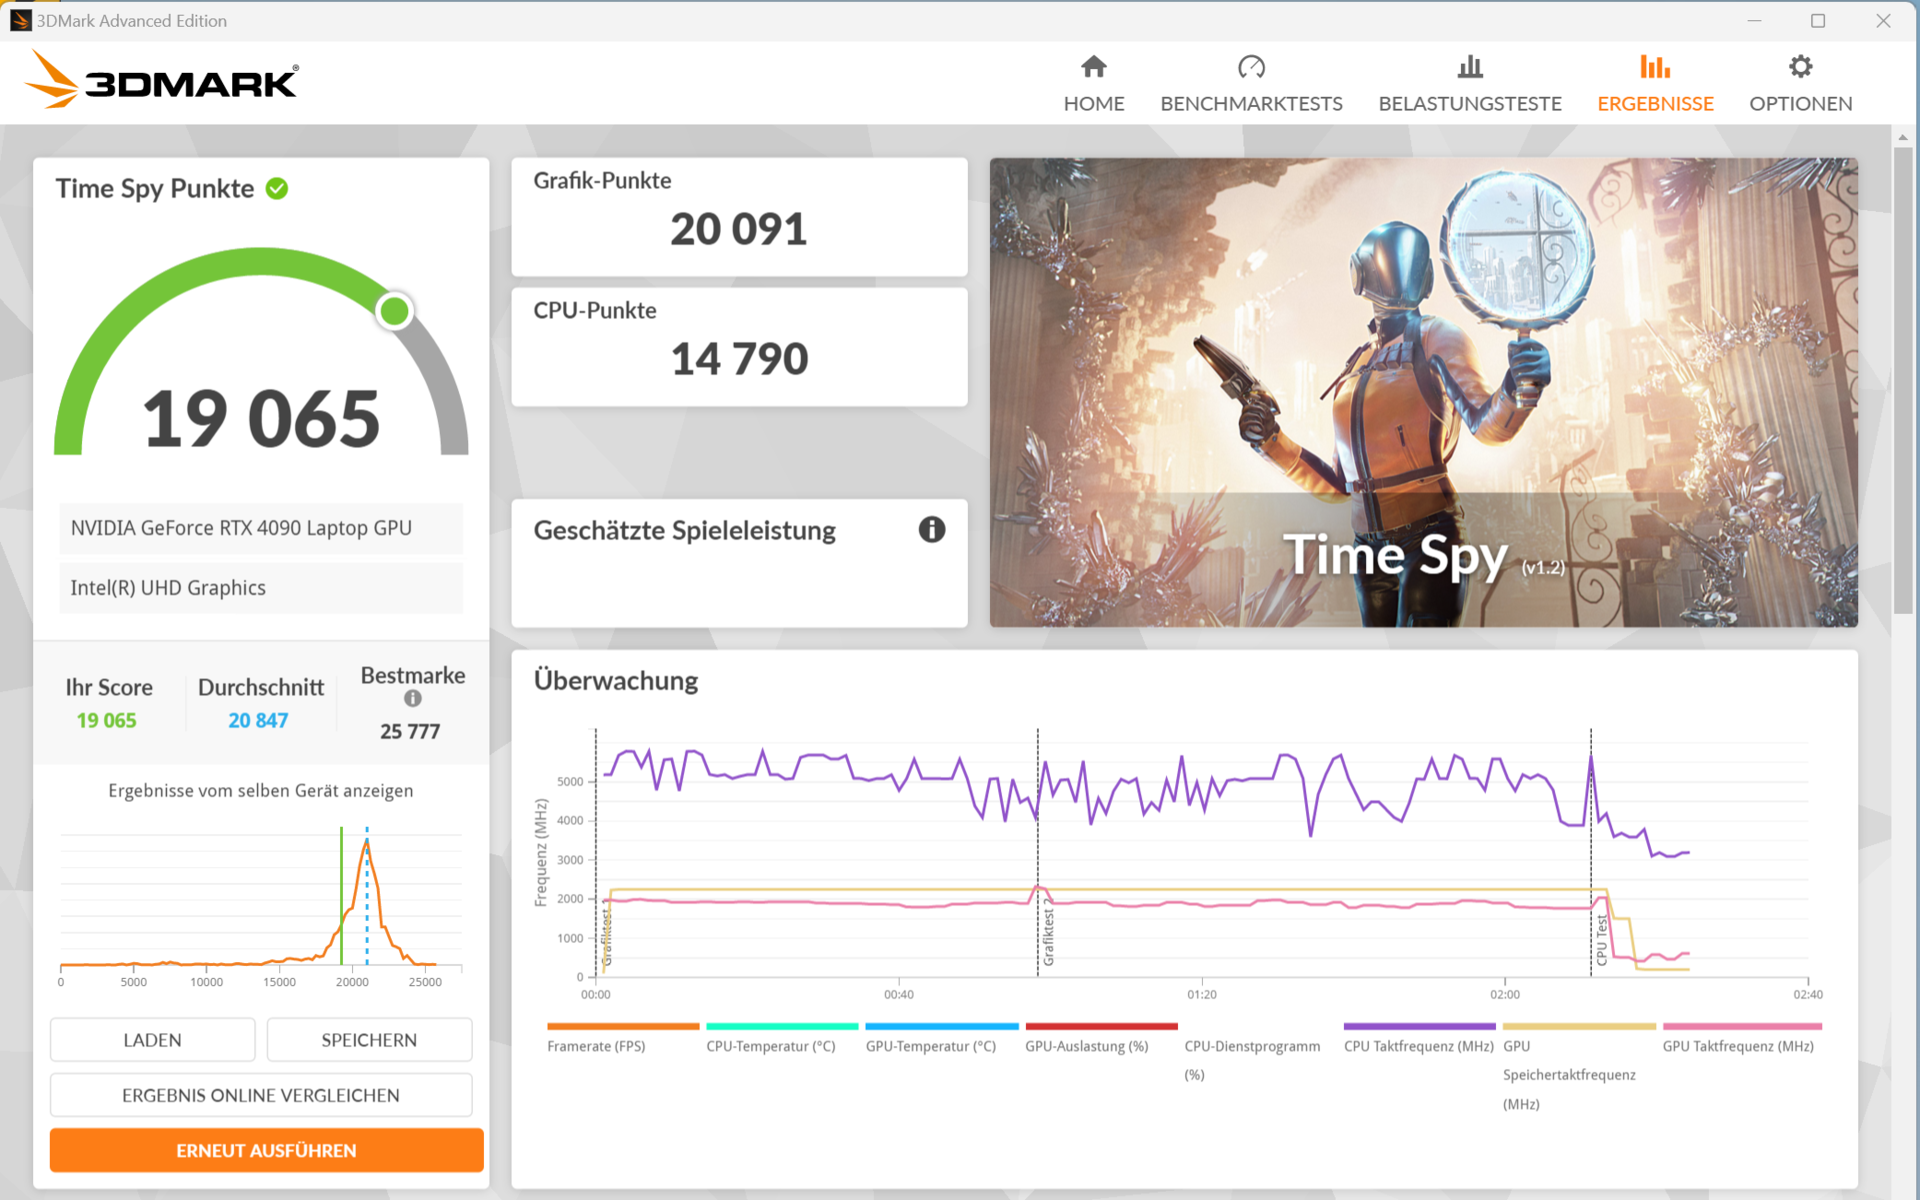
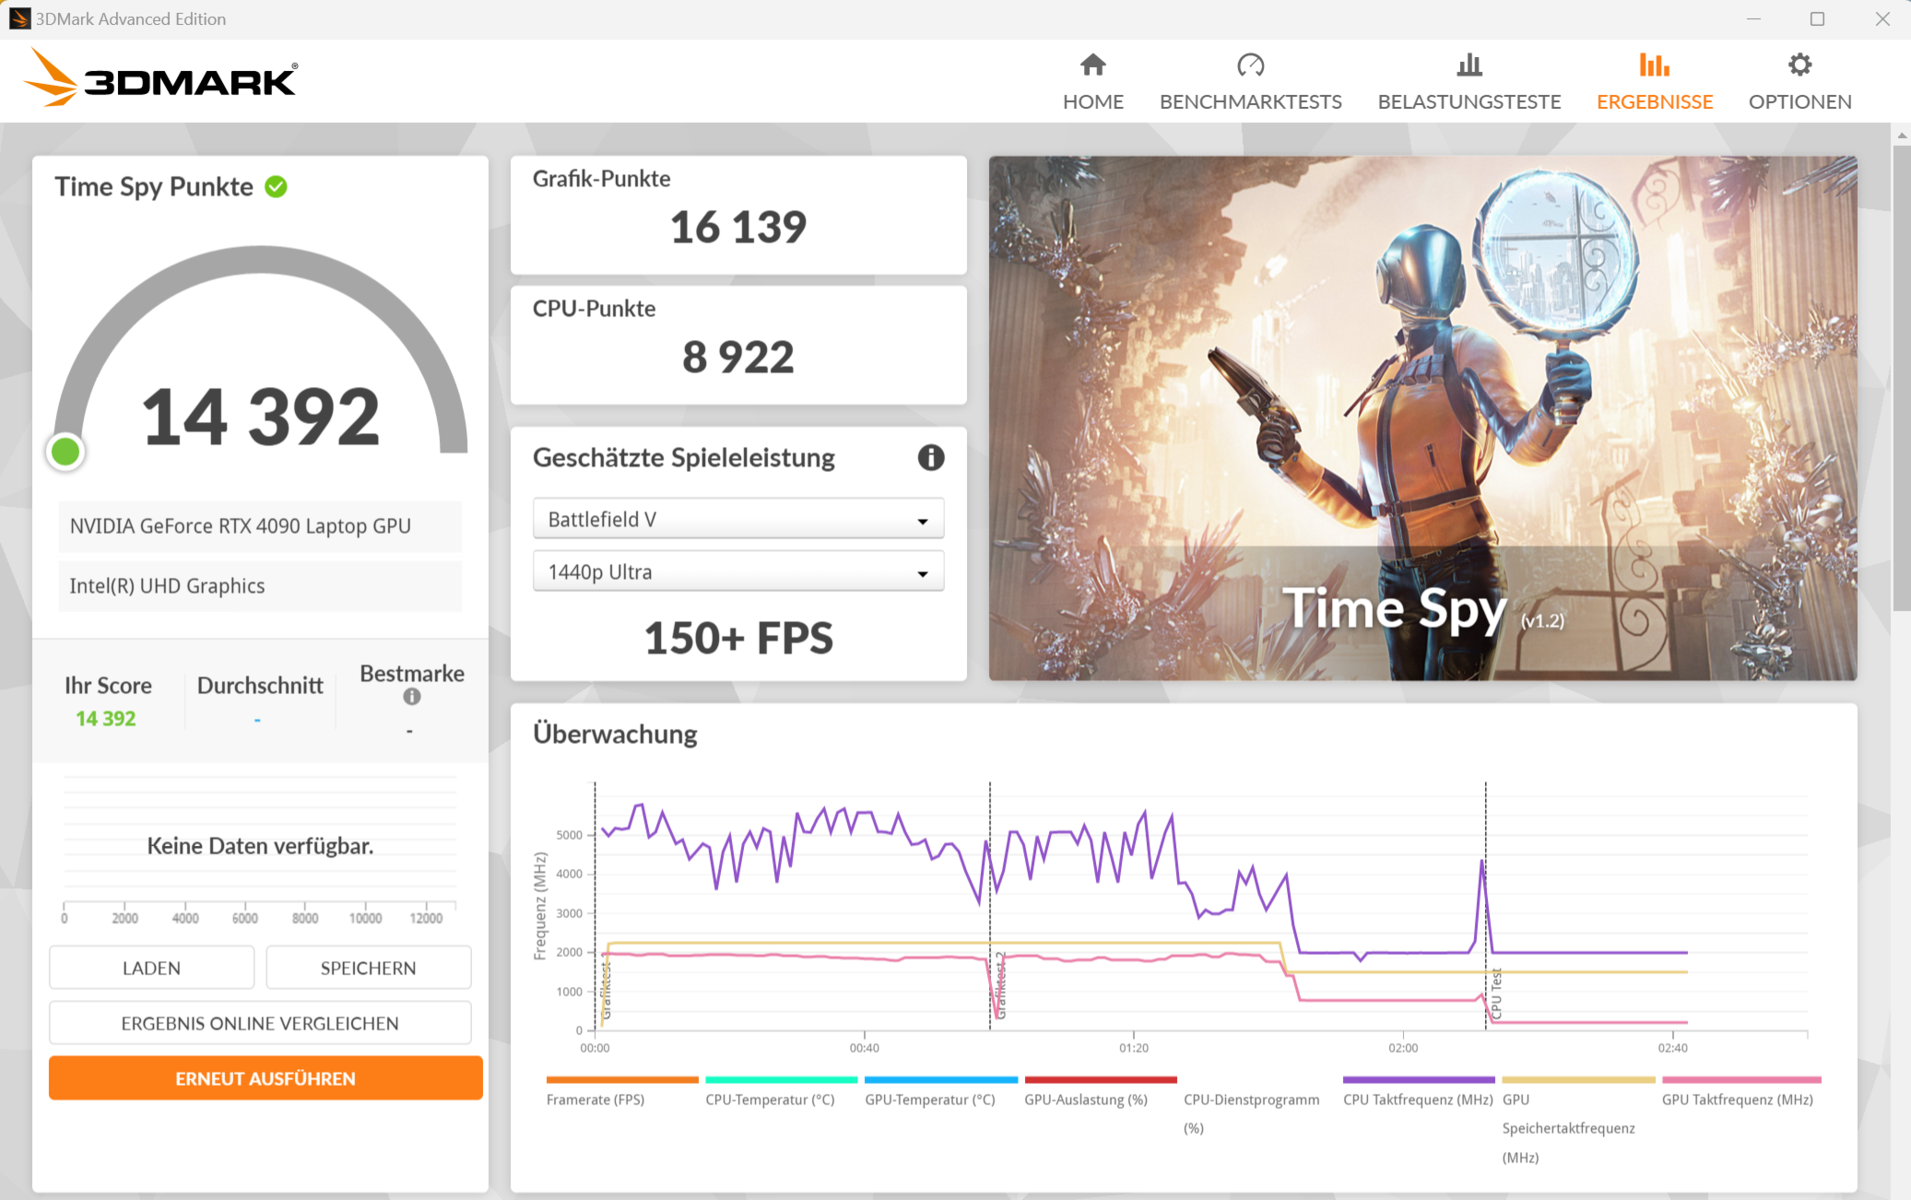
| 3DMark 06 Standard Score | 62889 points | |
| 3DMark 11 Performance | 43829 points | |
| 3DMark Fire Strike Score | 38597 points | |
| 3DMark Time Spy Score | 20588 points | |
| 3DMark Steel Nomad Score | 5102 points | |
Help | ||
| Geekbench 6.6 | |
| GPU Vulkan | |
| Razer Blade 16 2024, RTX 4090 (6.2.1) | |
| Medion Erazer Beast X40 2024 (6.2.1) | |
| Schenker XMG Neo 16 (Early 24) (6.2.1) | |
| Asus ROG Strix Scar 17 G733PYV-LL053X | |
| Average NVIDIA GeForce RTX 4090 Laptop GPU (128748 - 196201, n=16) | |
| Schenker XMG Neo 16 (Early 24) (6.2.1, Overboost, Oasis) | |
| Lenovo Legion 9 16IRX9, RTX 4090 (6.2.1) | |
| Average of class Gaming (28528 - 231659, n=71, last 2 years) | |
| Alienware x16 R2 P120F (6.2.1) | |
| Asus ROG Strix Scar 16 G634JZR (6.2.1) | |
| GPU OpenCL | |
| Medion Erazer Beast X40 2024 (6.2.1) | |
| Schenker XMG Neo 16 (Early 24) (6.2.1, Overboost, Oasis) | |
| Asus ROG Strix Scar 17 G733PYV-LL053X | |
| Schenker XMG Neo 16 (Early 24) (6.2.1) | |
| Lenovo Legion 9 16IRX9, RTX 4090 (6.2.1) | |
| Average NVIDIA GeForce RTX 4090 Laptop GPU (159127 - 209521, n=20) | |
| Razer Blade 16 2024, RTX 4090 (6.2.1) | |
| Asus ROG Strix Scar 16 G634JZR (6.2.1) | |
| Alienware x16 R2 P120F (6.2.1) | |
| Average of class Gaming (64989 - 253130, n=120, last 2 years) | |
* ... smaller is better
游戏性能
XMG 电脑旨在以最高设置处理 QHD 游戏。对于 RTX 4090(超增压)来说,帧率高于平均水平,水冷性能略有提升。图形处理器功能、帧生成和 DLSS 3 可在最大设置下通过光线追踪实现更高分辨率,但仅限于提供这些功能的游戏。
| The Witcher 3 - 1920x1080 Ultra Graphics & Postprocessing (HBAO+) | |
| Schenker XMG Neo 16 (Early 24) | |
| Schenker XMG Neo 16 (Early 24) (Overboost, Oasis) | |
| Schenker XMG Neo 16 E23 | |
| Asus ROG Strix Scar 17 G733PYV-LL053X | |
| Medion Erazer Beast X40 2024 | |
| Lenovo Legion 9 16IRX9, RTX 4090 | |
| Lenovo Legion Pro 7 RTX4090 | |
| Razer Blade 16 2024, RTX 4090 | |
| Average NVIDIA GeForce RTX 4090 Laptop GPU (139.2 - 216, n=35) | |
| Asus ROG Strix Scar 16 G634JZR | |
| Alienware x16 R2 P120F | |
| Average of class Gaming (83.7 - 240, n=25, last 2 years) | |
| GTA V - 1920x1080 Highest AA:4xMSAA + FX AF:16x | |
| Asus ROG Strix Scar 17 G733PYV-LL053X | |
| Schenker XMG Neo 16 (Early 24) (Overboost, Oasis) | |
| Schenker XMG Neo 16 (Early 24) | |
| Schenker XMG Neo 16 E23 | |
| Lenovo Legion Pro 7 RTX4090 | |
| Medion Erazer Beast X40 2024 | |
| Asus ROG Strix Scar 16 G634JZR | |
| Average NVIDIA GeForce RTX 4090 Laptop GPU (91.1 - 167.7, n=40) | |
| Razer Blade 16 2024, RTX 4090 | |
| Lenovo Legion 9 16IRX9, RTX 4090 | |
| Average of class Gaming (48.3 - 186.9, n=113, last 2 years) | |
| Final Fantasy XV Benchmark - 1920x1080 High Quality | |
| Schenker XMG Neo 16 (Early 24) (1.3, Overboost, Oasis) | |
| Schenker XMG Neo 16 (Early 24) (1.3) | |
| Schenker XMG Neo 16 E23 (1.3) | |
| Lenovo Legion Pro 7 RTX4090 (1.3) | |
| Medion Erazer Beast X40 2024 (1.3) | |
| Asus ROG Strix Scar 17 G733PYV-LL053X (1.3) | |
| Asus ROG Strix Scar 16 G634JZR (1.3) | |
| Average NVIDIA GeForce RTX 4090 Laptop GPU (122.2 - 201, n=40) | |
| Lenovo Legion 9 16IRX9, RTX 4090 (1.3) | |
| Average of class Gaming (41 - 215, n=117, last 2 years) | |
| Alienware x16 R2 P120F (1.3) | |
| Razer Blade 16 2024, RTX 4090 (1.3) | |
| Strange Brigade - 1920x1080 ultra AA:ultra AF:16 | |
| Asus ROG Strix Scar 17 G733PYV-LL053X (1.47.22.14 D3D12) | |
| Schenker XMG Neo 16 (Early 24) (1.47.22.14 D3D12, Overboost, Oasis) | |
| Schenker XMG Neo 16 (Early 24) (1.47.22.14 D3D12) | |
| Schenker XMG Neo 16 E23 (1.47.22.14 D3D12) | |
| Medion Erazer Beast X40 2024 (1.47.22.14 D3D12) | |
| Lenovo Legion 9 16IRX9, RTX 4090 (1.47.22.14 D3D12) | |
| Razer Blade 16 2024, RTX 4090 (1.47.22.14 D3D12) | |
| Average NVIDIA GeForce RTX 4090 Laptop GPU (233 - 421, n=39) | |
| Lenovo Legion Pro 7 RTX4090 (1.47.22.14 D3D12) | |
| Asus ROG Strix Scar 16 G634JZR (1.47.22.14 D3D12) | |
| Alienware x16 R2 P120F (1.47.22.14 D3D12) | |
| Average of class Gaming (76.3 - 456, n=107, last 2 years) | |
| Dota 2 Reborn - 1920x1080 ultra (3/3) best looking | |
| Asus ROG Strix Scar 17 G733PYV-LL053X | |
| Schenker XMG Neo 16 (Early 24) | |
| Schenker XMG Neo 16 (Early 24) (Overboost, Oasis) | |
| Medion Erazer Beast X40 2024 | |
| Razer Blade 16 2024, RTX 4090 | |
| Schenker XMG Neo 16 E23 | |
| Lenovo Legion Pro 7 RTX4090 | |
| Asus ROG Strix Scar 16 G634JZR | |
| Average NVIDIA GeForce RTX 4090 Laptop GPU (115.7 - 220, n=42) | |
| Lenovo Legion 9 16IRX9, RTX 4090 | |
| Average of class Gaming (84.8 - 248, n=125, last 2 years) | |
| Alienware x16 R2 P120F | |
| X-Plane 11.11 - 1920x1080 high (fps_test=3) | |
| Asus ROG Strix Scar 17 G733PYV-LL053X | |
| Razer Blade 16 2024, RTX 4090 | |
| Schenker XMG Neo 16 (Early 24) | |
| Medion Erazer Beast X40 2024 | |
| Asus ROG Strix Scar 16 G634JZR | |
| Schenker XMG Neo 16 (Early 24) (v6.92.6600, Overboost, Oasis) | |
| Lenovo Legion Pro 7 RTX4090 | |
| Schenker XMG Neo 16 E23 | |
| Average NVIDIA GeForce RTX 4090 Laptop GPU (77.8 - 166.2, n=46) | |
| Lenovo Legion 9 16IRX9, RTX 4090 | |
| Average of class Gaming (52.1 - 144.5, n=128, last 2 years) | |
| Alienware x16 R2 P120F | |
| F1 24 | |
| 1920x1080 Ultra High Preset AA:T AF:16x | |
| Asus ROG Strix Scar 17 G733PYV-LL053X (1222678) | |
| Schenker XMG Neo 16 (Early 24) (1119215) | |
| XMG Neo 16 E23 | |
| Average NVIDIA GeForce RTX 4090 Laptop GPU (88 - 144.9, n=5) | |
| Lenovo Legion 9 16IRX9, RTX 4090 (1118244) | |
| Average of class Gaming (46.1 - 157.8, n=60, last 2 years) | |
| 2560x1440 Ultra High Preset AA:T AF:16x | |
| Asus ROG Strix Scar 17 G733PYV-LL053X (1222678) | |
| Schenker XMG Neo 16 (Early 24) (1119215) | |
| XMG Neo 16 E23 | |
| Average NVIDIA GeForce RTX 4090 Laptop GPU (58.5 - 96.8, n=5) | |
| Lenovo Legion 9 16IRX9, RTX 4090 (1118244) | |
| Average of class Gaming (29.8 - 106.9, n=58, last 2 years) | |
| 2560x1440 Ultra High Preset + Quality DLSS AF:16x | |
| Asus ROG Strix Scar 17 G733PYV-LL053X (1222678) | |
| Schenker XMG Neo 16 (Early 24) (1119215) | |
| Average NVIDIA GeForce RTX 4090 Laptop GPU (88.3 - 150.4, n=3) | |
| Average of class Gaming (14.3 - 159.3, n=46, last 2 years) | |
| Senua's Saga Hellblade 2 | |
| 1920x1080 High Preset | |
| Schenker XMG Neo 16 (Early 24) | |
| Average NVIDIA GeForce RTX 4090 Laptop GPU (74 - 78.8, n=2) | |
| XMG Neo 16 E23 | |
| Average of class Gaming (33.9 - 86.1, n=17, last 2 years) | |
| 2560x1440 High Preset | |
| Schenker XMG Neo 16 (Early 24) | |
| Average NVIDIA GeForce RTX 4090 Laptop GPU (51.8 - 57.3, n=2) | |
| XMG Neo 16 E23 | |
| Average of class Gaming (24.2 - 63.1, n=13, last 2 years) | |
| 2560x1440 High Preset + Quality DLSS | |
| Schenker XMG Neo 16 (Early 24) | |
| Average NVIDIA GeForce RTX 4090 Laptop GPU (n=1) | |
| Average of class Gaming (39.6 - 83.1, n=11, last 2 years) | |
| Horizon Forbidden West | |
| 1920x1080 Very High Preset AA:T | |
| Schenker XMG Neo 16 (Early 24) | |
| Average NVIDIA GeForce RTX 4090 Laptop GPU (81 - 125.2, n=3) | |
| Average of class Gaming (14.7 - 140.3, n=18, last 2 years) | |
| 2560x1440 Very High Preset AA:T | |
| Schenker XMG Neo 16 (Early 24) | |
| Average NVIDIA GeForce RTX 4090 Laptop GPU (66 - 98, n=3) | |
| Average of class Gaming (24.1 - 100.9, n=15, last 2 years) | |
| Alone in the Dark | |
| 1920x1080 Cinematic Preset | |
| Schenker XMG Neo 16 (Early 24) | |
| Average NVIDIA GeForce RTX 4090 Laptop GPU (141 - 189.9, n=2) | |
| Average of class Gaming (126 - 189.9, n=3, last 2 years) | |
| 2560x1440 Cinematic Preset | |
| Schenker XMG Neo 16 (Early 24) | |
| Average NVIDIA GeForce RTX 4090 Laptop GPU (99 - 133.6, n=2) | |
| Average of class Gaming (76.6 - 133.6, n=2, last 2 years) | |
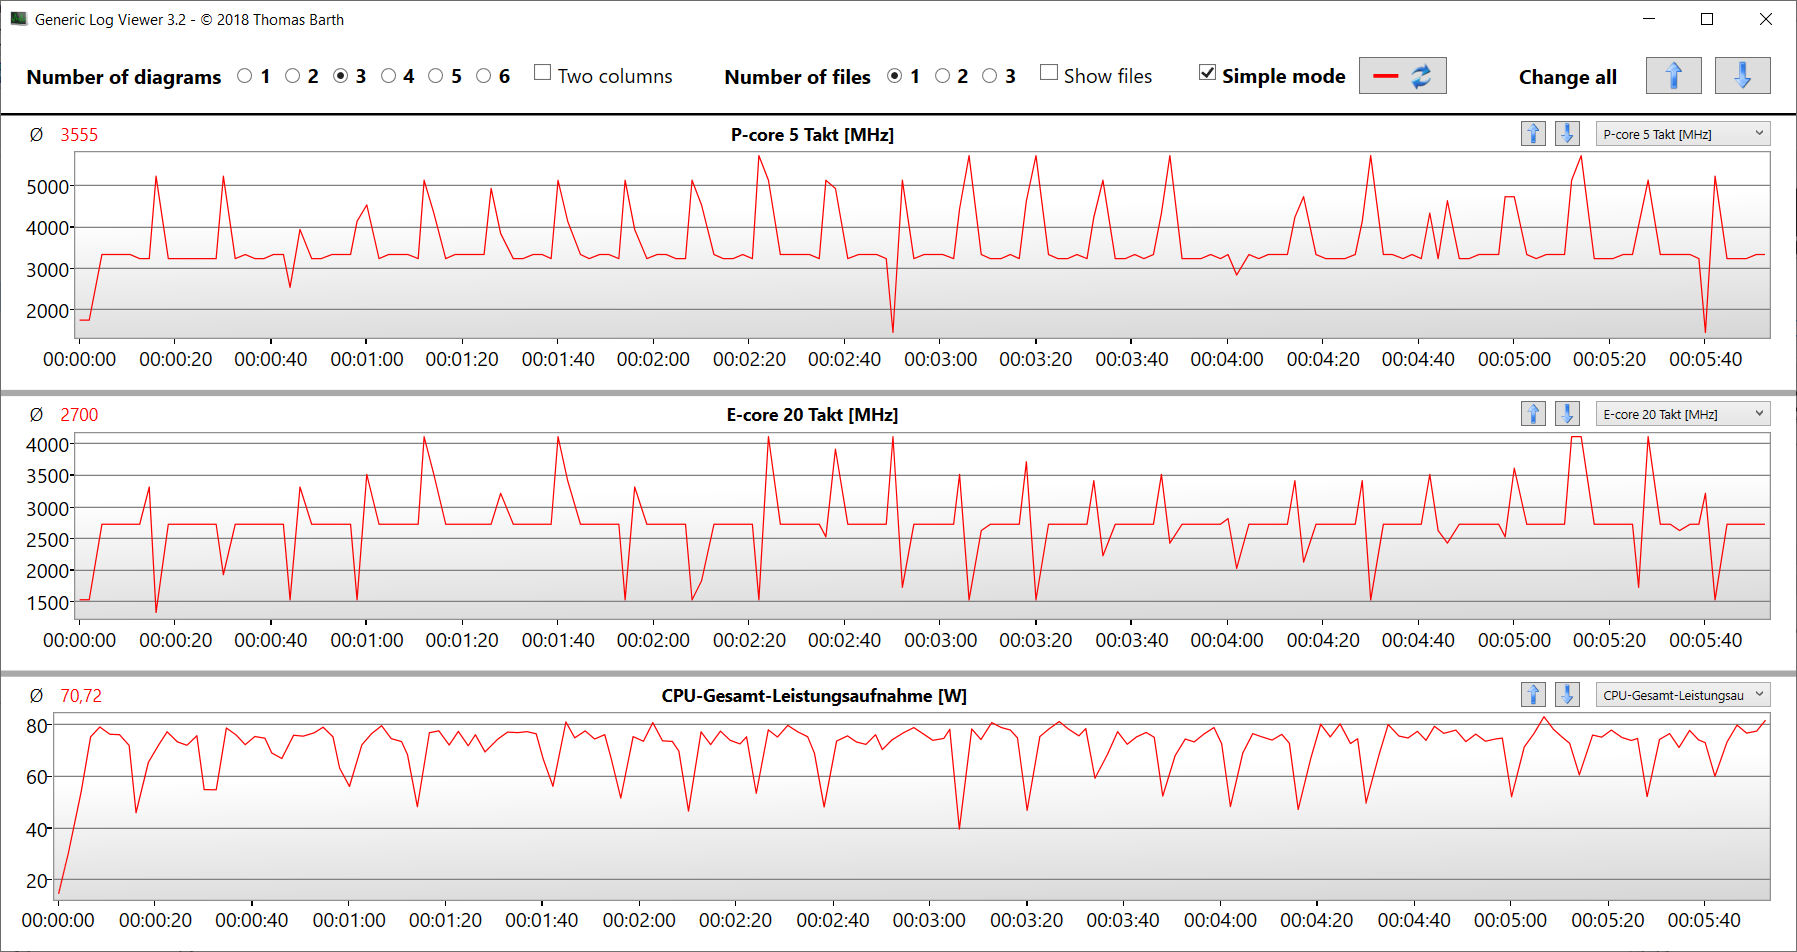
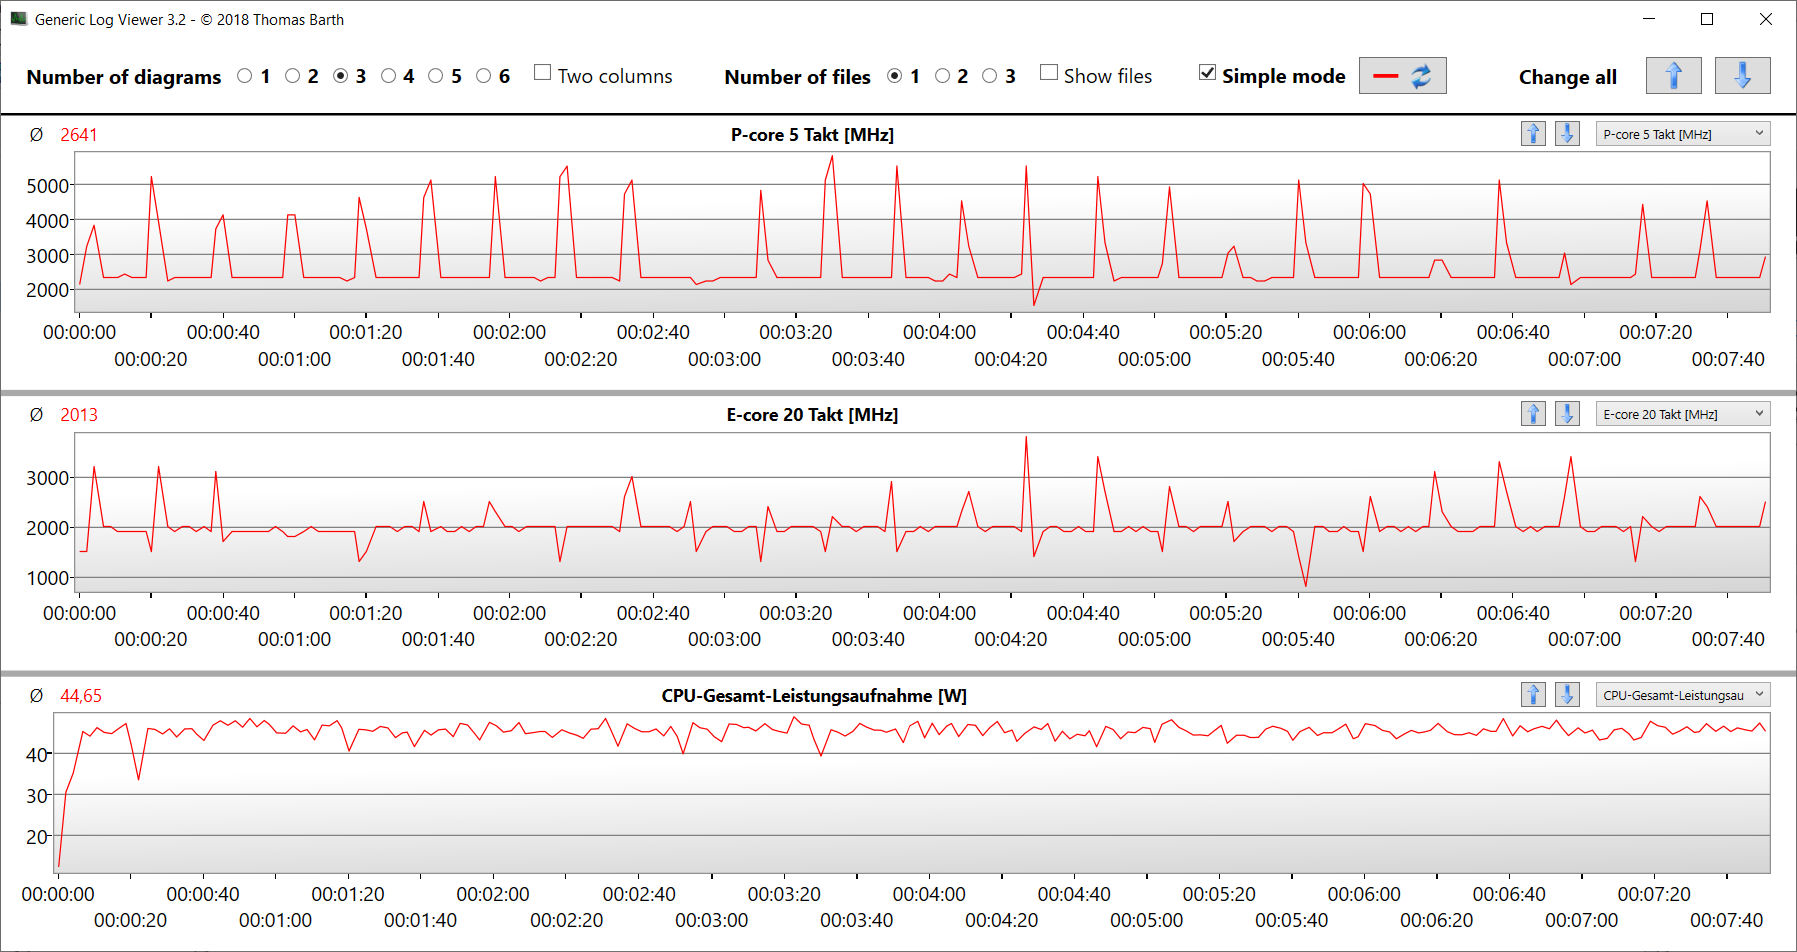
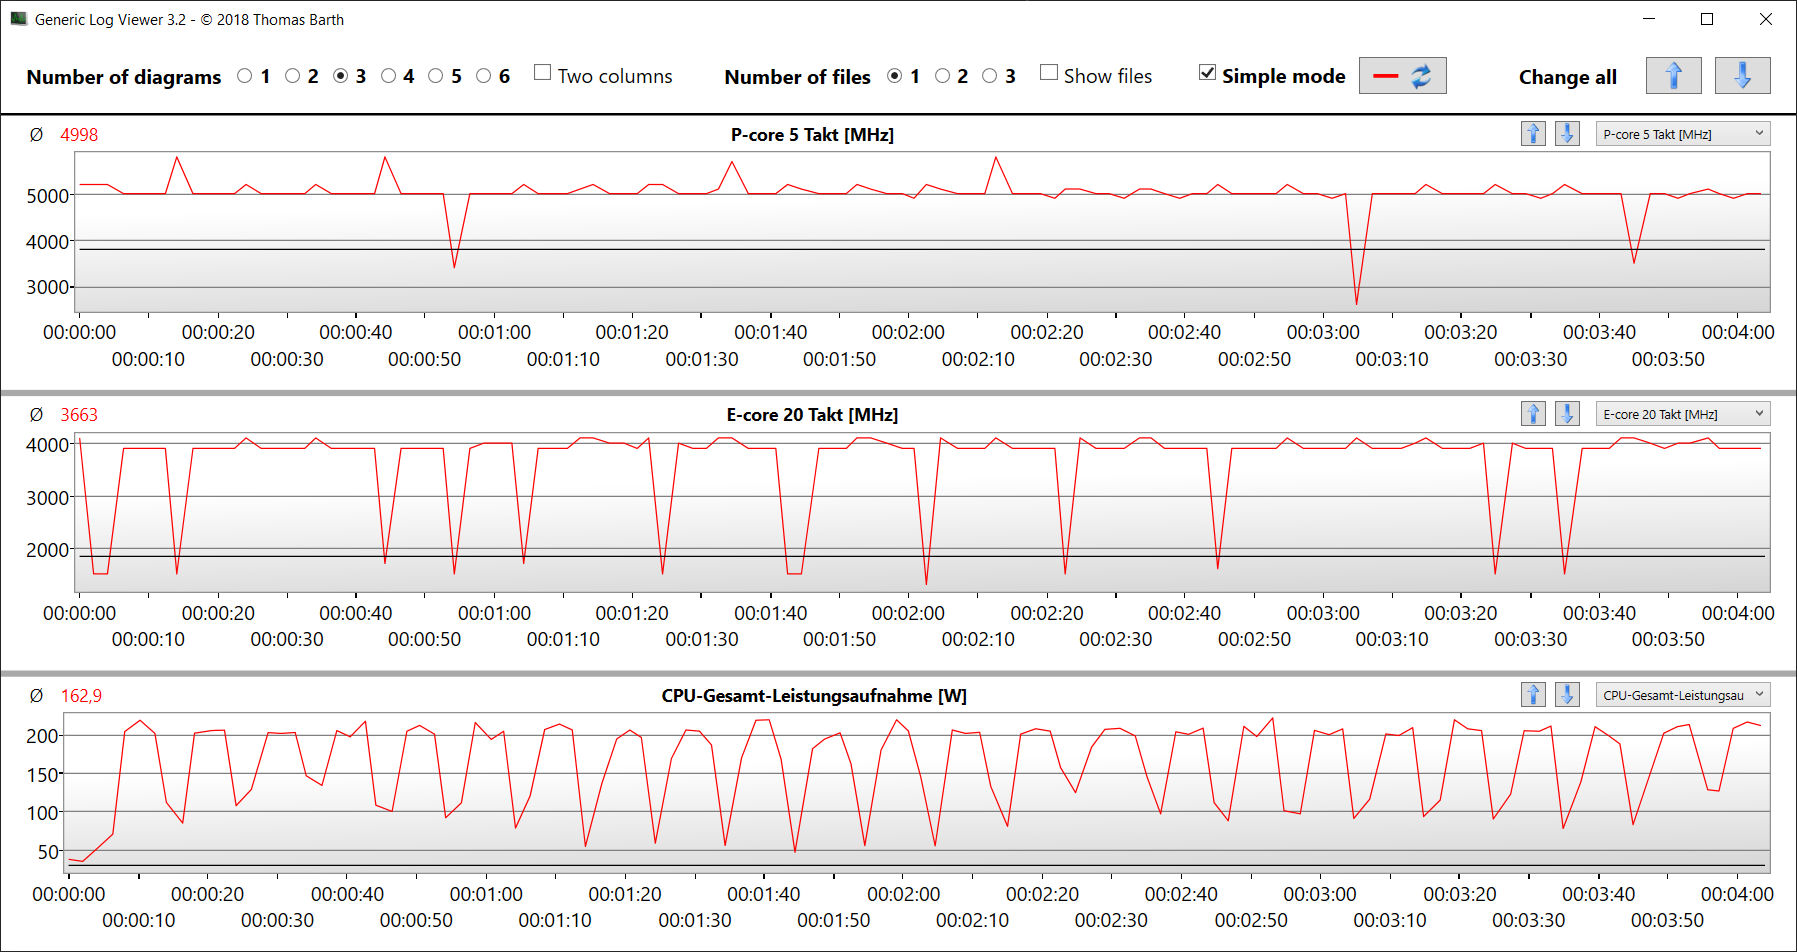
我们使用Witcher 3 检查帧频的稳定性:游戏(最高设置,全高清)运行了大约 1 小时,游戏角色没有移动,我们也没有观察到帧速率有任何下降。
Witcher 3 FPS diagram
| low | med. | high | ultra | QHD DLSS | QHD FSR | QHD | 4K DLSS | 4K | |
|---|---|---|---|---|---|---|---|---|---|
| GTA V (2015) | 187.6 | 187.4 | 185.7 | 159.3 | 156 | ||||
| The Witcher 3 (2015) | 643 | 562.3 | 412.7 | 214 | 169.4 | ||||
| Dota 2 Reborn (2015) | 248 | 221 | 210 | 194.6 | |||||
| Final Fantasy XV Benchmark (2018) | 233 | 225 | 196.9 | 162.5 | |||||
| X-Plane 11.11 (2018) | 208 | 184.2 | 144.5 | ||||||
| Far Cry 5 (2018) | 194 | 184 | 172 | 156 | |||||
| Strange Brigade (2018) | 579 | 444 | 397 | 403 | 305 | ||||
| Baldur's Gate 3 (2023) | 253 | 215.5 | 188 | 187 | 133.2 | 114 | 73.1 | ||
| Cyberpunk 2077 (2023) | 168.5 | 157.8 | 138 | 131.5 | 93.8 | ||||
| Alan Wake 2 (2023) | 128.5 | 128 | 123.3 | 87.1 | |||||
| Alone in the Dark (2024) | 219 | 217 | 216 | 189.9 | 133.6 | ||||
| Horizon Forbidden West (2024) | 165.4 | 160.5 | 126.2 | 125.2 | 98 | ||||
| Senua's Saga Hellblade 2 (2024) | 122.3 | 103.3 | 78.8 | 83.1 | 82.1 | 57.3 | |||
| F1 24 (2024) | 346 | 369 | 302 | 127 | 129.5 | 127.1 | 84.7 |
排放 - XMG 笔记本电脑具有特定等级的排放要求
噪音排放
噪音水平最高可达 56 dB(A),但在游戏时,这一数字会稍低一些(过载)。使用 "平衡 "功能可以大大降低噪音水平,但会牺牲性能。这样就可以玩游戏了。在日常使用(办公、上网)和空闲运行时,计算机一般都能安静地工作,与激活的性能模式无关。
使用外部水冷会产生一些噪音:水泵工作时非常安静,而风扇则更加明显。从主观角度看,我们认为使用外部水冷时的噪音水平更令人愉悦,但并不一定更安静。
例如,在进行 Diskspd 测试时,笔记本电脑内部偶尔会发出电子噼啪声。这可能是固态硬盘造成的。
Noise level
| Idle |
| 28 / 29 / 31 dB(A) |
| Load |
| 51 / 56 dB(A) |
 | ||
30 dB silent 40 dB(A) audible 50 dB(A) loud |
||
min: | ||
| Schenker XMG Neo 16 (Early 24) GeForce RTX 4090 Laptop GPU, i9-14900HX, Samsung 990 Pro 1 TB | Razer Blade 16 2024, RTX 4090 GeForce RTX 4090 Laptop GPU, i9-14900HX, Samsung PM9A1 MZVL22T0HBLB | Medion Erazer Beast X40 2024 GeForce RTX 4090 Laptop GPU, i9-14900HX, Phison E18-1TB-PHISON-SSD-BICS5 | Asus ROG Strix Scar 17 G733PYV-LL053X GeForce RTX 4090 Laptop GPU, R9 7945HX3D, SK hynix PC801 HFS001TEJ9X101N | Schenker XMG Neo 16 E23 GeForce RTX 4090 Laptop GPU, i9-13900HX, Crucial P5 Plus 1TB CT1000P5PSSD8 | |
|---|---|---|---|---|---|
| Noise | 14% | 3% | 3% | -12% | |
| off / environment * (dB) | 26 | 23 12% | 25 4% | 23 12% | 25 4% |
| Idle Minimum * (dB) | 28 | 23 18% | 28 -0% | 23 18% | 31 -11% |
| Idle Average * (dB) | 29 | 23 21% | 29 -0% | 27.7 4% | 33 -14% |
| Idle Maximum * (dB) | 31 | 27.66 11% | 32 -3% | 34.7 -12% | 42 -35% |
| Load Average * (dB) | 51 | 43.76 14% | 48 6% | 53.4 -5% | 58 -14% |
| Witcher 3 ultra * (dB) | 54 | 46.81 13% | 50 7% | 53.4 1% | 57 -6% |
| Load Maximum * (dB) | 56 | 50.37 10% | 52 7% | 53.4 5% | 59 -5% |
* ... smaller is better
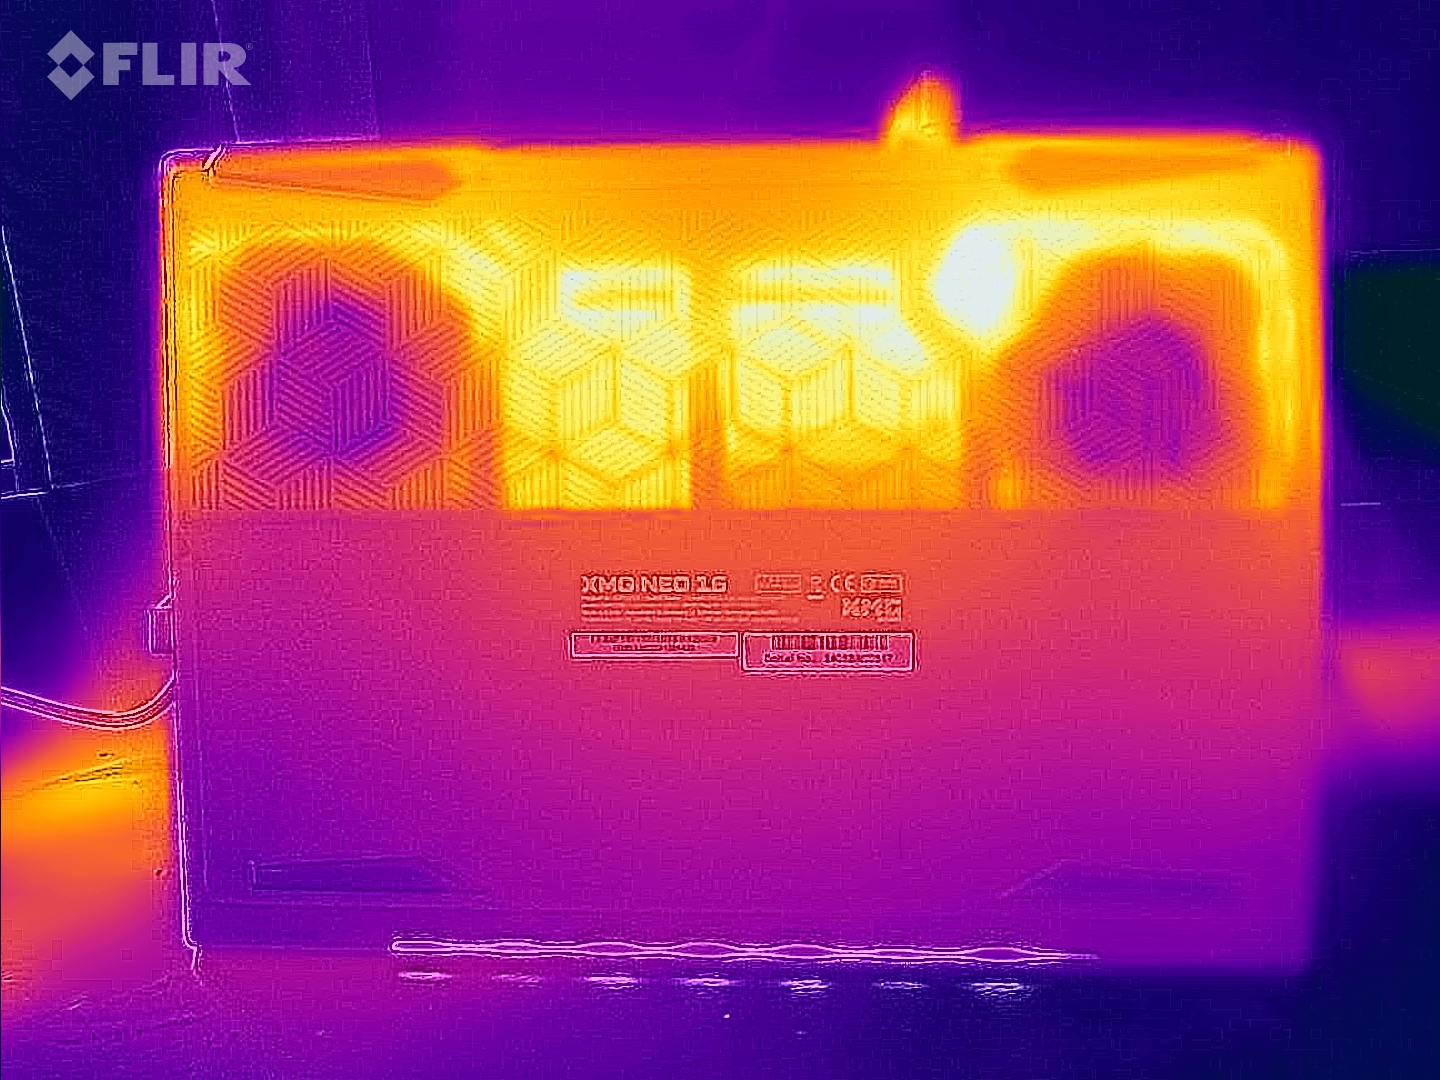
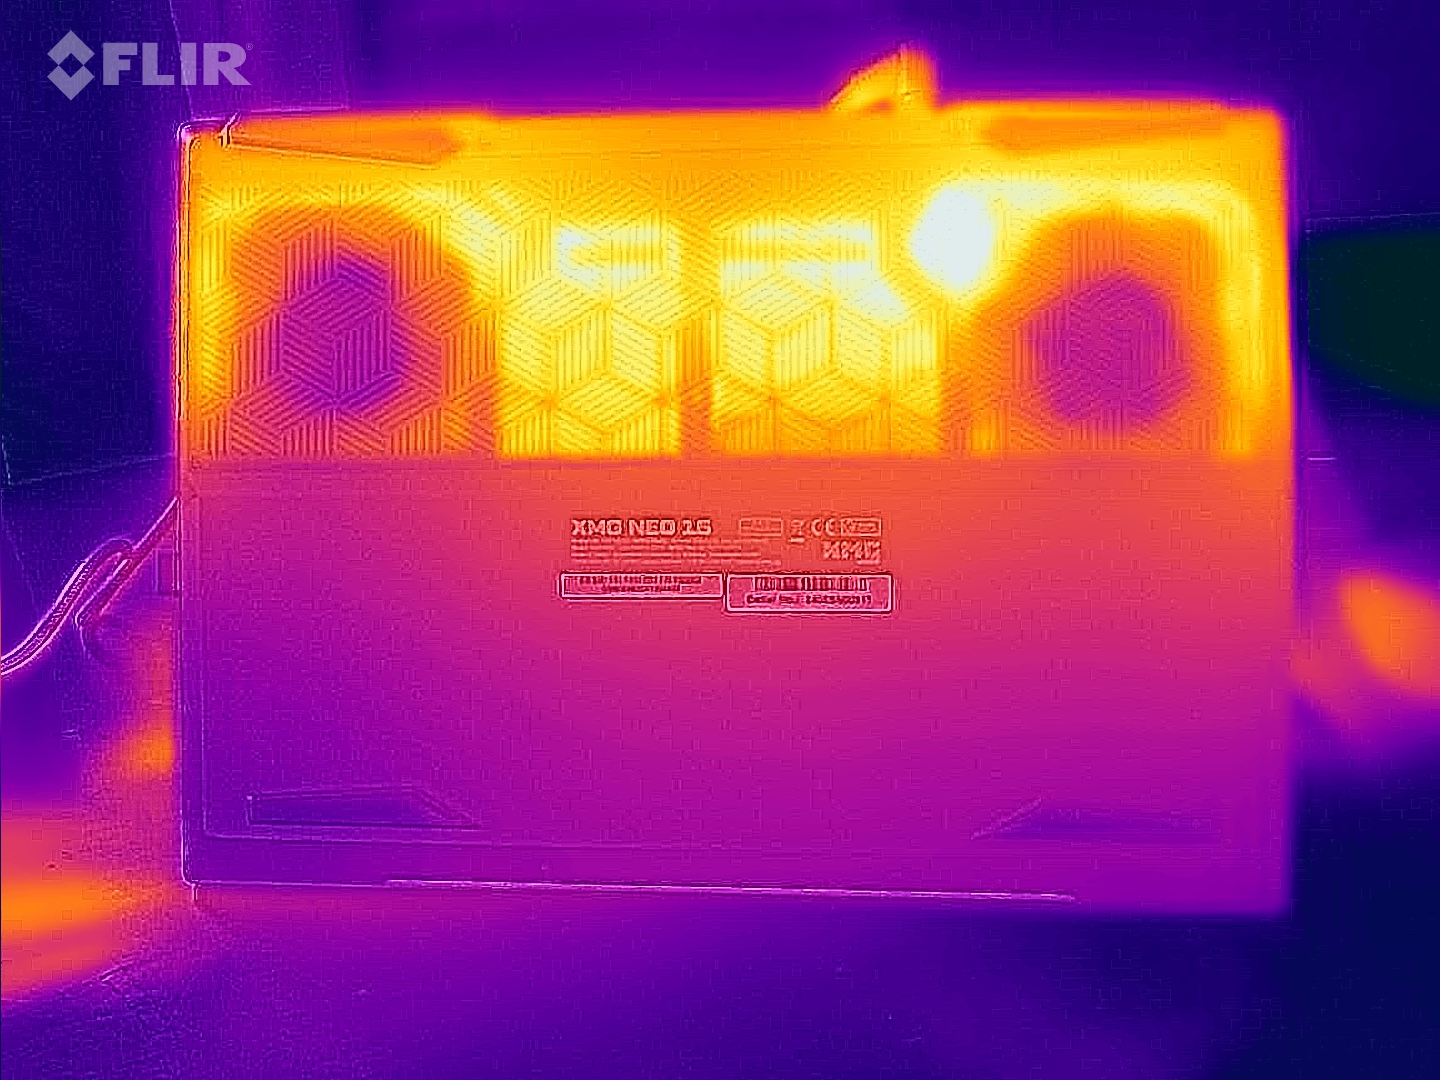
温度
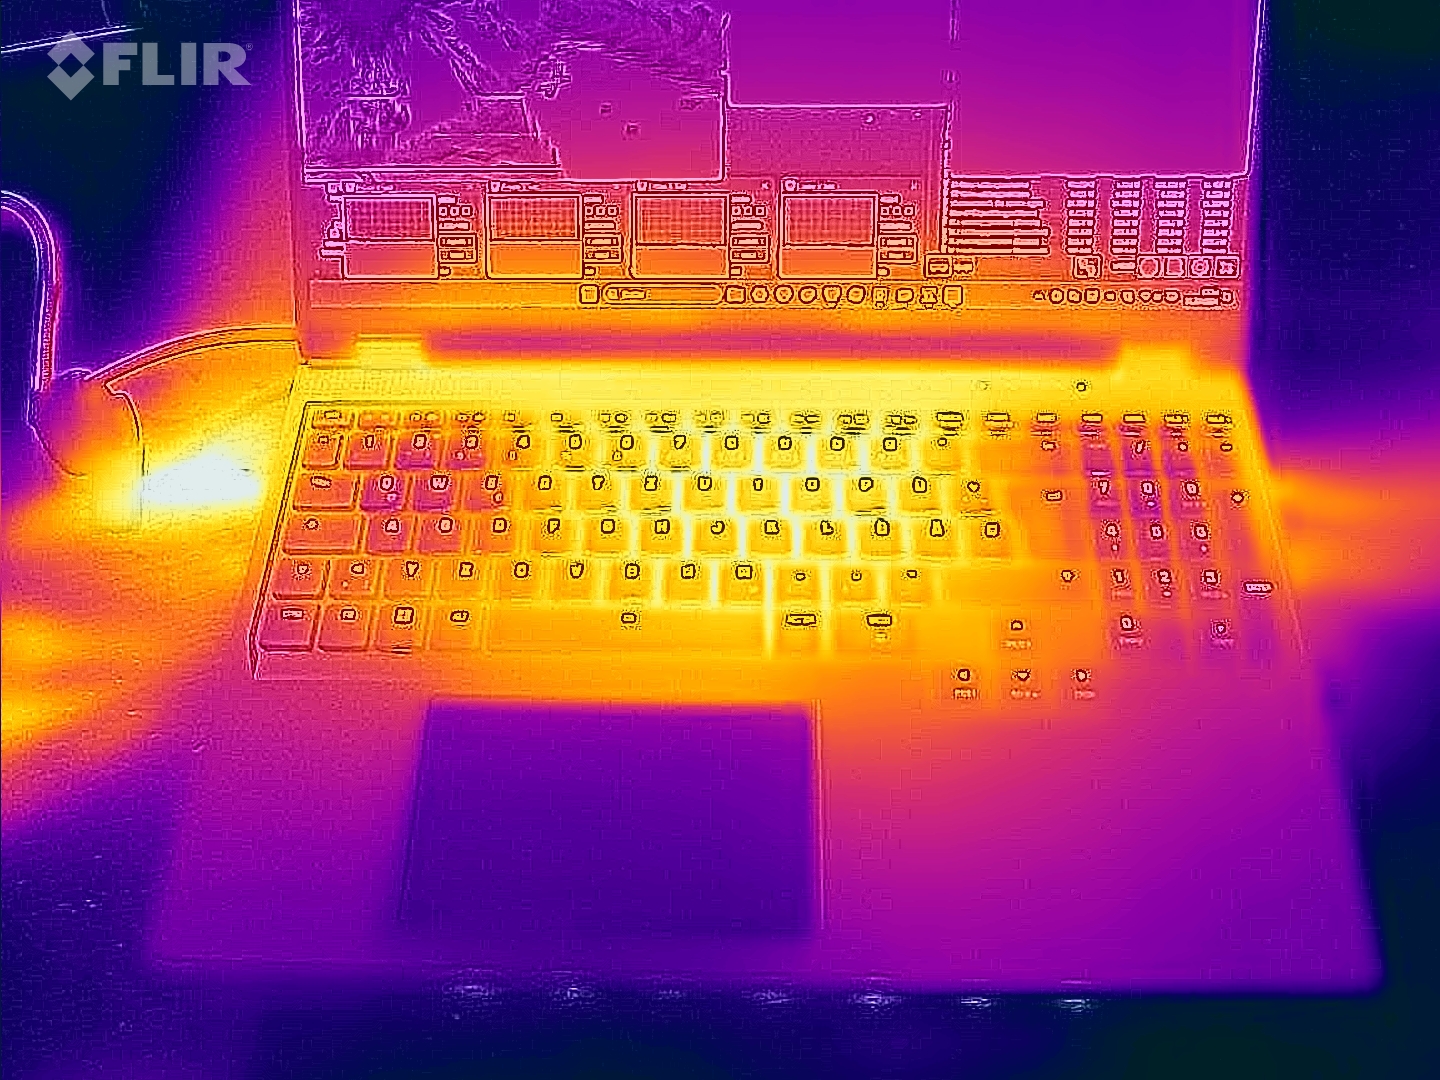
在负载情况下(压力测试和Witcher 3 测试),笔记本电脑会明显发热:某些区域的温度有时会超过 50 °C。不过,在掌托上,温度保持在中等水平。在日常使用中(办公、上网),这些数据处于绿色区域。
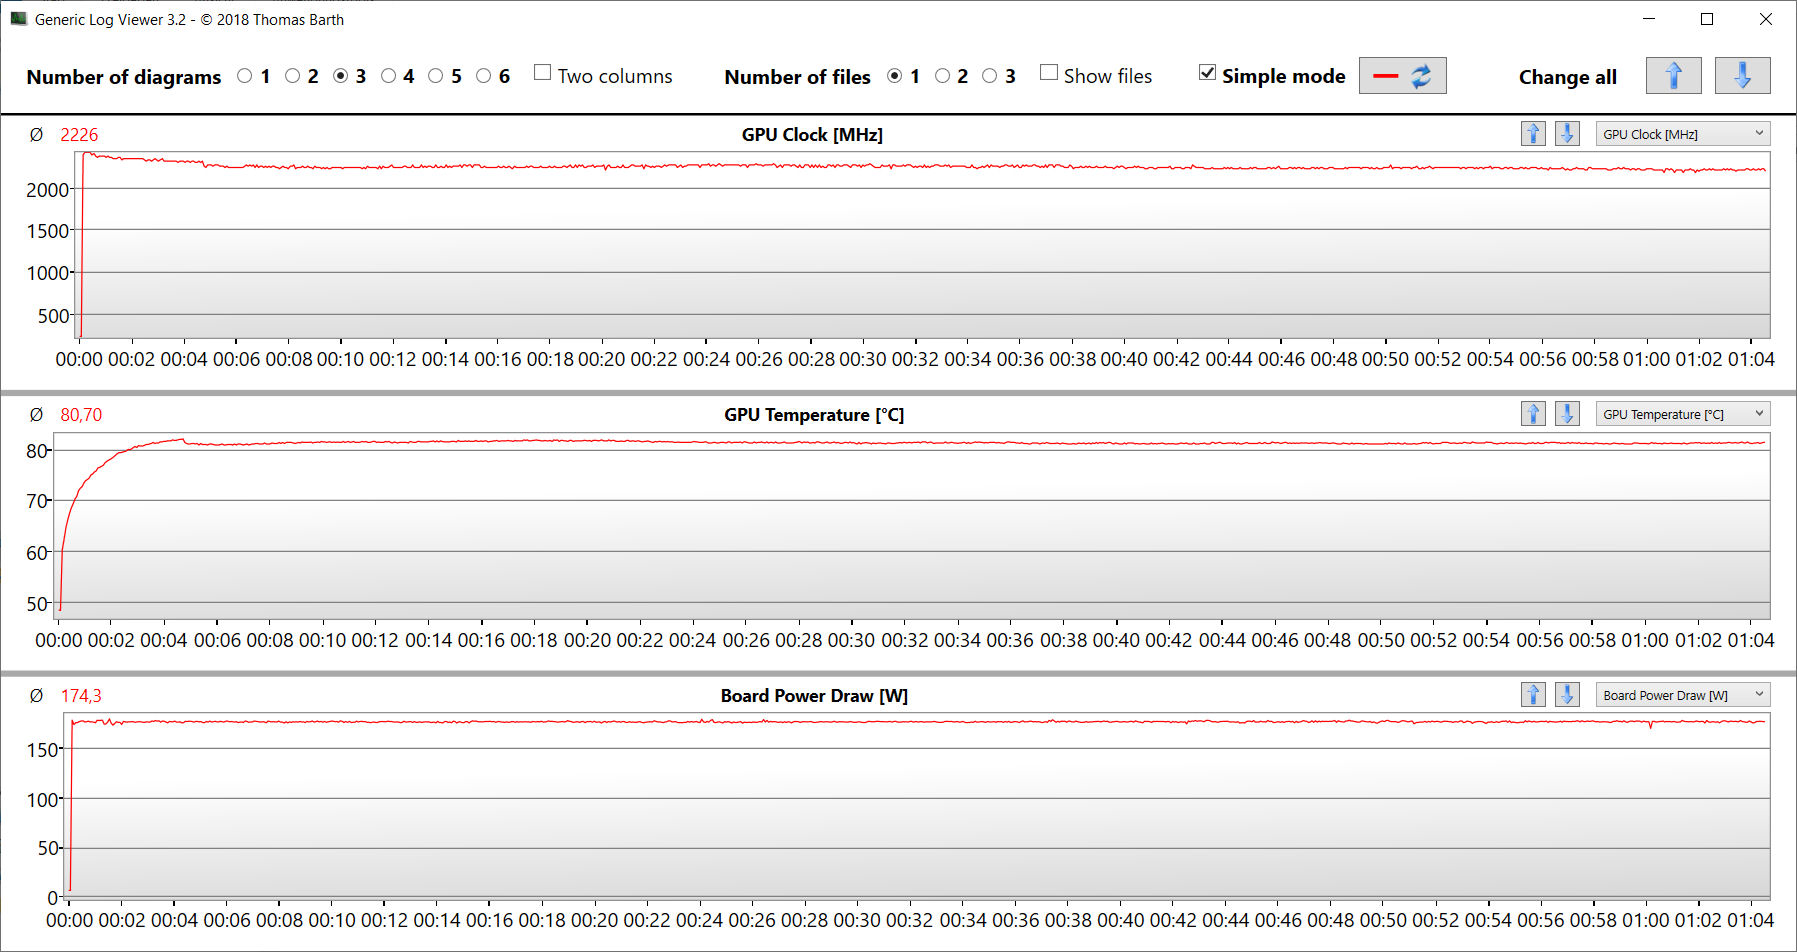
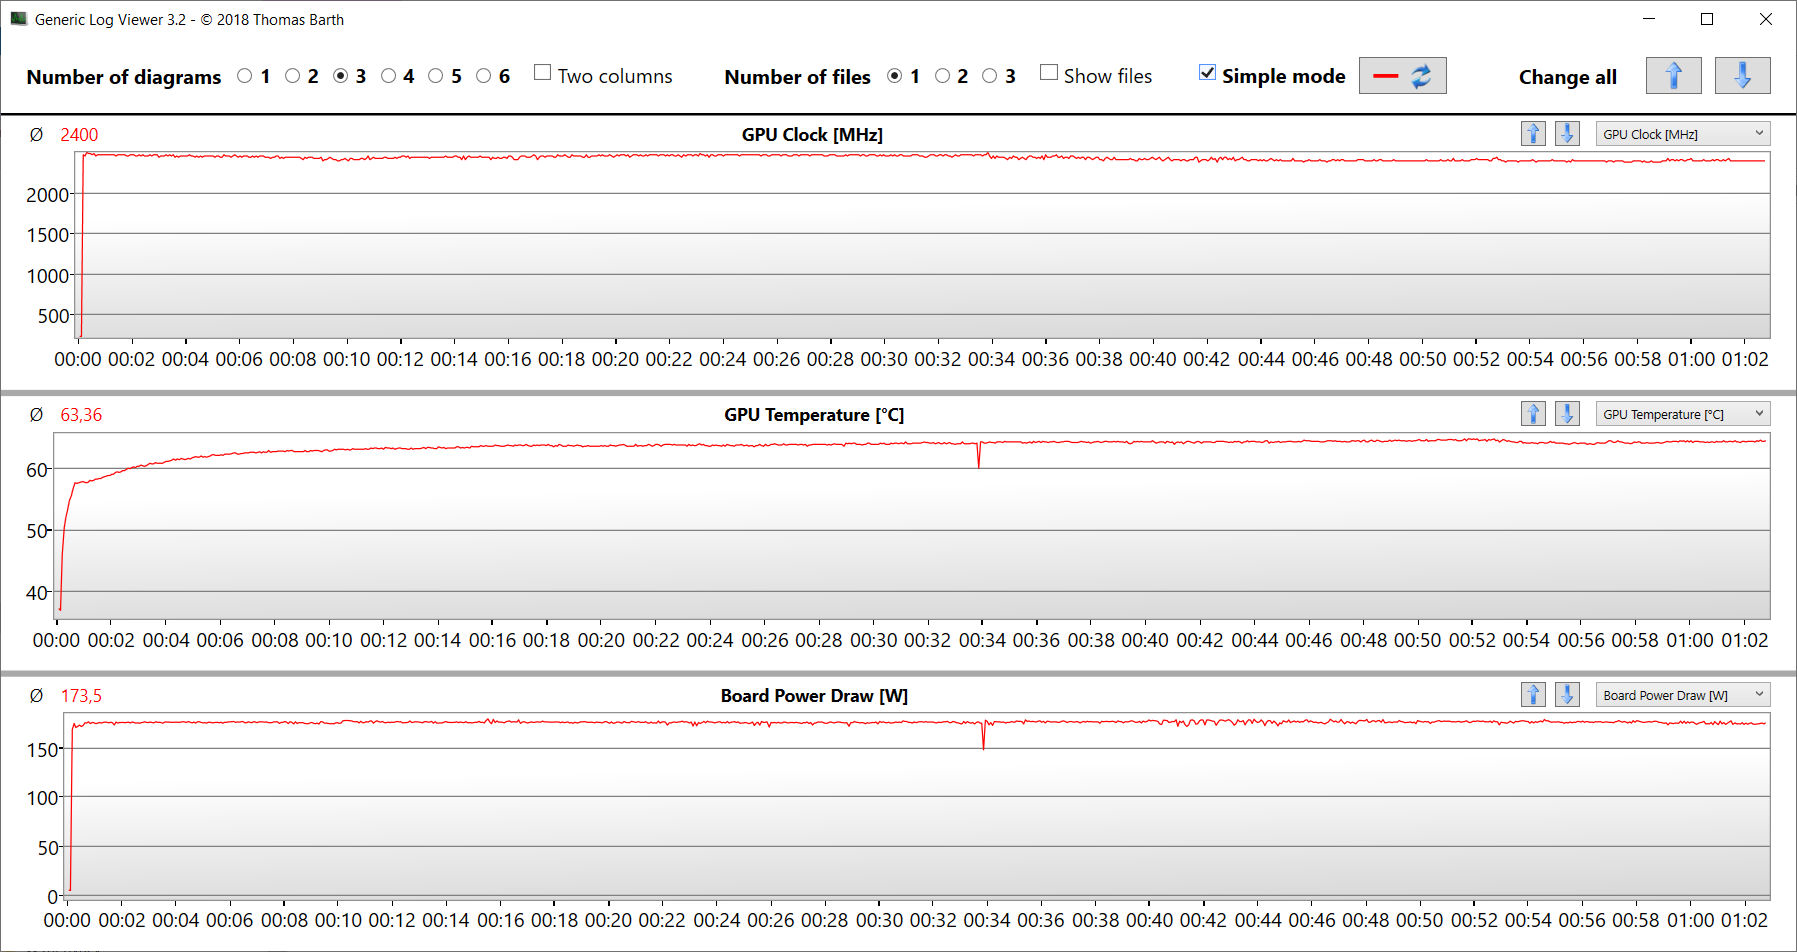
Witcher 3 测试凸显了可选水冷系统的效果:GPU 温度相差约 17 °C(80.7 °C 对 63.4 °C)。
(-) The maximum temperature on the upper side is 47 °C / 117 F, compared to the average of 40.4 °C / 105 F, ranging from 21.2 to 68.8 °C for the class Gaming.
(-) The bottom heats up to a maximum of 56 °C / 133 F, compared to the average of 43.3 °C / 110 F
(+) In idle usage, the average temperature for the upper side is 26 °C / 79 F, compared to the device average of 33.9 °C / 93 F.
(-) Playing The Witcher 3, the average temperature for the upper side is 42.4 °C / 108 F, compared to the device average of 33.9 °C / 93 F.
(+) The palmrests and touchpad are reaching skin temperature as a maximum (35 °C / 95 F) and are therefore not hot.
(-) The average temperature of the palmrest area of similar devices was 28.8 °C / 83.8 F (-6.2 °C / -11.2 F).
| Schenker XMG Neo 16 (Early 24) Intel Core i9-14900HX, NVIDIA GeForce RTX 4090 Laptop GPU | Razer Blade 16 2024, RTX 4090 Intel Core i9-14900HX, NVIDIA GeForce RTX 4090 Laptop GPU | Medion Erazer Beast X40 2024 Intel Core i9-14900HX, NVIDIA GeForce RTX 4090 Laptop GPU | Asus ROG Strix Scar 17 G733PYV-LL053X AMD Ryzen 9 7945HX3D, NVIDIA GeForce RTX 4090 Laptop GPU | Schenker XMG Neo 16 E23 Intel Core i9-13900HX, NVIDIA GeForce RTX 4090 Laptop GPU | |
|---|---|---|---|---|---|
| Heat | 2% | -7% | 8% | 1% | |
| Maximum Upper Side * (°C) | 47 | 45 4% | 47 -0% | 40.1 15% | 50 -6% |
| Maximum Bottom * (°C) | 56 | 45 20% | 54 4% | 46.7 17% | 51 9% |
| Idle Upper Side * (°C) | 27 | 29 -7% | 30 -11% | 26.5 2% | 28 -4% |
| Idle Bottom * (°C) | 27 | 30 -11% | 32 -19% | 27.7 -3% | 26 4% |
* ... smaller is better
压力测试
压力测试极端情况(Prime95 和 Furmark 连续运行)检查系统在满负荷情况下的稳定性。在测试的第一分钟内,CPU 速度从大约 4.3 至 4.5 GHz(P)和 3.5 至 3.6 GHz(E)降至 2.5 GHz(P)和 2.3 GHz(E)。与此同时,GPU 的速度从起始点的 1,600 MHz 提高到 2,000 MHz 以上。
发言人
立体声扬声器缺乏低音。除此之外,它们大多能产生不错的音效。使用耳机或外置扬声器可以获得更好的音质。
Schenker XMG Neo 16 (Early 24) audio analysis
(+) | speakers can play relatively loud (86 dB)
Bass 100 - 315 Hz
(-) | nearly no bass - on average 16.3% lower than median
(±) | linearity of bass is average (8.6% delta to prev. frequency)
Mids 400 - 2000 Hz
(+) | balanced mids - only 3% away from median
(+) | mids are linear (3.6% delta to prev. frequency)
Highs 2 - 16 kHz
(+) | balanced highs - only 2.5% away from median
(+) | highs are linear (4.9% delta to prev. frequency)
Overall 100 - 16.000 Hz
(+) | overall sound is linear (12.4% difference to median)
Compared to same class
» 14% of all tested devices in this class were better, 3% similar, 82% worse
» The best had a delta of 6%, average was 18%, worst was 132%
Compared to all devices tested
» 10% of all tested devices were better, 2% similar, 87% worse
» The best had a delta of 4%, average was 24%, worst was 134%
Razer Blade 16 2024, RTX 4090 audio analysis
(±) | speaker loudness is average but good (81.16 dB)
Bass 100 - 315 Hz
(±) | reduced bass - on average 8.2% lower than median
(±) | linearity of bass is average (7.4% delta to prev. frequency)
Mids 400 - 2000 Hz
(+) | balanced mids - only 3.3% away from median
(+) | mids are linear (5.9% delta to prev. frequency)
Highs 2 - 16 kHz
(+) | balanced highs - only 1.6% away from median
(+) | highs are linear (3.1% delta to prev. frequency)
Overall 100 - 16.000 Hz
(+) | overall sound is linear (9.2% difference to median)
Compared to same class
» 3% of all tested devices in this class were better, 1% similar, 96% worse
» The best had a delta of 6%, average was 18%, worst was 132%
Compared to all devices tested
» 3% of all tested devices were better, 1% similar, 96% worse
» The best had a delta of 4%, average was 24%, worst was 134%
能源管理 - Schenker Neo 的电池续航能力不错
耗电量
对于我们这里安装的硬件来说,功耗处于正常水平。Witcher 3 测试和压力测试的功耗略有下降。电源适配器(330 瓦)大小合适。
| Off / Standby | |
| Idle | |
| Load |
|
Key:
min: | |
| Schenker XMG Neo 16 (Early 24) i9-14900HX, GeForce RTX 4090 Laptop GPU, Samsung 990 Pro 1 TB, IPS, 2560x1600, 16" | Razer Blade 16 2024, RTX 4090 i9-14900HX, GeForce RTX 4090 Laptop GPU, Samsung PM9A1 MZVL22T0HBLB, OLED, 2560x1600, 16" | Medion Erazer Beast X40 2024 i9-14900HX, GeForce RTX 4090 Laptop GPU, Phison E18-1TB-PHISON-SSD-BICS5, IPS, 2560x1600, 17" | Asus ROG Strix Scar 17 G733PYV-LL053X R9 7945HX3D, GeForce RTX 4090 Laptop GPU, SK hynix PC801 HFS001TEJ9X101N, IPS, 2560x1440, 17.3" | Schenker XMG Neo 16 E23 i9-13900HX, GeForce RTX 4090 Laptop GPU, Crucial P5 Plus 1TB CT1000P5PSSD8, IPS, 2560x1600, 16" | Average of class Gaming | |
|---|---|---|---|---|---|---|
| Power Consumption | -22% | -1% | -23% | -9% | -17% | |
| Idle Minimum * (Watt) | 6 | 16.9 -182% | 7 -17% | 15.4 -157% | 8 -33% | 13.4 ? -123% |
| Idle Average * (Watt) | 16 | 17.8 -11% | 15 6% | 21.6 -35% | 18 -13% | 19.1 ? -19% |
| Idle Maximum * (Watt) | 28 | 19.6 30% | 33 -18% | 22.2 21% | 28 -0% | 24.5 ? 12% |
| Load Average * (Watt) | 130 | 128 2% | 134 -3% | 116.7 10% | 133 -2% | 108.3 ? 17% |
| Witcher 3 ultra * (Watt) | 302 | 243 20% | 280 7% | 262 13% | 294 3% | |
| Load Maximum * (Watt) | 361 | 328 9% | 294 19% | 327.1 9% | 399 -11% | 253 ? 30% |
| Cyberpunk 2077 ultra external monitor * (Watt) | 272 |
* ... smaller is better
Power consumption Witcher 3 / stress test
Power consumption with an external monitor
电池寿命
在 Wi-Fi 和视频测试(借助脚本加载网站以及循环播放短片 Big Buck Bunny(H.264 编码,FHD))中,16 英寸机器的运行时间分别为 5 小时 50 分钟和 6 小时 58 分钟。总之,这些数据还算不错。
| Schenker XMG Neo 16 (Early 24) i9-14900HX, GeForce RTX 4090 Laptop GPU, 99.8 Wh | Razer Blade 16 2024, RTX 4090 i9-14900HX, GeForce RTX 4090 Laptop GPU, 95.2 Wh | Medion Erazer Beast X40 2024 i9-14900HX, GeForce RTX 4090 Laptop GPU, 99.8 Wh | Asus ROG Strix Scar 17 G733PYV-LL053X R9 7945HX3D, GeForce RTX 4090 Laptop GPU, 90 Wh | Schenker XMG Neo 16 E23 i9-13900HX, GeForce RTX 4090 Laptop GPU, 99 Wh | Average of class Gaming | |
|---|---|---|---|---|---|---|
| Battery runtime | -10% | 7% | -34% | -1% | 0% | |
| Reader / Idle (h) | 10 | 9.1 ? -9% | ||||
| H.264 (h) | 7 | 7.6 9% | 5 -29% | 5.8 -17% | 8.02 ? 15% | |
| WiFi v1.3 (h) | 5.8 | 5.5 -5% | 6.2 7% | 4.8 -17% | 6.7 16% | 6.83 ? 18% |
| Load (h) | 2 | 1.3 -35% | 0.9 -55% | 1.512 ? -24% | ||
| Witcher 3 ultra (h) | 1.4 | 0.958 ? |
Pros
Cons
结论--高端火球

Neo 16 兑现了它的承诺:性能高端的硬件(酷睿 i9、RTX 4090)可以进行视频编辑、渲染、流媒体传输,当然还有 QHD 游戏。通过选择适当的性能模式,可以将预期的高辐射降低到更适中的水平。
通过 XMG Neo 16(早期 24),申克以紧凑的外形提供了强大的动力。
要想获得不折不扣的解决方案,就必须选配外部水冷系统(230 美元):这有助于实现性能的小幅提升和排放的降低。尽管如此,笔记本电脑还是被固定在一个固定的位置上。
16 英寸 16:10 雾面显示屏(2,560 x 1,600 像素,sRGB,IPS,240 Hz)在很大程度上给人留下了良好印象,其高亮度尤其讨人喜欢。在对比度和色彩空间覆盖率方面还有待改进。两个固态硬盘插槽(PCIe 4)包括 RAID 0/1 支持,可提供大量存储空间和较短的加载时间。
单次电池充电(99.8 瓦时)足以支持 6 至 7 小时的实际运行时间,数据相当不错。优点电池可通过 USB-C 充电器(100 瓦、20 V、5 A)充电,TB4 端口支持 Power Delivery,这意味着 PSU(330 瓦)理论上可以留在家里。
另一种选择是 雷蛇刀锋 16 (2024).这款电脑的计算能力略低,但与 Neo 不同的是,它的对比度更高,搭载的 OLED 显示屏也更生动。
价格和供应情况
XMG Neo 16(早期 24)可单独配置,并可在申克在线商店(德国)购买,价格代表测试时的美元/欧元汇率。我们的评测机型价格约为 4000 美元。入门级型号(配备 RTX 4060)的起价约为 2000 美元。申克公司表示,它们将于 6 月底(RTX 4090)和 7 月中(RTX 4060/70/80)上市。可选的水冷散热将需要支付约 230 美元。
Schenker XMG Neo 16 (Early 24)
- 06/19/2024 v8
Sascha Mölck
 Total Sustainability Score:
 Transparency
The selection of devices to be reviewed is made by our editorial team. The test sample was provided to the author as a loan by the manufacturer or retailer for the purpose of this review. The lender had no influence on this review, nor did the manufacturer receive a copy of this review before publication. There was no obligation to publish this review. As an independent media company, Notebookcheck is not subjected to the authority of manufacturers, retailers or publishers.
This is how Notebookcheck is testing
Every year, Notebookcheck independently reviews hundreds of laptops and smartphones using standardized procedures to ensure that all results are comparable. We have continuously developed our test methods for around 20 years and set industry standards in the process. In our test labs, high-quality measuring equipment is utilized by experienced technicians and editors. These tests involve a multi-stage validation process. Our complex rating system is based on hundreds of well-founded measurements and benchmarks, which maintains objectivity. Further information on our test methods can be found here.
Price comparison

