Durabook S15 强固型笔记本电脑评测:在同类产品中出人意料的轻薄

潜在的竞争对手比较
Rating | Date | Model | Weight | Height | Size | Resolution | Price |
|---|---|---|---|---|---|---|---|
| 80.5 % | 06 / 2024 | Durabook S15 i7-1255U, Iris Xe G7 96EUs | 2.7 kg | 29.5 mm | 15.60" | 1920x1080 | |
| 78.3 % v7 (old) | Durabook S15ABG2 i5-8265U, UHD Graphics 620 | 2.6 kg | 30 mm | 15.60" | 1920x1080 | ||
v (old) | 07 / 2022 | Panasonic Toughbook 40 i7-1185G7, Iris Xe G7 96EUs | 3.9 kg | 53.4 mm | 14.00" | 1920x1080 | |
| 82.9 % v7 (old) | 06 / 2024 | Getac S410 G5 i5-1350P, Iris Xe G7 80EUs | 2.9 kg | 34.9 mm | 14.00" | 1920x1080 | |
| 89.2 % v6 (old) | Dell Latitude 5420 Rugged-P85G i7-8650U, Radeon RX 540 | 2.8 kg | 32.9 mm | 14.00" | 1920x1080 | ||
| 82.4 % v7 (old) | 12 / 2021 | Acer Enduro Urban N3 EUN314 i7-1165G7, Iris Xe G7 96EUs | 1.8 kg | 21.95 mm | 14.00" | 1920x1080 |
外壳 - 通过 MIL-STD-810H 认证
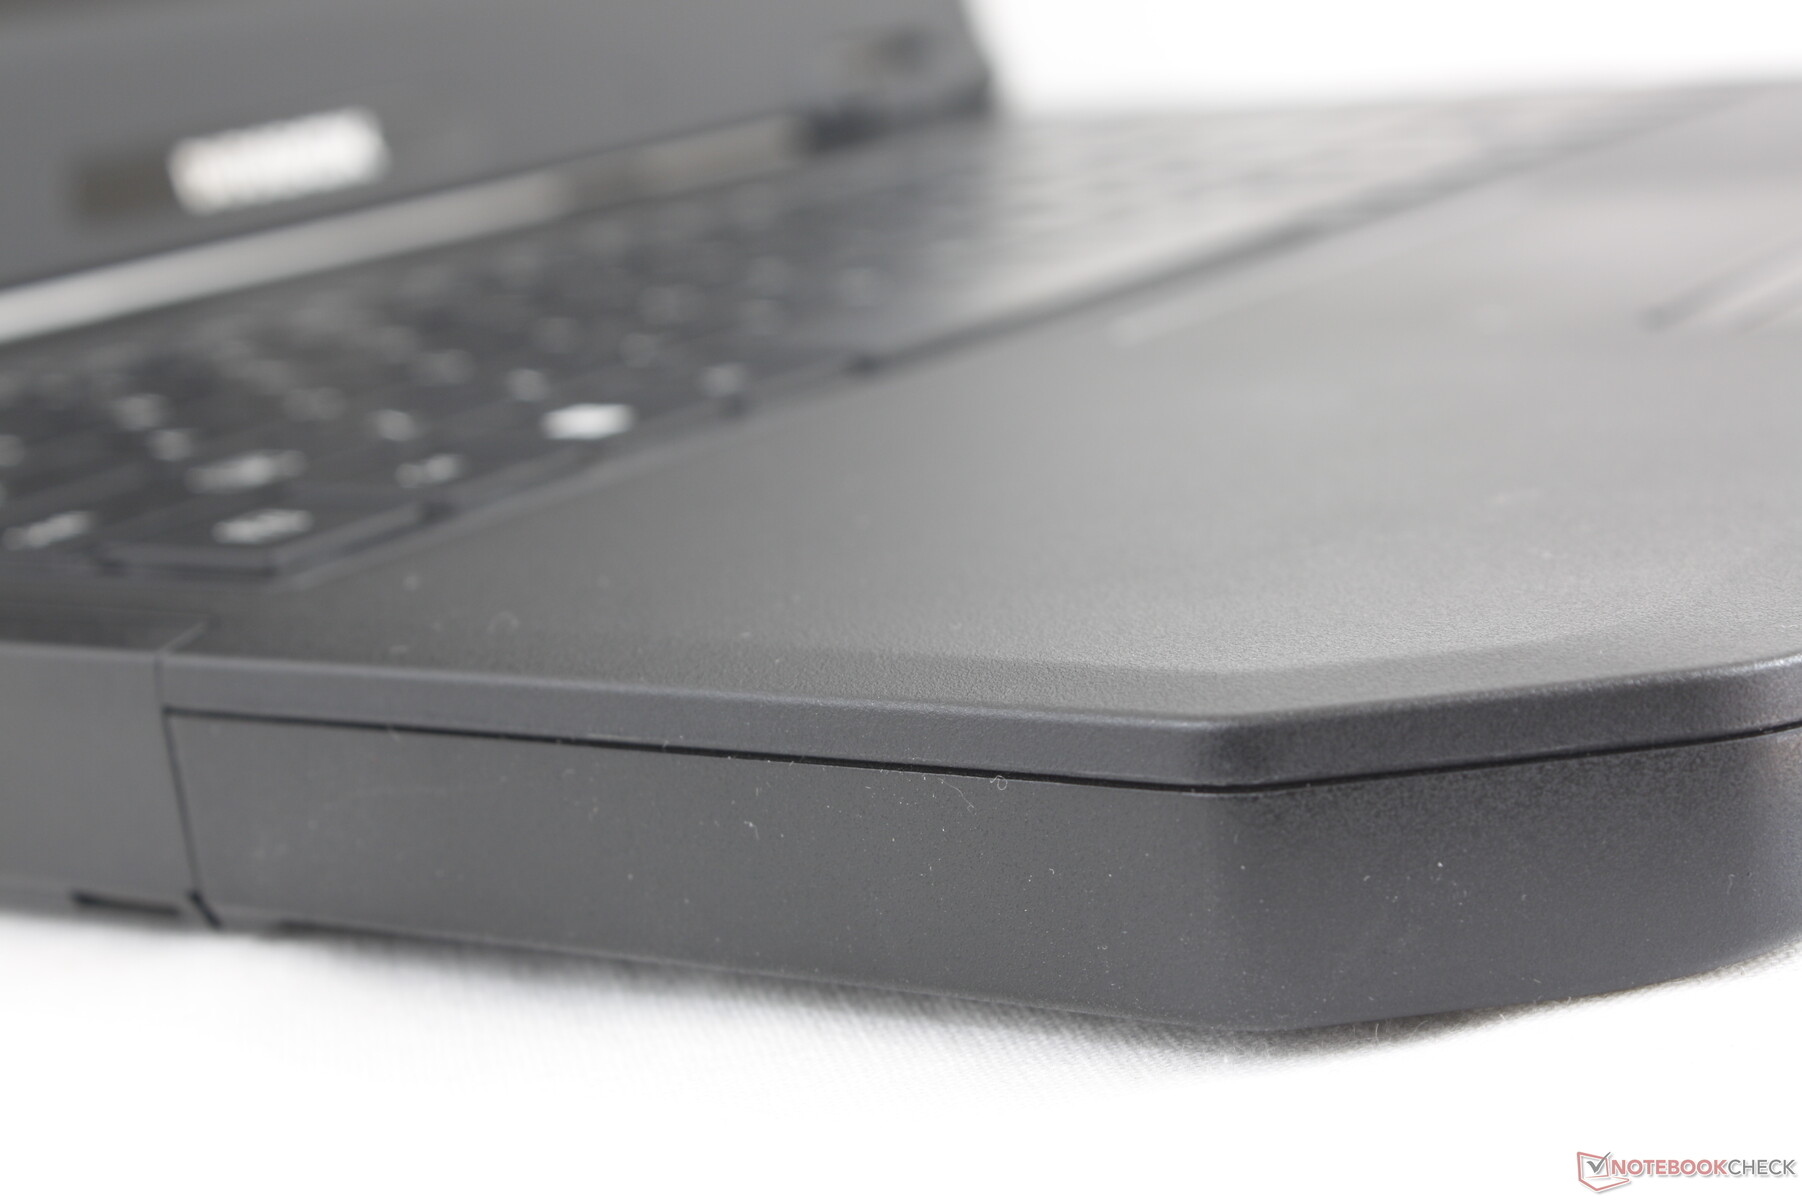
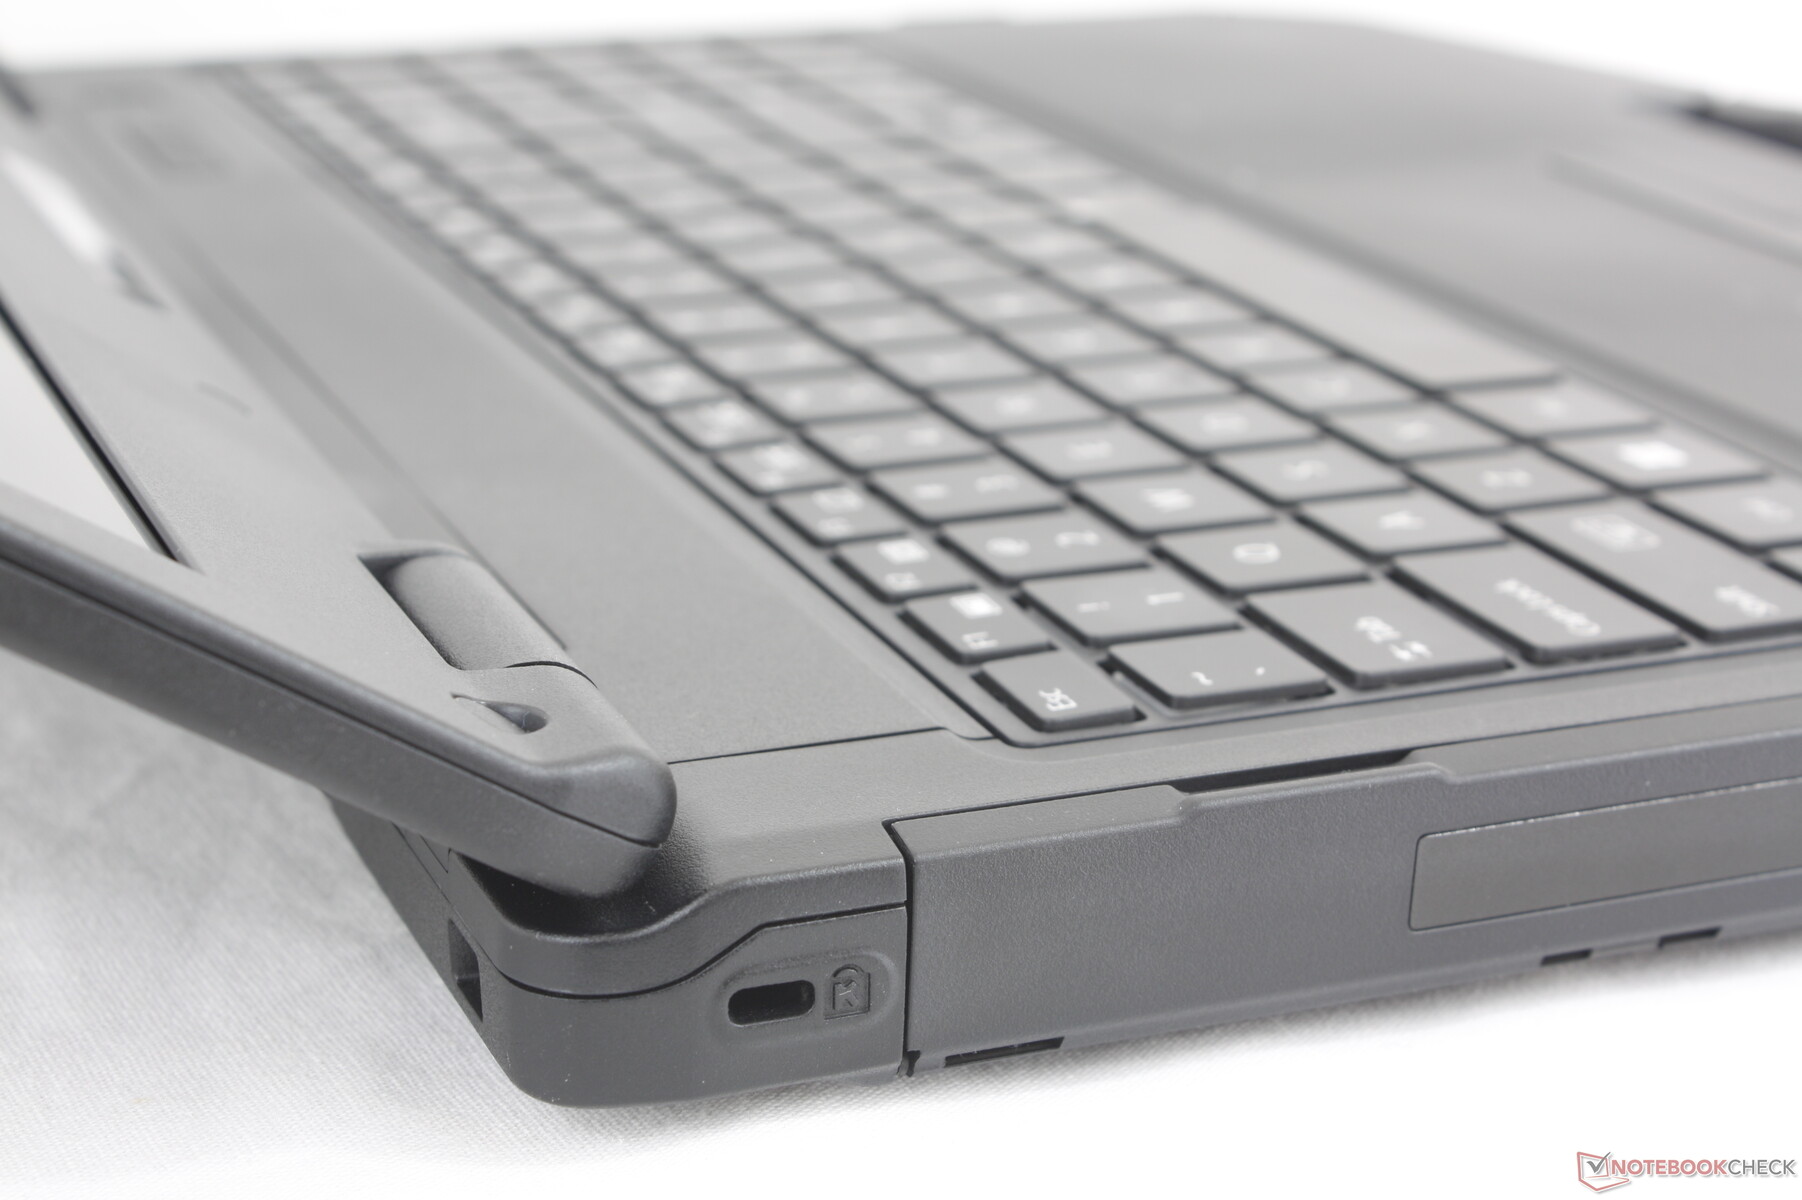
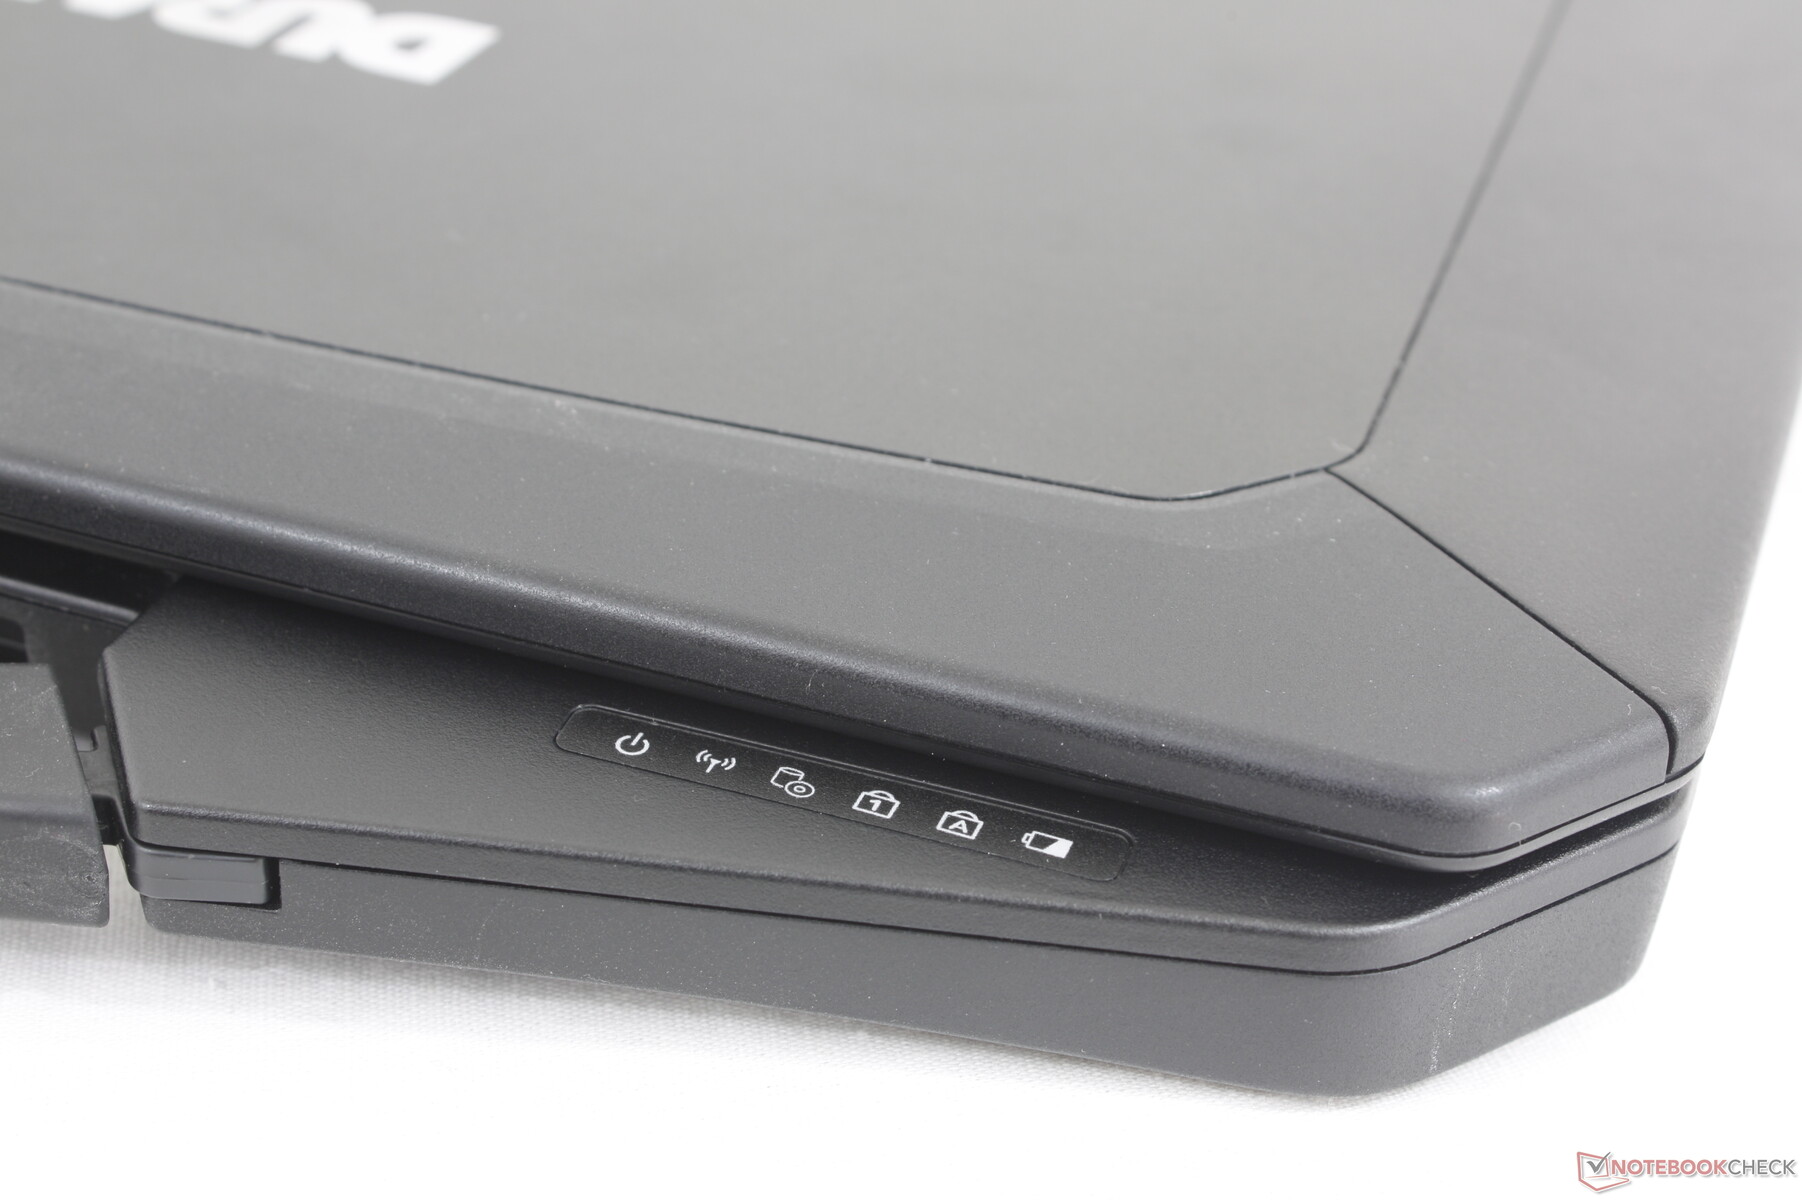
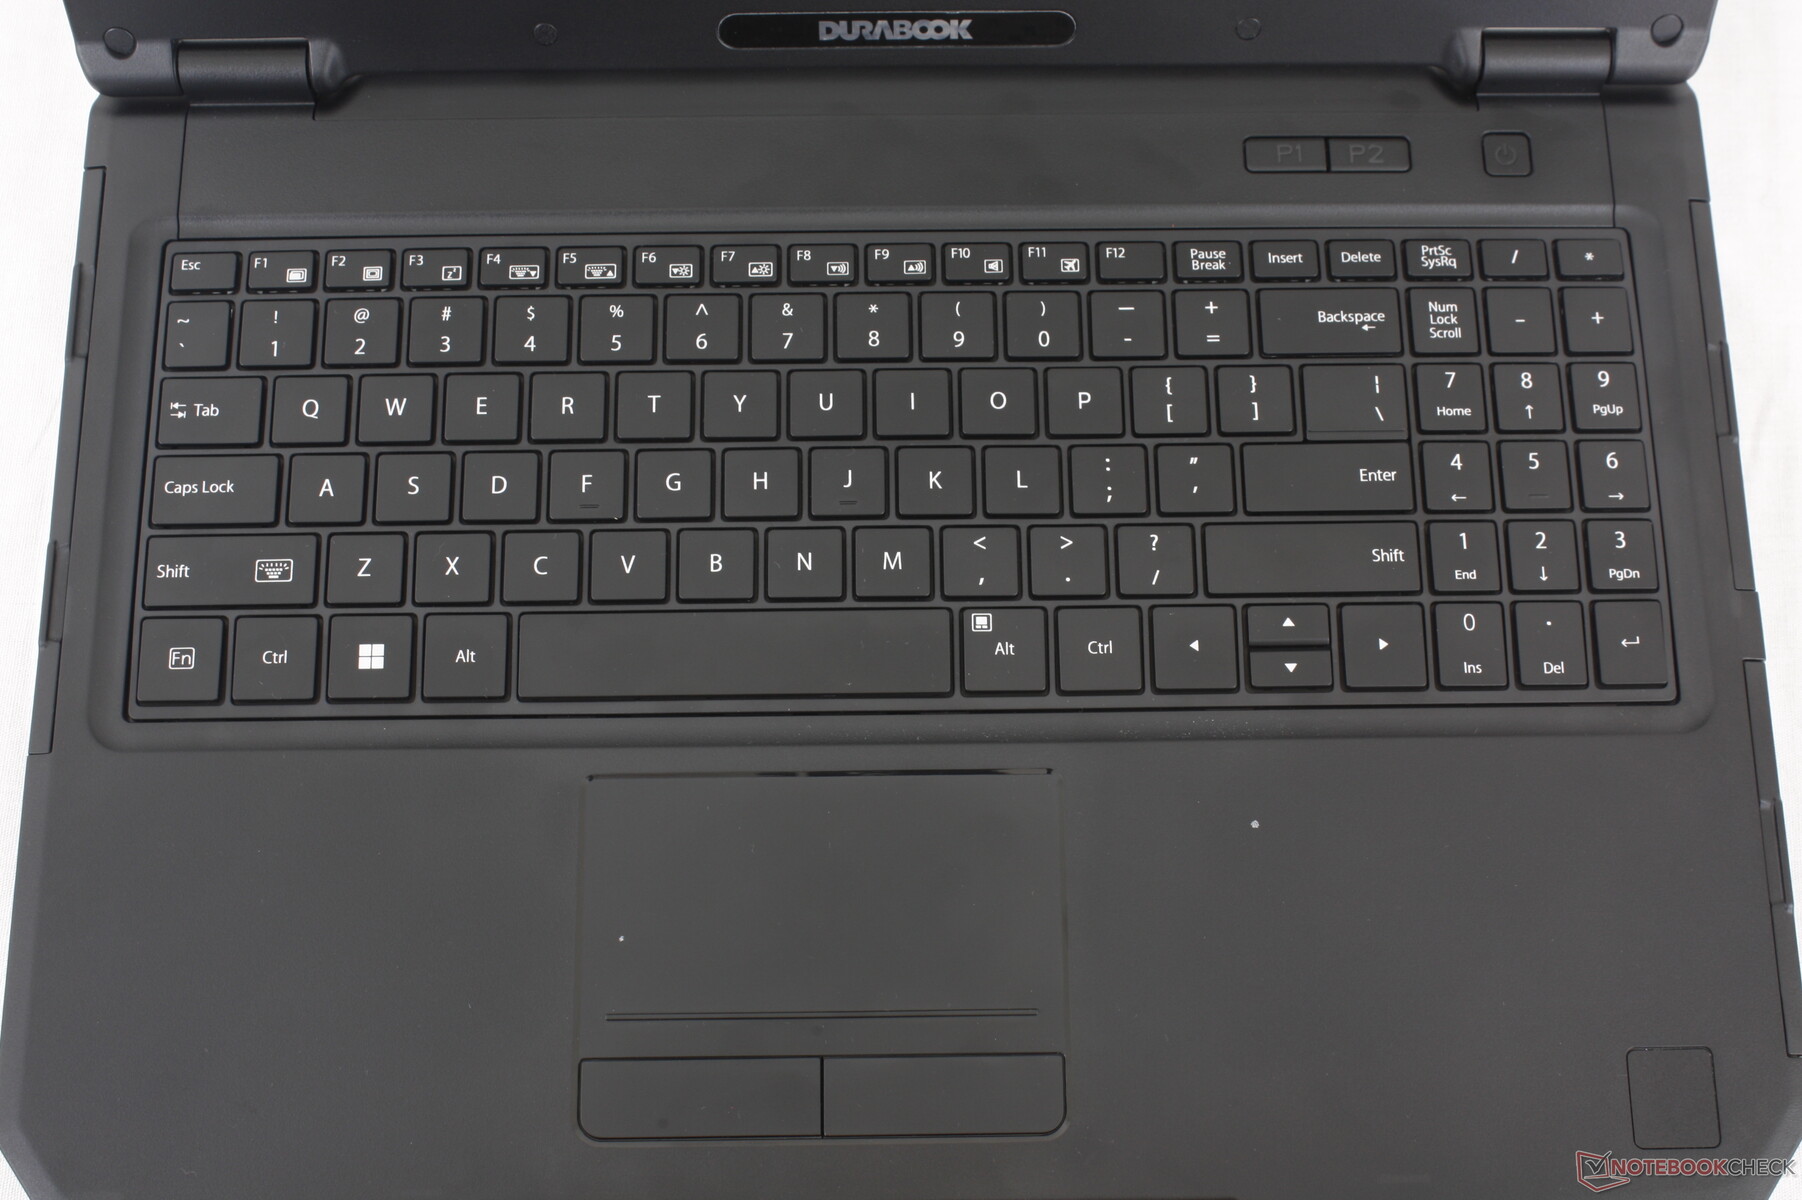
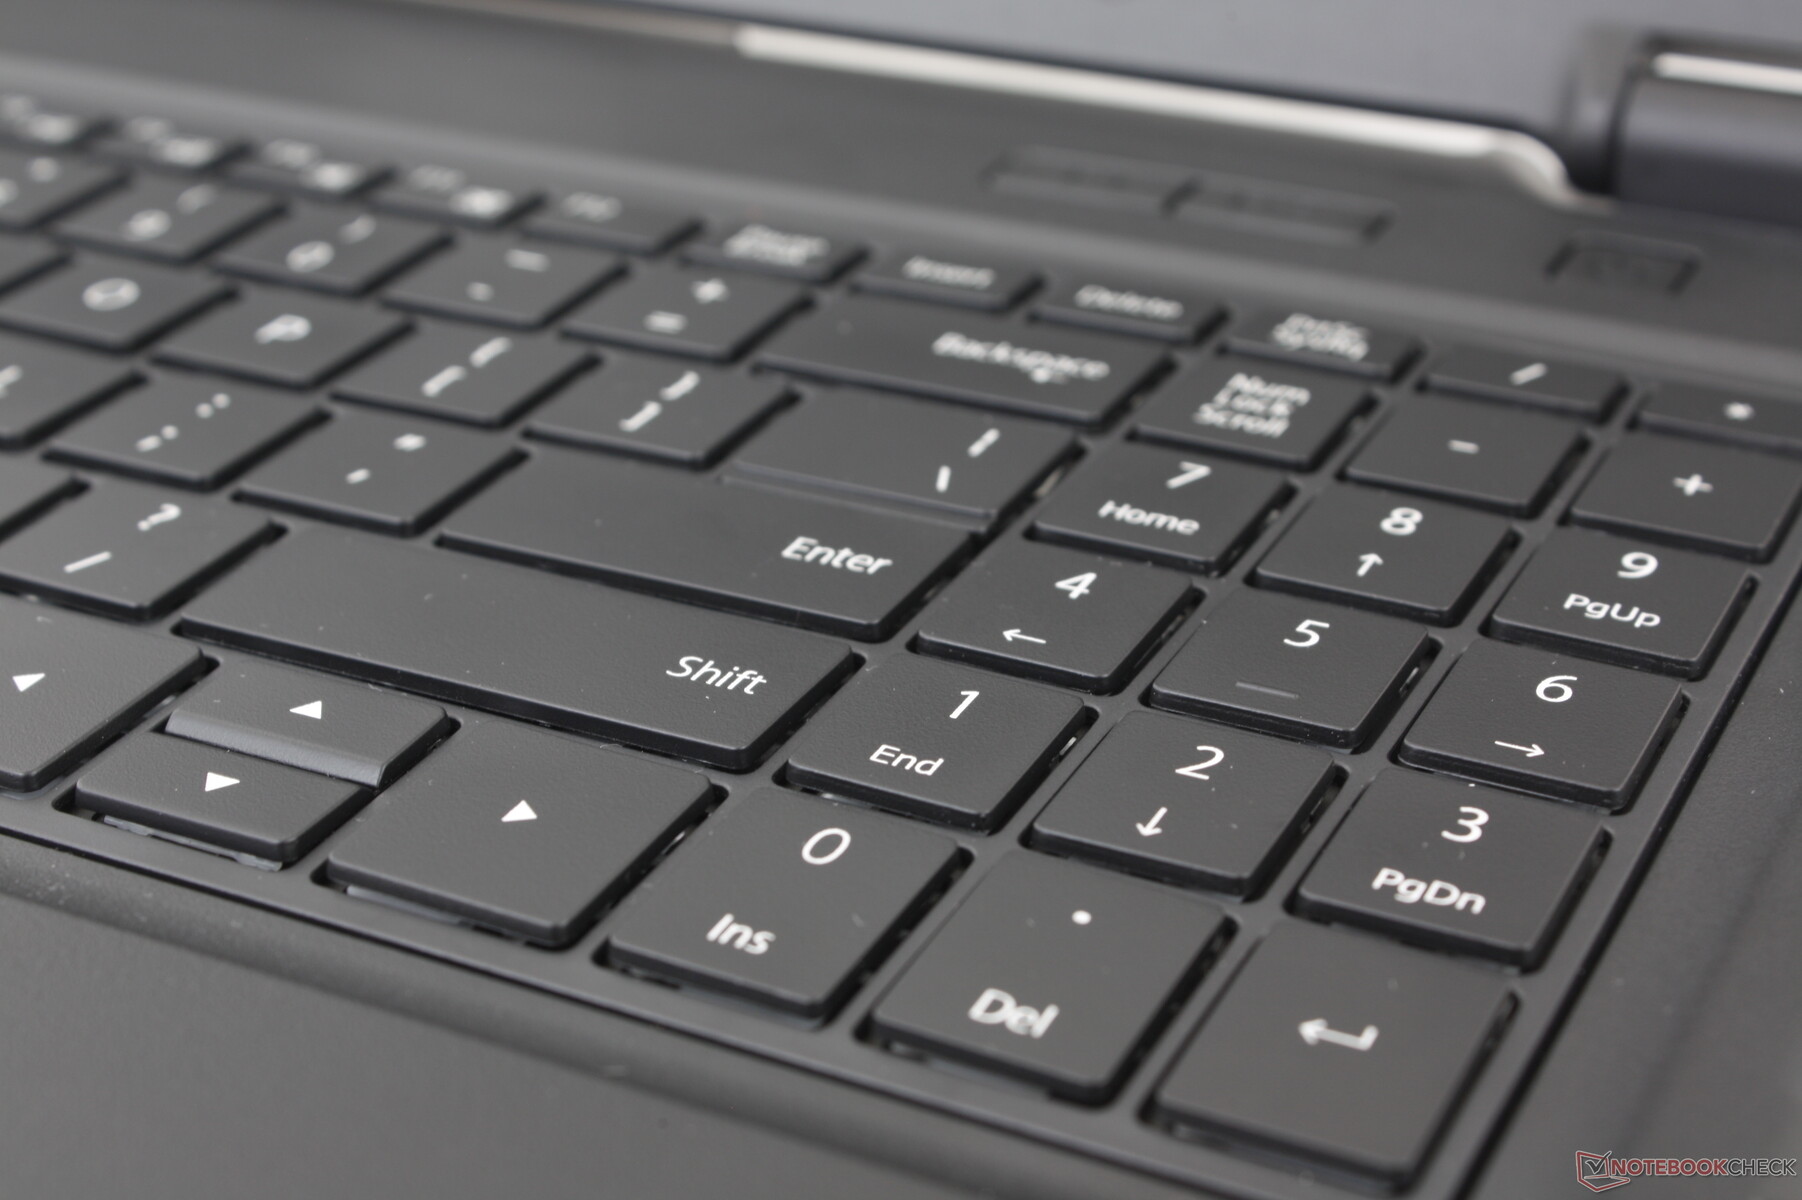
从外观上看,机箱做了一些调整,包括新的统一黑色、带数字键盘的更大键盘、键盘面板和提手之间更平滑的表面过渡,以及因主板内部变化而修改的端口位置。除了键盘的数字键盘部分在受力时表面更容易翘起外,机箱质量与以前一样出色。我们发现更厚的 Getac S410 更加坚固,尤其是在边角处,因为 Durabook 没有采用橡胶处理,以提供更好的防摔保护。
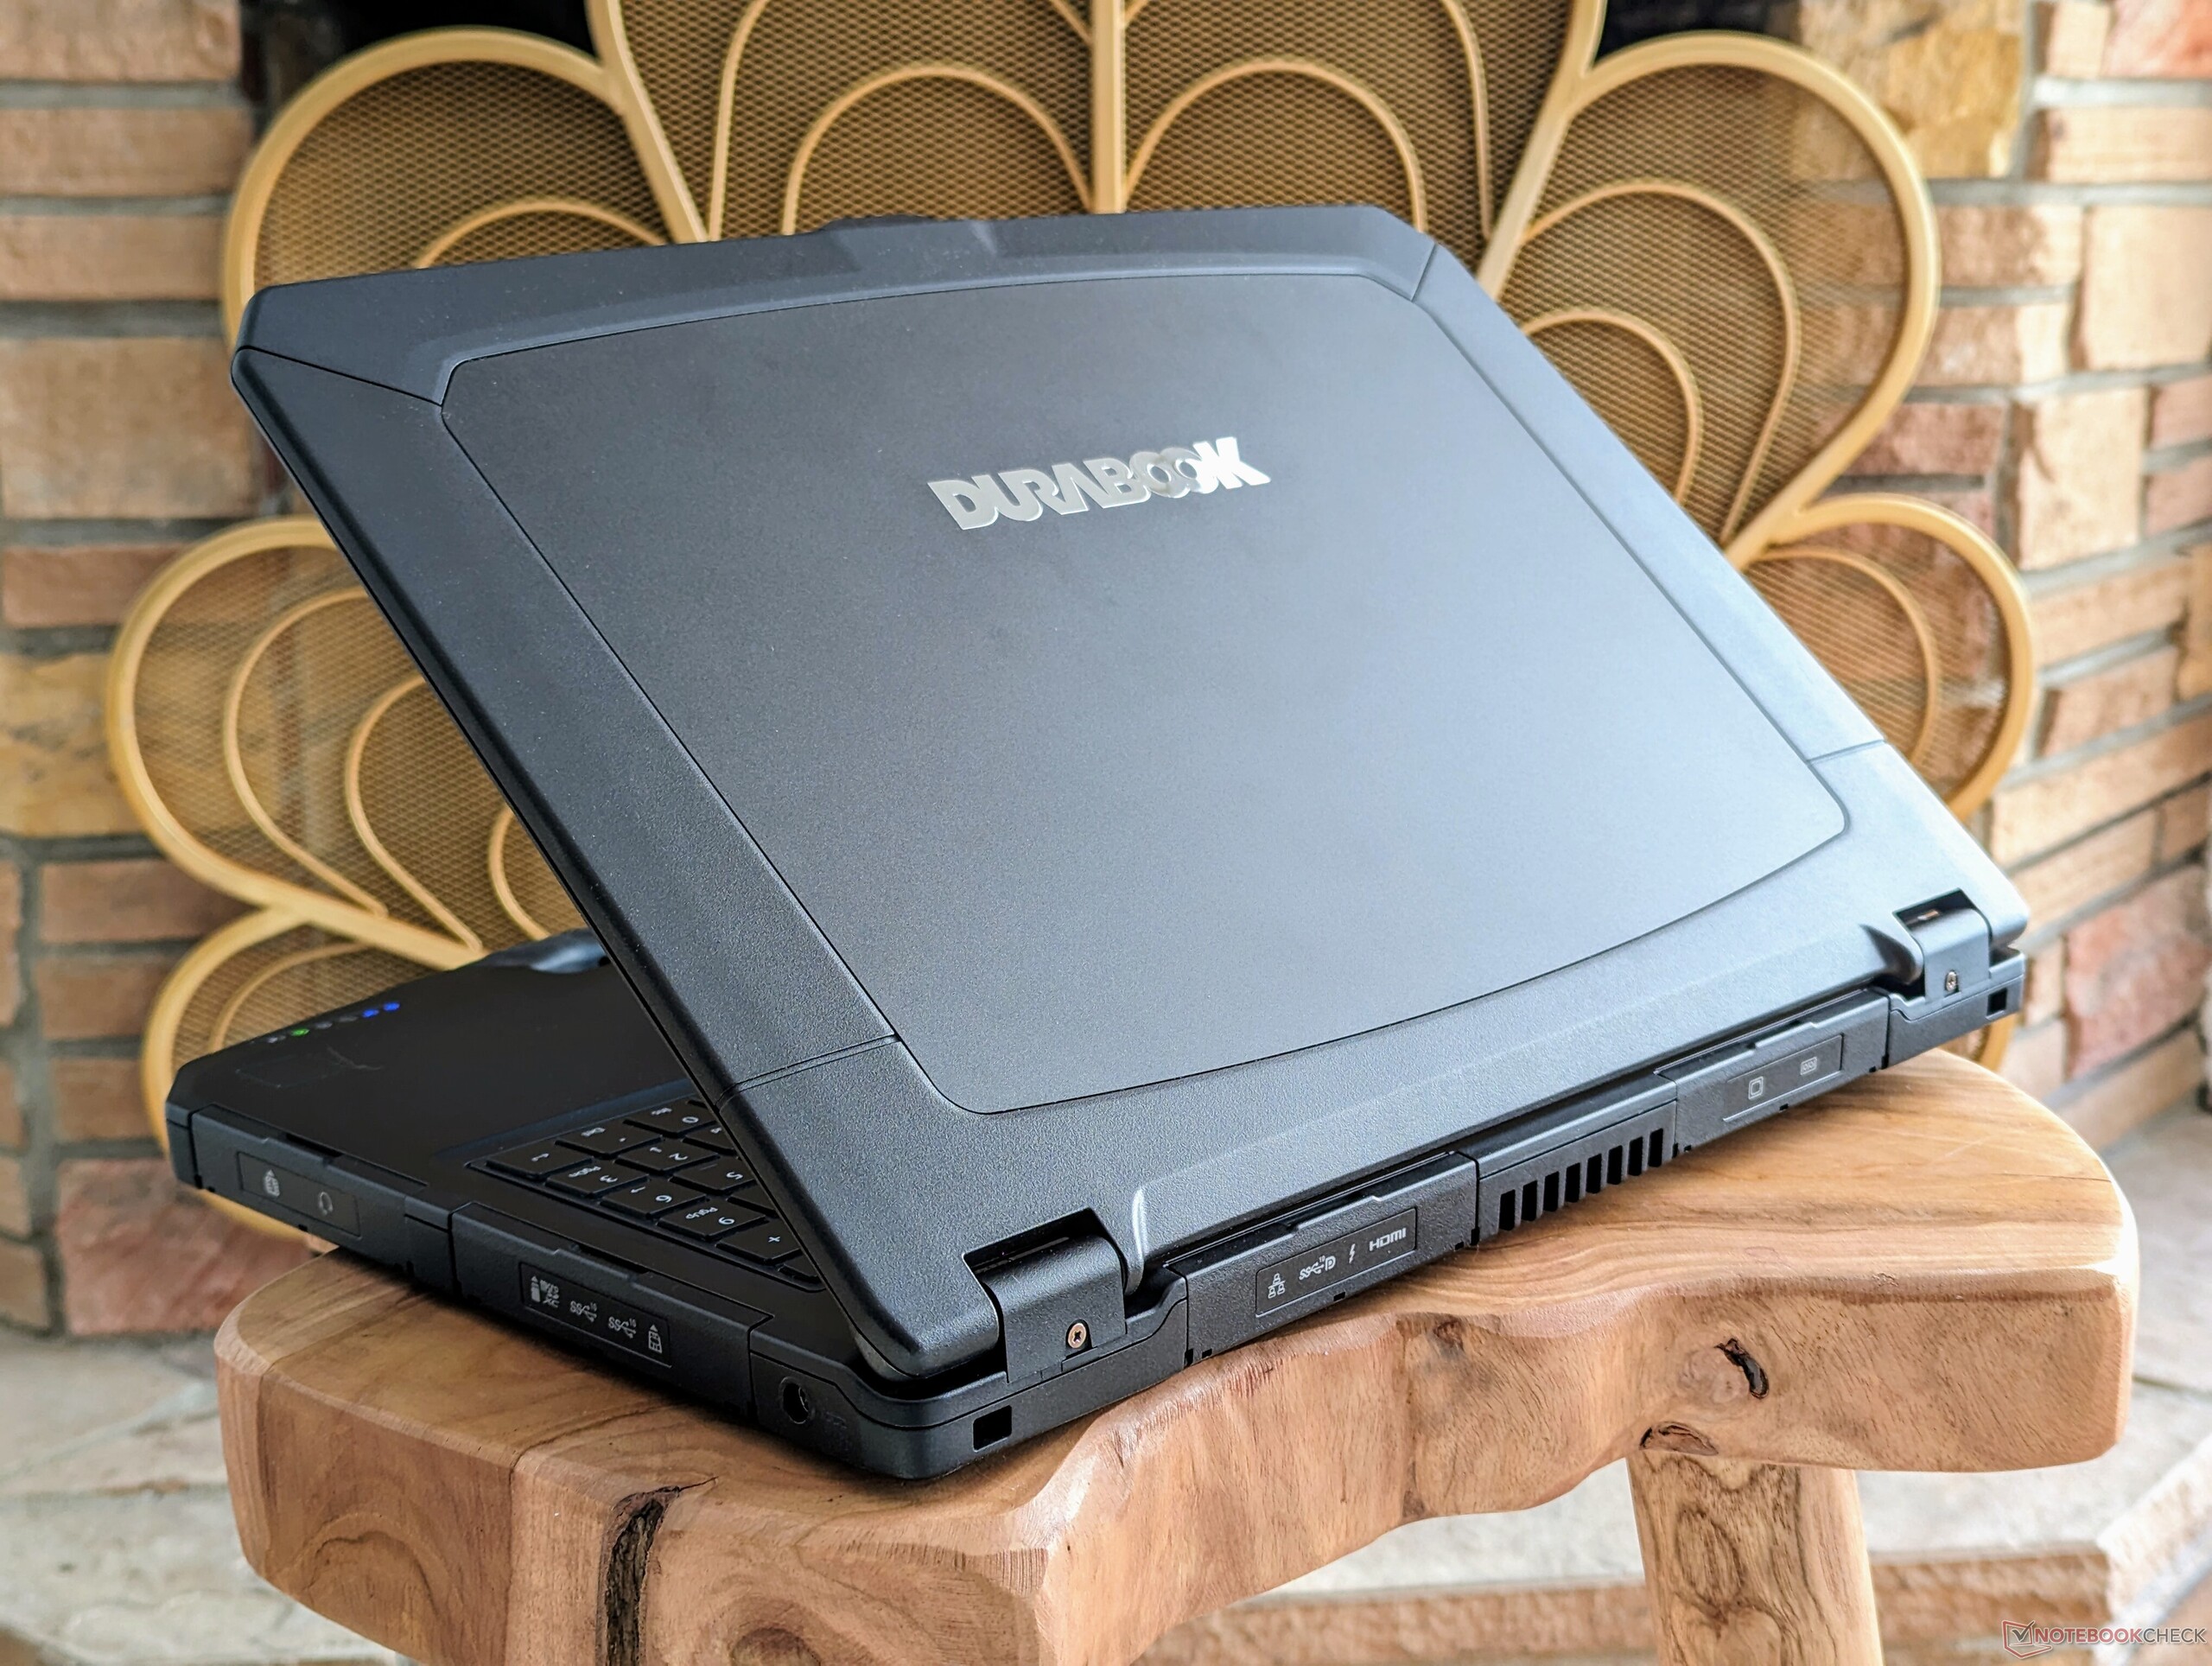
重量和尺寸与 2020 年的设计基本相同,以便与尽可能多的配件兼容。在同类产品中,旧款设计已经非常便携,而 2024 S15 依然如此,制造商宣称它是 "最薄、最轻 "的产品。14 英寸 Getac S410 G5例如,14 英寸的 Getac S410 G5 比 S15 既重又厚,尽管 Durabook 提供了更大的 15.6 英寸屏幕。
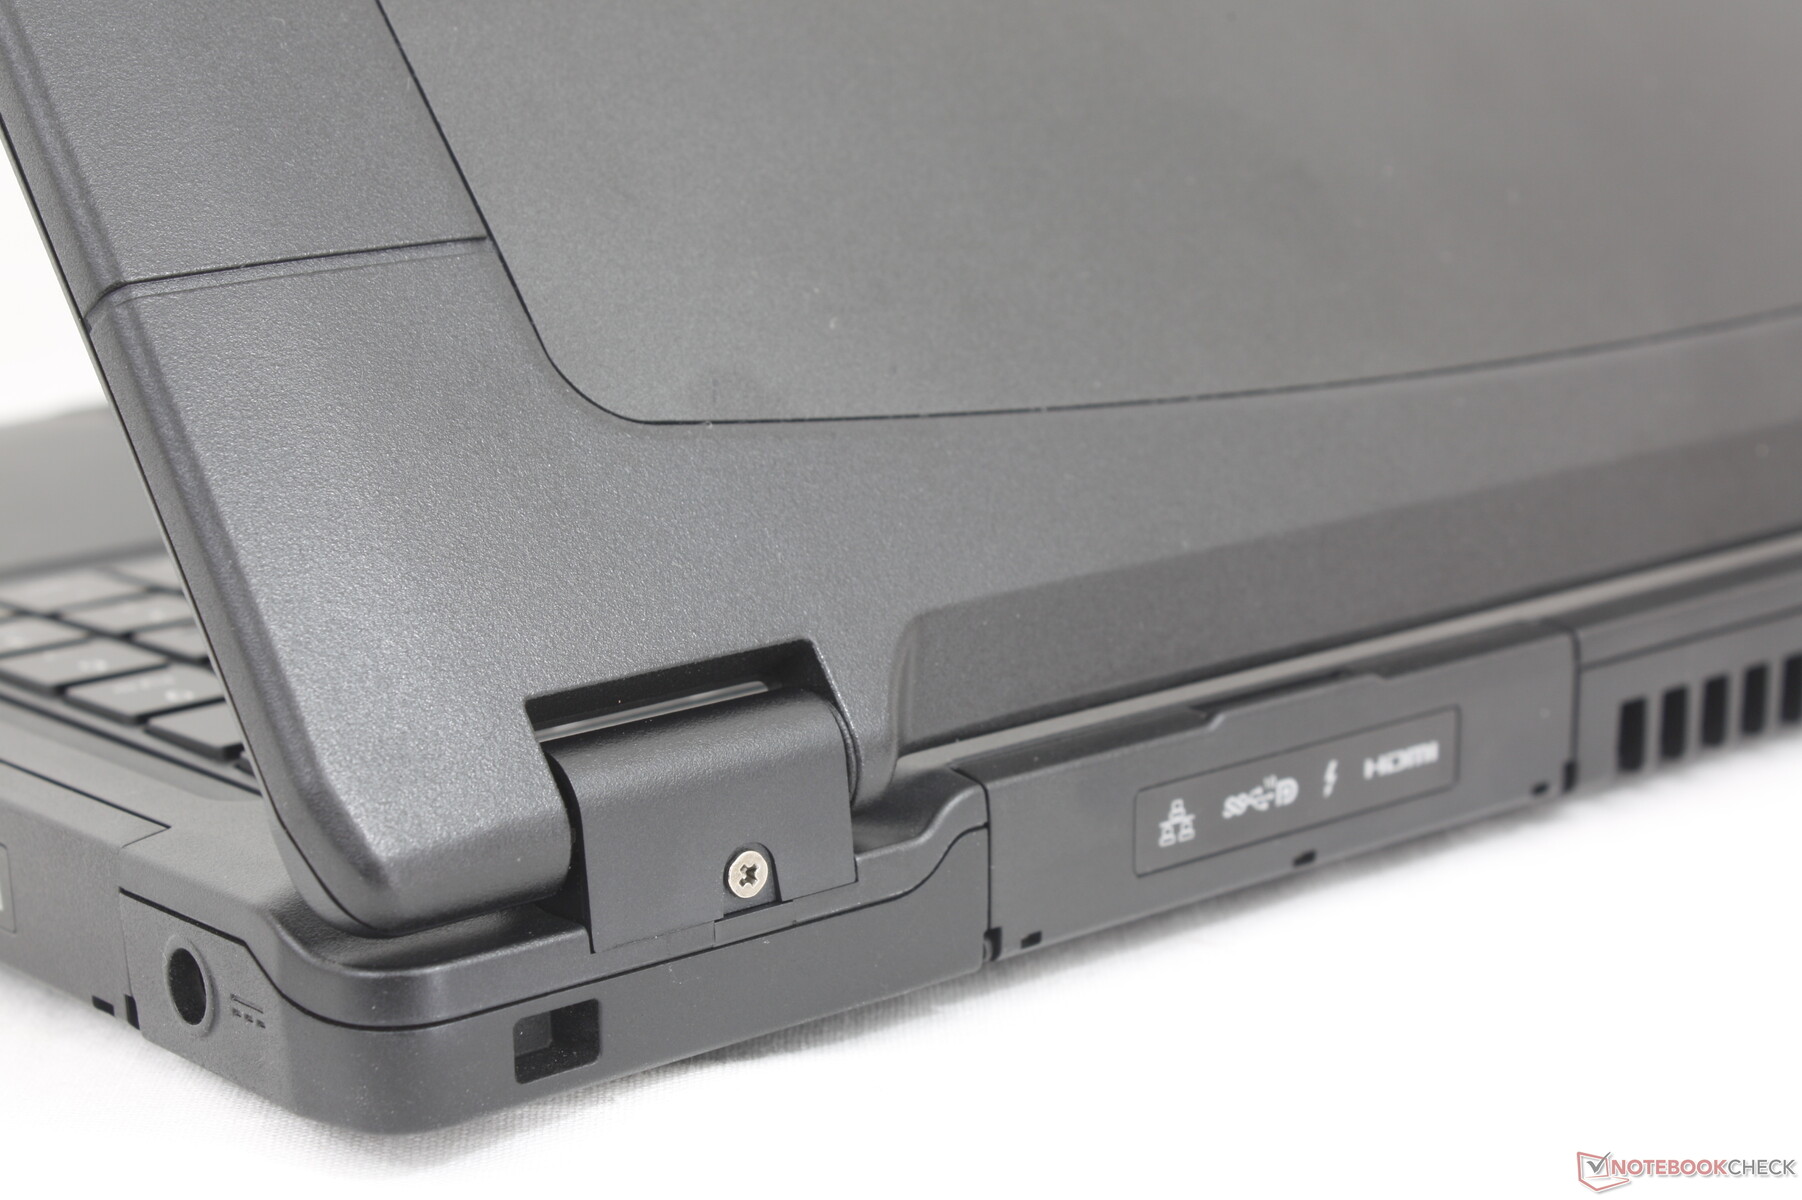
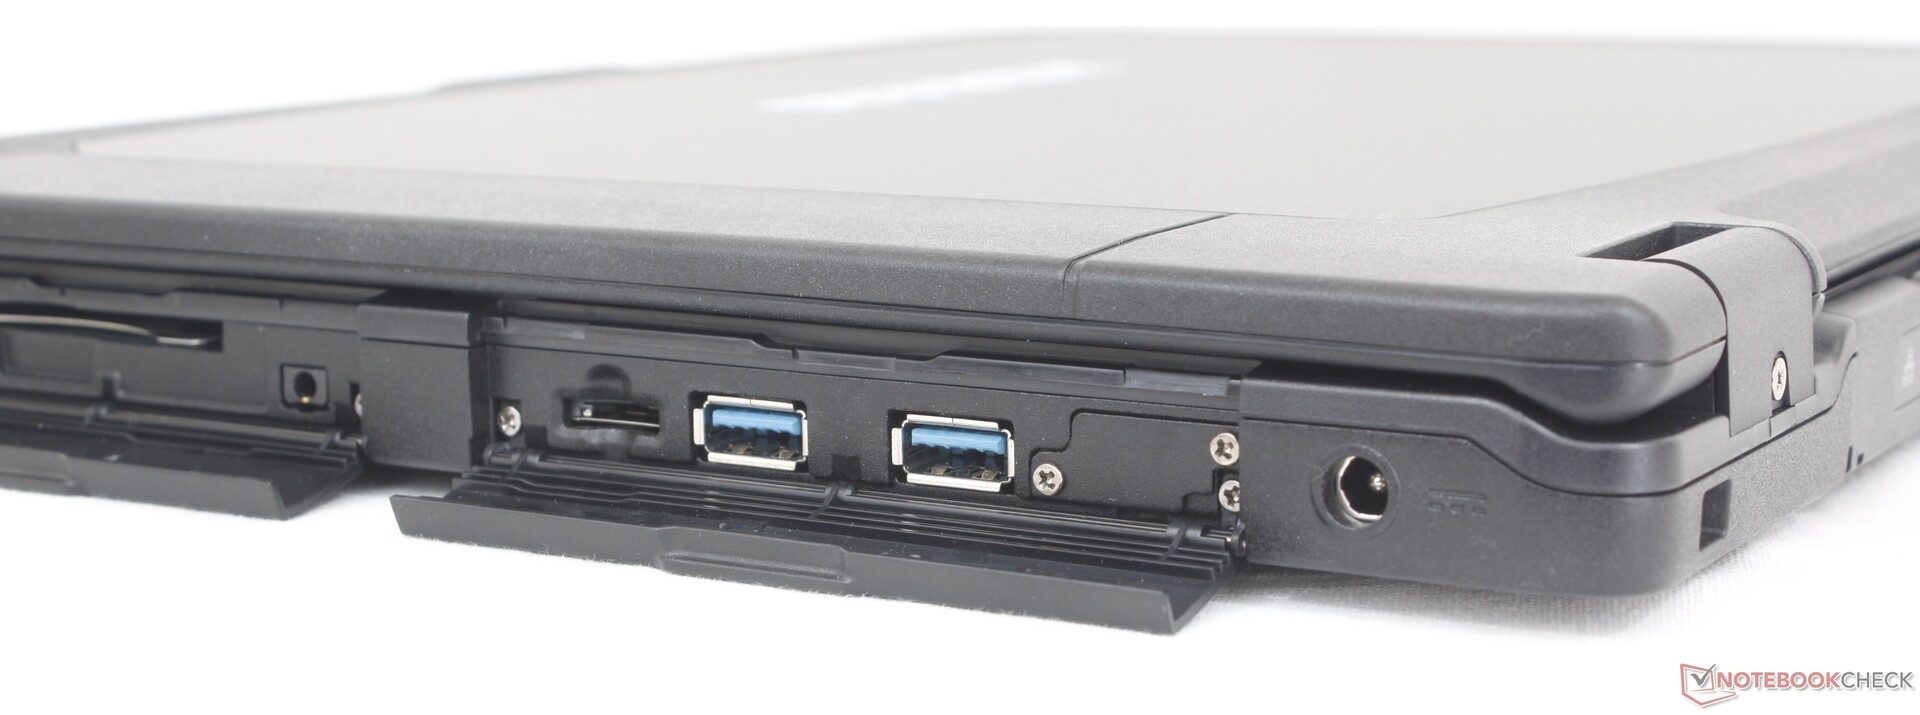
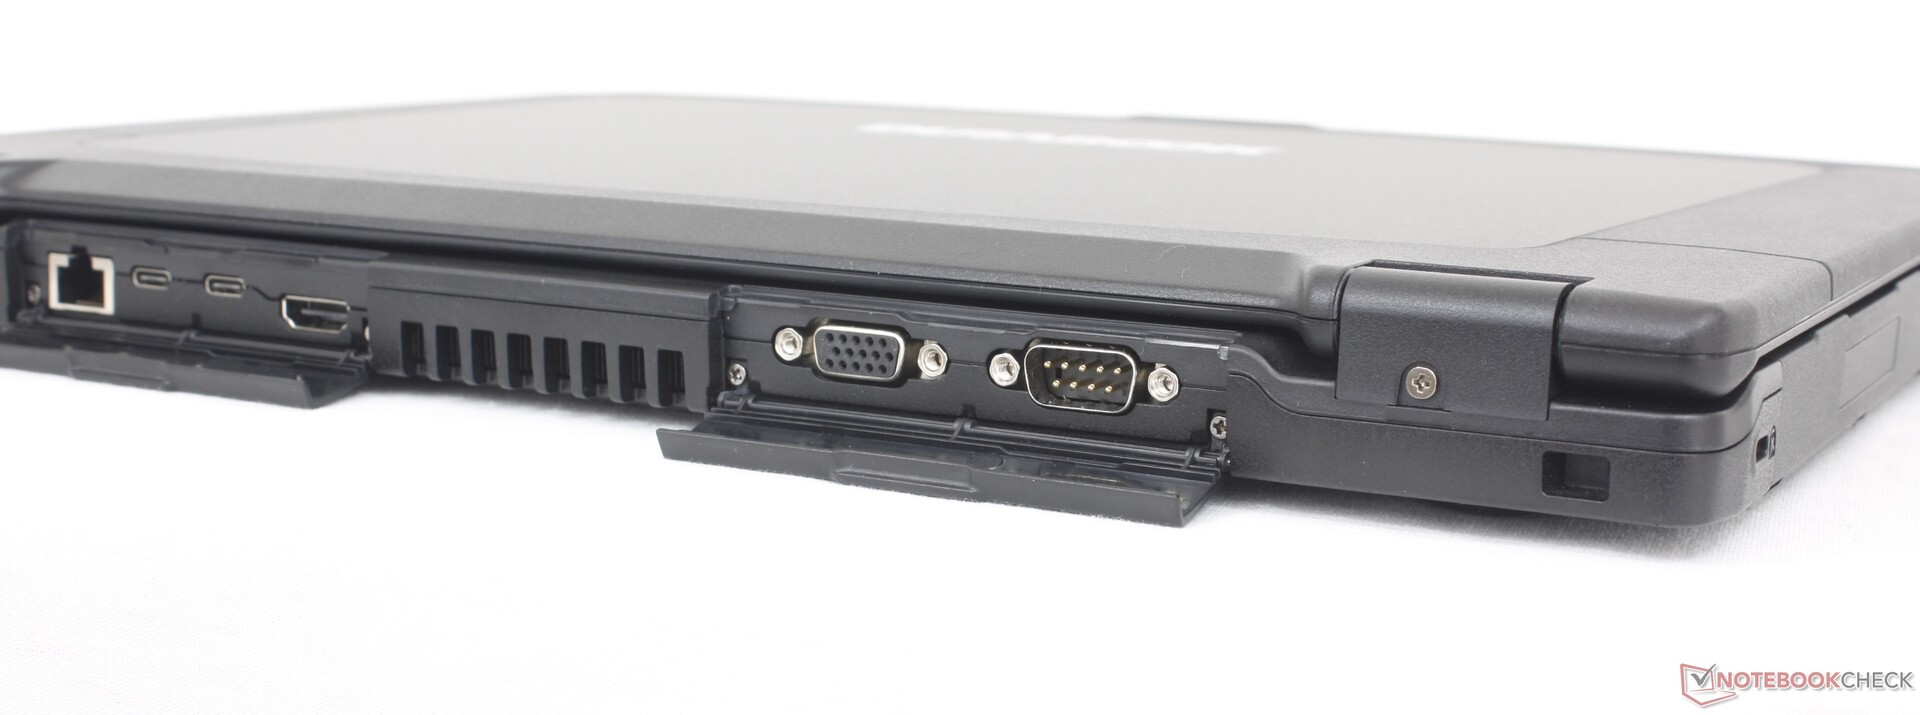
连接性--新增更多 USB-C 端口
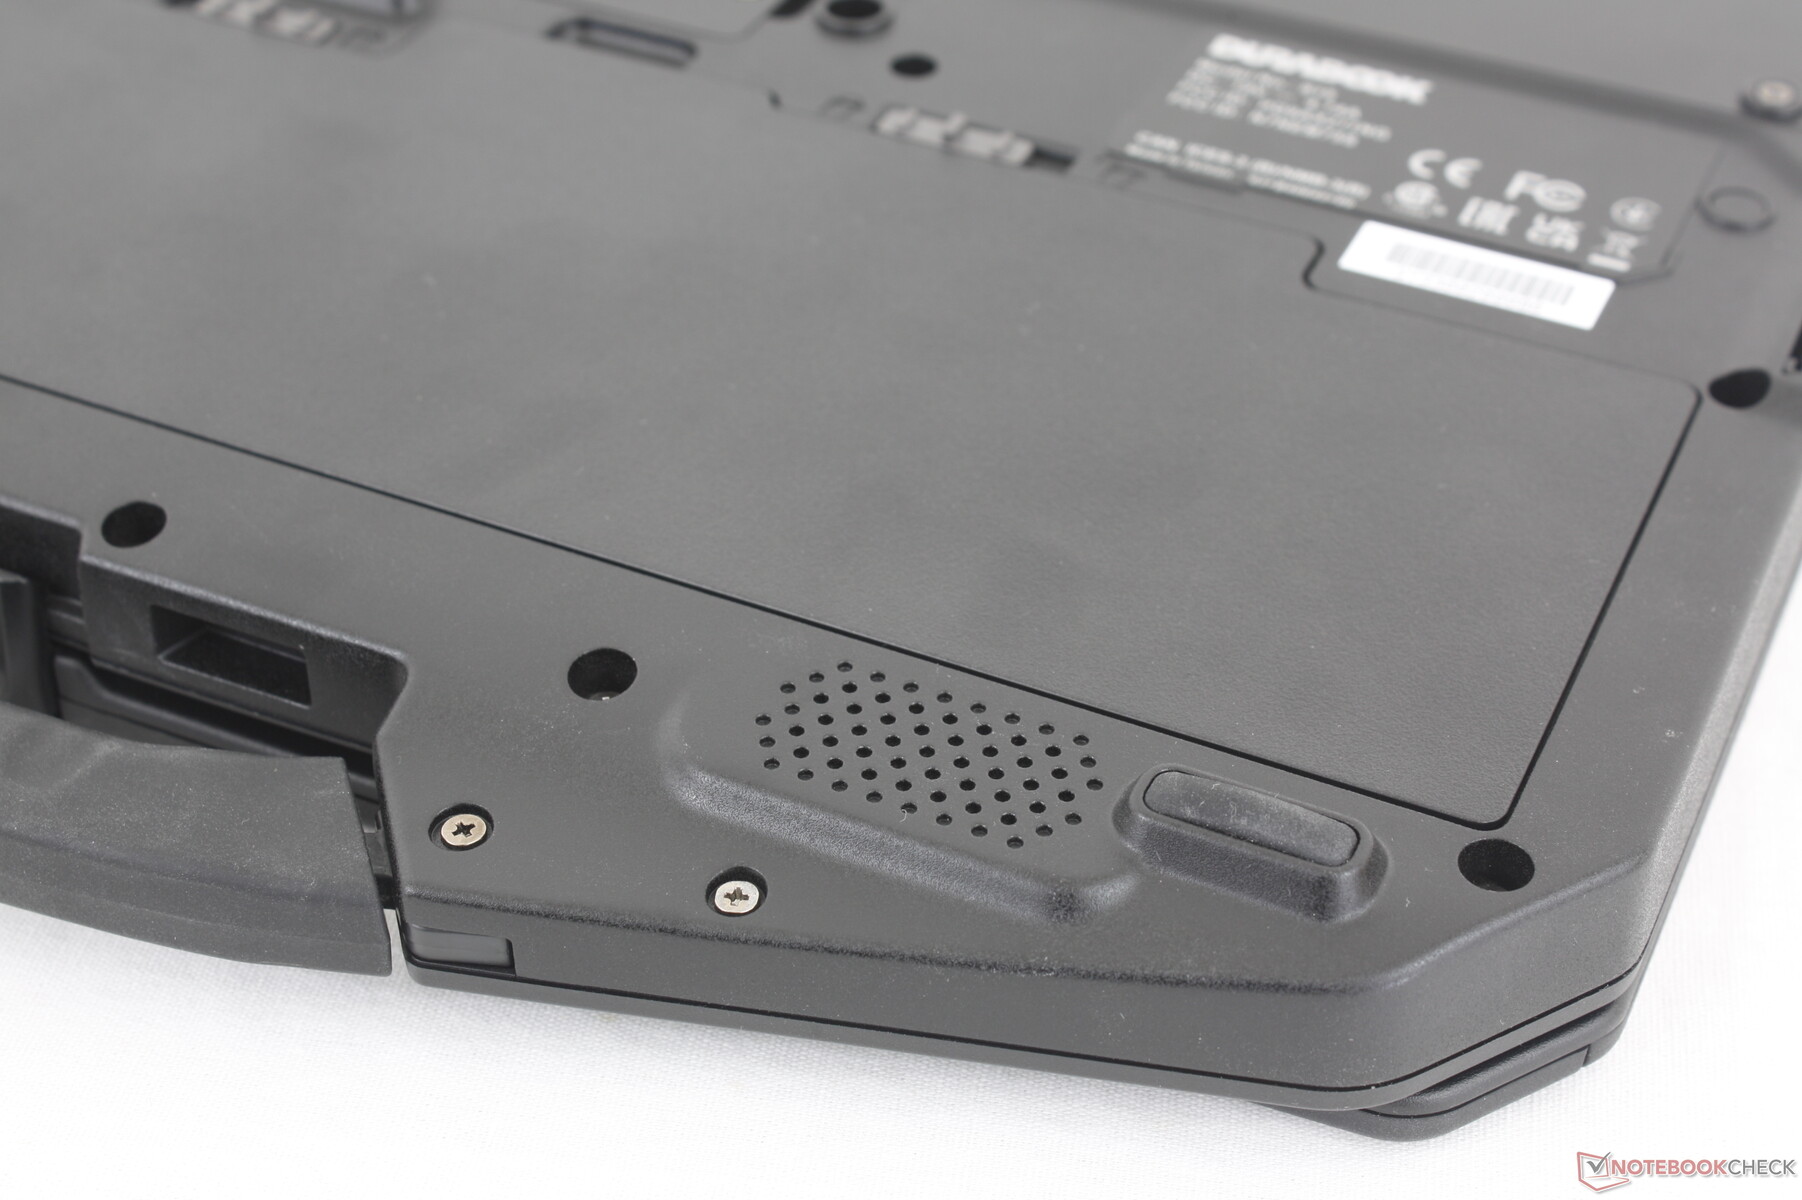
端口种类非常丰富,与 S15AB 厚度相同的选项全部回归。最引人注目的是增加了第二个 USB-C 端口,支持 Thunderbolt,以及方便的 ODD 插槽,用于热插拔额外的存储设备或专用配件。需要注意的是,虽然两个 USB-C 端口都支持 DisplayPort,但只有兼容 Thunderbolt 的端口支持 Power Delivery 为设备充电。
与 Getac S410 上的挡板相比,覆盖端口的保护挡板明显更容易打开和关闭。这个小细节让 Durabook 在野外使用时更加友好。


SD 读卡器
SD 卡传输速率没有提高。我们建议查看 戴尔Latitude Rugged 系列如果对传输速率有较高要求,它们往往集成了速度更快的 SD 卡读卡器。
| SD Card Reader | |
| average JPG Copy Test (av. of 3 runs) | |
| Dell Latitude 5420 Rugged-P85G (Toshiba Exceria Pro SDXC 64 GB UHS-II) | |
| Getac S410 G5 (AV Pro V60) | |
| Panasonic Toughbook 40 (AV Pro V60) | |
| Durabook S15ABG2 (Toshiba Exceria Pro SDXC 64 GB UHS-II) | |
| Durabook S15 (AV Pro V60) | |
| Acer Enduro Urban N3 EUN314 (AV Pro V60) | |
| maximum AS SSD Seq Read Test (1GB) | |
| Dell Latitude 5420 Rugged-P85G (Toshiba Exceria Pro SDXC 64 GB UHS-II) | |
| Getac S410 G5 (AV Pro V60) | |
| Durabook S15 (AV Pro V60) | |
| Durabook S15ABG2 (Toshiba Exceria Pro SDXC 64 GB UHS-II) | |
| Panasonic Toughbook 40 (AV Pro V60) | |
| Acer Enduro Urban N3 EUN314 (AV Pro V60) | |
交流
我们的设备配备了英特尔 AX211,可连接 Wi-Fi 6E 和蓝牙 5.3。与华硕 AXE11000 测试路由器配对后,传输速率非常出色,而且出奇地稳定。
| Networking | |
| iperf3 transmit AX12 | |
| Acer Enduro Urban N3 EUN314 | |
| Durabook S15ABG2 | |
| Dell Latitude 5420 Rugged-P85G | |
| iperf3 receive AX12 | |
| Acer Enduro Urban N3 EUN314 | |
| Durabook S15ABG2 | |
| Dell Latitude 5420 Rugged-P85G | |
| iperf3 transmit AXE11000 | |
| Durabook S15 | |
| Panasonic Toughbook 40 | |
| Getac S410 G5 | |
| iperf3 receive AXE11000 | |
| Panasonic Toughbook 40 | |
| Durabook S15 | |
| Getac S410 G5 | |
| iperf3 transmit AXE11000 6GHz | |
| Durabook S15 | |
| Getac S410 G5 | |
| iperf3 receive AXE11000 6GHz | |
| Durabook S15 | |
| Getac S410 G5 | |
网络摄像头
网络摄像头可配置为 200 万像素、500 万像素或完全不配置,具体取决于用户应用。我们的设备配备了一个 500 万像素传感器,内置红外功能,支持 Hello 功能。为保护隐私,标配了物理滑动快门。


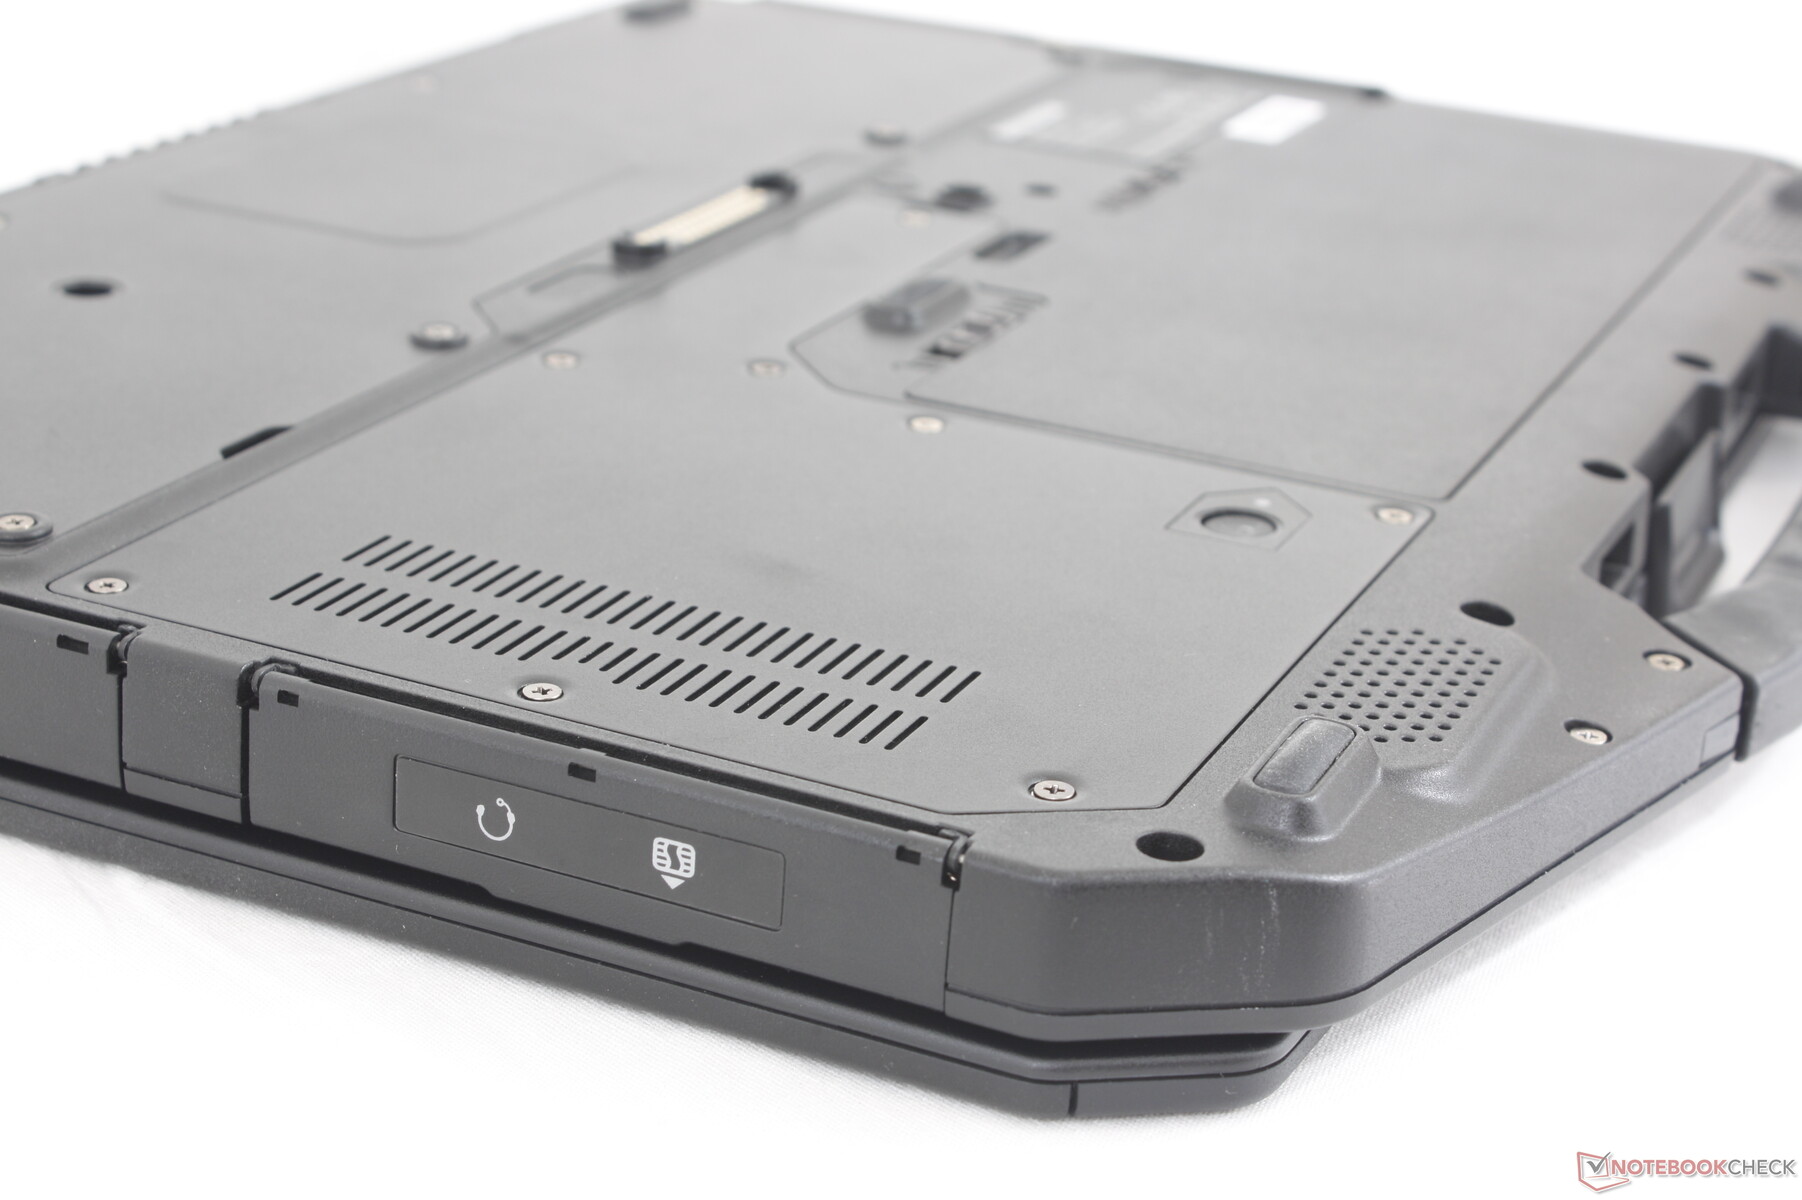
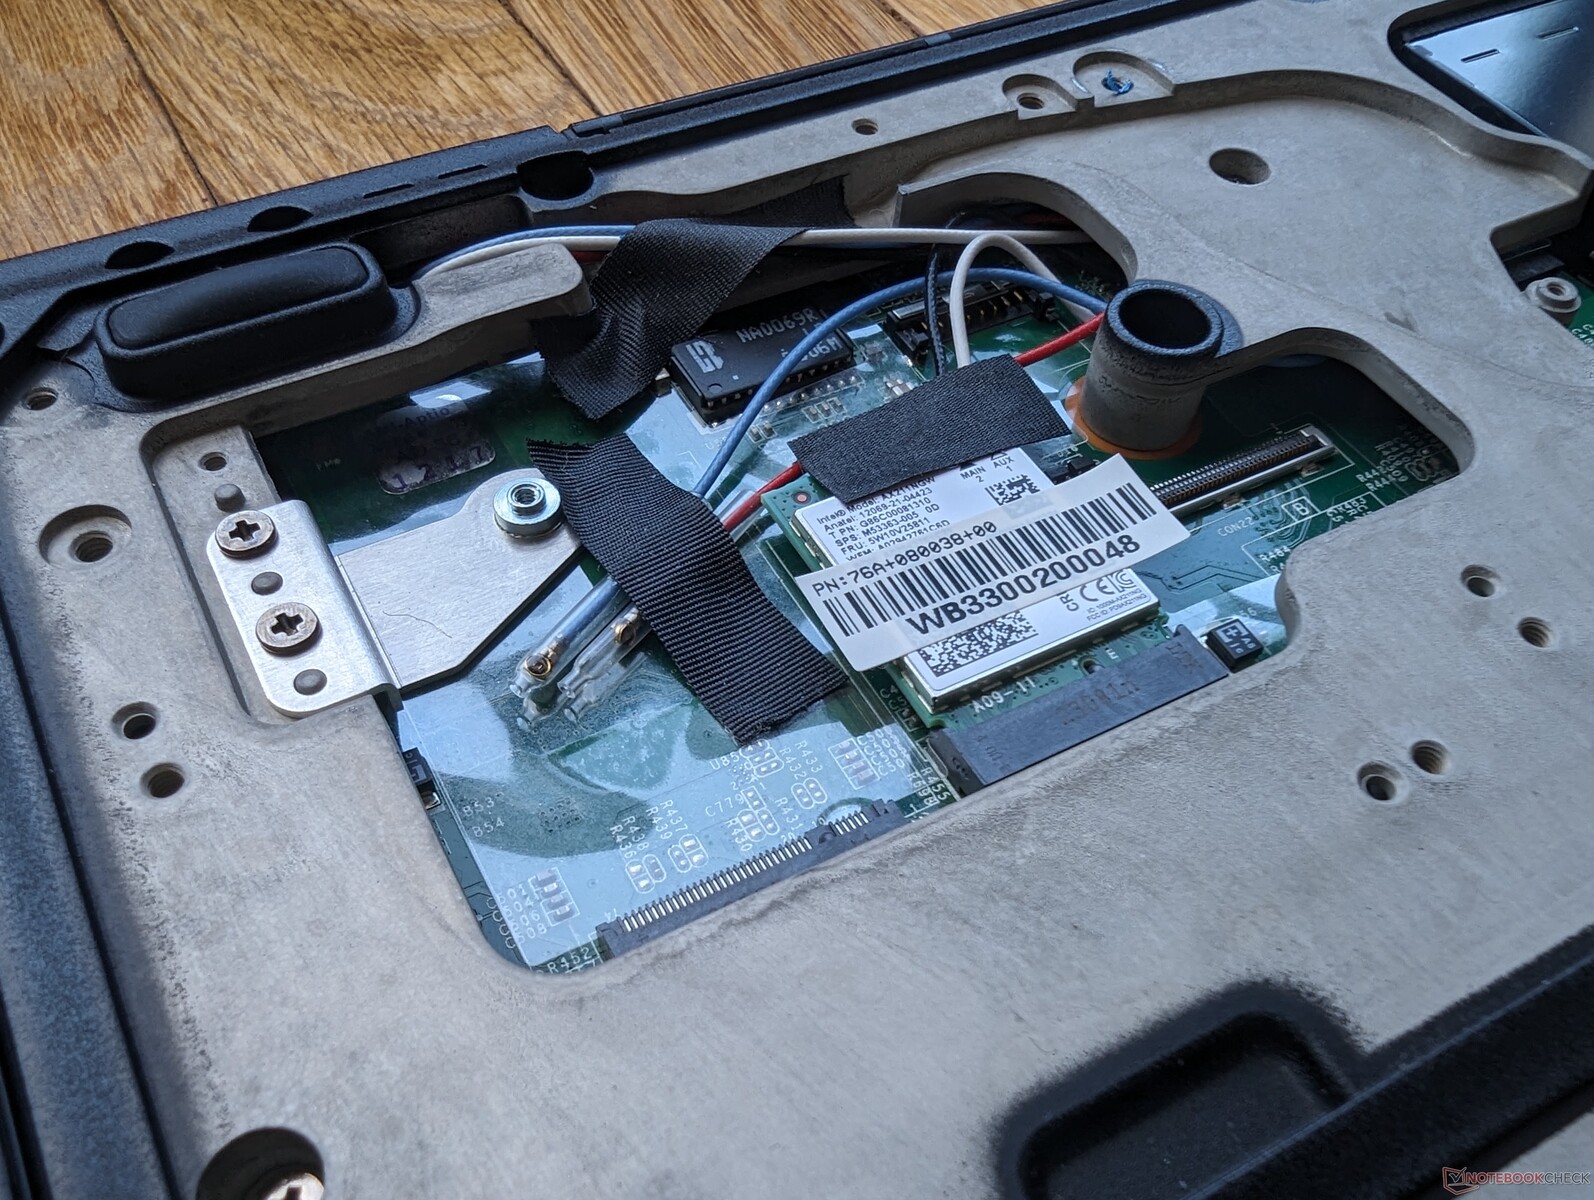
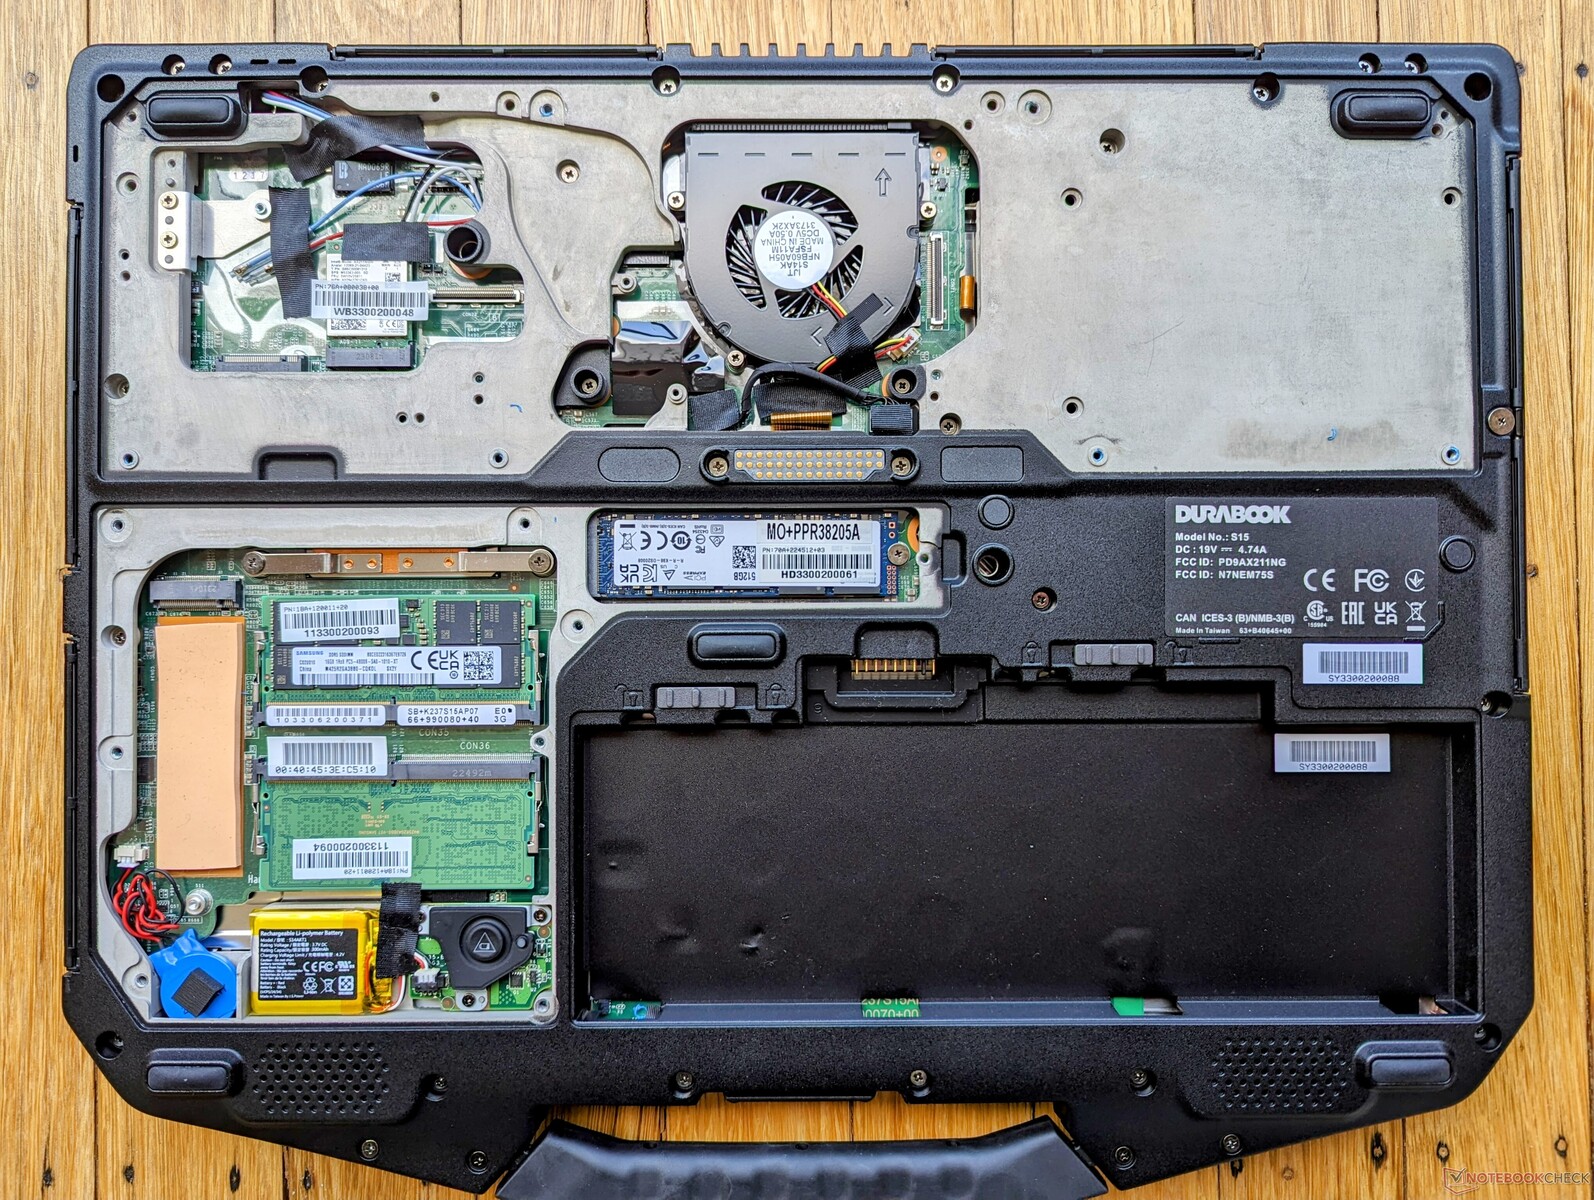
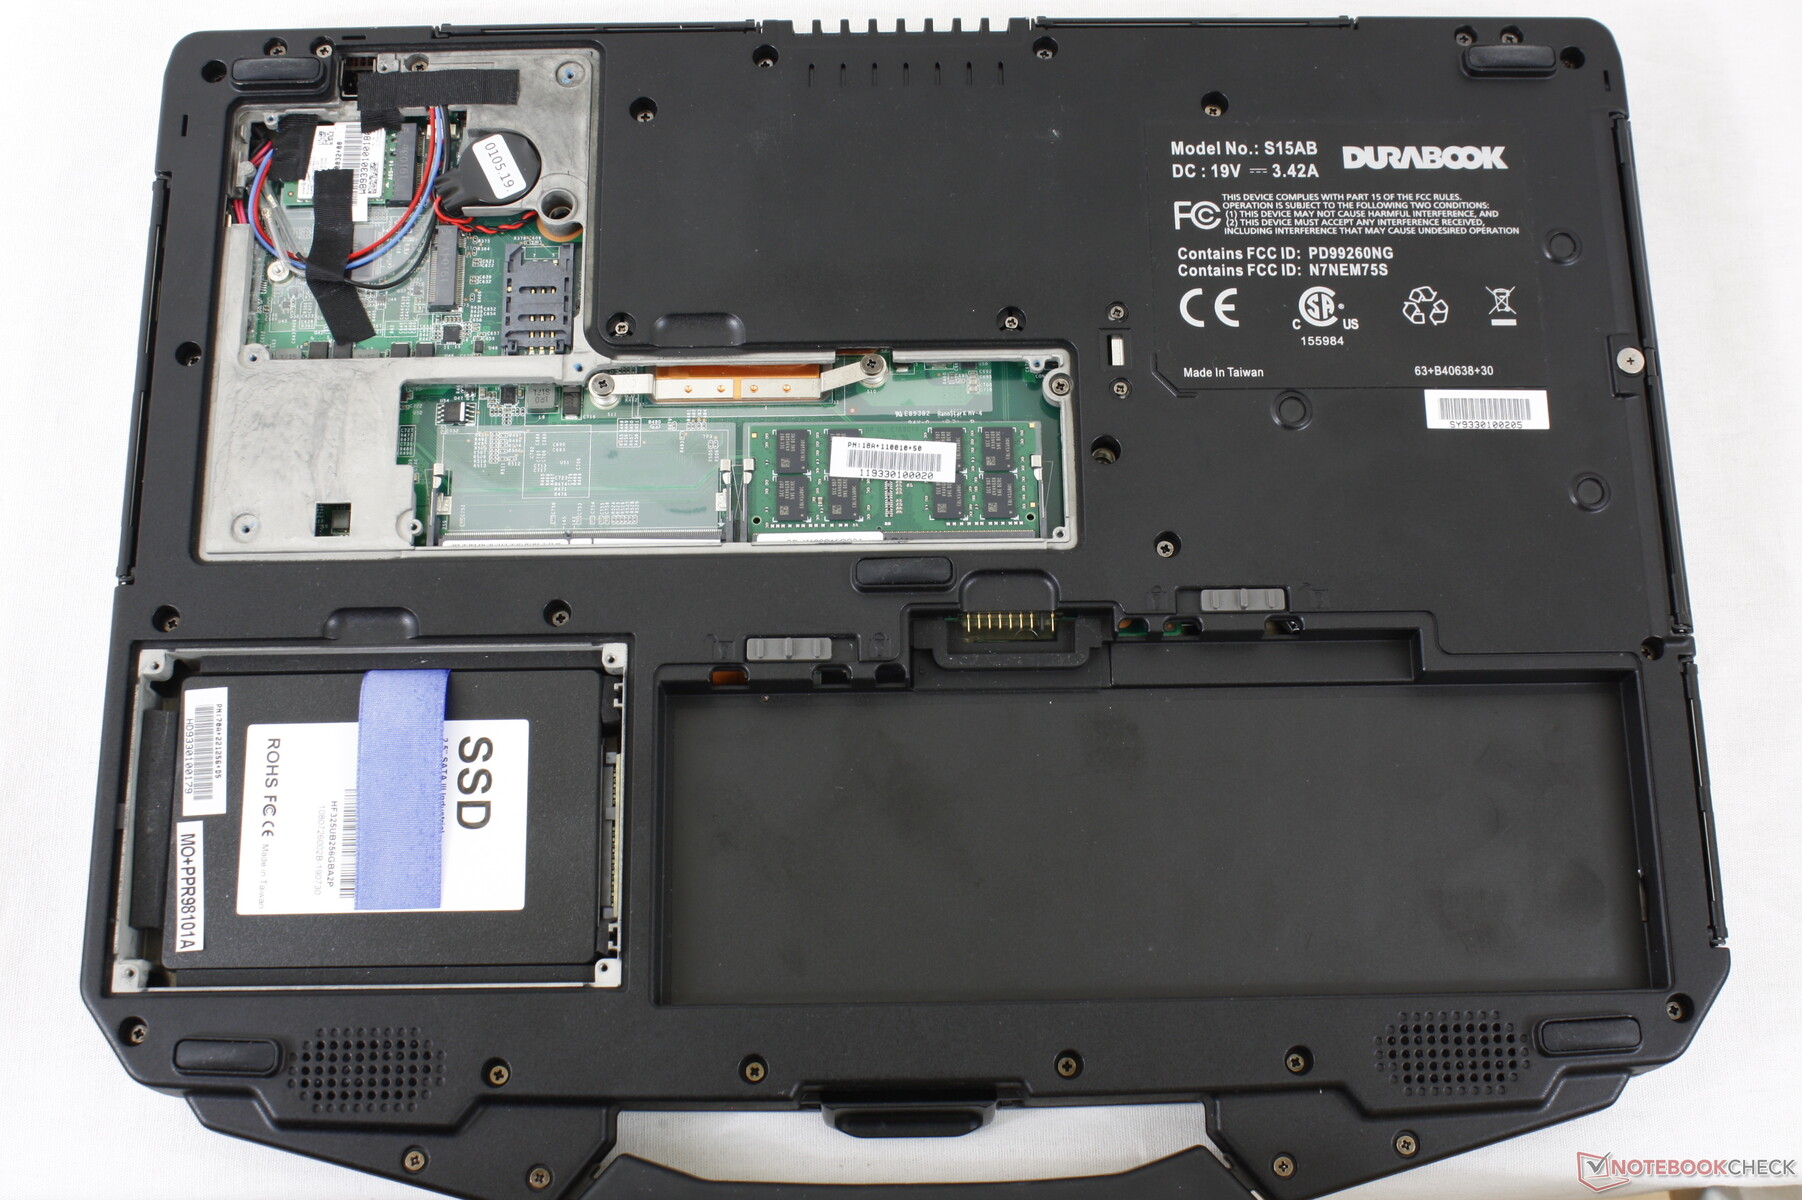
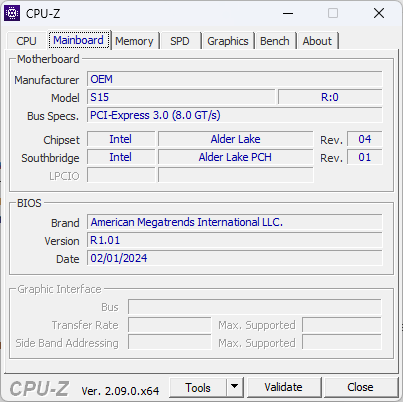
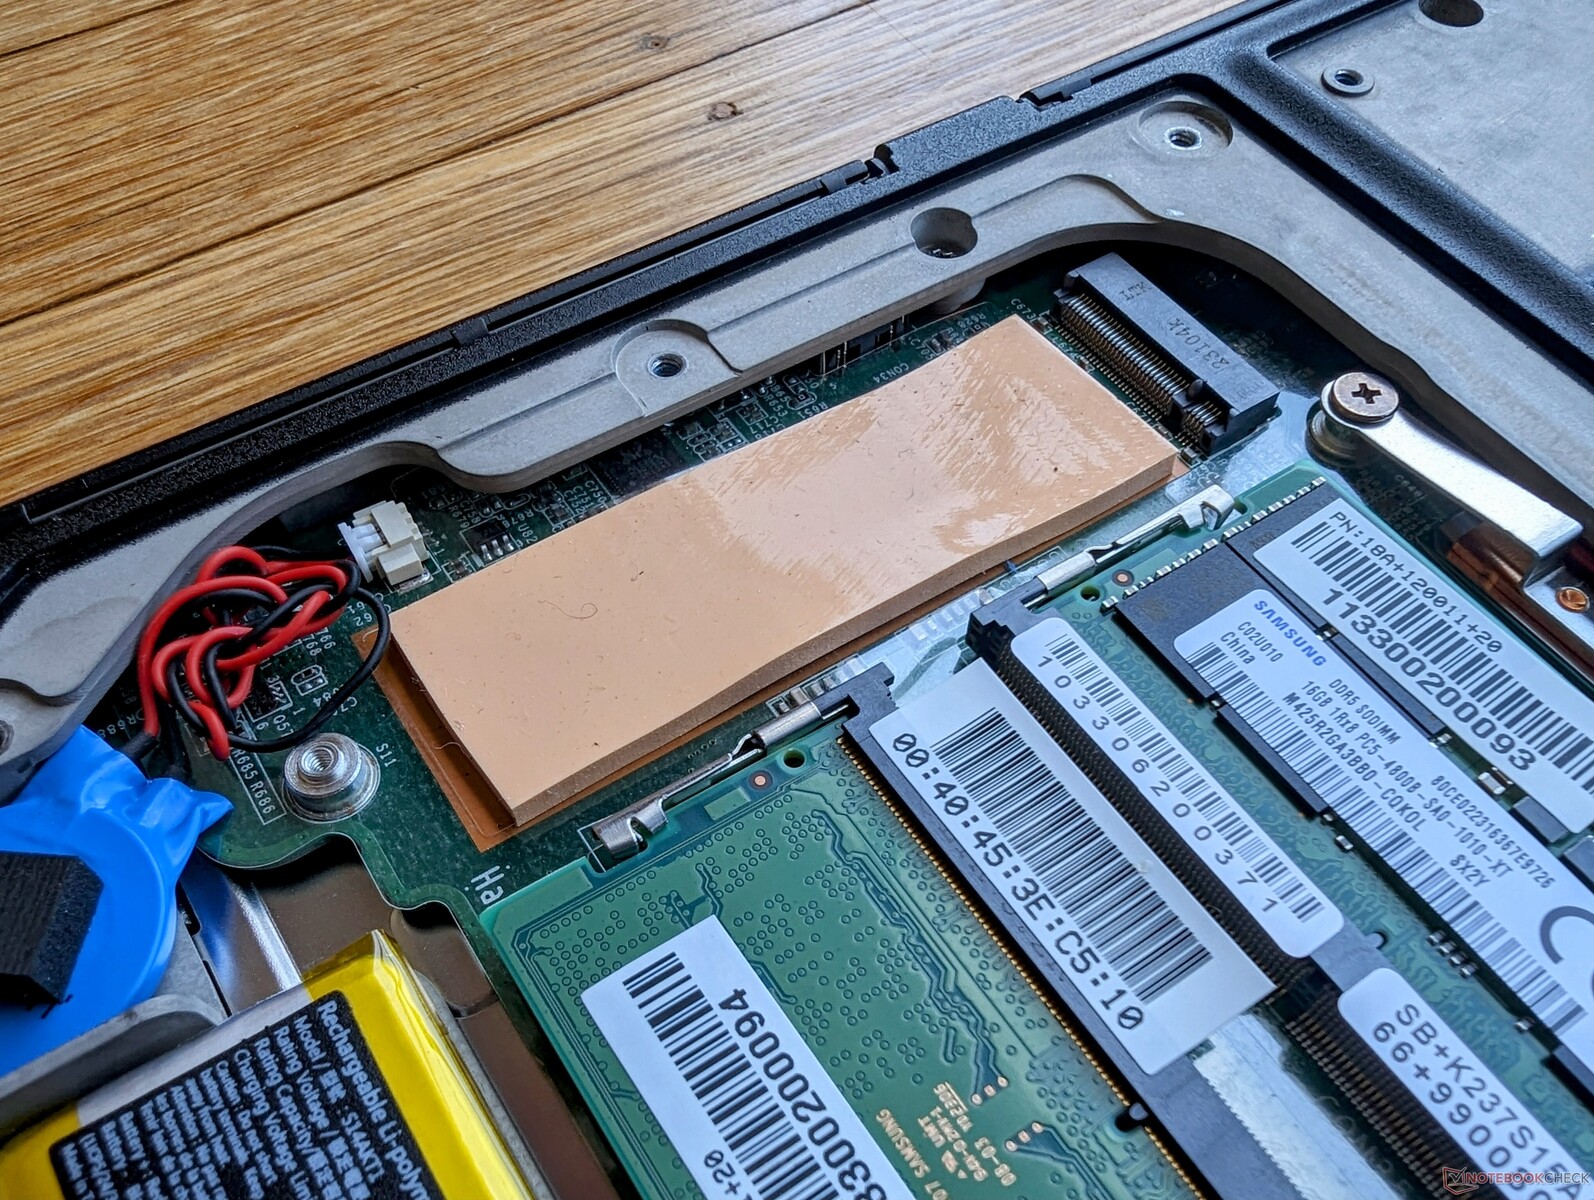
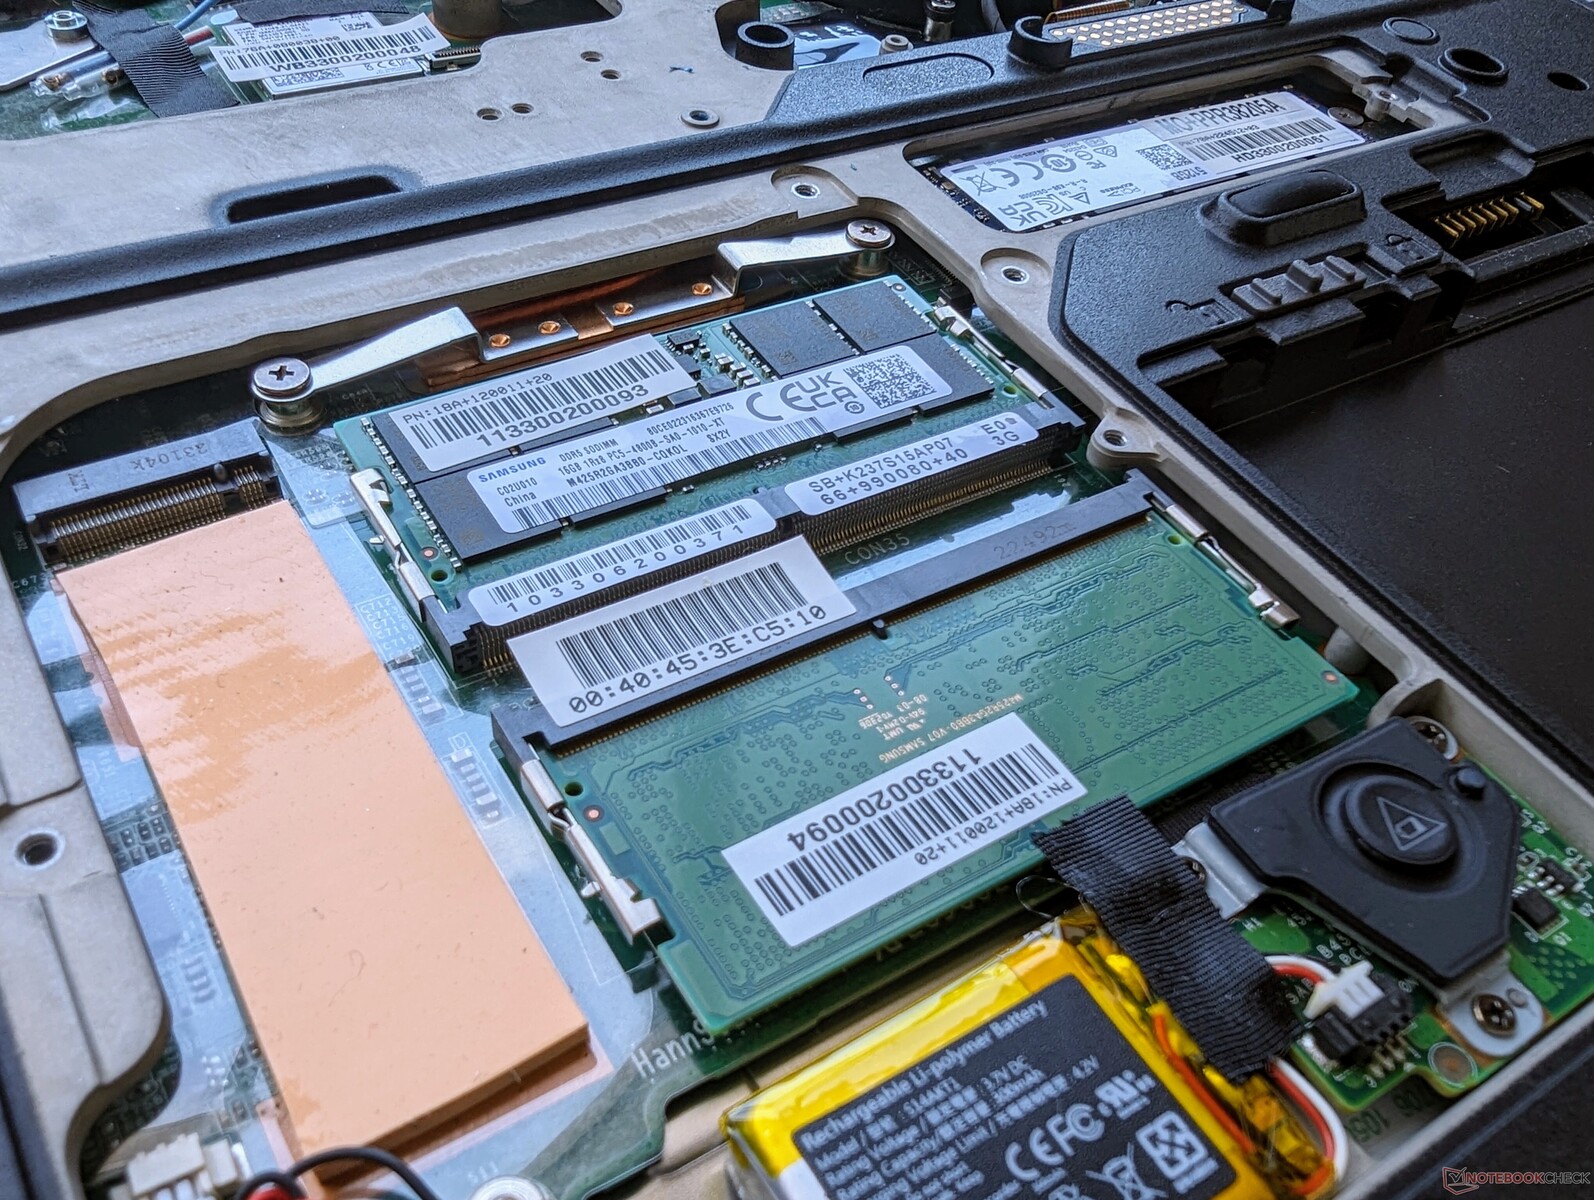
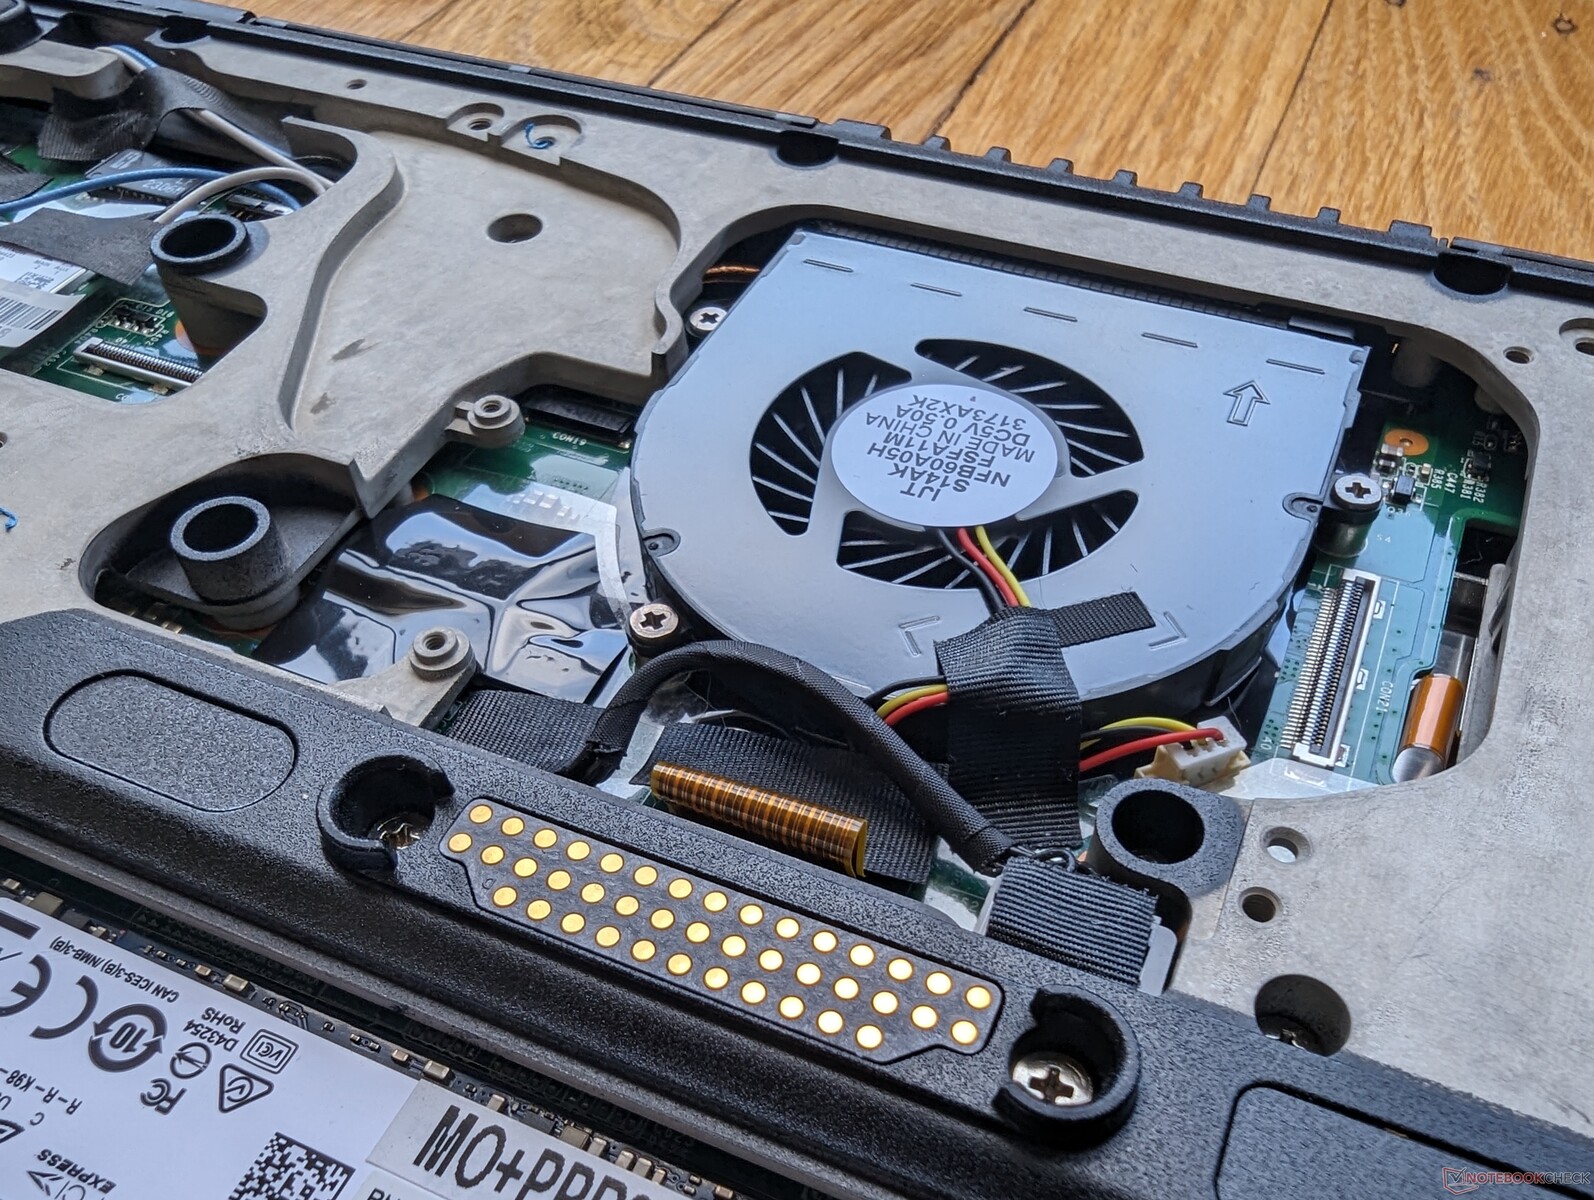
维护
底部(D 面板)几乎完全重新设计。旧的 2.5 英寸 SATA III 插槽不见了,取而代之的是一个辅助 M.2 2280 插槽,而内部风扇现在更便于清洁或维修。
配件和保修
Durabook 提供多种可选配件,包括扩展媒体托架、车载点烟适配器、扩展坞和备用电池。需要注意的是,由于不提供触摸屏,因此没有笔或触控笔。
制造商提供三年有限保修。
输入设备 - 差劲的键盘配上出色的触摸板
键盘
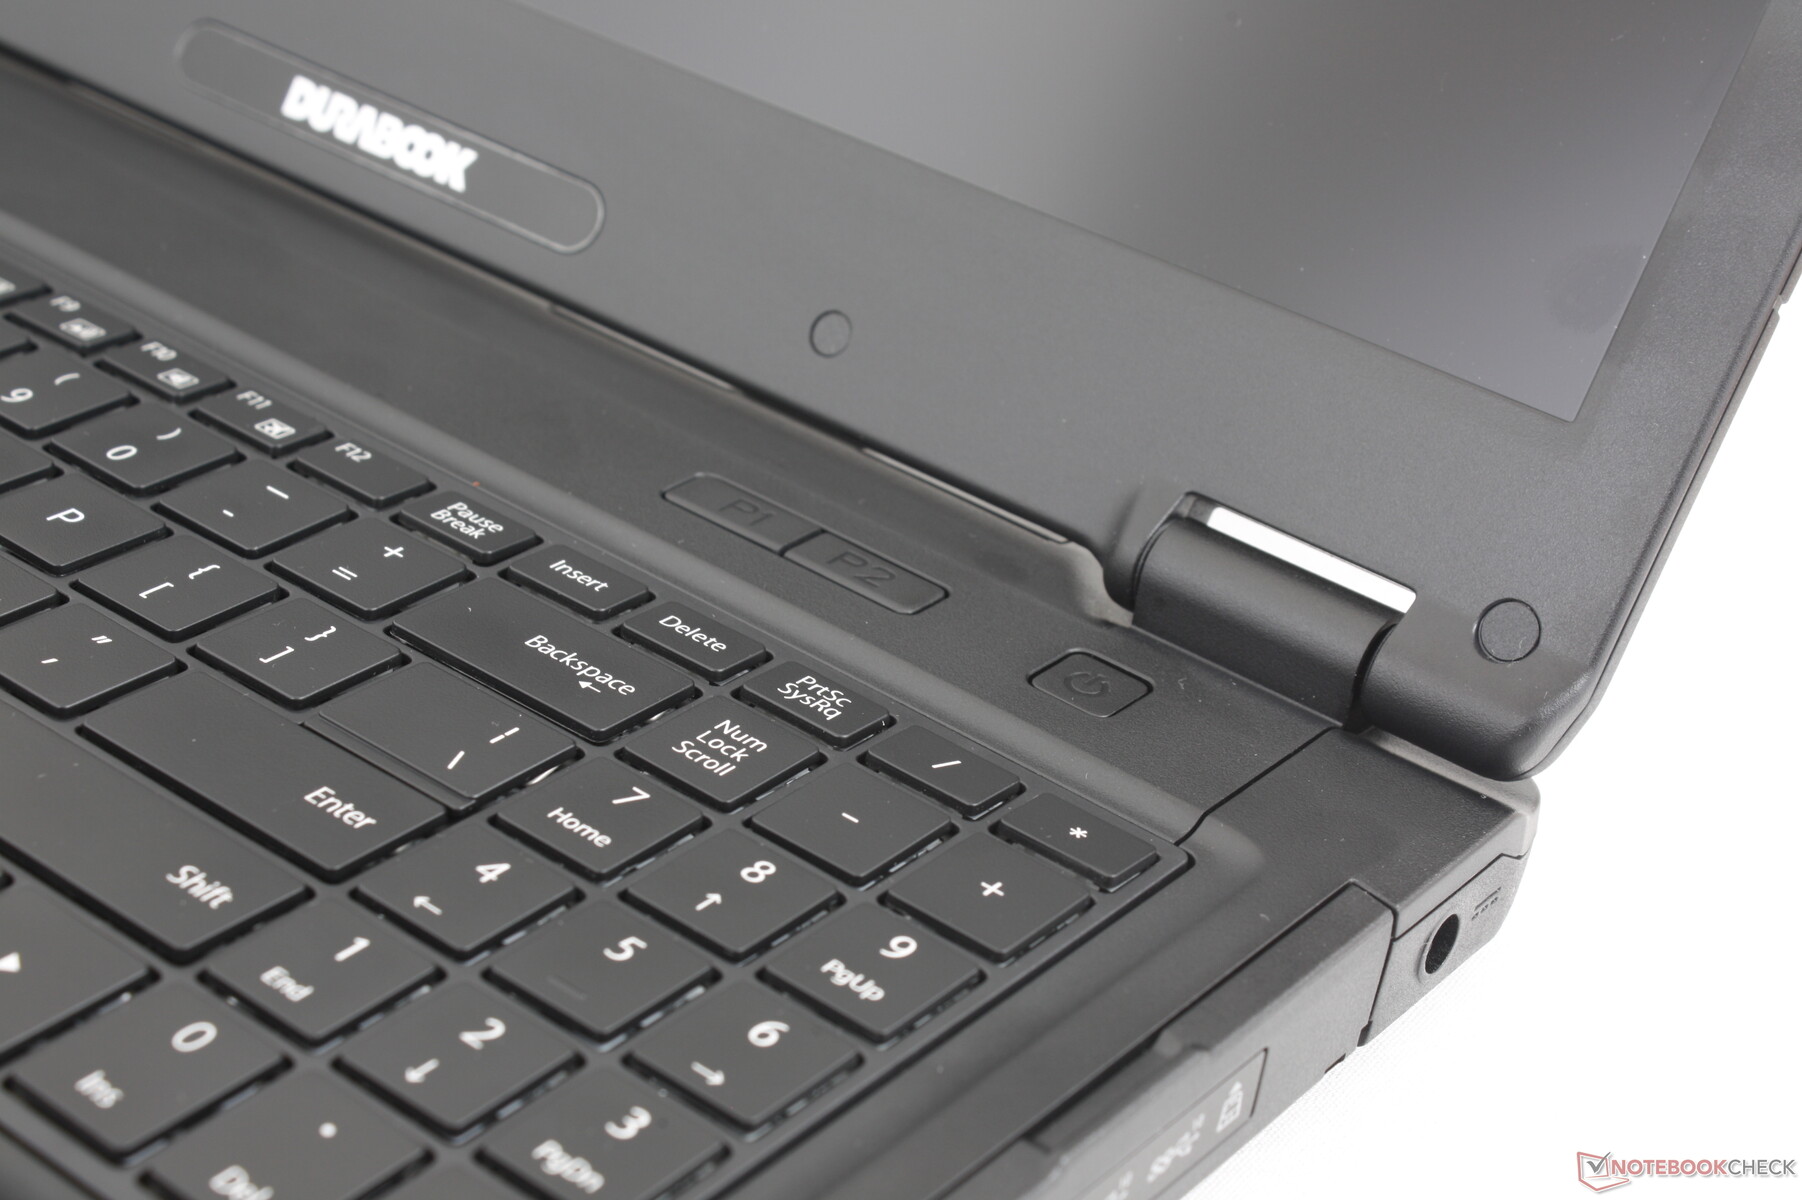
遗憾的是,键盘的性能参差不齐。虽然集成了数字键盘,但按键反馈较弱,键程太浅,即使与惠普Pavilion 或联想 IdeaPad 等较薄的消费级笔记本电脑相比也是如此。尤其是空格键,传统上它比 QWERTY 主键更坚硬,按下时感觉很松软。前面提到的按下数字键盘时的翘曲也不利于按键反馈。因此,在 S15 上打字会让人感觉不满意。
触摸板
触摸板的可用面积与 2020 S15AB 的触摸板相同,为 10 x 5 厘米。我们不得不说 "可用",因为触控板的实际表面积似乎略大,但凸起条和专用鼠标按钮之间的狭窄部分只是死角。触控板表面略有纹理,反应灵敏,而其他耐用型笔记本电脑(如 Getac S410 或 松下 Toughbook 40的触控板则经常会跳过或错误注册输入。这是我们所见过的同类产品中较好的触控板之一。
同时,专用鼠标按键坚固耐用,按下时声音响亮,手感令人满意。不过,移动距离还可以再深一些。


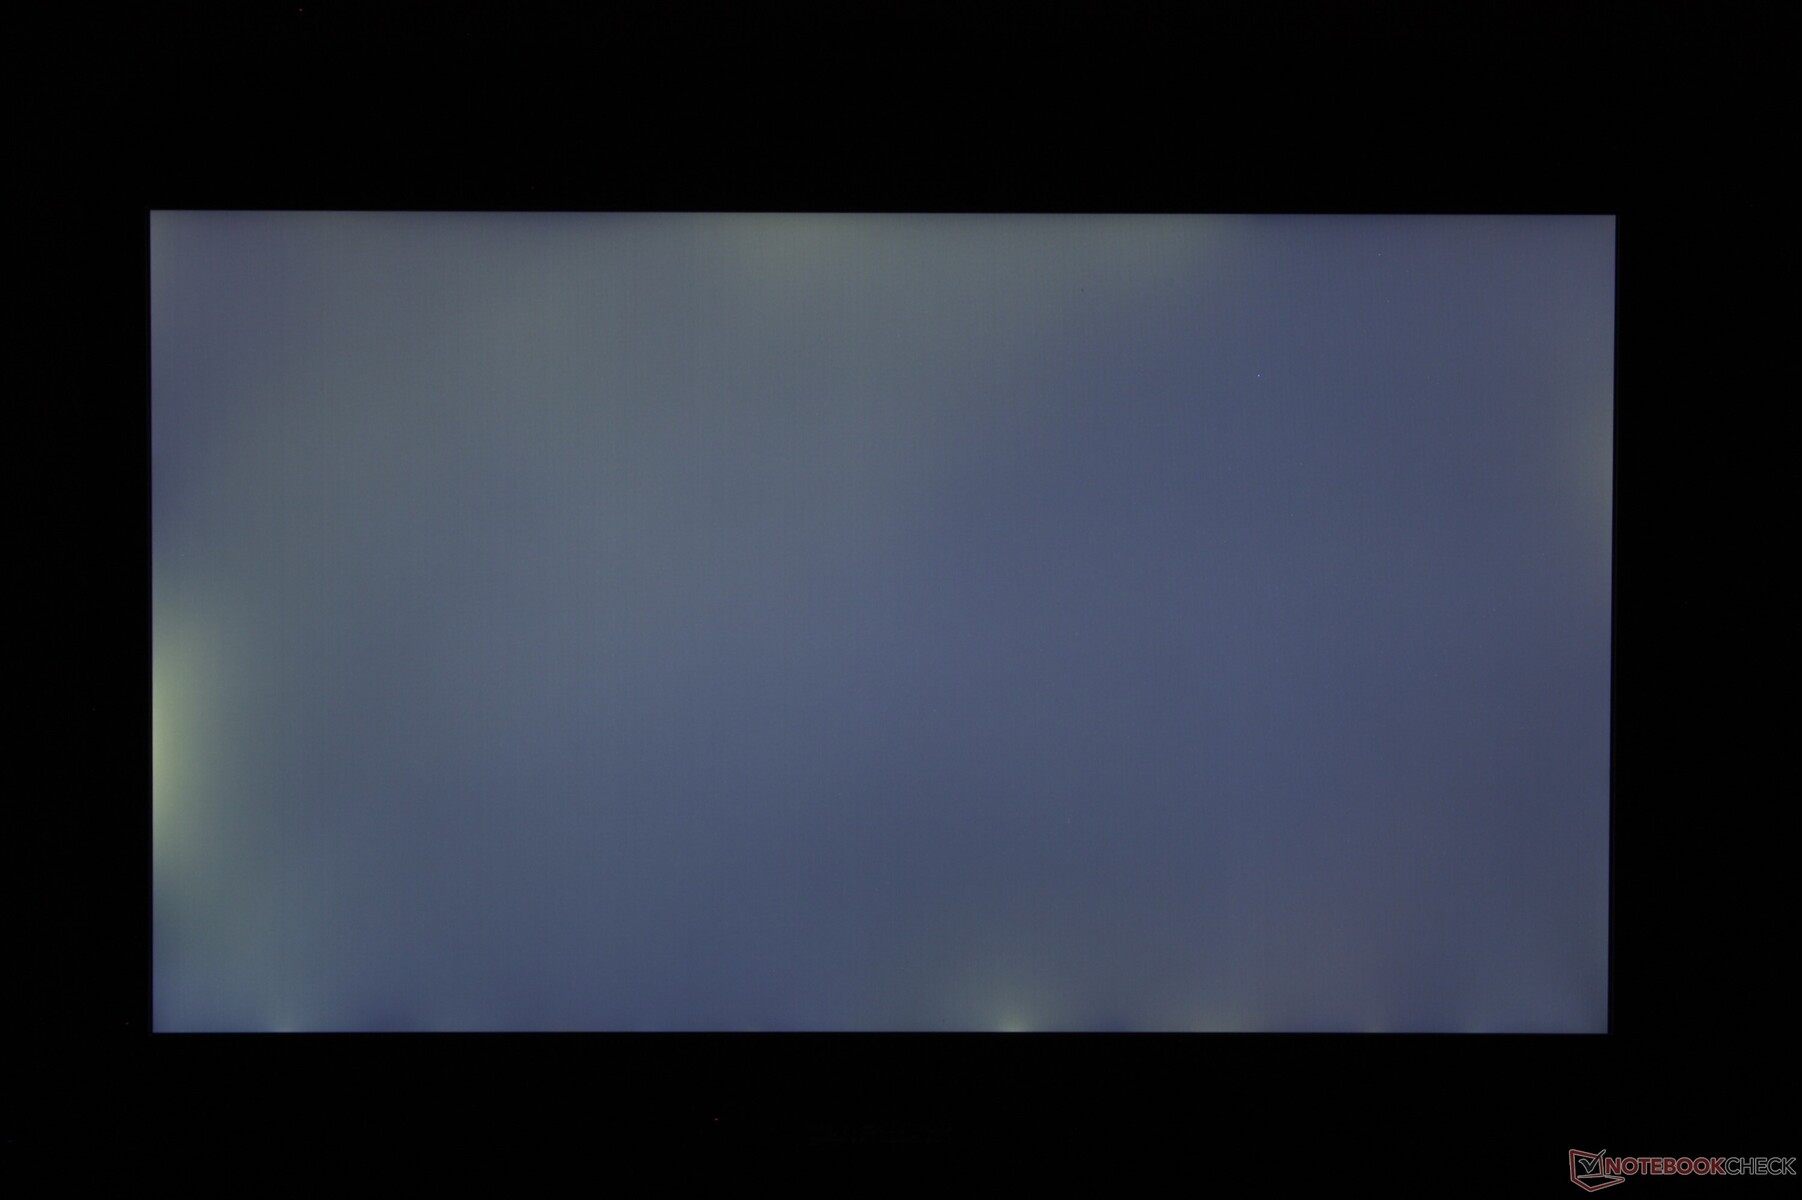
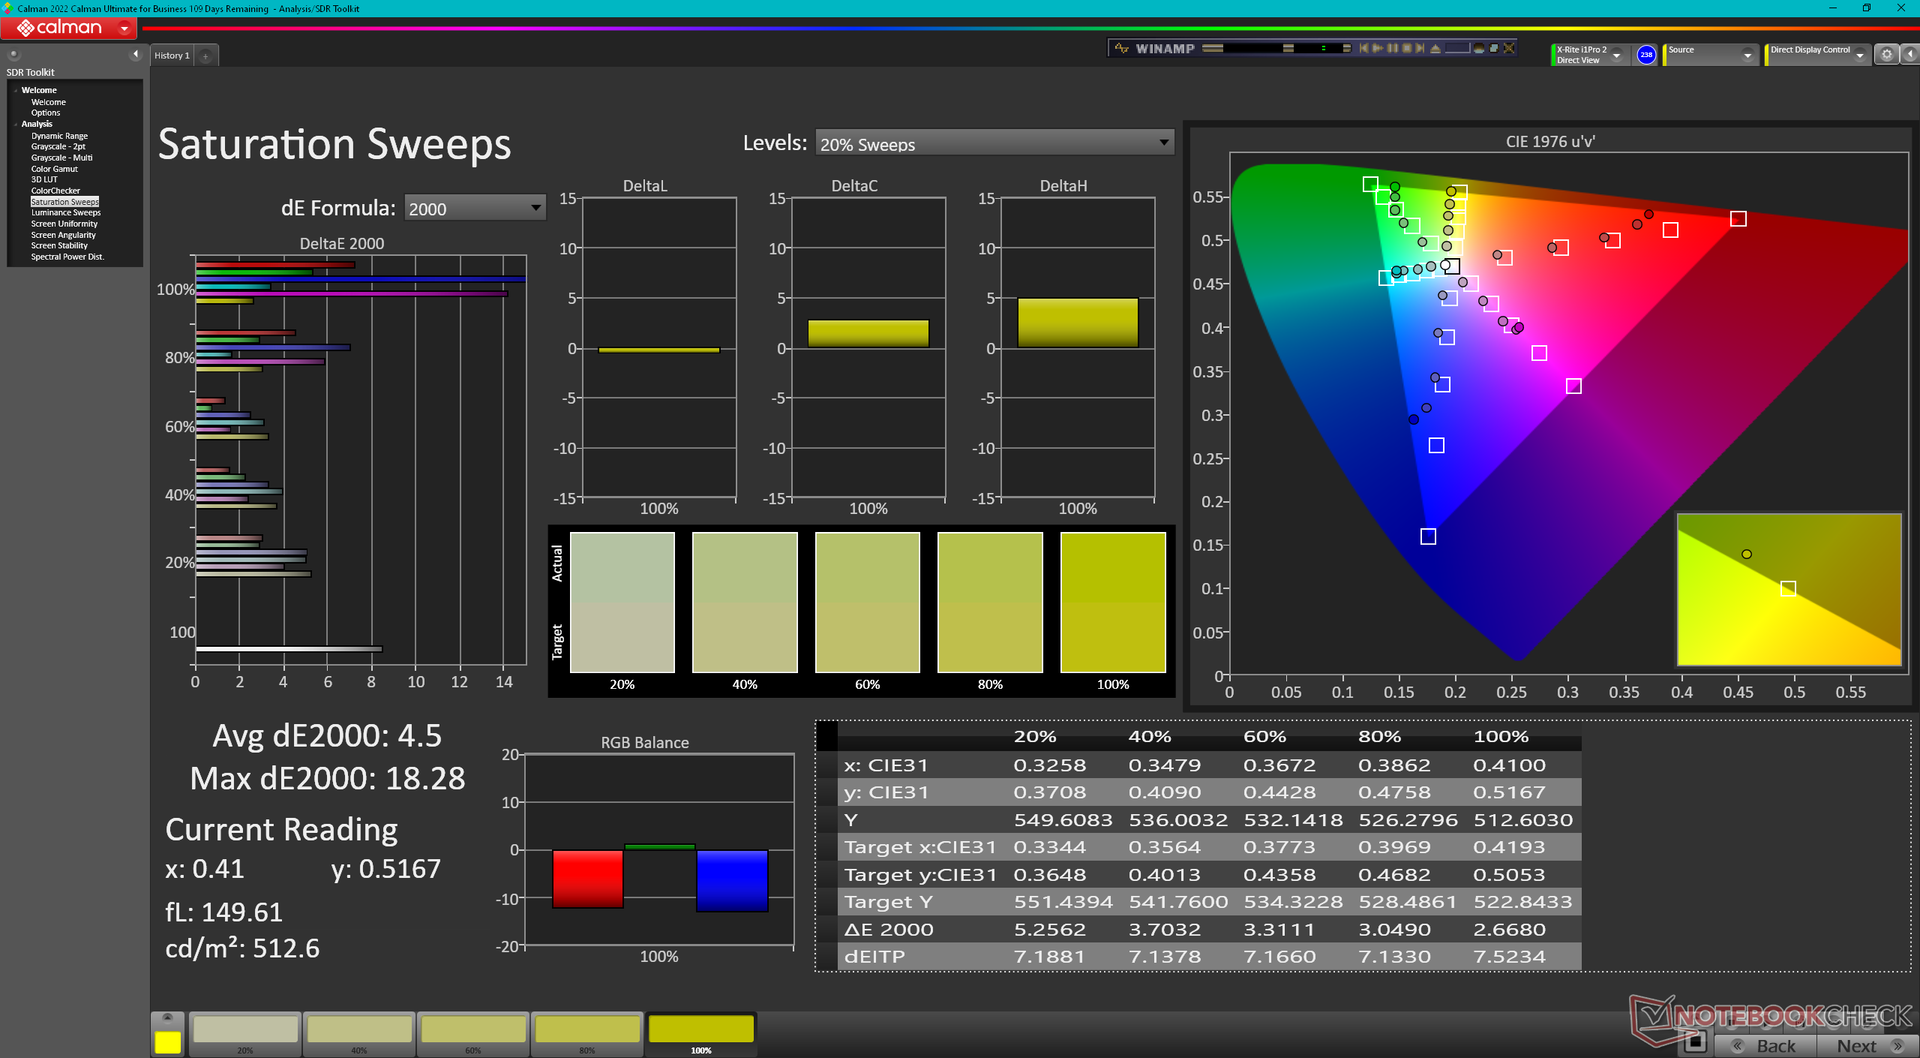
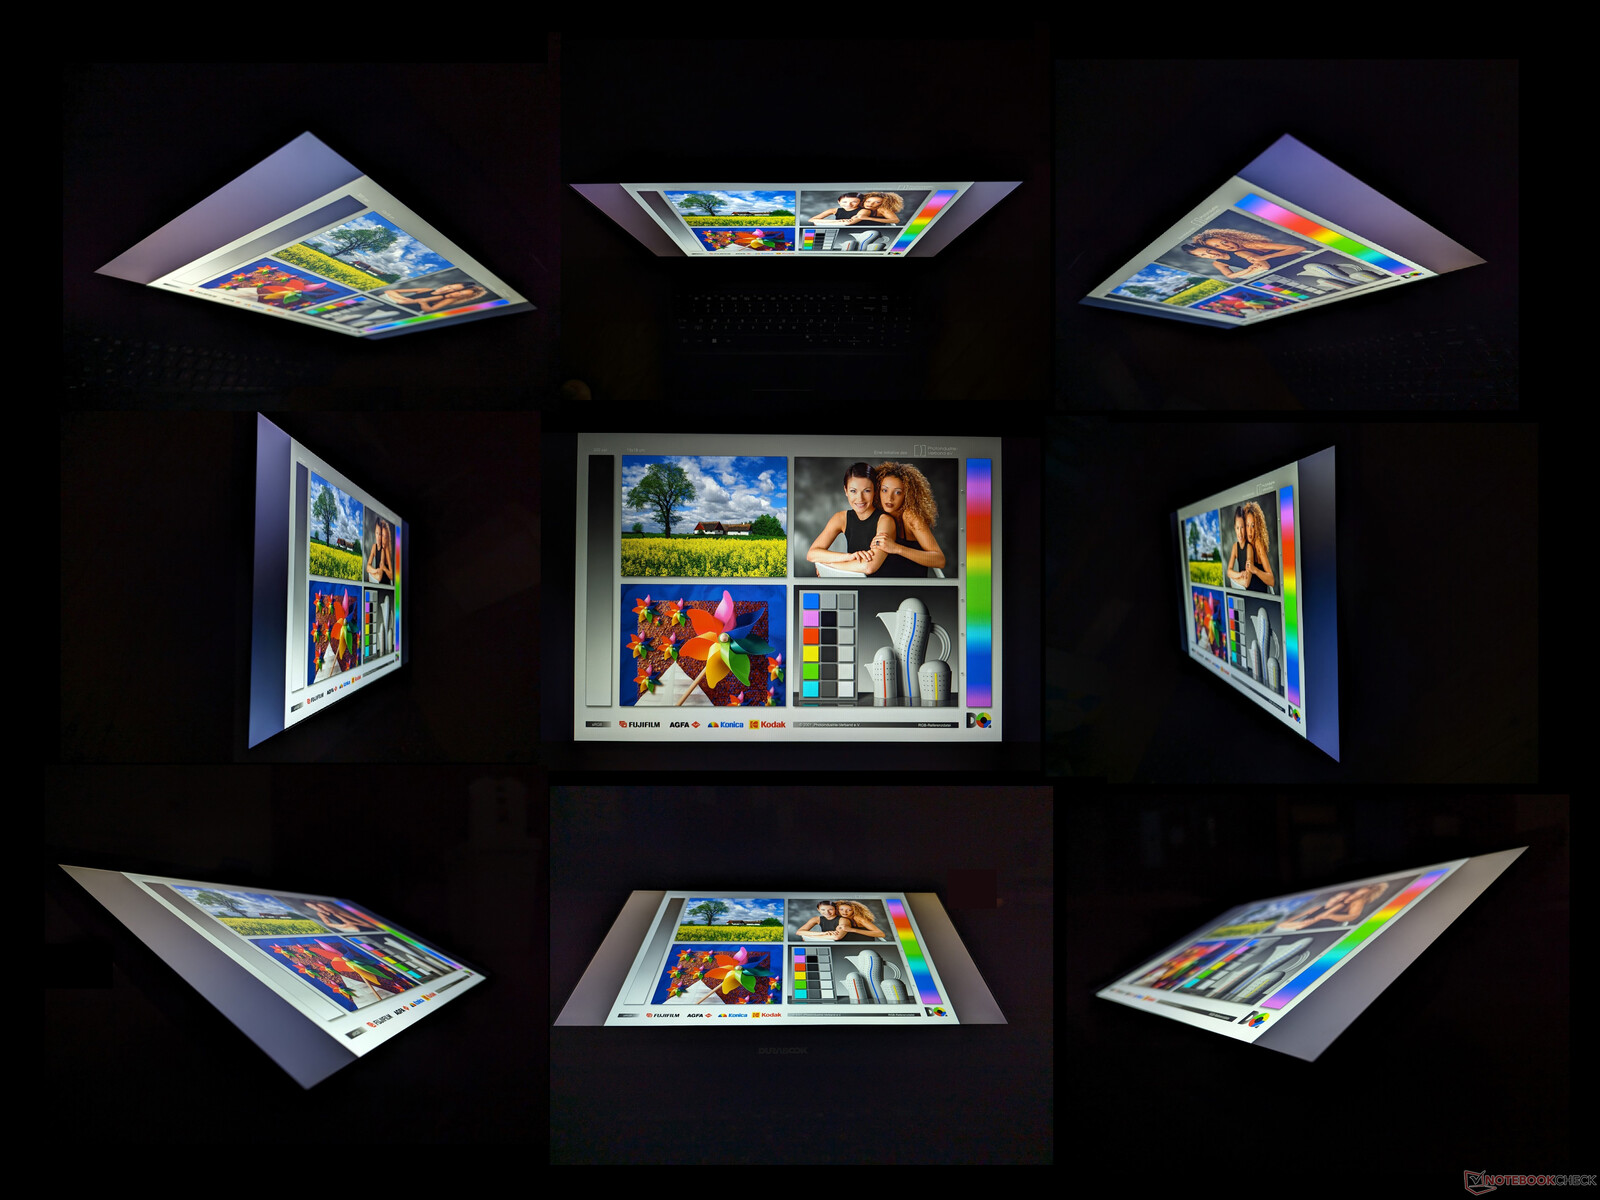
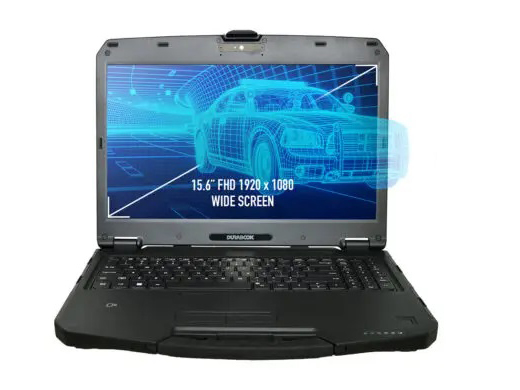
显示屏 - 明亮的 1000 尼特 IPS
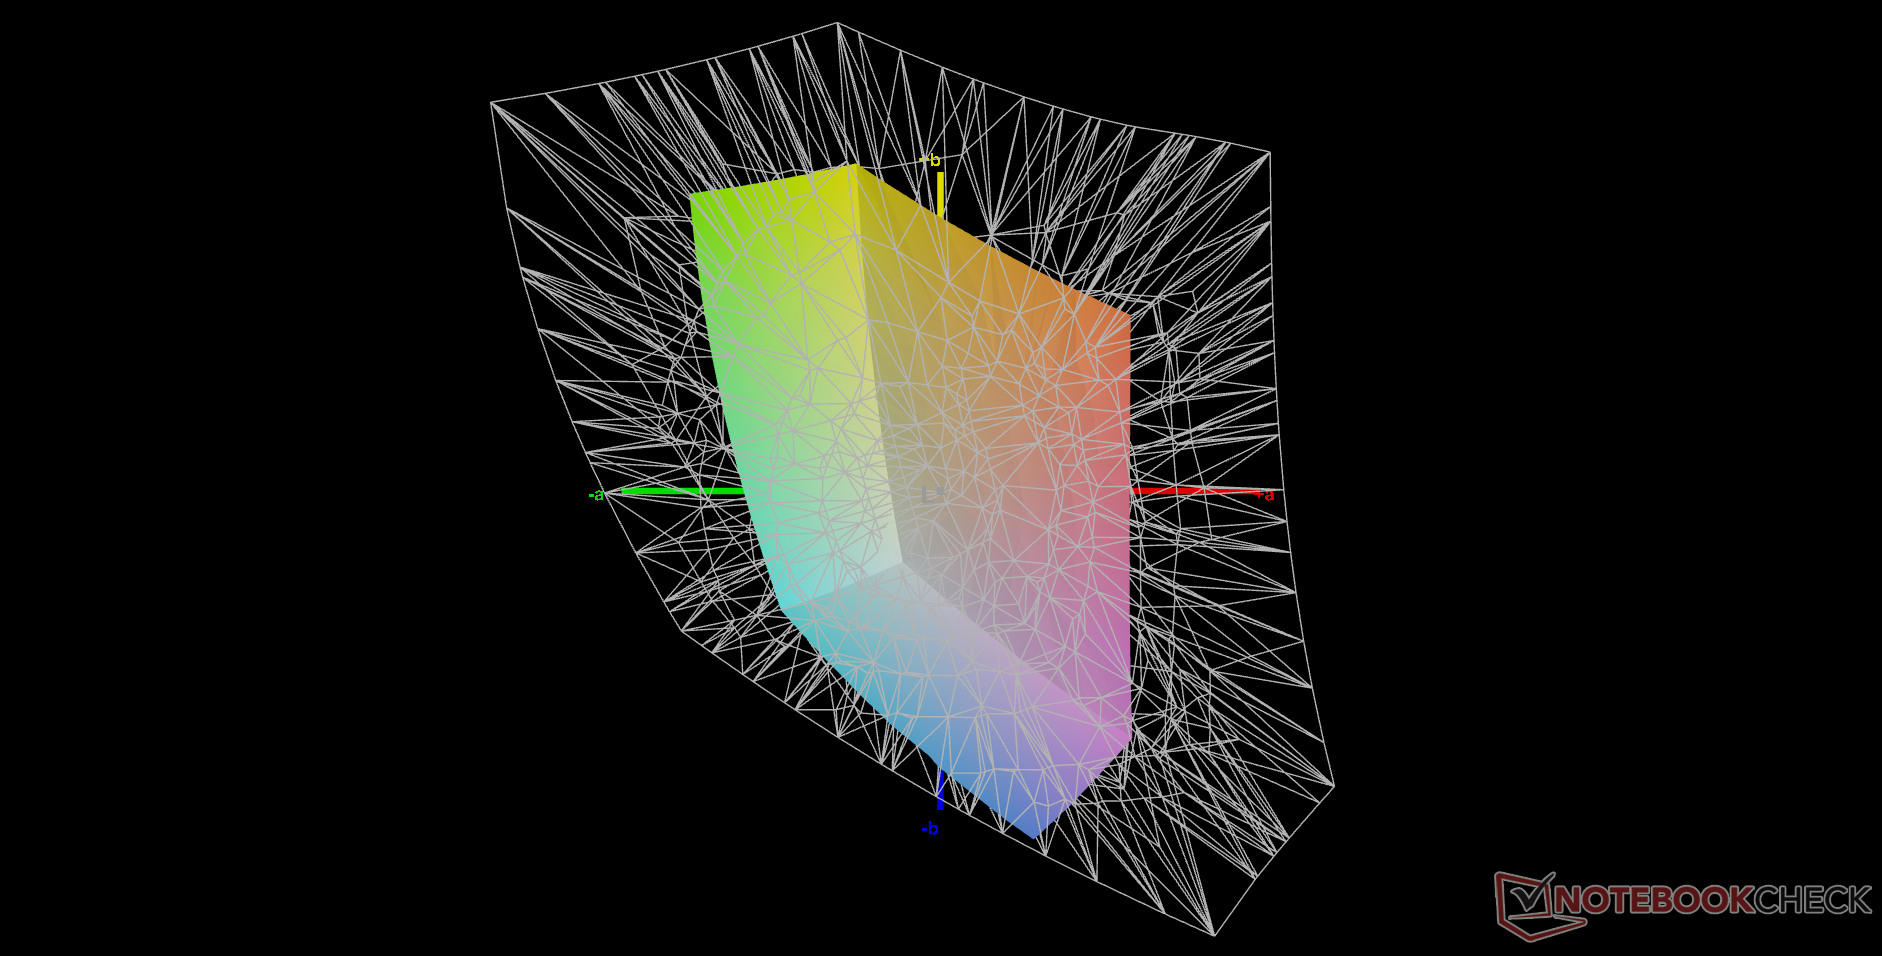
S15 是我们数据库中第一款采用 HKC MB156CS01'2 IPS 面板的机型。与老款 S15ABG2 上的奇美 TN 面板相比,它在可视角度、对比度和亮度方面有了明显改善,而响应时间和色彩等其他方面则基本相同。其他坚固耐用的机型,如戴尔Latitude 5420 Rugged 或宏碁 Enduro Urban提供的面板具有更大的 sRGB 覆盖范围,色彩更加鲜艳。


| |||||||||||||||||||||||||
Brightness Distribution: 84 %
Center on Battery: 1087.3 cd/m²
Contrast: 1066:1 (Black: 1.02 cd/m²)
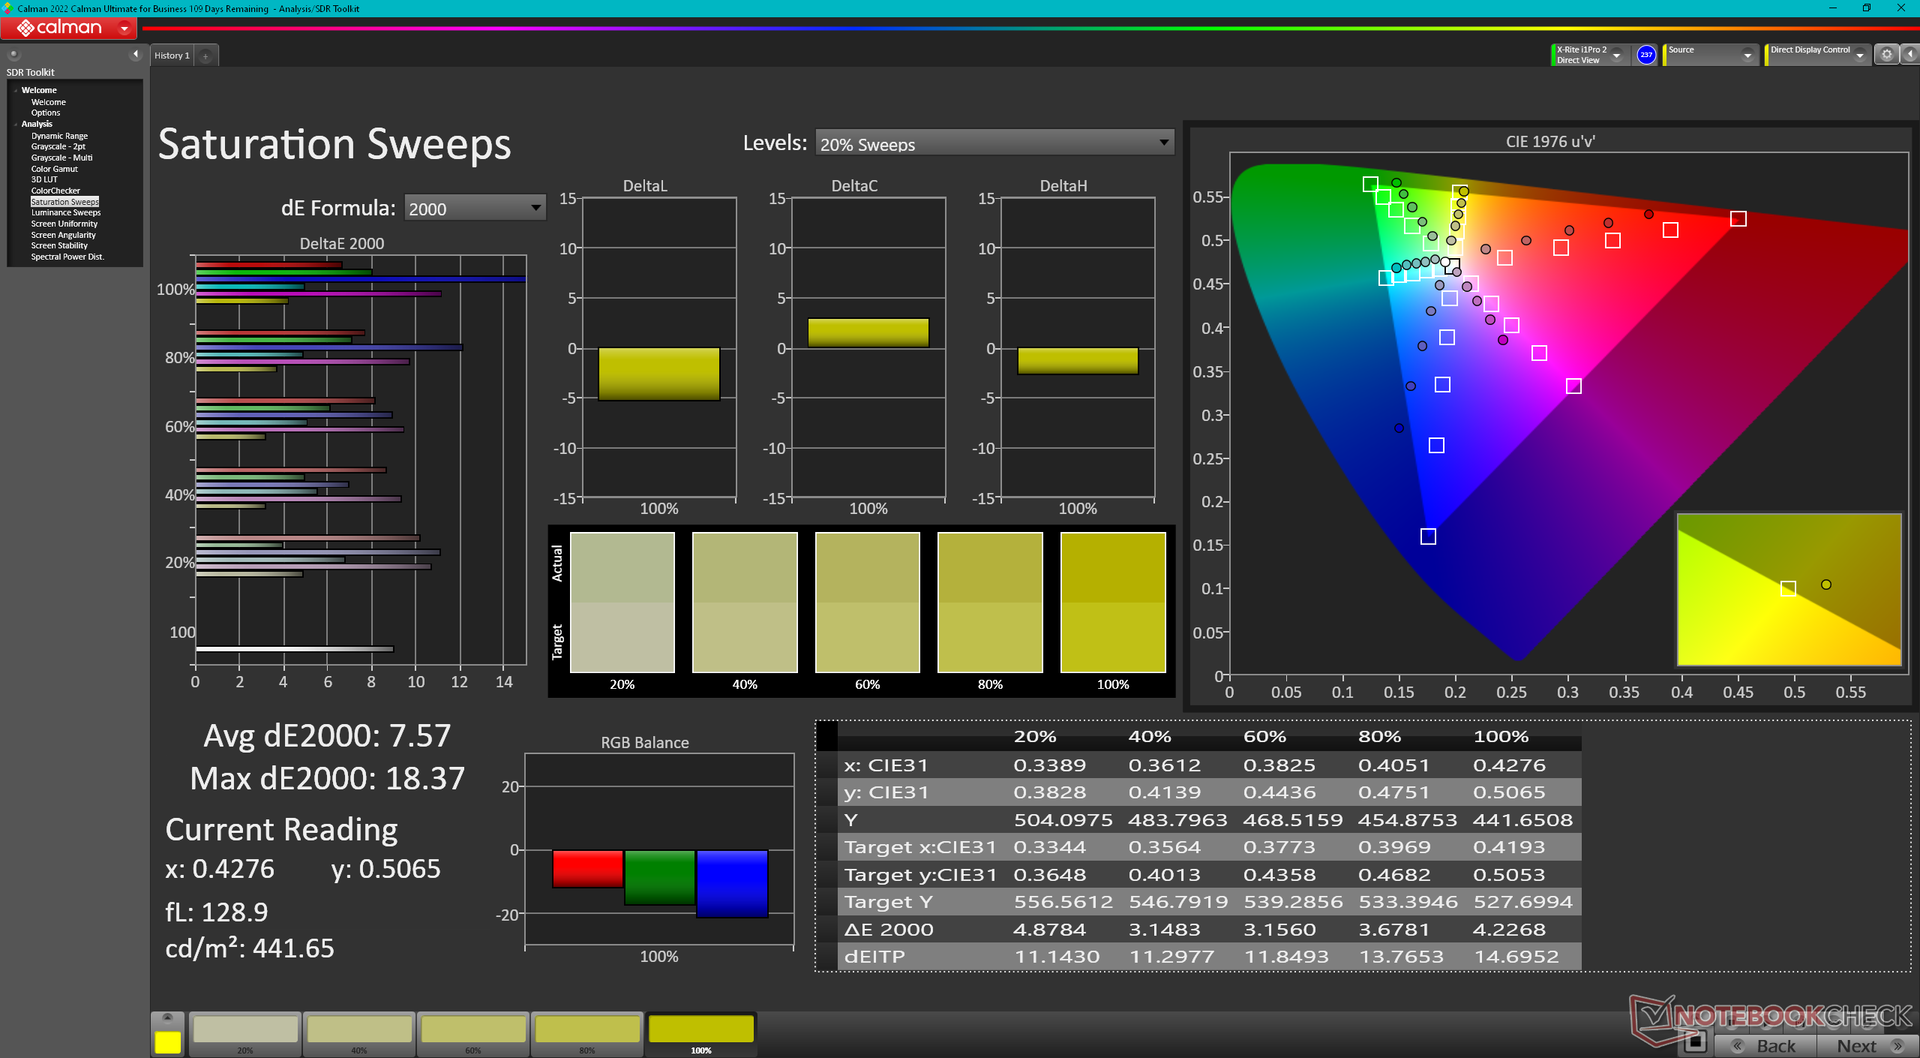
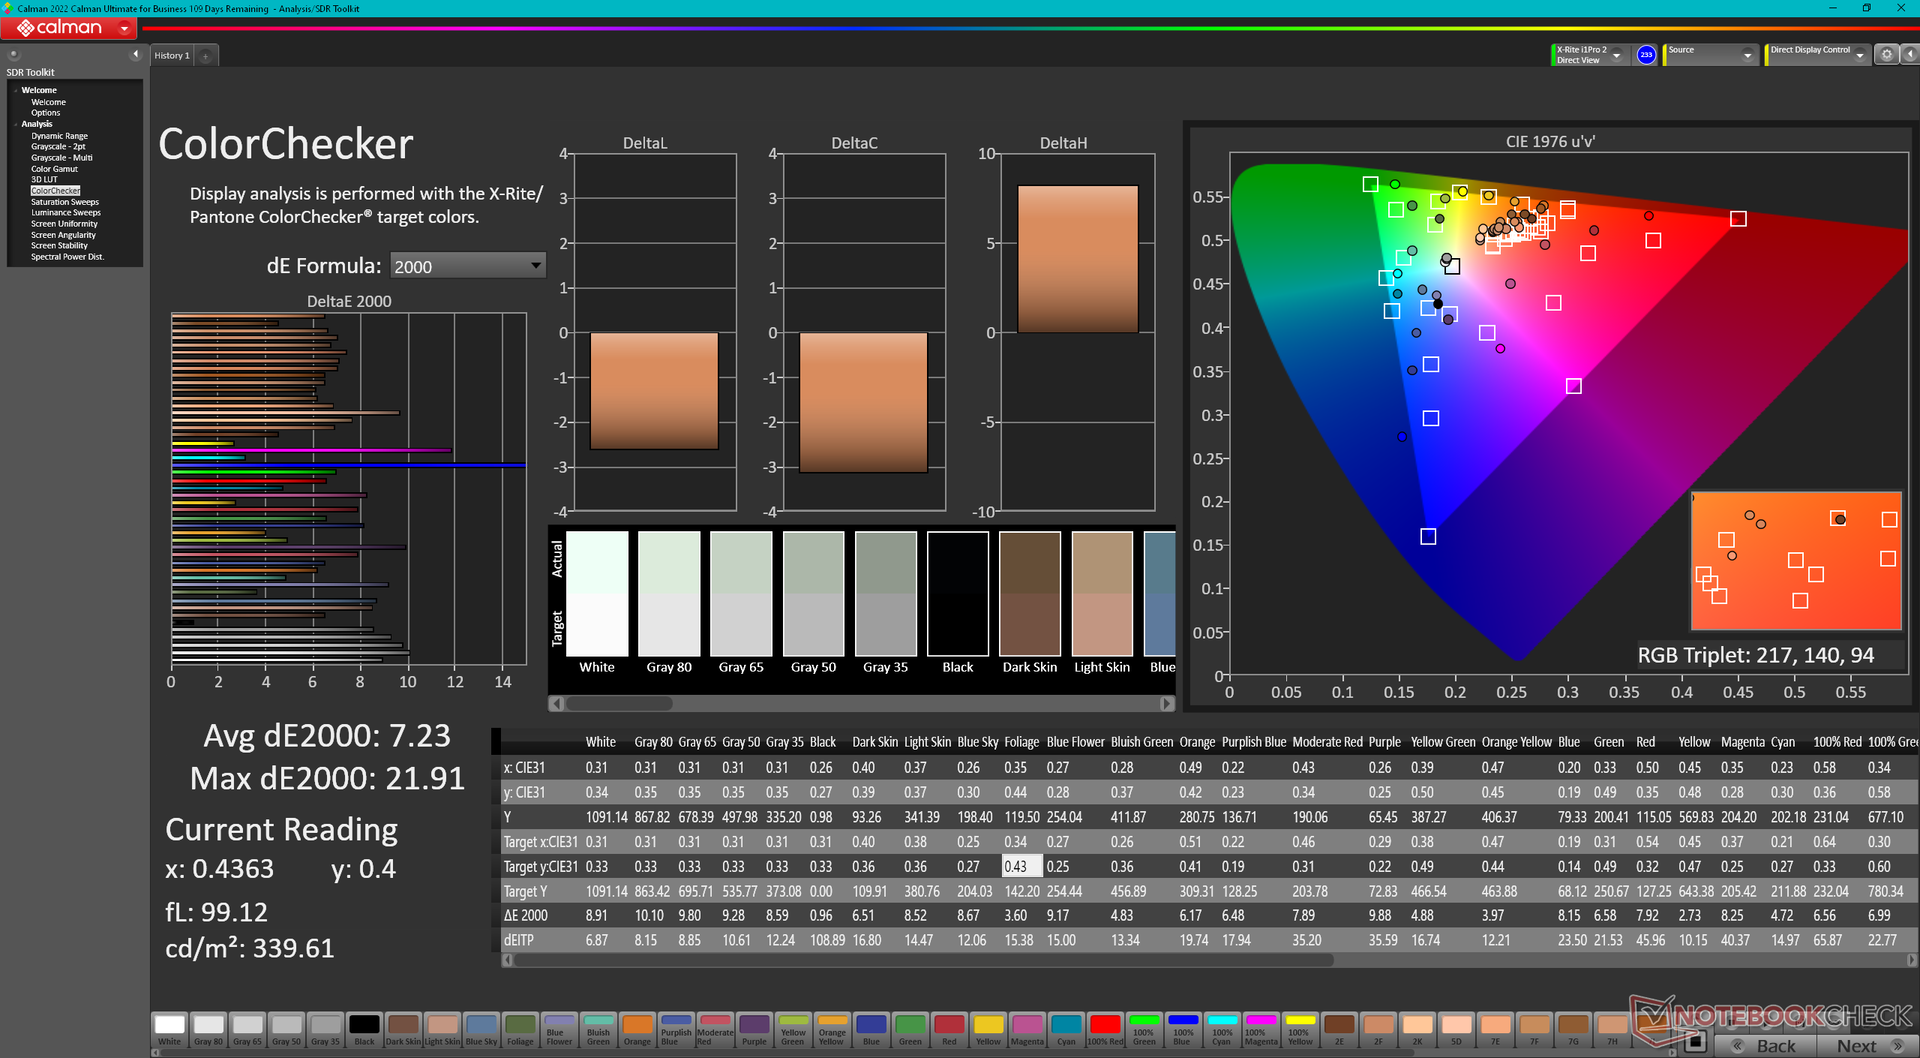
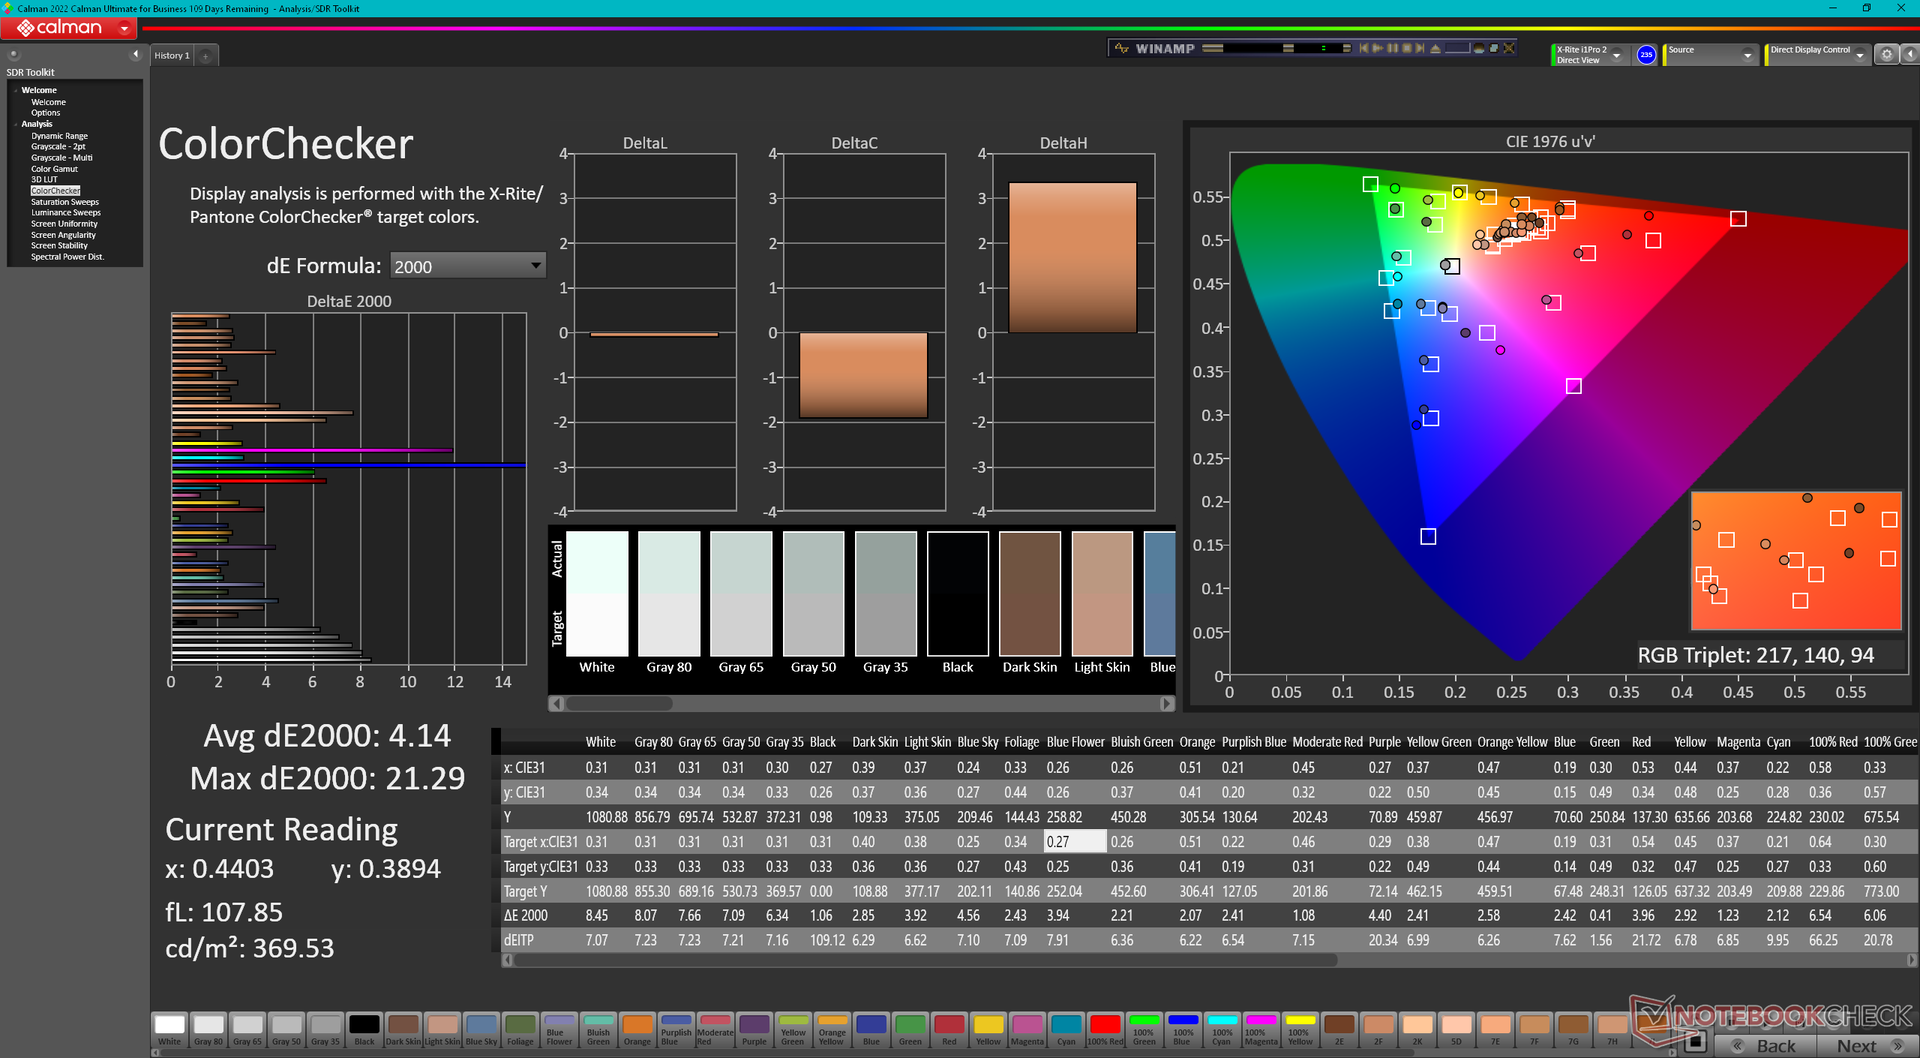
ΔE ColorChecker Calman: 7.23 | ∀{0.5-29.43 Ø4.75}
calibrated: 4.14
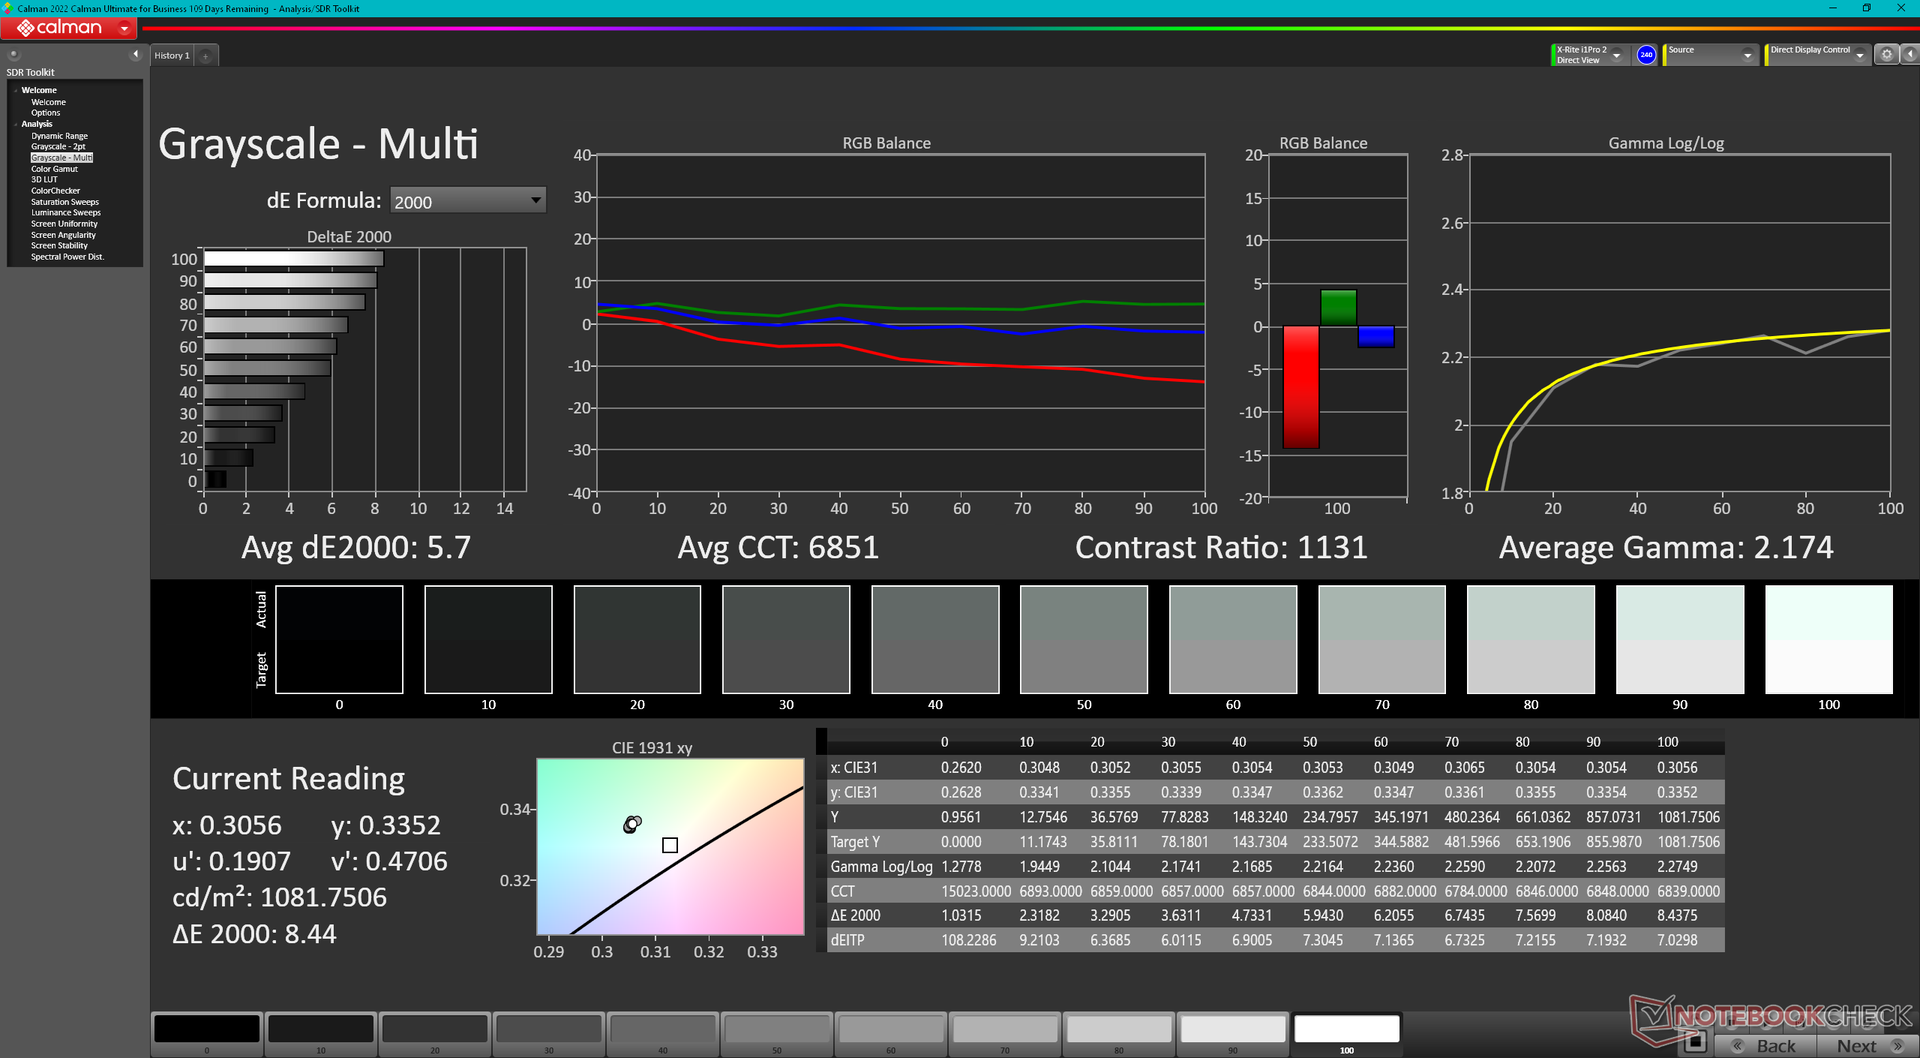
ΔE Greyscale Calman: 7.4 | ∀{0.09-98 Ø5}
41.2% AdobeRGB 1998 (Argyll 3D)
59% sRGB (Argyll 3D)
39.9% Display P3 (Argyll 3D)
Gamma: 2.34
CCT: 6327 K
| Durabook S15 HKC MY MB156CS01'2, IPS, 1920x1080, 15.6" | Durabook S15ABG2 Chi Mei N156HGE-EA2, TN LED, 1920x1080, 15.6" | Panasonic Toughbook 40 InfoVision M140NWF5 R3, IPS, 1920x1080, 14" | Getac S410 G5 CSOT T9 SNE001BS1-1, IPS, 1920x1080, 14" | Dell Latitude 5420 Rugged-P85G AU Optronics AUO523D, IPS, 1920x1080, 14" | Acer Enduro Urban N3 EUN314 XR140EA6T, IPS, 1920x1080, 14" | |
|---|---|---|---|---|---|---|
| Display | 29% | -10% | -3% | 57% | 58% | |
| Display P3 Coverage (%) | 39.9 | 51.4 29% | 35.8 -10% | 38.5 -4% | 62.5 57% | 63.5 59% |
| sRGB Coverage (%) | 59 | 77.1 31% | 53.8 -9% | 57.9 -2% | 92.4 57% | 91.9 56% |
| AdobeRGB 1998 Coverage (%) | 41.2 | 52.9 28% | 37 -10% | 39.8 -3% | 64.2 56% | 65.5 59% |
| Response Times | -22% | -108% | -29% | -168% | -147% | |
| Response Time Grey 50% / Grey 80% * (ms) | 22.4 ? | 24.4 ? -9% | 50.4 ? -125% | 29 ? -29% | 68 ? -204% | 56 ? -150% |
| Response Time Black / White * (ms) | 14.5 ? | 19.6 ? -35% | 27.6 ? -90% | 18.6 ? -28% | 33.6 ? -132% | 35.2 ? -143% |
| PWM Frequency (Hz) | 300 ? | 301.2 ? | 694.4 ? | 876 ? | 735 ? | 1000 ? |
| Screen | -31% | 28% | 16% | 24% | 6% | |
| Brightness middle (cd/m²) | 1087.3 | 284.8 -74% | 1284.3 18% | 958.4 -12% | 1111.7 2% | 487.8 -55% |
| Brightness (cd/m²) | 997 | 267 -73% | 1289 29% | 978 -2% | 1026 3% | 464 -53% |
| Brightness Distribution (%) | 84 | 86 2% | 82 -2% | 86 2% | 80 -5% | 89 6% |
| Black Level * (cd/m²) | 1.02 | 0.7 31% | 0.89 13% | 0.96 6% | 0.81 21% | 0.48 53% |
| Contrast (:1) | 1066 | 407 -62% | 1443 35% | 998 -6% | 1372 29% | 1016 -5% |
| Colorchecker dE 2000 * | 7.23 | 11.48 -59% | 4.67 35% | 4.95 32% | 3.83 47% | 6.51 10% |
| Colorchecker dE 2000 max. * | 21.91 | 19.71 10% | 19.85 9% | 16.88 23% | 7.85 64% | 11.36 48% |
| Colorchecker dE 2000 calibrated * | 4.14 | 3.06 26% | 2.21 47% | 1.96 53% | 2.98 28% | 1.77 57% |
| Greyscale dE 2000 * | 7.4 | 13.2 -78% | 2.7 64% | 3.9 47% | 5.6 24% | 7.8 -5% |
| Gamma | 2.34 94% | 2.09 105% | 1.97 112% | 2.14 103% | 2.306 95% | 2.28 96% |
| CCT | 6327 103% | 14566 45% | 6222 104% | 7174 91% | 7676 85% | 8102 80% |
| Color Space (Percent of AdobeRGB 1998) (%) | 48.8 | 59 | ||||
| Color Space (Percent of sRGB) (%) | 76.8 | 93 | ||||
| Total Average (Program / Settings) | -8% /
-17% | -30% /
0% | -5% /
6% | -29% /
3% | -28% /
-5% |
* ... smaller is better
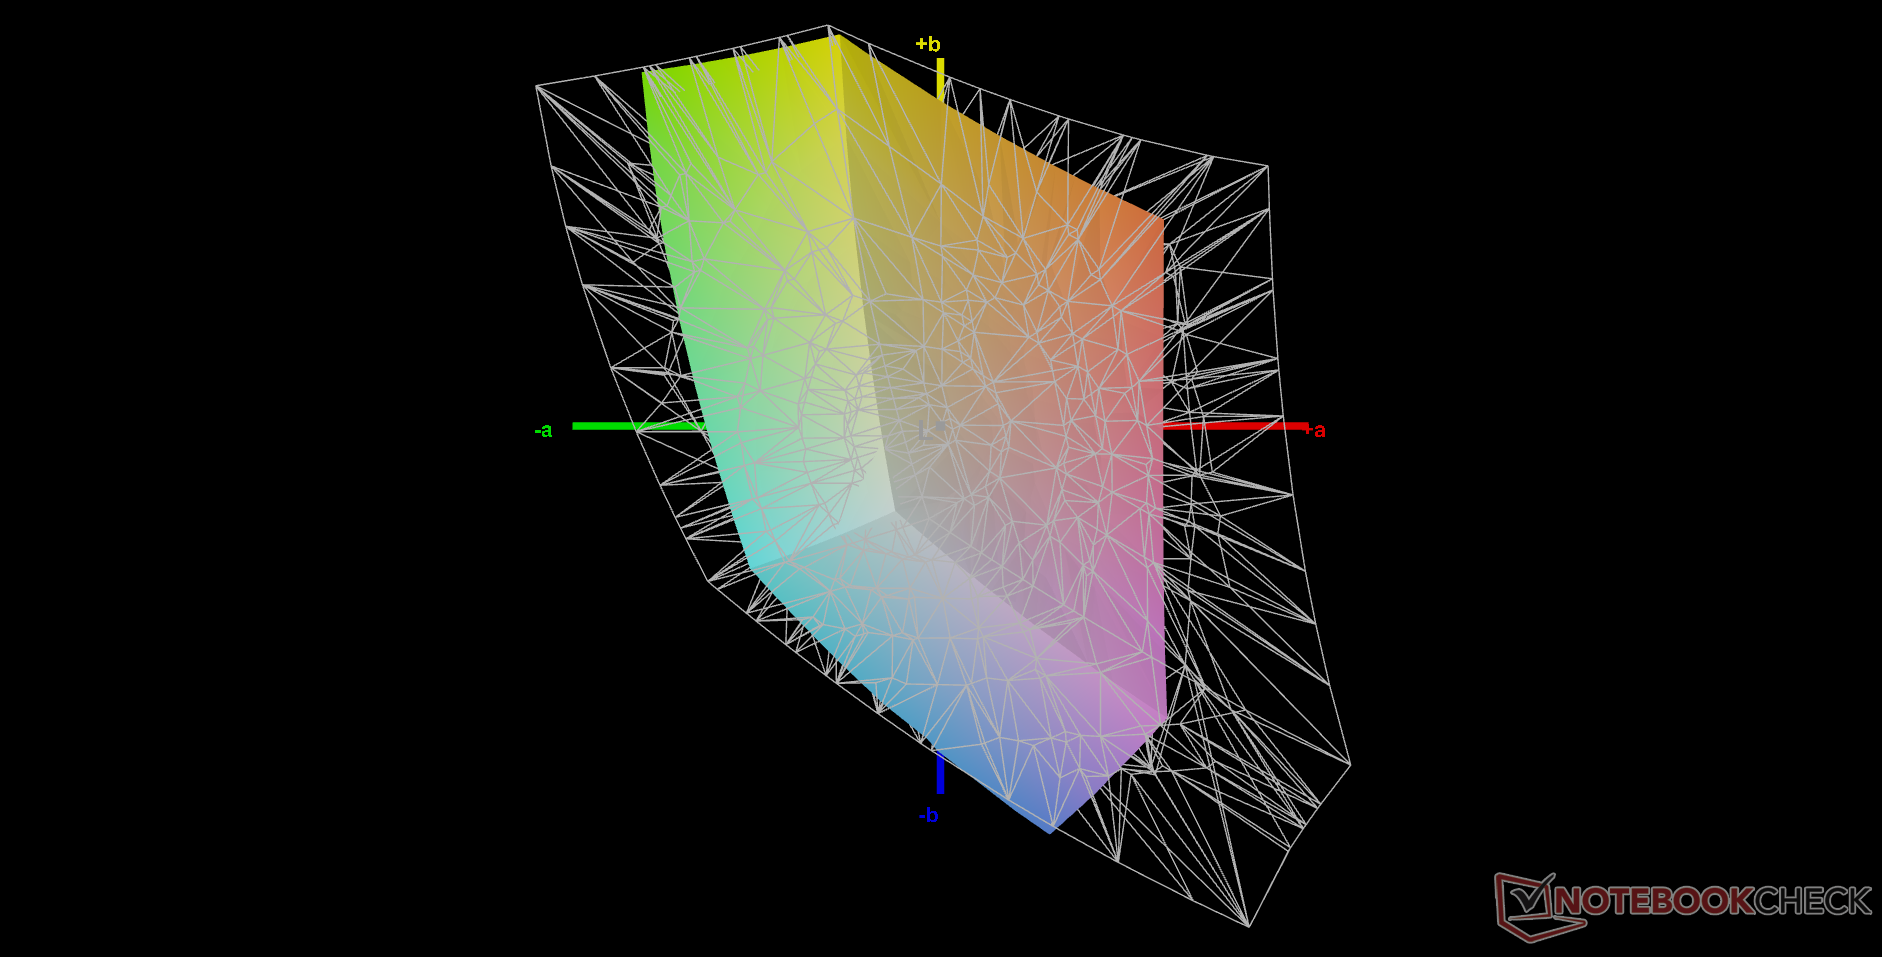
显示器开箱后的校准效果很差,灰度和色彩 deltaE 平均值分别为 7.4 和 7.23,相对较高。自行校准显示屏会有所改善,但由于上述有限的 sRGB 覆盖范围,饱和度越高,色彩越不准确。无论如何,准确的色彩通常不是这类笔记本电脑的首要任务。

Display Response Times
| ↔ Response Time Black to White | ||
|---|---|---|
| 14.5 ms ... rise ↗ and fall ↘ combined | ↗ 7 ms rise | 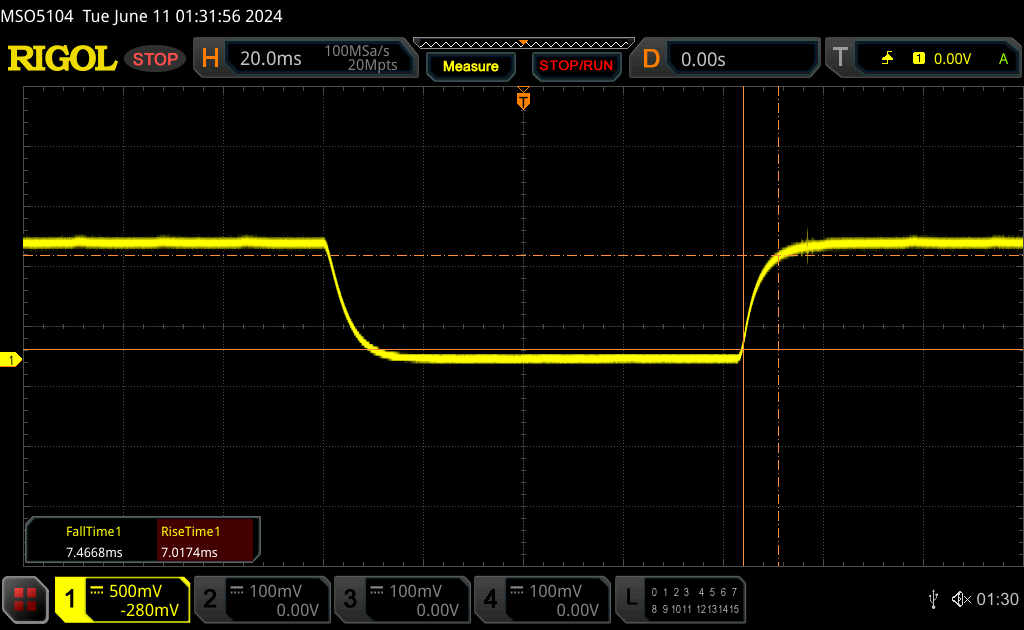 |
| ↘ 7.5 ms fall | ||
| The screen shows good response rates in our tests, but may be too slow for competitive gamers. In comparison, all tested devices range from 0.1 (minimum) to 240 (maximum) ms. » 35 % of all devices are better. This means that the measured response time is better than the average of all tested devices (20.1 ms). | ||
| ↔ Response Time 50% Grey to 80% Grey | ||
| 22.4 ms ... rise ↗ and fall ↘ combined | ↗ 10 ms rise | 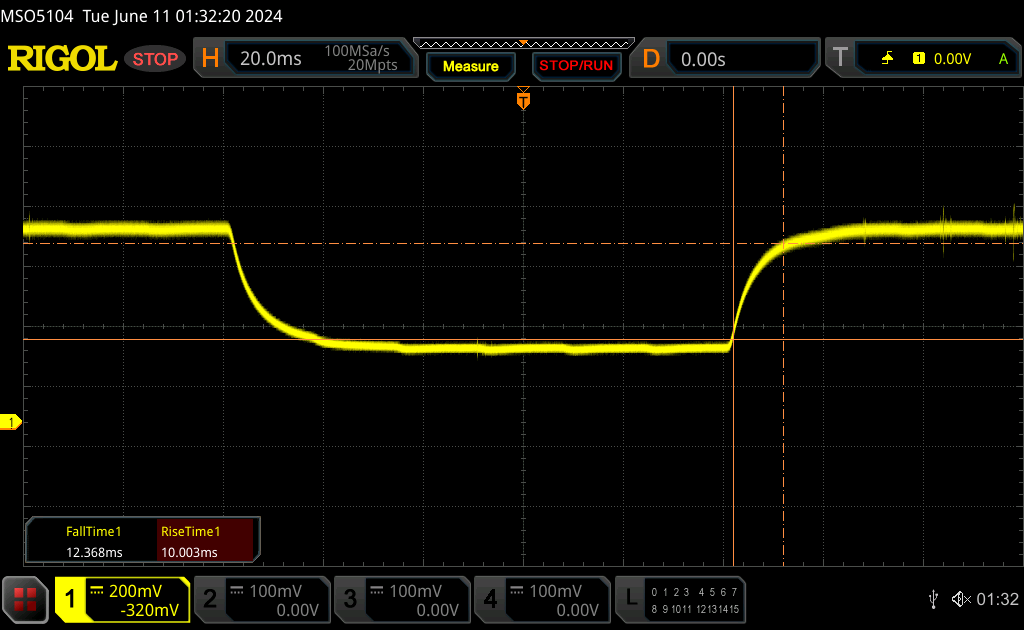 |
| ↘ 12.4 ms fall | ||
| The screen shows good response rates in our tests, but may be too slow for competitive gamers. In comparison, all tested devices range from 0.165 (minimum) to 636 (maximum) ms. » 33 % of all devices are better. This means that the measured response time is better than the average of all tested devices (31.4 ms). | ||
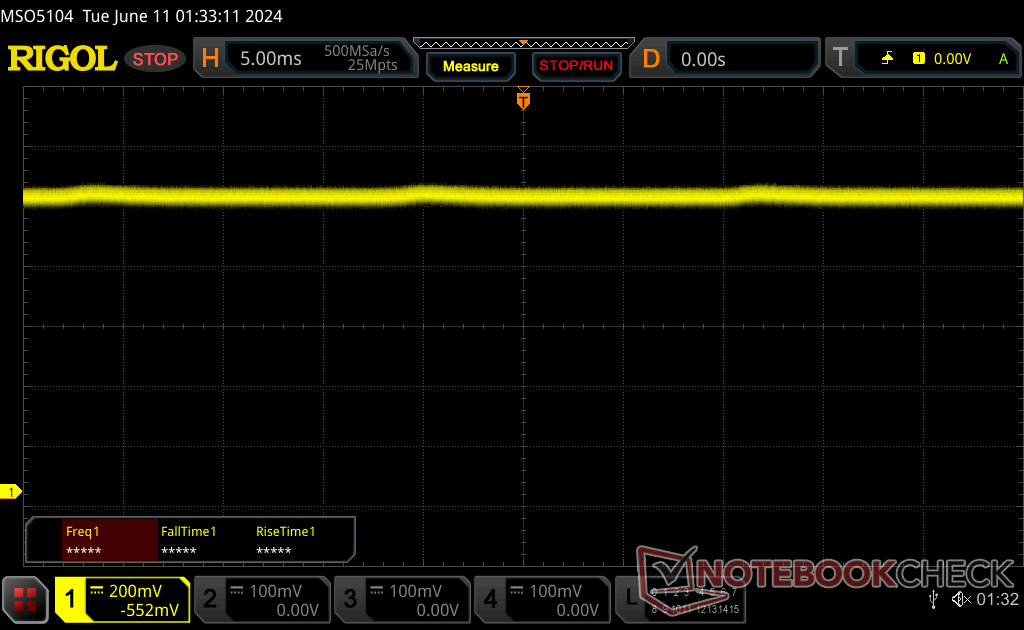
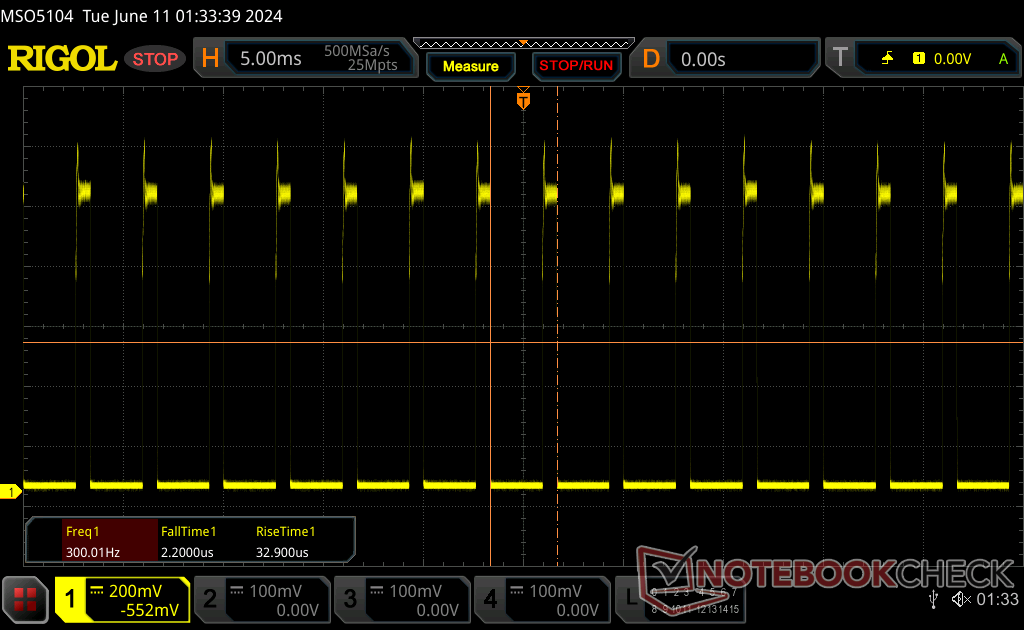
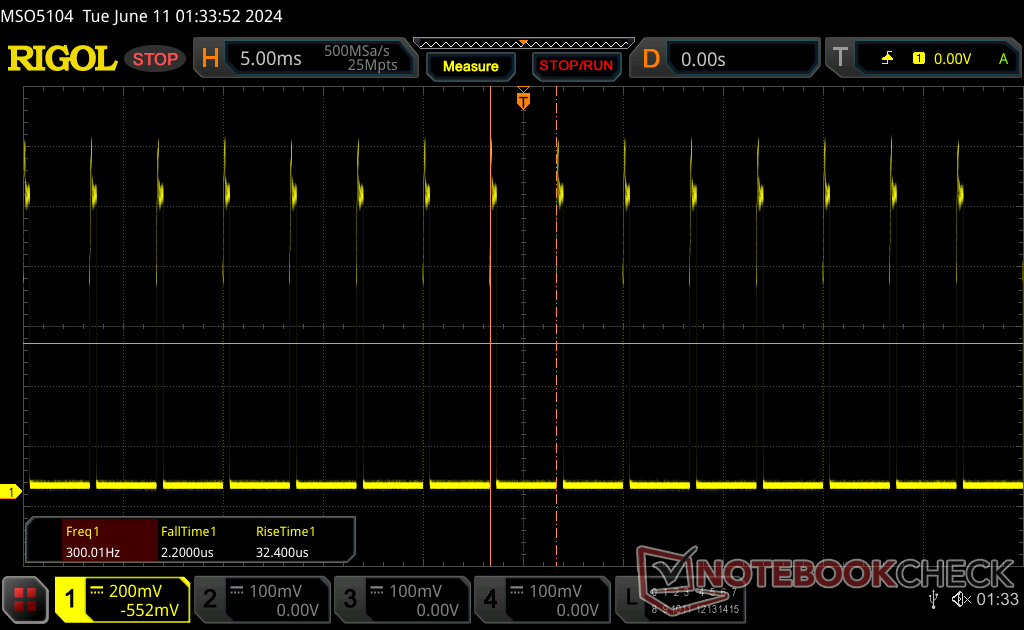
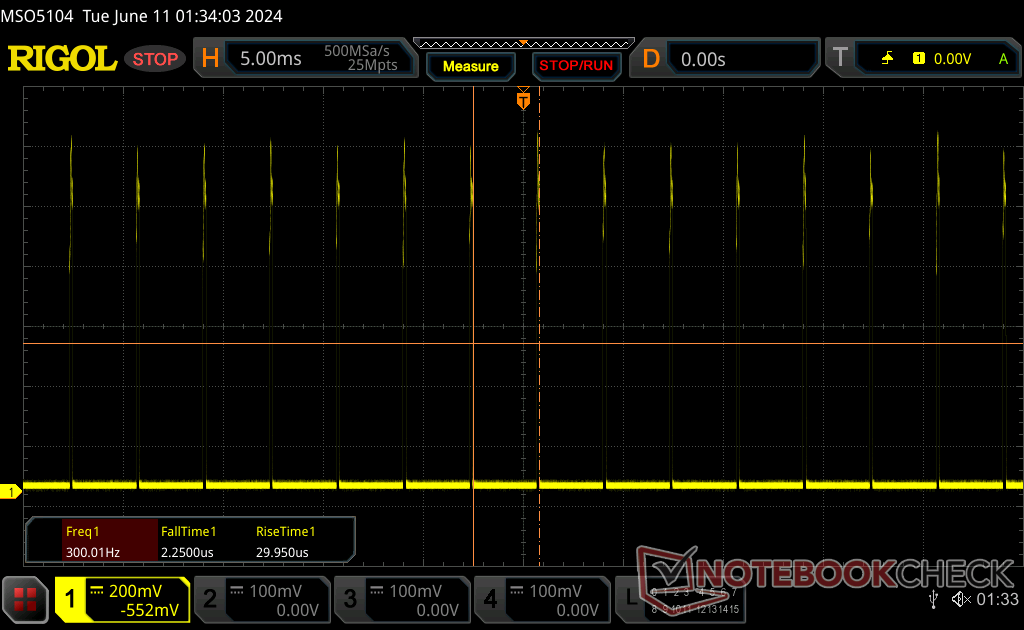
Screen Flickering / PWM (Pulse-Width Modulation)
| Screen flickering / PWM detected | 300 Hz | ≤ 99 % brightness setting | 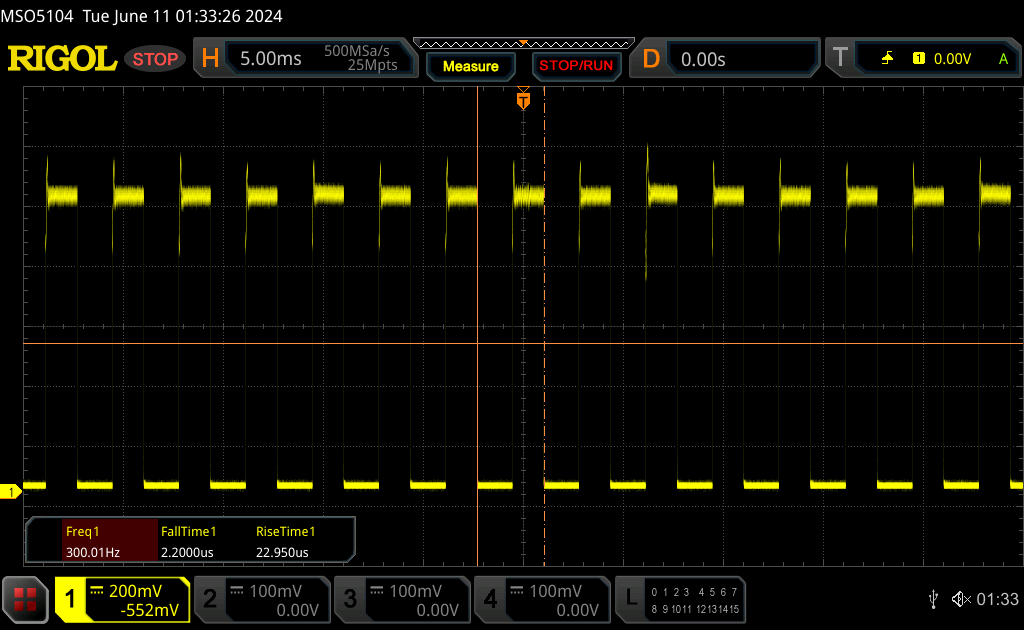 |
The display backlight flickers at 300 Hz (worst case, e.g., utilizing PWM) Flickering detected at a brightness setting of 99 % and below. There should be no flickering or PWM above this brightness setting. The frequency of 300 Hz is relatively high, so most users sensitive to PWM should not notice any flickering. However, there are reports that some users are still sensitive to PWM at 500 Hz and above, so be aware. In comparison: 53 % of all tested devices do not use PWM to dim the display. If PWM was detected, an average of 7986 (minimum: 5 - maximum: 343500) Hz was measured. | |||
除最大亮度外,所有亮度级别都有脉宽调制。从 0 到 99% 的亮度范围内,其频率恒定为 300 Hz,这意味着对屏幕闪烁敏感的用户可能需要避免长时间使用 Durabook。
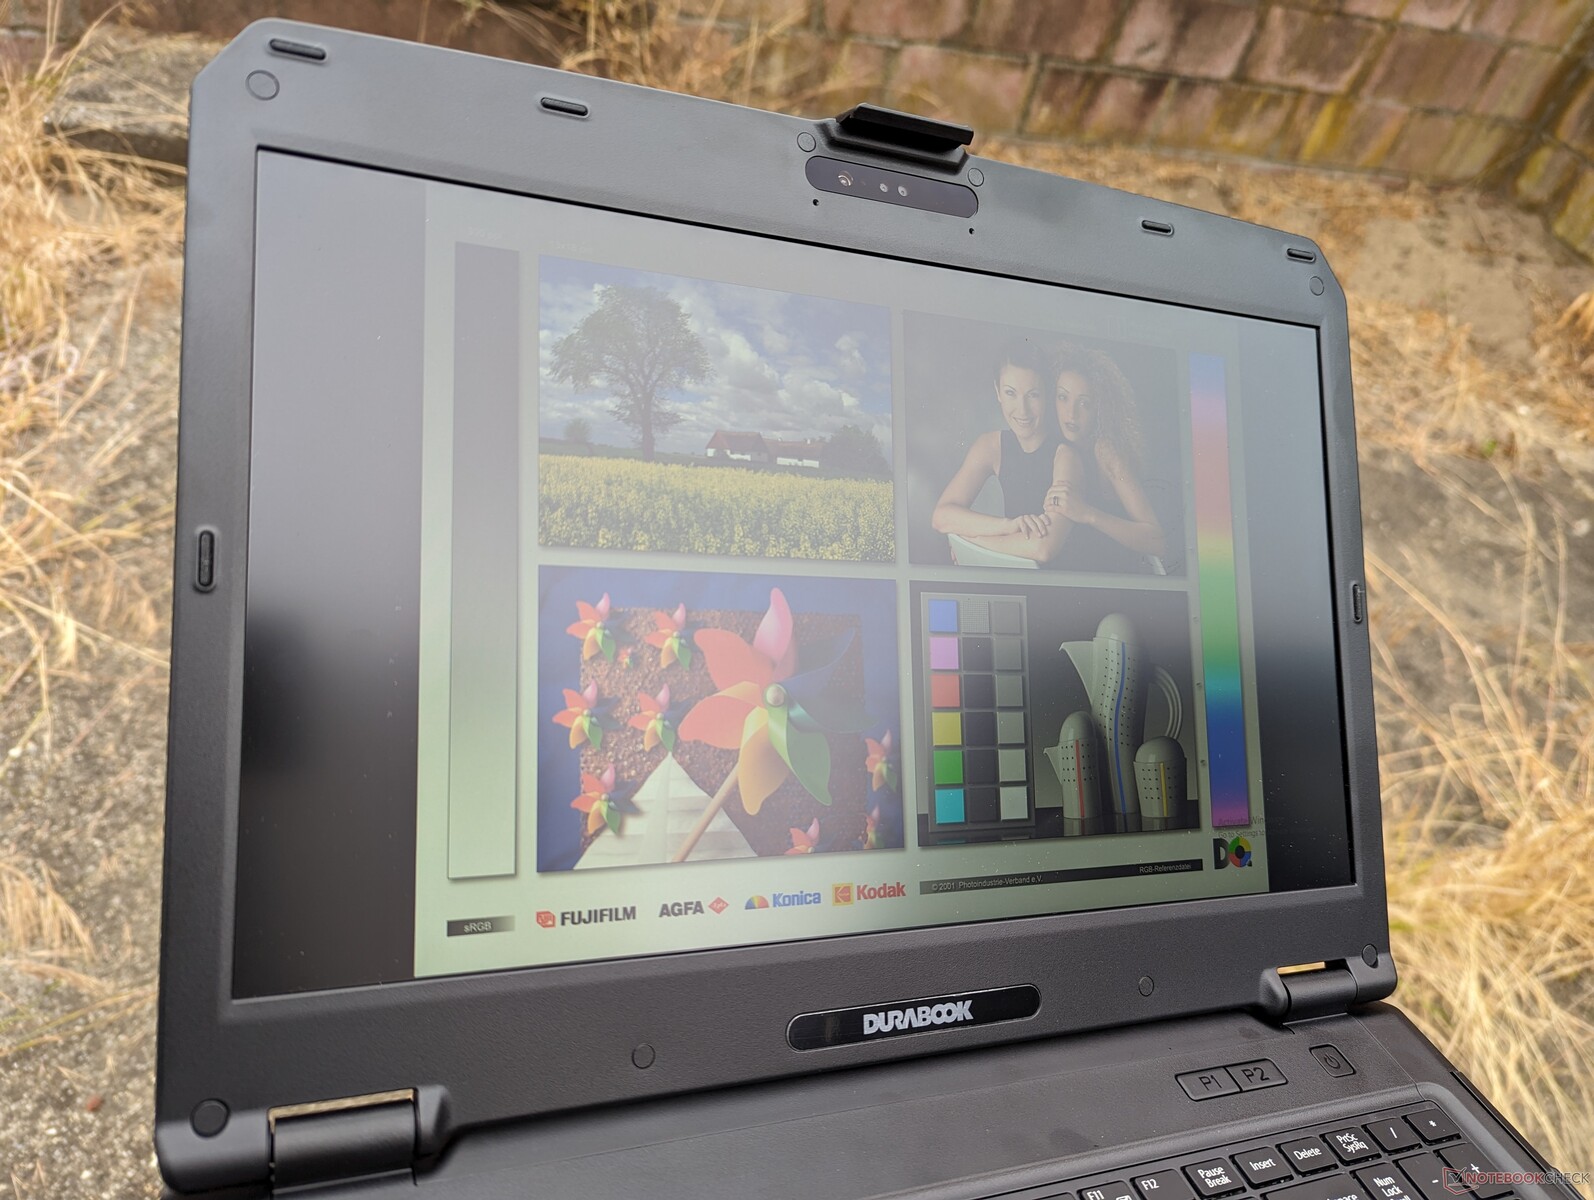
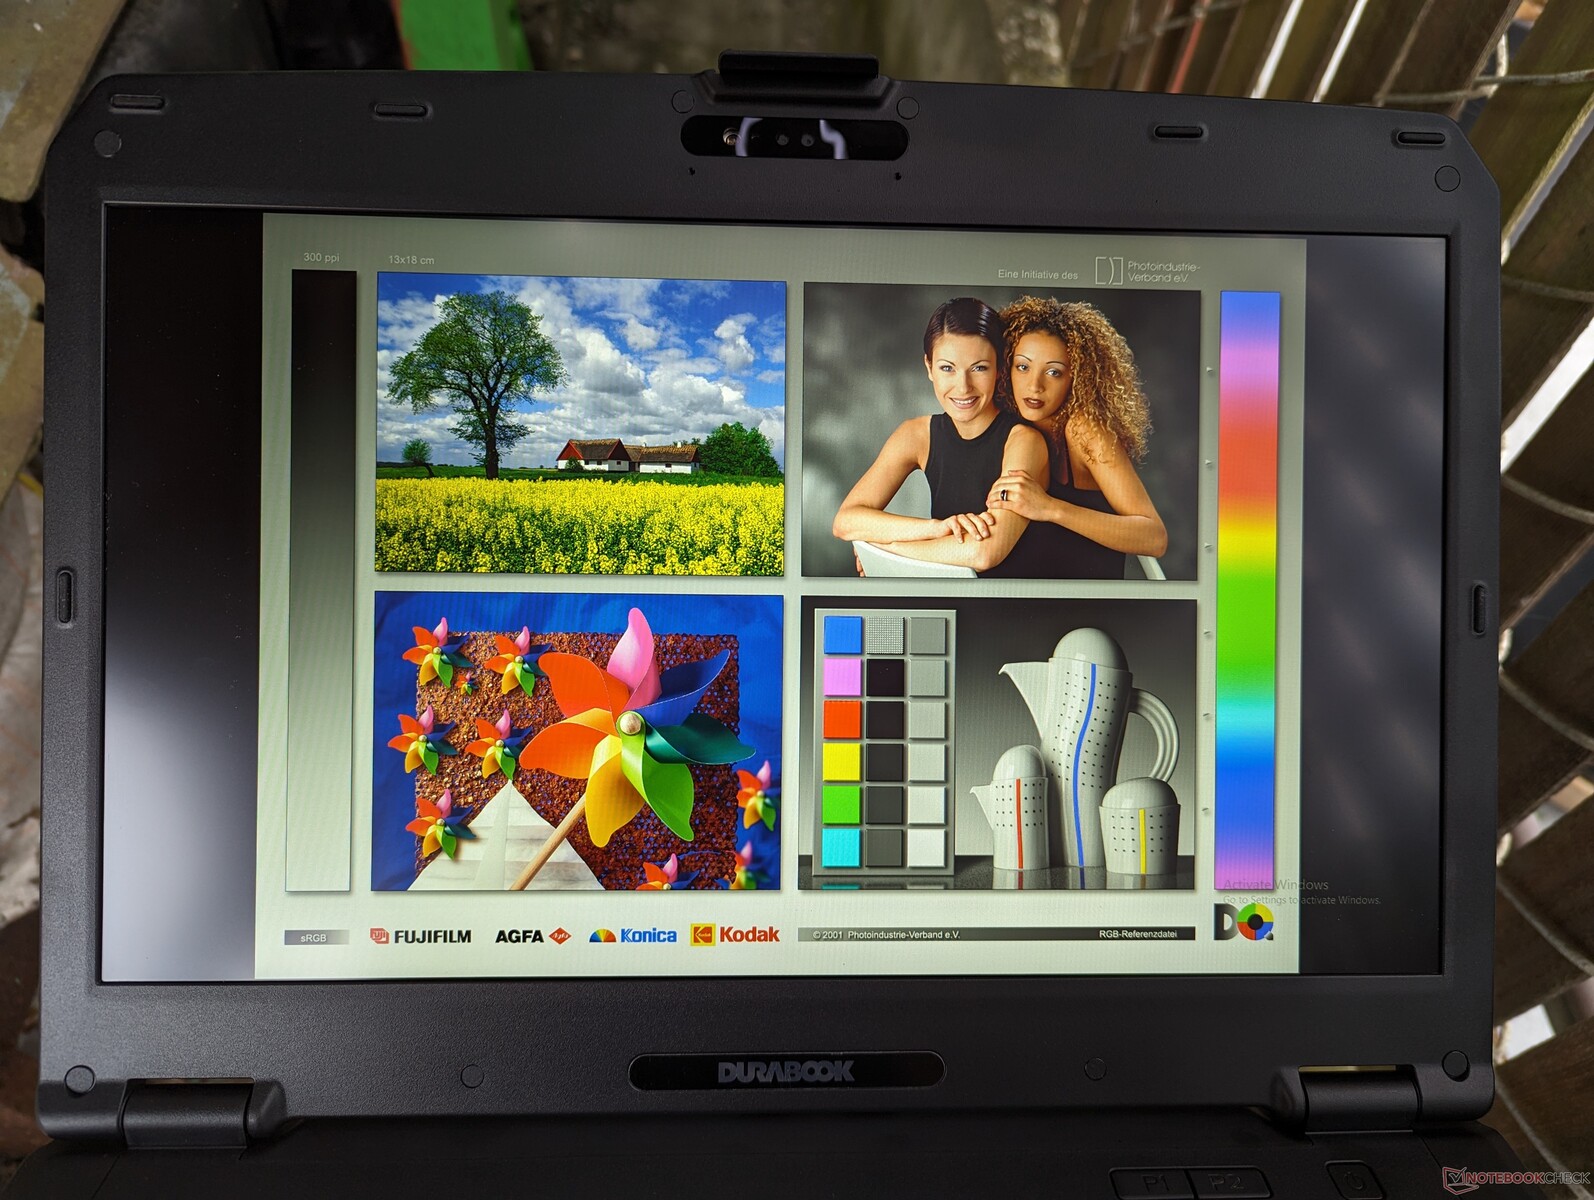
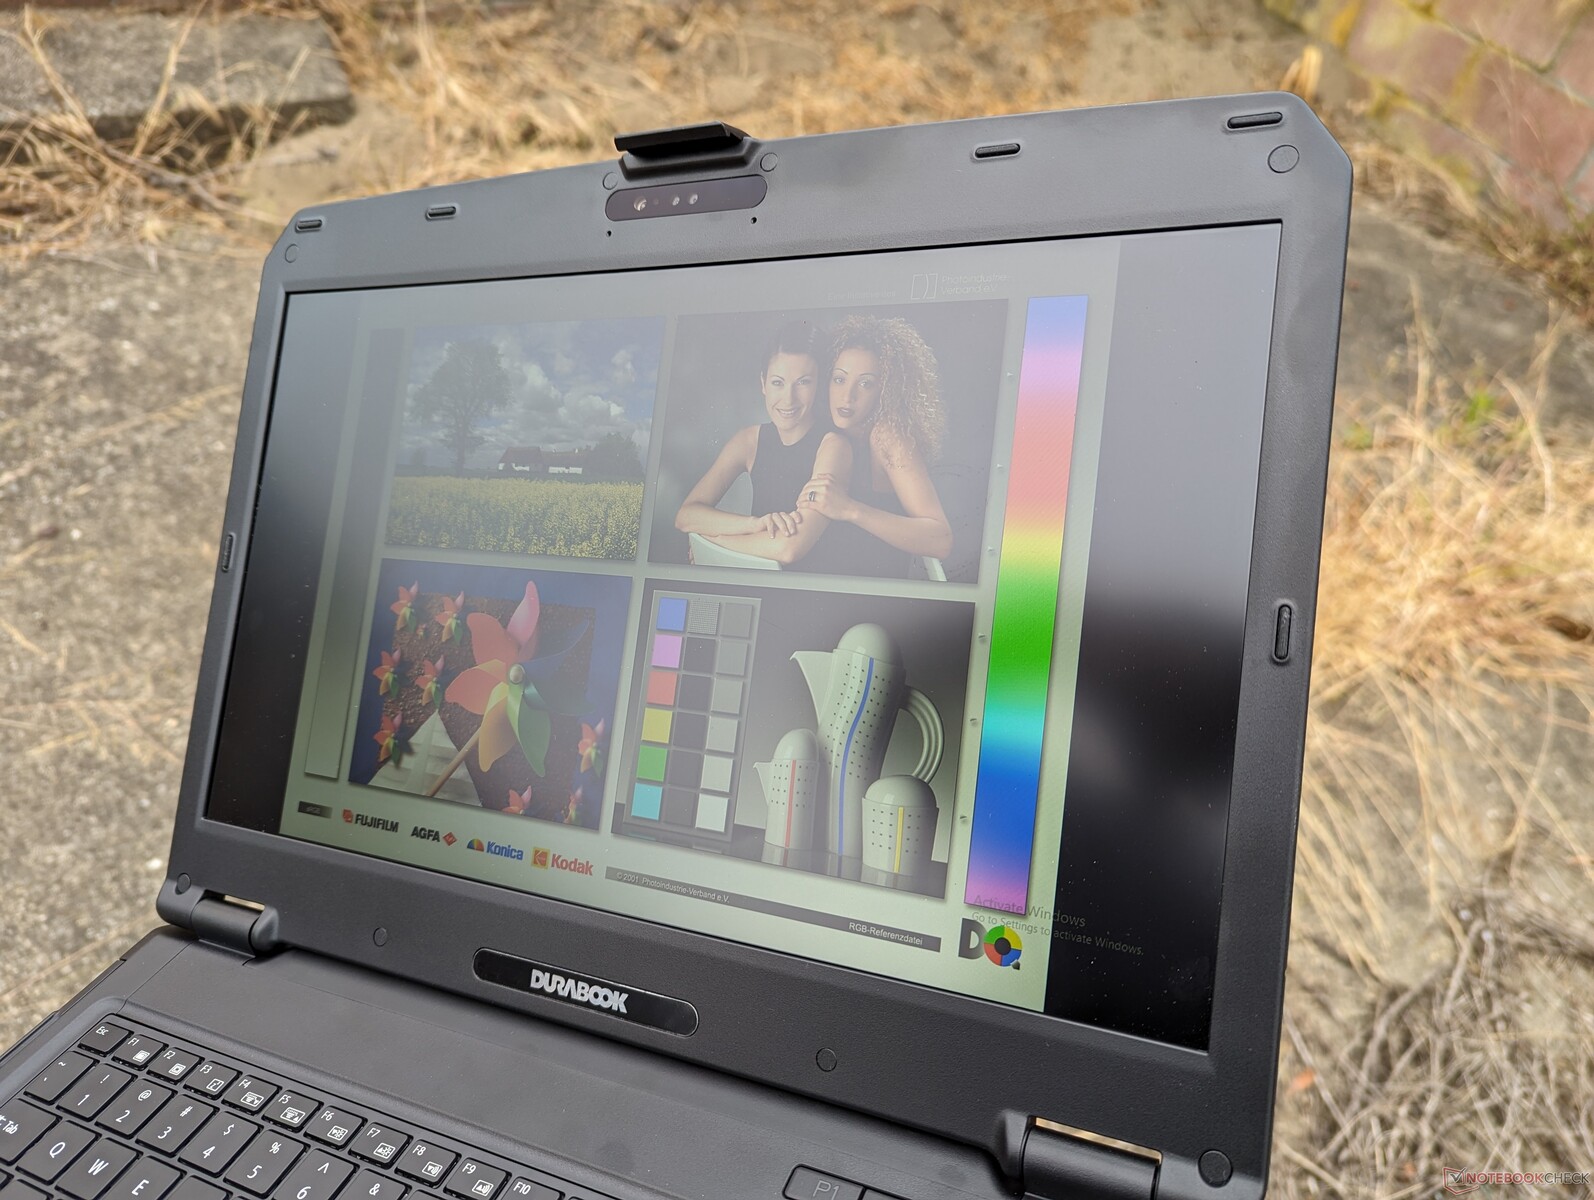
在阴凉处的室外可视性非常好,而在阳光下或明亮的阴天也能正常使用。虽然会有一些眩光,但 1000 尼特的背光有助于缓解明亮的环境光线,使文字更容易阅读。
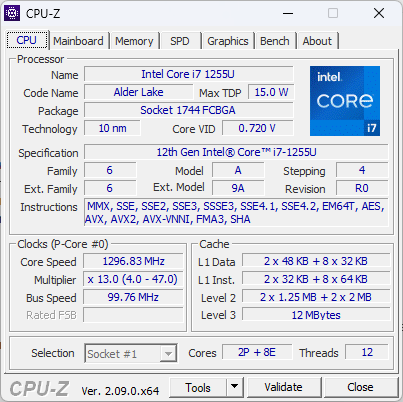
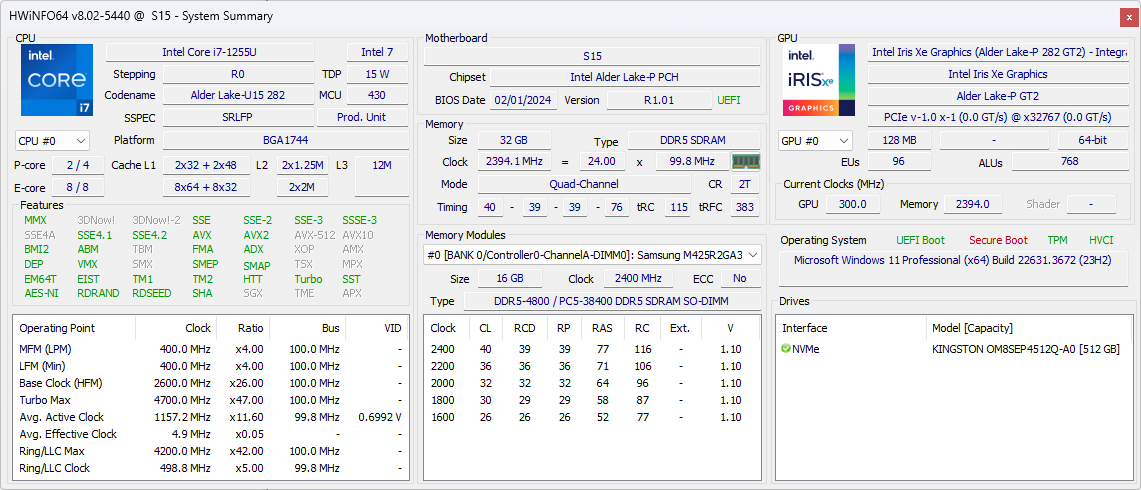
性能 - 配备 vPro 的英特尔第 12 代处理器
测试条件
在运行以下基准测试之前,我们将 Windows 设置为性能模式。
处理器
CPU 性能远远超过 酷睿 i5-8265U处理器的性能远远超过了老款 S15ABG2 的酷睿 i5-8265U,这也在意料之中,而且还比酷睿 i7Tiger Lake 处理器略快。 松下 Toughbook FZ或 Acer Enduro Urban 上的酷睿 i7 处理器稍快一些。但反过来说,它也明显慢于我们数据库中配备相同 酷睿 i7-1255U处理器的笔记本电脑平均速度慢约 20% 至 25%。这表明 S15 在运行处理器时比较保守,以提高性能的一致性和可靠性。
如果想获得更显著的性能提升,我们建议您看看 Getac S410 G5它配备了第 13 代 Raptor Lake-P CPU 选件,多线程性能比酷睿 i7-1255U 快 60% 到 70%。
Cinebench R15 Multi Loop
Cinebench R23: Multi Core | Single Core
Cinebench R20: CPU (Multi Core) | CPU (Single Core)
Cinebench R15: CPU Multi 64Bit | CPU Single 64Bit
Blender: v2.79 BMW27 CPU
7-Zip 18.03: 7z b 4 | 7z b 4 -mmt1
Geekbench 6.5: Multi-Core | Single-Core
Geekbench 5.5: Multi-Core | Single-Core
HWBOT x265 Benchmark v2.2: 4k Preset
LibreOffice : 20 Documents To PDF
R Benchmark 2.5: Overall mean
| CPU Performance rating | |
| Getac S410 G5 | |
| Average Intel Core i7-1255U | |
| Durabook S15 | |
| Dell Latitude 7330 Rugged Extreme -2! | |
| Acer Enduro Urban N3 EUN314 -2! | |
| Panasonic Toughbook FZ-55 MK2 -4! | |
| Getac S410 Gen 4 -2! | |
| Panasonic Toughbook 40 -2! | |
| Durabook S14I -2! | |
| Getac B360 -3! | |
| Getac S410 -14! | |
| Dell Latitude 5420 Rugged-P85G -14! | |
| Durabook S15ABG2 -4! | |
| Cinebench R23 / Multi Core | |
| Getac S410 G5 | |
| Average Intel Core i7-1255U (5269 - 9628, n=11) | |
| Durabook S15 | |
| Dell Latitude 7330 Rugged Extreme | |
| Panasonic Toughbook FZ-55 MK2 | |
| Acer Enduro Urban N3 EUN314 | |
| Getac S410 Gen 4 | |
| Panasonic Toughbook 40 | |
| Getac B360 | |
| Durabook S14I | |
| Cinebench R23 / Single Core | |
| Getac S410 G5 | |
| Average Intel Core i7-1255U (1408 - 1775, n=11) | |
| Dell Latitude 7330 Rugged Extreme | |
| Panasonic Toughbook FZ-55 MK2 | |
| Acer Enduro Urban N3 EUN314 | |
| Getac S410 Gen 4 | |
| Durabook S15 | |
| Panasonic Toughbook 40 | |
| Durabook S14I | |
| Getac B360 | |
| Cinebench R20 / CPU (Multi Core) | |
| Getac S410 G5 | |
| Average Intel Core i7-1255U (2095 - 3702, n=11) | |
| Durabook S15 | |
| Dell Latitude 7330 Rugged Extreme | |
| Panasonic Toughbook FZ-55 MK2 | |
| Acer Enduro Urban N3 EUN314 | |
| Getac S410 Gen 4 | |
| Panasonic Toughbook 40 | |
| Getac B360 | |
| Durabook S14I | |
| Durabook S15ABG2 | |
| Cinebench R20 / CPU (Single Core) | |
| Getac S410 G5 | |
| Average Intel Core i7-1255U (550 - 682, n=11) | |
| Durabook S15 | |
| Dell Latitude 7330 Rugged Extreme | |
| Acer Enduro Urban N3 EUN314 | |
| Panasonic Toughbook FZ-55 MK2 | |
| Getac S410 Gen 4 | |
| Durabook S14I | |
| Panasonic Toughbook 40 | |
| Getac B360 | |
| Durabook S15ABG2 | |
| Cinebench R15 / CPU Multi 64Bit | |
| Getac S410 G5 | |
| Average Intel Core i7-1255U (919 - 1577, n=11) | |
| Durabook S15 | |
| Acer Enduro Urban N3 EUN314 | |
| Dell Latitude 7330 Rugged Extreme | |
| Panasonic Toughbook FZ-55 MK2 | |
| Getac S410 Gen 4 | |
| Panasonic Toughbook 40 | |
| Getac B360 | |
| Durabook S14I | |
| Getac S410 | |
| Durabook S15ABG2 | |
| Dell Latitude 5420 Rugged-P85G | |
| Cinebench R15 / CPU Single 64Bit | |
| Getac S410 G5 | |
| Average Intel Core i7-1255U (161 - 251, n=12) | |
| Durabook S15 | |
| Dell Latitude 7330 Rugged Extreme | |
| Panasonic Toughbook FZ-55 MK2 | |
| Acer Enduro Urban N3 EUN314 | |
| Getac S410 Gen 4 | |
| Durabook S14I | |
| Panasonic Toughbook 40 | |
| Getac B360 | |
| Getac S410 | |
| Durabook S15ABG2 | |
| Dell Latitude 5420 Rugged-P85G | |
| Blender / v2.79 BMW27 CPU | |
| Durabook S15ABG2 | |
| Durabook S14I | |
| Getac B360 | |
| Panasonic Toughbook 40 | |
| Getac S410 Gen 4 | |
| Panasonic Toughbook FZ-55 MK2 | |
| Acer Enduro Urban N3 EUN314 | |
| Dell Latitude 7330 Rugged Extreme | |
| Durabook S15 | |
| Average Intel Core i7-1255U (372 - 601, n=11) | |
| Getac S410 G5 | |
| 7-Zip 18.03 / 7z b 4 | |
| Getac S410 G5 | |
| Average Intel Core i7-1255U (24126 - 37365, n=11) | |
| Durabook S15 | |
| Acer Enduro Urban N3 EUN314 | |
| Dell Latitude 7330 Rugged Extreme | |
| Panasonic Toughbook FZ-55 MK2 | |
| Getac S410 Gen 4 | |
| Getac B360 | |
| Panasonic Toughbook 40 | |
| Durabook S14I | |
| Durabook S15ABG2 | |
| 7-Zip 18.03 / 7z b 4 -mmt1 | |
| Dell Latitude 7330 Rugged Extreme | |
| Acer Enduro Urban N3 EUN314 | |
| Average Intel Core i7-1255U (5059 - 5529, n=11) | |
| Panasonic Toughbook FZ-55 MK2 | |
| Durabook S14I | |
| Getac S410 G5 | |
| Durabook S15 | |
| Panasonic Toughbook 40 | |
| Getac S410 Gen 4 | |
| Getac B360 | |
| Durabook S15ABG2 | |
| Geekbench 6.5 / Multi-Core | |
| Getac S410 G5 | |
| Average Intel Core i7-1255U (7914 - 8632, n=2) | |
| Durabook S15 | |
| Geekbench 6.5 / Single-Core | |
| Getac S410 G5 | |
| Average Intel Core i7-1255U (2313 - 2325, n=2) | |
| Durabook S15 | |
| Geekbench 5.5 / Multi-Core | |
| Getac S410 G5 | |
| Average Intel Core i7-1255U (4463 - 8821, n=12) | |
| Durabook S15 | |
| Dell Latitude 7330 Rugged Extreme | |
| Acer Enduro Urban N3 EUN314 | |
| Getac S410 Gen 4 | |
| Panasonic Toughbook 40 | |
| Getac B360 | |
| Durabook S14I | |
| Durabook S15ABG2 | |
| Geekbench 5.5 / Single-Core | |
| Getac S410 G5 | |
| Durabook S15 | |
| Average Intel Core i7-1255U (1560 - 1712, n=12) | |
| Dell Latitude 7330 Rugged Extreme | |
| Acer Enduro Urban N3 EUN314 | |
| Durabook S14I | |
| Getac S410 Gen 4 | |
| Panasonic Toughbook 40 | |
| Getac B360 | |
| Durabook S15ABG2 | |
| HWBOT x265 Benchmark v2.2 / 4k Preset | |
| Getac S410 G5 | |
| Average Intel Core i7-1255U (6.31 - 10.1, n=11) | |
| Dell Latitude 7330 Rugged Extreme | |
| Durabook S15 | |
| Panasonic Toughbook FZ-55 MK2 | |
| Acer Enduro Urban N3 EUN314 | |
| Getac S410 Gen 4 | |
| Panasonic Toughbook 40 | |
| Getac B360 | |
| Durabook S14I | |
| Durabook S15ABG2 | |
| LibreOffice / 20 Documents To PDF | |
| Durabook S15ABG2 | |
| Acer Enduro Urban N3 EUN314 | |
| Panasonic Toughbook 40 | |
| Durabook S15 | |
| Getac S410 Gen 4 | |
| Dell Latitude 7330 Rugged Extreme | |
| Panasonic Toughbook FZ-55 MK2 | |
| Average Intel Core i7-1255U (35.6 - 52.5, n=11) | |
| Durabook S14I | |
| Getac S410 G5 | |
| R Benchmark 2.5 / Overall mean | |
| Durabook S15ABG2 | |
| Getac B360 | |
| Panasonic Toughbook 40 | |
| Getac S410 Gen 4 | |
| Durabook S14I | |
| Acer Enduro Urban N3 EUN314 | |
| Panasonic Toughbook FZ-55 MK2 | |
| Dell Latitude 7330 Rugged Extreme | |
| Average Intel Core i7-1255U (0.4688 - 0.558, n=11) | |
| Getac S410 G5 | |
| Durabook S15 | |
Cinebench R23: Multi Core | Single Core
Cinebench R20: CPU (Multi Core) | CPU (Single Core)
Cinebench R15: CPU Multi 64Bit | CPU Single 64Bit
Blender: v2.79 BMW27 CPU
7-Zip 18.03: 7z b 4 | 7z b 4 -mmt1
Geekbench 6.5: Multi-Core | Single-Core
Geekbench 5.5: Multi-Core | Single-Core
HWBOT x265 Benchmark v2.2: 4k Preset
LibreOffice : 20 Documents To PDF
R Benchmark 2.5: Overall mean
* ... smaller is better
AIDA64: FP32 Ray-Trace | FPU Julia | CPU SHA3 | CPU Queen | FPU SinJulia | FPU Mandel | CPU AES | CPU ZLib | FP64 Ray-Trace | CPU PhotoWorxx
| Performance rating | |
| Getac S410 G5 | |
| Average Intel Core i7-1255U | |
| Acer Enduro Urban N3 EUN314 | |
| Durabook S15 | |
| Panasonic Toughbook 40 | |
| Durabook S15ABG2 | |
| AIDA64 / FP32 Ray-Trace | |
| Getac S410 G5 | |
| Acer Enduro Urban N3 EUN314 | |
| Average Intel Core i7-1255U (4313 - 8127, n=11) | |
| Panasonic Toughbook 40 | |
| Durabook S15 | |
| Durabook S15ABG2 | |
| AIDA64 / FPU Julia | |
| Getac S410 G5 | |
| Average Intel Core i7-1255U (19813 - 41353, n=11) | |
| Acer Enduro Urban N3 EUN314 | |
| Durabook S15 | |
| Panasonic Toughbook 40 | |
| Durabook S15ABG2 | |
| AIDA64 / CPU SHA3 | |
| Getac S410 G5 | |
| Acer Enduro Urban N3 EUN314 | |
| Average Intel Core i7-1255U (1325 - 2135, n=11) | |
| Panasonic Toughbook 40 | |
| Durabook S15 | |
| Durabook S15ABG2 | |
| AIDA64 / CPU Queen | |
| Getac S410 G5 | |
| Average Intel Core i7-1255U (61375 - 65892, n=11) | |
| Durabook S15 | |
| Acer Enduro Urban N3 EUN314 | |
| Panasonic Toughbook 40 | |
| Durabook S15ABG2 | |
| AIDA64 / FPU SinJulia | |
| Getac S410 G5 | |
| Acer Enduro Urban N3 EUN314 | |
| Average Intel Core i7-1255U (3577 - 5095, n=11) | |
| Panasonic Toughbook 40 | |
| Durabook S15ABG2 | |
| Durabook S15 | |
| AIDA64 / FPU Mandel | |
| Getac S410 G5 | |
| Acer Enduro Urban N3 EUN314 | |
| Average Intel Core i7-1255U (11759 - 20187, n=11) | |
| Panasonic Toughbook 40 | |
| Durabook S15 | |
| Durabook S15ABG2 | |
| AIDA64 / CPU AES | |
| Acer Enduro Urban N3 EUN314 | |
| Getac S410 G5 | |
| Average Intel Core i7-1255U (27900 - 67458, n=11) | |
| Panasonic Toughbook 40 | |
| Durabook S15 | |
| Durabook S15ABG2 | |
| AIDA64 / CPU ZLib | |
| Getac S410 G5 | |
| Average Intel Core i7-1255U (393 - 640, n=11) | |
| Durabook S15 | |
| Acer Enduro Urban N3 EUN314 | |
| Panasonic Toughbook 40 | |
| Durabook S15ABG2 | |
| AIDA64 / FP64 Ray-Trace | |
| Getac S410 G5 | |
| Acer Enduro Urban N3 EUN314 | |
| Average Intel Core i7-1255U (2474 - 4400, n=11) | |
| Panasonic Toughbook 40 | |
| Durabook S15 | |
| Durabook S15ABG2 | |
| AIDA64 / CPU PhotoWorxx | |
| Getac S410 G5 | |
| Durabook S15 | |
| Average Intel Core i7-1255U (13899 - 44054, n=11) | |
| Acer Enduro Urban N3 EUN314 | |
| Panasonic Toughbook 40 | |
| Durabook S15ABG2 | |
压力测试
在启动 Prime95 压力测试时,CPU 会升至 2.4 GHz 和 34 W。几秒钟后,核心温度达到 85 摄氏度,处理器会降至 1.3 GHz 和 15 W,以保持 80 摄氏度的低温。
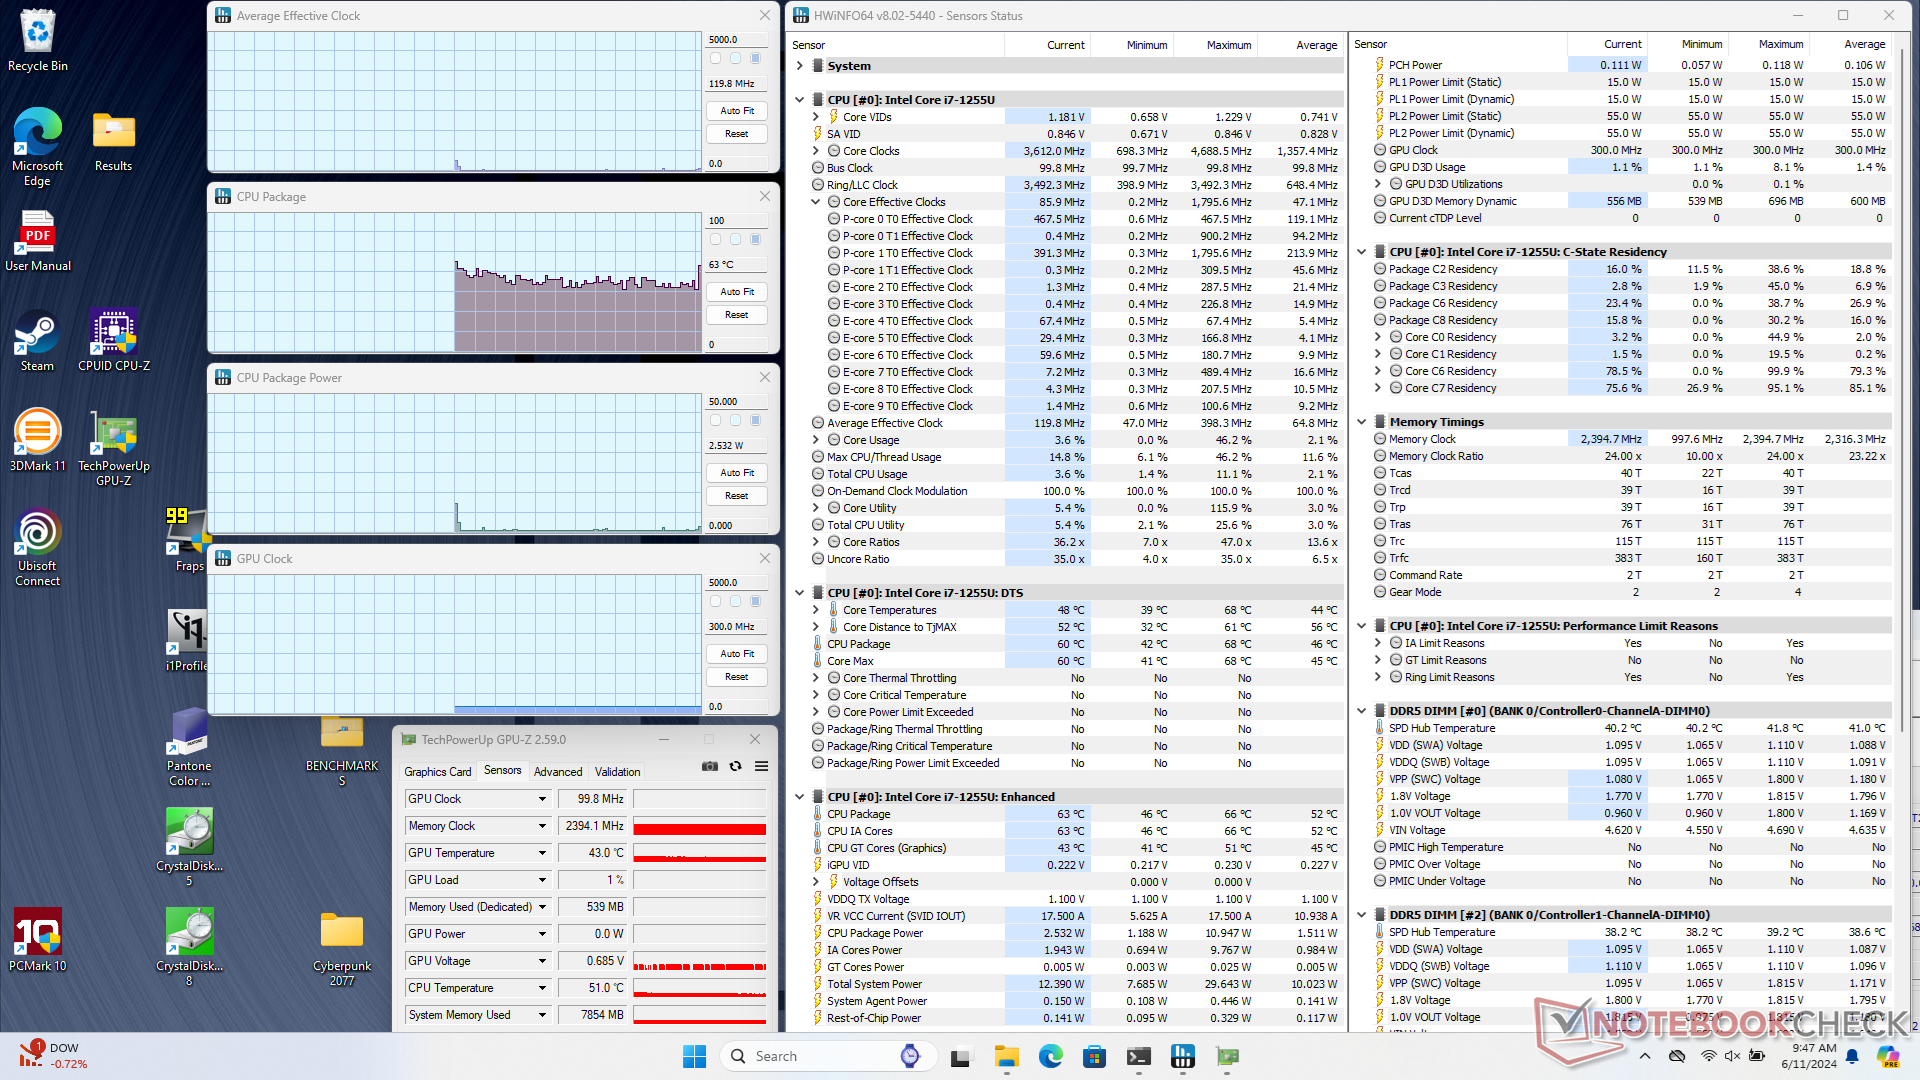
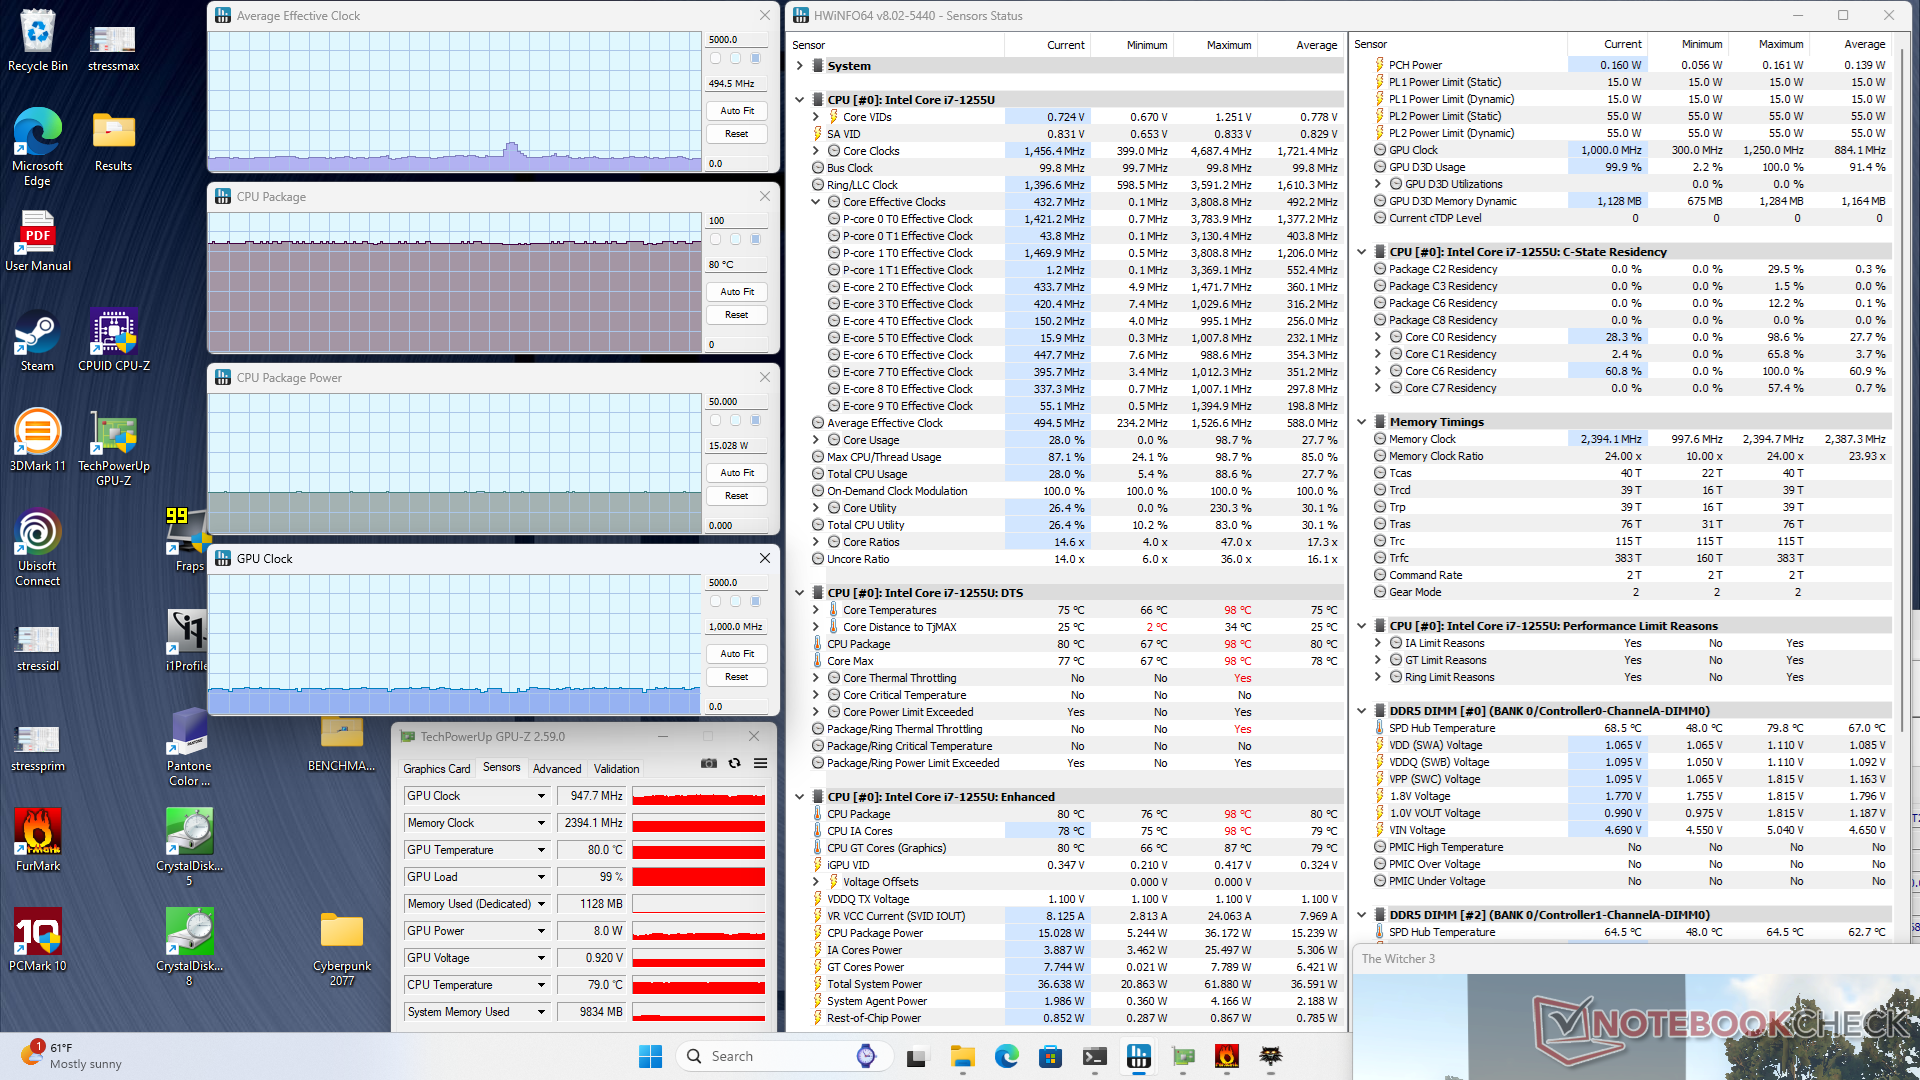
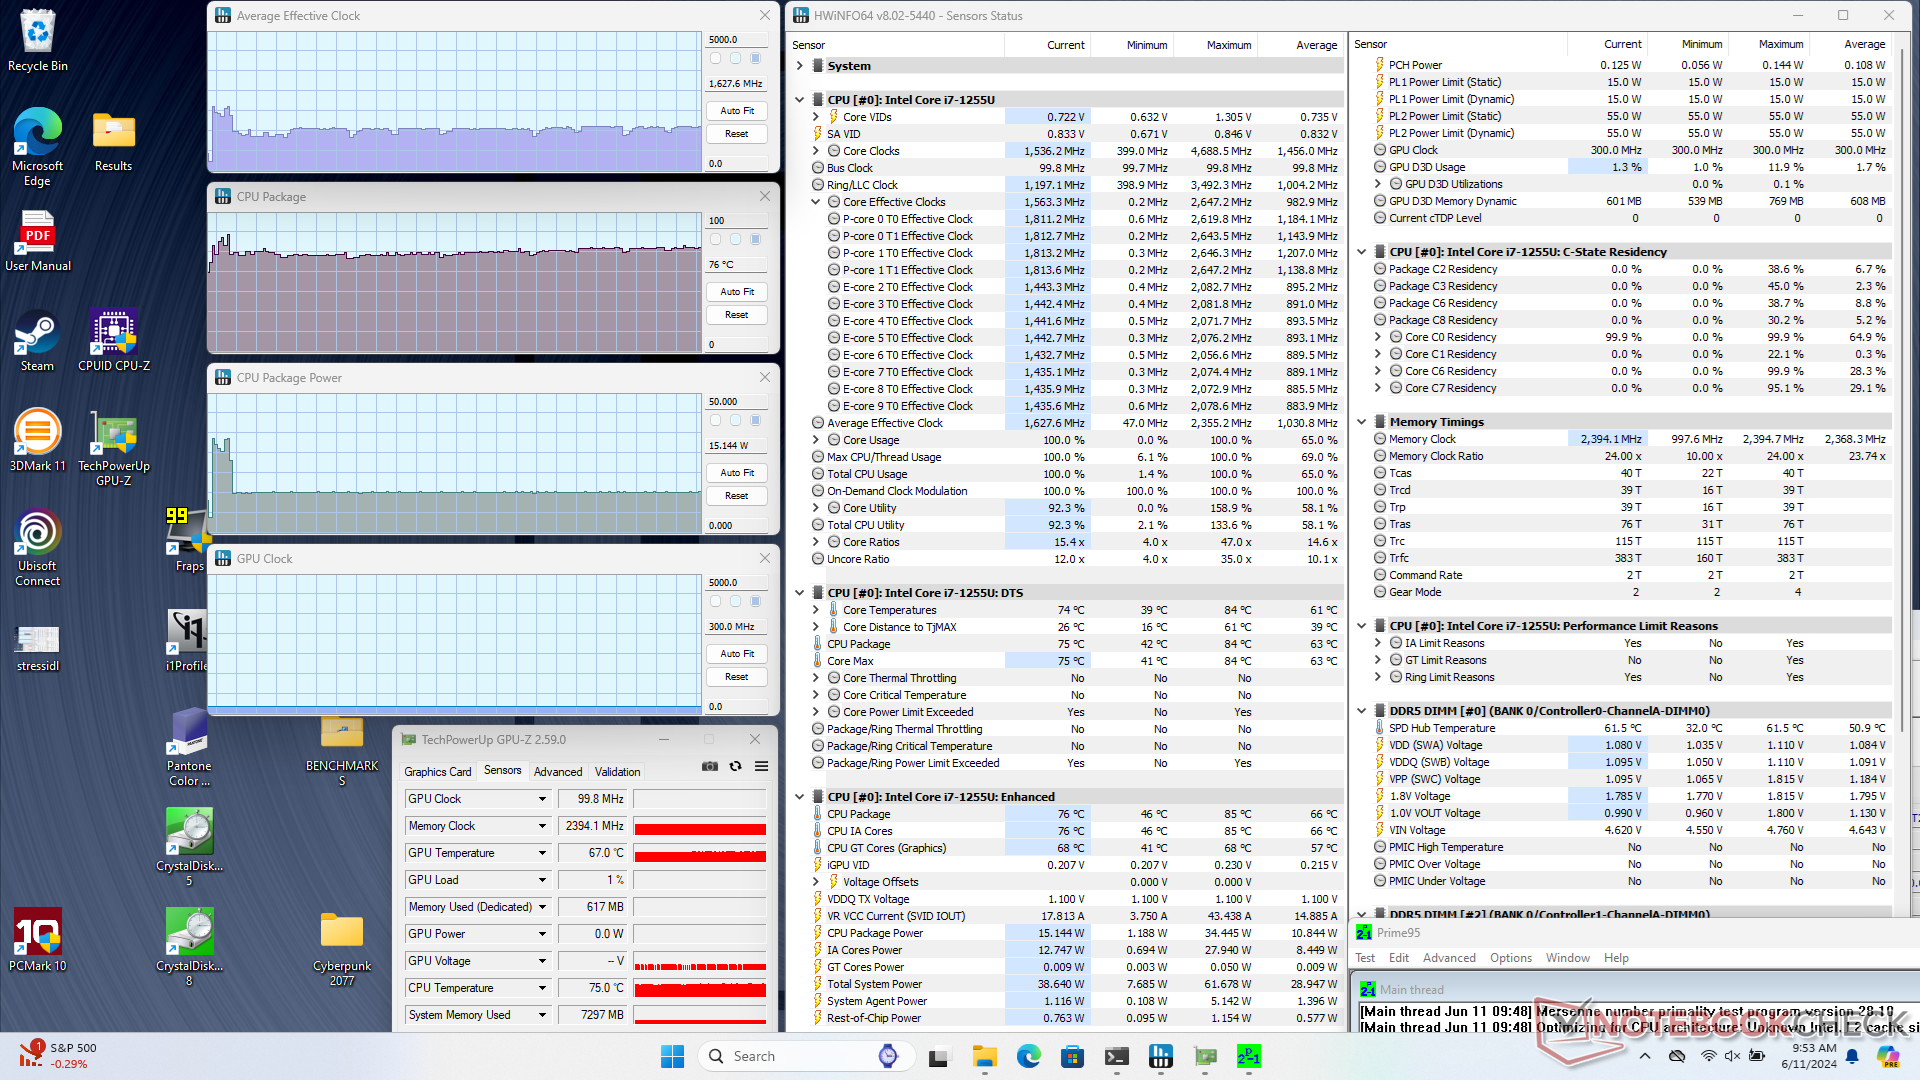
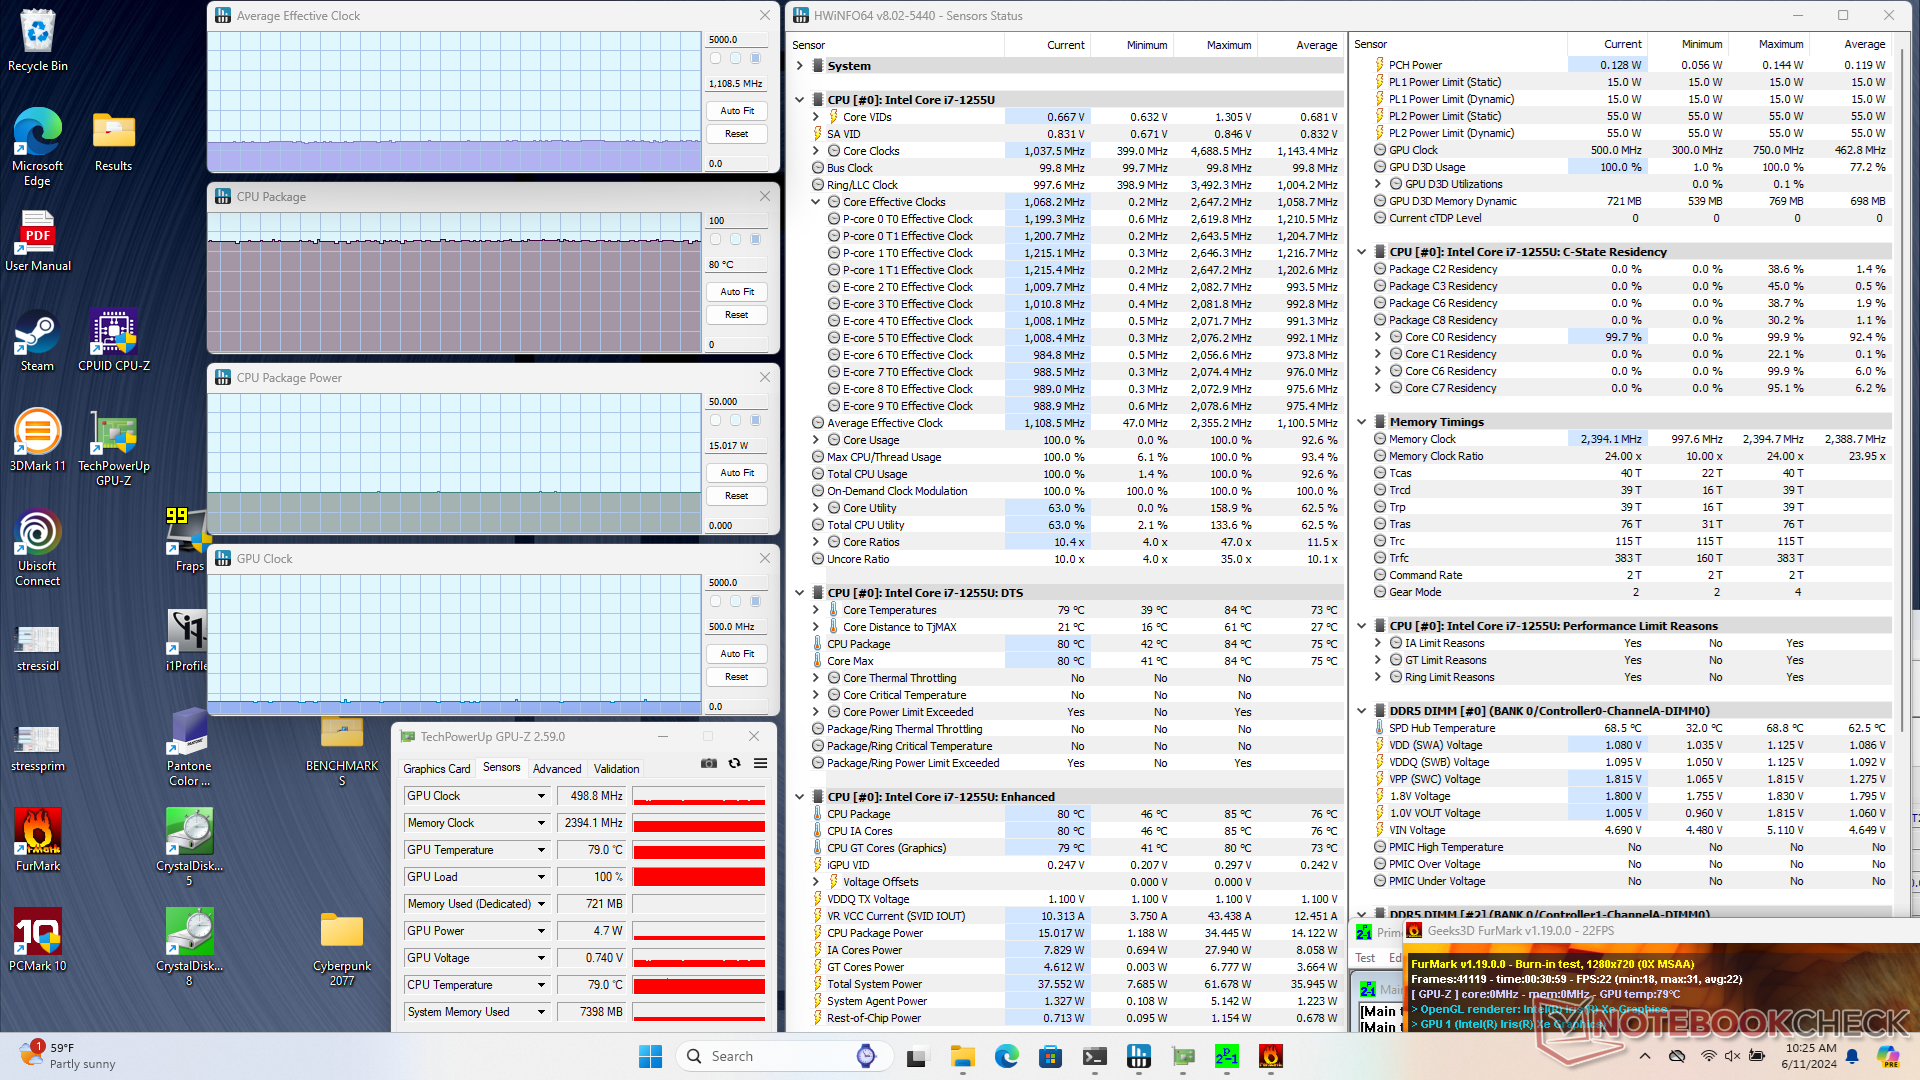
| CPU 平均时钟 (GHz) | GPU 时钟 (MHz) | CPU 平均温度 (°C) | |
| 系统闲置 | -- | -- | 60 |
| Prime95 压力 | 1.6 | -- | 76 |
| Prime95 + FurMark 压力 | 1.1 | 499 | 80 |
| Witcher 3 压力 | 0.5 | 948 | 80 |
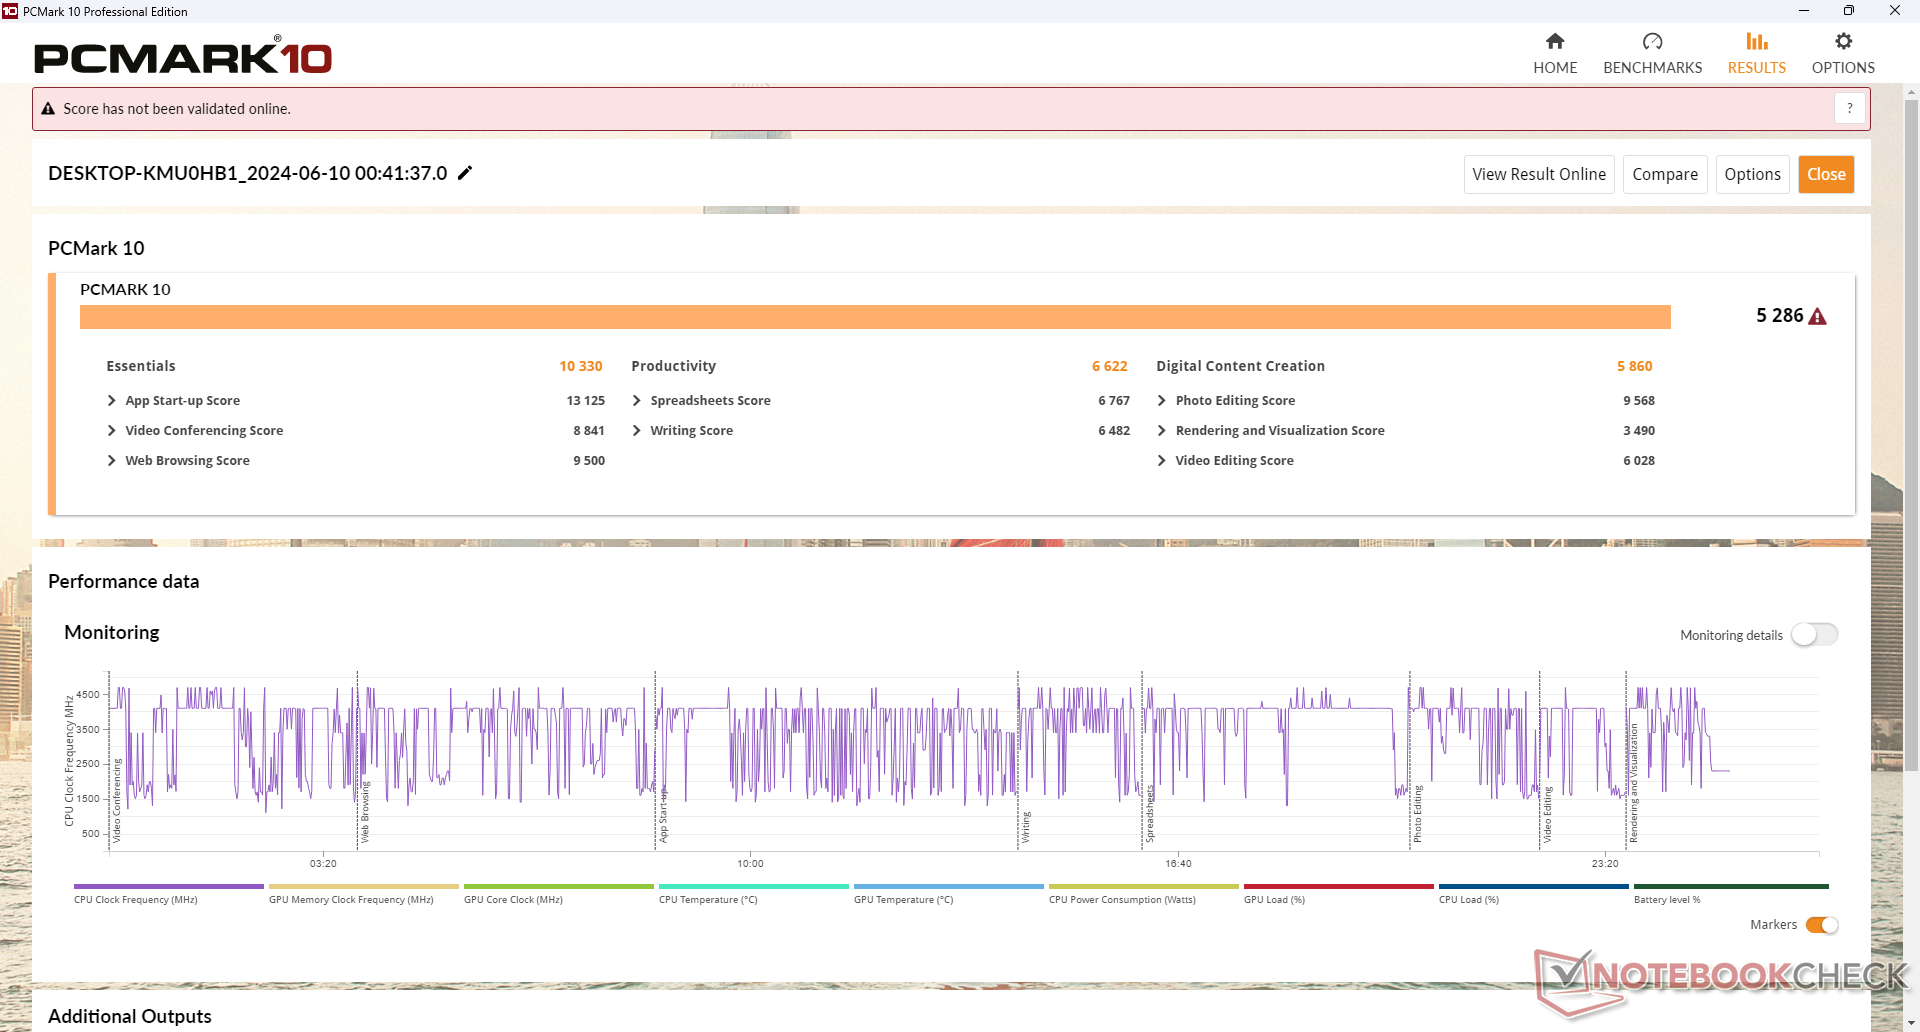
系统性能
PCMark 分数领先于大多数采用较旧的第 11 代或第 10 代英特尔平台的其他耐用笔记本电脑。也许最值得注意的是,它远远领先于较旧的 2020 S15ABG2在 GPU 性能最为重要的数字内容创建子测试中遥遥领先。
CrossMark: Overall | Productivity | Creativity | Responsiveness
WebXPRT 3: Overall
WebXPRT 4: Overall
Mozilla Kraken 1.1: Total
| PCMark 10 / Score | |
| Getac S410 G5 | |
| Average Intel Core i7-1255U, Intel Iris Xe Graphics G7 96EUs (4676 - 5523, n=9) | |
| Durabook S15 | |
| Panasonic Toughbook 40 | |
| Durabook S14I | |
| Acer Enduro Urban N3 EUN314 | |
| Dell Latitude 5420 Rugged-P85G | |
| Durabook S15ABG2 | |
| PCMark 10 / Essentials | |
| Average Intel Core i7-1255U, Intel Iris Xe Graphics G7 96EUs (9381 - 11654, n=9) | |
| Durabook S15 | |
| Durabook S14I | |
| Getac S410 G5 | |
| Panasonic Toughbook 40 | |
| Acer Enduro Urban N3 EUN314 | |
| Dell Latitude 5420 Rugged-P85G | |
| Durabook S15ABG2 | |
| PCMark 10 / Productivity | |
| Dell Latitude 5420 Rugged-P85G | |
| Getac S410 G5 | |
| Durabook S14I | |
| Average Intel Core i7-1255U, Intel Iris Xe Graphics G7 96EUs (6530 - 7418, n=9) | |
| Durabook S15 | |
| Panasonic Toughbook 40 | |
| Durabook S15ABG2 | |
| Acer Enduro Urban N3 EUN314 | |
| PCMark 10 / Digital Content Creation | |
| Getac S410 G5 | |
| Durabook S15 | |
| Average Intel Core i7-1255U, Intel Iris Xe Graphics G7 96EUs (4498 - 6203, n=9) | |
| Panasonic Toughbook 40 | |
| Acer Enduro Urban N3 EUN314 | |
| Durabook S14I | |
| Dell Latitude 5420 Rugged-P85G | |
| Durabook S15ABG2 | |
| CrossMark / Overall | |
| Average Intel Core i7-1255U, Intel Iris Xe Graphics G7 96EUs (1329 - 1573, n=9) | |
| Getac S410 G5 | |
| Durabook S15 | |
| Panasonic Toughbook 40 | |
| CrossMark / Productivity | |
| Average Intel Core i7-1255U, Intel Iris Xe Graphics G7 96EUs (1364 - 1554, n=9) | |
| Getac S410 G5 | |
| Durabook S15 | |
| Panasonic Toughbook 40 | |
| CrossMark / Creativity | |
| Getac S410 G5 | |
| Average Intel Core i7-1255U, Intel Iris Xe Graphics G7 96EUs (1372 - 1660, n=9) | |
| Durabook S15 | |
| Panasonic Toughbook 40 | |
| CrossMark / Responsiveness | |
| Durabook S15 | |
| Average Intel Core i7-1255U, Intel Iris Xe Graphics G7 96EUs (1117 - 1434, n=9) | |
| Getac S410 G5 | |
| Panasonic Toughbook 40 | |
| WebXPRT 3 / Overall | |
| Average Intel Core i7-1255U, Intel Iris Xe Graphics G7 96EUs (200 - 366, n=9) | |
| Getac S410 G5 | |
| Durabook S14I | |
| Panasonic Toughbook 40 | |
| Acer Enduro Urban N3 EUN314 | |
| Durabook S15ABG2 | |
| WebXPRT 4 / Overall | |
| Getac S410 G5 | |
| Durabook S15 | |
| Average Intel Core i7-1255U, Intel Iris Xe Graphics G7 96EUs (183.4 - 249, n=9) | |
| Mozilla Kraken 1.1 / Total | |
| Dell Latitude 5420 Rugged-P85G | |
| Durabook S15ABG2 | |
| Acer Enduro Urban N3 EUN314 | |
| Panasonic Toughbook 40 | |
| Durabook S14I | |
| Average Intel Core i7-1255U, Intel Iris Xe Graphics G7 96EUs (476 - 727, n=10) | |
| Durabook S15 | |
| Getac S410 G5 | |
* ... smaller is better
| PCMark 10 Score | 5286 points | |
Help | ||
| AIDA64 / Memory Copy | |
| Durabook S15 | |
| Getac S410 G5 | |
| Average Intel Core i7-1255U (22846 - 67017, n=11) | |
| Acer Enduro Urban N3 EUN314 | |
| Panasonic Toughbook 40 | |
| Durabook S15ABG2 | |
| AIDA64 / Memory Read | |
| Durabook S15 | |
| Getac S410 G5 | |
| Average Intel Core i7-1255U (22877 - 67398, n=11) | |
| Acer Enduro Urban N3 EUN314 | |
| Panasonic Toughbook 40 | |
| Durabook S15ABG2 | |
| AIDA64 / Memory Write | |
| Durabook S15 | |
| Getac S410 G5 | |
| Average Intel Core i7-1255U (22883 - 65839, n=11) | |
| Acer Enduro Urban N3 EUN314 | |
| Panasonic Toughbook 40 | |
| Durabook S15ABG2 | |
| AIDA64 / Memory Latency | |
| Getac S410 G5 | |
| Panasonic Toughbook 40 | |
| Durabook S15 | |
| Average Intel Core i7-1255U (76 - 163.2, n=11) | |
| Acer Enduro Urban N3 EUN314 | |
| Durabook S15ABG2 | |
* ... smaller is better
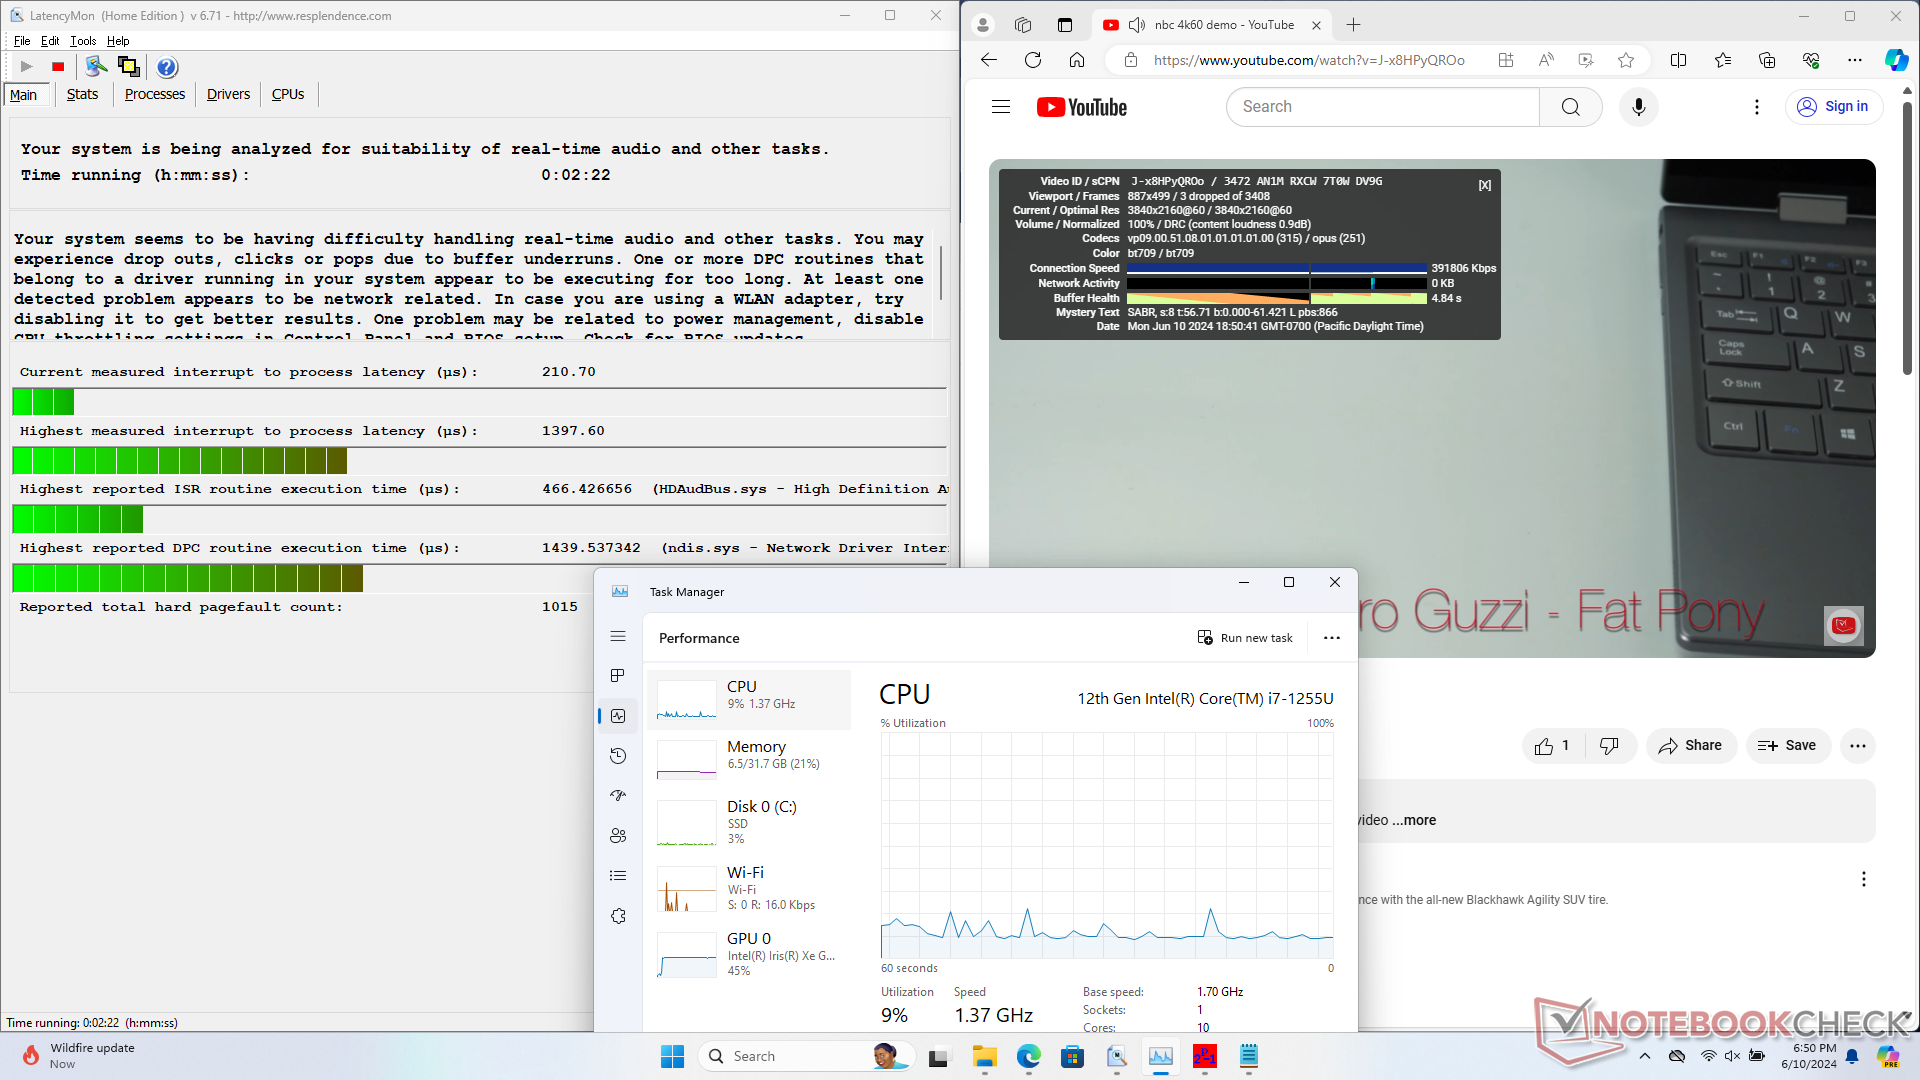
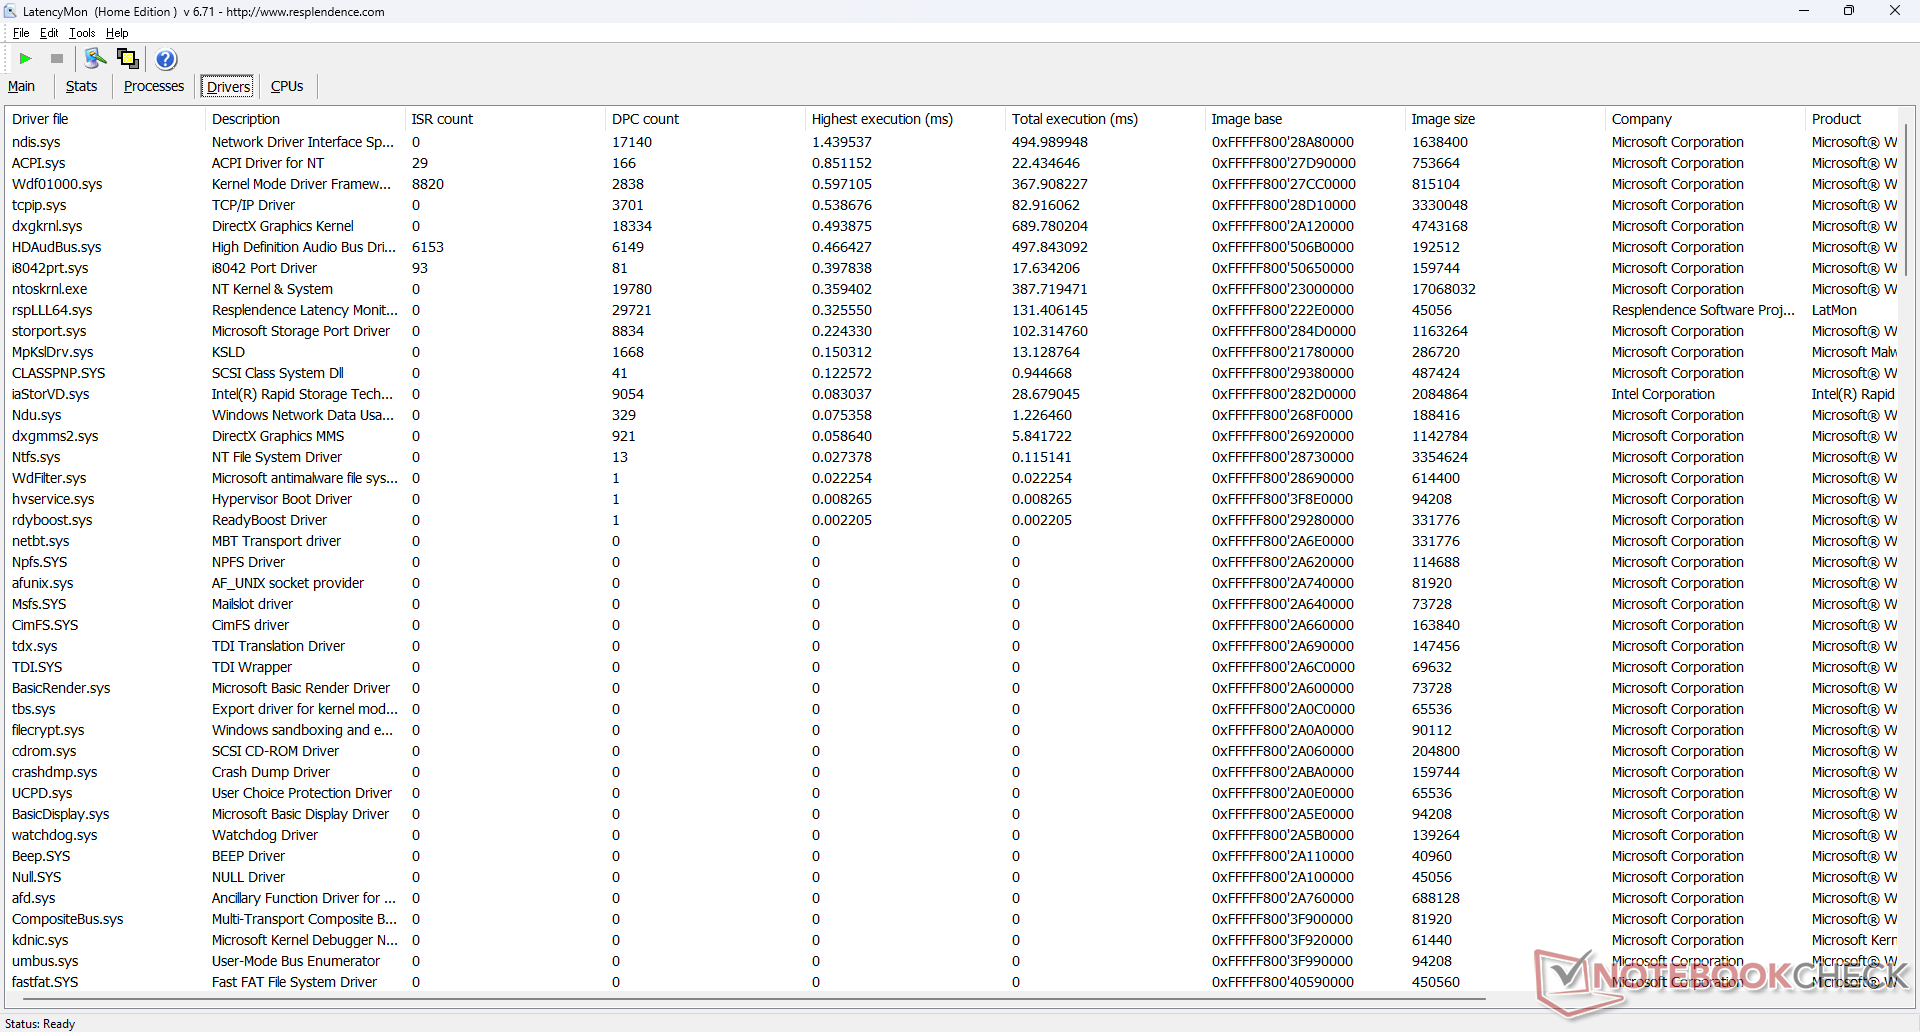
DPC 延迟
在打开我们主页的多个浏览器标签时,LatencyMon 会显示轻微的 DPC 问题。60 FPS 的 4K 视频回放也不尽如人意,在 60 秒的时间窗口内,即使多次重试,也至少有几帧跳过。
| DPC Latencies / LatencyMon - interrupt to process latency (max), Web, Youtube, Prime95 | |
| Acer Enduro Urban N3 EUN314 | |
| Getac S410 G5 | |
| Durabook S15 | |
| Panasonic Toughbook 40 | |
| Durabook S15ABG2 | |
* ... smaller is better
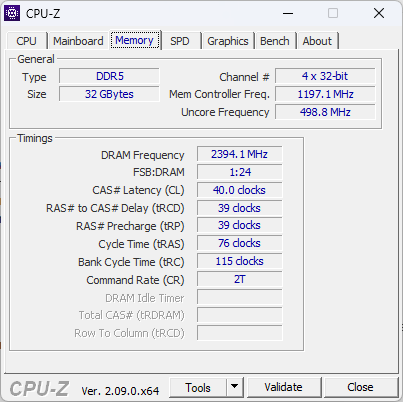
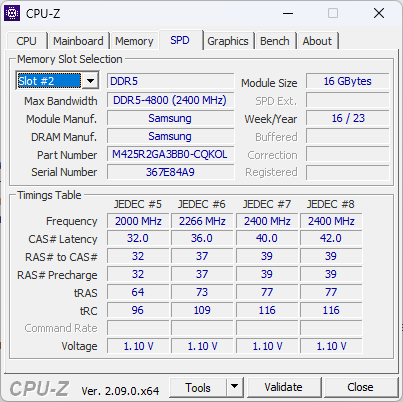
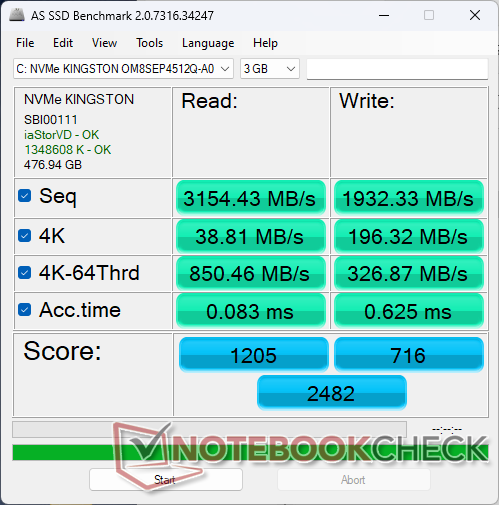
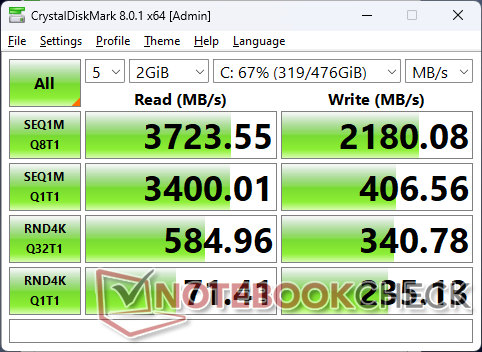
存储设备
我们的设备随附 金士顿 OM8SEP4512Q-AAPCIe4 NVMe SSD 的连续读取和写入速度分别约为 3300 MB/s 和 2200 MB/s。该硬盘在压力下保持这些最高速度没有任何问题。


| Drive Performance rating - Percent | |
| Acer Enduro Urban N3 EUN314 | |
| Getac S410 G5 | |
| Panasonic Toughbook 40 | |
| Durabook S15 | |
| Dell Latitude 5420 Rugged-P85G -8! | |
| Durabook S15ABG2 | |
| DiskSpd | |
| seq read | |
| Durabook S15 | |
| Getac S410 G5 | |
| Panasonic Toughbook 40 | |
| Acer Enduro Urban N3 EUN314 | |
| Durabook S15ABG2 | |
| seq write | |
| Panasonic Toughbook 40 | |
| Acer Enduro Urban N3 EUN314 | |
| Getac S410 G5 | |
| Durabook S15 | |
| Durabook S15ABG2 | |
| seq q8 t1 read | |
| Getac S410 G5 | |
| Durabook S15 | |
| Panasonic Toughbook 40 | |
| Acer Enduro Urban N3 EUN314 | |
| Durabook S15ABG2 | |
| seq q8 t1 write | |
| Durabook S15 | |
| Getac S410 G5 | |
| Panasonic Toughbook 40 | |
| Acer Enduro Urban N3 EUN314 | |
| Durabook S15ABG2 | |
| 4k q1 t1 read | |
| Panasonic Toughbook 40 | |
| Acer Enduro Urban N3 EUN314 | |
| Getac S410 G5 | |
| Durabook S15 | |
| Durabook S15ABG2 | |
| 4k q1 t1 write | |
| Durabook S15 | |
| Acer Enduro Urban N3 EUN314 | |
| Getac S410 G5 | |
| Panasonic Toughbook 40 | |
| Durabook S15ABG2 | |
| 4k q32 t16 read | |
| Acer Enduro Urban N3 EUN314 | |
| Durabook S15 | |
| Panasonic Toughbook 40 | |
| Getac S410 G5 | |
| Durabook S15ABG2 | |
| 4k q32 t16 write | |
| Acer Enduro Urban N3 EUN314 | |
| Durabook S15 | |
| Getac S410 G5 | |
| Panasonic Toughbook 40 | |
| Durabook S15ABG2 | |
* ... smaller is better
Disk Throttling: DiskSpd Read Loop, Queue Depth 8
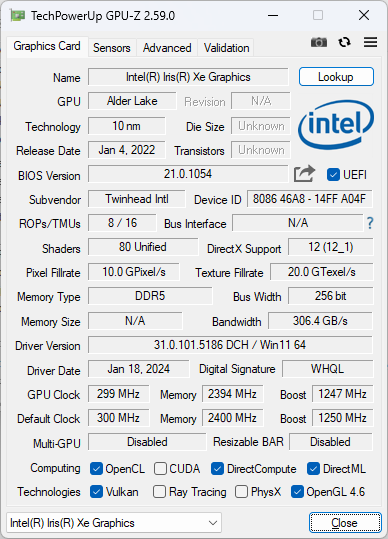
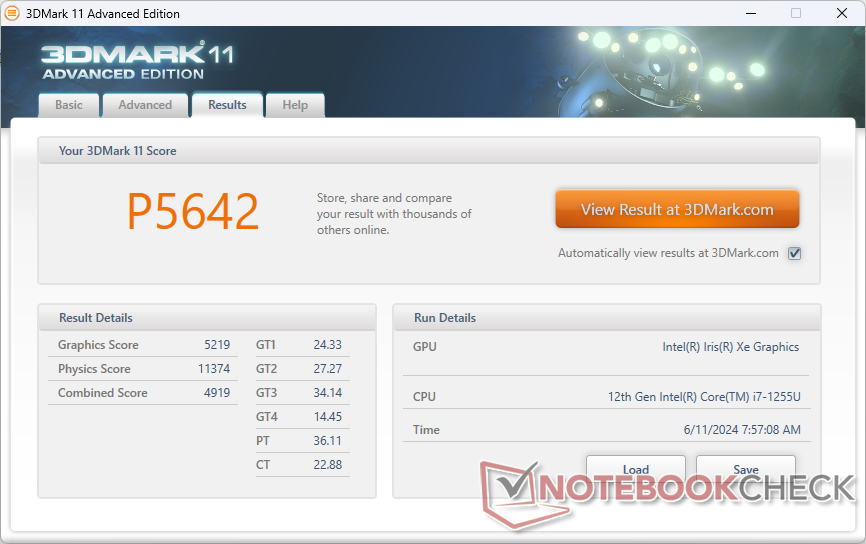
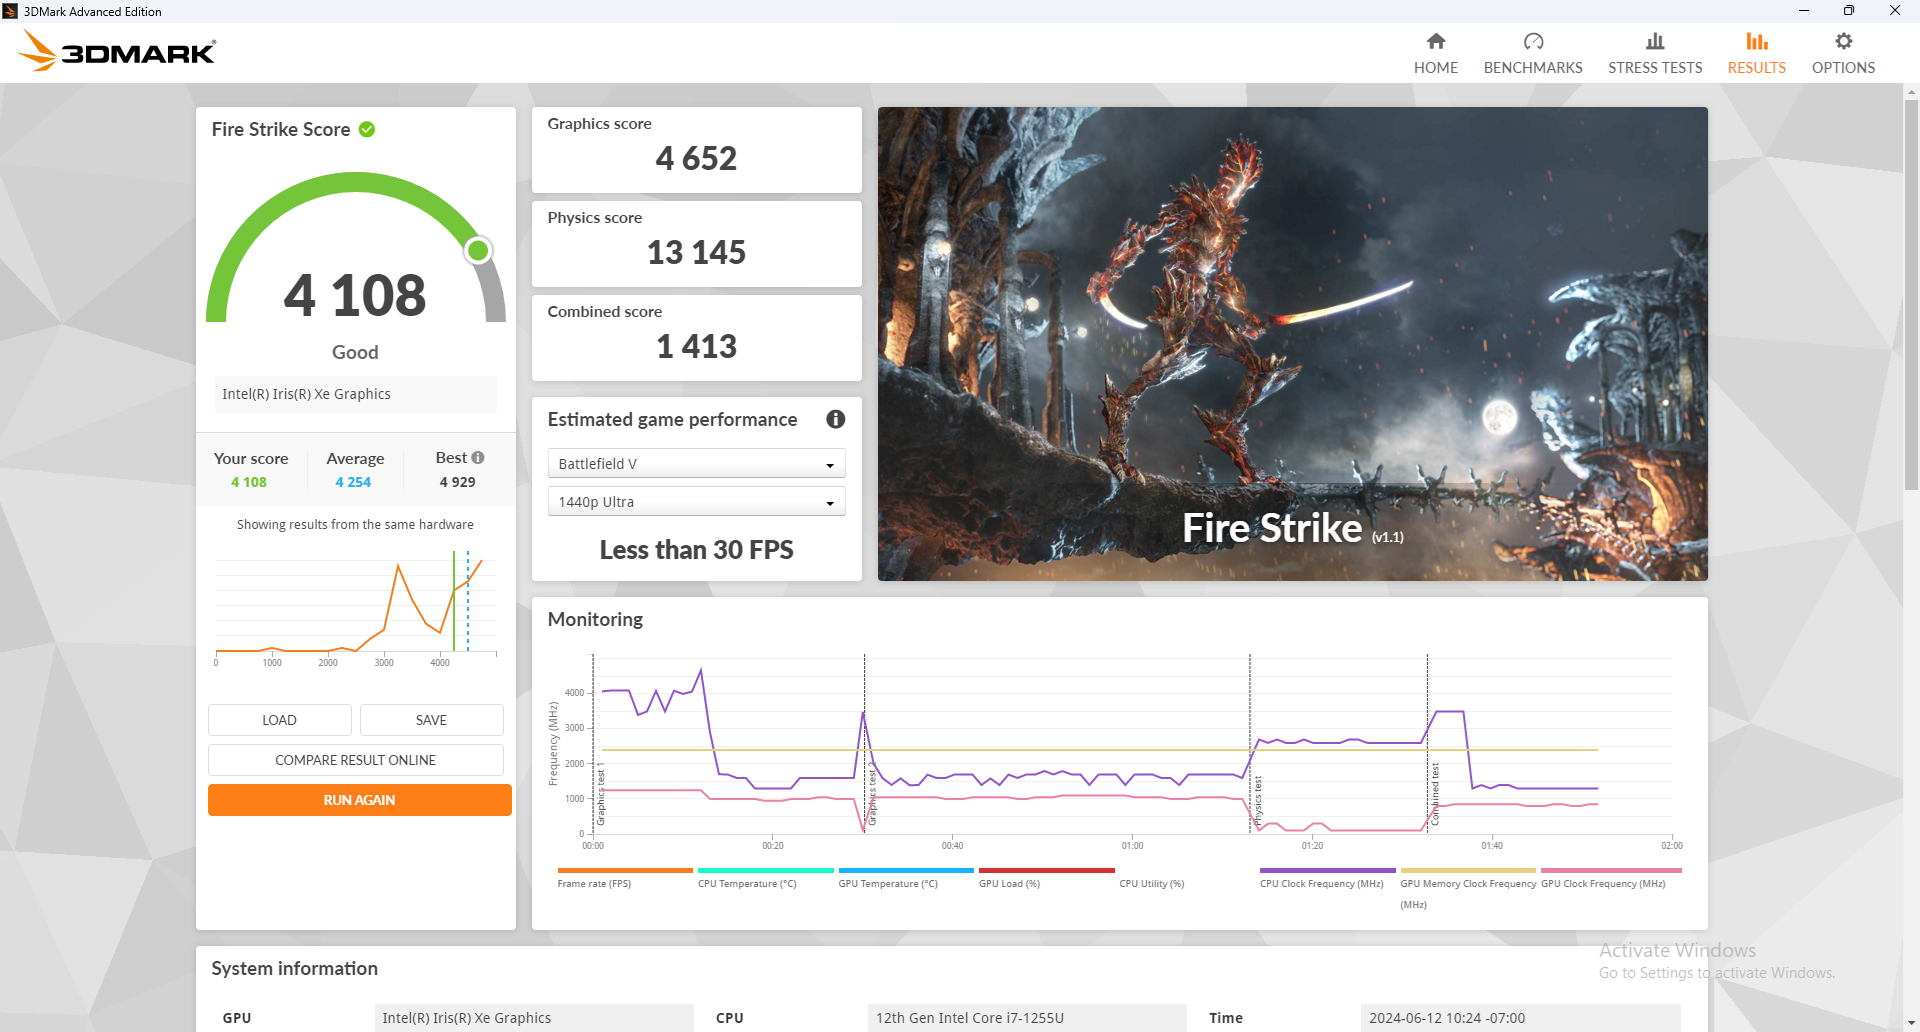
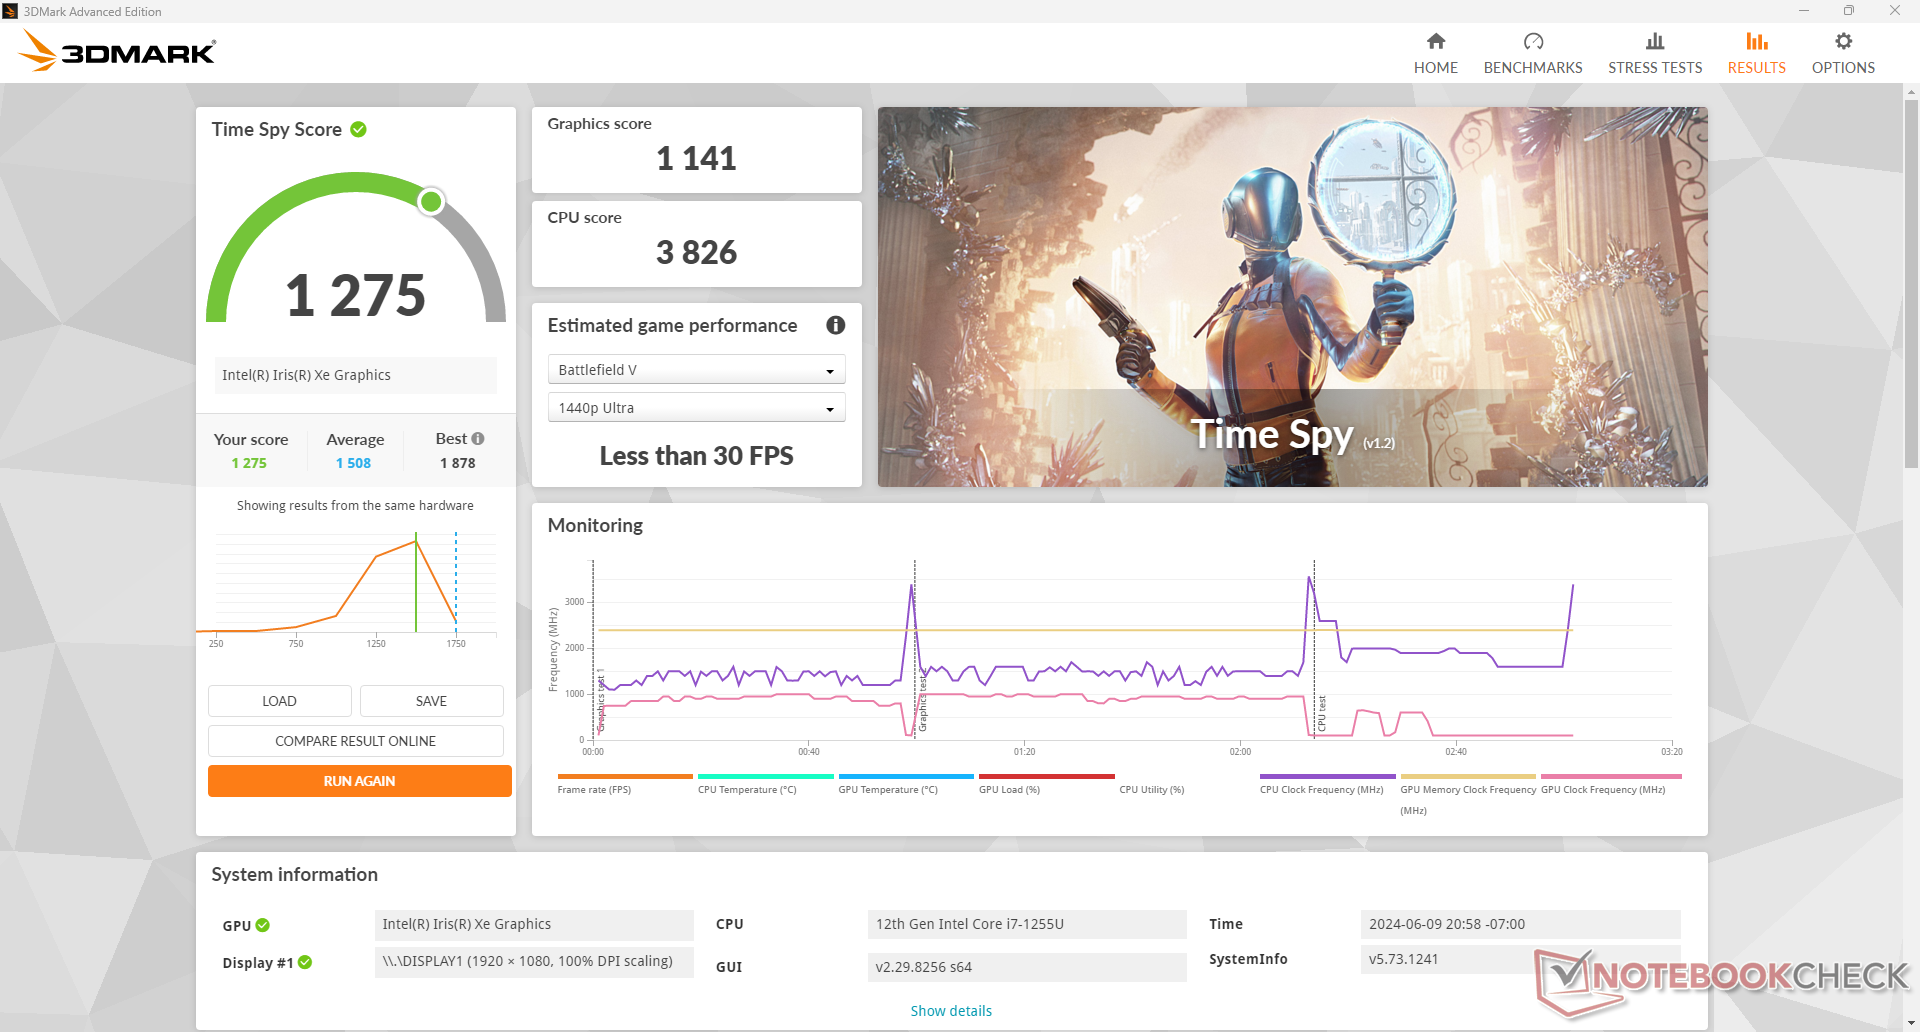
GPU 性能 - Iris Xe 开始显老
该型号采用了与 Iris Xe 相同的集成 Iris Xe 图形处理器,整体图形性能仅略有提升。大多数坚固耐用的笔记本电脑尚未过渡到集成 Arc 系列的 Meteor Lake,但 2024 S15 仍大大领先于现在已经过时的 UHD Graphics 620的 2 倍到 4 倍。
Nvidia Nvidia Quadro T1000为需要独立显卡的用户提供了可选配置。
| 电源配置文件 | 图形得分 | 物理得分 | 综合得分 |
| 性能模式 | 4652 | 13145 | 1413 |
| 均衡模式 | 4119 (-15%) | 11865 (-10%) | 1312 (-7%) |
| 电池电量 | 3958 (-15%) | 12722 (-3%) | 1314 (-7%) |
如Fire Strike 上表所示,使用平衡模式或电池供电可能会影响性能达 10%至 15%。
| 3DMark Performance rating - Percent | |
| Lenovo ThinkPad P1 2019-20QT000RGE | |
| Dell Latitude 7330 Rugged Extreme | |
| Getac S410 G5 | |
| Acer Enduro Urban N3 EUN314 | |
| Average Intel Iris Xe Graphics G7 96EUs | |
| Panasonic Toughbook FZ-55 MK2 | |
| Getac S410 Gen 4 | |
| Panasonic Toughbook 40 | |
| Durabook S15 | |
| Durabook S14I | |
| Dell Latitude 5420 Rugged-P85G | |
| Getac B360 | |
| Getac S410 -4! | |
| Durabook S15ABG2 | |
| 3DMark 11 - 1280x720 Performance GPU | |
| Lenovo ThinkPad P1 2019-20QT000RGE | |
| Acer Enduro Urban N3 EUN314 | |
| Dell Latitude 7330 Rugged Extreme | |
| Panasonic Toughbook FZ-55 MK2 | |
| Getac S410 Gen 4 | |
| Getac S410 G5 | |
| Panasonic Toughbook 40 | |
| Average Intel Iris Xe Graphics G7 96EUs (2867 - 7676, n=209) | |
| Durabook S15 | |
| Durabook S14I | |
| Dell Latitude 5420 Rugged-P85G | |
| Getac B360 | |
| Getac S410 | |
| Durabook S15ABG2 | |
| 3DMark 11 Performance | 5642 points | |
| 3DMark Cloud Gate Standard Score | 14383 points | |
| 3DMark Fire Strike Score | 4108 points | |
| 3DMark Time Spy Score | 1275 points | |
Help | ||
| Blender - v3.3 Classroom CPU | |
| Durabook S15 | |
| Average Intel Iris Xe Graphics G7 96EUs (336 - 1259, n=109) | |
| Getac S410 G5 | |
* ... smaller is better
| Performance rating - Percent | |
| Getac S410 G5 | |
| Acer Enduro Urban N3 EUN314 | |
| Panasonic Toughbook 40 -2! | |
| Durabook S15 -1! | |
| Durabook S15ABG2 -4! | |
| Dell Latitude 5420 Rugged-P85G -4! | |
| The Witcher 3 - 1920x1080 Ultra Graphics & Postprocessing (HBAO+) | |
| Getac S410 G5 | |
| Panasonic Toughbook 40 | |
| Acer Enduro Urban N3 EUN314 | |
| Durabook S15 | |
| Dell Latitude 5420 Rugged-P85G | |
| GTA V - 1920x1080 Highest AA:4xMSAA + FX AF:16x | |
| Getac S410 G5 | |
| Acer Enduro Urban N3 EUN314 | |
| Final Fantasy XV Benchmark - 1920x1080 High Quality | |
| Acer Enduro Urban N3 EUN314 | |
| Getac S410 G5 | |
| Panasonic Toughbook 40 | |
| Durabook S15 | |
| Dell Latitude 5420 Rugged-P85G | |
| Strange Brigade - 1920x1080 ultra AA:ultra AF:16 | |
| Getac S410 G5 | |
| Acer Enduro Urban N3 EUN314 | |
| Durabook S15 | |
| Dota 2 Reborn - 1920x1080 ultra (3/3) best looking | |
| Panasonic Toughbook 40 | |
| Getac S410 G5 | |
| Durabook S15 | |
| Acer Enduro Urban N3 EUN314 | |
| Durabook S15ABG2 | |
| X-Plane 11.11 - 1920x1080 high (fps_test=3) | |
| Acer Enduro Urban N3 EUN314 | |
| Getac S410 G5 | |
| Durabook S15 | |
| Panasonic Toughbook 40 | |
| Durabook S15ABG2 | |
| Far Cry 5 | |
| 1280x720 Low Preset AA:T | |
| Acer Enduro Urban N3 EUN314 | |
| Average Intel Iris Xe Graphics G7 96EUs (23 - 75, n=93) | |
| Dell Latitude 5420 Rugged-P85G | |
| Durabook S15 | |
| 1920x1080 Medium Preset AA:T | |
| Average Intel Iris Xe Graphics G7 96EUs (14 - 39, n=91) | |
| Dell Latitude 5420 Rugged-P85G | |
| Acer Enduro Urban N3 EUN314 | |
| Durabook S15 | |
| 1920x1080 High Preset AA:T | |
| Average Intel Iris Xe Graphics G7 96EUs (10 - 35, n=89) | |
| Dell Latitude 5420 Rugged-P85G | |
| Acer Enduro Urban N3 EUN314 | |
| Durabook S15 | |
| 1920x1080 Ultra Preset AA:T | |
| Average Intel Iris Xe Graphics G7 96EUs (11 - 33, n=75) | |
| Acer Enduro Urban N3 EUN314 | |
| Durabook S15 | |
| Dell Latitude 5420 Rugged-P85G | |
| Final Fantasy XV Benchmark | |
| 1280x720 Lite Quality | |
| Dell Latitude 7330 Rugged Extreme | |
| Panasonic Toughbook FZ-55 MK2 | |
| Getac S410 G5 | |
| Panasonic Toughbook 40 | |
| Acer Enduro Urban N3 EUN314 | |
| Average Intel Iris Xe Graphics G7 96EUs (14.9 - 56.5, n=189) | |
| Getac S410 Gen 4 | |
| Durabook S15 | |
| Durabook S14I | |
| Getac B360 | |
| Dell Latitude 5420 Rugged-P85G | |
| 1920x1080 Standard Quality | |
| Dell Latitude 7330 Rugged Extreme | |
| Acer Enduro Urban N3 EUN314 | |
| Panasonic Toughbook FZ-55 MK2 | |
| Getac S410 G5 | |
| Average Intel Iris Xe Graphics G7 96EUs (10.5 - 31.2, n=185) | |
| Panasonic Toughbook 40 | |
| Getac S410 Gen 4 | |
| Durabook S15 | |
| Durabook S14I | |
| Getac B360 | |
| Dell Latitude 5420 Rugged-P85G | |
| 1920x1080 High Quality | |
| Dell Latitude 7330 Rugged Extreme | |
| Average Intel Iris Xe Graphics G7 96EUs (8.15 - 27.8, n=178) | |
| Acer Enduro Urban N3 EUN314 | |
| Getac S410 G5 | |
| Panasonic Toughbook FZ-55 MK2 | |
| Panasonic Toughbook 40 | |
| Getac S410 Gen 4 | |
| Durabook S15 | |
| Durabook S14I | |
| Getac B360 | |
| Dell Latitude 5420 Rugged-P85G | |
| Strange Brigade | |
| 1280x720 lowest AF:1 | |
| Getac S410 G5 | |
| Average Intel Iris Xe Graphics G7 96EUs (48.5 - 115.1, n=172) | |
| Acer Enduro Urban N3 EUN314 | |
| Getac S410 Gen 4 | |
| Durabook S15 | |
| 1920x1080 medium AA:medium AF:4 | |
| Getac S410 G5 | |
| Average Intel Iris Xe Graphics G7 96EUs (18.2 - 51.4, n=170) | |
| Acer Enduro Urban N3 EUN314 | |
| Durabook S15 | |
| Getac S410 Gen 4 | |
| 1920x1080 high AA:high AF:8 | |
| Getac S410 G5 | |
| Average Intel Iris Xe Graphics G7 96EUs (15.4 - 39.8, n=169) | |
| Acer Enduro Urban N3 EUN314 | |
| Getac S410 Gen 4 | |
| Durabook S15 | |
| 1920x1080 ultra AA:ultra AF:16 | |
| Getac S410 G5 | |
| Average Intel Iris Xe Graphics G7 96EUs (13.2 - 31.7, n=167) | |
| Acer Enduro Urban N3 EUN314 | |
| Getac S410 Gen 4 | |
| Durabook S15 | |
| Tiny Tina's Wonderlands | |
| 1280x720 Lowest Preset (DX12) | |
| Average Intel Iris Xe Graphics G7 96EUs (25.9 - 67.3, n=32) | |
| Durabook S15 | |
| 1920x1080 Low Preset (DX12) | |
| Average Intel Iris Xe Graphics G7 96EUs (22.3 - 53, n=32) | |
| Durabook S15 | |
| F1 22 | |
| 1280x720 Ultra Low Preset AA:T AF:16x | |
| Average Intel Iris Xe Graphics G7 96EUs (57.4 - 94.9, n=53) | |
| Durabook S15 | |
| 1920x1080 Low Preset AA:T AF:16x | |
| Average Intel Iris Xe Graphics G7 96EUs (33.3 - 57.2, n=58) | |
| Durabook S15 | |
| 1920x1080 Medium Preset AA:T AF:16x | |
| Average Intel Iris Xe Graphics G7 96EUs (28 - 52.3, n=58) | |
| Durabook S15 | |
| Baldur's Gate 3 | |
| 1280x720 Low Preset AA:SM | |
| Average Intel Iris Xe Graphics G7 96EUs (14.5 - 66.1, n=13) | |
| Durabook S15 | |
| 1920x1080 Low Preset AA:SM | |
| Average Intel Iris Xe Graphics G7 96EUs (9.4 - 29.3, n=13) | |
| Durabook S15 | |
| Cyberpunk 2077 | |
| 1280x720 Low Preset (FSR off) | |
| Average Intel Iris Xe Graphics G7 96EUs (21.4 - 37.3, n=17) | |
| Durabook S15 | |
| 1920x1080 Low Preset (FSR off) | |
| Average Intel Iris Xe Graphics G7 96EUs (13.1 - 22.5, n=17) | |
| Durabook S15 | |
Witcher 3 FPS Chart
| low | med. | high | ultra | |
|---|---|---|---|---|
| The Witcher 3 (2015) | 60.2 | 46 | 24.9 | 12.5 |
| Dota 2 Reborn (2015) | 93.7 | 65.7 | 51.8 | 46.8 |
| Final Fantasy XV Benchmark (2018) | 35.2 | 20.1 | 14.7 | |
| X-Plane 11.11 (2018) | 44.8 | 33.3 | 30.2 | |
| Far Cry 5 (2018) | 23 | 22 | 19 | 19 |
| Strange Brigade (2018) | 73 | 32.4 | 26.7 | 21.9 |
| Tiny Tina's Wonderlands (2022) | 23.4 | |||
| F1 22 (2022) | 34.7 | 29.1 | 22.1 | |
| Baldur's Gate 3 (2023) | 9.4 | |||
| Cyberpunk 2077 (2023) | 14.4 |
排放量
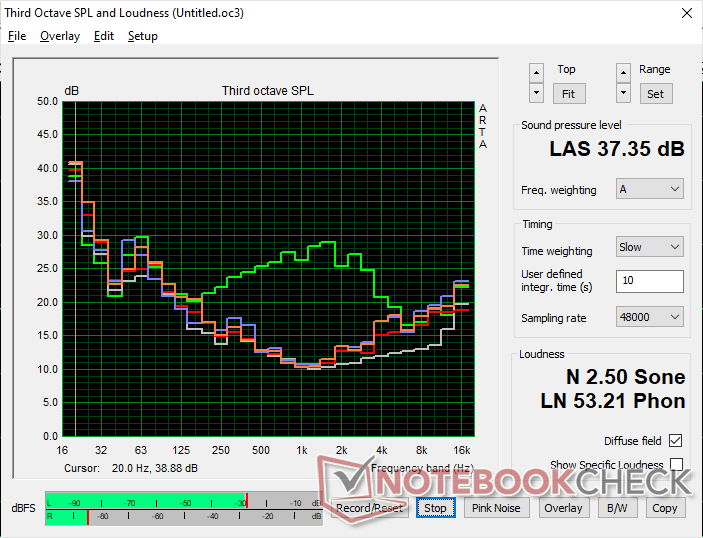
系统噪音
风扇噪音是所有耐用型笔记本电脑中最安静的。在运行游戏或 Prime95 等要求极高的负载时,风扇噪音最高可达 37 dB(A),然后迅速回落到接近安静的 28 dB(A) 范围。这种非常保守的做法与上述低于平均水平的 CPU 性能相得益彰。当考虑到政府或科学应用的受众时,更安静的风扇噪音可能更可取,即使这意味着性能下降。
Noise level
| Idle |
| 26.3 / 26.3 / 26.8 dB(A) |
| Load |
| 27.7 / 37.4 dB(A) |
 | ||
30 dB silent 40 dB(A) audible 50 dB(A) loud |
||
min: | ||
| Durabook S15 Iris Xe G7 96EUs, i7-1255U, Kingston OM8SEP4512Q-AA | Durabook S15ABG2 UHD Graphics 620, i5-8265U, UDinfo HF3-25UB HF325UB256GBA2P | Panasonic Toughbook 40 Iris Xe G7 96EUs, i7-1185G7, Samsung PM991 MZVLQ1T0HALB | Getac S410 G5 Iris Xe G7 80EUs, i5-1350P, SSSTC CL4-8D512 | Dell Latitude 5420 Rugged-P85G Radeon RX 540, i7-8650U, SK hynix PC401 NVMe 500 GB | Acer Enduro Urban N3 EUN314 Iris Xe G7 96EUs, i7-1165G7, Samsung PM991 MZVLQ1T0HALB | |
|---|---|---|---|---|---|---|
| Noise | -13% | -10% | -12% | -8% | -1% | |
| off / environment * (dB) | 24.6 | 29.3 -19% | 22.8 7% | 23.4 5% | 28.3 -15% | 23.8 3% |
| Idle Minimum * (dB) | 26.3 | 29.3 -11% | 26 1% | 23.4 11% | 28.3 -8% | 24.1 8% |
| Idle Average * (dB) | 26.3 | 29.3 -11% | 26 1% | 25.9 2% | 28.3 -8% | 24.1 8% |
| Idle Maximum * (dB) | 26.8 | 29.3 -9% | 26 3% | 26 3% | 28.3 -6% | 24.1 10% |
| Load Average * (dB) | 27.7 | 35.5 -28% | 37.6 -36% | 38.7 -40% | 29.9 -8% | 27.9 -1% |
| Witcher 3 ultra * (dB) | 27.4 | 37.8 -38% | 42.1 -54% | 35.7 -30% | ||
| Load Maximum * (dB) | 37.4 | 38 -2% | 40.3 -8% | 42.1 -13% | 38 -2% | 38.6 -3% |
* ... smaller is better
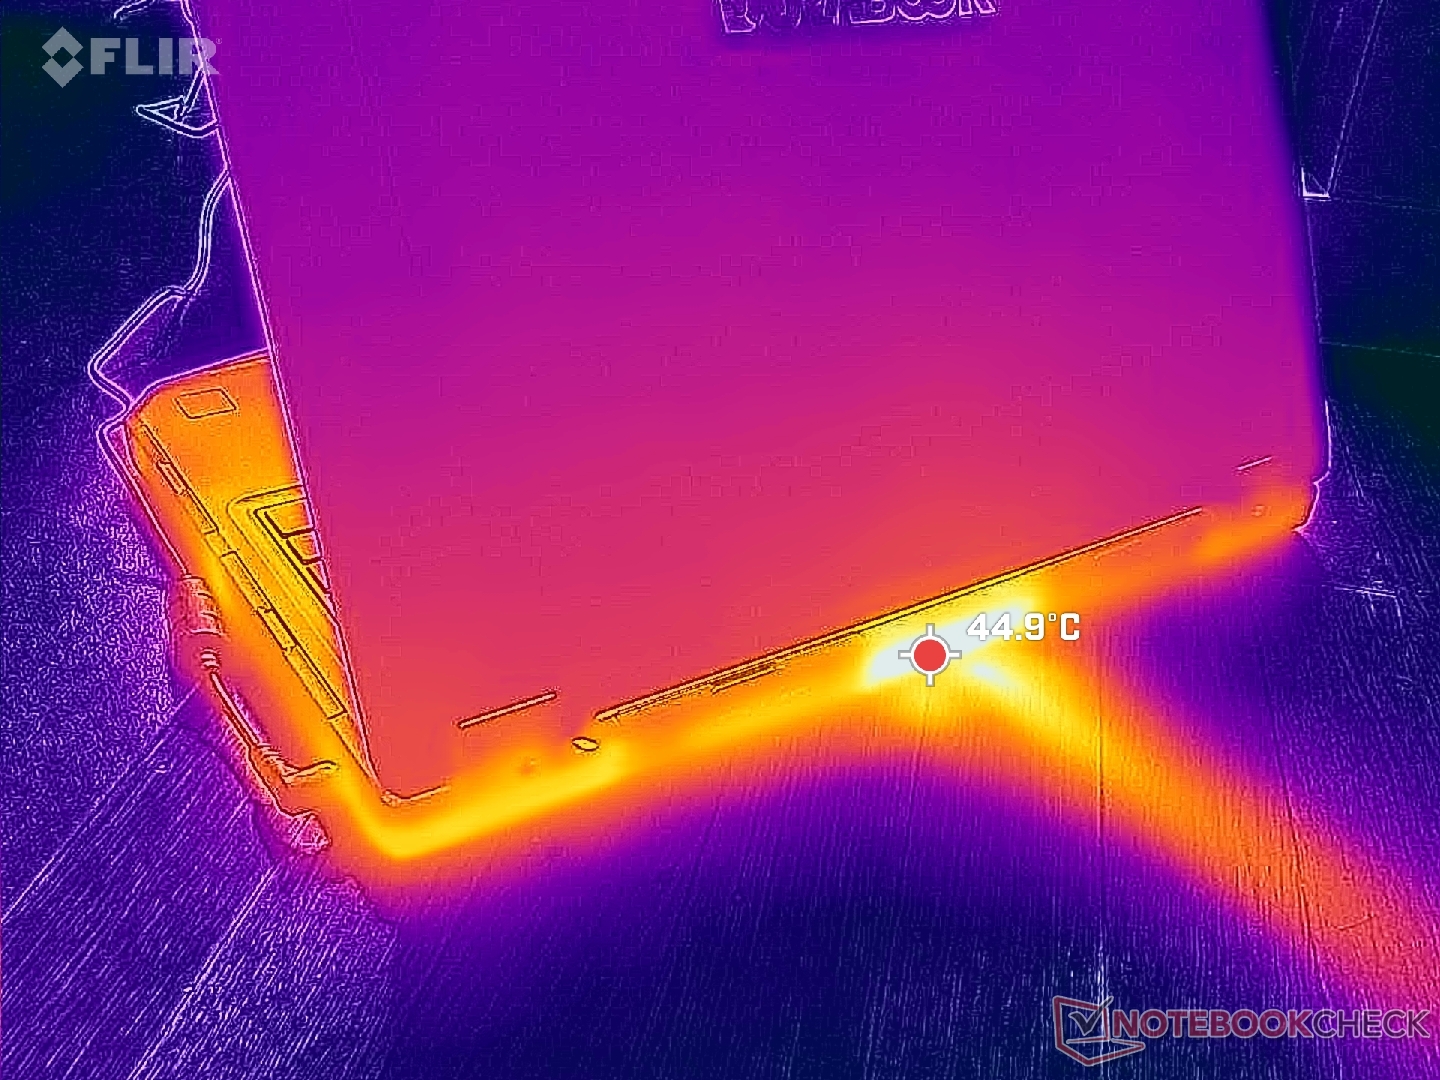
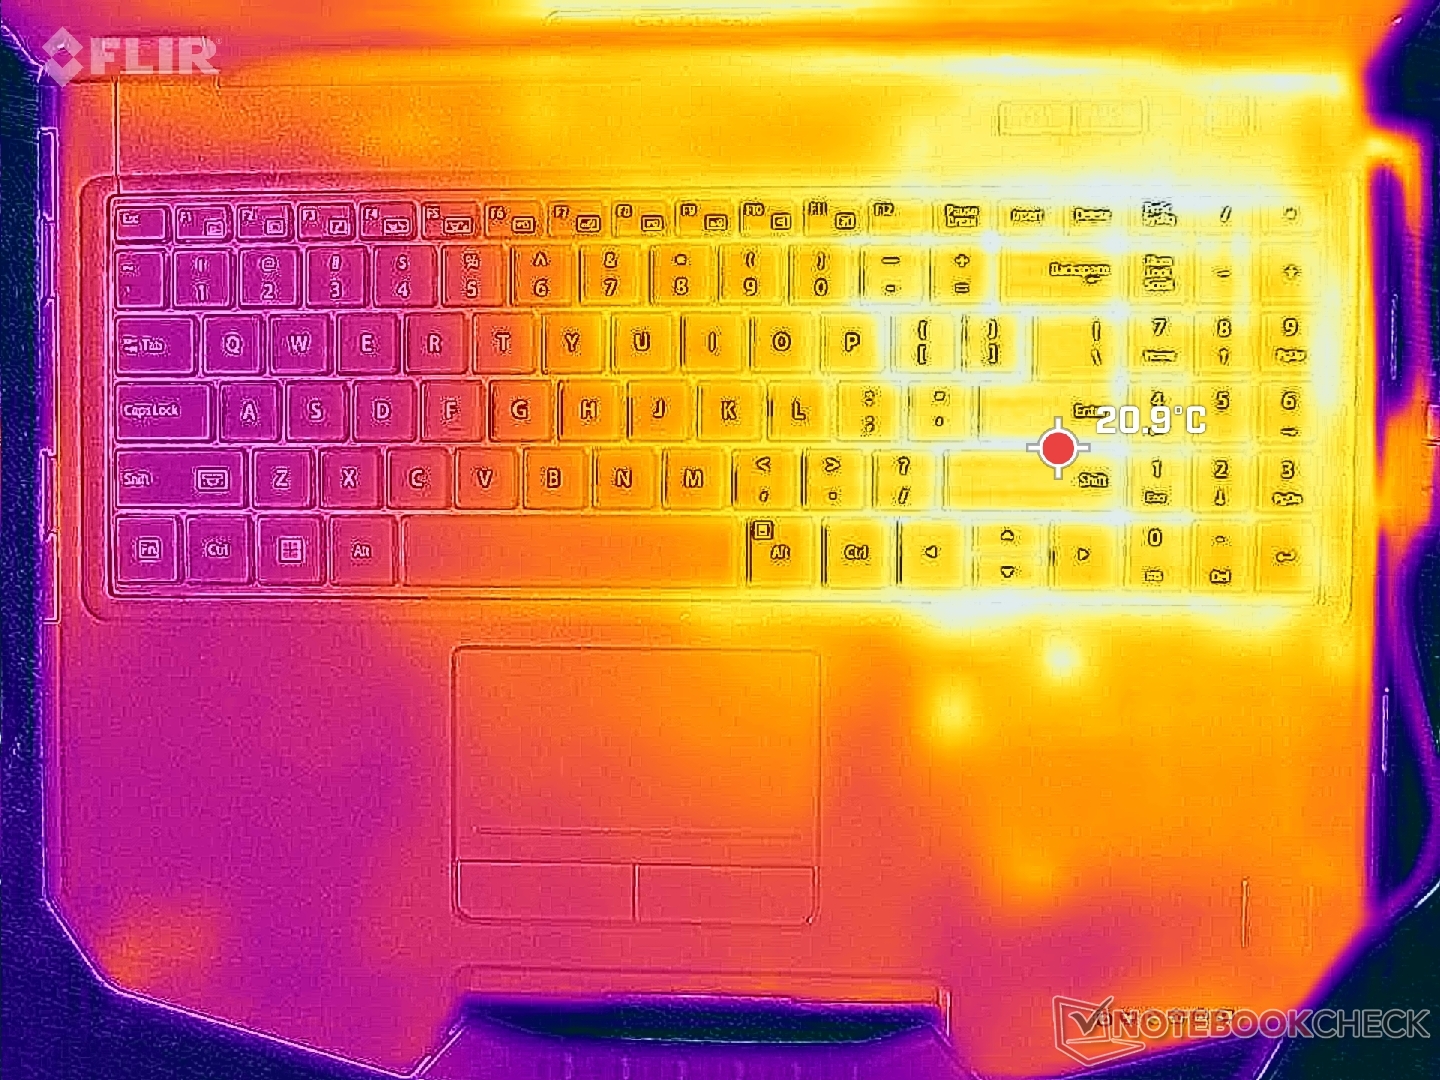
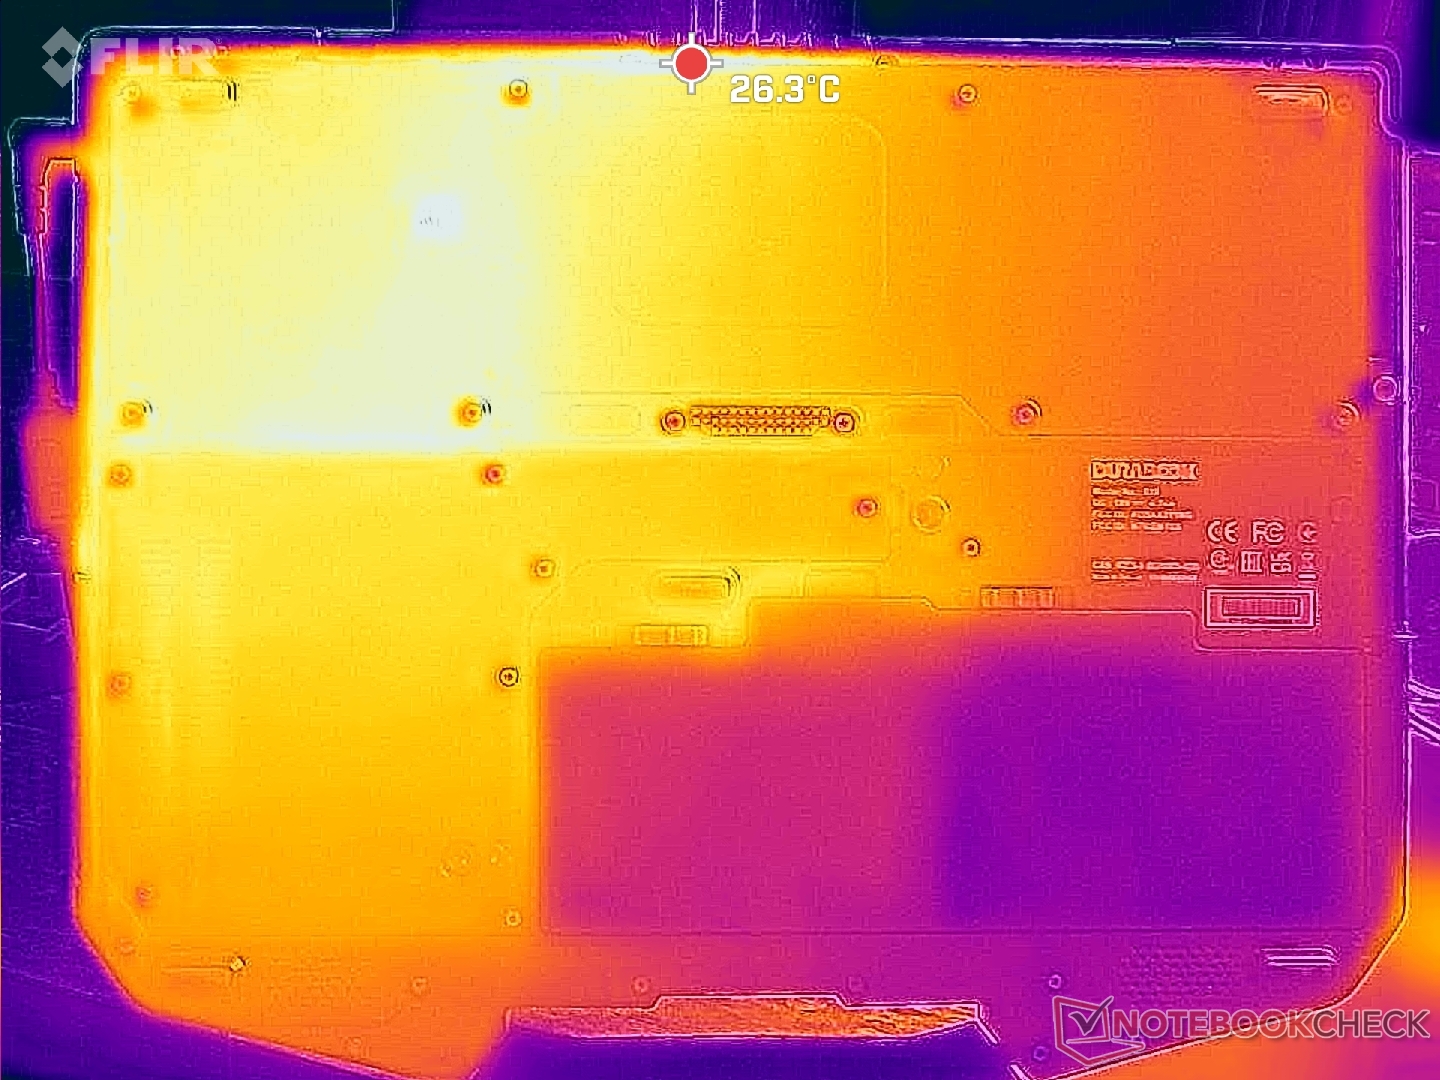
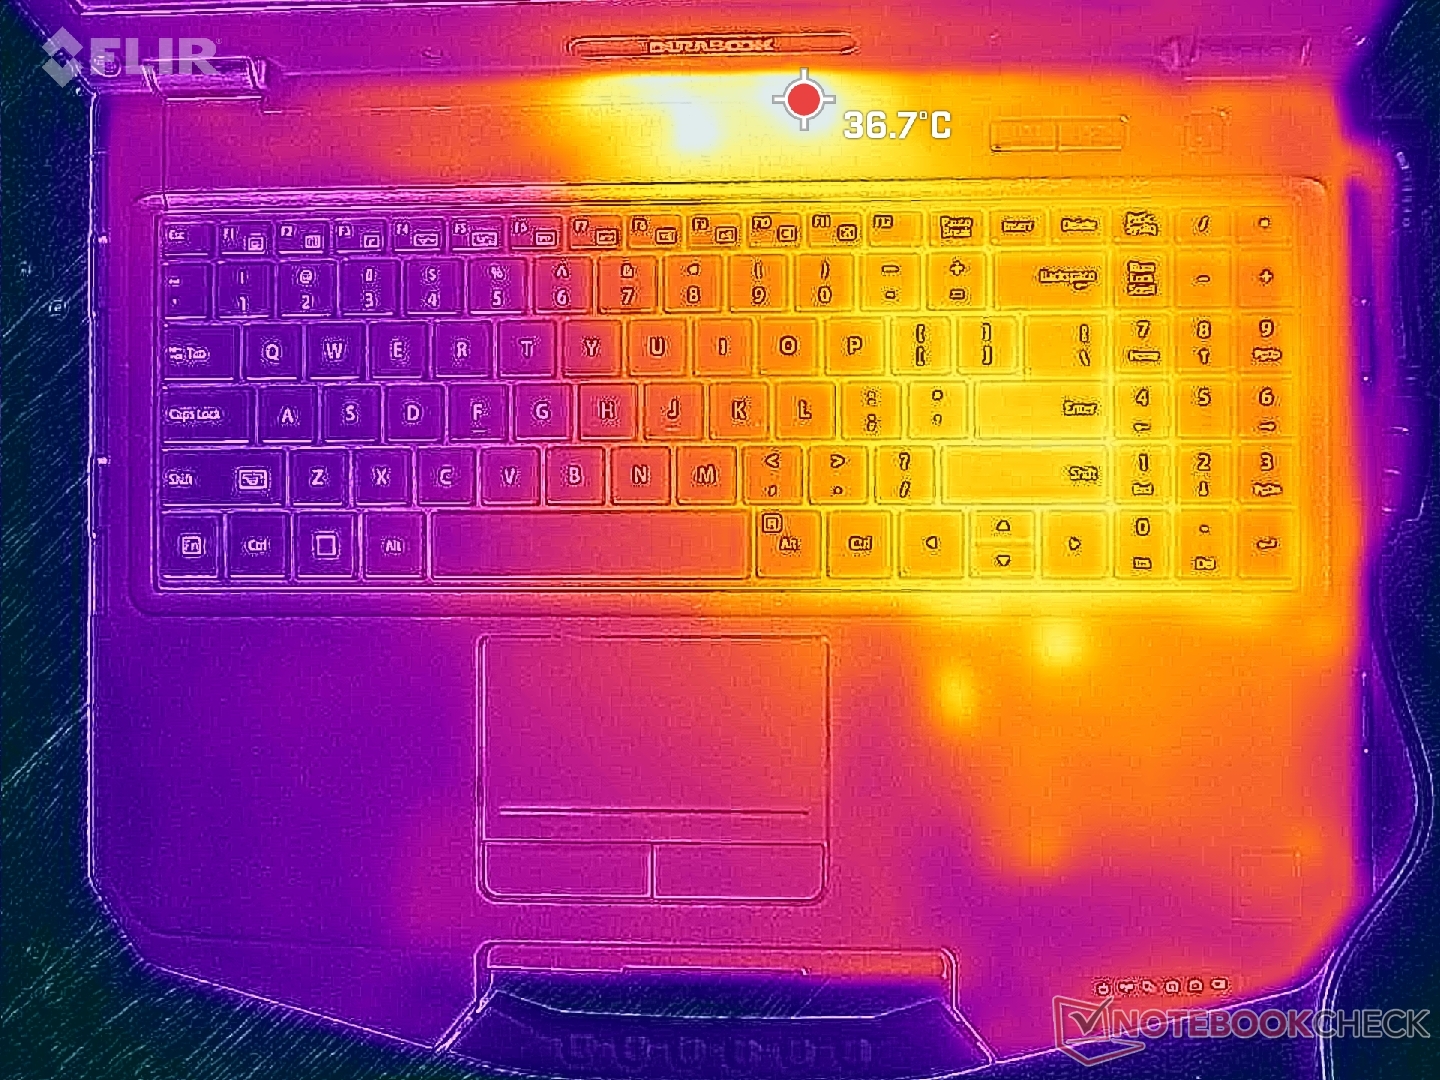
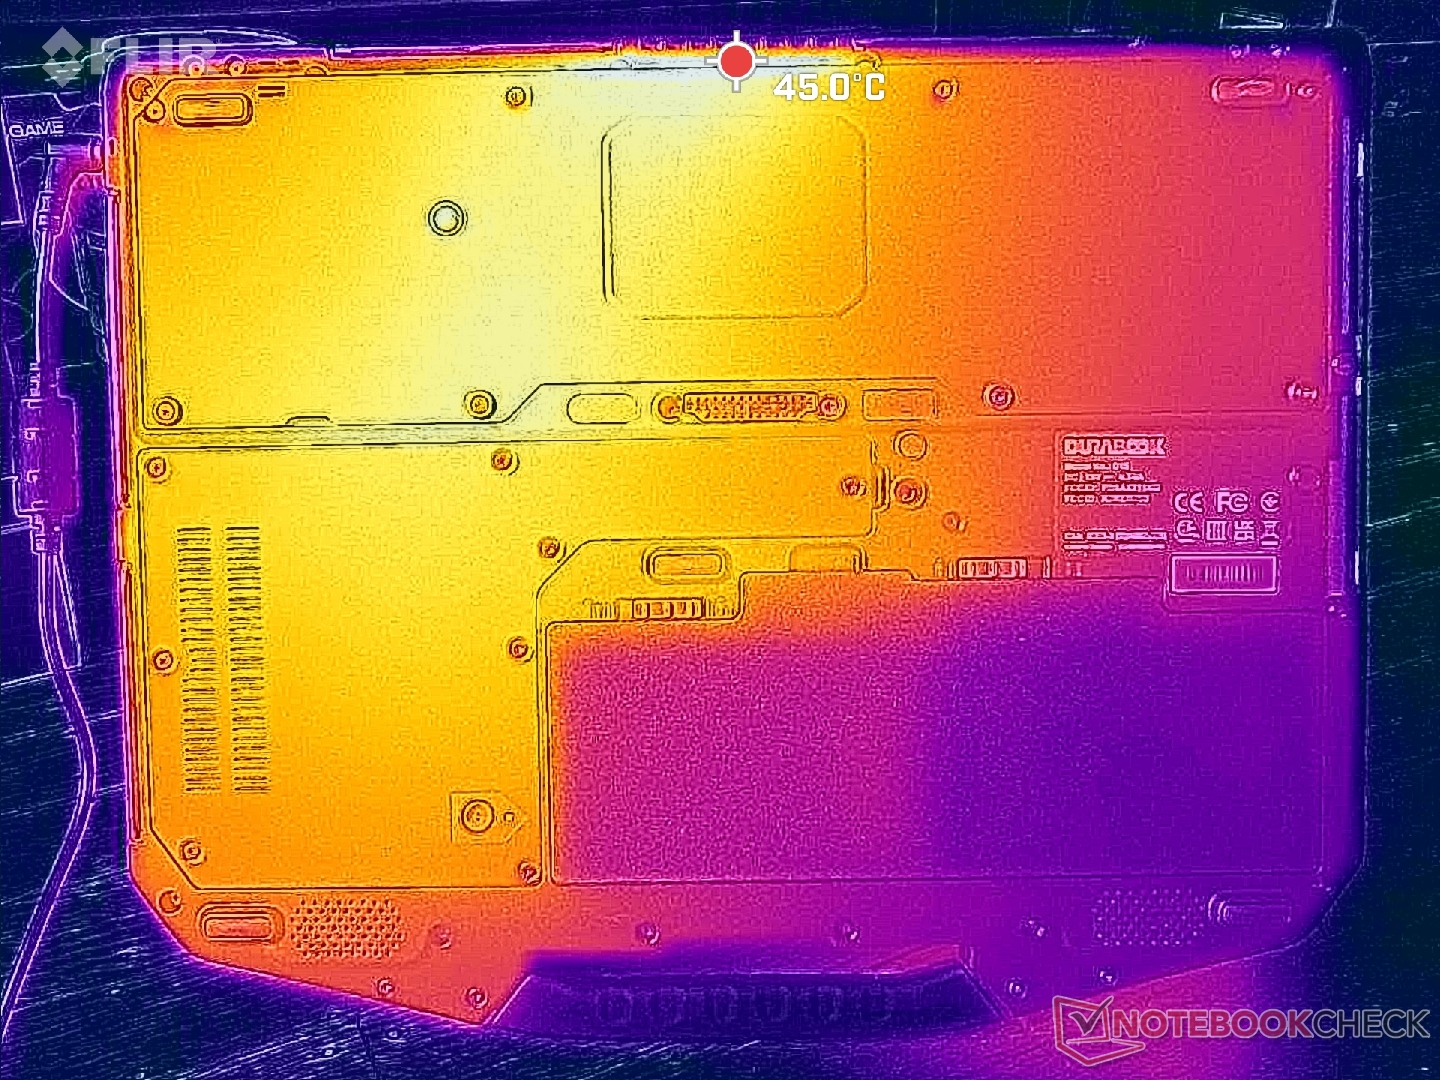
温度
由于电池和冷却解决方案的位置关系,系统右半部分的温度总是高于左半部分。底部的热点温度可达到 40 摄氏度以上,这与较厚较重的 松下 Toughbook 40或较旧的 Durabook S15ABG2 相似。
(+) The maximum temperature on the upper side is 38.6 °C / 101 F, compared to the average of 34.3 °C / 94 F, ranging from 21.2 to 62.5 °C for the class Office.
(±) The bottom heats up to a maximum of 41 °C / 106 F, compared to the average of 36.8 °C / 98 F
(+) In idle usage, the average temperature for the upper side is 26.6 °C / 80 F, compared to the device average of 29.5 °C / 85 F.
(+) The palmrests and touchpad are reaching skin temperature as a maximum (32.6 °C / 90.7 F) and are therefore not hot.
(-) The average temperature of the palmrest area of similar devices was 27.5 °C / 81.5 F (-5.1 °C / -9.2 F).
| Durabook S15 Intel Core i7-1255U, Intel Iris Xe Graphics G7 96EUs | Durabook S15ABG2 Intel Core i5-8265U, Intel UHD Graphics 620 | Panasonic Toughbook 40 Intel Core i7-1185G7, Intel Iris Xe Graphics G7 96EUs | Getac S410 G5 Intel Core i5-1350P, Intel Iris Xe Graphics G7 80EUs | Dell Latitude 5420 Rugged-P85G Intel Core i7-8650U, AMD Radeon RX 540 | Acer Enduro Urban N3 EUN314 Intel Core i7-1165G7, Intel Iris Xe Graphics G7 96EUs | |
|---|---|---|---|---|---|---|
| Heat | -3% | 4% | -1% | -6% | 1% | |
| Maximum Upper Side * (°C) | 38.6 | 44 -14% | 35.6 8% | 37 4% | 42.2 -9% | 37.8 2% |
| Maximum Bottom * (°C) | 41 | 42 -2% | 40 2% | 42.2 -3% | 42 -2% | 45.8 -12% |
| Idle Upper Side * (°C) | 28.8 | 28 3% | 28.6 1% | 28.8 -0% | 31.6 -10% | 26.4 8% |
| Idle Bottom * (°C) | 31.4 | 30.6 3% | 29.4 6% | 33 -5% | 31.8 -1% | 30.2 4% |
* ... smaller is better
发言人
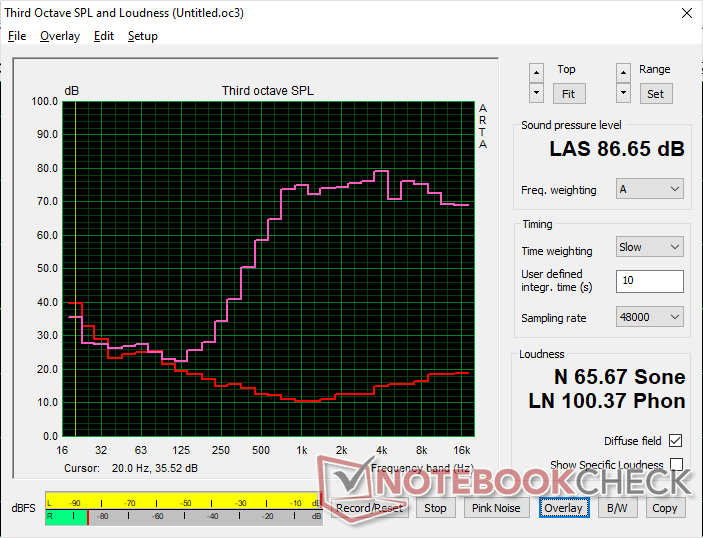
Durabook S15 audio analysis
(+) | speakers can play relatively loud (86.7 dB)
Bass 100 - 315 Hz
(-) | nearly no bass - on average 41.6% lower than median
(+) | bass is linear (6.3% delta to prev. frequency)
Mids 400 - 2000 Hz
(±) | reduced mids - on average 6.7% lower than median
(±) | linearity of mids is average (8.8% delta to prev. frequency)
Highs 2 - 16 kHz
(+) | balanced highs - only 4.4% away from median
(+) | highs are linear (5.7% delta to prev. frequency)
Overall 100 - 16.000 Hz
(±) | linearity of overall sound is average (25.8% difference to median)
Compared to same class
» 78% of all tested devices in this class were better, 7% similar, 15% worse
» The best had a delta of 7%, average was 21%, worst was 53%
Compared to all devices tested
» 79% of all tested devices were better, 4% similar, 17% worse
» The best had a delta of 4%, average was 24%, worst was 134%
Apple MacBook Pro 16 2021 M1 Pro audio analysis
(+) | speakers can play relatively loud (84.7 dB)
Bass 100 - 315 Hz
(+) | good bass - only 3.8% away from median
(+) | bass is linear (5.2% delta to prev. frequency)
Mids 400 - 2000 Hz
(+) | balanced mids - only 1.3% away from median
(+) | mids are linear (2.1% delta to prev. frequency)
Highs 2 - 16 kHz
(+) | balanced highs - only 1.9% away from median
(+) | highs are linear (2.7% delta to prev. frequency)
Overall 100 - 16.000 Hz
(+) | overall sound is linear (4.6% difference to median)
Compared to same class
» 0% of all tested devices in this class were better, 0% similar, 100% worse
» The best had a delta of 5%, average was 17%, worst was 45%
Compared to all devices tested
» 0% of all tested devices were better, 0% similar, 100% worse
» The best had a delta of 4%, average was 24%, worst was 134%
能源管理
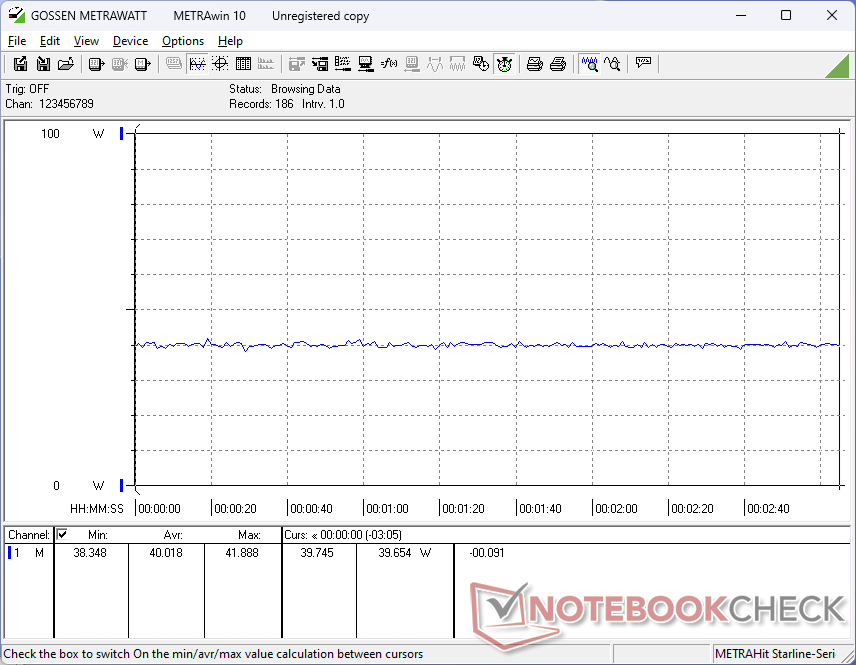
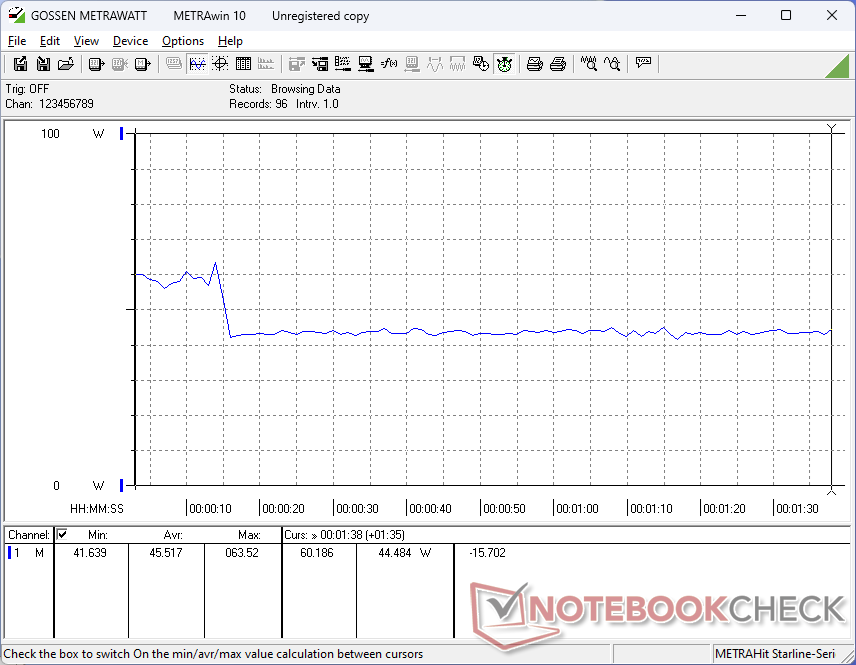
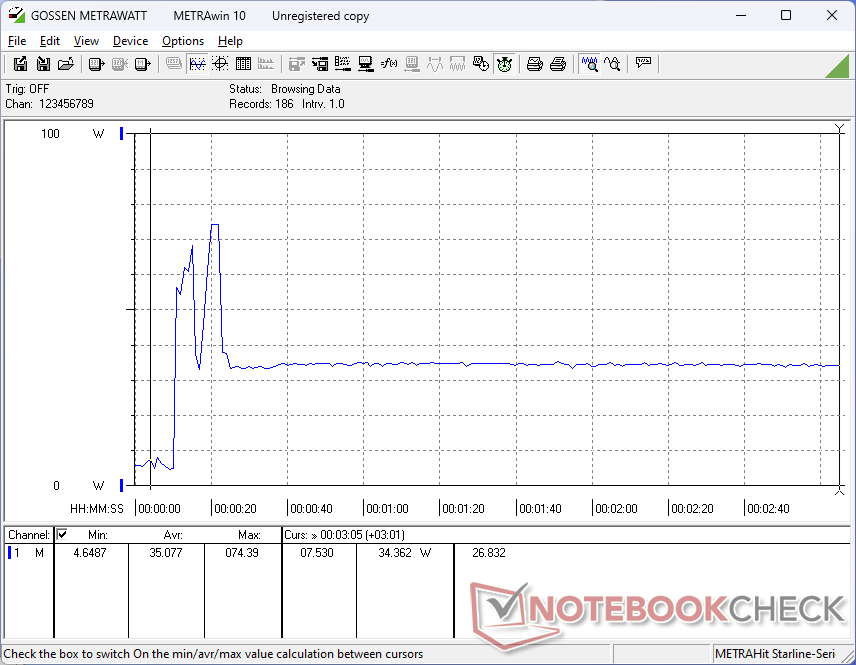
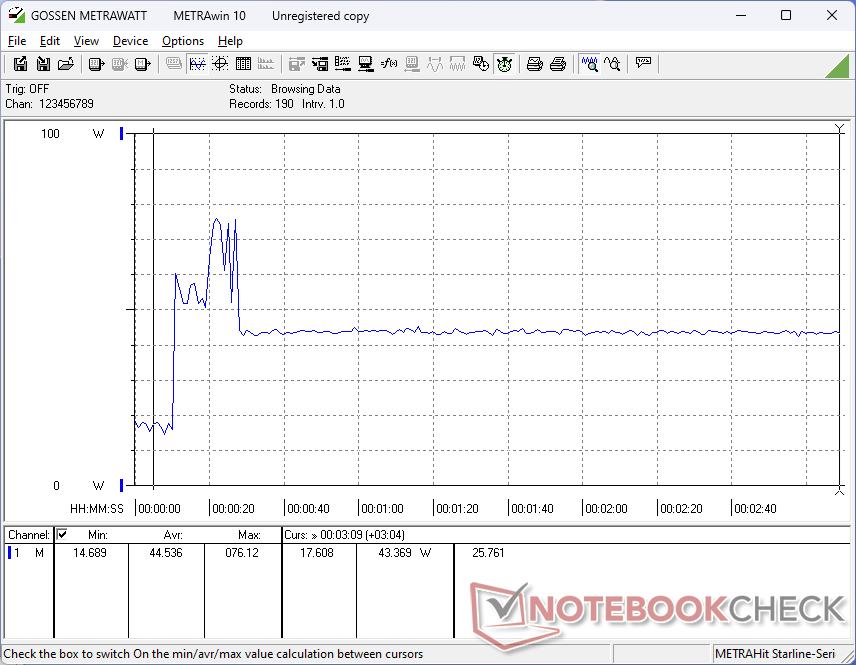
耗电量
台式机的空转功耗在 4 W 到 16 W 之间,明显高于 2020 S15ABG2。不过,功耗增加可能是由于 S15 的显示屏亮度更高,最低亮度和最高亮度之间相差约 10 W。
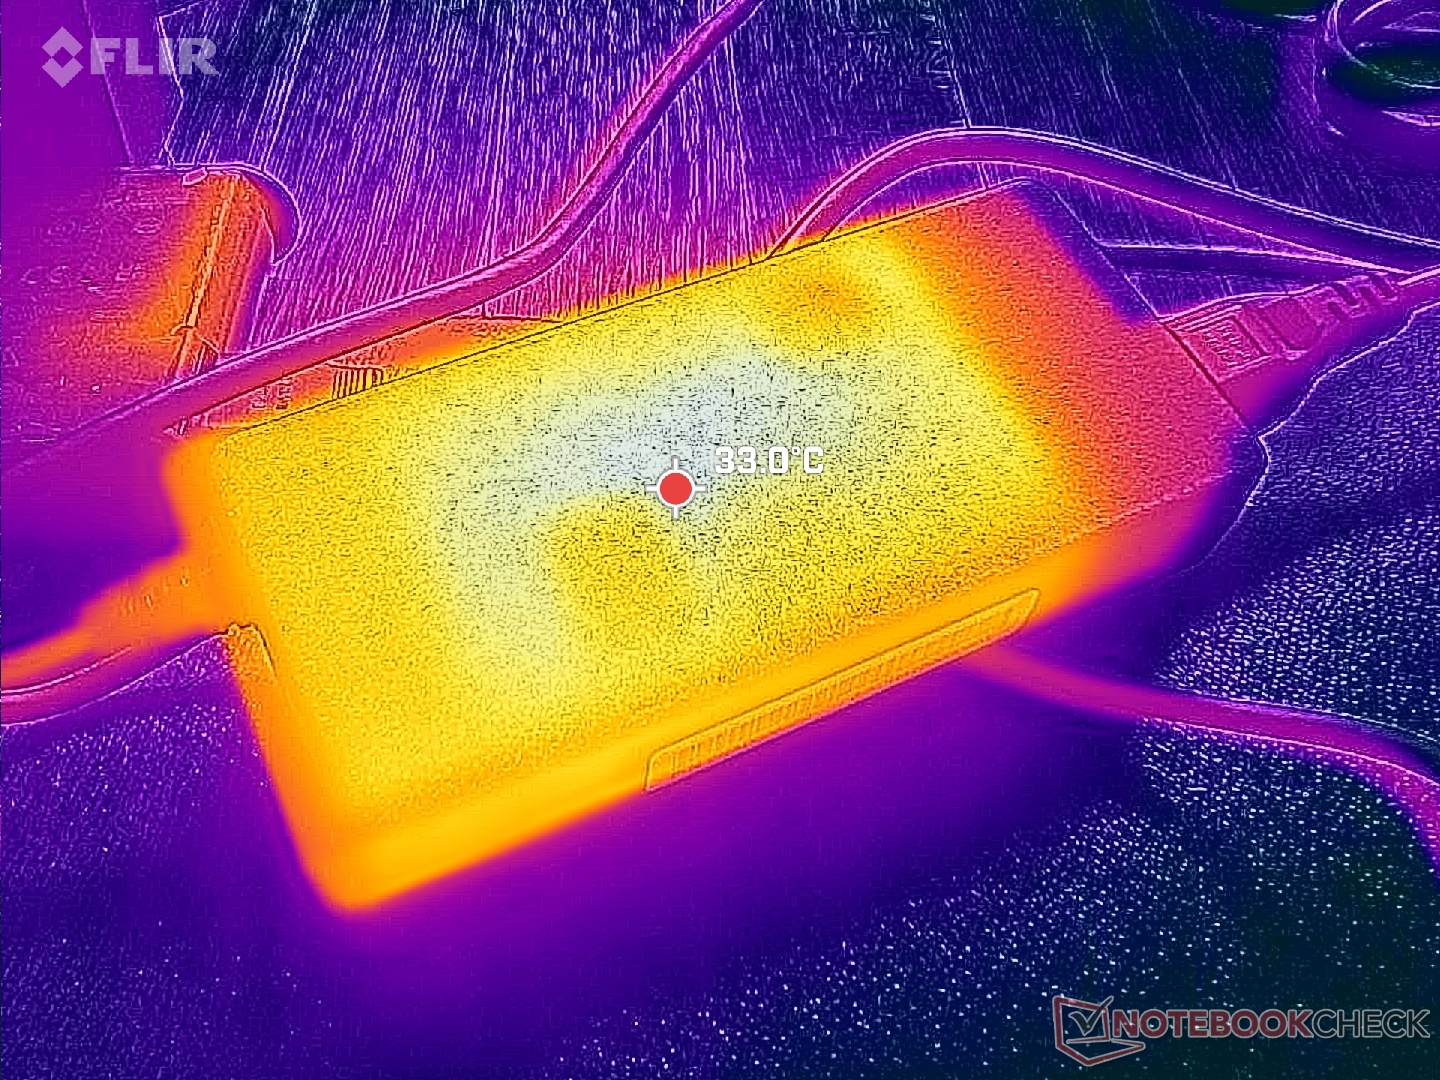
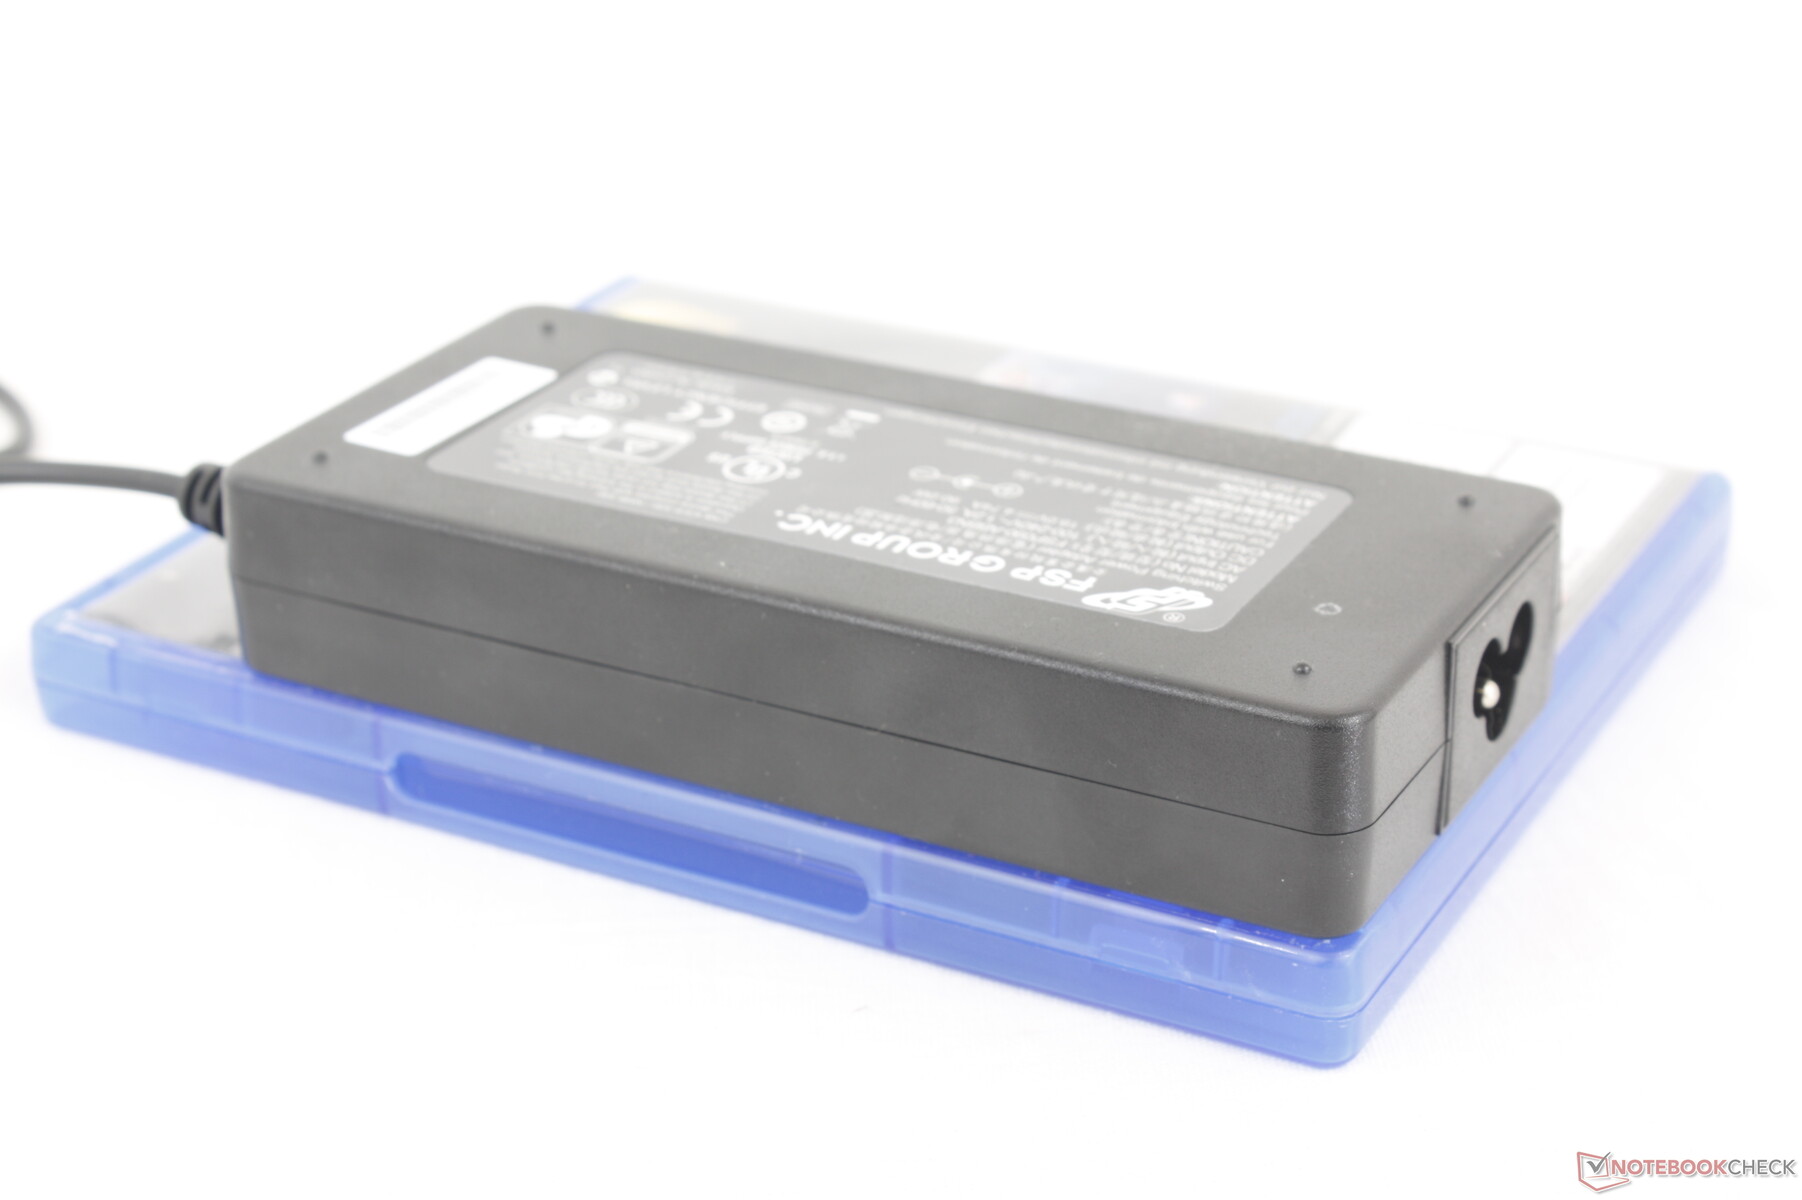
运行较高负载时的总体功耗略低于 Getac S410 G5略低。如下图所示,在热限制生效之前,CPU 的最大功耗可暂时达到 77 W。该系统兼容大多数通用 USB-C 交流适配器,因此包装盒中的专有 90 W 交流桶式适配器(约 15 x 6.4 x 2.6 厘米)并非绝对必要。
| Off / Standby | |
| Idle | |
| Load |
|
Key:
min: | |
| Durabook S15 i7-1255U, Iris Xe G7 96EUs, Kingston OM8SEP4512Q-AA, IPS, 1920x1080, 15.6" | Durabook S15ABG2 i5-8265U, UHD Graphics 620, UDinfo HF3-25UB HF325UB256GBA2P, TN LED, 1920x1080, 15.6" | Panasonic Toughbook 40 i7-1185G7, Iris Xe G7 96EUs, Samsung PM991 MZVLQ1T0HALB, IPS, 1920x1080, 14" | Getac S410 G5 i5-1350P, Iris Xe G7 80EUs, SSSTC CL4-8D512, IPS, 1920x1080, 14" | Dell Latitude 5420 Rugged-P85G i7-8650U, Radeon RX 540, SK hynix PC401 NVMe 500 GB, IPS, 1920x1080, 14" | Acer Enduro Urban N3 EUN314 i7-1165G7, Iris Xe G7 96EUs, Samsung PM991 MZVLQ1T0HALB, IPS, 1920x1080, 14" | |
|---|---|---|---|---|---|---|
| Power Consumption | 29% | -5% | -29% | -22% | 30% | |
| Idle Minimum * (Watt) | 4.4 | 3.5 20% | 4.9 -11% | 7.9 -80% | 4.8 -9% | 3.8 14% |
| Idle Average * (Watt) | 14.9 | 7.9 47% | 12.3 17% | 14.4 3% | 13.6 9% | 8 46% |
| Idle Maximum * (Watt) | 15.6 | 9 42% | 14 10% | 15.2 3% | 13.8 12% | 8.7 44% |
| Load Average * (Watt) | 45.5 | 39.8 13% | 54 -19% | 58.4 -28% | 67.8 -49% | 34.6 24% |
| Witcher 3 ultra * (Watt) | 40 | 46.3 -16% | 53.7 -34% | 69.1 -73% | 35.4 11% | |
| Load Maximum * (Watt) | 76.2 | 59.8 22% | 83.6 -10% | 106.5 -40% | 93.5 -23% | 45.4 40% |
* ... smaller is better
Power Consumption Witcher 3 / Stresstest
Power Consumption external Monitor
电池寿命
内部电池容量相对较小,仅为 54 Wh,实际无线局域网运行时间约为 8 小时,与旧款 2020 型号相似,亮度均设置为 150 nit。可选择辅助电池来延长电池寿命。
从空电到满电的充电时间相对较慢,仅为 2 个多小时,而大多数消费类笔记本电脑的充电时间为 1.5 小时。
| Durabook S15 i7-1255U, Iris Xe G7 96EUs, 56 Wh | Durabook S15ABG2 i5-8265U, UHD Graphics 620, 56 Wh | Panasonic Toughbook 40 i7-1185G7, Iris Xe G7 96EUs, 136 Wh | Getac S410 G5 i5-1350P, Iris Xe G7 80EUs, 150 Wh | Dell Latitude 5420 Rugged-P85G i7-8650U, Radeon RX 540, 102 Wh | Acer Enduro Urban N3 EUN314 i7-1165G7, Iris Xe G7 96EUs, 50.3 Wh | |
|---|---|---|---|---|---|---|
| Battery runtime | -14% | 138% | 119% | 93% | -20% | |
| Reader / Idle (h) | 17.2 | 31.4 83% | ||||
| WiFi v1.3 (h) | 8 | 6.9 -14% | 19 138% | 17.5 119% | 16.2 103% | 6.4 -20% |
| Load (h) | 3.2 |
Pros
Cons
结论--更新的内部结构让一切与众不同
2024 Durabook S15 基于我们在 2020 年评测过的设计,在保留原有核心品质的基础上,加快了该系列的发展速度。熟悉的外部功能依然完好,但增加了新的硬件规格,如 Wi-Fi 6E、1000-nit 显示器选项、更大的键盘、Thunderbolt 4,当然还有更快的处理器性能。不过,一些用户可能会对取消 2.5 英寸 SATA III 插槽和缺少触摸屏感到不满。一些竞争机型,如 Getac S410 5 代等几款竞争机型相比,拥有触摸屏、手写笔和更快的 Core-P 选项。
从外观上看,2024 Durabook S15 可能没有什么变化,但内部几乎进行了全面修改,引入了现代功能和选项,同时保持了与大多数配件的向后兼容性。
键盘亮度控制采用 PWM 技术,键盘左右两侧的按键反馈不均匀,这些都应在今后的改版中加以改进。扬声器的音量还可以再大一些,而侧面的扩展坞仍然需要用螺丝刀才能打开,这在野外使用时会很不方便。绝大多数最新的笔记本电脑也已过渡到 16:10 或 16 英寸屏幕,而 S15 的 16:9 15.6 英寸外形已开始让人感觉过时。尽管存在这些缺点,但令人印象深刻的是,该机型在这么多年后仍然是同类产品中最便携的机型之一。
价格和供应情况
可提供报价如果直接从制造商处配置和购买,可提供报价。
Durabook S15
- 06/17/2024 v8
Allen Ngo
Transparency
The selection of devices to be reviewed is made by our editorial team. The test sample was provided to the author as a loan by the manufacturer or retailer for the purpose of this review. The lender had no influence on this review, nor did the manufacturer receive a copy of this review before publication. There was no obligation to publish this review. As an independent media company, Notebookcheck is not subjected to the authority of manufacturers, retailers or publishers.
This is how Notebookcheck is testing
Every year, Notebookcheck independently reviews hundreds of laptops and smartphones using standardized procedures to ensure that all results are comparable. We have continuously developed our test methods for around 20 years and set industry standards in the process. In our test labs, high-quality measuring equipment is utilized by experienced technicians and editors. These tests involve a multi-stage validation process. Our complex rating system is based on hundreds of well-founded measurements and benchmarks, which maintains objectivity. Further information on our test methods can be found here.
Price comparison

