

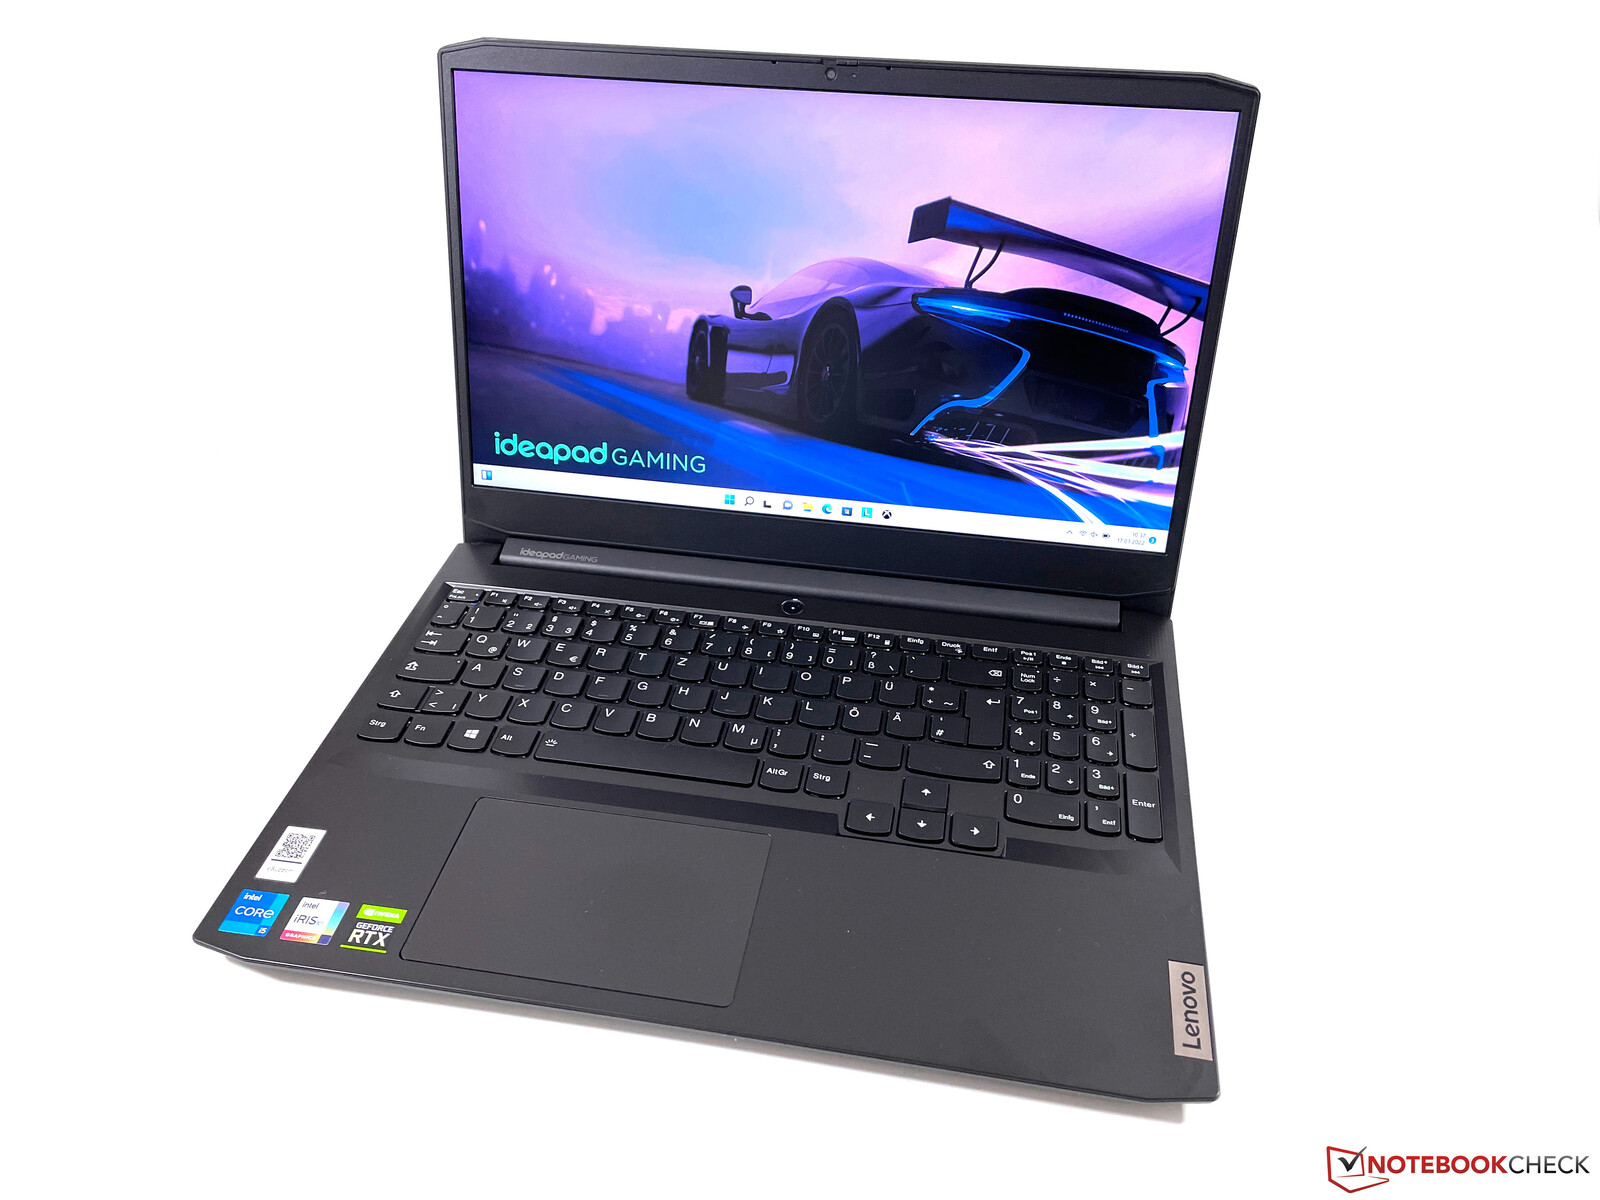
联想IdeaPad Gaming 3i 15 G6笔记本电脑评论。显示效果不佳的预算型游戏笔记本
联想的IdeaPad Gaming系列是联想游戏笔记本的实惠之选,其重点在于重要的东西,即游戏性能,没有任何花哨的东西。第六代IdeaPad Gaming 3i 15基于英特尔目前的Tiger Lake ,它配备了NvidiaGeForce RTX 3050 Ti,16GB内存,512GB PCIe SSD,以及15英寸IPS FHD显示屏。这个确切的型号目前没有在美国销售。然而,有一款基于英特尔酷睿i7-11370H的设备,有8GB内存和256GB固态硬盘,售价为1000美元。
潜在的竞争对手比较
Rating | Date | Model | Weight | Height | Size | Resolution | Price |
|---|---|---|---|---|---|---|---|
| 79.7 % v7 (old) | 03 / 2022 | Lenovo Ideapad Gaming 3 15IHU-82K1002RGE i5-11300H, GeForce RTX 3050 Ti Laptop GPU | 2 kg | 24.2 mm | 15.60" | 1920x1080 | |
| 82.7 % v7 (old) | 10 / 2021 | Dell G15 5515 R7 5800H, GeForce RTX 3050 Ti Laptop GPU | 2.4 kg | 24.9 mm | 15.60" | 1920x1080 | |
| 81.7 % v7 (old) | 11 / 2021 | Gigabyte G5 GD i5-11400H, GeForce RTX 3050 4GB Laptop GPU | 2.1 kg | 31.6 mm | 15.60" | 1920x1080 | |
| 81.4 % v7 (old) | 12 / 2021 | Medion Erazer Deputy P25 R7 5800H, GeForce RTX 3060 Laptop GPU | 2.3 kg | 26 mm | 15.60" | 1920x1080 | |
| 83.2 % v7 (old) | 10 / 2021 | SCHENKER XMG Focus 15 i7-11800H, GeForce RTX 3050 Ti Laptop GPU | 1.9 kg | 22 mm | 15.60" | 1920x1080 | |
| 83.4 % v7 (old) | 09 / 2021 | Lenovo Legion 5 15ACH-82JU00C6GE-FL R7 5800H, GeForce RTX 3060 Laptop GPU | 2.5 kg | 26 mm | 15.60" | 1920x1080 |
案例
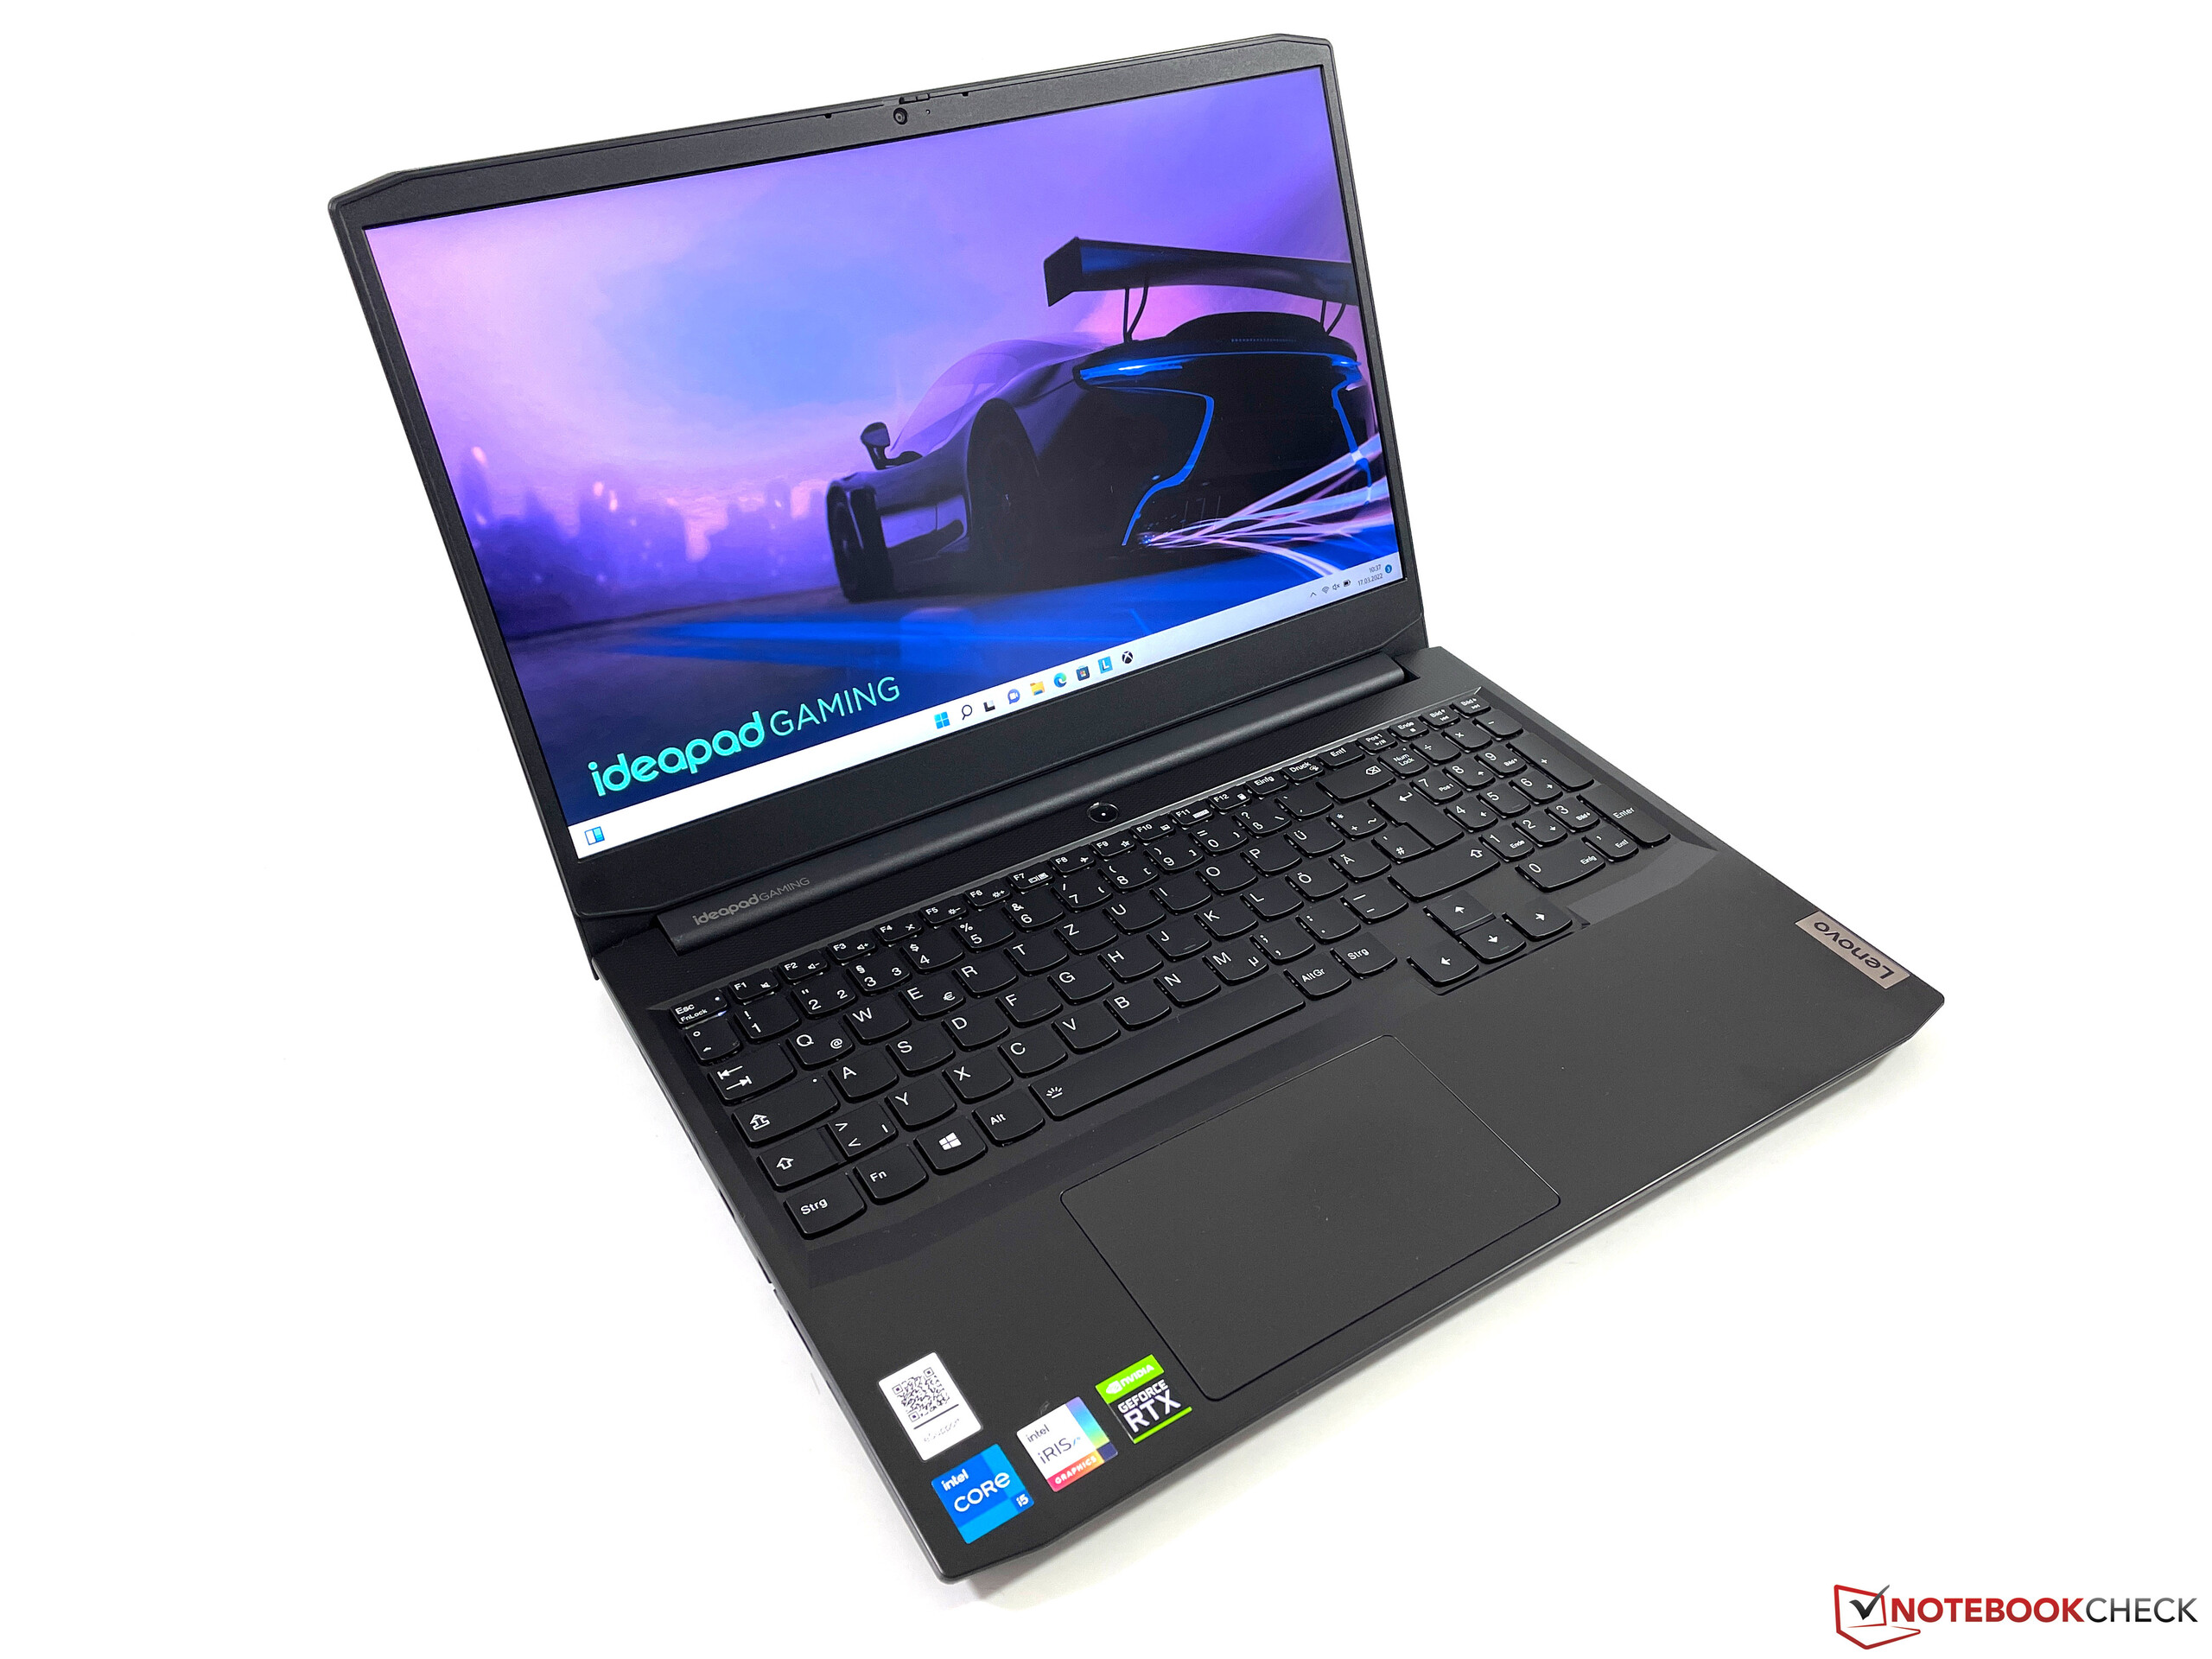
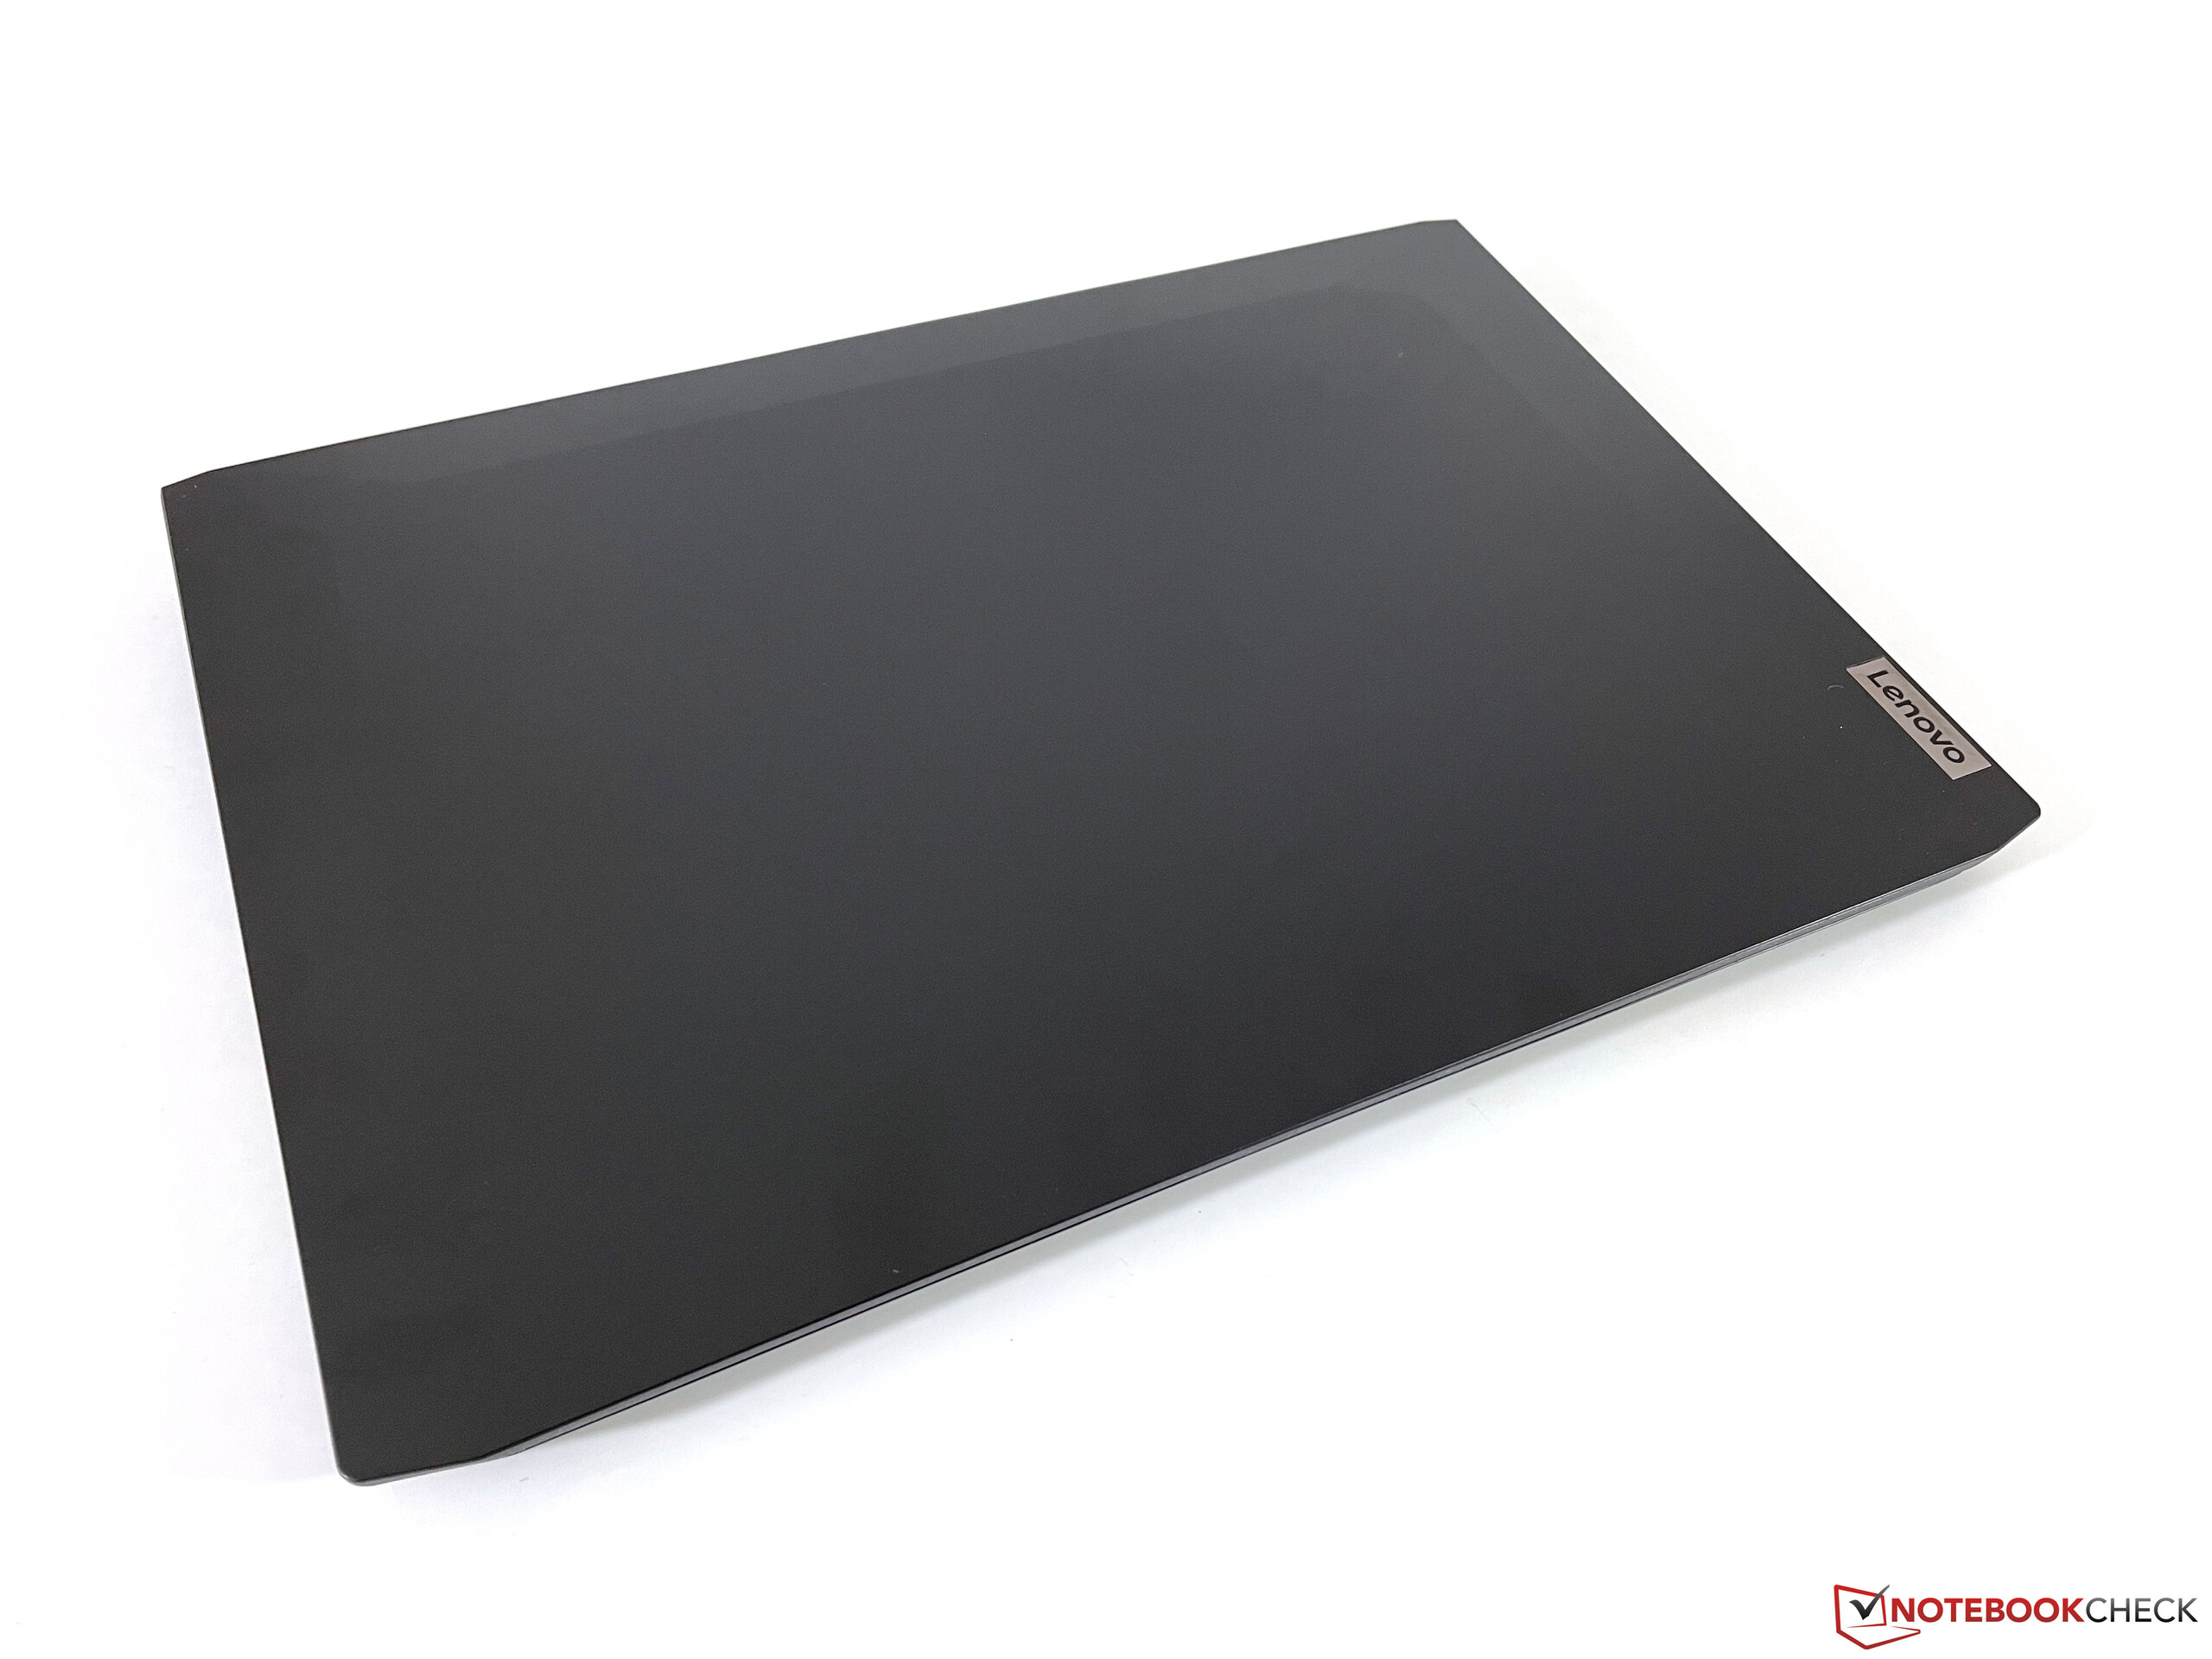
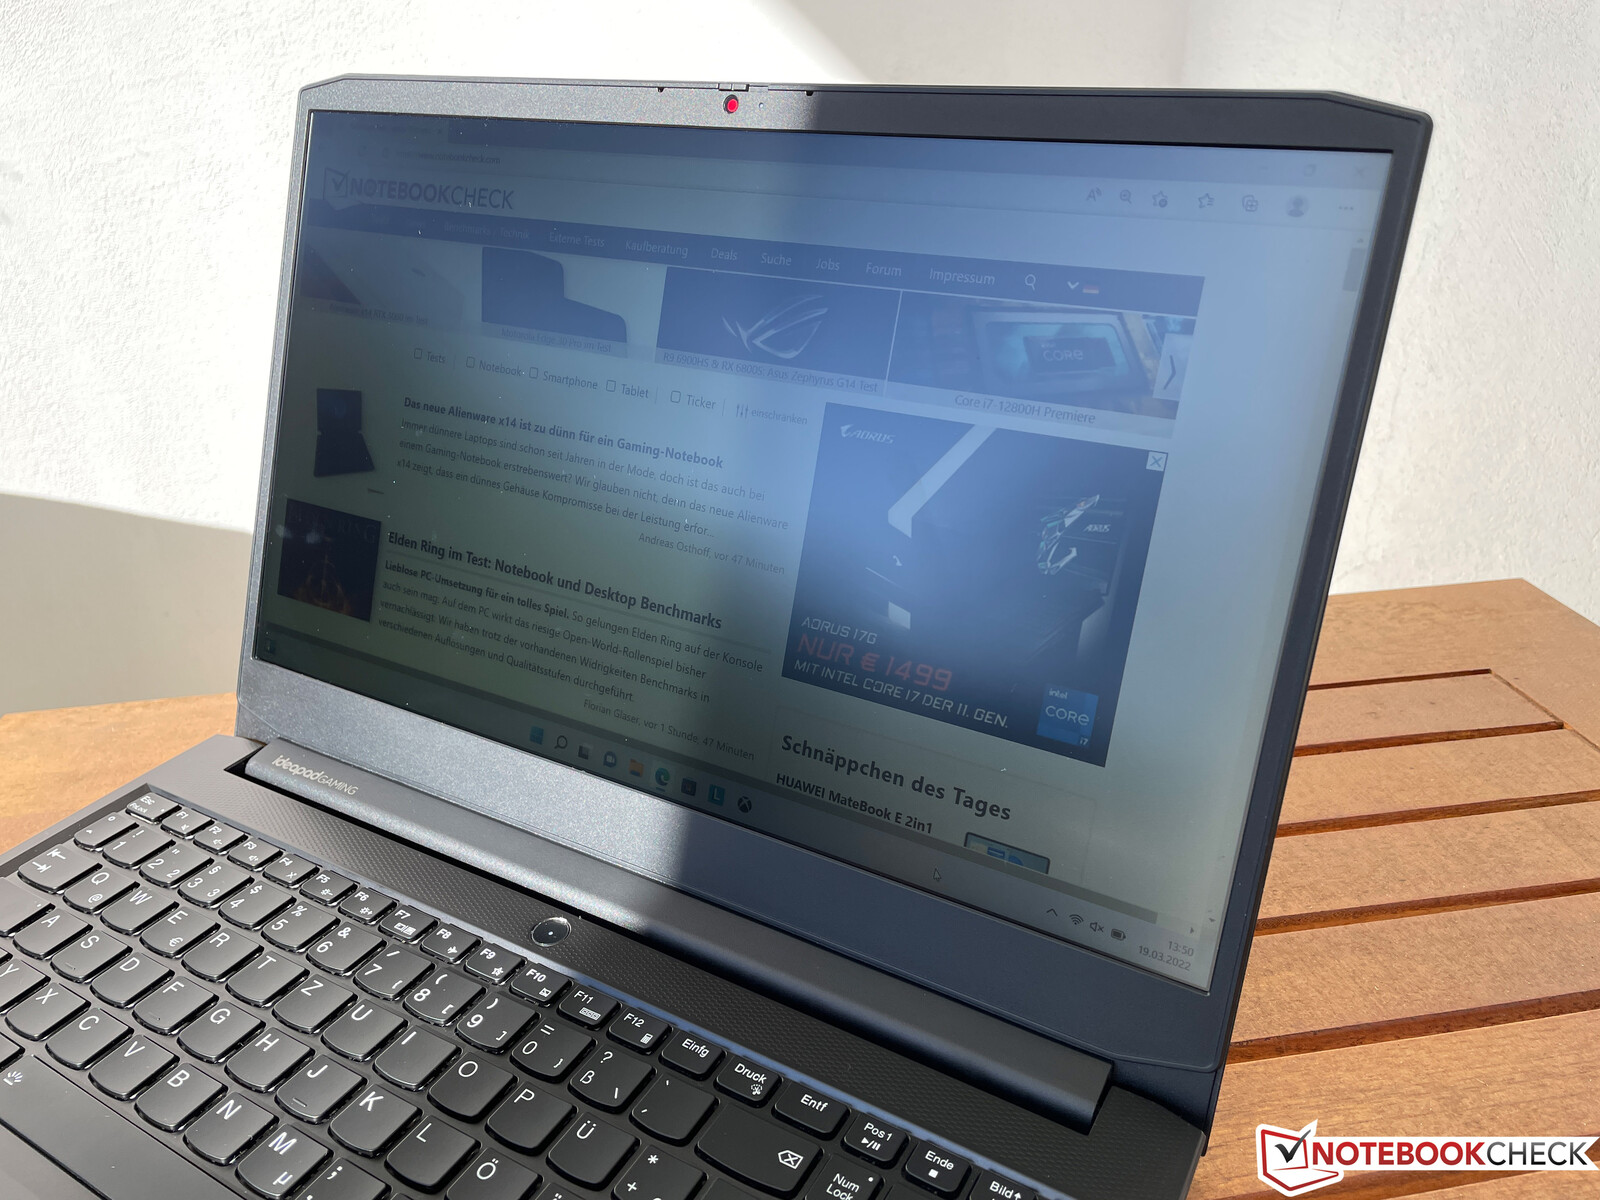
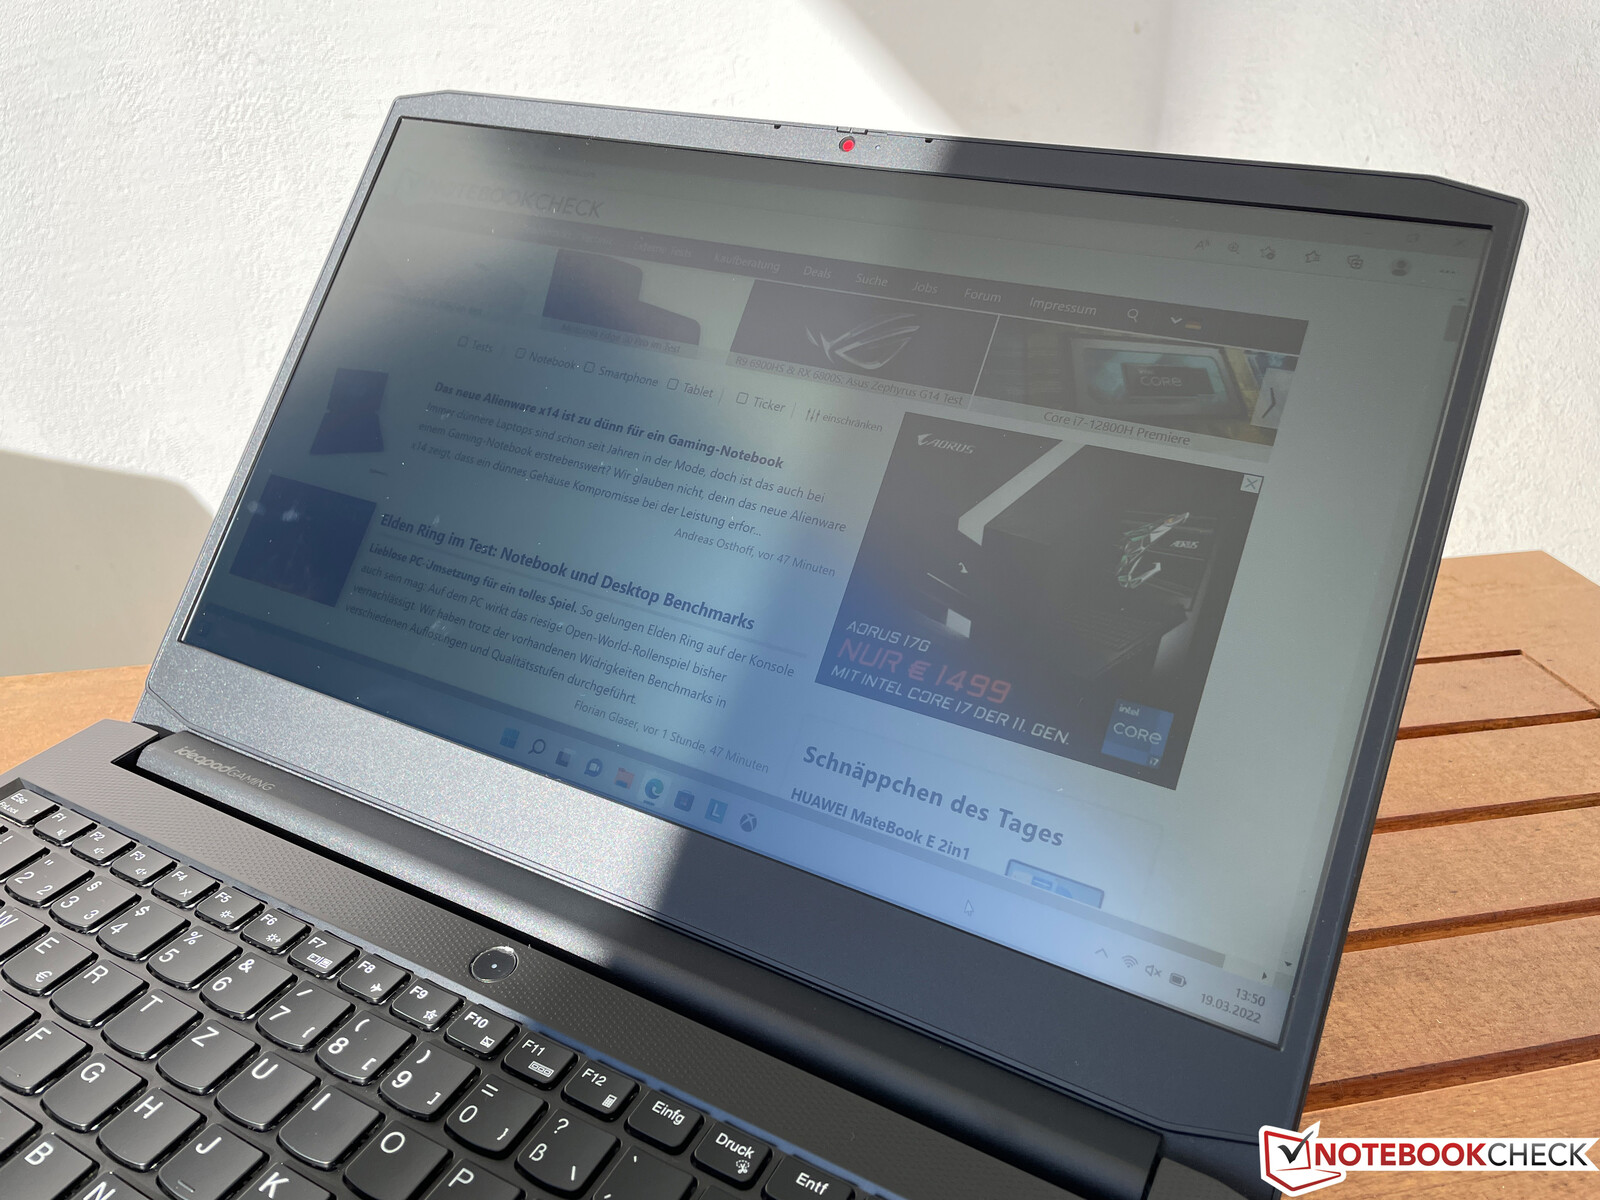
IdeaPad Gaming 3的外壳完全由塑料制成,其粗糙的底盖显示了其低廉的价格。整体设计是功利和谨慎的。没有任何游戏专用的设计元素,而且该设备无法被识别为游戏笔记本电脑。它甚至缺乏任何形式的外壳照明效果。
顶盖和底座的表面都很光滑,容易沾染指纹和污渍。底座单元的刚性很好,尽管键盘的中心很容易被压下,而且当我们试图翘起它时,整个单元略微吱吱作响。
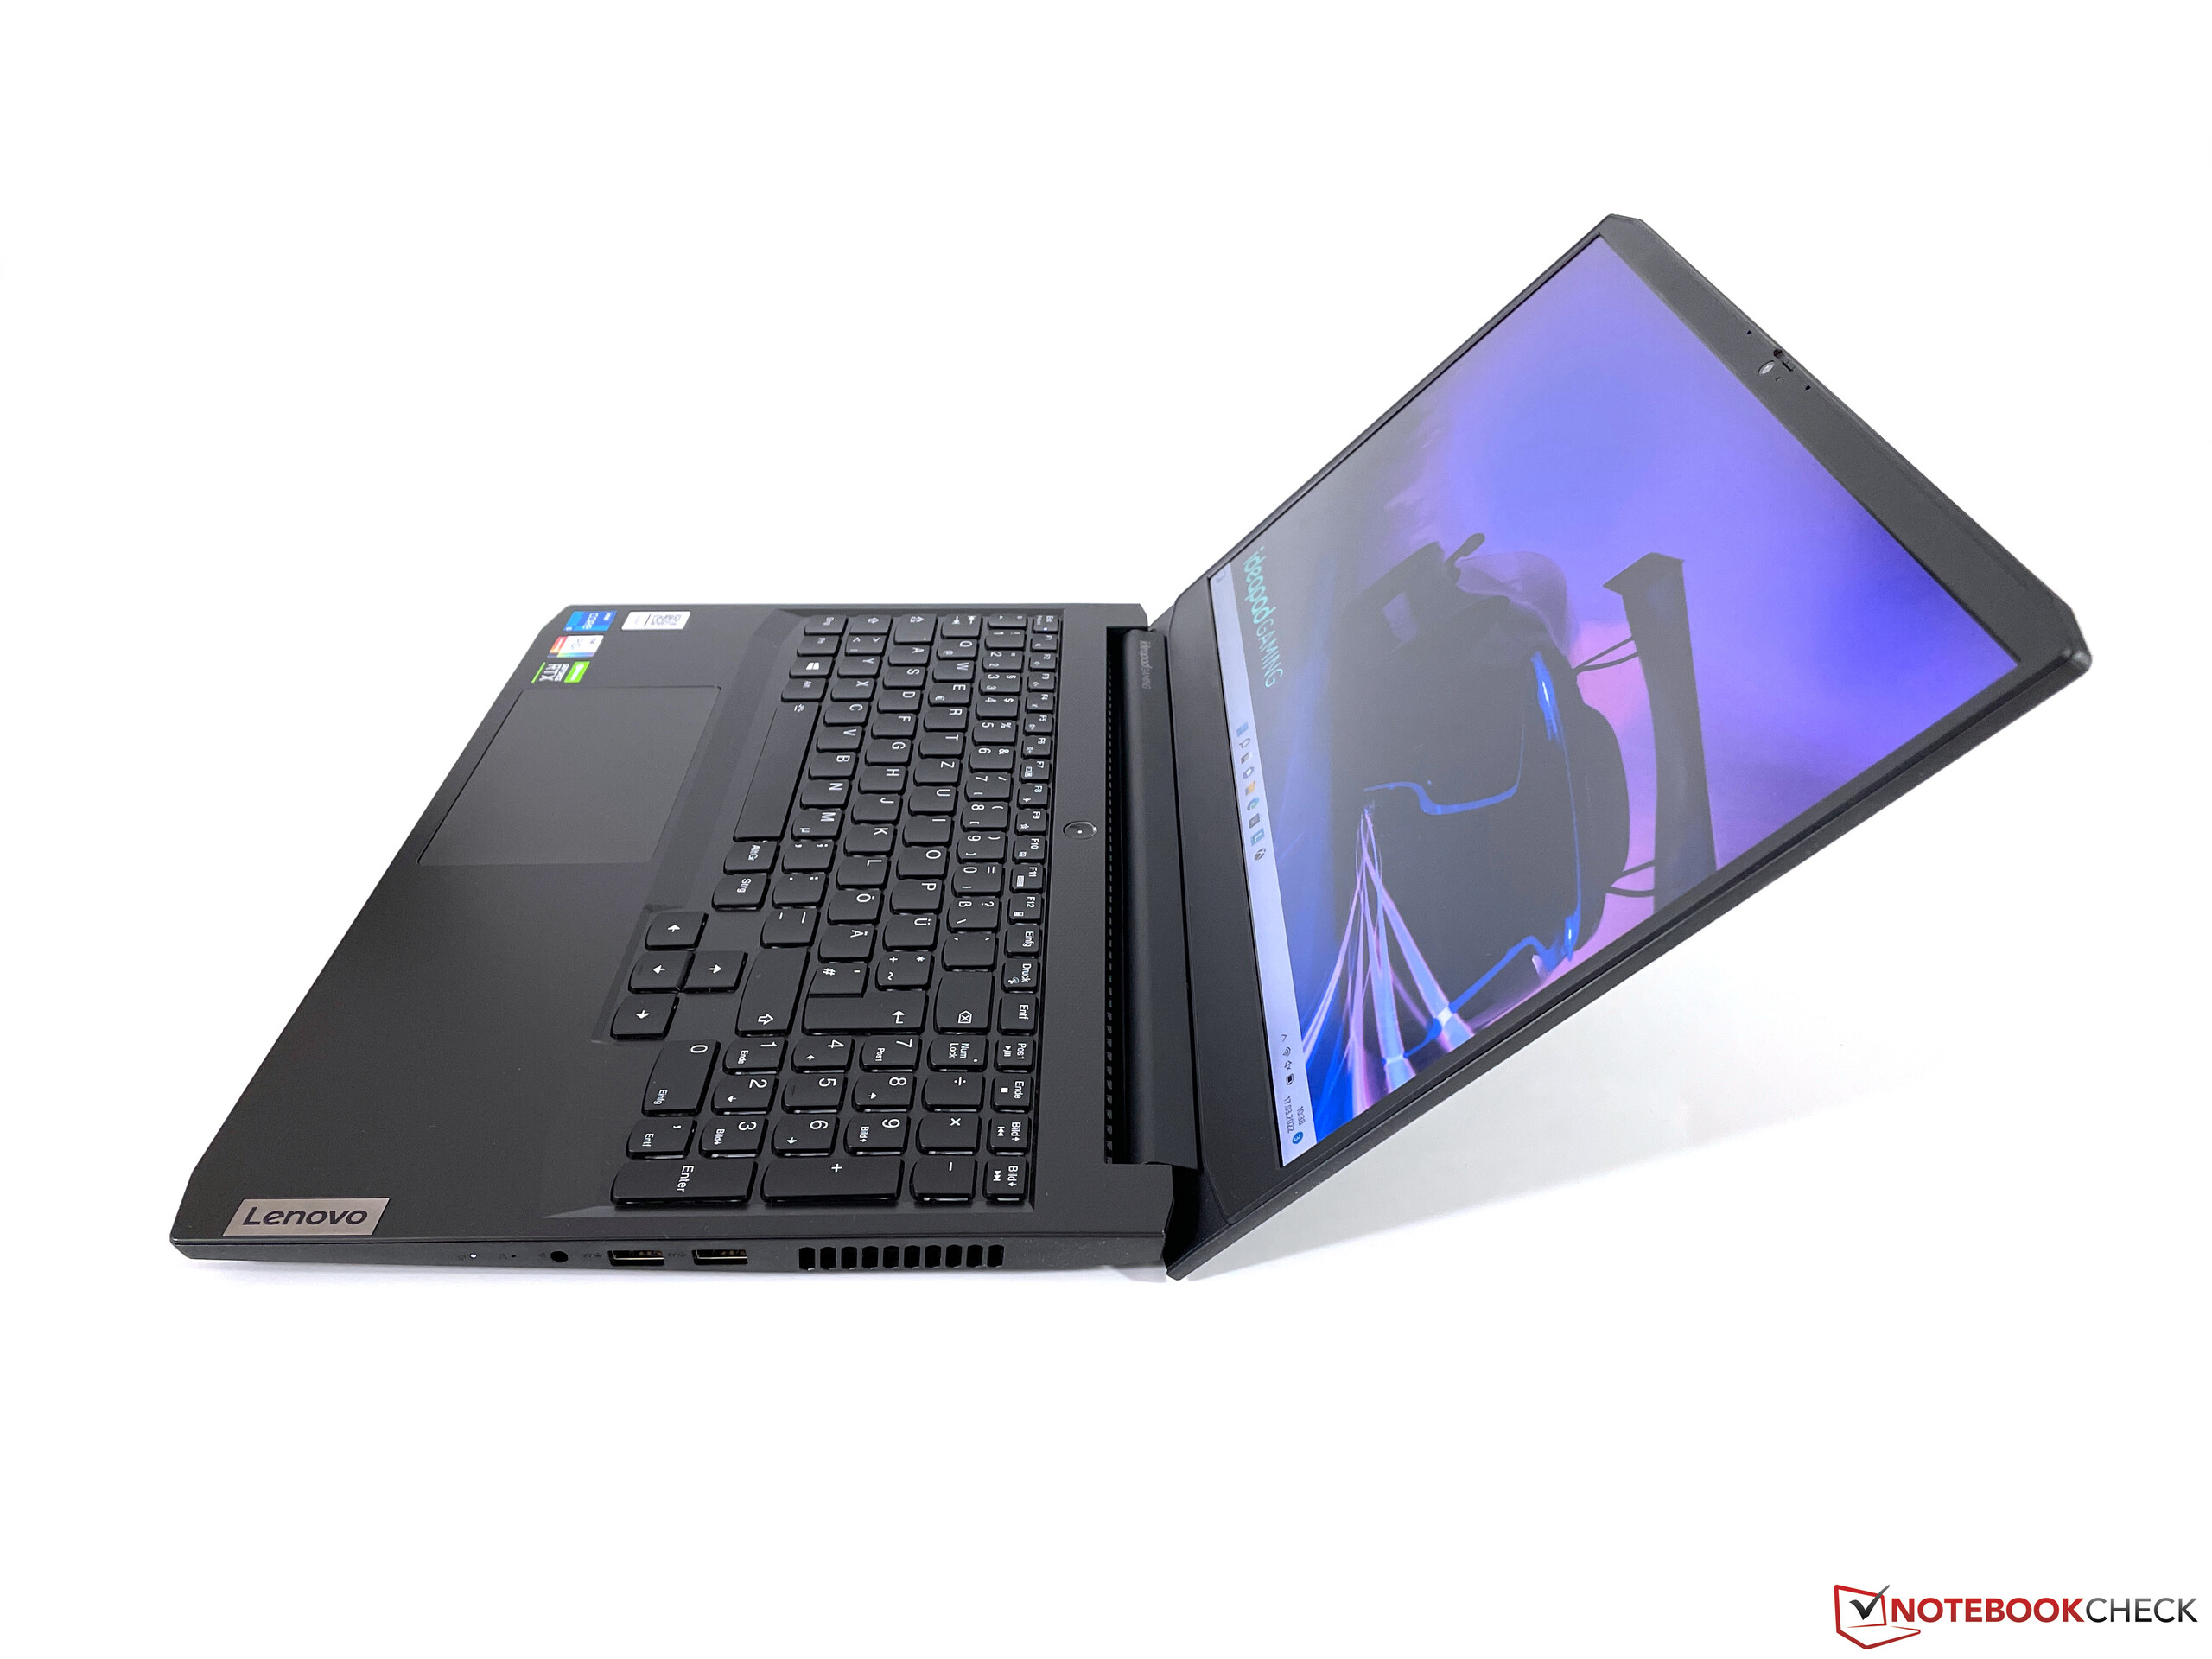
铰链本身总体上调整得相当好,在调整显示器时有一些轻微的摇晃(最大开启角度:135°)。显示屏的盖子明显没有底座那么坚硬,在对其背面施压时,面板显示出非常明显的波纹效果。
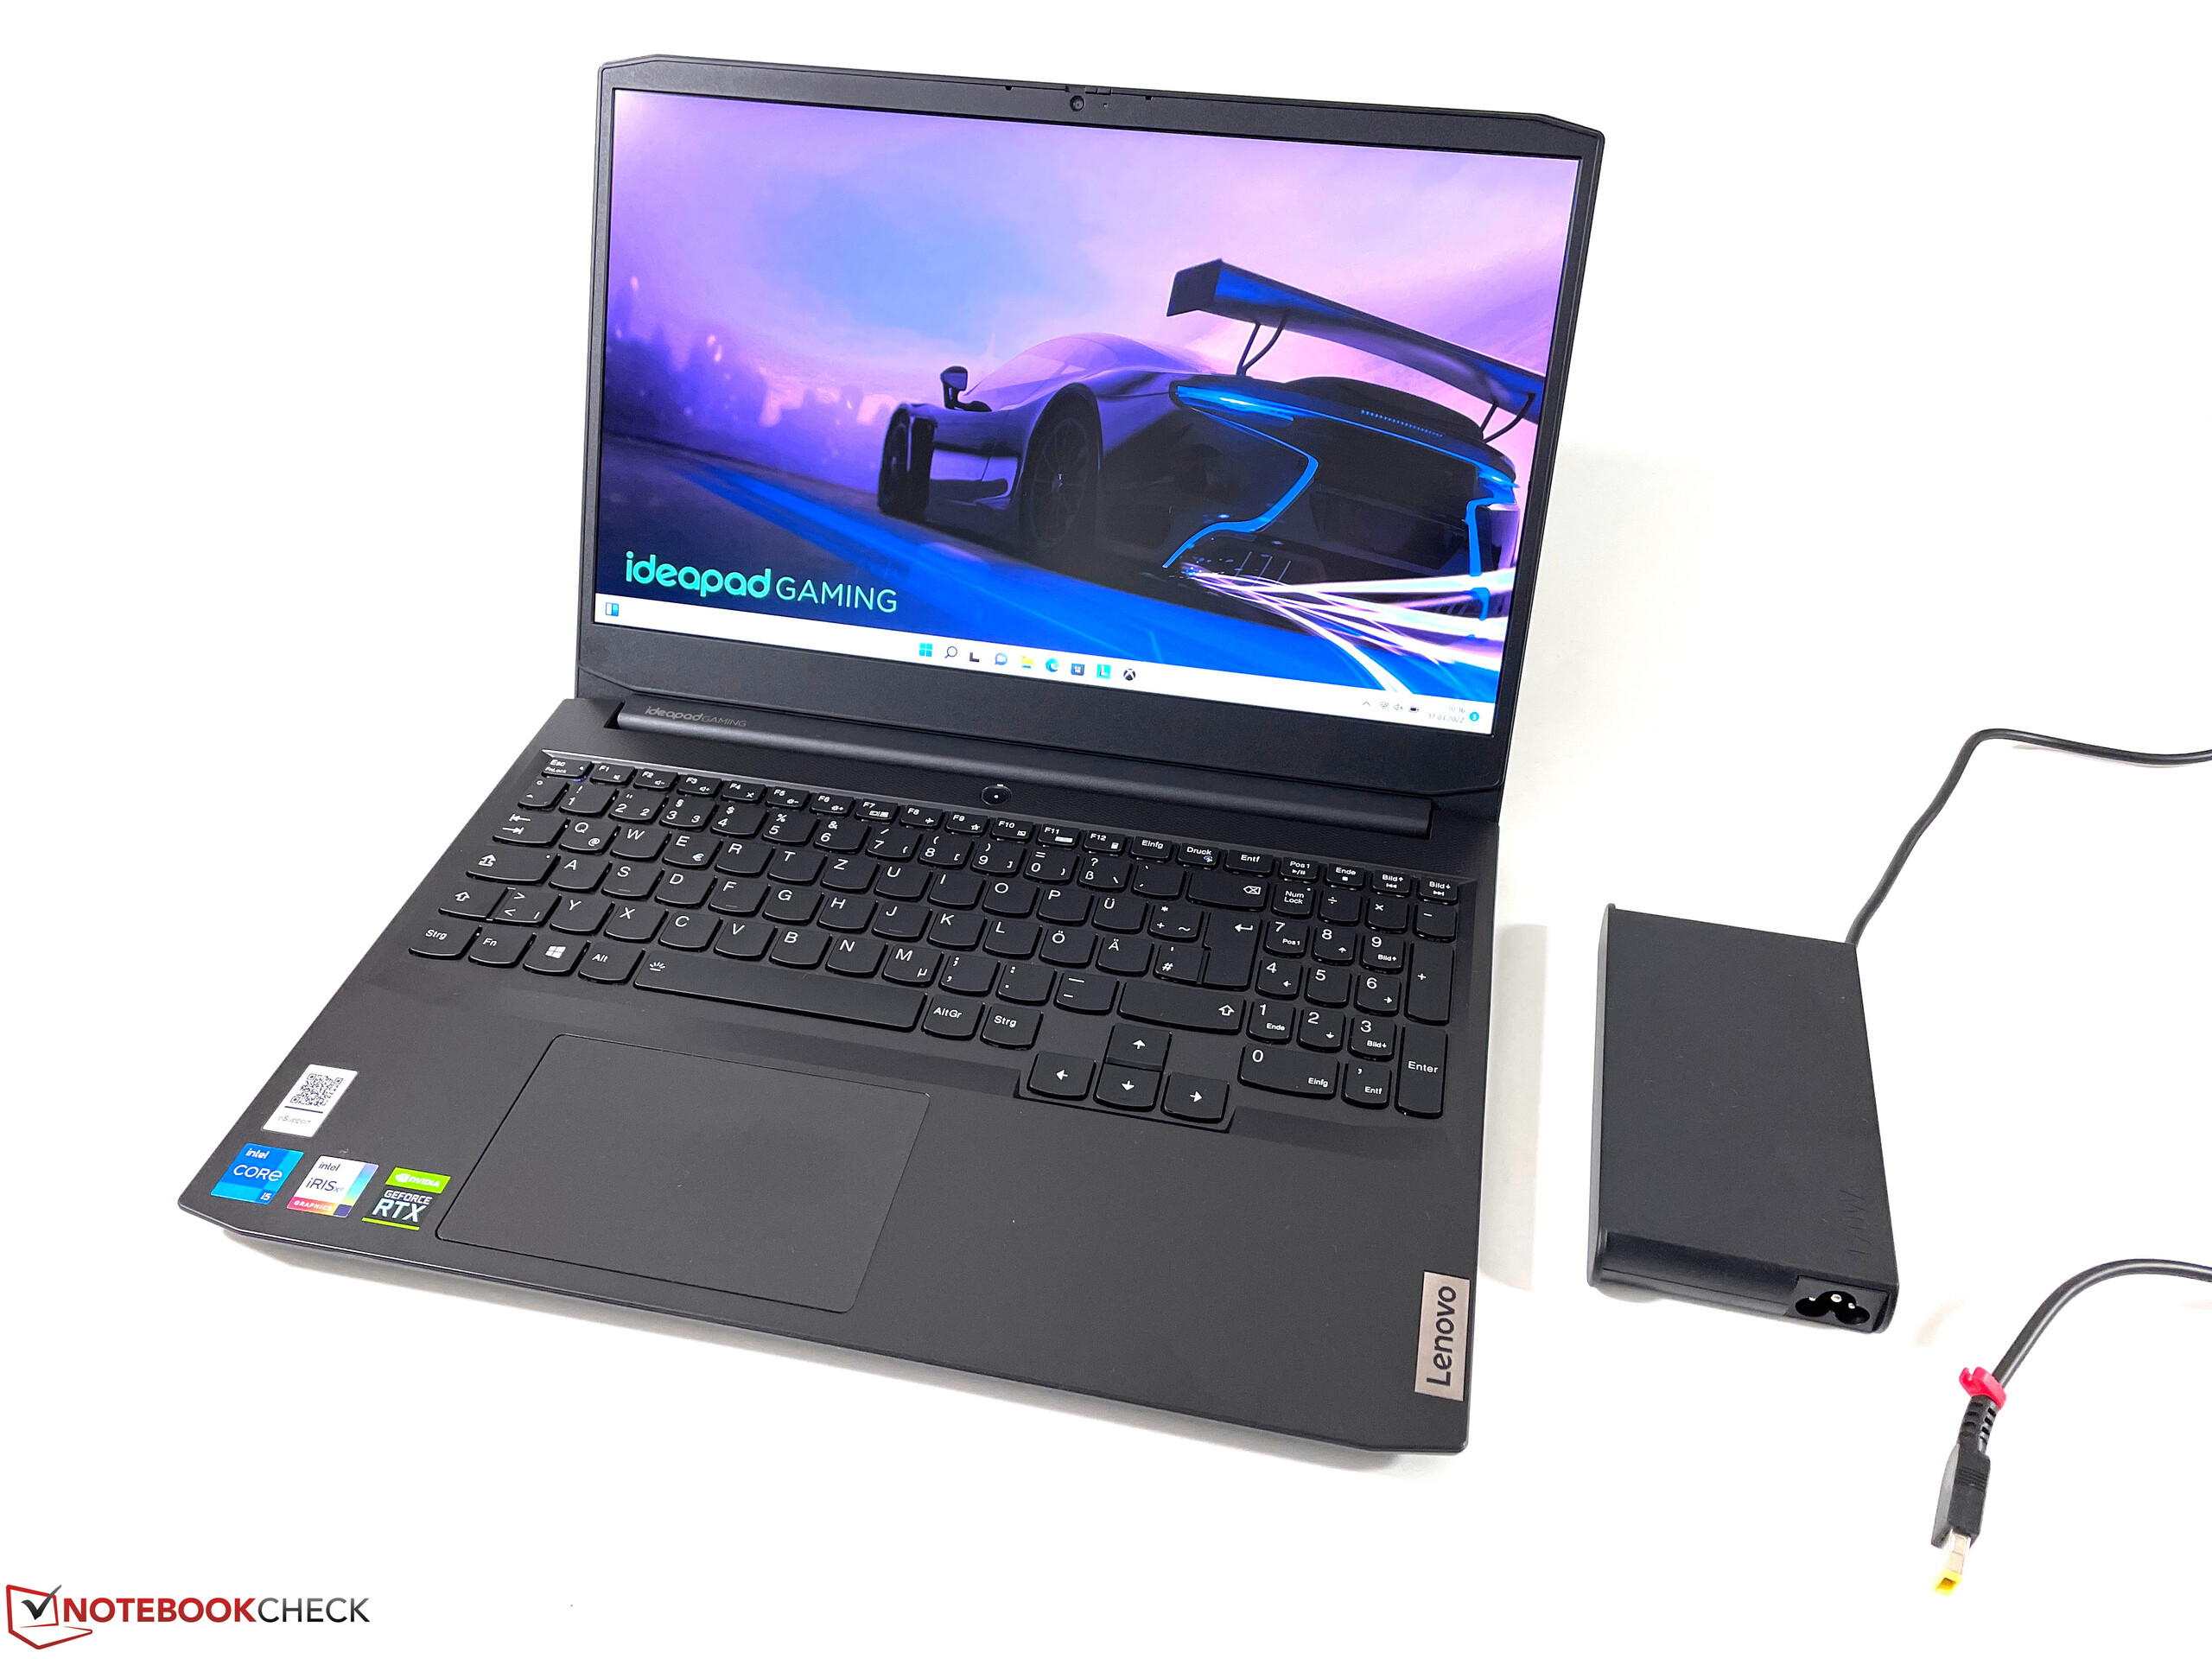
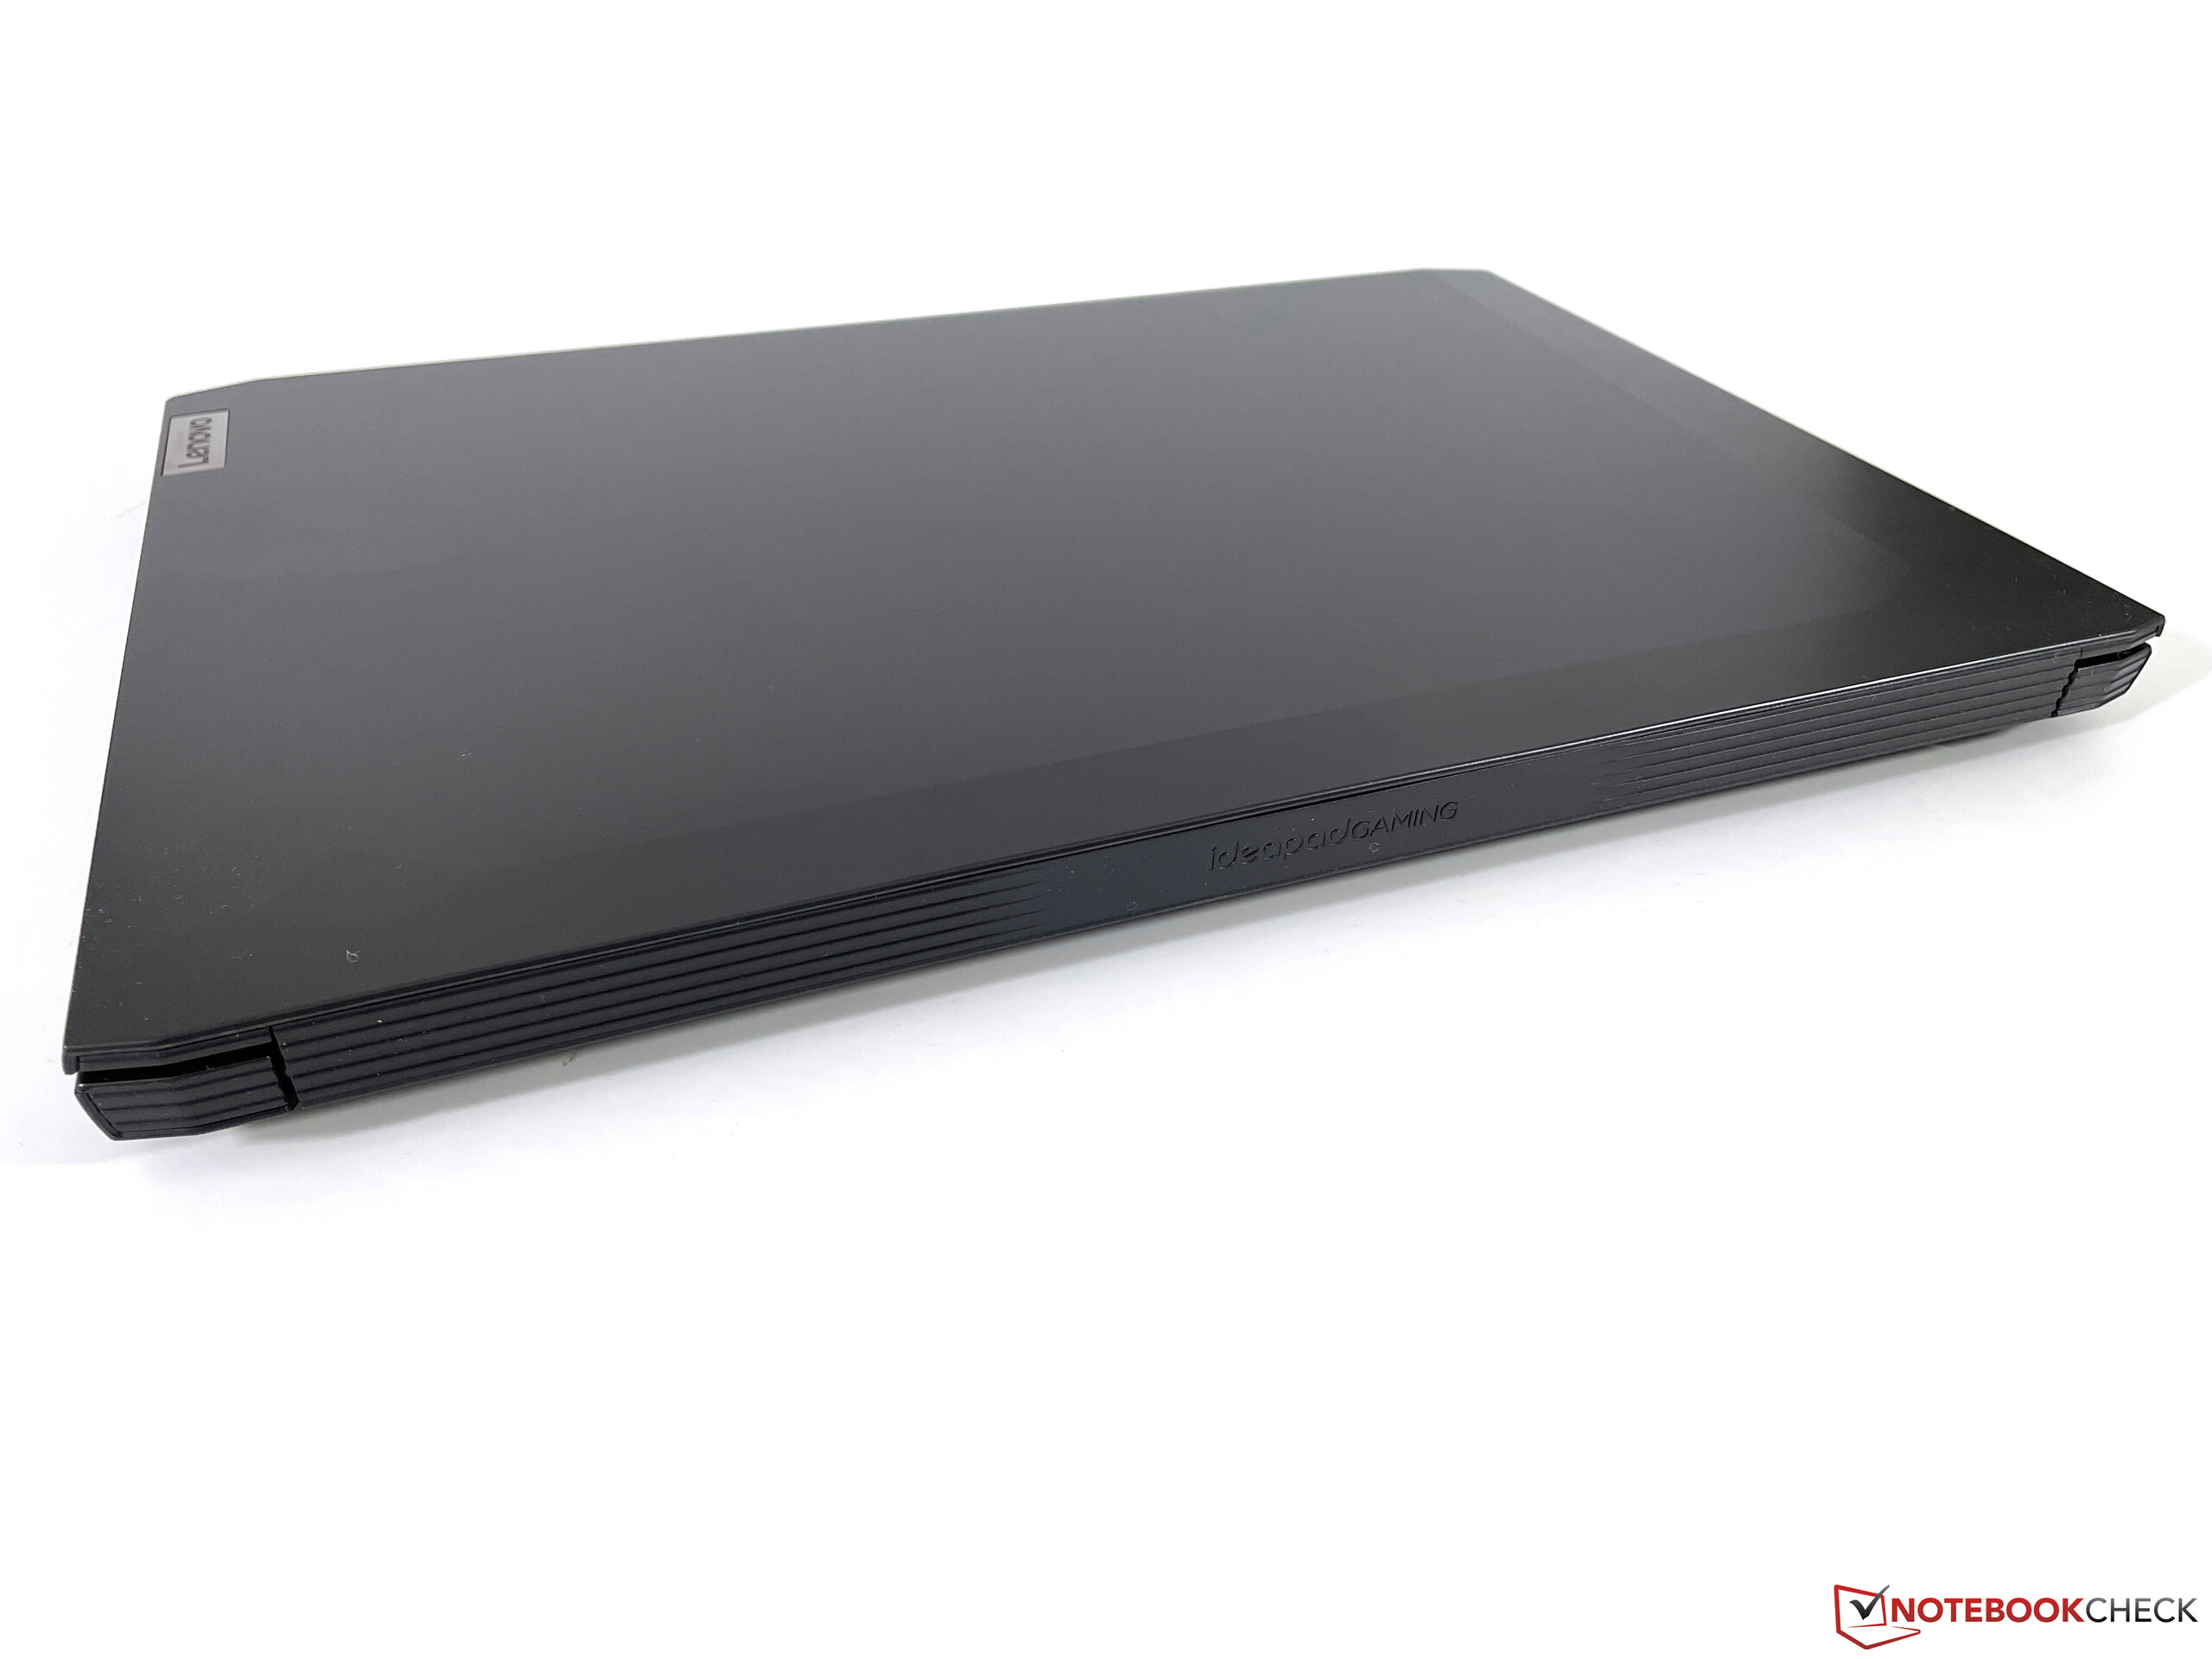
综合考虑,IdeaPad Gaming 3是其竞争对手中更紧凑的设备之一,尽管差异相当小。略高于2公斤(4.41磅)的重量也是比较轻的。请记住,电源增加了25%以上的重量预算(500克/1.1磅)。
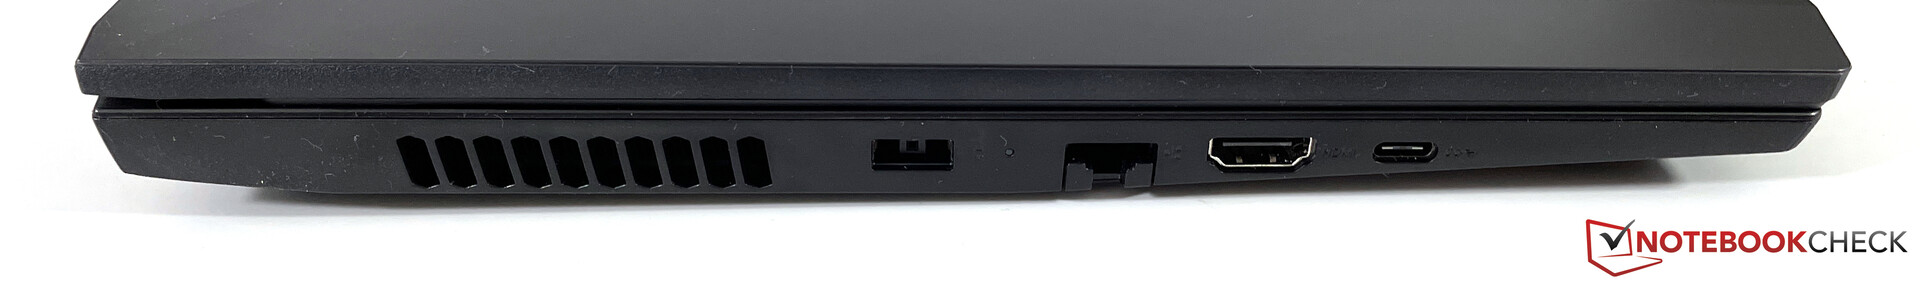
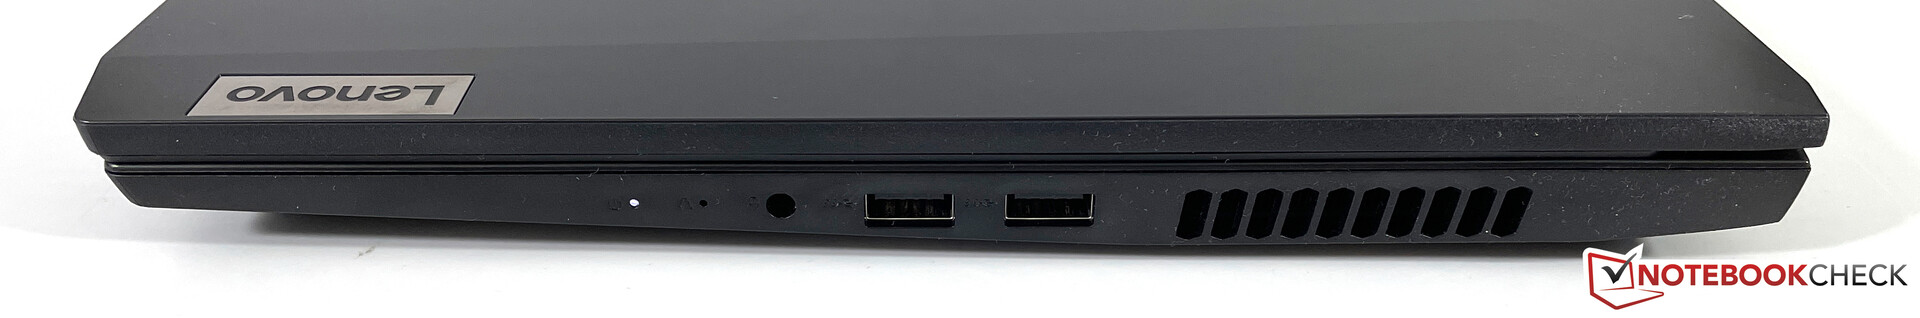
连接性 - IdeaPad游戏涵盖了基础知识
所有的端口都位于两边的中间位置。我们发现电源端口的位置对于打算使用外部鼠标的左撇子玩家来说特别不方便。支持的协议再次表明了它的低价位。该设备缺乏对Thunderbolt的支持,不能通过其USB-C端口进行充电,该端口也没有携带DisplayPort信号。读卡器也无处可寻。
沟通
在网络连接方面,IdeaPad Gaming 3提供一个以太网端口以及一个Wi-Fi调制解调器。联想在这部分没有吝啬,选择了一个最新的英特尔AX201模块,支持Wi-Fi 6(802.11ax,160MHz)和蓝牙5.1。当连接到我们的Netgear Nighthawk AX12参考路由器时,传输率非常好,我们在审查期间没有遇到任何连接问题。
网络摄像头
在显示屏上方,我们发现一个标准的720p网络摄像头产生了预期的效果。换句话说:它的图像质量很差,即使在体面的光线下也是如此。至少该摄像头提供了一个物理隐私快门。


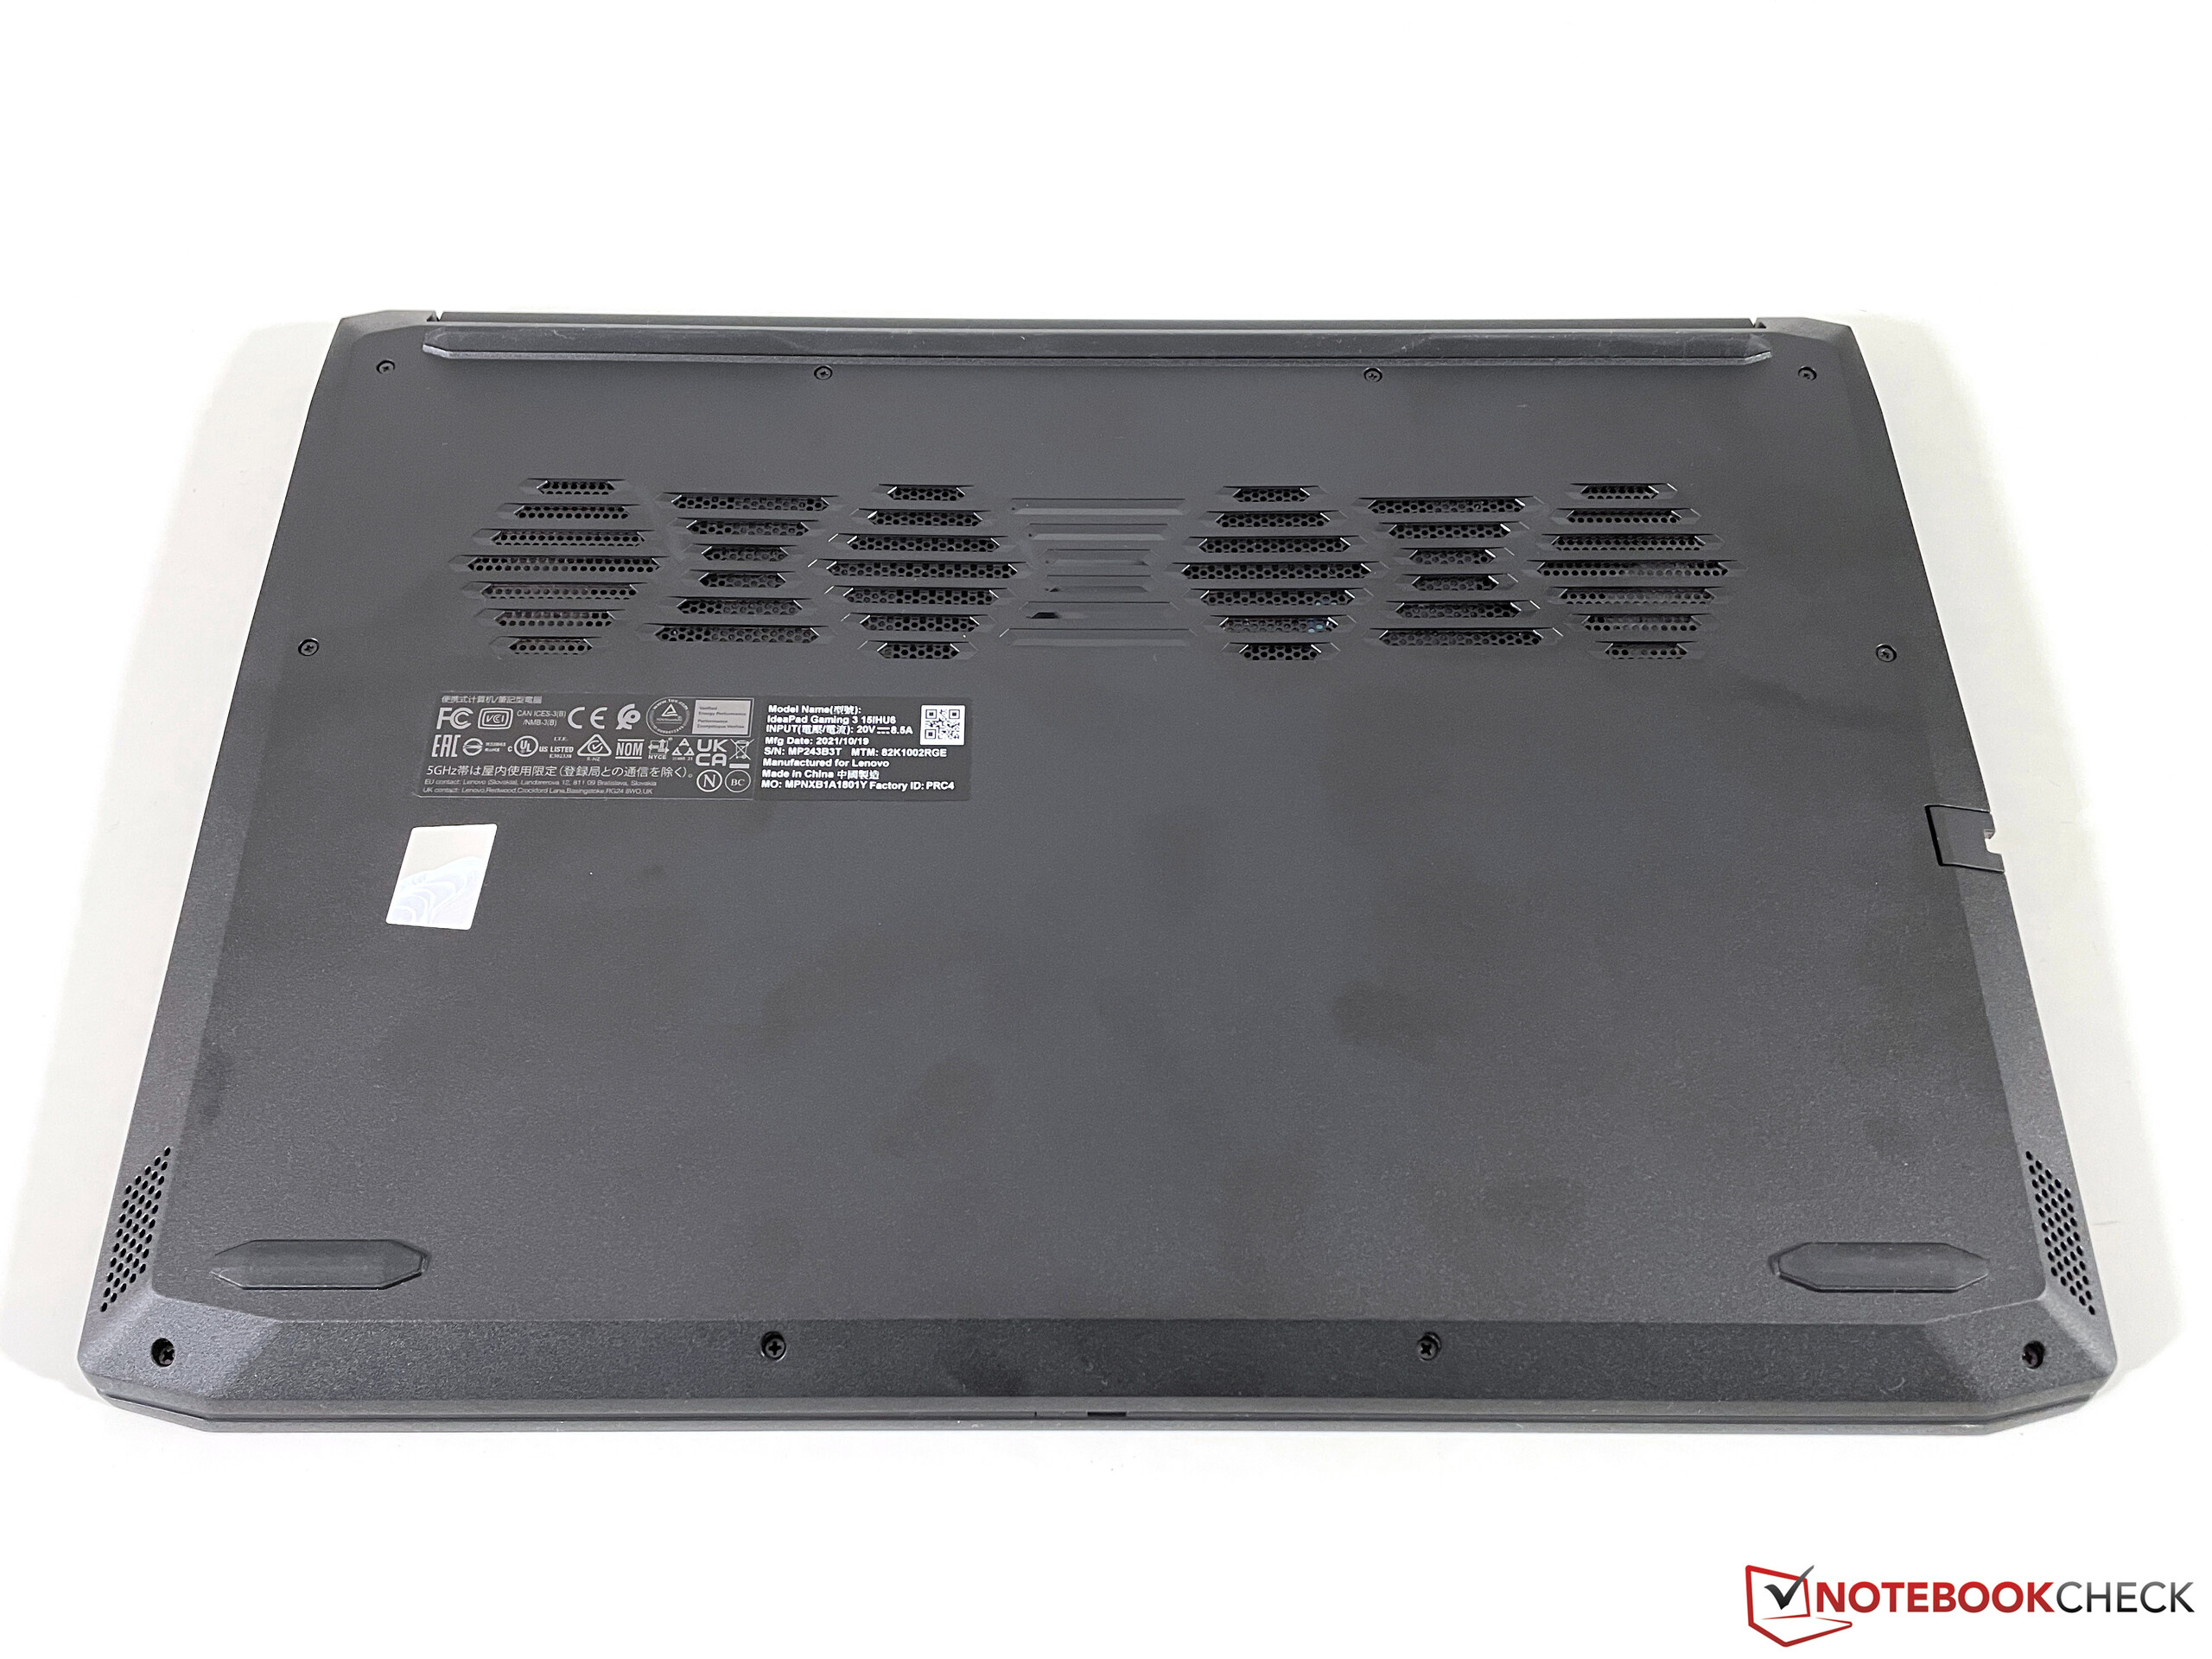
维护
理论上,你可以取下整个底板,以便接触到IdeaPad Gaming 3的内部组件。虽然固定盖子的飞利浦螺钉可以很容易地解开,但我们发现在不损坏基本单元的情况下,无论是视觉上还是物理上,都不可能拆除底盖。考虑到我们的评论单元是一个商店单元,我们决定今天就这样吧。
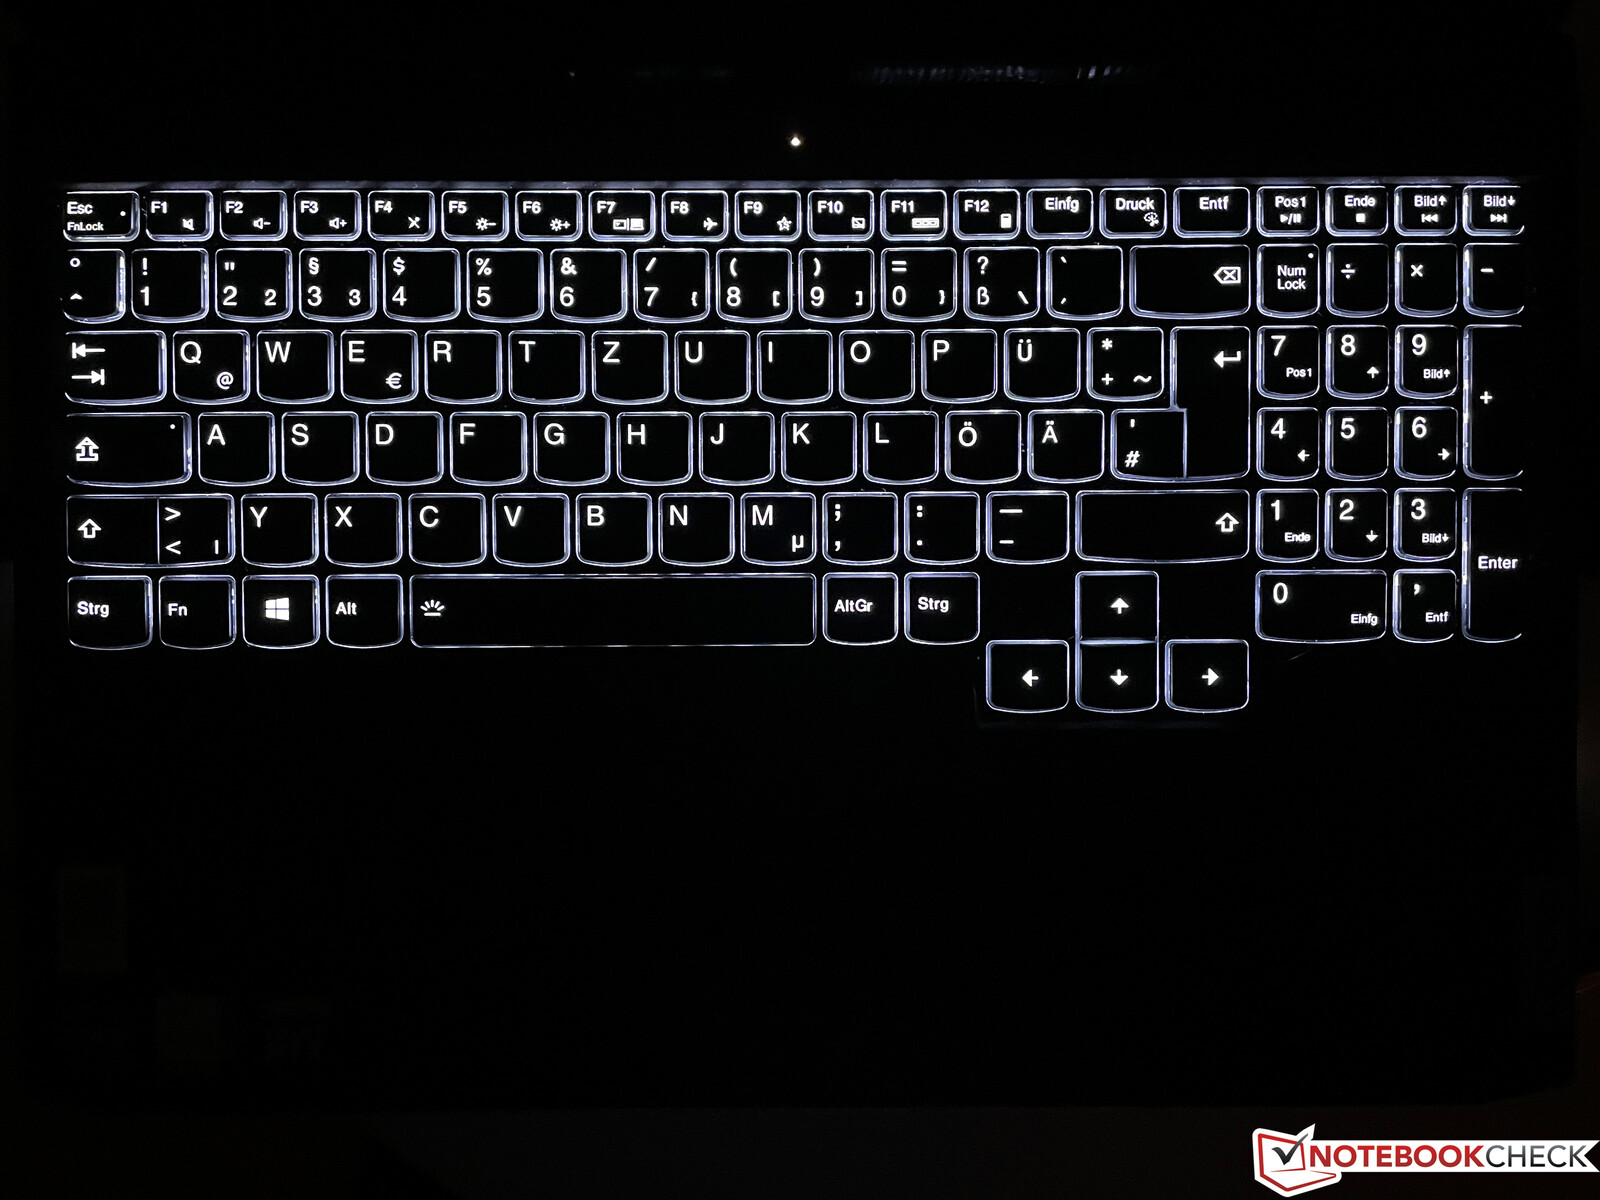
输入设备 - 带背光键盘的IdeaPad游戏机
键盘
IdeaPad Gaming 3配有全尺寸的键盘和小键盘,尽管后者相对较窄。与其他IdeaPad不同的是,这个键盘带有增加的行程(1.5毫米),使打字非常舒适和愉快。即使与更昂贵的Legion 游戏笔记本相比,我们的评测单元也表现得非常好,我们在输入长文本时没有问题。游戏玩家将从大的偏移光标键中受益。该设备缺乏RGB背光,而是采用了两段式白色背光。尽管如此,也可以选择4区RGB背光。
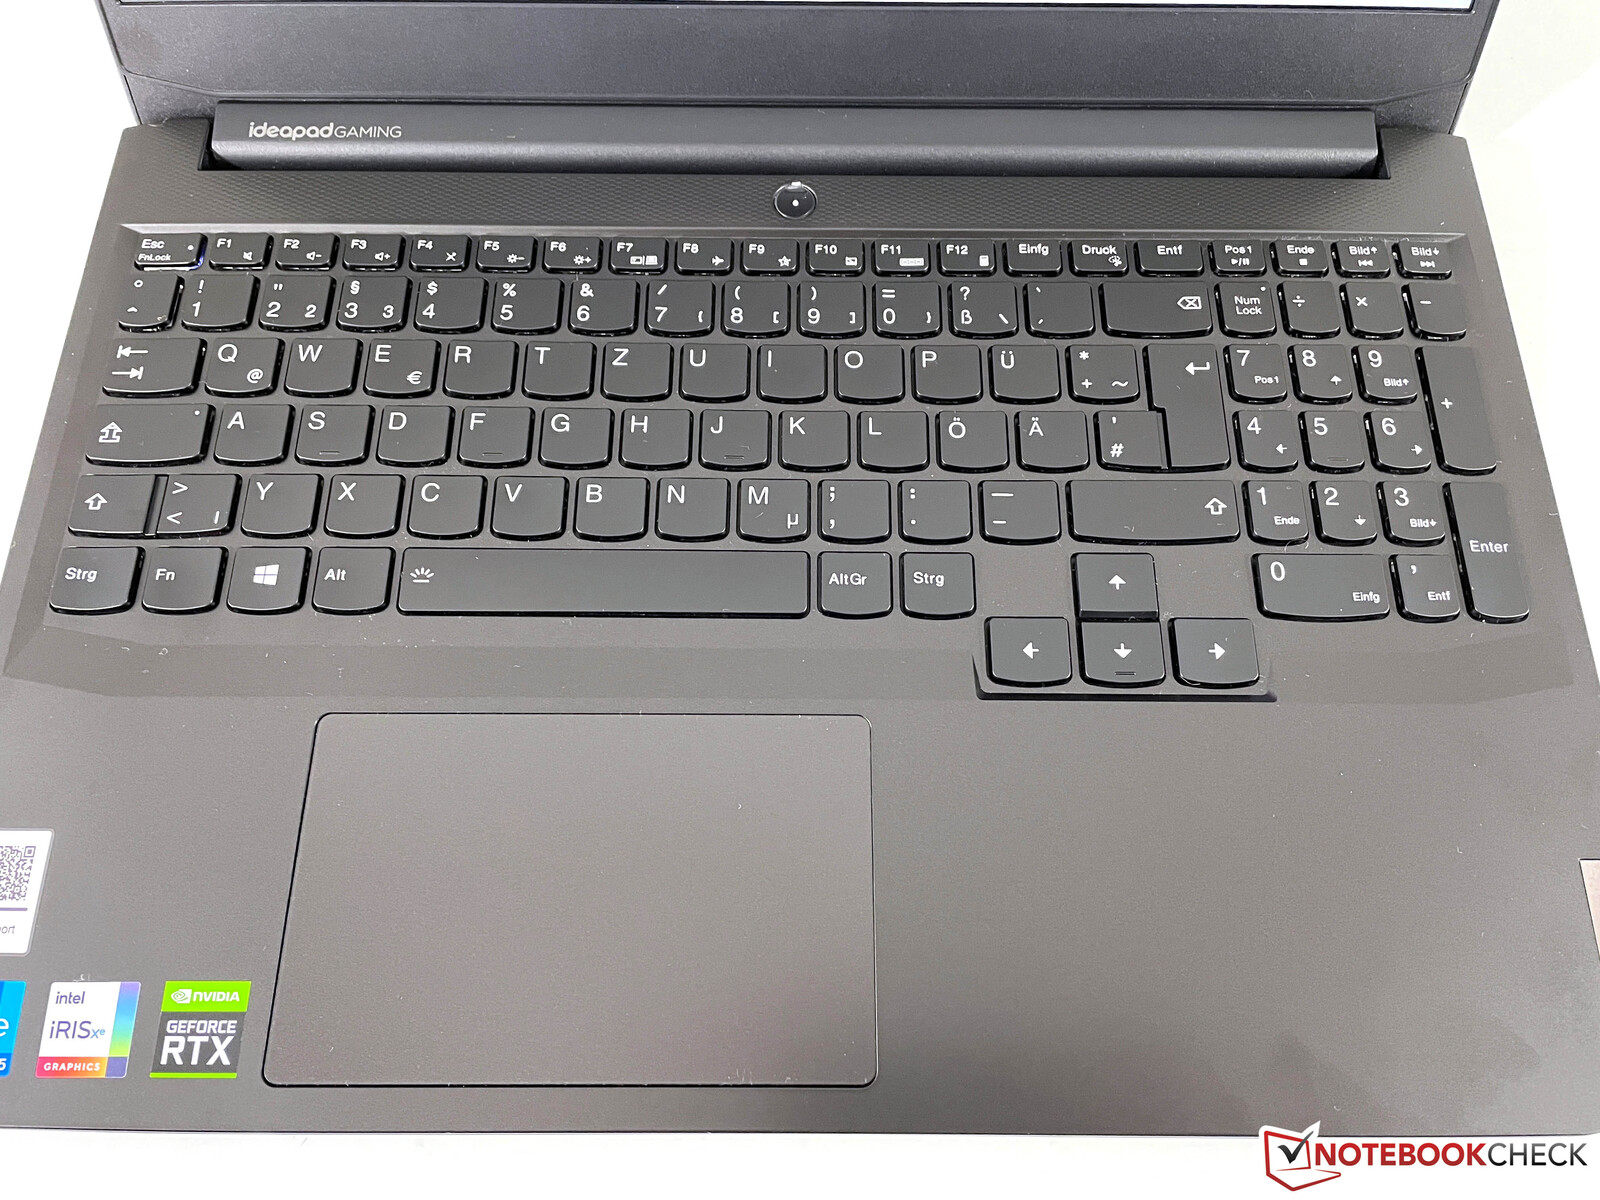
触摸板
点击板向左移动,在空格键的下方居中。12 x 7.5厘米(4.72 x 2.95英寸)的尺寸足够大,而且由于其光滑的表面,使用和控制光标都很容易。在底部,我们发现了集成的按钮,按下时产生了响亮且非常明显的点击声。鼠标垫支持微软的Precision 标准,因此最多可以用四个手指做手势。
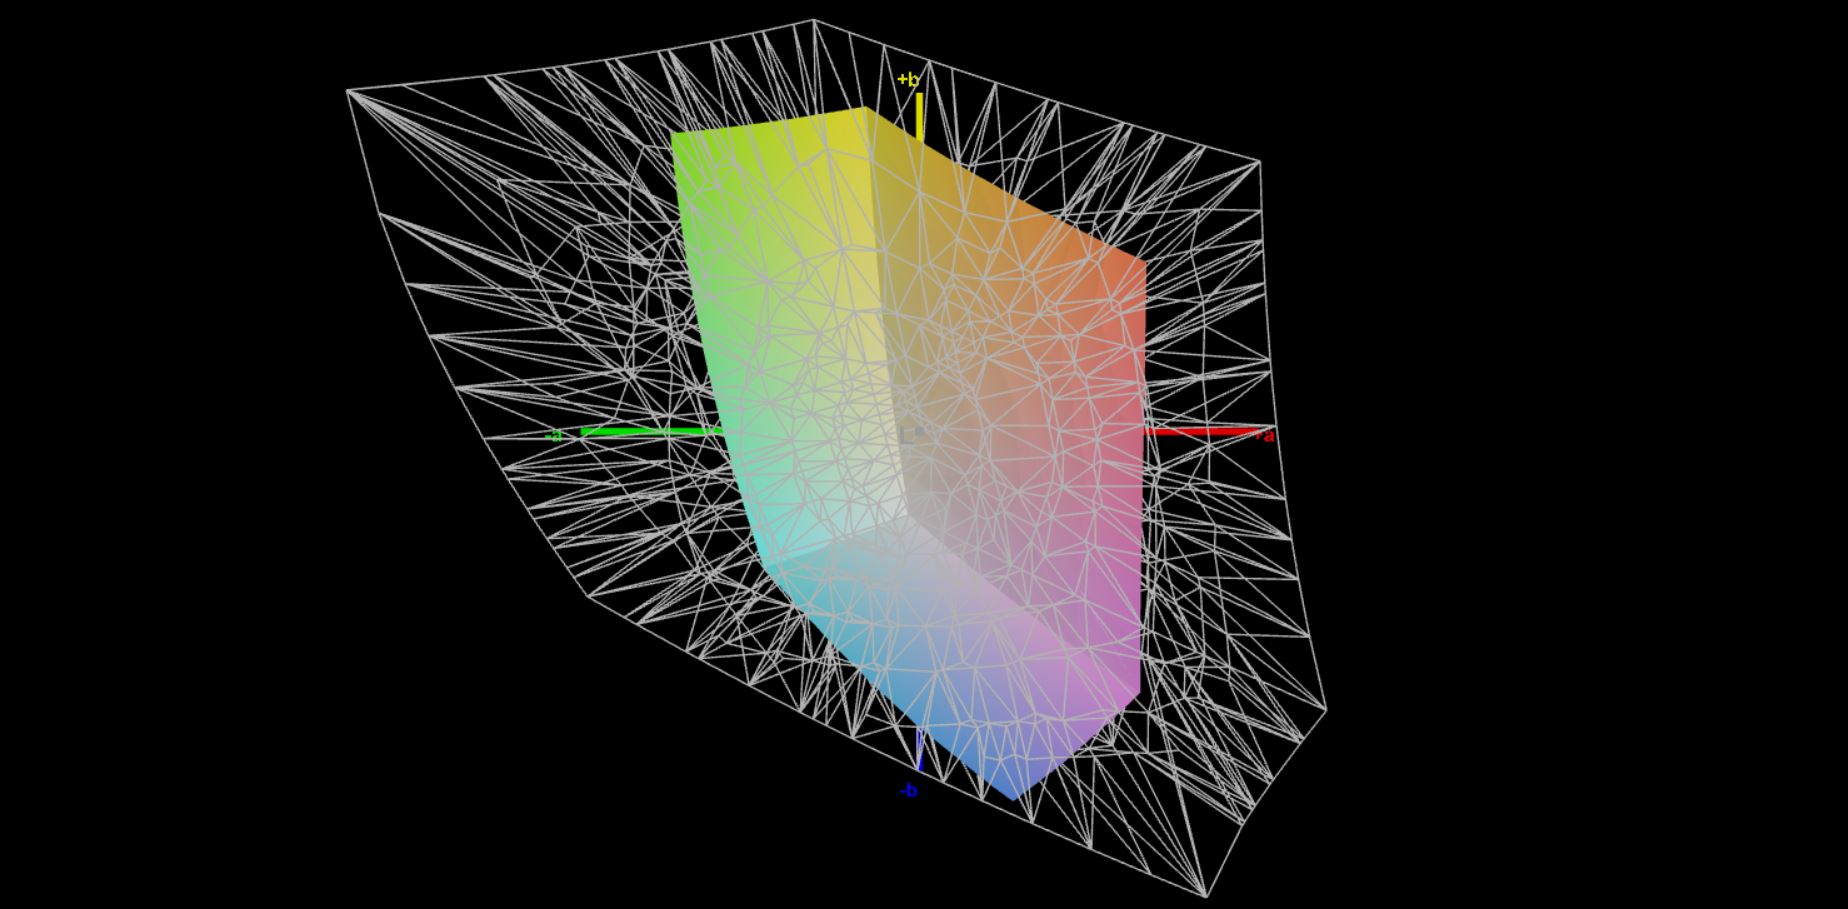
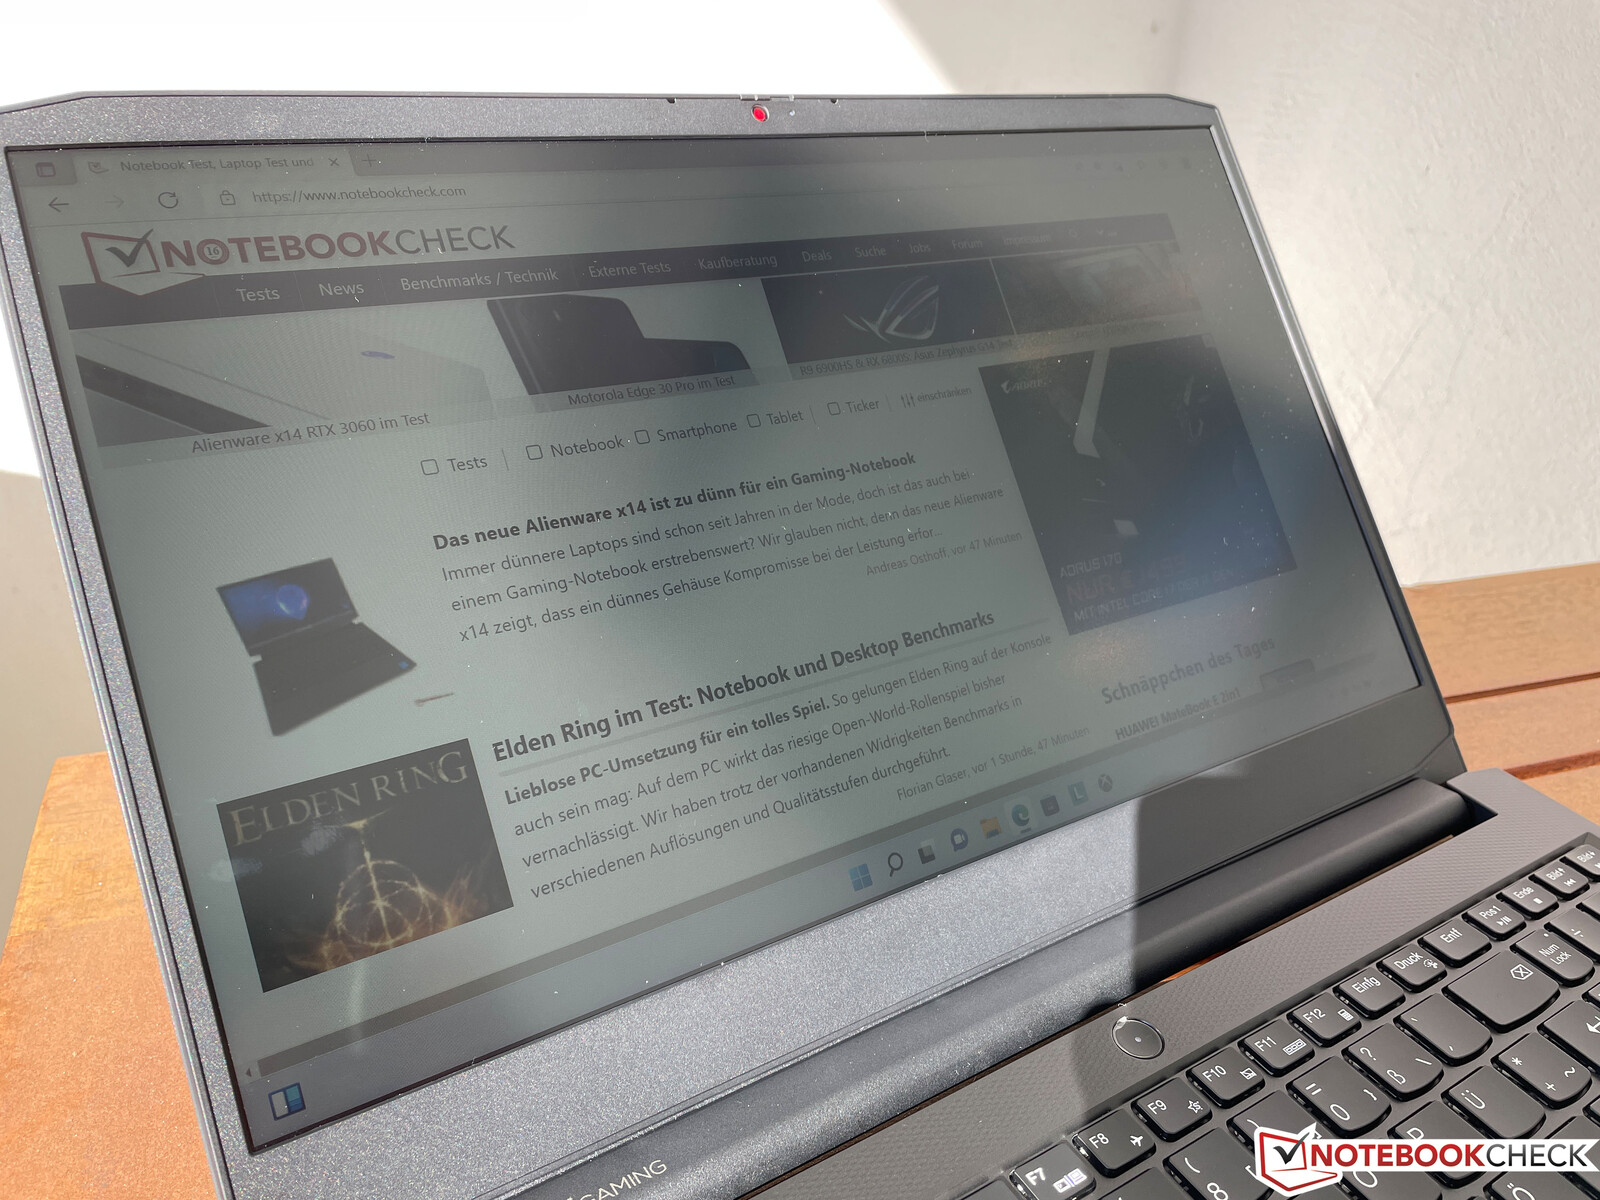
显示屏 - 哑光IPS面板

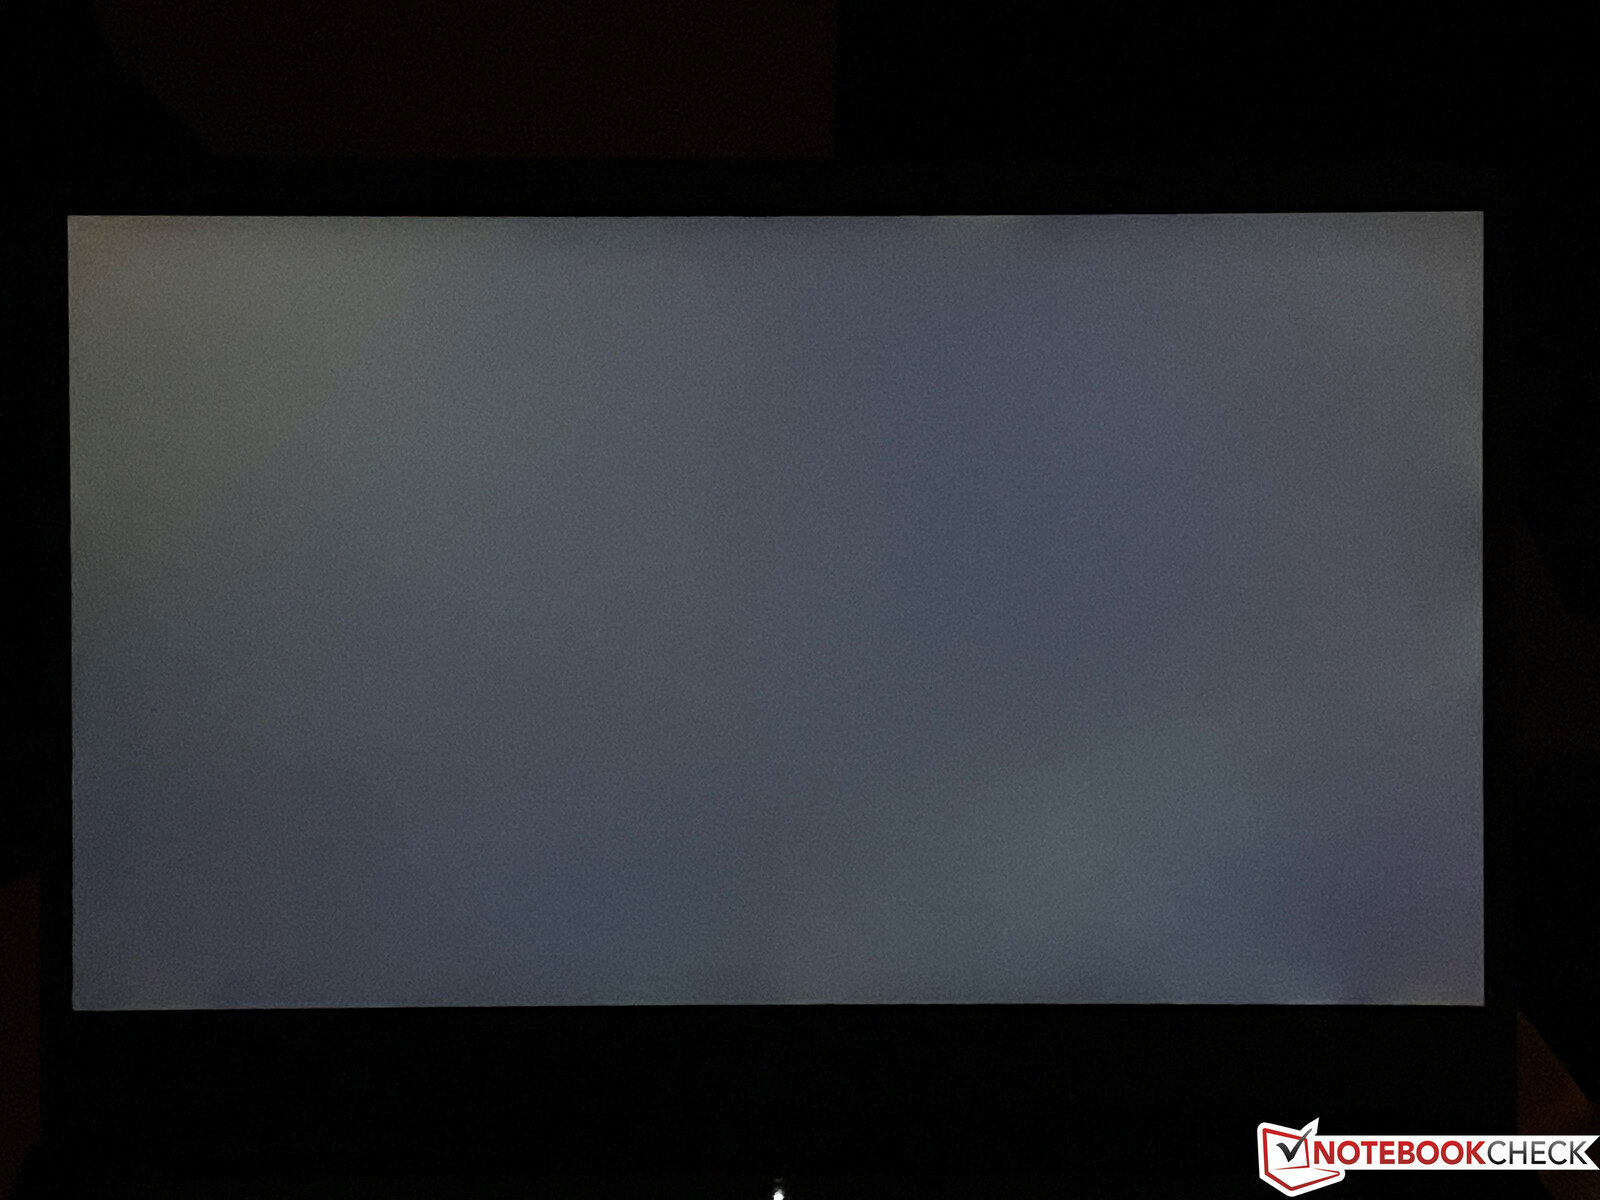
IdeaPad Gaming 3共有三种不同的1080p面板,所有这些面板都是哑光的,并基于IPS技术:我们的审查单位配备的标准60赫兹显示器(250尼特),120赫兹面板(250尼特),以及165赫兹面板(300尼特),全sRGB覆盖。
在我们的测试中,标准显示屏的峰值高于联想的额定亮度,并能达到300尼特的水平。然而,从主观上看,它充其量是好的,当然也是IdeaPad Gaming 3最明显的缺点。显示内容有些颗粒感,由于采用了磨砂显示涂层,颜色也不是特别强烈。我们没有发现PWM闪烁的证据,但在另一方面,反应时间相当迟钝。如果可以的话,我们强烈建议选择可选的165Hz面板。请记住,并非所有的显示器选项在所有地区都可用。
| |||||||||||||||||||||||||
Brightness Distribution: 88 %
Center on Battery: 307 cd/m²
Contrast: 1462:1 (Black: 0.21 cd/m²)
ΔE Color 5.9 | 0.5-29.43 Ø4.87, calibrated: 4.8
ΔE Greyscale 4.9 | 0.5-98 Ø5.1
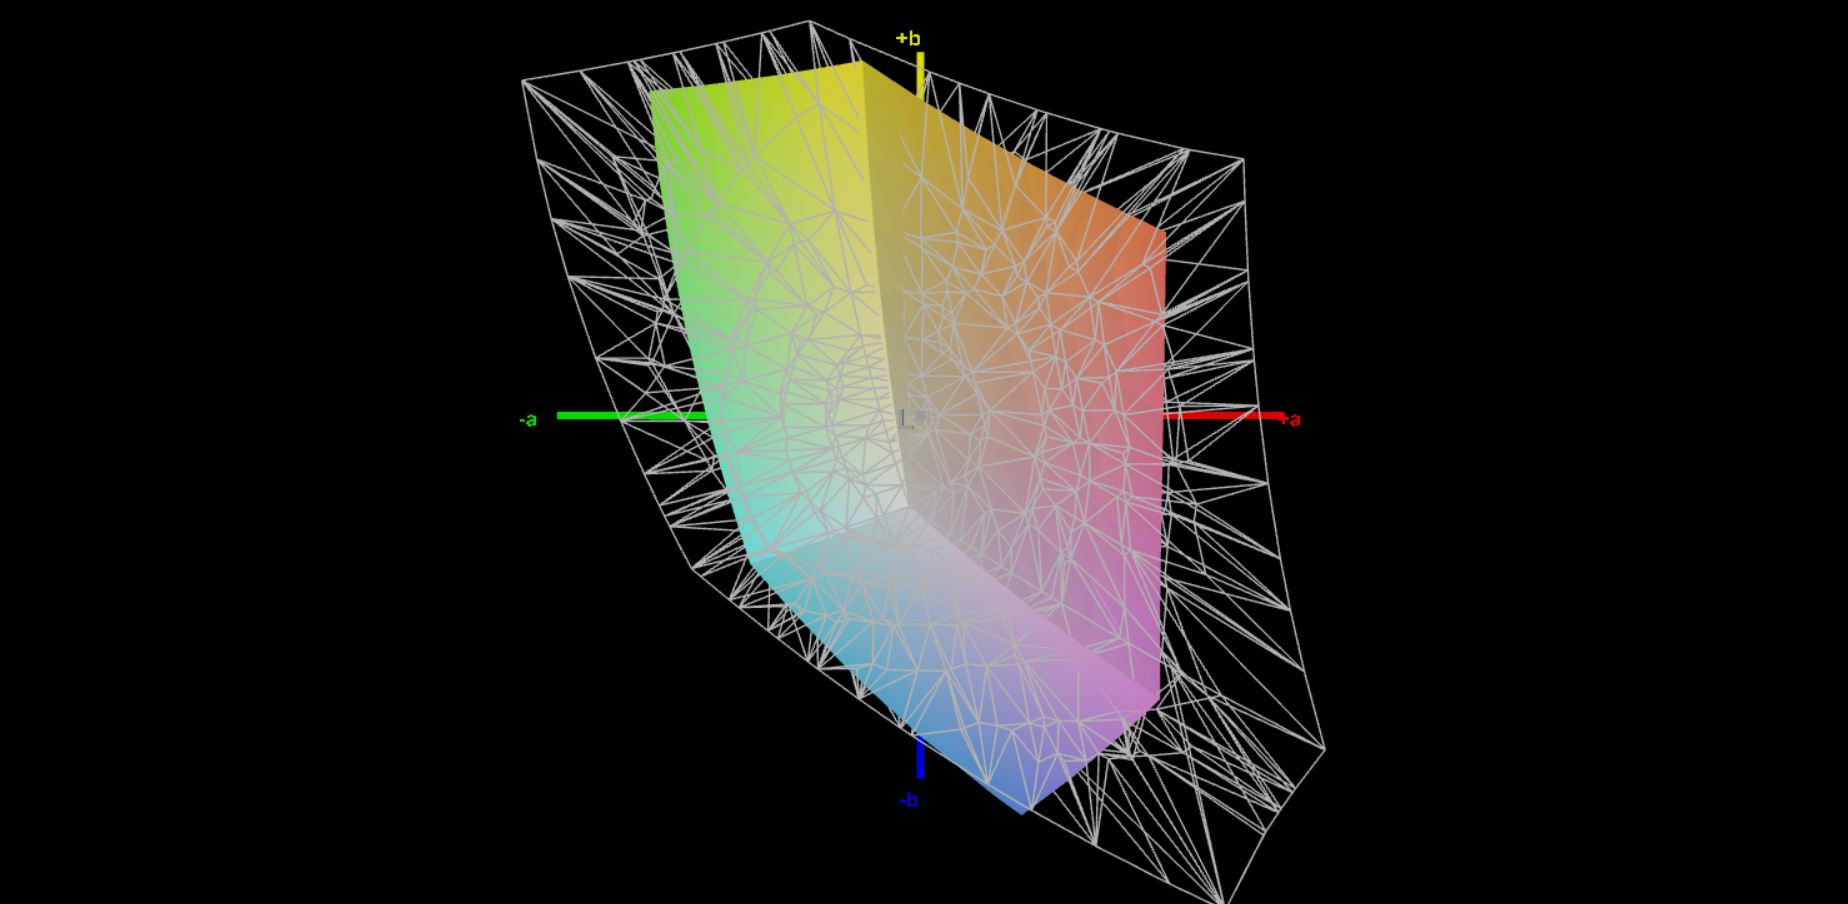
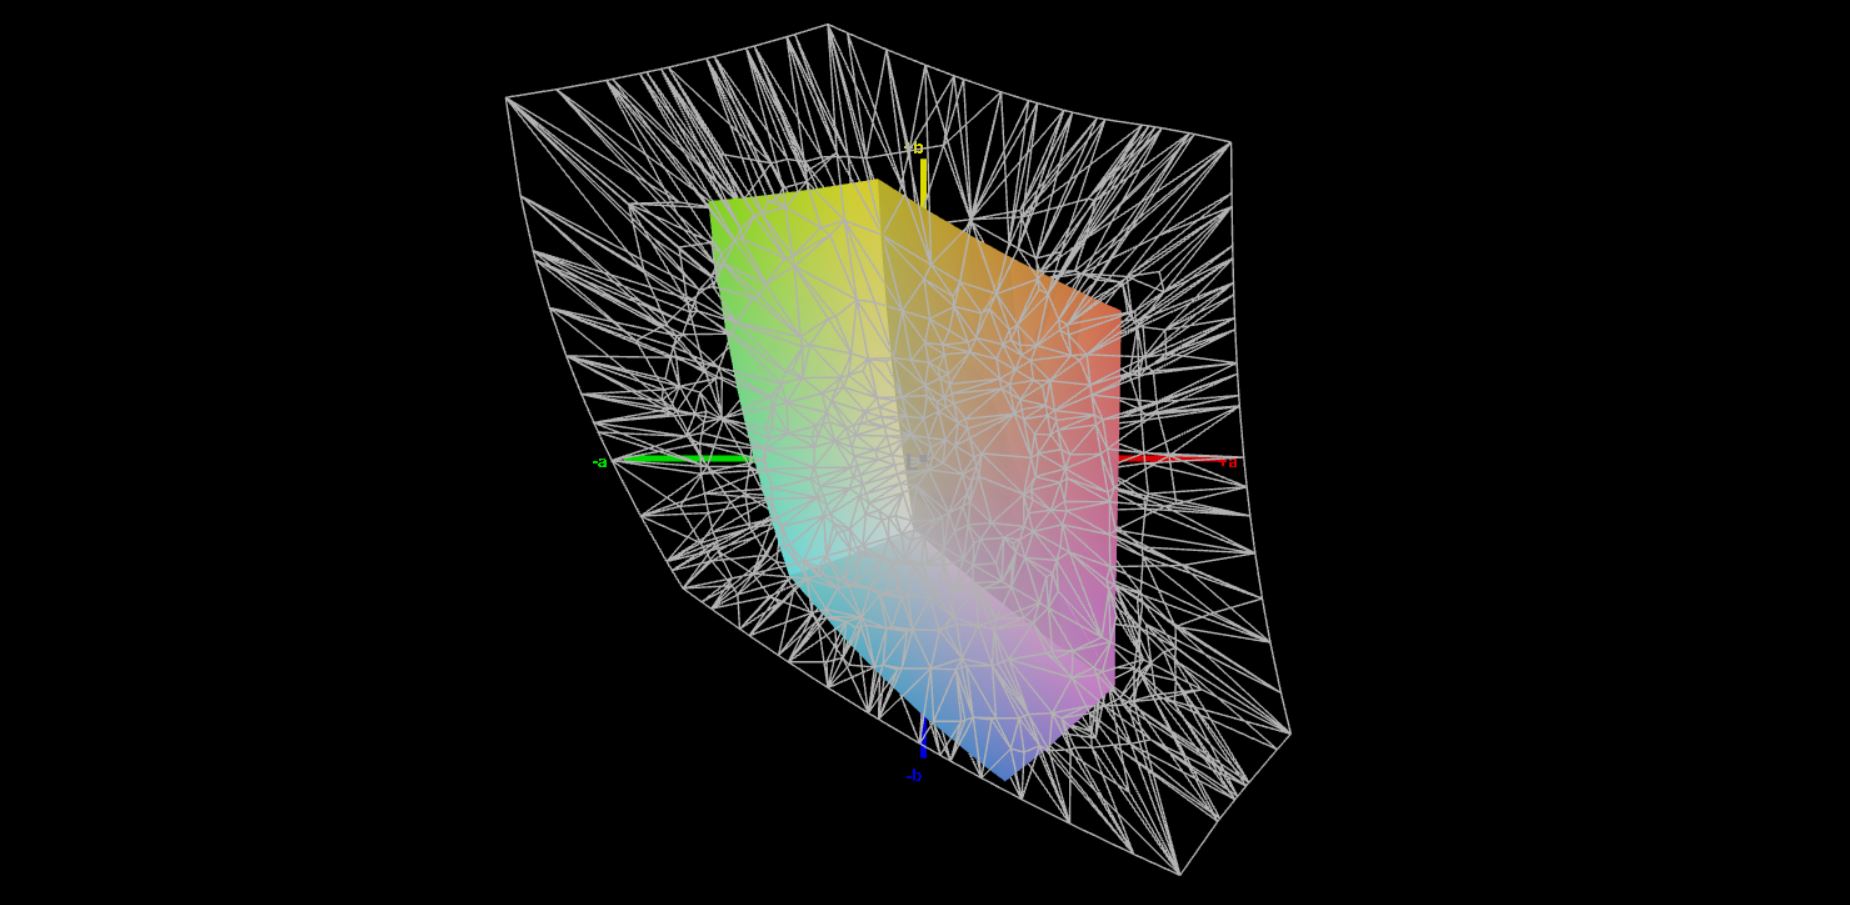
41.1% AdobeRGB 1998 (Argyll 2.2.0 3D)
59.6% sRGB (Argyll 2.2.0 3D)
39.7% Display P3 (Argyll 2.2.0 3D)
Gamma: 2.26
| Lenovo Ideapad Gaming 3 15IHU-82K1002RGE LEN156FHD, IPS, 1920x1080, 15.6" | Dell G15 5515 BOE092A, IPS, 1920x1080, 15.6" | Gigabyte G5 GD Chi Mei N156HRA-EA1, IPS, 1920x1080, 15.6" | Medion Erazer Deputy P25 Panda LM156LF-2F03, IPS, 1920x1080, 15.6" | SCHENKER XMG Focus 15 LG Philips LP156WFG-SPB5, IPS, 1920x1080, 15.6" | Lenovo Legion 5 15ACH-82JU00C6GE-FL B156HAN12.H, , 1920x1080, 15.6" | |
|---|---|---|---|---|---|---|
| Display | -3% | 5% | 0% | 62% | 64% | |
| Display P3 Coverage | 39.7 | 39.1 -2% | 41.8 5% | 39.7 0% | 64.6 63% | 65.4 65% |
| sRGB Coverage | 59.6 | 56.9 -5% | 62.3 5% | 59.7 0% | 95.3 60% | 96.3 62% |
| AdobeRGB 1998 Coverage | 41.1 | 40.4 -2% | 43.2 5% | 41.1 0% | 66.5 62% | 67.5 64% |
| Response Times | 49% | 30% | 14% | 68% | 73% | |
| Response Time Grey 50% / Grey 80% * | 46.4 ? | 25.2 ? 46% | 34.4 ? 26% | 40.4 ? 13% | 18 ? 61% | 13.6 ? 71% |
| Response Time Black / White * | 35.2 ? | 16.8 ? 52% | 23.2 ? 34% | 30.4 ? 14% | 8.8 ? 75% | 9.2 ? 74% |
| PWM Frequency | 200 ? | |||||
| Screen | -10% | 10% | 8% | 23% | 15% | |
| Brightness middle | 307 | 278 -9% | 261 -15% | 283 -8% | 418 36% | 350 14% |
| Brightness | 292 | 262 -10% | 246 -16% | 266 -9% | 376 29% | 350 20% |
| Brightness Distribution | 88 | 83 -6% | 87 -1% | 85 -3% | 83 -6% | 96 9% |
| Black Level * | 0.21 | 0.36 -71% | 0.19 10% | 0.2 5% | 0.41 -95% | 0.3 -43% |
| Contrast | 1462 | 772 -47% | 1374 -6% | 1415 -3% | 1020 -30% | 1167 -20% |
| Colorchecker dE 2000 * | 5.9 | 5.74 3% | 3.9 34% | 5.32 10% | 1.67 72% | 3.9 34% |
| Colorchecker dE 2000 max. * | 21.6 | 19.63 9% | 19.26 11% | 17.68 18% | 3.88 82% | 8.2 62% |
| Colorchecker dE 2000 calibrated * | 4.8 | 4.7 2% | 3.24 32% | 3.94 18% | 0.98 80% | 1.6 67% |
| Greyscale dE 2000 * | 4.9 | 3.1 37% | 2.7 45% | 2.9 41% | 2.9 41% | 5.5 -12% |
| Gamma | 2.26 97% | 2.011 109% | 2.248 98% | 2.062 107% | 2.26 97% | 2.15 102% |
| CCT | 6504 100% | 6207 105% | 6828 95% | 7167 91% | 6209 105% | 7414 88% |
| Total Average (Program / Settings) | 12% /
-0% | 15% /
12% | 7% /
7% | 51% /
38% | 51% /
33% |
* ... smaller is better
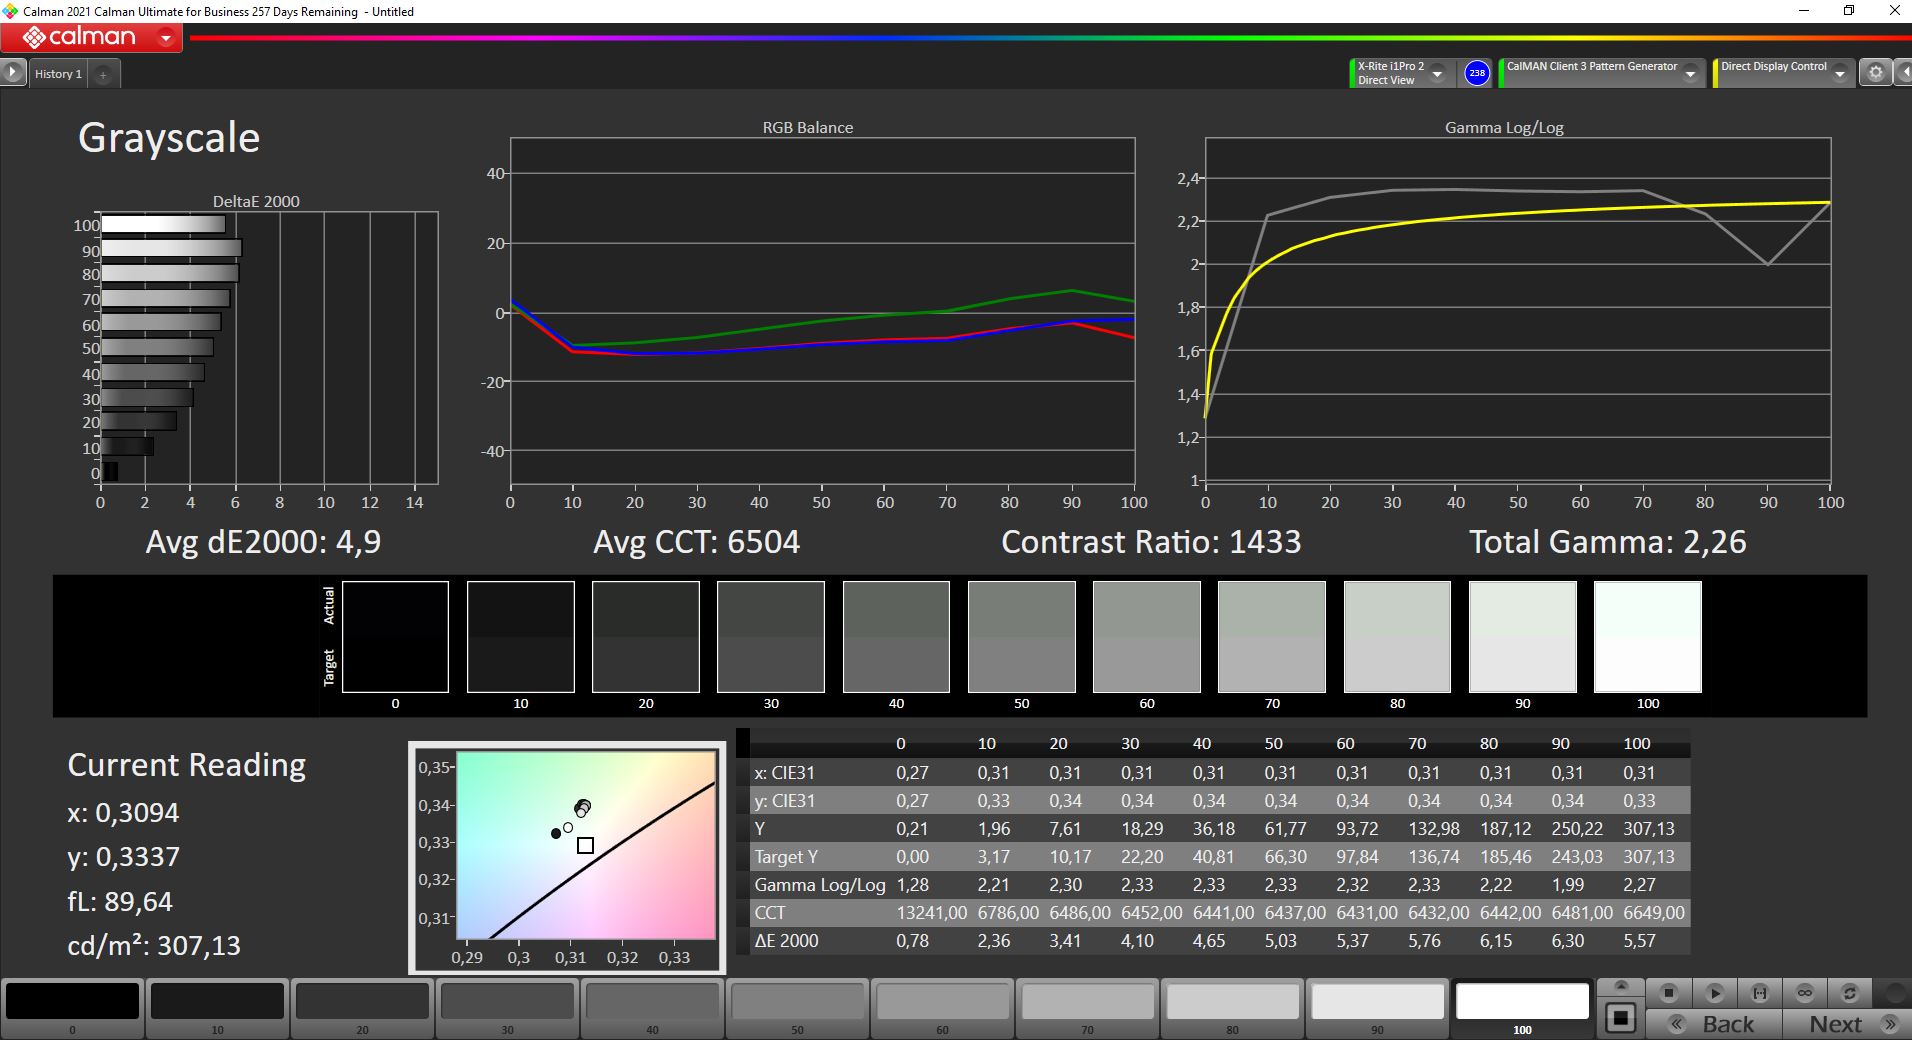
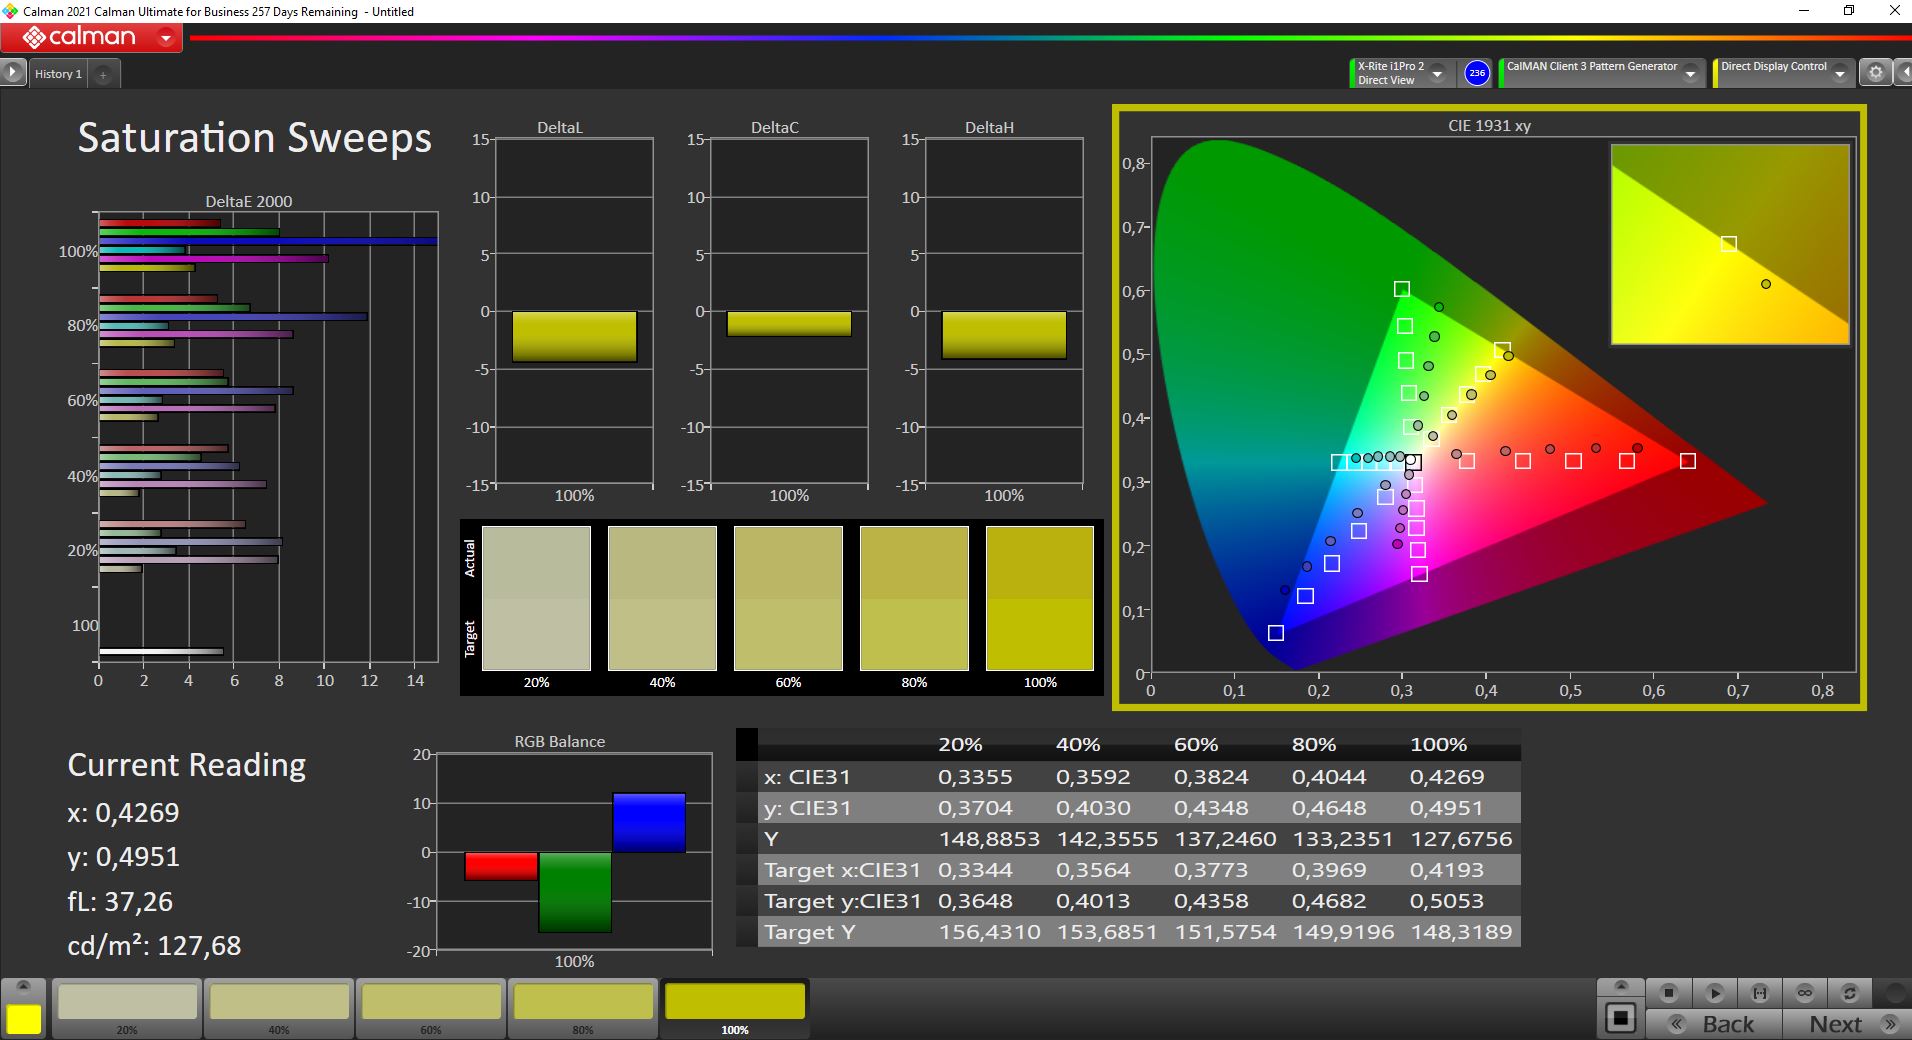
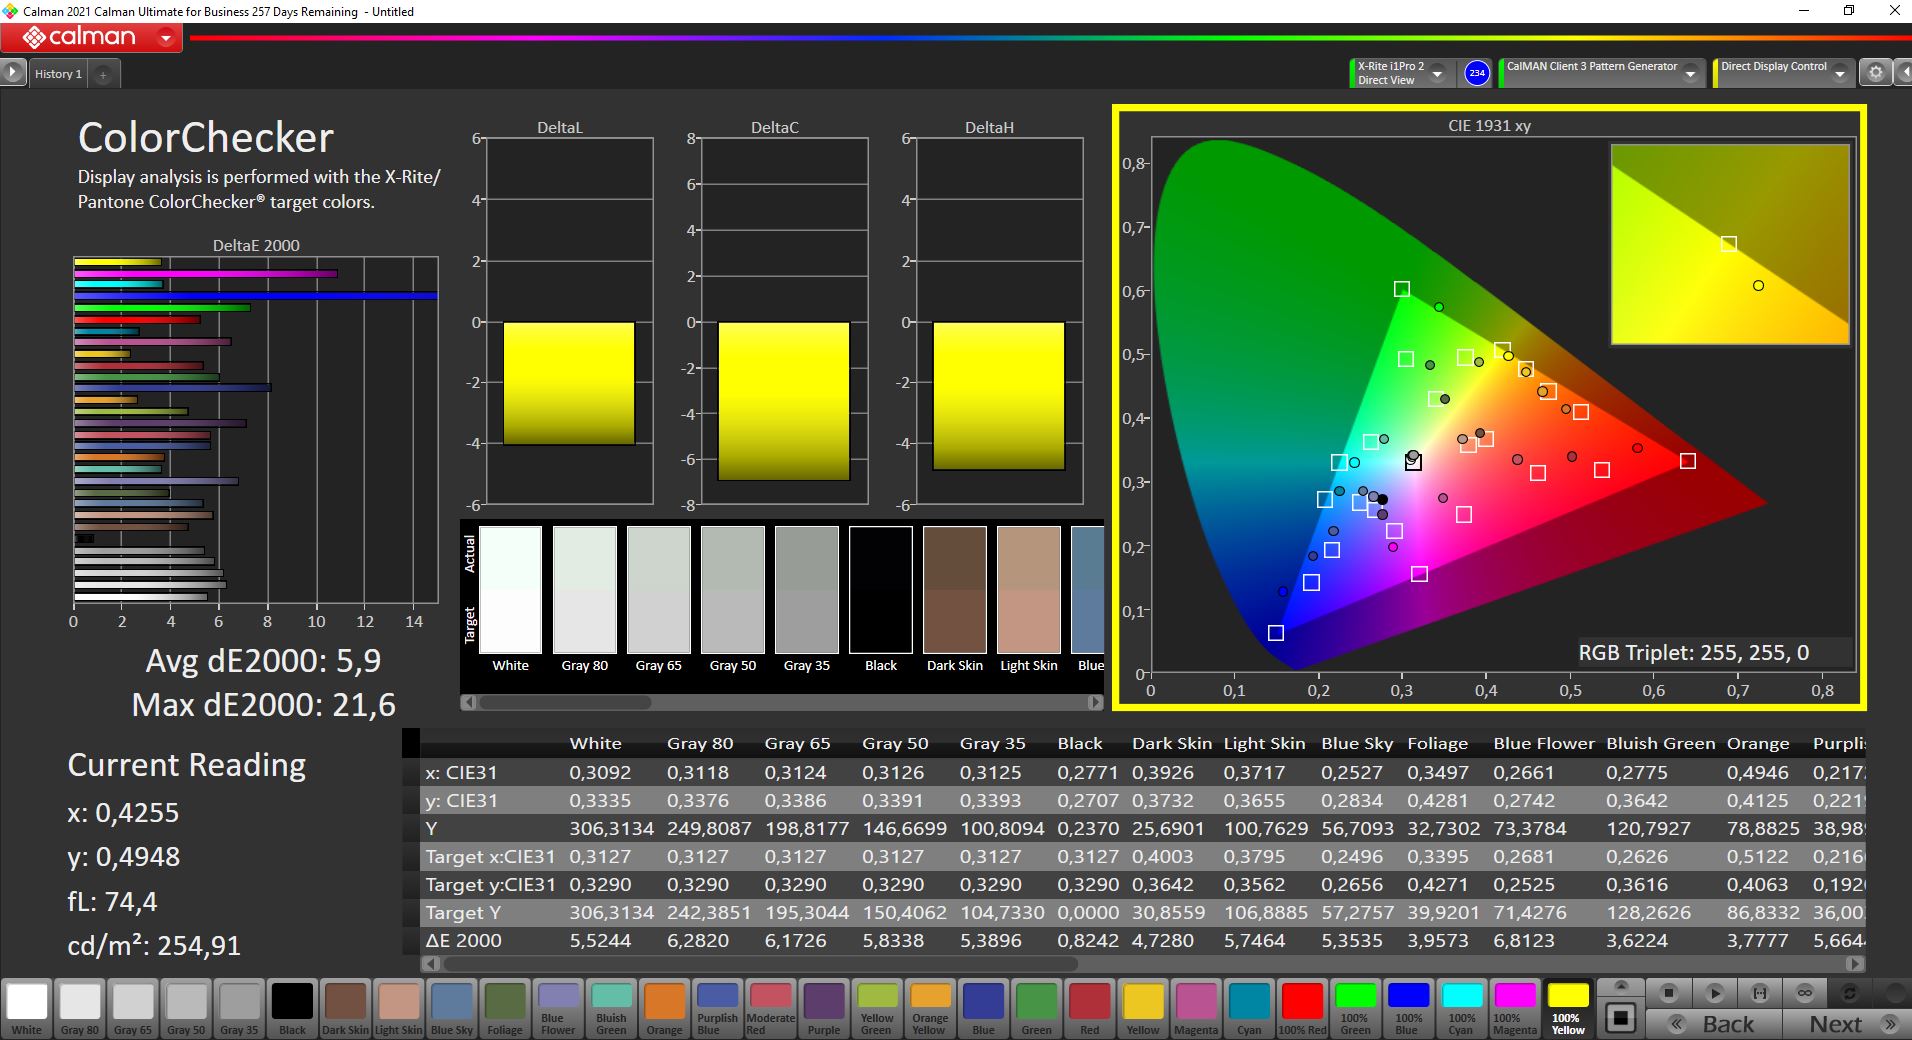
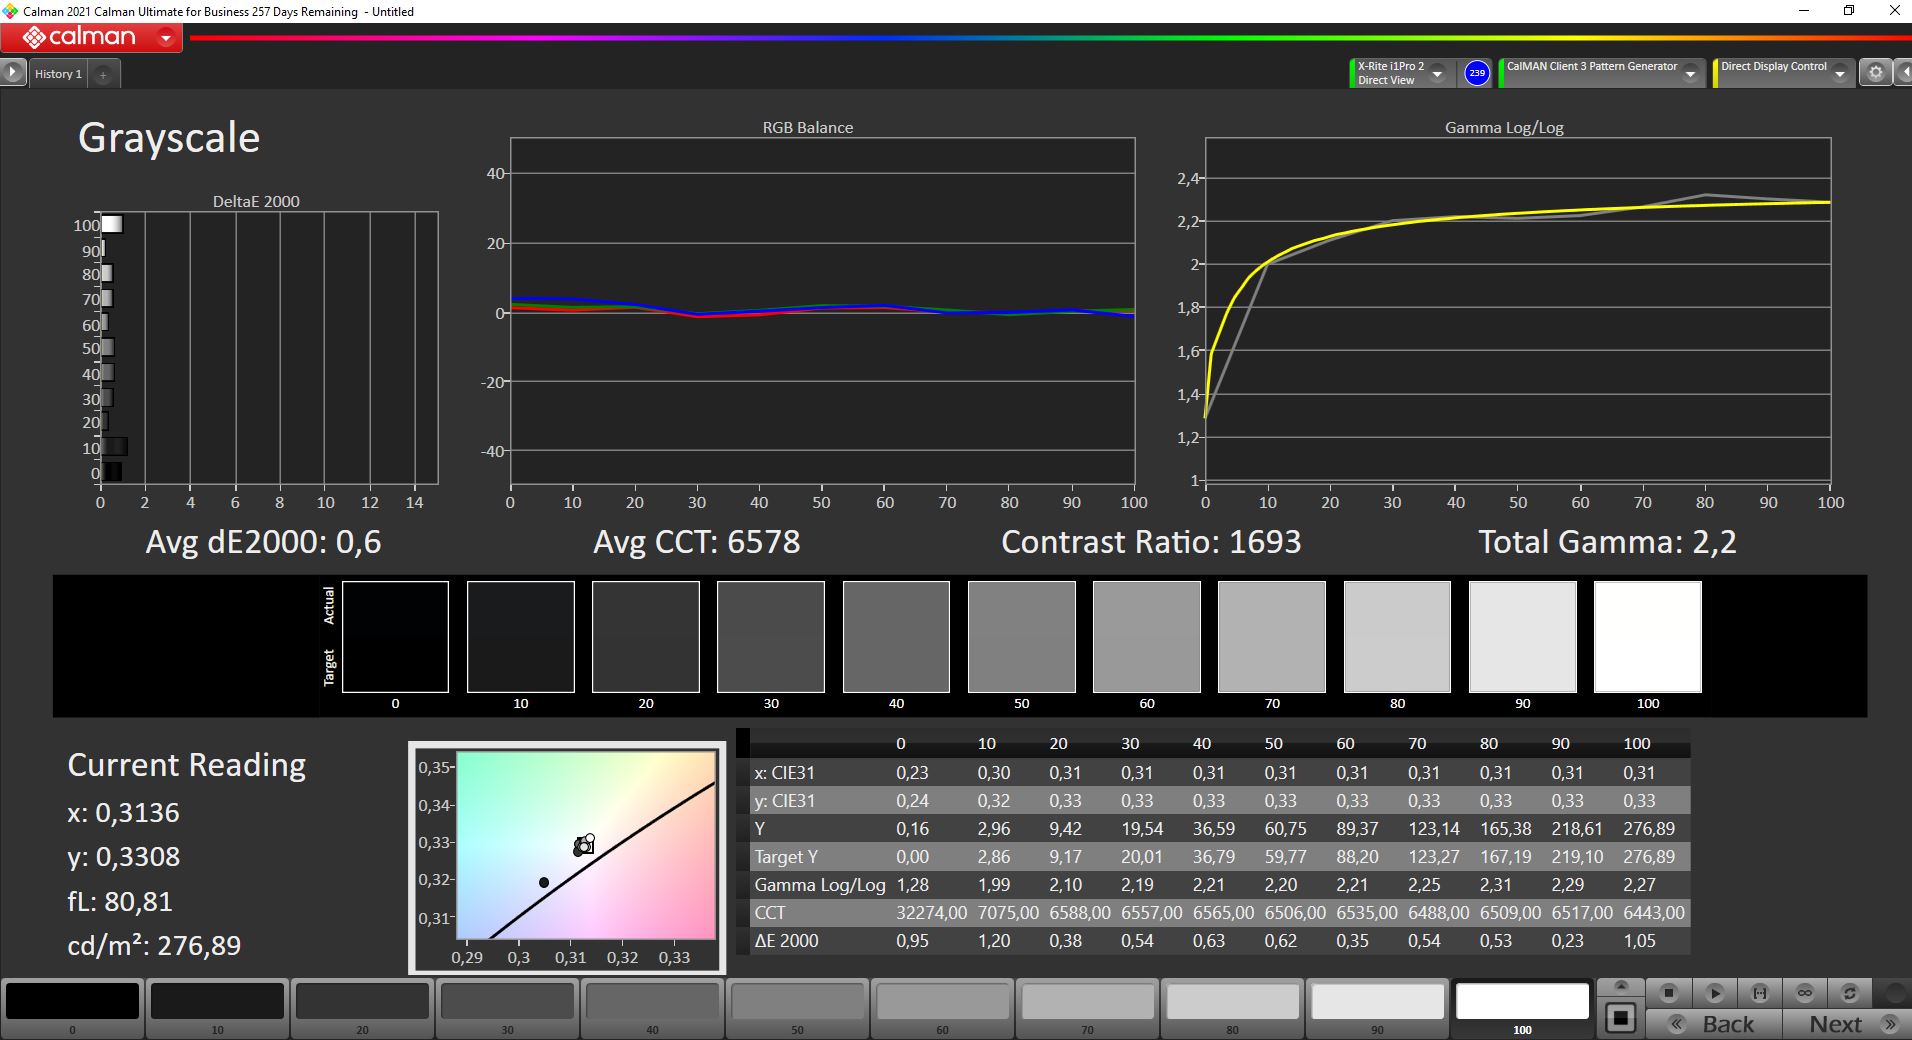
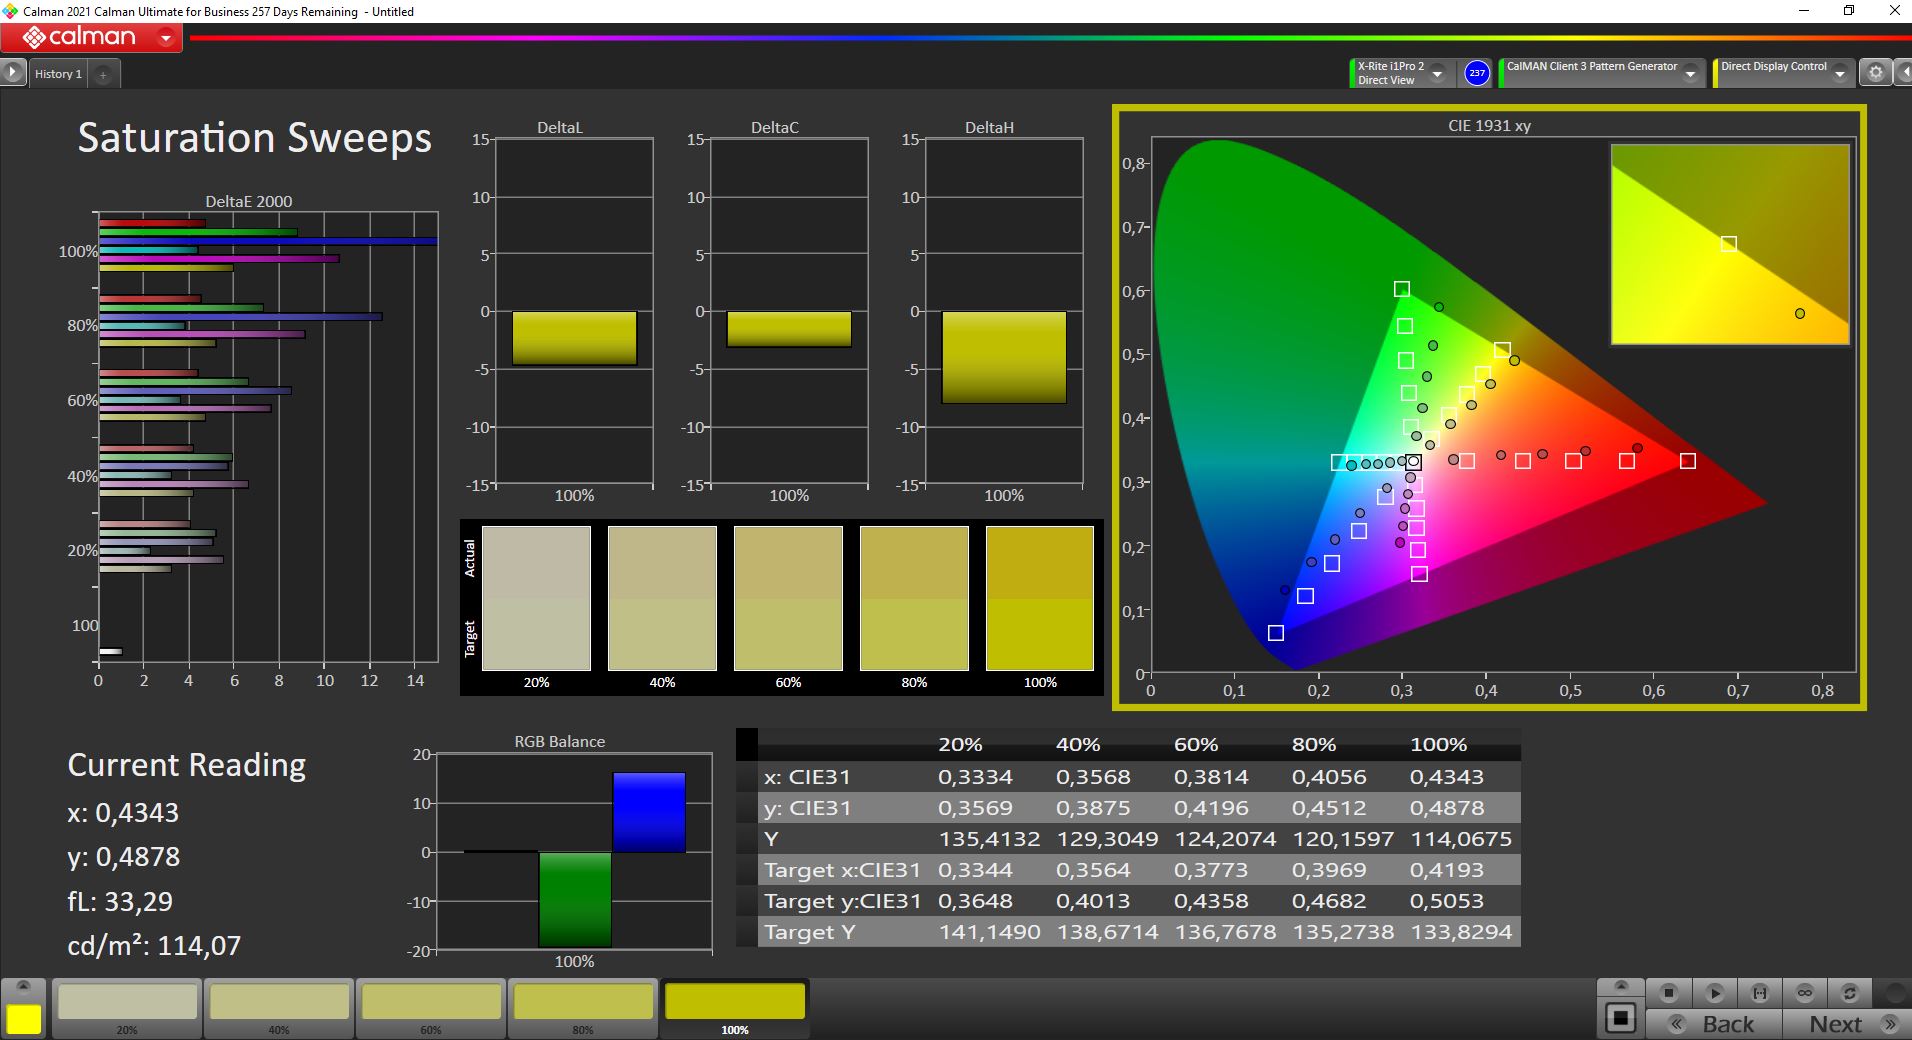
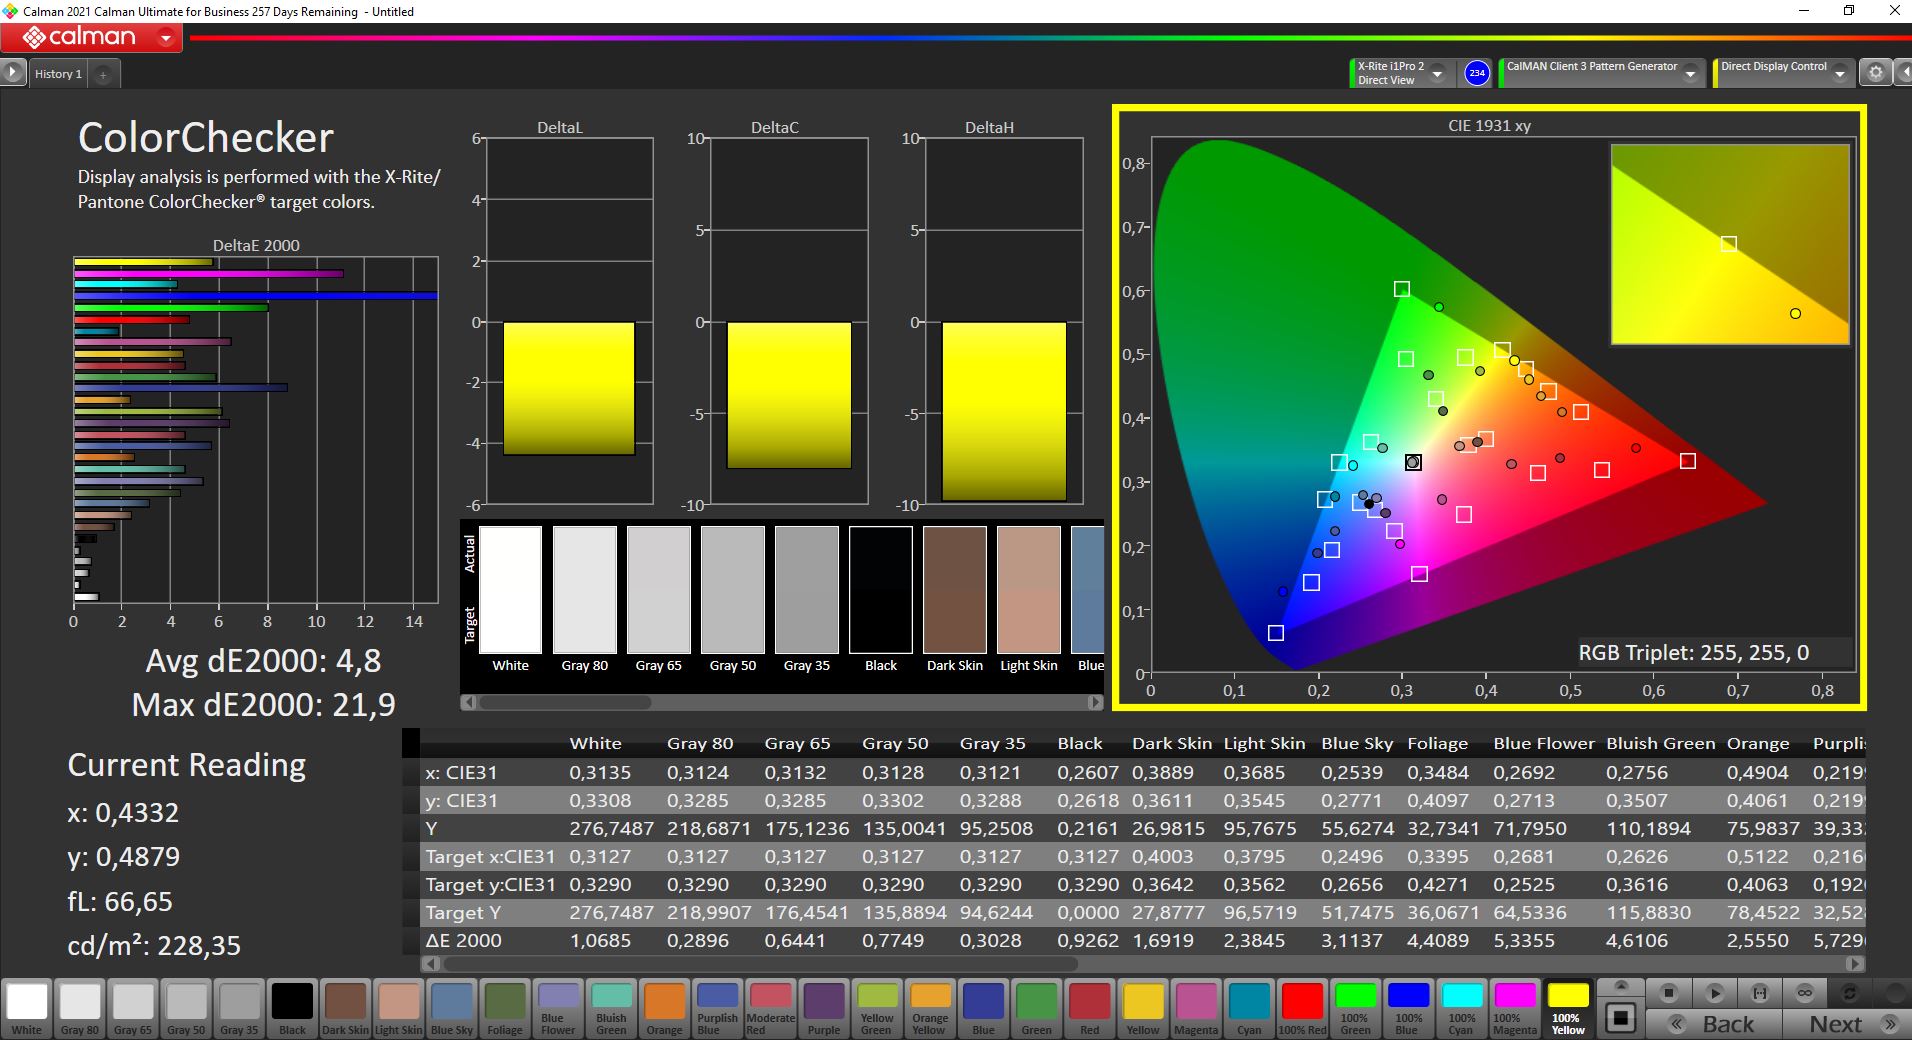
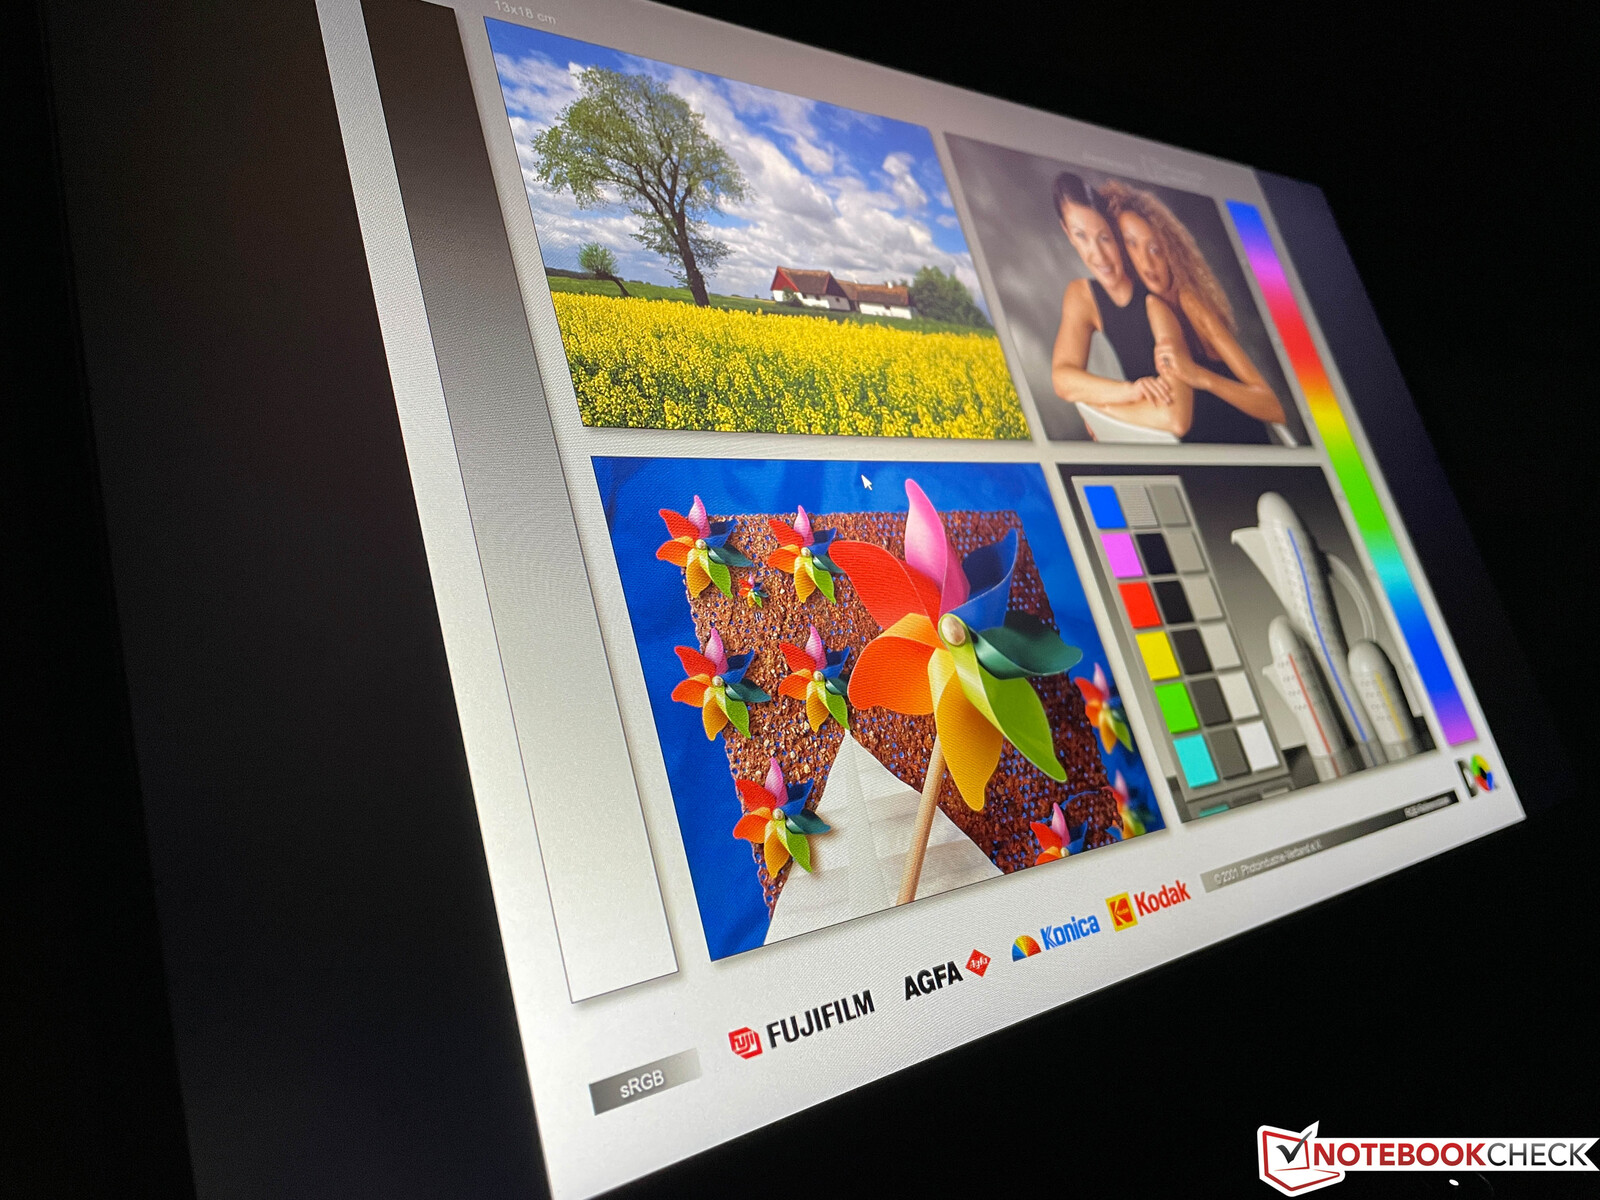
当使用专业的CalMAN软件(X-Rite i1 Pro 2)进行分析时,IPS面板的低价真的显示出来了。虽然它的灰度没有受到任何形式的明显色差的影响,但我们发现颜色是非常不准确的。我们能够通过校准来改善灰度,并且像往常一样,你可以在上面找到所产生的ICC配置文件供下载。请记住,我们的校准导致了整体亮度的轻微下降,而且我们根本无法改善显示面板的色彩准确性。该显示器根本没有能力实现更好的色彩,这可以从其相对较差的sRGB色彩空间覆盖率(仅60%)中得到证明。因此,该显示器不适合任何形式的照片编辑。
Display Response Times
| ↔ Response Time Black to White | ||
|---|---|---|
| 35.2 ms ... rise ↗ and fall ↘ combined | ↗ 18.8 ms rise | 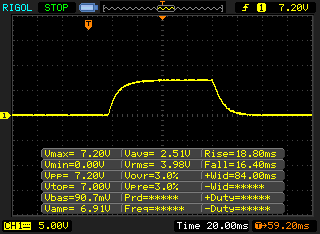 |
| ↘ 16.4 ms fall | ||
| The screen shows slow response rates in our tests and will be unsatisfactory for gamers. In comparison, all tested devices range from 0.1 (minimum) to 240 (maximum) ms. » 92 % of all devices are better. This means that the measured response time is worse than the average of all tested devices (20.8 ms). | ||
| ↔ Response Time 50% Grey to 80% Grey | ||
| 46.4 ms ... rise ↗ and fall ↘ combined | ↗ 21.2 ms rise | 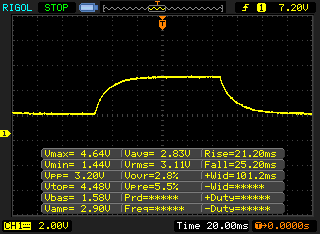 |
| ↘ 25.2 ms fall | ||
| The screen shows slow response rates in our tests and will be unsatisfactory for gamers. In comparison, all tested devices range from 0.165 (minimum) to 636 (maximum) ms. » 79 % of all devices are better. This means that the measured response time is worse than the average of all tested devices (32.5 ms). | ||
Screen Flickering / PWM (Pulse-Width Modulation)
| Screen flickering / PWM not detected | 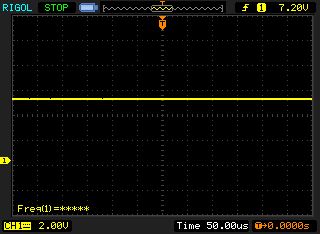 | ||
In comparison: 53 % of all tested devices do not use PWM to dim the display. If PWM was detected, an average of 8516 (minimum: 5 - maximum: 343500) Hz was measured. | |||
由于其哑光显示涂层,只要不是太亮,IdeaPad Gaming 3就可以在户外使用。作为典型的IPS面板,它的可视角度非常宽。
性能 - IdeaPad配备Tiger Lake 和RTX 3000
测试条件
联想预装的Vantage软件带有三个电源配置文件。静音、自动和性能。在静音和自动模式下,GPU的功率被限制在60W,而性能模式下则可以释放全部90W。请记住,性能模式在电池上是不可用的,这意味着我们的电池测试是在自动模式下进行的。
处理器
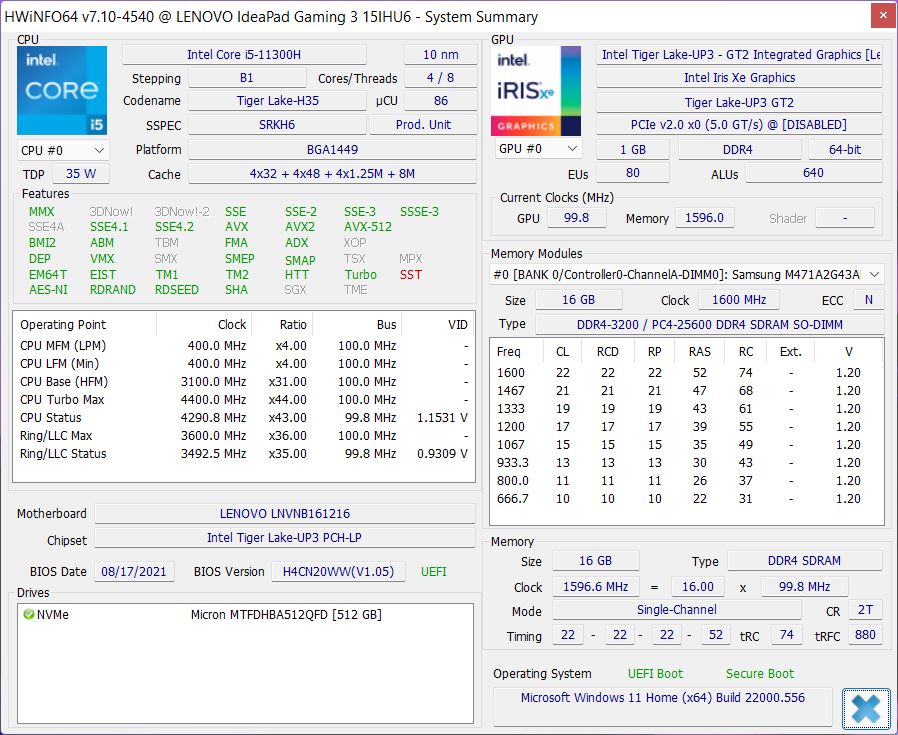
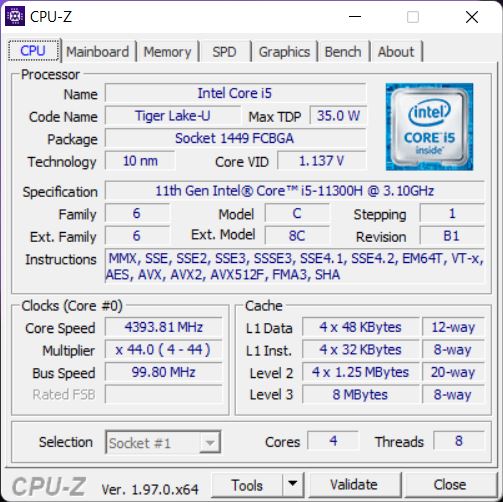
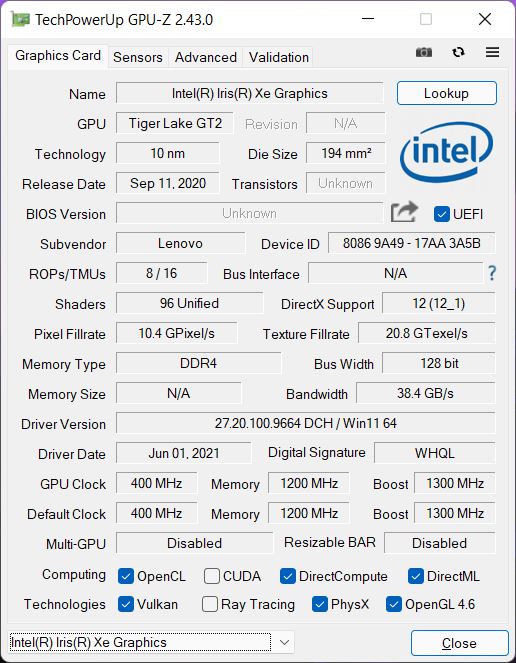
英特尔Tiger Lake H35处理器是一个老朋友。它是其Tiger Lake U兄弟姐妹的一个稍快的版本,有四个核心和一个内置的Iris Xe GPU。我们评测单位的Core i5-11300H,额定功率为42W,因此,即使在长时间的持续负载下,它的表现也非常稳定。
Cinebench R15 Multi Loop
我们的基准测试表明,虽然Core i5-11300H可能在单核性能方面能够跟上其竞争对手,但在多核情况下却完全被摧毁。H35Tiger Lake的最大优势,即Iris Xe GPU,在配备专用GPU的笔记本电脑中没有用处,我们更倾向于使用不同的Tiger Lake CPU,例如6核Core i5-11400H。正如随后的测试显示,该设备因其糟糕的CPU性能而受到极大的影响,例如在游戏时。另外,IdeaPad Gaming 3也可使用AMD Ryzen 5600H,其多核性能要高得多。
在电池上,CPU在短时间内被限制在只有25W。相应地,它在多核负载情况下的表现更差。其他CPU基准测试可以在我们的 技术部分.
Cinebench R23: Multi Core | Single Core
Cinebench R20: CPU (Multi Core) | CPU (Single Core)
Cinebench R15: CPU Multi 64Bit | CPU Single 64Bit
Blender: v2.79 BMW27 CPU
7-Zip 18.03: 7z b 4 | 7z b 4 -mmt1
Geekbench 5.5: Multi-Core | Single-Core
HWBOT x265 Benchmark v2.2: 4k Preset
LibreOffice : 20 Documents To PDF
R Benchmark 2.5: Overall mean
| CPU Performance Rating | |
| Average of class Gaming | |
| Medion Erazer Deputy P25 | |
| Lenovo Legion 5 15ACH-82JU00C6GE-FL | |
| SCHENKER XMG Focus 15 | |
| Dell G15 5515 | |
| Gigabyte G5 GD | |
| Lenovo Ideapad Gaming 3 15IHU-82K1002RGE | |
| Average Intel Core i5-11300H | |
| Cinebench R23 / Multi Core | |
| Average of class Gaming (5668 - 39652, n=151, last 2 years) | |
| Lenovo Legion 5 15ACH-82JU00C6GE-FL | |
| Medion Erazer Deputy P25 | |
| Dell G15 5515 | |
| SCHENKER XMG Focus 15 | |
| Gigabyte G5 GD | |
| Lenovo Ideapad Gaming 3 15IHU-82K1002RGE | |
| Average Intel Core i5-11300H (3313 - 6581, n=10) | |
| Cinebench R23 / Single Core | |
| Average of class Gaming (1136 - 2252, n=151, last 2 years) | |
| Gigabyte G5 GD | |
| Medion Erazer Deputy P25 | |
| Dell G15 5515 | |
| Lenovo Legion 5 15ACH-82JU00C6GE-FL | |
| SCHENKER XMG Focus 15 | |
| Average Intel Core i5-11300H (1218 - 1431, n=11) | |
| Lenovo Ideapad Gaming 3 15IHU-82K1002RGE | |
| Cinebench R20 / CPU (Multi Core) | |
| Average of class Gaming (2179 - 15517, n=151, last 2 years) | |
| Lenovo Legion 5 15ACH-82JU00C6GE-FL | |
| Medion Erazer Deputy P25 | |
| Dell G15 5515 | |
| SCHENKER XMG Focus 15 | |
| Gigabyte G5 GD | |
| Lenovo Ideapad Gaming 3 15IHU-82K1002RGE | |
| Average Intel Core i5-11300H (1300 - 2533, n=10) | |
| Cinebench R20 / CPU (Single Core) | |
| Average of class Gaming (439 - 866, n=151, last 2 years) | |
| Gigabyte G5 GD | |
| Medion Erazer Deputy P25 | |
| Dell G15 5515 | |
| Lenovo Legion 5 15ACH-82JU00C6GE-FL | |
| SCHENKER XMG Focus 15 | |
| Average Intel Core i5-11300H (431 - 548, n=11) | |
| Lenovo Ideapad Gaming 3 15IHU-82K1002RGE | |
| Cinebench R15 / CPU Multi 64Bit | |
| Average of class Gaming (905 - 6074, n=154, last 2 years) | |
| Lenovo Legion 5 15ACH-82JU00C6GE-FL | |
| Medion Erazer Deputy P25 | |
| Dell G15 5515 | |
| SCHENKER XMG Focus 15 | |
| Gigabyte G5 GD | |
| Lenovo Ideapad Gaming 3 15IHU-82K1002RGE | |
| Average Intel Core i5-11300H (632 - 990, n=11) | |
| Cinebench R15 / CPU Single 64Bit | |
| Average of class Gaming (191.9 - 343, n=151, last 2 years) | |
| Medion Erazer Deputy P25 | |
| Dell G15 5515 | |
| Lenovo Legion 5 15ACH-82JU00C6GE-FL | |
| Gigabyte G5 GD | |
| SCHENKER XMG Focus 15 | |
| Lenovo Ideapad Gaming 3 15IHU-82K1002RGE | |
| Average Intel Core i5-11300H (123 - 211, n=8) | |
| Blender / v2.79 BMW27 CPU | |
| Average Intel Core i5-11300H (466 - 862, n=10) | |
| Lenovo Ideapad Gaming 3 15IHU-82K1002RGE | |
| Gigabyte G5 GD | |
| SCHENKER XMG Focus 15 | |
| Dell G15 5515 | |
| Medion Erazer Deputy P25 | |
| Lenovo Legion 5 15ACH-82JU00C6GE-FL | |
| Average of class Gaming (81 - 555, n=144, last 2 years) | |
| 7-Zip 18.03 / 7z b 4 | |
| Average of class Gaming (23795 - 144064, n=149, last 2 years) | |
| Medion Erazer Deputy P25 | |
| Dell G15 5515 | |
| Lenovo Legion 5 15ACH-82JU00C6GE-FL | |
| SCHENKER XMG Focus 15 | |
| Gigabyte G5 GD | |
| Lenovo Ideapad Gaming 3 15IHU-82K1002RGE | |
| Average Intel Core i5-11300H (17573 - 26001, n=10) | |
| 7-Zip 18.03 / 7z b 4 -mmt1 | |
| Average of class Gaming (4199 - 7573, n=149, last 2 years) | |
| Dell G15 5515 | |
| Medion Erazer Deputy P25 | |
| Lenovo Legion 5 15ACH-82JU00C6GE-FL | |
| SCHENKER XMG Focus 15 | |
| Gigabyte G5 GD | |
| Average Intel Core i5-11300H (4603 - 4969, n=10) | |
| Lenovo Ideapad Gaming 3 15IHU-82K1002RGE | |
| Geekbench 5.5 / Multi-Core | |
| Average of class Gaming (4557 - 25855, n=148, last 2 years) | |
| SCHENKER XMG Focus 15 | |
| Lenovo Legion 5 15ACH-82JU00C6GE-FL | |
| Dell G15 5515 | |
| Medion Erazer Deputy P25 | |
| Gigabyte G5 GD | |
| Average Intel Core i5-11300H (3631 - 5499, n=10) | |
| Lenovo Ideapad Gaming 3 15IHU-82K1002RGE | |
| Geekbench 5.5 / Single-Core | |
| Average of class Gaming (986 - 2423, n=148, last 2 years) | |
| Gigabyte G5 GD | |
| SCHENKER XMG Focus 15 | |
| Medion Erazer Deputy P25 | |
| Lenovo Legion 5 15ACH-82JU00C6GE-FL | |
| Dell G15 5515 | |
| Average Intel Core i5-11300H (1342 - 1462, n=10) | |
| Lenovo Ideapad Gaming 3 15IHU-82K1002RGE | |
| HWBOT x265 Benchmark v2.2 / 4k Preset | |
| Average of class Gaming (6.72 - 42.9, n=148, last 2 years) | |
| Medion Erazer Deputy P25 | |
| Lenovo Legion 5 15ACH-82JU00C6GE-FL | |
| Dell G15 5515 | |
| SCHENKER XMG Focus 15 | |
| Gigabyte G5 GD | |
| Lenovo Ideapad Gaming 3 15IHU-82K1002RGE | |
| Average Intel Core i5-11300H (4.32 - 8.38, n=10) | |
| LibreOffice / 20 Documents To PDF | |
| Lenovo Legion 5 15ACH-82JU00C6GE-FL | |
| Dell G15 5515 | |
| Medion Erazer Deputy P25 | |
| Lenovo Ideapad Gaming 3 15IHU-82K1002RGE | |
| Average Intel Core i5-11300H (43.6 - 59.4, n=10) | |
| Average of class Gaming (19 - 96.6, n=147, last 2 years) | |
| SCHENKER XMG Focus 15 | |
| Gigabyte G5 GD | |
| R Benchmark 2.5 / Overall mean | |
| Average Intel Core i5-11300H (0.6 - 0.644, n=10) | |
| Lenovo Ideapad Gaming 3 15IHU-82K1002RGE | |
| SCHENKER XMG Focus 15 | |
| Gigabyte G5 GD | |
| Lenovo Legion 5 15ACH-82JU00C6GE-FL | |
| Medion Erazer Deputy P25 | |
| Dell G15 5515 | |
| Average of class Gaming (0.3609 - 0.759, n=150, last 2 years) | |
* ... smaller is better
AIDA64: FP32 Ray-Trace | FPU Julia | CPU SHA3 | CPU Queen | FPU SinJulia | FPU Mandel | CPU AES | CPU ZLib | FP64 Ray-Trace | CPU PhotoWorxx
| Performance Rating | |
| Average of class Gaming | |
| Lenovo Legion 5 15ACH-82JU00C6GE-FL | |
| Dell G15 5515 | |
| Medion Erazer Deputy P25 | |
| Gigabyte G5 GD | |
| Lenovo Ideapad Gaming 3 15IHU-82K1002RGE | |
| Average Intel Core i5-11300H | |
| AIDA64 / FP32 Ray-Trace | |
| Average of class Gaming (4986 - 81639, n=147, last 2 years) | |
| Lenovo Legion 5 15ACH-82JU00C6GE-FL | |
| Medion Erazer Deputy P25 | |
| Dell G15 5515 | |
| Gigabyte G5 GD | |
| Lenovo Ideapad Gaming 3 15IHU-82K1002RGE | |
| Average Intel Core i5-11300H (6128 - 8440, n=9) | |
| AIDA64 / FPU Julia | |
| Average of class Gaming (25360 - 252486, n=147, last 2 years) | |
| Lenovo Legion 5 15ACH-82JU00C6GE-FL | |
| Medion Erazer Deputy P25 | |
| Dell G15 5515 | |
| Gigabyte G5 GD | |
| Lenovo Ideapad Gaming 3 15IHU-82K1002RGE | |
| Average Intel Core i5-11300H (25739 - 33986, n=9) | |
| AIDA64 / CPU SHA3 | |
| Average of class Gaming (1339 - 10389, n=147, last 2 years) | |
| Lenovo Legion 5 15ACH-82JU00C6GE-FL | |
| Medion Erazer Deputy P25 | |
| Dell G15 5515 | |
| Gigabyte G5 GD | |
| Lenovo Ideapad Gaming 3 15IHU-82K1002RGE | |
| Average Intel Core i5-11300H (1773 - 2286, n=9) | |
| AIDA64 / CPU Queen | |
| Average of class Gaming (50699 - 200651, n=147, last 2 years) | |
| Lenovo Legion 5 15ACH-82JU00C6GE-FL | |
| Medion Erazer Deputy P25 | |
| Dell G15 5515 | |
| Gigabyte G5 GD | |
| Lenovo Ideapad Gaming 3 15IHU-82K1002RGE | |
| Average Intel Core i5-11300H (41257 - 49312, n=9) | |
| AIDA64 / FPU SinJulia | |
| Average of class Gaming (4800 - 32988, n=147, last 2 years) | |
| Medion Erazer Deputy P25 | |
| Dell G15 5515 | |
| Lenovo Legion 5 15ACH-82JU00C6GE-FL | |
| Gigabyte G5 GD | |
| Lenovo Ideapad Gaming 3 15IHU-82K1002RGE | |
| Average Intel Core i5-11300H (3925 - 4677, n=9) | |
| AIDA64 / FPU Mandel | |
| Average of class Gaming (12321 - 134044, n=147, last 2 years) | |
| Lenovo Legion 5 15ACH-82JU00C6GE-FL | |
| Medion Erazer Deputy P25 | |
| Dell G15 5515 | |
| Gigabyte G5 GD | |
| Lenovo Ideapad Gaming 3 15IHU-82K1002RGE | |
| Average Intel Core i5-11300H (15820 - 20669, n=9) | |
| AIDA64 / CPU AES | |
| Lenovo Legion 5 15ACH-82JU00C6GE-FL | |
| Dell G15 5515 | |
| Average of class Gaming (19065 - 328679, n=147, last 2 years) | |
| Gigabyte G5 GD | |
| Lenovo Ideapad Gaming 3 15IHU-82K1002RGE | |
| Average Intel Core i5-11300H (37694 - 71519, n=9) | |
| Medion Erazer Deputy P25 | |
| AIDA64 / CPU ZLib | |
| Average of class Gaming (373 - 2531, n=147, last 2 years) | |
| Lenovo Legion 5 15ACH-82JU00C6GE-FL | |
| Medion Erazer Deputy P25 | |
| Dell G15 5515 | |
| Gigabyte G5 GD | |
| Lenovo Ideapad Gaming 3 15IHU-82K1002RGE | |
| Average Intel Core i5-11300H (269 - 390, n=9) | |
| AIDA64 / FP64 Ray-Trace | |
| Average of class Gaming (2540 - 43430, n=147, last 2 years) | |
| Medion Erazer Deputy P25 | |
| Lenovo Legion 5 15ACH-82JU00C6GE-FL | |
| Dell G15 5515 | |
| Gigabyte G5 GD | |
| Lenovo Ideapad Gaming 3 15IHU-82K1002RGE | |
| Average Intel Core i5-11300H (3322 - 4613, n=9) | |
| AIDA64 / CPU PhotoWorxx | |
| Average of class Gaming (10805 - 60161, n=147, last 2 years) | |
| Gigabyte G5 GD | |
| Average Intel Core i5-11300H (9705 - 38002, n=9) | |
| Dell G15 5515 | |
| Lenovo Legion 5 15ACH-82JU00C6GE-FL | |
| Medion Erazer Deputy P25 | |
| Lenovo Ideapad Gaming 3 15IHU-82K1002RGE | |
系统性能
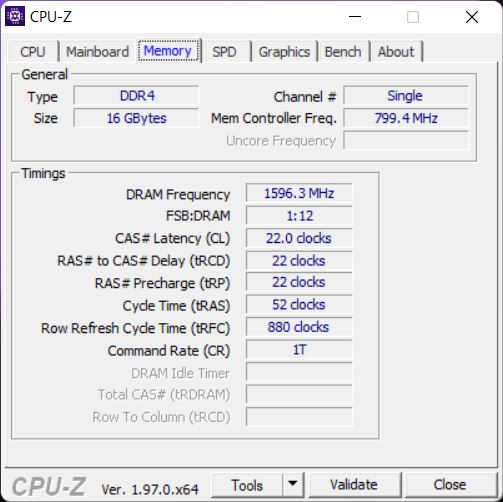
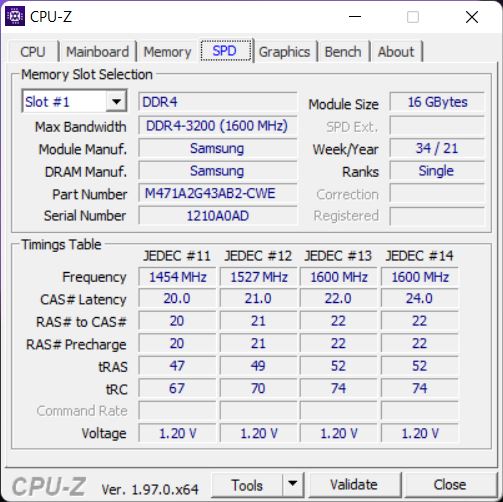
从主观上讲,该设备表现非常好,对输入的反应很即时。相比之下,它在基准测试中的表现往往相当糟糕,只能保证在列表的最末端有一个位置。这种糟糕的表现部分是由于CPU的特点是不超过四个核心,部分是由于我们的评测单元只配备了一个在单通道模式下运行的DDR4-3200内存模块。
CrossMark: Overall | Productivity | Creativity | Responsiveness
| PCMark 10 / Score | |
| Average of class Gaming (5776 - 9852, n=133, last 2 years) | |
| Medion Erazer Deputy P25 | |
| Lenovo Legion 5 15ACH-82JU00C6GE-FL | |
| SCHENKER XMG Focus 15 | |
| Dell G15 5515 | |
| Gigabyte G5 GD | |
| Lenovo Ideapad Gaming 3 15IHU-82K1002RGE | |
| Average Intel Core i5-11300H, NVIDIA GeForce RTX 3050 Ti Laptop GPU (5442 - 5641, n=2) | |
| PCMark 10 / Essentials | |
| Average of class Gaming (9057 - 12600, n=133, last 2 years) | |
| Lenovo Legion 5 15ACH-82JU00C6GE-FL | |
| SCHENKER XMG Focus 15 | |
| Medion Erazer Deputy P25 | |
| Dell G15 5515 | |
| Gigabyte G5 GD | |
| Average Intel Core i5-11300H, NVIDIA GeForce RTX 3050 Ti Laptop GPU (8524 - 8829, n=2) | |
| Lenovo Ideapad Gaming 3 15IHU-82K1002RGE | |
| PCMark 10 / Productivity | |
| Average of class Gaming (6662 - 14612, n=133, last 2 years) | |
| Lenovo Legion 5 15ACH-82JU00C6GE-FL | |
| Lenovo Ideapad Gaming 3 15IHU-82K1002RGE | |
| Medion Erazer Deputy P25 | |
| SCHENKER XMG Focus 15 | |
| Dell G15 5515 | |
| Gigabyte G5 GD | |
| Average Intel Core i5-11300H, NVIDIA GeForce RTX 3050 Ti Laptop GPU (7664 - 9112, n=2) | |
| PCMark 10 / Digital Content Creation | |
| Average of class Gaming (6807 - 18475, n=133, last 2 years) | |
| Medion Erazer Deputy P25 | |
| SCHENKER XMG Focus 15 | |
| Lenovo Legion 5 15ACH-82JU00C6GE-FL | |
| Dell G15 5515 | |
| Gigabyte G5 GD | |
| Average Intel Core i5-11300H, NVIDIA GeForce RTX 3050 Ti Laptop GPU (6271 - 6462, n=2) | |
| Lenovo Ideapad Gaming 3 15IHU-82K1002RGE | |
| CrossMark / Overall | |
| Average of class Gaming (1247 - 2344, n=114, last 2 years) | |
| Lenovo Ideapad Gaming 3 15IHU-82K1002RGE | |
| Average Intel Core i5-11300H, NVIDIA GeForce RTX 3050 Ti Laptop GPU (n=1) | |
| CrossMark / Productivity | |
| Average of class Gaming (1299 - 2204, n=114, last 2 years) | |
| Lenovo Ideapad Gaming 3 15IHU-82K1002RGE | |
| Average Intel Core i5-11300H, NVIDIA GeForce RTX 3050 Ti Laptop GPU (n=1) | |
| CrossMark / Creativity | |
| Average of class Gaming (1275 - 2660, n=114, last 2 years) | |
| Lenovo Ideapad Gaming 3 15IHU-82K1002RGE | |
| Average Intel Core i5-11300H, NVIDIA GeForce RTX 3050 Ti Laptop GPU (n=1) | |
| CrossMark / Responsiveness | |
| Average of class Gaming (1030 - 2330, n=114, last 2 years) | |
| Lenovo Ideapad Gaming 3 15IHU-82K1002RGE | |
| Average Intel Core i5-11300H, NVIDIA GeForce RTX 3050 Ti Laptop GPU (n=1) | |
| PCMark 10 Score | 5641 points | |
Help | ||
| AIDA64 / Memory Copy | |
| Average of class Gaming (21750 - 97515, n=147, last 2 years) | |
| Gigabyte G5 GD | |
| Dell G15 5515 | |
| Medion Erazer Deputy P25 | |
| Lenovo Legion 5 15ACH-82JU00C6GE-FL | |
| Average Intel Core i5-11300H (19947 - 60141, n=9) | |
| Lenovo Ideapad Gaming 3 15IHU-82K1002RGE | |
| AIDA64 / Memory Read | |
| Average of class Gaming (22956 - 102937, n=147, last 2 years) | |
| Gigabyte G5 GD | |
| Dell G15 5515 | |
| Lenovo Legion 5 15ACH-82JU00C6GE-FL | |
| Medion Erazer Deputy P25 | |
| Average Intel Core i5-11300H (22688 - 62684, n=9) | |
| Lenovo Ideapad Gaming 3 15IHU-82K1002RGE | |
| AIDA64 / Memory Write | |
| Average of class Gaming (22297 - 108954, n=147, last 2 years) | |
| Gigabyte G5 GD | |
| Average Intel Core i5-11300H (20959 - 65245, n=9) | |
| Medion Erazer Deputy P25 | |
| Dell G15 5515 | |
| Lenovo Legion 5 15ACH-82JU00C6GE-FL | |
| Lenovo Ideapad Gaming 3 15IHU-82K1002RGE | |
| AIDA64 / Memory Latency | |
| Average of class Gaming (59.5 - 259, n=147, last 2 years) | |
| Gigabyte G5 GD | |
| Lenovo Ideapad Gaming 3 15IHU-82K1002RGE | |
| Average Intel Core i5-11300H (76.3 - 93.6, n=9) | |
| Lenovo Legion 5 15ACH-82JU00C6GE-FL | |
| Medion Erazer Deputy P25 | |
| Dell G15 5515 | |
* ... smaller is better
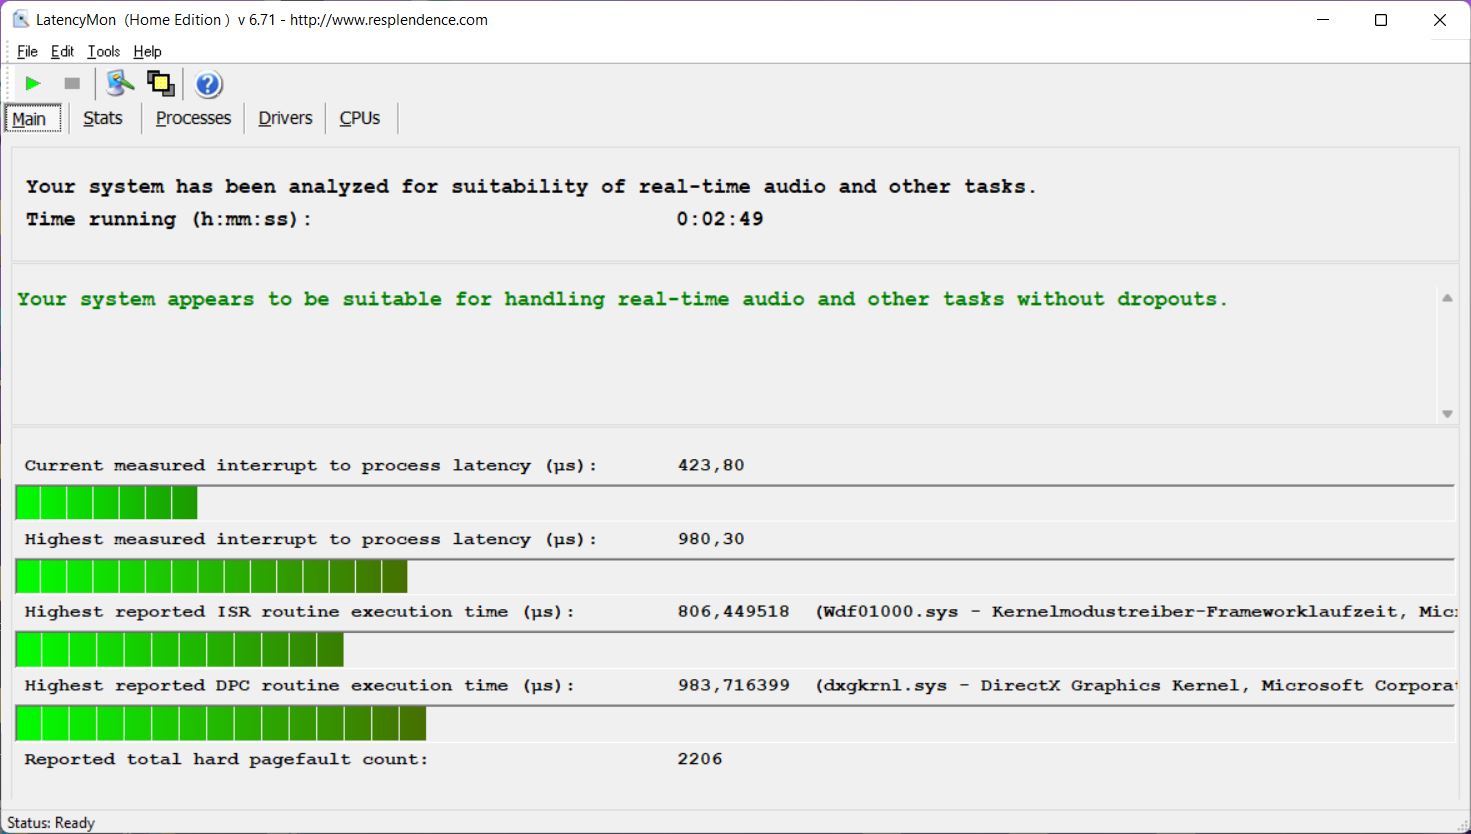
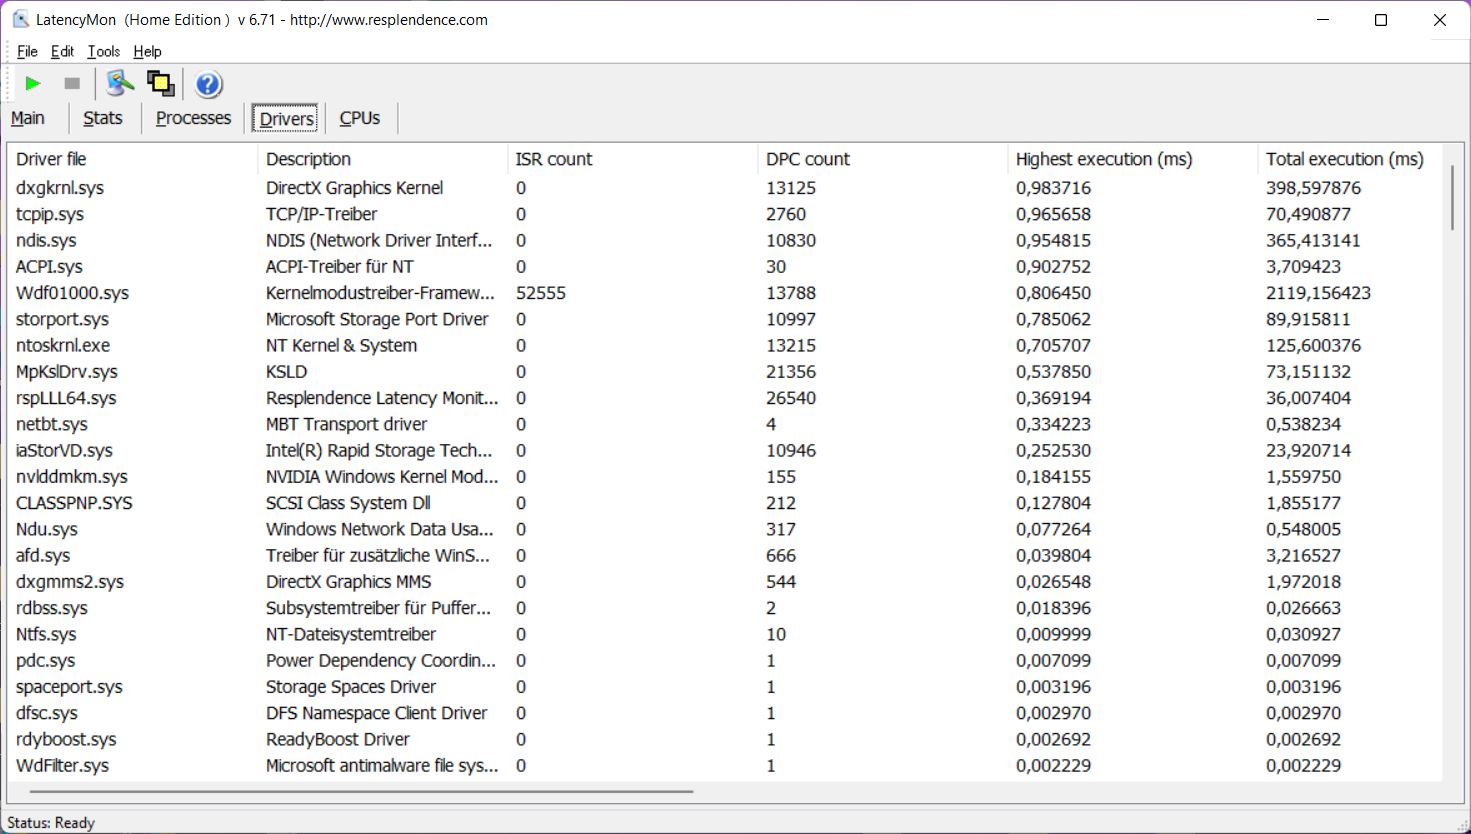
DPC延迟
我们的延迟测试显示,在撰写本文时,最新的BIOS没有重大问题。尽管如此,在我们的4K视频播放测试中,我们确实遇到了一些丢帧。
| DPC Latencies / LatencyMon - interrupt to process latency (max), Web, Youtube, Prime95 | |
| Medion Erazer Deputy P25 | |
| Lenovo Ideapad Gaming 3 15IHU-82K1002RGE | |
| Lenovo Legion 5 15ACH-82JU00C6GE-FL | |
| Dell G15 5515 | |
| SCHENKER XMG Focus 15 | |
| Gigabyte G5 GD | |
* ... smaller is better
存储设备
在IdeaPad Gaming 3内部,我们发现由美光制造的M.2-2280 SSD连接到PCIe 3.0 x4接口。它在日常使用中表现得足够快,但与竞争对手相比,并不是特别快。第一次启动后,我们发现512GB固态硬盘上共有424GB的自由空间,该设备还具有一个辅助的2.5英寸插槽。注意:在美国销售的所有SKU都有一个1TB的硬盘,默认搭配256GB的SSD。更多的SSD基准测试可以在这里找到。

* ... smaller is better
Sustained Read: DiskSpd Read Loop, Queue Depth 8
图形性能
IdeaPad Gaming 3支持Nvidia Optimus,用于在专用和集成GPU之间进行基于负载的全自动GPU切换。然而,它缺乏对MUX(高级优化)的支持,而且Vantage应用程序不支持将GPU钉在专用GeForce 芯片上。唯一支持的GPU pinning形式是通过BIOS设置,允许禁用专用GPU并完全使用集成Iris Xe。
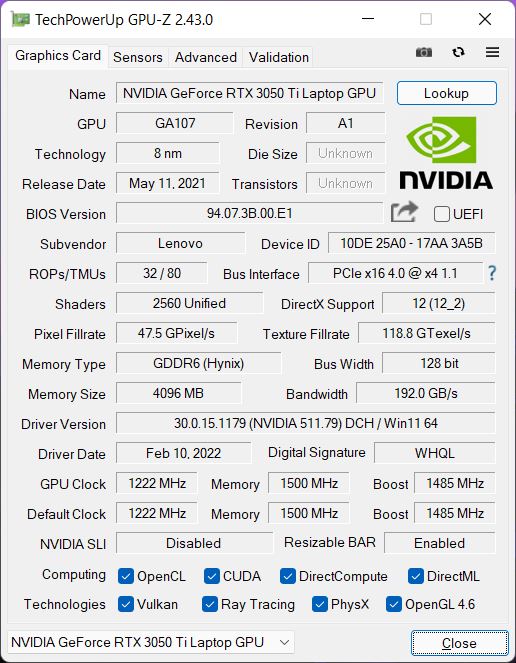
安装的GeForce RTX 3050 Ti芯片是现有最快的型号,具有90 W TGP和1,702 MHz的最大时钟速度。在我们的基准测试中,该设备的表现高于RTX 3050 Ti设备的平均水平。也就是说,各种RTX 3050 Ti和RTX 3060-配备的竞争对手已经设法稍微超过了IdeaPad Gaming 3。GPU性能在一段时间内是一致的,IdeaPad Gaming 3以98.5%的分数完成了Time Spy 压力测试。
GPU性能被限制在电池上只有30W。因此,IdeaPad Gaming 3遭受了50%的性能损失(2,815 vs, 5,677 inTime Spy Graphics)。其他GPU基准测试可以在我们的 技术部分.
| 3DMark 11 Performance | 15615 points | |
| 3DMark Cloud Gate Standard Score | 26518 points | |
| 3DMark Fire Strike Score | 11894 points | |
| 3DMark Time Spy Score | 5512 points | |
Help | ||
游戏性能
从纸面上看,游戏性能应该是不错的,即使是目前的游戏,如Cyberpunk 2077,在最高设置下也能顺利运行。然而,正如我们在CPU基准测试中已经注意到的,相对较慢的CPU是IdeaPad Gaming 3表现比大多数竞争对手略差的主要原因。在我们的Witcher 3 循环中,我们能够发现图形性能在很长一段时间内保持一致。在电池上,Witcher 3 Ultra从47 FPS下降到只有32 FPS。其他游戏基准测试可以在这里找到Computer Games on Laptop Graphics Cards 。
| The Witcher 3 | |
| 1920x1080 High Graphics & Postprocessing (Nvidia HairWorks Off) | |
| Average of class Gaming (40.1 - 424, n=86, last 2 years) | |
| Lenovo Legion 5 15ACH-82JU00C6GE-FL | |
| Medion Erazer Deputy P25 | |
| SCHENKER XMG Focus 15 | |
| Dell G15 5515 | |
| Gigabyte G5 GD | |
| Lenovo Ideapad Gaming 3 15IHU-82K1002RGE | |
| Average NVIDIA GeForce RTX 3050 Ti Laptop GPU (30 - 110, n=26) | |
| 1920x1080 Ultra Graphics & Postprocessing (HBAO+) | |
| Average of class Gaming (18.4 - 214, n=119, last 2 years) | |
| Medion Erazer Deputy P25 | |
| Lenovo Legion 5 15ACH-82JU00C6GE-FL (Ultra Performance) | |
| Lenovo Legion 5 15ACH-82JU00C6GE-FL (Auto) | |
| Lenovo Legion 5 15ACH-82JU00C6GE-FL (Eco) | |
| Dell G15 5515 | |
| SCHENKER XMG Focus 15 | |
| Gigabyte G5 GD | |
| Average NVIDIA GeForce RTX 3050 Ti Laptop GPU (19 - 58.5, n=29) | |
| Lenovo Ideapad Gaming 3 15IHU-82K1002RGE | |
| GTA V | |
| 1920x1080 High/On (Advanced Graphics Off) AA:2xMSAA + FX AF:8x | |
| Average of class Gaming (24.2 - 187.1, n=112, last 2 years) | |
| SCHENKER XMG Focus 15 | |
| Lenovo Legion 5 15ACH-82JU00C6GE-FL | |
| Medion Erazer Deputy P25 | |
| Gigabyte G5 GD | |
| Dell G15 5515 | |
| Average NVIDIA GeForce RTX 3050 Ti Laptop GPU (53.8 - 149, n=25) | |
| Lenovo Ideapad Gaming 3 15IHU-82K1002RGE | |
| 1920x1080 Highest Settings possible AA:4xMSAA + FX AF:16x | |
| Average of class Gaming (12.1 - 168.2, n=132, last 2 years) | |
| Lenovo Legion 5 15ACH-82JU00C6GE-FL | |
| Medion Erazer Deputy P25 | |
| SCHENKER XMG Focus 15 | |
| Dell G15 5515 | |
| Gigabyte G5 GD | |
| Average NVIDIA GeForce RTX 3050 Ti Laptop GPU (27.8 - 75.6, n=26) | |
| Lenovo Ideapad Gaming 3 15IHU-82K1002RGE | |
| Final Fantasy XV Benchmark | |
| 1920x1080 High Quality | |
| Average of class Gaming (19.2 - 201, n=144, last 2 years) | |
| Lenovo Legion 5 15ACH-82JU00C6GE-FL (1.3) | |
| Medion Erazer Deputy P25 | |
| SCHENKER XMG Focus 15 | |
| Dell G15 5515 (1.3) | |
| Average NVIDIA GeForce RTX 3050 Ti Laptop GPU (23.5 - 106, n=24) | |
| Gigabyte G5 GD (1.3) | |
| Lenovo Ideapad Gaming 3 15IHU-82K1002RGE (1.3) | |
| 1920x1080 Standard Quality | |
| Average of class Gaming (33.5 - 232, n=119, last 2 years) | |
| Lenovo Legion 5 15ACH-82JU00C6GE-FL (1.3) | |
| SCHENKER XMG Focus 15 | |
| Dell G15 5515 (1.3) | |
| Gigabyte G5 GD (1.3) | |
| Average NVIDIA GeForce RTX 3050 Ti Laptop GPU (33.4 - 106, n=24) | |
| Lenovo Ideapad Gaming 3 15IHU-82K1002RGE (1.3) | |
| Strange Brigade | |
| 1920x1080 high AA:high AF:8 | |
| Average of class Gaming (49.4 - 460, n=120, last 2 years) | |
| Medion Erazer Deputy P25 (1.47.22.14 D3D12) | |
| SCHENKER XMG Focus 15 (1.47.22.14 D3D12) | |
| Dell G15 5515 (1.47.22.14 D3D12) | |
| Lenovo Ideapad Gaming 3 15IHU-82K1002RGE (1.47.22.14 D3D12) | |
| Gigabyte G5 GD (1.47.22.14 D3D12) | |
| Average NVIDIA GeForce RTX 3050 Ti Laptop GPU (79.2 - 117.3, n=23) | |
| 1920x1080 ultra AA:ultra AF:16 | |
| Average of class Gaming (38.9 - 420, n=140, last 2 years) | |
| Medion Erazer Deputy P25 (1.47.22.14 D3D12) | |
| Dell G15 5515 (1.47.22.14 D3D12) | |
| SCHENKER XMG Focus 15 (1.47.22.14 D3D12) | |
| Gigabyte G5 GD (1.47.22.14 D3D12) | |
| Lenovo Ideapad Gaming 3 15IHU-82K1002RGE (1.47.22.14 D3D12) | |
| Average NVIDIA GeForce RTX 3050 Ti Laptop GPU (34.8 - 101.3, n=25) | |
| F1 2021 | |
| 1920x1080 High Preset AA:T AF:16x | |
| Average of class Gaming (65.1 - 470, n=10, last 2 years) | |
| Lenovo Legion 5 15ACH-82JU00C6GE-FL | |
| Dell G15 5515 (807588) | |
| Gigabyte G5 GD (824817) | |
| Average NVIDIA GeForce RTX 3050 Ti Laptop GPU (68 - 131, n=11) | |
| Lenovo Ideapad Gaming 3 15IHU-82K1002RGE (852849) | |
| 1920x1080 Ultra High Preset + Raytracing AA:T AF:16x | |
| Average of class Gaming (27.6 - 271, n=10, last 2 years) | |
| Lenovo Legion 5 15ACH-82JU00C6GE-FL | |
| Dell G15 5515 (807588) | |
| Gigabyte G5 GD (824817) | |
| Average NVIDIA GeForce RTX 3050 Ti Laptop GPU (44.4 - 69, n=11) | |
| Lenovo Ideapad Gaming 3 15IHU-82K1002RGE (852849) | |
Witcher 3 FPS Graph
| low | med. | high | ultra | |
|---|---|---|---|---|
| GTA V (2015) | 134 | 118 | 85.6 | 55 |
| The Witcher 3 (2015) | 172 | 136 | 91 | 47.1 |
| Dota 2 Reborn (2015) | 115 | 103 | 94.5 | 90.6 |
| Final Fantasy XV Benchmark (2018) | 98.9 | 68.9 | 47.9 | |
| X-Plane 11.11 (2018) | 87.5 | 72 | 61 | |
| Far Cry 5 (2018) | 88 | 67 | 66 | 62 |
| Strange Brigade (2018) | 208 | 129 | 106 | 90 |
| F1 2021 (2021) | 157 | 102 | 82.3 | 44.4 |
| GRID Legends (2022) | 91 | 84 | 73 | 56 |
| Cyberpunk 2077 1.6 (2022) | 55 | 50 | 39 | 37 |
排放 - 令人满意的联想游戏笔记本电脑
噪声排放
由于有三个可用的功率配置文件,风扇的性能可以很容易地调整到你的喜好。例如,在启用性能配置文件时,你可以预期偶尔会有明显的噪音排放,如果你坚持要求极度安静,没有风扇或其他噪音,如线圈啸叫,最好选择沉默配置文件。
在负载情况下,我们发现游戏时的噪音排放和压力测试时的噪音排放之间存在明显差异,CPU和GPU都被折磨到了极致。游戏时,IdeaPad仍然比较安静,只有43 dB(A),即使启用了性能配置文件。然而,我们强烈建议在其他两个电源配置文件中测试您的游戏,因为有些人可能会从更安静的风扇中受益,而不会牺牲太多的性能。下表描述了在游戏和我们的压力测试中所有三个配置文件的风扇噪音排放。
| 情景 | 静音 | 自动 | 性能 |
|---|---|---|---|
| Witcher 3 Ultra | 35.2 dB(A) (46 FPS) | 39.8 dB(A) (47 FPS) | 43.5 dB(A) (47 FPS) |
| Cyberpunk 2077 1.5 Ultra | 35.2 dB(A) (27 FPS) | 39.8 dB(A) (29 FPS) | 43.5 dB(A) (37 FPS) |
| 压力测试 | 35.2 dB(A) | 48.3 dB(A) | 53.1 dB(A) |
Noise Level
| Idle |
| 23.9 / 26.8 / 26.8 dB(A) |
| Load |
| 43.5 / 53.1 dB(A) |
 | ||
30 dB silent 40 dB(A) audible 50 dB(A) loud |
||
min: | ||
| Lenovo Ideapad Gaming 3 15IHU-82K1002RGE GeForce RTX 3050 Ti Laptop GPU, i5-11300H, Micron 2210 MTFDHBA512QFD | Dell G15 5515 GeForce RTX 3050 Ti Laptop GPU, R7 5800H, Samsung PM991a MZ9LQ512HBLU-00BD1 | Gigabyte G5 GD GeForce RTX 3050 4GB Laptop GPU, i5-11400H, ESR512GTLG-E6GBTNB4 | Medion Erazer Deputy P25 GeForce RTX 3060 Laptop GPU, R7 5800H, Phison E12S-512GB-Phison-SSD-BICS4 | SCHENKER XMG Focus 15 GeForce RTX 3050 Ti Laptop GPU, i7-11800H, Samsung SSD 970 EVO Plus 1TB | Lenovo Legion 5 15ACH-82JU00C6GE-FL GeForce RTX 3060 Laptop GPU, R7 5800H, Micron 2300 512GB MTFDHBA512TDV | |
|---|---|---|---|---|---|---|
| Noise | -1% | -14% | -16% | -21% | -12% | |
| off / environment * | 23.9 | 24 -0% | 24 -0% | 25 -5% | 24 -0% | 24.2 -1% |
| Idle Minimum * | 23.9 | 25 -5% | 29 -21% | 27 -13% | 25 -5% | 29 -21% |
| Idle Average * | 26.8 | 26 3% | 30 -12% | 29 -8% | 30 -12% | 29 -8% |
| Idle Maximum * | 26.8 | 30 -12% | 32 -19% | 31 -16% | 43 -60% | 29 -8% |
| Load Average * | 43.5 | 44 -1% | 53 -22% | 57 -31% | 56 -29% | 53.5 -23% |
| Witcher 3 ultra * | 43.5 | 44 -1% | 52 -20% | 56 -29% | 56 -29% | 53.5 -23% |
| Load Maximum * | 53.1 | 48 10% | 54 -2% | 58 -9% | 58 -9% | 53.5 -1% |
* ... smaller is better
温度
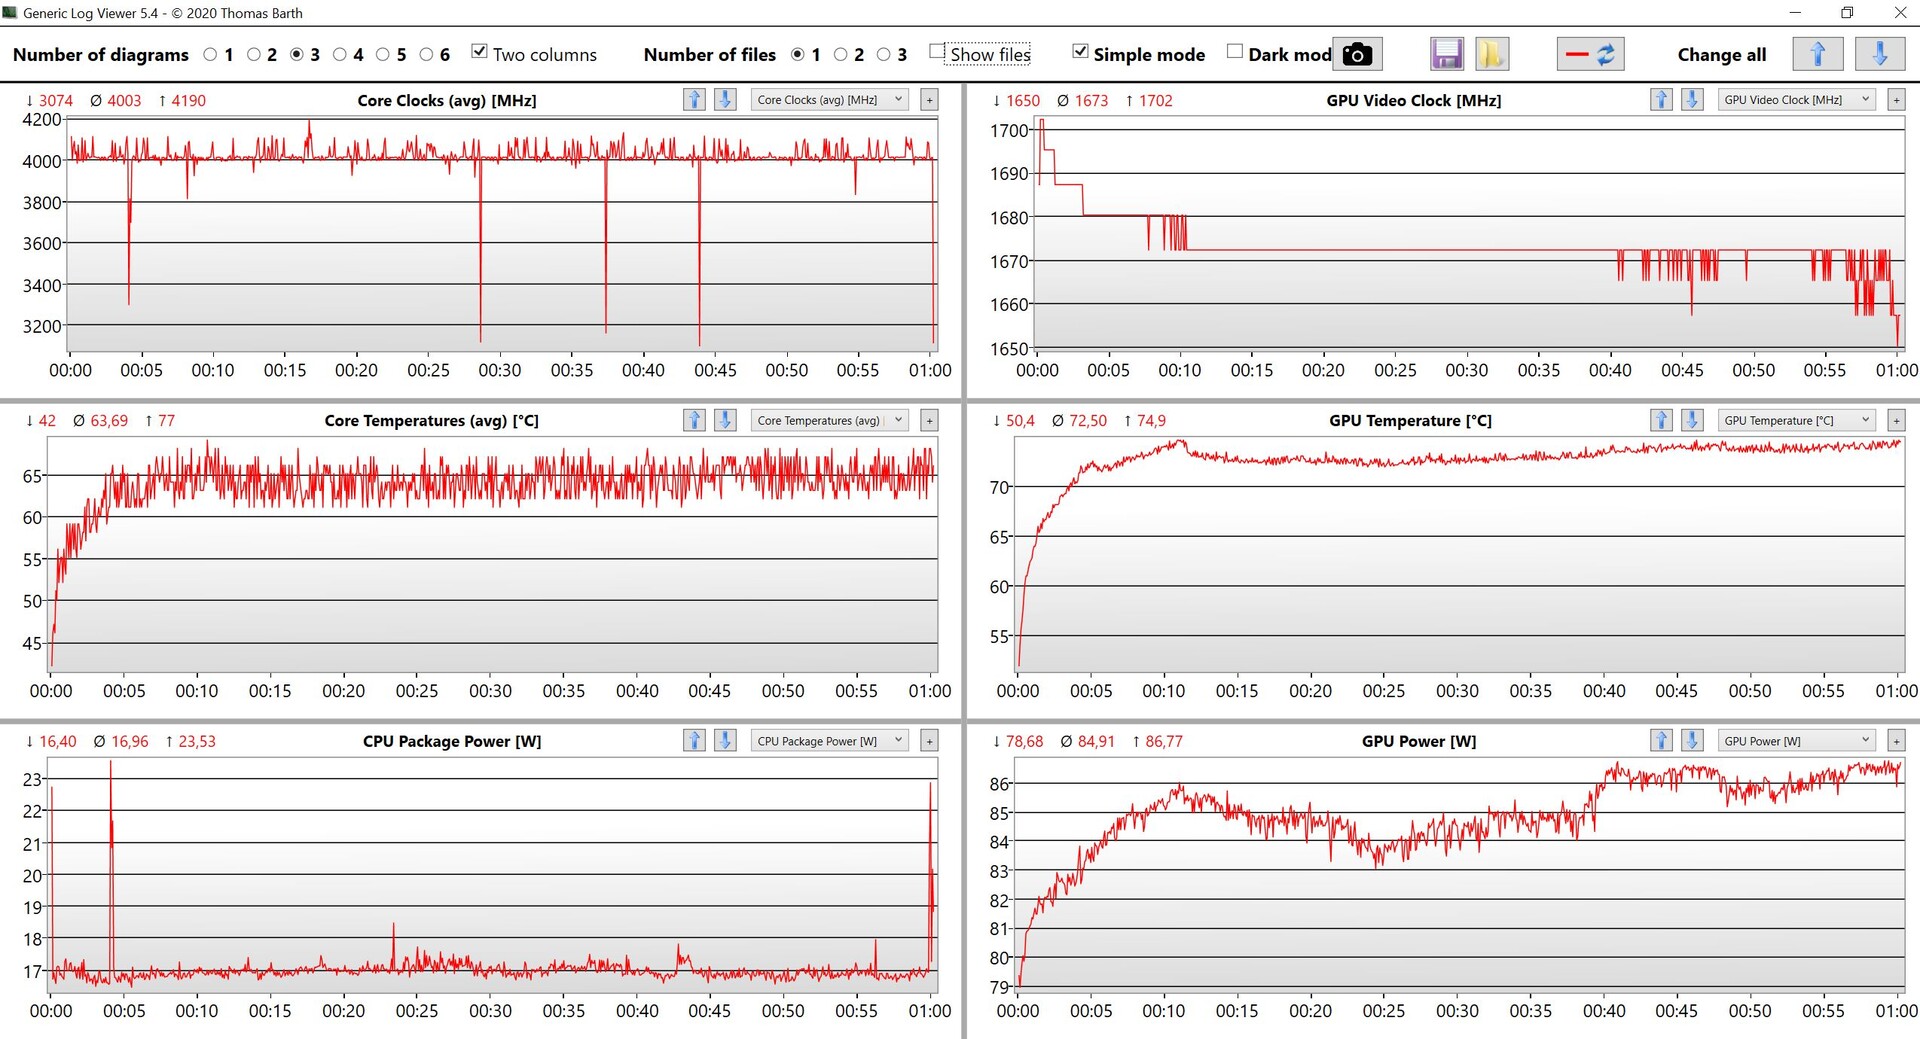
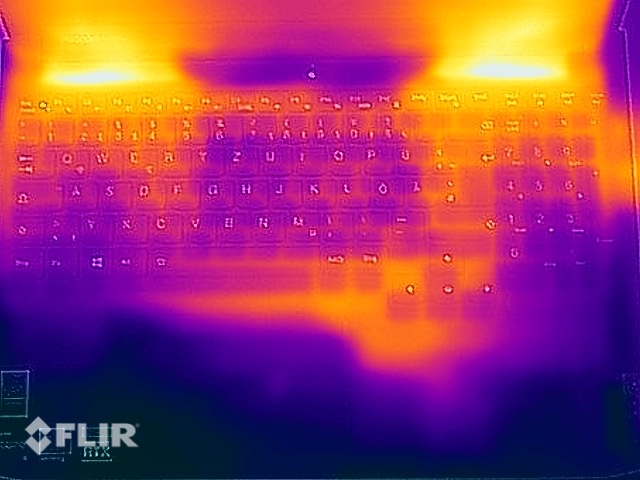
IdeaPad Gaming 3的冷却系统做得很好,游戏时表面温度仍然相当低。只有在底部,我们能够找到一个单一的热点,达到最高45℃,这意味着该设备应该很容易在你的腿上使用。笔记本电脑在空闲和低负载情况下仍然非常凉爽。
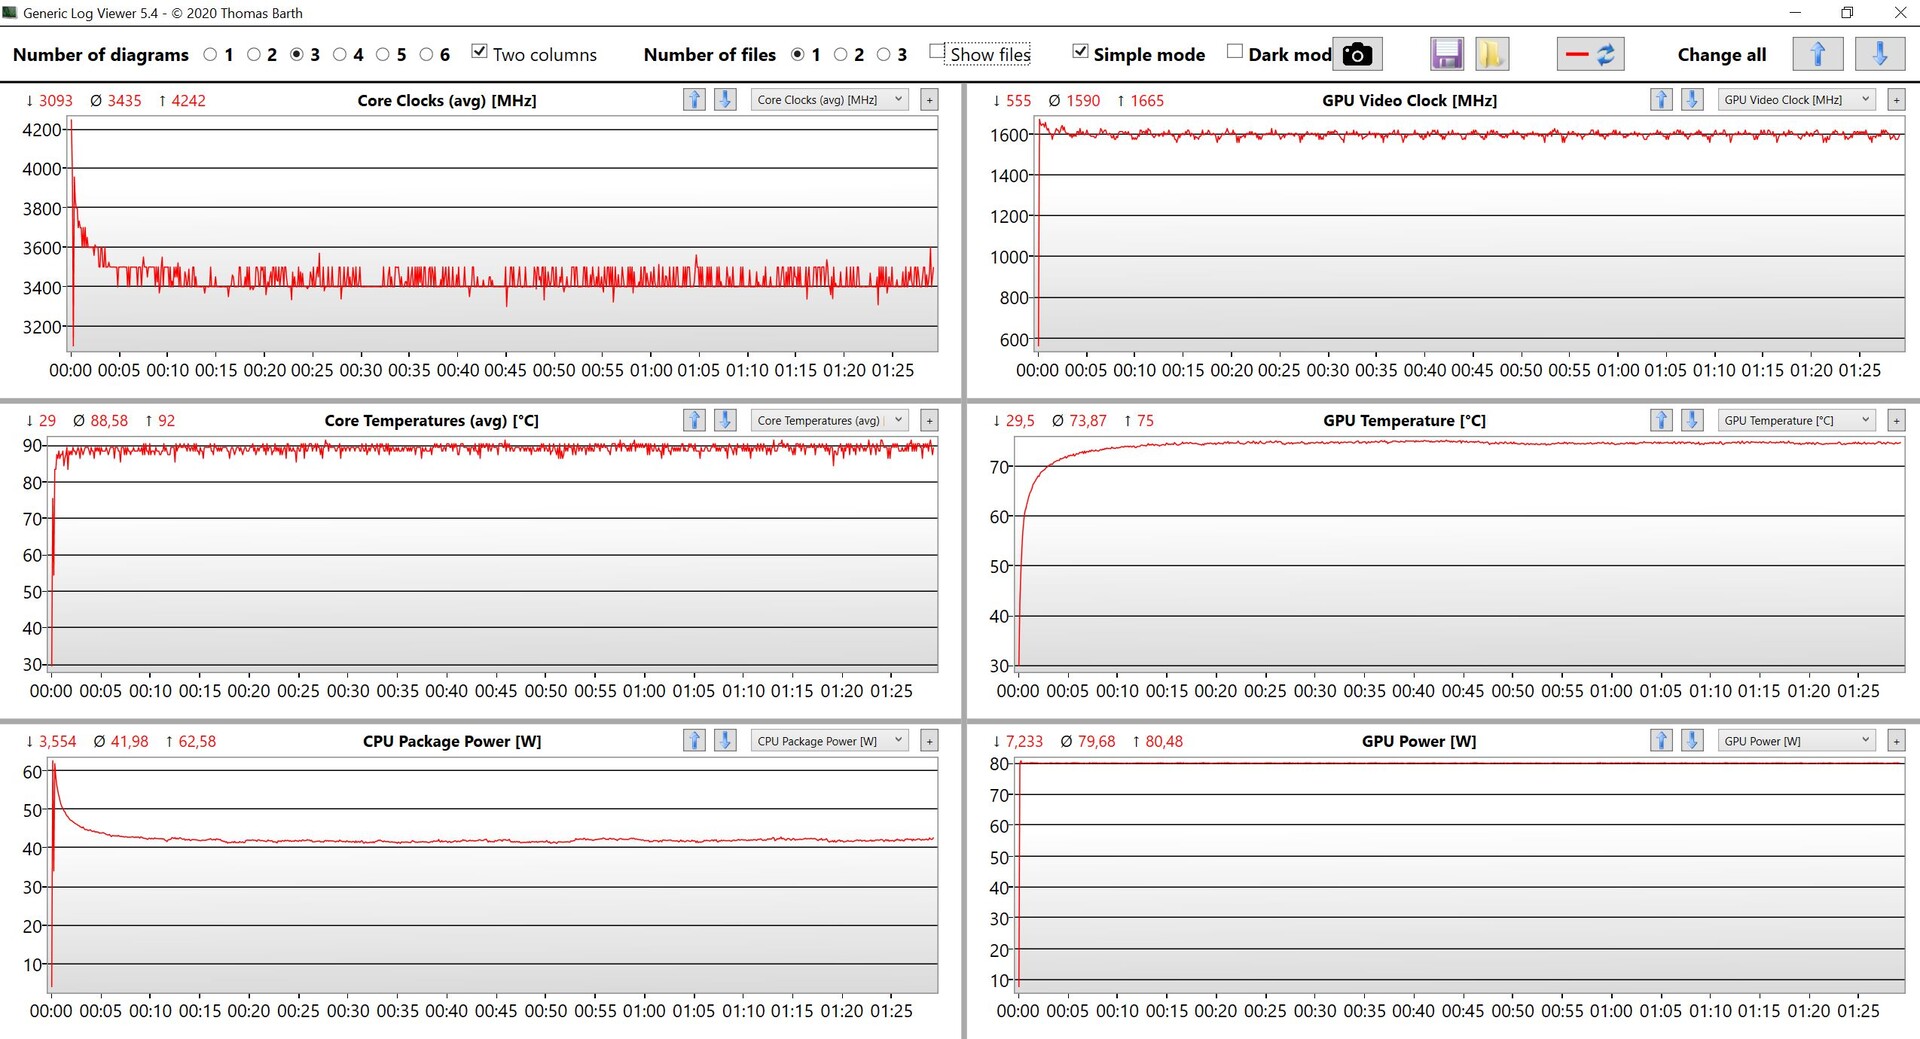
在我们的压力测试中,我们发现CPU(42W)和专用GPU(80W)在很长一段时间内都很稳定,而且在压力测试之后,性能完全没有受到阻碍。
(±) The maximum temperature on the upper side is 43.2 °C / 110 F, compared to the average of 40.4 °C / 105 F, ranging from 21.2 to 68.8 °C for the class Gaming.
(-) The bottom heats up to a maximum of 47.9 °C / 118 F, compared to the average of 43.2 °C / 110 F
(+) In idle usage, the average temperature for the upper side is 24.2 °C / 76 F, compared to the device average of 33.9 °C / 93 F.
(±) Playing The Witcher 3, the average temperature for the upper side is 35.5 °C / 96 F, compared to the device average of 33.9 °C / 93 F.
(±) The palmrests and touchpad can get very hot to the touch with a maximum of 38.2 °C / 100.8 F.
(-) The average temperature of the palmrest area of similar devices was 28.9 °C / 84 F (-9.3 °C / -16.8 F).
| Lenovo Ideapad Gaming 3 15IHU-82K1002RGE Intel Core i5-11300H, NVIDIA GeForce RTX 3050 Ti Laptop GPU | Dell G15 5515 AMD Ryzen 7 5800H, NVIDIA GeForce RTX 3050 Ti Laptop GPU | Gigabyte G5 GD Intel Core i5-11400H, NVIDIA GeForce RTX 3050 4GB Laptop GPU | Medion Erazer Deputy P25 AMD Ryzen 7 5800H, NVIDIA GeForce RTX 3060 Laptop GPU | SCHENKER XMG Focus 15 Intel Core i7-11800H, NVIDIA GeForce RTX 3050 Ti Laptop GPU | Lenovo Legion 5 15ACH-82JU00C6GE-FL AMD Ryzen 7 5800H, NVIDIA GeForce RTX 3060 Laptop GPU | |
|---|---|---|---|---|---|---|
| Heat | -5% | -9% | 4% | -25% | -1% | |
| Maximum Upper Side * | 43.2 | 50 -16% | 45 -4% | 37 14% | 43 -0% | 42.6 1% |
| Maximum Bottom * | 47.9 | 49 -2% | 50 -4% | 40 16% | 46 4% | 52.2 -9% |
| Idle Upper Side * | 24.9 | 26 -4% | 28 -12% | 27 -8% | 39 -57% | 24.9 -0% |
| Idle Bottom * | 27 | 26 4% | 31 -15% | 29 -7% | 40 -48% | 25.3 6% |
* ... smaller is better
发言人
立体声扬声器的额定功率为2瓦,音量足够大,但总体上非常微弱。虽然预装的Nahimic软件允许使用预装的配置文件进行一些明显的微调,但我们发现其他笔记本电脑在这方面的表现要好很多。因此,我们强烈建议在大多数使用情况下连接外部扬声器或耳机,从游戏到音乐。
Lenovo Ideapad Gaming 3 15IHU-82K1002RGE audio analysis
(±) | speaker loudness is average but good (80 dB)
Bass 100 - 315 Hz
(-) | nearly no bass - on average 23.8% lower than median
(±) | linearity of bass is average (10.3% delta to prev. frequency)
Mids 400 - 2000 Hz
(±) | higher mids - on average 6.7% higher than median
(+) | mids are linear (6% delta to prev. frequency)
Highs 2 - 16 kHz
(+) | balanced highs - only 3.6% away from median
(±) | linearity of highs is average (7.4% delta to prev. frequency)
Overall 100 - 16.000 Hz
(±) | linearity of overall sound is average (20.7% difference to median)
Compared to same class
» 73% of all tested devices in this class were better, 4% similar, 23% worse
» The best had a delta of 6%, average was 18%, worst was 132%
Compared to all devices tested
» 53% of all tested devices were better, 8% similar, 39% worse
» The best had a delta of 4%, average was 24%, worst was 134%
Lenovo Legion 5 15ACH-82JU00C6GE-FL audio analysis
(±) | speaker loudness is average but good (81 dB)
Bass 100 - 315 Hz
(-) | nearly no bass - on average 22.1% lower than median
(±) | linearity of bass is average (11.4% delta to prev. frequency)
Mids 400 - 2000 Hz
(+) | balanced mids - only 4.5% away from median
(+) | mids are linear (5% delta to prev. frequency)
Highs 2 - 16 kHz
(+) | balanced highs - only 2.9% away from median
(+) | highs are linear (4.5% delta to prev. frequency)
Overall 100 - 16.000 Hz
(±) | linearity of overall sound is average (17.8% difference to median)
Compared to same class
» 51% of all tested devices in this class were better, 10% similar, 39% worse
» The best had a delta of 6%, average was 18%, worst was 132%
Compared to all devices tested
» 33% of all tested devices were better, 8% similar, 59% worse
» The best had a delta of 4%, average was 24%, worst was 134%
能源管理--带小电池的联想游戏笔记本
消耗功率
我们的评测设备在空闲时的效率令人惊讶。在游戏时,它总共消耗了120-130瓦,在我们的压力测试中达到了172瓦的峰值,然后稳定在一个更合理的150瓦。
| Off / Standby | |
| Idle | |
| Load |
|
Key:
min: | |
| Lenovo Ideapad Gaming 3 15IHU-82K1002RGE i5-11300H, GeForce RTX 3050 Ti Laptop GPU, Micron 2210 MTFDHBA512QFD, IPS, 1920x1080, 15.6" | Dell G15 5515 R7 5800H, GeForce RTX 3050 Ti Laptop GPU, Samsung PM991a MZ9LQ512HBLU-00BD1, IPS, 1920x1080, 15.6" | Gigabyte G5 GD i5-11400H, GeForce RTX 3050 4GB Laptop GPU, ESR512GTLG-E6GBTNB4, IPS, 1920x1080, 15.6" | Medion Erazer Deputy P25 R7 5800H, GeForce RTX 3060 Laptop GPU, Phison E12S-512GB-Phison-SSD-BICS4, IPS, 1920x1080, 15.6" | SCHENKER XMG Focus 15 i7-11800H, GeForce RTX 3050 Ti Laptop GPU, Samsung SSD 970 EVO Plus 1TB, IPS, 1920x1080, 15.6" | Lenovo Legion 5 15ACH-82JU00C6GE-FL R7 5800H, GeForce RTX 3060 Laptop GPU, Micron 2300 512GB MTFDHBA512TDV, , 1920x1080, 15.6" | Average NVIDIA GeForce RTX 3050 Ti Laptop GPU | Average of class Gaming | |
|---|---|---|---|---|---|---|---|---|
| Power Consumption | -26% | -65% | -48% | -138% | -44% | -41% | -113% | |
| Idle Minimum * | 4.9 | 5 -2% | 13 -165% | 8 -63% | 23 -369% | 7.3 -49% | 8.2 ? -67% | 13.4 ? -173% |
| Idle Average * | 8.3 | 9 -8% | 15 -81% | 11 -33% | 25 -201% | 10.5 -27% | 12.6 ? -52% | 18.9 ? -128% |
| Idle Maximum * | 8.9 | 20 -125% | 20 -125% | 16 -80% | 29 -226% | 15.7 -76% | 17.2 ? -93% | 26.3 ? -196% |
| Load Average * | 81 | 94 -16% | 102 -26% | 109 -35% | 106 -31% | 108 -33% | 92 ? -14% | 102.7 ? -27% |
| Witcher 3 ultra * | 119 | 123 -3% | 124 -4% | 183 -54% | 128 -8% | 175 -47% | ||
| Load Maximum * | 172 | 172 -0% | 148 14% | 211 -23% | 156 9% | 228 -33% | 139.1 ? 19% | 244 ? -42% |
* ... smaller is better
Power Consumption Witcher 3 / stress test
Power Consumption with External Monitor
电池寿命
尽管IdeaPad Gaming 3的外壳很大,但它配备了一个小型的3芯45Wh电池,允许一个体面的整体电池寿命,至少在闲置时是如此。在负载情况下,它能够持续一个小时左右。在我们浏览网页的Wi-Fi测试中,它持续了5.5至6.5小时,这取决于显示屏的亮度。在我们的视频测试中,显示亮度正常为150尼特(在我们的设备上为84%),它持续了7.5小时以上。将一个通电的设备从接近空的地方充电到充满需要大约两个小时。
| Lenovo Ideapad Gaming 3 15IHU-82K1002RGE i5-11300H, GeForce RTX 3050 Ti Laptop GPU, 45 Wh | Dell G15 5515 R7 5800H, GeForce RTX 3050 Ti Laptop GPU, 56 Wh | Gigabyte G5 GD i5-11400H, GeForce RTX 3050 4GB Laptop GPU, 41 Wh | Medion Erazer Deputy P25 R7 5800H, GeForce RTX 3060 Laptop GPU, 49 Wh | SCHENKER XMG Focus 15 i7-11800H, GeForce RTX 3050 Ti Laptop GPU, 49 Wh | Lenovo Legion 5 15ACH-82JU00C6GE-FL R7 5800H, GeForce RTX 3060 Laptop GPU, 80 Wh | Average of class Gaming | |
|---|---|---|---|---|---|---|---|
| Battery Runtime | 26% | -33% | 1% | -29% | -2% | 9% | |
| H.264 | 460 | 529 15% | 214 -53% | 259 -44% | 447 ? -3% | ||
| WiFi v1.3 | 397 | 478 20% | 186 -53% | 404 2% | 235 -41% | 290 -27% | 387 ? -3% |
| Load | 64 | 91 42% | 68 6% | 64 0% | 54 -16% | 105 64% | 84.5 ? 32% |
| Reader / Idle | 807 | 339 | 628 | 387 | 585 ? |
Pros
Cons
结论--经济型玩家使用AMD更好
IdeaPad Gaming 3i 15 G6是一款经济实惠的游戏笔记本,配备了快速的RTX 3050 Ti,具有足够的FHD游戏性能。然而,我们对联想选择的CPU感到惊讶。英特尔相对较慢的Tiger Lake 四核处理器在一个拥有强大的专用GPU的设备中根本没有意义。其结果是游戏性能相对较低,如果采用6核Core i5-11400H ,该笔记本将受益匪浅。更糟的是,这个Tiger Lake CPU会比联想选择的i5-11300H更便宜。而基于Ryzen 5 5600H,配备AMD的SKU也有,而且它的整体性能要好得多。然而,它在许多地区很难获得。
总的来说,IdeaPad Gaming 3涵盖了最重要的游戏基础知识,没有任何花哨的东西。除了缓慢的CPU,我们还发现默认的显示屏是不合格的。由于其内置的IPS面板,它可能是哑光的,并提供宽广的视角,但其图像质量(颗粒状)和色彩表现相当差。毫无疑问,默认面板是一个相当便宜的设备,其糟糕的色彩准确性和低sRGB覆盖率进一步证明了这一点。可选的是,IdeaPad Gaming 3有一个165赫兹的1080p面板,在选定的地区有完全的sRGB覆盖,如果有的话,这肯定是一个更好的选择。
IdeaPad Gaming 3i 15是一款预算游戏笔记本,配备RTX 3050 Ti和足够的FHD游戏性能。如果你能把你的预算再拉长一点,我们会强烈推荐可选的165赫兹面板。
它的竞争对手,如戴尔G15,Medion Erazer,Schenker XMG Focus,甚至联想自己的Legion 5 15,提供了更高的性能,通常也有明显更好的显示器。然而,如果你的预算紧张,默认的FHD面板肯定足够了。
价格和可用性
Lenovo Ideapad Gaming 3 15IHU-82K1002RGE
- 03/22/2022 v7 (old)
Andreas Osthoff
Price comparison

