Notebookcheck Logo

Intel Core Ultra 7 256V

Intel Core Ultra 7 256V

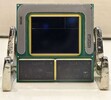
酷睿至尊 7 256V是 Lunar Lake 系列的中高端处理器。这是一款用于笔记本电脑和平板电脑的 SoC,采用了 4 个新的 E 核和 4 个新的 P 核,主频从 2.2 GHz 到 4.8 GHz 不等。 Arc 140ViGPU 和 16GB 内置 LPDDR5x-8533 内存。此外,还包括一个新的 47 TOPS 神经引擎、雷电 4 和 PCIe 5 固态硬盘支持。

该芯片与 超 7 258V的唯一区别是封装内存的数量:分别为 16 GB 和 32 GB。

架构和功能

Lunar Lake 采用 Foveros 技术(将多个芯片堆叠在一起,彼此相邻),就像 Meteor Lake 一样。这些新芯片使用了巨大的 BGA2833 插座接口;Lion Cove P 核心取代了 Redwood 核心,而 Crestwood E 核心则被 Skymont 所取代,据说后者非常省电,使得 Meteor Lake 多出的 2 个低功耗岛 CPU 核心完全多余。在这 8 个内核中,没有一个支持超线程技术,这与 AMD 目前的 Zen 5/5c 芯片正好相反。

英特尔声称,Lion Cove 内核的 IPC 性能提高了 14%。而 Skymont 则提高了 68%。此外,英特尔还在其他方面进行了改进,例如低延迟架构(Low Latency Fabric),它可以大大加快内核/缓存之间的小数据传输。在其他方面,256V 拥有 4 条 PCIe 5 和 4 条 PCIe 4 通道,可连接各种设备,包括速度高达 15.75 GB/s 的 NVMe SSD。默认板载支持 Thunderbolt 4,支持英特尔的 CNVi WiFi 7 + BT 5.4 卡。47 TOPS AI Boost 神经引擎以及威胁检测等技术的加入,使 Windows Defender 等支持 AI 的应用更加强大。

这款第 2 代酷睿 Ultra 处理器配备了 16 GB 包装内不可更换的 LPDDR5x-8533 内存。

性能

该芯片的高效内核运行频率高达 3.7 GHz。P 核心的主频则高达 4.8GHz。

如果我们的首次内部测试显示出任何迹象,256V 的性能与较早的 U 级 AMD 和英特尔芯片(如 Ryzen 7 6800U酷睿 i7-1355U在多线程性能方面。就 2024 年第四季度而言,这是一个可以使用但并不出色的结果。

图形性能

显卡 Arc Graphics 140V已取代 8 核 ArciGPU。它的 8 个 Xe² 架构内核运行频率高达 1,950 MHz,还拥有 8 个光线追踪单元。适配器支持 DirectX 12 Ultimate,能够对 h.266 VVC、h.265 HEVC、h.264 AVC、AV1 和 VP9 等一系列流行视频编解码器进行硬件解码。该 iGPU 可同时使用三台 SUHD 4320p 显示器。

其实际性能仅略高于 Radeon 780M在低图形设置下以 1080p 处理任何 2024 游戏的帧速率时,其实际性能仅略高于 Radeon 780M。

功耗

大多数 Lunar Lake 处理器的长期功耗目标应该是 17 W。与此同时,英特尔建议该芯片的短期 PL 值为 37 W。

CodenameLunar Lake
SeriesIntel Lunar Lake

Series: Lunar Lake Lunar Lake

Intel Core Ultra 9 288V3.3 - 5.1 GHz8 / 8 cores12 MB L3
Intel Core Ultra 7 268V2.2 - 5 GHz8 / 8 cores12 MB L3
Intel Core Ultra 7 266V2.2 - 5 GHz8 / 8 cores12 MB L3
Intel Core Ultra 7 258V2.2 - 4.8 GHz8 / 8 cores12 MB L3
Intel Core Ultra 7 256V « 2.2 - 4.8 GHz8 / 8 cores12 MB L3
Intel Core Ultra 5 238V2.1 - 4.7 GHz8 / 8 cores8 MB L3
Intel Core Ultra 5 236V2.1 - 4.7 GHz8 / 8 cores8 MB L3
Intel Core Ultra 5 228V2.1 - 4.5 GHz8 / 8 cores8 MB L3
Intel Core Ultra 5 226V2.1 - 4.5 GHz8 / 8 cores8 MB L3
Clock Rate2200 - 4800 MHz
Level 3 Cache12 MB
Number of Cores / Threads8 / 8
4 x 4.8 GHz Intel Lion Cove P-core
4 x 3.7 GHz Intel Skymont E-core
Power Consumption (TDP = Thermal Design Power)17 Watt
TDP Turbo PL237 Watt
Manufacturing Technology3 nm
Max. Temperature100 °C
SocketBGA2833
FeaturesLPDDR5x-8533 RAM, PCIe 5 + PCIe 4, USB 4, AI Boost NPU (47 TOPS), Thread Director, PSE, Threat Detection, MMX, SSE, SSE2, SSE3, SSSE3, SSE4.1, SSE4.2, AES, AVX, AVX2, AVX-VNNi, FMA3, SHA
GPUIntel Arc Graphics 140V ( - 1950 MHz)
64 Bit64 Bit support
Architecturex86
Announcement Date09/03/2024
Product Link (external)ark.intel.com

Benchmarks

Performance Rating - CB R15 + R20 + 7-Zip + X265 + Blender + 3DM11 CPU
38.3 pt (64%)
Cinebench 2024 - Cinebench 2024 CPU Single Core
min: 117.4     avg: 118.5     median: 118 (66%)     max: 120 Points
Cinebench 2024 - Cinebench 2024 CPU Multi Core
min: 435     avg: 549     median: 582 (11%)     max: 630 Points
Cinebench R23 - Cinebench R23 Multi Core
min: 10391     avg: 10580     median: 10579.5 (10%)     max: 10768 Points
AMD E1-2100
202 -98%
...
10095 -5%
10198 -4%
10275 -3%
10291 -3%
10327 -2%
10383 -2%
10429 -1%
10454 -1%
10472 -1%
Intel Core Ultra 7 256V
10580
10605 0%
10653 1%
10857 3%
10889 3%
AMD Ryzen 7 7735H
10920 3%
10921 3%
10923 3%
11507 9%
11515 9%
...
32782 210%
max:
107681 918%
0%
100%
Cinebench R23 - Cinebench R23 Single Core
min: 1875     avg: 1889     median: 1888.5 (80%)     max: 1902 Points
Cinebench R20 - Cinebench R20 CPU (Single Core)
min: 720     avg: 724     median: 723.5 (80%)     max: 727 Points
Cinebench R20 - Cinebench R20 CPU (Multi Core)
min: 4038     avg: 4100     median: 4100 (10%)     max: 4162 Points
Cinebench R15 - Cinebench R15 CPU Multi 64 Bit
1570 Points (10%)
AMD A4-1200
31 -98%
...
1502 -4%
1502 -4%
1506 -4%
Intel Xeon W-10885M
1509 -4%
1528 -3%
1547 -1%
1554 -1%
1562 -1%
1564 0%
Intel Core Ultra 7 256V
1570
1578 1%
1590 1%
1607 2%
1607 2%
1614 3%
1625 4%
1628 4%
1634 4%
Intel Core i9-9980HK
1656 5%
...
5600 257%
max:
15842 909%
0%
100%
0801602403204004805606407208008809601040112012001280136014401520Tooltip
Cinebench R15 - Cinebench R15 CPU Single 64 Bit
285 Points (80%)
7-Zip 18.03 - 7-Zip 18.03 Multi Thread 4 runs
min: 35950     avg: 35964     median: 35964 (21%)     max: 35978 MIPS
7-Zip 18.03 - 7-Zip 18.03 Single Thread 4 runs
min: 5616     avg: 5672     median: 5671.5 (67%)     max: 5727 MIPS
HWBOT x265 Benchmark v2.2 - HWBOT x265 4k Preset
min: 13.1     avg: 13.3     median: 13.3 (23%)     max: 13.5 fps
05101520Tooltip
Blender - Blender 3.3 Classroom CPU *
min: 533     avg: 557     median: 556.5 (7%)     max: 580 Seconds
Blender - Blender 2.79 BMW27 CPU *
min: 324     avg: 331.5     median: 331.5 (2%)     max: 339 Seconds
R Benchmark 2.5 - R Benchmark 2.5 *
min: 0.4578     avg: 0.5     median: 0.5 (10%)     max: 0.4645 sec
3DMark 11 - 3DM11 Performance Physics
min: 14943     avg: 15150     median: 15149.5 (38%)     max: 15356 Points
3DMark - 3DMark Cloud Gate Physics
min: 13988     avg: 14241     median: 14240.5 (36%)     max: 14493 Points
3DMark - 3DMark Fire Strike Standard Physics
min: 14488     avg: 19626     median: 22132 (39%)     max: 22257 Points
3DMark - 3DMark Time Spy CPU
min: 4853     avg: 6140     median: 6502 (27%)     max: 7066 Points
Geekbench 6.3 - Geekbench 6.3 Single-Core
min: 2680     avg: 2747     median: 2778 (71%)     max: 2784 points
Geekbench 6.3 - Geekbench 6.3 Multi-Core
min: 9852     avg: 10592     median: 10952 (43%)     max: 10972 points
Geekbench 5.5 - Geekbench 5.1 - 5.5 64 Bit Single-Core
min: 1972     avg: 1991     median: 1991 (78%)     max: 2010 points
Geekbench 5.5 - Geekbench 5.1 - 5.5 64 Bit Multi-Core
min: 9302     avg: 9460     median: 9460 (17%)     max: 9618 points
Mozilla Kraken 1.1 - Kraken 1.1 Total Score *
min: 472     avg: 473     median: 473 (1%)     max: 474 ms
WebXPRT 4 - WebXPRT 4 Score
min: 284     avg: 285     median: 285 (78%)     max: 286 Points
WebXPRT 3 - WebXPRT 3 Score
min: 306     avg: 308     median: 308 (55%)     max: 310 Points
CrossMark - CrossMark Overall
min: 1663     avg: 1700     median: 1699.5 (64%)     max: 1736 Points
Power Consumption - Prime95 Power Consumption - external Monitor *
min: 46.1     avg: 49.9     median: 49.9 (9%)     max: 53.6 Watt
051015202530354045505560Tooltip
Power Consumption - Cinebench R15 Multi Power Consumption - external Monitor *
min: 50.9     avg: 54     median: 54 (10%)     max: 57.1 Watt
051015202530354045505560Tooltip
Power Consumption - Idle Power Consumption - external Monitor *
min: 1.596     avg: 2.6     median: 2.6 (2%)     max: 3.63 Watt
00.20.50.711.21.51.722.22.42.72.93.23.43.73.94.14.44.6Tooltip
Power Consumption - Idle Power Consumption 150cd 1min *
min: 1.954     avg: 3.5     median: 3.5 (4%)     max: 5.14 Watt
0123456Tooltip
Power Consumption - Power Efficiency - Cinebench R15 Multi external Monitor
30.8 Points per Watt (23%)
- Range of benchmark values for this graphics card
red legend - Average benchmark values for this graphics card
* Smaller numbers mean a higher performance

v1.28
log 17. 20:15:43

#0 ran 0s before starting gpusingle class +0s ... 0s

#1 no ids found in url (should be separated by "_") +0s ... 0s

#2 not redirecting to Ajax server +0s ... 0s

#3 did not recreate cache, as it is less than 5 days old! Created at Fri, 17 Jan 2025 09:54:19 +0100 +0.001s ... 0.001s

#4 no comparison url found in template nbc.compare_page_2 needed +0.017s ... 0.018s

#5 no comparison url found in template nbc.compare_page_2 needed +0s ... 0.018s

#6 no comparison url found in template nbc.compare_page_2 needed +0s ... 0.018s

#7 no comparison url found in template nbc.compare_page_2 needed +0s ... 0.019s

#8 no comparison url found in template nbc.compare_page_2 needed +0s ... 0.019s

#9 no comparison url found in template nbc.compare_page_2 needed +0s ... 0.019s

#10 no comparison url found in template nbc.compare_page_2 needed +0s ... 0.019s

#11 no comparison url found in template nbc.compare_page_2 needed +0s ... 0.02s

#12 composed specs +0.001s ... 0.02s

#13 did output specs +0s ... 0.021s

#14 getting avg benchmarks for device 17996 +0.017s ... 0.037s

#15 got single benchmarks 17996 +0.011s ... 0.048s

#16 got avg benchmarks for devices +0s ... 0.048s

#17 min, max, avg, median took s +0.593s ... 0.642s

#18 no comparison url found in template nbc.compare_page_2 needed +0s ... 0.642s

#19 return log +0s ... 0.642s

Please share our article, every link counts!
Mail Logo

»移动处理器 对比
所有移动处理器的对比


»移动处理器 基准测试
所有已有笔记本电脑中使用的处理器的基准测试成绩 (桌面处理器或移动处理器)

Other CPUs of the series Lunar Lake

» Intel Core Ultra 9 288V
   8x 3.3 GHz - 5.1 GHz
» Intel Core Ultra 7 268V
   8x 2.2 GHz - 5 GHz
» Intel Core Ultra 7 266V
   8x 2.2 GHz - 5 GHz
» Intel Core Ultra 7 258V
   8x 2.2 GHz - 4.8 GHz
» Intel Core Ultra 7 256V
   8x 2.2 GHz - 4.8 GHz
» Intel Core Ultra 5 238V
   8x 2.1 GHz - 4.7 GHz
» Intel Core Ultra 5 236V
   8x 2.1 GHz - 4.7 GHz
» Intel Core Ultra 5 228V
   8x 2.1 GHz - 4.5 GHz
» Intel Core Ultra 5 226V
   8x 2.1 GHz - 4.5 GHz

Surrounding CPUs

+ Intel Core Ultra 7 265U
   12x 2.4 GHz - 5.3 GHz
+ Intel Core Ultra 7 255U
   12x 3.8 GHz - 4.8 GHz
+ AMD Ryzen 5 7640HS
   6x 4.3 GHz - 5 GHz
+ AMD Ryzen 5 PRO 7640HS
   6x 4.3 GHz - 5 GHz
+ Intel Core Ultra 7 258V
   8x 2.2 GHz - 4.8 GHz
» Intel Core Ultra 7 256V
   8x 2.2 GHz - 4.8 GHz
- AMD Ryzen 7 8840U
   8x 3.3 GHz - 5.1 GHz
- AMD Ryzen 7 250
   8x 3.3 GHz - 5.1 GHz
- AMD Ryzen 7 PRO 250
   8x 3.3 GHz - 5.1 GHz
- AMD Ryzen 7 8840U
   8x 3.3 GHz - 5.1 GHz
- AMD Ryzen Z2
   8x 3.3 GHz - 5.1 GHz
Klaus Hinum (Update: 2024-10-31)