Notebookcheck Logo
Teaser

Minisforum BD790i 评测:配备 AMD Ryzen 9 7945HX 和 PCIe 5.0 的 Mini-ITX 主板是小型游戏 PC 的基础

移动 SoC 与台式机主板的完美结合。

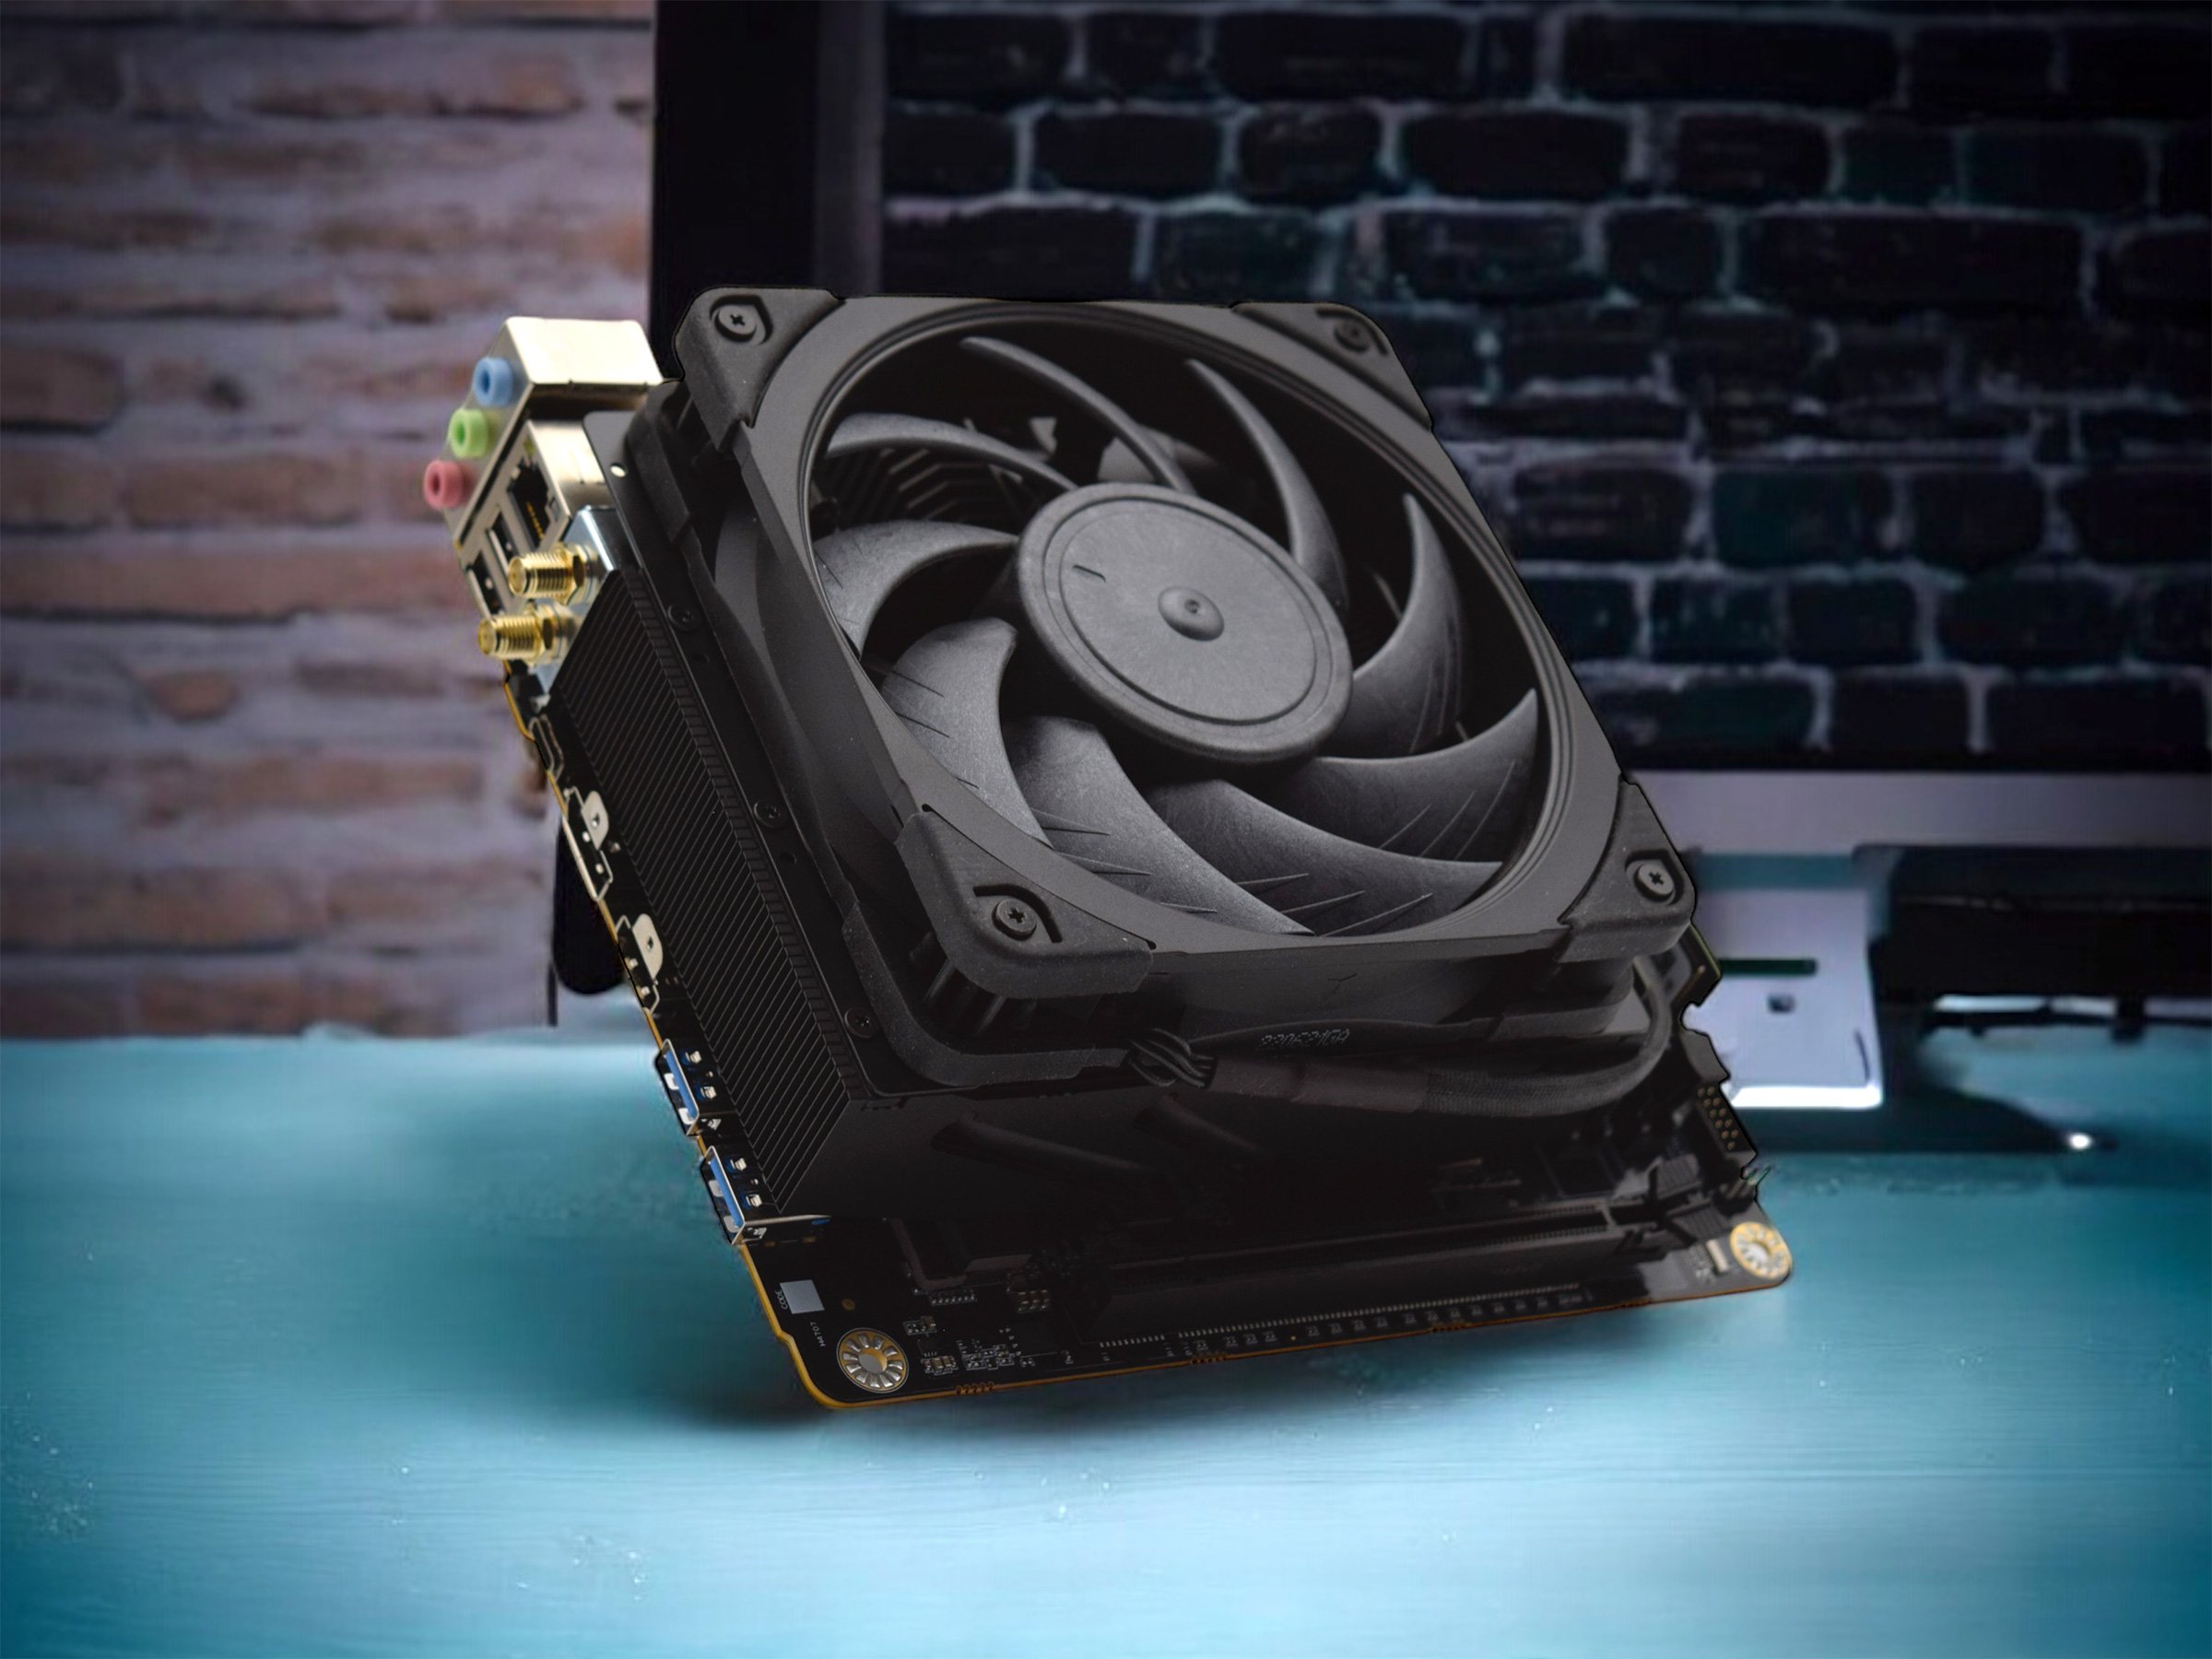
Minisforum BD790i 主板承诺提供出色的性能,因此可以成为小型 Mini-ITX PC 的绝佳基础。我们对这款主板进行了测试,它配备了 AMD Ryzen 9 7945HX ex 处理器,专门面向高要求用户。在测试中,我们分析了该系统在执行密集型任务时的性能,并结合 NvidiaGeForce RTX 4090 测试了其游戏性能。
Sebastian Bade, 👁 Sebastian Bade (translated by DeepL / Ninh Duy) Published 🇺🇸 🇩🇪 ...
Desktop AMD Gaming Mini PC

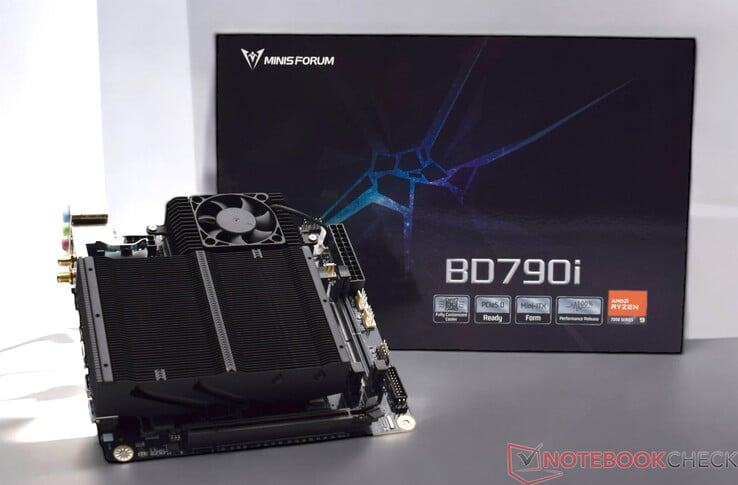
Minisforum 主要以提供各种性能级别的迷你 PC 而闻名。大多数迷你 PC 制造商都倾向于远离传统台式机市场,但 Minisforum 却敢于在这一领域站稳脚跟。前段时间,我们发现了性能不俗的 Minisforum BD770i基于 AMD Ryzen 7 7745HX.作为搭载 AMD Ryzen APU 的顶级型号,Minisforum 的 BD790i 主板是该制造商产品组合中性能更强大的型号,我们将在本次评测中对其进行详细检查。

Minisforum 安装了 AMD Ryzen 9 7945HX处理器,它配备了 16 个 Zen4 内核。这意味着,这款来自移动领域的 SoC 是 AMD 目前提供的速度最快的处理器之一。为了评估它的游戏性能,我们将它与一台 英伟达GeForce RTX 4090.得益于其完整的 PCIe x16 插槽,显卡可以充分发挥其性能。

Minisforum 主板对比

名称 BD790i BD790i SE BD770i AR900i
CPU AMD Ryzen 9 7945HX AMD Ryzen 9 7940HX AMD Ryzen 7 7745HX Intel Core i9-13900HX 处理器
内核/线程 16 / 32 16/32 8/16 24/32
图形处理器 AMD Radeon 610M AMD Radeon 610M AMD Radeon 610M 英特尔UHD Graphics
内存类型 DDR5-5200SODIMM DDR5-5200 SODIMM DDR5-5200 SODIMM DDR5-5600 SODIMM
最大内存容量 96 GB 64 GB 64 GB 64 GB
Minisforum BD790i
Processor
AMD Ryzen 9 7945HX 16 x 2.5 - 5.4 GHz, Dragon Range-HX (Zen 4)
Graphics adapter
AMD Radeon 610M
Memory
64 GB 
, DDR5-5200 SODIMM
Mainboard
AMD Promontory/Bixby FCH
Storage
Kingston KC3000 2048G SKC3000D2048G, 2048 GB 
Soundcard
AMD Zen - Audio Processor - HD Audio Controller
Connections
2 USB 2.0, 3 USB 3.0 / 3.1 Gen1, 1 USB 3.1 Gen2, 1 HDMI, 2 DisplayPort, Audio Connections: 3,5mm Klinke, Line Out, Front Panel Audio header
Networking
Realtek RTL8125 2.5GBe Family Ethernet Controller (10/100/1000/2500MBit/s), Intel Killer Wi-Fi 6E AX1675x (210NGW) (b/g/n = Wi-Fi 4/ac = Wi-Fi 5/ax = Wi-Fi 6/ Wi-Fi 6E 6 GHz), Bluetooth 5.2
Price
551 Euro
Note: The manufacturer may use components from different suppliers including display panels, drives or memory sticks with similar specifications.


Minisforum BD790i 和测试系统详情

迷你论坛 BD790i
迷你论坛 BD790i
迷你论坛 BD790i
迷你论坛 BD790i
迷你论坛 BD790i
迷你论坛 BD790i
迷你论坛 BD790i
迷你论坛 BD790i
迷你论坛 BD790i
迷你论坛 BD790i
迷你论坛 BD790i
迷你论坛 BD790i
迷你论坛 BD790i
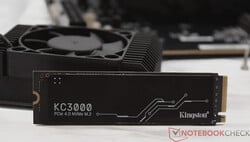
金士顿 KC3000(测试固态硬盘)
金士顿 FURY Impact SO-DIMM 套件 64 GB
Noctua NF-A12x25 冷却器
已安装 Noctua NF-A12x25 散热器的 Minisforum BD790i
Phanteks Enthoo Evolv Shift XT
安装了 Minisforum BD790i 的 Phanteks Enthoo Evolv Shift XT
银欣 SFX 650 瓦电源

案例和测试设置

为了确保与我们已经测试过的 Minisforum BD770i 的最佳可比性,我们坚持在完全相同的条件下进行测试。更确切地说,这意味着我们在CPU安装状态下进行了所有测试。我们使用的是 Phanteks Enthoo Evolv Shift XT 机箱,它的紧凑性为测试提供了良好的基础。

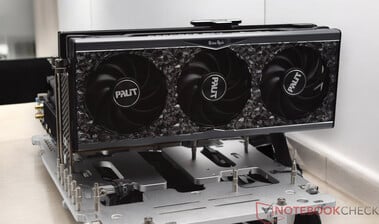
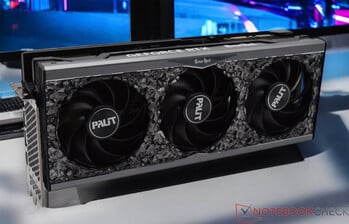
在与专用显卡的性能比较中,我们测试了 Minisforum BD790i 和 PalitGeForce RTX 4090 GameRock OC在开放式设置中进行了测试。由于显卡的尺寸,我们无法将其安装在 Phanteks Enthoo Evolv Shift XT 中。长度不超过 32.4 厘米的显卡适用于 Phanteks Enthoo Evolv Shift XT。

交付和连接范围

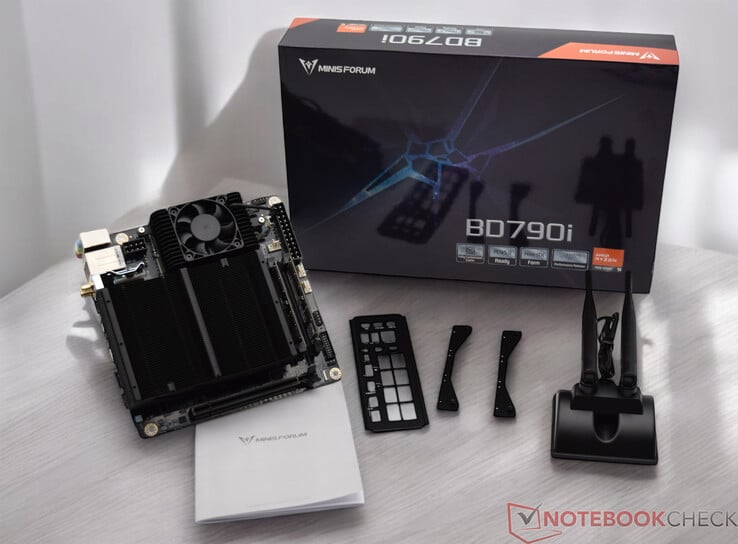
Minisforum BD790i 主板的供货范围与 Minisforum BD770i 类似。制造商随主板附送一个预装散热器,可同时覆盖处理器和电压转换器。还有一个与主板匹配的 IO 屏蔽罩,可惜没有预装。供货范围内还包括一根相对较大的 WLAN 天线。没有完全预配置的选件,但这不是问题。必须购买一个 120 毫米的风扇作为 CPU 风扇,使用安装材料即可快速安装。然后还需要固态硬盘、内存和 PC 电源装置才能运行。Minisforum BD790i 是功能强大、结构紧凑的微型 DIY PC 的良好基础。

Minisforum BD790i 的连接非常少。与传统主板相比,虽然最重要的端口都在机身上,但背面只有几个接口。主板上还有一个 USB 3.2 接口,这意味着总共可以使用 6 个 USB-A 端口。遗憾的是,没有其他连接,如 ARGB 接头或额外的 USB-C 端口。在风扇选择方面,您只能使用预装的散热器。没有安装更强劲散热器的其他选择。最好是单独冷却电压转换器,以便用户选择安装自己的冷却解决方案。

Minisforum BD790i 的供货范围

处理器基准

Minisforum BD790i 主板配备了目前笔记本电脑领域最强大的处理器之一。处理器 AMD Ryzen 9 7945HX配备 16 个 Zen4 内核,可处理 32 个线程。就性能而言,这听起来很有希望,我们的测试也证明了这一点。在性能对比中,AMD Ryzen 9 7945HX 的性能排在 AMD Ryzen 9 7900X 和 AMD Ryzen 9 7900X 之间。 AMD Ryzen 9 7900XAMD Ryzen 9 7950X.如果与英特尔处理器进行比较,那么 AMD Ryzen 9 7945HX 的性能可以与 英特尔酷睿 i7-14700K.与传统台式机处理器相比,功耗是 AMD Ryzen 9 7945HX 的最大优势。这款处理器的功耗仅为 100 瓦,明显更省钱,也更容易散热。

如需进一步比较和基准测试,请查看我们的 CPU 对比表.

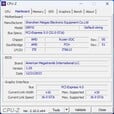
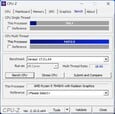
CPU-Z
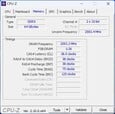
CPU-Z
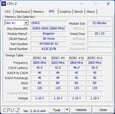
CPU-Z
CPU-Z
CPU-Z
CPU-Z
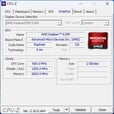
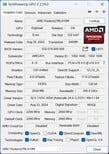
GPU-Z
GPU-Z
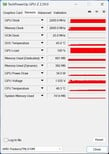
HWiNFO
Performance Rating - Percent
Intel Core i9-14900K
i9-14900K, 3200 MHz
79.5 pt
Intel Core i9-13900K
i9-13900K, 3000 MHz
77 pt
AMD Ryzen 9 7950X
R9 7950X, 4500 MHz
75.5 pt
AMD Ryzen 9 7950X3D
R9 7950X3D, 4200 MHz
74.1 pt
Intel Core i7-14700K
i7-14700K, 2500 MHz
73.8 pt
AMD Ryzen 9 7945HX
R9 7945HX, 2500 MHz
70.3 pt
AMD Ryzen 9 7900X
R9 7900X, 4700 MHz
68.6 pt
Intel Core i5-14600K
i5-14600K, 3500 MHz
65.5 pt
Intel Core i9-12900K
i9-12900K, 3200 MHz
64.8 pt
AMD Ryzen 9 5950X
R9 5950X, 3400 MHz
63.4 pt
Intel Core i5-13600K
i5-13600K, 3500 MHz
63.3 pt
AMD Ryzen 5 9600X
Ryzen 5 9600X, 3900 MHz
60.9 pt
AMD Ryzen 7 7800X3D
R7 7800X3D, 4200 MHz
60.3 pt
AMD Ryzen 7 7745HX
R7 7745HX, 3600 MHz
58.6 pt
AMD Ryzen 5 7600X
R5 7600X, 4700 MHz
58 pt
Intel Core i5-12600K
i5-12600K, 2800 MHz
55.9 pt
AMD Ryzen 7 7840HS
R7 7840HS, 3800 MHz
55.2 pt
AMD Ryzen 9 7940HS
R9 7940HS, 4000 MHz
55.2 pt
Intel Core i5-13400
i5-13400, 2500 MHz
53.2 pt
Intel Core i5-12400F
i5-12400F, 2500 MHz
48.2 pt
Cinebench R23
Single Core
Intel Core i9-14900K
i9-14900K, 3200 MHz
2351 Points +21%
Intel Core i9-13900K
i9-13900K, 3000 MHz
2267 Points +17%
AMD Ryzen 5 9600X
Ryzen 5 9600X, 3900 MHz
2180 Points +12%
Intel Core i7-14700K
i7-14700K, 2500 MHz
2153 Points +11%
Intel Core i5-14600K
i5-14600K, 3500 MHz
2064 Points +6%
AMD Ryzen 9 7950X3D
R9 7950X3D, 4200 MHz
2053 Points +6%
AMD Ryzen 9 7950X
R9 7950X, 4500 MHz
2045 Points +5%
AMD Ryzen 9 7900X
R9 7900X, 4700 MHz
2039 Points +5%
Intel Core i5-13600K
i5-13600K, 3500 MHz
2010 Points +4%
Intel Core i9-12900K
i9-12900K, 3200 MHz
1998 Points +3%
AMD Ryzen 5 7600X
R5 7600X, 4700 MHz
1967 Points +1%
AMD Ryzen 9 7945HX
R9 7945HX, 2500 MHz
1942 Points
Intel Core i5-12600K
i5-12600K, 2800 MHz
1907 Points -2%
AMD Ryzen 7 7745HX
R7 7745HX, 3600 MHz
1854 Points -5%
AMD Ryzen 7 7800X3D
R7 7800X3D, 4200 MHz
1820 Points -6%
AMD Ryzen 9 7940HS
R9 7940HS, 4000 MHz
1813 Points -7%
Intel Core i5-13400
i5-13400, 2500 MHz
1786 Points -8%
AMD Ryzen 7 7840HS
R7 7840HS, 3800 MHz
1779 Points -8%
Intel Core i5-12400F
i5-12400F, 2500 MHz
1680 Points -13%
AMD Ryzen 9 5950X
R9 5950X, 3400 MHz
1649 Points -15%
Multi Core
Intel Core i9-14900K
i9-14900K, 3200 MHz
41193 Points +23%
Intel Core i9-13900K
i9-13900K, 3000 MHz
40103 Points +20%
AMD Ryzen 9 7950X
R9 7950X, 4500 MHz
37792 Points +13%
AMD Ryzen 9 7950X3D
R9 7950X3D, 4200 MHz
36291 Points +8%
Intel Core i7-14700K
i7-14700K, 2500 MHz
35892 Points +7%
AMD Ryzen 9 7945HX
R9 7945HX, 2500 MHz
33459 Points
AMD Ryzen 9 7900X
R9 7900X, 4700 MHz
29480 Points -12%
AMD Ryzen 9 5950X
R9 5950X, 3400 MHz
27062 Points -19%
Intel Core i9-12900K
i9-12900K, 3200 MHz
27005 Points -19%
Intel Core i5-14600K
i5-14600K, 3500 MHz
24491 Points -27%
Intel Core i5-13600K
i5-13600K, 3500 MHz
24268 Points -27%
AMD Ryzen 7 7745HX
R7 7745HX, 3600 MHz
18845 Points -44%
AMD Ryzen 7 7800X3D
R7 7800X3D, 4200 MHz
18086 Points -46%
Intel Core i5-12600K
i5-12600K, 2800 MHz
17491 Points -48%
AMD Ryzen 5 9600X
Ryzen 5 9600X, 3900 MHz
17176 Points -49%
AMD Ryzen 9 7940HS
R9 7940HS, 4000 MHz
16985 Points -49%
AMD Ryzen 7 7840HS
R7 7840HS, 3800 MHz
16706 Points -50%
Intel Core i5-13400
i5-13400, 2500 MHz
15953 Points -52%
AMD Ryzen 5 7600X
R5 7600X, 4700 MHz
15322 Points -54%
Intel Core i5-12400F
i5-12400F, 2500 MHz
12380 Points -63%
Cinebench R20
CPU (Single Core)
Intel Core i9-14900K
i9-14900K, 3200 MHz
900 Points +18%
AMD Ryzen 5 9600X
Ryzen 5 9600X, 3900 MHz
858 Points +13%
Intel Core i7-14700K
i7-14700K, 2500 MHz
832 Points +9%
Intel Core i9-13900K
i9-13900K, 3000 MHz
828 Points +9%
AMD Ryzen 9 7950X
R9 7950X, 4500 MHz
795 Points +5%
AMD Ryzen 9 7950X3D
R9 7950X3D, 4200 MHz
795 Points +5%
Intel Core i5-14600K
i5-14600K, 3500 MHz
790 Points +4%
AMD Ryzen 9 7900X
R9 7900X, 4700 MHz
786 Points +3%
Intel Core i5-13600K
i5-13600K, 3500 MHz
775 Points +2%
Intel Core i9-12900K
i9-12900K, 3200 MHz
766 Points +1%
AMD Ryzen 5 7600X
R5 7600X, 4700 MHz
761 Points 0%
AMD Ryzen 9 7945HX
R9 7945HX, 2500 MHz
760 Points
Intel Core i5-12600K
i5-12600K, 2800 MHz
734 Points -3%
AMD Ryzen 7 7745HX
R7 7745HX, 3600 MHz
719 Points -5%
AMD Ryzen 9 7940HS
R9 7940HS, 4000 MHz
711 Points -6%
AMD Ryzen 7 7800X3D
R7 7800X3D, 4200 MHz
709 Points -7%
AMD Ryzen 7 7840HS
R7 7840HS, 3800 MHz
690 Points -9%
Intel Core i5-13400
i5-13400, 2500 MHz
688 Points -9%
Intel Core i5-12400F
i5-12400F, 2500 MHz
653 Points -14%
AMD Ryzen 9 5950X
R9 5950X, 3400 MHz
641 Points -16%
CPU (Multi Core)
Intel Core i9-14900K
i9-14900K, 3200 MHz
15466 Points +18%
Intel Core i9-13900K
i9-13900K, 3000 MHz
15181 Points +16%
AMD Ryzen 9 7950X
R9 7950X, 4500 MHz
14786 Points +13%
AMD Ryzen 9 7950X3D
R9 7950X3D, 4200 MHz
14188 Points +9%
Intel Core i7-14700K
i7-14700K, 2500 MHz
13672 Points +5%
AMD Ryzen 9 7945HX
R9 7945HX, 2500 MHz
13057 Points
AMD Ryzen 9 7900X
R9 7900X, 4700 MHz
11563 Points -11%
AMD Ryzen 9 5950X
R9 5950X, 3400 MHz
10482 Points -20%
Intel Core i9-12900K
i9-12900K, 3200 MHz
10240 Points -22%
Intel Core i5-14600K
i5-14600K, 3500 MHz
9371 Points -28%
Intel Core i5-13600K
i5-13600K, 3500 MHz
9265 Points -29%
AMD Ryzen 7 7745HX
R7 7745HX, 3600 MHz
7399 Points -43%
AMD Ryzen 7 7800X3D
R7 7800X3D, 4200 MHz
7121 Points -45%
AMD Ryzen 5 9600X
Ryzen 5 9600X, 3900 MHz
6719 Points -49%
Intel Core i5-12600K
i5-12600K, 2800 MHz
6692 Points -49%
AMD Ryzen 9 7940HS
R9 7940HS, 4000 MHz
6640 Points -49%
AMD Ryzen 7 7840HS
R7 7840HS, 3800 MHz
6509 Points -50%
Intel Core i5-13400
i5-13400, 2500 MHz
6135 Points -53%
AMD Ryzen 5 7600X
R5 7600X, 4700 MHz
5985 Points -54%
Intel Core i5-12400F
i5-12400F, 2500 MHz
4740 Points -64%
Cinebench R15
CPU Single 64Bit
AMD Ryzen 5 9600X
Ryzen 5 9600X, 3900 MHz
341 Points +10%
Intel Core i9-14900K
i9-14900K, 3200 MHz
332 Points +7%
AMD Ryzen 9 7950X
R9 7950X, 4500 MHz
328 Points +5%
Intel Core i9-13900K
i9-13900K, 3000 MHz
327 Points +5%
AMD Ryzen 9 7950X3D
R9 7950X3D, 4200 MHz
326 Points +5%
AMD Ryzen 9 7900X
R9 7900X, 4700 MHz
324 Points +4%
AMD Ryzen 5 7600X
R5 7600X, 4700 MHz
315 Points +1%
Intel Core i7-14700K
i7-14700K, 2500 MHz
314 Points +1%
AMD Ryzen 9 7945HX
R9 7945HX, 2500 MHz
311 Points
Intel Core i5-14600K
i5-14600K, 3500 MHz
297 Points -5%
AMD Ryzen 7 7745HX
R7 7745HX, 3600 MHz
295 Points -5%
AMD Ryzen 7 7800X3D
R7 7800X3D, 4200 MHz
291 Points -6%
Intel Core i5-13600K
i5-13600K, 3500 MHz
289 Points -7%
Intel Core i9-12900K
i9-12900K, 3200 MHz
286 Points -8%
AMD Ryzen 9 7940HS
R9 7940HS, 4000 MHz
284 Points -9%
AMD Ryzen 7 7840HS
R7 7840HS, 3800 MHz
279 Points -10%
Intel Core i5-12600K
i5-12600K, 2800 MHz
275 Points -12%
AMD Ryzen 9 5950X
R9 5950X, 3400 MHz
272 Points -13%
Intel Core i5-13400
i5-13400, 2500 MHz
257 Points -17%
Intel Core i5-12400F
i5-12400F, 2500 MHz
244 Points -22%
CPU Multi 64Bit
Intel Core i9-14900K
i9-14900K, 3200 MHz
6282 Points +19%
AMD Ryzen 9 7950X
R9 7950X, 4500 MHz
6209 Points +17%
Intel Core i9-13900K
i9-13900K, 3000 MHz
6191 Points +17%
AMD Ryzen 9 7950X3D
R9 7950X3D, 4200 MHz
5974 Points +13%
Intel Core i7-14700K
i7-14700K, 2500 MHz
5459 (5323.4min - 5459.26max) Points +3%
AMD Ryzen 9 7945HX
R9 7945HX, 2500 MHz
5289 Points
AMD Ryzen 9 7900X
R9 7900X, 4700 MHz
4856 Points -8%
AMD Ryzen 9 5950X
R9 5950X, 3400 MHz
4492 Points -15%
Intel Core i9-12900K
i9-12900K, 3200 MHz
4057 Points -23%
Intel Core i5-13600K
i5-13600K, 3500 MHz
3643 Points -31%
Intel Core i5-14600K
i5-14600K, 3500 MHz
3640 Points -31%
AMD Ryzen 7 7745HX
R7 7745HX, 3600 MHz
2994 Points -43%
AMD Ryzen 7 7800X3D
R7 7800X3D, 4200 MHz
2974 Points -44%
AMD Ryzen 9 7940HS
R9 7940HS, 4000 MHz
2663 Points -50%
AMD Ryzen 5 9600X
Ryzen 5 9600X, 3900 MHz
2630 Points -50%
AMD Ryzen 7 7840HS
R7 7840HS, 3800 MHz
2608 Points -51%
Intel Core i5-12600K
i5-12600K, 2800 MHz
2555 Points -52%
AMD Ryzen 5 7600X
R5 7600X, 4700 MHz
2507 Points -53%
Intel Core i5-13400
i5-13400, 2500 MHz
2358 Points -55%
Intel Core i5-12400F
i5-12400F, 2500 MHz
1759 Points -67%
Cinebench R11.5
CPU Single 64Bit
Intel Core i9-14900K
i9-14900K, 3200 MHz
4.02 Points +10%
AMD Ryzen 5 9600X
Ryzen 5 9600X, 3900 MHz
4 Points +9%
Intel Core i9-13900K
i9-13900K, 3000 MHz
3.92 Points +7%
AMD Ryzen 9 7950X
R9 7950X, 4500 MHz
3.86 Points +5%
AMD Ryzen 9 7950X3D
R9 7950X3D, 4200 MHz
3.86 Points +5%
AMD Ryzen 9 7900X
R9 7900X, 4700 MHz
3.83 Points +4%
AMD Ryzen 5 7600X
R5 7600X, 4700 MHz
3.72 Points +1%
Intel Core i7-14700K
i7-14700K, 2500 MHz
3.7 Points +1%
AMD Ryzen 9 7945HX
R9 7945HX, 2500 MHz
3.67 Points
Intel Core i5-14600K
i5-14600K, 3500 MHz
3.58 Points -2%
AMD Ryzen 7 7745HX
R7 7745HX, 3600 MHz
3.5 Points -5%
Intel Core i9-12900K
i9-12900K, 3200 MHz
3.49 Points -5%
Intel Core i5-13600K
i5-13600K, 3500 MHz
3.48 Points -5%
AMD Ryzen 9 7940HS
R9 7940HS, 4000 MHz
3.46 Points -6%
AMD Ryzen 7 7800X3D
R7 7800X3D, 4200 MHz
3.43 Points -7%
AMD Ryzen 7 7840HS
R7 7840HS, 3800 MHz
3.33 Points -9%
Intel Core i5-12600K
i5-12600K, 2800 MHz
3.31 Points -10%
AMD Ryzen 9 5950X
R9 5950X, 3400 MHz
3.14 Points -14%
Intel Core i5-13400
i5-13400, 2500 MHz
3.1 Points -16%
Intel Core i5-12400F
i5-12400F, 2500 MHz
2.95 Points -20%
CPU Multi 64Bit
Intel Core i9-14900K
i9-14900K, 3200 MHz
72.24 Points +17%
Intel Core i9-13900K
i9-13900K, 3000 MHz
70.78 Points +15%
AMD Ryzen 9 7950X
R9 7950X, 4500 MHz
68.61 Points +11%
AMD Ryzen 9 7950X3D
R9 7950X3D, 4200 MHz
64.59 Points +5%
AMD Ryzen 9 7945HX
R9 7945HX, 2500 MHz
61.54 Points
Intel Core i7-14700K
i7-14700K, 2500 MHz
61.44 Points 0%
AMD Ryzen 9 7900X
R9 7900X, 4700 MHz
54.51 Points -11%
AMD Ryzen 9 5950X
R9 5950X, 3400 MHz
49.6 Points -19%
Intel Core i9-12900K
i9-12900K, 3200 MHz
47.06 Points -24%
Intel Core i5-13600K
i5-13600K, 3500 MHz
42.38 Points -31%
Intel Core i5-14600K
i5-14600K, 3500 MHz
40.96 Points -33%
AMD Ryzen 7 7745HX
R7 7745HX, 3600 MHz
35.06 Points -43%
AMD Ryzen 7 7800X3D
R7 7800X3D, 4200 MHz
33.48 Points -46%
AMD Ryzen 9 7940HS
R9 7940HS, 4000 MHz
30.88 Points -50%
AMD Ryzen 5 9600X
Ryzen 5 9600X, 3900 MHz
30.86 Points -50%
AMD Ryzen 7 7840HS
R7 7840HS, 3800 MHz
30.25 Points -51%
Intel Core i5-12600K
i5-12600K, 2800 MHz
30.01 Points -51%
AMD Ryzen 5 7600X
R5 7600X, 4700 MHz
28.41 Points -54%
Intel Core i5-13400
i5-13400, 2500 MHz
27.36 Points -56%
Intel Core i5-12400F
i5-12400F, 2500 MHz
20.39 Points -67%
Cinebench R10
Rendering Single CPUs 64Bit
Intel Core i9-14900K
i9-14900K, 3200 MHz
18511 Points +17%
Intel Core i9-13900K
i9-13900K, 3000 MHz
18236 Points +15%
AMD Ryzen 5 9600X
Ryzen 5 9600X, 3900 MHz
17541 Points +10%
Intel Core i7-14700K
i7-14700K, 2500 MHz
17458 Points +10%
Intel Core i5-14600K
i5-14600K, 3500 MHz
16643 Points +5%
AMD Ryzen 9 7900X
R9 7900X, 4700 MHz
16338 Points +3%
AMD Ryzen 9 7950X
R9 7950X, 4500 MHz
16260 Points +2%
Intel Core i5-13600K
i5-13600K, 3500 MHz
16235 Points +2%
Intel Core i9-12900K
i9-12900K, 3200 MHz
16144 Points +2%
AMD Ryzen 5 7600X
R5 7600X, 4700 MHz
16010 Points +1%
AMD Ryzen 9 7945HX
R9 7945HX, 2500 MHz
15889 Points
Intel Core i5-12600K
i5-12600K, 2800 MHz
15180 Points -4%
AMD Ryzen 7 7745HX
R7 7745HX, 3600 MHz
15010 Points -6%
AMD Ryzen 9 7940HS
R9 7940HS, 4000 MHz
14731 Points -7%
AMD Ryzen 7 7800X3D
R7 7800X3D, 4200 MHz
14485 Points -9%
AMD Ryzen 7 7840HS
R7 7840HS, 3800 MHz
14177 Points -11%
Intel Core i5-13400
i5-13400, 2500 MHz
14142 Points -11%
Intel Core i5-12400F
i5-12400F, 2500 MHz
13664 Points -14%
AMD Ryzen 9 5950X
R9 5950X, 3400 MHz
13279 Points -16%
AMD Ryzen 9 7950X3D
R9 7950X3D, 4200 MHz
8853 Points -44%
Rendering Multiple CPUs 64Bit
Intel Core i9-14900K
i9-14900K, 3200 MHz
144156 Points +10%
Intel Core i7-14700K
i7-14700K, 2500 MHz
136062 Points +4%
Intel Core i9-13900K
i9-13900K, 3000 MHz
132000 Points +1%
AMD Ryzen 9 7945HX
R9 7945HX, 2500 MHz
131256 Points
AMD Ryzen 9 7950X
R9 7950X, 4500 MHz
130289 Points -1%
AMD Ryzen 9 7900X
R9 7900X, 4700 MHz
121250 Points -8%
Intel Core i5-14600K
i5-14600K, 3500 MHz
115171 Points -12%
Intel Core i9-12900K
i9-12900K, 3200 MHz
112749 Points -14%
Intel Core i5-13600K
i5-13600K, 3500 MHz
110412 Points -16%
AMD Ryzen 9 5950X
R9 5950X, 3400 MHz
104638 Points -20%
AMD Ryzen 5 9600X
Ryzen 5 9600X, 3900 MHz
100227 Points -24%
AMD Ryzen 7 7745HX
R7 7745HX, 3600 MHz
99215 Points -24%
AMD Ryzen 7 7800X3D
R7 7800X3D, 4200 MHz
94035 Points -28%
AMD Ryzen 5 7600X
R5 7600X, 4700 MHz
89641 Points -32%
Intel Core i5-12600K
i5-12600K, 2800 MHz
89478 Points -32%
AMD Ryzen 9 7940HS
R9 7940HS, 4000 MHz
88529 Points -33%
AMD Ryzen 7 7840HS
R7 7840HS, 3800 MHz
87064 Points -34%
Intel Core i5-13400
i5-13400, 2500 MHz
83214 Points -37%
AMD Ryzen 9 7950X3D
R9 7950X3D, 4200 MHz
72361 Points -45%
Intel Core i5-12400F
i5-12400F, 2500 MHz
69819 Points -47%
Blender - v2.79 BMW27 CPU
Intel Core i5-12400F
i5-12400F, 2500 MHz
269 Seconds * -186%
Intel Core i5-13400
i5-13400, 2500 MHz
206 Seconds * -119%
AMD Ryzen 5 7600X
R5 7600X, 4700 MHz
203 Seconds * -116%
AMD Ryzen 7 7840HS
R7 7840HS, 3800 MHz
192 Seconds * -104%
Intel Core i5-12600K
i5-12600K, 2800 MHz
189.5 Seconds * -102%
AMD Ryzen 9 7940HS
R9 7940HS, 4000 MHz
188 Seconds * -100%
AMD Ryzen 5 9600X
Ryzen 5 9600X, 3900 MHz
184 Seconds * -96%
AMD Ryzen 7 7800X3D
R7 7800X3D, 4200 MHz
169 Seconds * -80%
AMD Ryzen 7 7745HX
R7 7745HX, 3600 MHz
169 Seconds * -80%
Intel Core i5-13600K
i5-13600K, 3500 MHz
135 Seconds * -44%
Intel Core i5-14600K
i5-14600K, 3500 MHz
134 Seconds * -43%
Intel Core i9-12900K
i9-12900K, 3200 MHz
121.1 Seconds * -29%
AMD Ryzen 9 5950X
R9 5950X, 3400 MHz
112.8 Seconds * -20%
AMD Ryzen 9 7900X
R9 7900X, 4700 MHz
106 Seconds * -13%
AMD Ryzen 9 7945HX
R9 7945HX, 2500 MHz
94 Seconds *
Intel Core i7-14700K
i7-14700K, 2500 MHz
91 Seconds * +3%
AMD Ryzen 9 7950X3D
R9 7950X3D, 4200 MHz
86 Seconds * +9%
AMD Ryzen 9 7950X
R9 7950X, 4500 MHz
85 Seconds * +10%
Intel Core i9-13900K
i9-13900K, 3000 MHz
80 Seconds * +15%
Intel Core i9-14900K
i9-14900K, 3200 MHz
80 Seconds * +15%
wPrime 2.10
32m
Intel Core i9-12900K
i9-12900K, 3200 MHz
4.924 s * -157%
Intel Core i5-12600K
i5-12600K, 2800 MHz
4.725 s * -146%
Intel Core i5-12400F
i5-12400F, 2500 MHz
4.078 s * -113%
Intel Core i5-13400
i5-13400, 2500 MHz
3.474 s * -81%
AMD Ryzen 5 7600X
R5 7600X, 4700 MHz
2.78 s * -45%
AMD Ryzen 9 7940HS
R9 7940HS, 4000 MHz
2.698 s * -41%
AMD Ryzen 7 7840HS
R7 7840HS, 3800 MHz
2.626 s * -37%
AMD Ryzen 5 9600X
Ryzen 5 9600X, 3900 MHz
2.617 s * -37%
AMD Ryzen 9 5950X
R9 5950X, 3400 MHz
2.538 s * -32%
Intel Core i5-13600K
i5-13600K, 3500 MHz
2.527 s * -32%
AMD Ryzen 7 7800X3D
R7 7800X3D, 4200 MHz
2.435 s * -27%
Intel Core i5-14600K
i5-14600K, 3500 MHz
2.39 s * -25%
AMD Ryzen 7 7745HX
R7 7745HX, 3600 MHz
2.275 s * -19%
Intel Core i7-14700K
i7-14700K, 2500 MHz
2.147 s * -12%
Intel Core i9-14900K
i9-14900K, 3200 MHz
2.07 s * -8%
AMD Ryzen 9 7950X3D
R9 7950X3D, 4200 MHz
2.007 s * -5%
AMD Ryzen 9 7945HX
R9 7945HX, 2500 MHz
1.917 s *
Intel Core i9-13900K
i9-13900K, 3000 MHz
1.818 s * +5%
AMD Ryzen 9 7900X
R9 7900X, 4700 MHz
1.781 s * +7%
AMD Ryzen 9 7950X
R9 7950X, 4500 MHz
1.669 s * +13%
1024m
Intel Core i5-13400
i5-13400, 2500 MHz
452.309 s * -1209%
Intel Core i5-12600K
i5-12600K, 2800 MHz
202.7 s * -486%
Intel Core i9-12900K
i9-12900K, 3200 MHz
190.6 s * -451%
Intel Core i5-13600K
i5-13600K, 3500 MHz
177.592 s * -414%
Intel Core i5-14600K
i5-14600K, 3500 MHz
158.77 s * -359%
Intel Core i5-12400F
i5-12400F, 2500 MHz
112.849 s * -227%
Intel Core i7-14700K
i7-14700K, 2500 MHz
109.801 s * -218%
Intel Core i9-13900K
i9-13900K, 3000 MHz
79.738 s * -131%
AMD Ryzen 5 7600X
R5 7600X, 4700 MHz
74.491 s * -116%
Intel Core i9-14900K
i9-14900K, 3200 MHz
74.47 s * -115%
AMD Ryzen 7 7840HS
R7 7840HS, 3800 MHz
72.819 s * -111%
AMD Ryzen 5 9600X
Ryzen 5 9600X, 3900 MHz
72.546 s * -110%
AMD Ryzen 9 7940HS
R9 7940HS, 4000 MHz
66.801 s * -93%
AMD Ryzen 9 5950X
R9 5950X, 3400 MHz
64.9 s * -88%
AMD Ryzen 7 7800X3D
R7 7800X3D, 4200 MHz
62.733 s * -82%
AMD Ryzen 7 7745HX
R7 7745HX, 3600 MHz
60.675 s * -76%
AMD Ryzen 9 7900X
R9 7900X, 4700 MHz
39.954 s * -16%
AMD Ryzen 9 7945HX
R9 7945HX, 2500 MHz
34.561 s *
AMD Ryzen 9 7950X3D
R9 7950X3D, 4200 MHz
33.879 s * +2%
AMD Ryzen 9 7950X
R9 7950X, 4500 MHz
30.811 s * +11%
X264 HD Benchmark 4.0
Pass 1
Intel Core i9-14900K
i9-14900K, 3200 MHz
433.5 (424min - 434max) fps +15%
Intel Core i7-14700K
i7-14700K, 2500 MHz
419 (415min - 420max) fps +11%
Intel Core i9-13900K
i9-13900K, 3000 MHz
412 (410min - 417max) fps +9%
Intel Core i5-14600K
i5-14600K, 3500 MHz
411 (410min - 412max) fps +9%
AMD Ryzen 9 7950X3D
R9 7950X3D, 4200 MHz
392.5 (391min - 397max) fps +4%
Intel Core i5-13600K
i5-13600K, 3500 MHz
388 (386min - 388max) fps +3%
AMD Ryzen 9 7950X
R9 7950X, 4500 MHz
379.5 (378min - 385max) fps +1%
AMD Ryzen 9 7945HX
R9 7945HX, 2500 MHz
377 (375min - 380max) fps
AMD Ryzen 9 7900X
R9 7900X, 4700 MHz
376 (369min - 378max) fps 0%
Intel Core i9-12900K
i9-12900K, 3200 MHz
368.5 (366min - 369max) fps -2%
AMD Ryzen 5 7600X
R5 7600X, 4700 MHz
367 (363min - 371max) fps -3%
AMD Ryzen 5 9600X
Ryzen 5 9600X, 3900 MHz
364 (361min - 367max) fps -3%
AMD Ryzen 7 7745HX
R7 7745HX, 3600 MHz
358.5 (356min - 366max) fps -5%
AMD Ryzen 7 7800X3D
R7 7800X3D, 4200 MHz
344 (339min - 346max) fps -9%
AMD Ryzen 9 5950X
R9 5950X, 3400 MHz
338.5 (337min - 340max) fps -10%
Intel Core i5-12600K
i5-12600K, 2800 MHz
333.5 (332min - 336max) fps -12%
Intel Core i5-13400
i5-13400, 2500 MHz
311 (310min - 312max) fps -18%
AMD Ryzen 9 7940HS
R9 7940HS, 4000 MHz
304.5 (304min - 306max) fps -19%
AMD Ryzen 7 7840HS
R7 7840HS, 3800 MHz
298 (288min - 300max) fps -21%
Intel Core i5-12400F
i5-12400F, 2500 MHz
252.5 (249min - 256max) fps -33%
Pass 2
Intel Core i9-14900K
i9-14900K, 3200 MHz
286.5 (285min - 287max) fps +18%
Intel Core i9-13900K
i9-13900K, 3000 MHz
267 (266min - 271max) fps +10%
AMD Ryzen 9 7950X
R9 7950X, 4500 MHz
266.5 (263min - 267max) fps +10%
AMD Ryzen 9 7950X3D
R9 7950X3D, 4200 MHz
265.5 (263min - 266max) fps +9%
Intel Core i7-14700K
i7-14700K, 2500 MHz
261 (259min - 262max) fps +7%
AMD Ryzen 9 7945HX
R9 7945HX, 2500 MHz
243 (242min - 244max) fps
AMD Ryzen 9 7900X
R9 7900X, 4700 MHz
241 (240min - 242max) fps -1%
AMD Ryzen 9 5950X
R9 5950X, 3400 MHz
221 (220min - 221max) fps -9%
Intel Core i5-14600K
i5-14600K, 3500 MHz
209 (208min - 209max) fps -14%
Intel Core i9-12900K
i9-12900K, 3200 MHz
206 (206min - 206max) fps -15%
Intel Core i5-13600K
i5-13600K, 3500 MHz
199 (198.5min - 199.4max) fps -18%
AMD Ryzen 7 7745HX
R7 7745HX, 3600 MHz
173.25 (172.2min - 174.1max) fps -29%
AMD Ryzen 7 7800X3D
R7 7800X3D, 4200 MHz
169.25 (169.1min - 170max) fps -30%
AMD Ryzen 5 9600X
Ryzen 5 9600X, 3900 MHz
154 (153.4min - 154.3max) fps -37%
AMD Ryzen 9 7940HS
R9 7940HS, 4000 MHz
150.8 (150.7min - 152.5max) fps -38%
AMD Ryzen 7 7840HS
R7 7840HS, 3800 MHz
149.3 (148.8min - 149.8max) fps -39%
Intel Core i5-12600K
i5-12600K, 2800 MHz
148 (147min - 148max) fps -39%
AMD Ryzen 5 7600X
R5 7600X, 4700 MHz
147.8 (147.7min - 147.9max) fps -39%
Intel Core i5-13400
i5-13400, 2500 MHz
135.8 (135.7min - 135.9max) fps -44%
Intel Core i5-12400F
i5-12400F, 2500 MHz
101.35 (101.1min - 101.5max) fps -58%
WinRAR - Result
AMD Ryzen 9 7900X
R9 7900X, 4700 MHz
17225 KB/s +13%
AMD Ryzen 7 7800X3D
R7 7800X3D, 4200 MHz
16585 KB/s +9%
AMD Ryzen 9 7950X
R9 7950X, 4500 MHz
16351 KB/s +7%
AMD Ryzen 5 7600X
R5 7600X, 4700 MHz
16178 KB/s +6%
Intel Core i9-14900K
i9-14900K, 3200 MHz
16108 KB/s +6%
AMD Ryzen 9 7950X3D
R9 7950X3D, 4200 MHz
15779 KB/s +4%
AMD Ryzen 9 7945HX
R9 7945HX, 2500 MHz
15242 KB/s
Intel Core i9-13900K
i9-13900K, 3000 MHz
14836 KB/s -3%
AMD Ryzen 5 9600X
Ryzen 5 9600X, 3900 MHz
14819 KB/s -3%
AMD Ryzen 7 7745HX
R7 7745HX, 3600 MHz
14476 KB/s -5%
Intel Core i7-14700K
i7-14700K, 2500 MHz
12800 KB/s -16%
AMD Ryzen 9 5950X
R9 5950X, 3400 MHz
12503 KB/s -18%
Intel Core i5-14600K
i5-14600K, 3500 MHz
11491 KB/s -25%
Intel Core i5-13600K
i5-13600K, 3500 MHz
10937 KB/s -28%
Intel Core i9-12900K
i9-12900K, 3200 MHz
10792 KB/s -29%
Intel Core i5-13400
i5-13400, 2500 MHz
7979 KB/s -48%
Intel Core i5-12400F
i5-12400F, 2500 MHz
7816 KB/s -49%
AMD Ryzen 7 7840HS
R7 7840HS, 3800 MHz
7699 KB/s -49%
AMD Ryzen 9 7940HS
R9 7940HS, 4000 MHz
7439 KB/s -51%
Intel Core i5-12600K
i5-12600K, 2800 MHz
6239 KB/s -59%
TrueCrypt
AES Mean 100MB
AMD Ryzen 9 7950X
R9 7950X, 4500 MHz
30.7 GB/s +11%
AMD Ryzen 9 7945HX
R9 7945HX, 2500 MHz
27.7 GB/s
Intel Core i9-13900K
i9-13900K, 3000 MHz
27 GB/s -3%
AMD Ryzen 9 5950X
R9 5950X, 3400 MHz
26.9 GB/s -3%
AMD Ryzen 9 7950X3D
R9 7950X3D, 4200 MHz
26.9 GB/s -3%
Intel Core i9-14900K
i9-14900K, 3200 MHz
26.7 GB/s -4%
Intel Core i7-14700K
i7-14700K, 2500 MHz
25.6 GB/s -8%
Intel Core i5-14600K
i5-14600K, 3500 MHz
19.5 GB/s -30%
Intel Core i5-13600K
i5-13600K, 3500 MHz
18.8 GB/s -32%
Intel Core i9-12900K
i9-12900K, 3200 MHz
18.5 GB/s -33%
AMD Ryzen 7 7745HX
R7 7745HX, 3600 MHz
16.4 GB/s -41%
AMD Ryzen 7 7800X3D
R7 7800X3D, 4200 MHz
15.3 GB/s -45%
AMD Ryzen 7 7840HS
R7 7840HS, 3800 MHz
14.9 GB/s -46%
AMD Ryzen 9 7900X
R9 7900X, 4700 MHz
14.8 GB/s -47%
AMD Ryzen 9 7940HS
R9 7940HS, 4000 MHz
14.8 GB/s -47%
AMD Ryzen 5 9600X
Ryzen 5 9600X, 3900 MHz
13.4 GB/s -52%
AMD Ryzen 5 7600X
R5 7600X, 4700 MHz
13.2 GB/s -52%
Intel Core i5-12600K
i5-12600K, 2800 MHz
12.8 GB/s -54%
Intel Core i5-13400
i5-13400, 2500 MHz
11.8 GB/s -57%
Intel Core i5-12400F
i5-12400F, 2500 MHz
9.3 GB/s -66%
Twofish Mean 100MB
Intel Core i9-14900K
i9-14900K, 3200 MHz
5.8 GB/s +41%
Intel Core i9-13900K
i9-13900K, 3000 MHz
5.4 GB/s +32%
Intel Core i7-14700K
i7-14700K, 2500 MHz
4.6 GB/s +12%
AMD Ryzen 9 7950X
R9 7950X, 4500 MHz
4.5 GB/s +10%
AMD Ryzen 9 7950X3D
R9 7950X3D, 4200 MHz
4.2 GB/s +2%
AMD Ryzen 9 7945HX
R9 7945HX, 2500 MHz
4.1 GB/s
AMD Ryzen 9 5950X
R9 5950X, 3400 MHz
3.7 GB/s -10%
Intel Core i9-12900K
i9-12900K, 3200 MHz
3.7 GB/s -10%
Intel Core i5-14600K
i5-14600K, 3500 MHz
3.4 GB/s -17%
Intel Core i5-13600K
i5-13600K, 3500 MHz
3.1 GB/s -24%
AMD Ryzen 9 7900X
R9 7900X, 4700 MHz
2.8 GB/s -32%
Intel Core i5-12600K
i5-12600K, 2800 MHz
2.2 GB/s -46%
AMD Ryzen 7 7745HX
R7 7745HX, 3600 MHz
2.2 GB/s -46%
AMD Ryzen 5 9600X
Ryzen 5 9600X, 3900 MHz
2.2 GB/s -46%
AMD Ryzen 7 7800X3D
R7 7800X3D, 4200 MHz
2.1 GB/s -49%
AMD Ryzen 9 7940HS
R9 7940HS, 4000 MHz
2.1 GB/s -49%
AMD Ryzen 7 7840HS
R7 7840HS, 3800 MHz
2.1 GB/s -49%
Intel Core i5-13400
i5-13400, 2500 MHz
2 GB/s -51%
AMD Ryzen 5 7600X
R5 7600X, 4700 MHz
1.8 GB/s -56%
Intel Core i5-12400F
i5-12400F, 2500 MHz
1.4 GB/s -66%
Serpent Mean 100MB
Intel Core i9-13900K
i9-13900K, 3000 MHz
3 GB/s +15%
AMD Ryzen 9 7950X
R9 7950X, 4500 MHz
2.8 GB/s +8%
AMD Ryzen 9 7950X3D
R9 7950X3D, 4200 MHz
2.8 GB/s +8%
Intel Core i9-14900K
i9-14900K, 3200 MHz
2.8 GB/s +8%
Intel Core i7-14700K
i7-14700K, 2500 MHz
2.6 GB/s 0%
AMD Ryzen 9 7945HX
R9 7945HX, 2500 MHz
2.6 GB/s
AMD Ryzen 9 5950X
R9 5950X, 3400 MHz
2.4 GB/s -8%
Intel Core i9-12900K
i9-12900K, 3200 MHz
1.9 GB/s -27%
Intel Core i5-14600K
i5-14600K, 3500 MHz
1.8 GB/s -31%
Intel Core i5-13600K
i5-13600K, 3500 MHz
1.7 GB/s -35%
AMD Ryzen 9 7900X
R9 7900X, 4700 MHz
1.5 GB/s -42%
AMD Ryzen 9 7940HS
R9 7940HS, 4000 MHz
1.4 GB/s -46%
AMD Ryzen 7 7745HX
R7 7745HX, 3600 MHz
1.4 GB/s -46%
AMD Ryzen 5 9600X
Ryzen 5 9600X, 3900 MHz
1.4 GB/s -46%
Intel Core i5-12600K
i5-12600K, 2800 MHz
1.3 GB/s -50%
AMD Ryzen 7 7800X3D
R7 7800X3D, 4200 MHz
1.3 GB/s -50%
AMD Ryzen 7 7840HS
R7 7840HS, 3800 MHz
1.3 GB/s -50%
Intel Core i5-13400
i5-13400, 2500 MHz
1.2 GB/s -54%
AMD Ryzen 5 7600X
R5 7600X, 4700 MHz
1.1 GB/s -58%
Intel Core i5-12400F
i5-12400F, 2500 MHz
0.884 GB/s -66%
Geekbench 5.5
Multi-Core
Intel Core i9-14900K
i9-14900K, 3200 MHz
25867 Points +27%
AMD Ryzen 9 7950X
R9 7950X, 4500 MHz
24625 Points +21%
AMD Ryzen 9 7950X3D
R9 7950X3D, 4200 MHz
24343 Points +19%
Intel Core i9-13900K
i9-13900K, 3000 MHz
24157 Points +18%
Intel Core i7-14700K
i7-14700K, 2500 MHz
23159 Points +14%
AMD Ryzen 9 7945HX
R9 7945HX, 2500 MHz
20394 Points
AMD Ryzen 9 7900X
R9 7900X, 4700 MHz
19987 Points -2%
Intel Core i9-12900K
i9-12900K, 3200 MHz
17854 Points -12%
Intel Core i5-14600K
i5-14600K, 3500 MHz
17516 Points -14%
AMD Ryzen 9 5950X
R9 5950X, 3400 MHz
16891 Points -17%
Intel Core i5-13600K
i5-13600K, 3500 MHz
16651 Points -18%
AMD Ryzen 7 7800X3D
R7 7800X3D, 4200 MHz
14252 Points -30%
AMD Ryzen 7 7745HX
R7 7745HX, 3600 MHz
13462 Points -34%
Intel Core i5-12600K
i5-12600K, 2800 MHz
12797 Points -37%
AMD Ryzen 5 9600X
Ryzen 5 9600X, 3900 MHz
12751 Points -37%
AMD Ryzen 7 7840HS
R7 7840HS, 3800 MHz
12177 Points -40%
Intel Core i5-13400
i5-13400, 2500 MHz
12107 Points -41%
AMD Ryzen 5 7600X
R5 7600X, 4700 MHz
11917 Points -42%
AMD Ryzen 9 7940HS
R9 7940HS, 4000 MHz
11564 Points -43%
Intel Core i5-12400F
i5-12400F, 2500 MHz
9517 Points -53%
Single-Core
AMD Ryzen 5 9600X
Ryzen 5 9600X, 3900 MHz
2523 Points +17%
AMD Ryzen 9 7950X
R9 7950X, 4500 MHz
2311 Points +7%
AMD Ryzen 9 7950X3D
R9 7950X3D, 4200 MHz
2311 Points +7%
Intel Core i9-13900K
i9-13900K, 3000 MHz
2290 Points +6%
AMD Ryzen 9 7900X
R9 7900X, 4700 MHz
2274 Points +5%
Intel Core i9-14900K
i9-14900K, 3200 MHz
2243 Points +4%
AMD Ryzen 5 7600X
R5 7600X, 4700 MHz
2205 Points +2%
AMD Ryzen 9 7945HX
R9 7945HX, 2500 MHz
2158 Points
Intel Core i7-14700K
i7-14700K, 2500 MHz
2121 Points -2%
AMD Ryzen 7 7745HX
R7 7745HX, 3600 MHz
2067 Points -4%
Intel Core i9-12900K
i9-12900K, 3200 MHz
2042 Points -5%
AMD Ryzen 7 7800X3D
R7 7800X3D, 4200 MHz
2027 Points -6%
Intel Core i5-14600K
i5-14600K, 3500 MHz
2017 Points -7%
AMD Ryzen 9 7940HS
R9 7940HS, 4000 MHz
1975 Points -8%
Intel Core i5-13600K
i5-13600K, 3500 MHz
1967 Points -9%
AMD Ryzen 7 7840HS
R7 7840HS, 3800 MHz
1943 Points -10%
Intel Core i5-12600K
i5-12600K, 2800 MHz
1904 Points -12%
Intel Core i5-13400
i5-13400, 2500 MHz
1795 Points -17%
Intel Core i5-12400F
i5-12400F, 2500 MHz
1742 Points -19%
AMD Ryzen 9 5950X
R9 5950X, 3400 MHz
1682 Points -22%
Geekbench 5.0
5.0 Multi-Core
Intel Core i9-14900K
i9-14900K, 3200 MHz
25459 Points +24%
AMD Ryzen 9 7950X
R9 7950X, 4500 MHz
24479 Points +19%
Intel Core i9-13900K
i9-13900K, 3000 MHz
24021 Points +17%
AMD Ryzen 9 7950X3D
R9 7950X3D, 4200 MHz
23720 Points +15%
Intel Core i7-14700K
i7-14700K, 2500 MHz
22756 Points +11%
AMD Ryzen 9 7945HX
R9 7945HX, 2500 MHz
20593 Points
AMD Ryzen 9 7900X
R9 7900X, 4700 MHz
19975 Points -3%
Intel Core i9-12900K
i9-12900K, 3200 MHz
17959 Points -13%
Intel Core i5-14600K
i5-14600K, 3500 MHz
17374 Points -16%
Intel Core i5-13600K
i5-13600K, 3500 MHz
16635 Points -19%
AMD Ryzen 9 5950X
R9 5950X, 3400 MHz
16570 Points -20%
AMD Ryzen 7 7800X3D
R7 7800X3D, 4200 MHz
13888 Points -33%
AMD Ryzen 7 7745HX
R7 7745HX, 3600 MHz
13342 Points -35%
Intel Core i5-12600K
i5-12600K, 2800 MHz
12746 Points -38%
AMD Ryzen 5 9600X
Ryzen 5 9600X, 3900 MHz
12556 Points -39%
AMD Ryzen 7 7840HS
R7 7840HS, 3800 MHz
11933 Points -42%
AMD Ryzen 5 7600X
R5 7600X, 4700 MHz
11880 Points -42%
Intel Core i5-13400
i5-13400, 2500 MHz
11801 Points -43%
AMD Ryzen 9 7940HS
R9 7940HS, 4000 MHz
11232 Points -45%
Intel Core i5-12400F
i5-12400F, 2500 MHz
9368 Points -55%
5.0 Single-Core
AMD Ryzen 5 9600X
Ryzen 5 9600X, 3900 MHz
2397 Points +14%
Intel Core i9-14900K
i9-14900K, 3200 MHz
2272 Points +8%
AMD Ryzen 9 7950X
R9 7950X, 4500 MHz
2222 Points +6%
Intel Core i9-13900K
i9-13900K, 3000 MHz
2214 Points +6%
AMD Ryzen 9 7900X
R9 7900X, 4700 MHz
2194 Points +5%
AMD Ryzen 9 7950X3D
R9 7950X3D, 4200 MHz
2183 Points +4%
AMD Ryzen 5 7600X
R5 7600X, 4700 MHz
2126 Points +1%
AMD Ryzen 9 7945HX
R9 7945HX, 2500 MHz
2095 Points
Intel Core i7-14700K
i7-14700K, 2500 MHz
2045 Points -2%
Intel Core i5-14600K
i5-14600K, 3500 MHz
2004 Points -4%
AMD Ryzen 7 7745HX
R7 7745HX, 3600 MHz
1989 Points -5%
Intel Core i9-12900K
i9-12900K, 3200 MHz
1968 Points -6%
AMD Ryzen 7 7800X3D
R7 7800X3D, 4200 MHz
1938 Points -7%
Intel Core i5-13600K
i5-13600K, 3500 MHz
1931 Points -8%
AMD Ryzen 7 7840HS
R7 7840HS, 3800 MHz
1900 Points -9%
AMD Ryzen 9 7940HS
R9 7940HS, 4000 MHz
1898 Points -9%
Intel Core i5-12600K
i5-12600K, 2800 MHz
1821 Points -13%
Intel Core i5-13400
i5-13400, 2500 MHz
1706 Points -19%
AMD Ryzen 9 5950X
R9 5950X, 3400 MHz
1683 Points -20%
Intel Core i5-12400F
i5-12400F, 2500 MHz
1673 Points -20%
Geekbench 4.4
64 Bit Single-Core Score
Intel Core i9-14900K
i9-14900K, 3200 MHz
9890 Points +15%
AMD Ryzen 5 9600X
Ryzen 5 9600X, 3900 MHz
9757 Points +13%
Intel Core i9-13900K
i9-13900K, 3000 MHz
9598 Points +11%
AMD Ryzen 9 7950X
R9 7950X, 4500 MHz
9322 Points +8%
Intel Core i7-14700K
i7-14700K, 2500 MHz
9304 Points +8%
AMD Ryzen 9 7950X3D
R9 7950X3D, 4200 MHz
9240 Points +7%
AMD Ryzen 9 7900X
R9 7900X, 4700 MHz
9193 Points +7%
AMD Ryzen 7 7800X3D
R7 7800X3D, 4200 MHz
9097 Points +6%
AMD Ryzen 5 7600X
R5 7600X, 4700 MHz
8926 Points +4%
Intel Core i5-14600K
i5-14600K, 3500 MHz
8904 Points +3%
Intel Core i9-12900K
i9-12900K, 3200 MHz
8665 Points +1%
Intel Core i5-13600K
i5-13600K, 3500 MHz
8618 Points 0%
AMD Ryzen 9 7945HX
R9 7945HX, 2500 MHz
8613 Points
AMD Ryzen 7 7745HX
R7 7745HX, 3600 MHz
8243 Points -4%
Intel Core i5-12600K
i5-12600K, 2800 MHz
8223 Points -5%
AMD Ryzen 7 7840HS
R7 7840HS, 3800 MHz
8048 Points -7%
AMD Ryzen 9 7940HS
R9 7940HS, 4000 MHz
7904 Points -8%
Intel Core i5-13400
i5-13400, 2500 MHz
7683 Points -11%
Intel Core i5-12400F
i5-12400F, 2500 MHz
7548 Points -12%
AMD Ryzen 9 5950X
R9 5950X, 3400 MHz
7216 Points -16%
64 Bit Multi-Core Score
AMD Ryzen 9 7950X
R9 7950X, 4500 MHz
89678 Points +18%
Intel Core i9-14900K
i9-14900K, 3200 MHz
89177 Points +17%
AMD Ryzen 9 7950X3D
R9 7950X3D, 4200 MHz
87922 Points +15%
Intel Core i9-13900K
i9-13900K, 3000 MHz
86695 Points +14%
Intel Core i7-14700K
i7-14700K, 2500 MHz
79501 Points +4%
AMD Ryzen 9 7945HX
R9 7945HX, 2500 MHz
76265 Points
AMD Ryzen 9 7900X
R9 7900X, 4700 MHz
74731 Points -2%
Intel Core i5-14600K
i5-14600K, 3500 MHz
64035 Points -16%
Intel Core i9-12900K
i9-12900K, 3200 MHz
63583 Points -17%
AMD Ryzen 9 5950X
R9 5950X, 3400 MHz
63233 Points -17%
Intel Core i5-13600K
i5-13600K, 3500 MHz
60407 Points -21%
AMD Ryzen 7 7800X3D
R7 7800X3D, 4200 MHz
54840 Points -28%
AMD Ryzen 7 7745HX
R7 7745HX, 3600 MHz
54665 Points -28%
AMD Ryzen 5 9600X
Ryzen 5 9600X, 3900 MHz
51644 Points -32%
AMD Ryzen 7 7840HS
R7 7840HS, 3800 MHz
48743 Points -36%
AMD Ryzen 5 7600X
R5 7600X, 4700 MHz
47407 Points -38%
Intel Core i5-12600K
i5-12600K, 2800 MHz
46557 Points -39%
AMD Ryzen 9 7940HS
R9 7940HS, 4000 MHz
46270 Points -39%
Intel Core i5-13400
i5-13400, 2500 MHz
42509 Points -44%
Intel Core i5-12400F
i5-12400F, 2500 MHz
35098 Points -54%
3DMark 11 - 1280x720 Performance Physics
AMD Ryzen 9 7950X3D
R9 7950X3D, 4200 MHz
36991 Points +36%
AMD Ryzen 7 7800X3D
R7 7800X3D, 4200 MHz
35127 Points +30%
Intel Core i7-14700K
i7-14700K, 2500 MHz
32336 Points +19%
Intel Core i9-13900K
i9-13900K, 3000 MHz
32273 Points +19%
Intel Core i9-14900K
i9-14900K, 3200 MHz
32188 Points +19%
Intel Core i5-14600K
i5-14600K, 3500 MHz
31641 Points +17%
Intel Core i5-13600K
i5-13600K, 3500 MHz
30480 Points +12%
AMD Ryzen 9 7900X
R9 7900X, 4700 MHz
28618 Points +6%
AMD Ryzen 9 7950X
R9 7950X, 4500 MHz
28618 Points +6%
Intel Core i9-12900K
i9-12900K, 3200 MHz
28211 Points +4%
AMD Ryzen 9 7945HX
R9 7945HX, 2500 MHz
27102 Points
AMD Ryzen 7 7745HX
R7 7745HX, 3600 MHz
26321 Points -3%
AMD Ryzen 5 9600X
Ryzen 5 9600X, 3900 MHz
25717 Points -5%
AMD Ryzen 5 7600X
R5 7600X, 4700 MHz
25396 Points -6%
AMD Ryzen 9 5950X
R9 5950X, 3400 MHz
25367 Points -6%
Intel Core i5-12600K
i5-12600K, 2800 MHz
25017 Points -8%
Intel Core i5-13400
i5-13400, 2500 MHz
23120 Points -15%
AMD Ryzen 7 7840HS
R7 7840HS, 3800 MHz
22960 Points -15%
AMD Ryzen 9 7940HS
R9 7940HS, 4000 MHz
21848 Points -19%
Intel Core i5-12400F
i5-12400F, 2500 MHz
19436 Points -28%
7-Zip 18.03
7z b 4
AMD Ryzen 9 7950X
R9 7950X, 4500 MHz
161724 MIPS +15%
AMD Ryzen 9 7950X3D
R9 7950X3D, 4200 MHz
159341 MIPS +13%
Intel Core i9-14900K
i9-14900K, 3200 MHz
149570 MIPS +6%
Intel Core i9-13900K
i9-13900K, 3000 MHz
147068 MIPS +5%
AMD Ryzen 9 7945HX
R9 7945HX, 2500 MHz
140613 MIPS
Intel Core i7-14700K
i7-14700K, 2500 MHz
135648 MIPS -4%
AMD Ryzen 9 5950X
R9 5950X, 3400 MHz
127792 MIPS -9%
AMD Ryzen 9 7900X
R9 7900X, 4700 MHz
124975 MIPS -11%
Intel Core i9-12900K
i9-12900K, 3200 MHz
97671 MIPS -31%
Intel Core i5-14600K
i5-14600K, 3500 MHz
93235 MIPS -34%
Intel Core i5-13600K
i5-13600K, 3500 MHz
89647 MIPS -36%
AMD Ryzen 7 7800X3D
R7 7800X3D, 4200 MHz
85067 MIPS -40%
AMD Ryzen 7 7745HX
R7 7745HX, 3600 MHz
83268 MIPS -41%
AMD Ryzen 7 7840HS
R7 7840HS, 3800 MHz
72684 MIPS -48%
AMD Ryzen 9 7940HS
R9 7940HS, 4000 MHz
70019 MIPS -50%
AMD Ryzen 5 7600X
R5 7600X, 4700 MHz
69291 MIPS -51%
AMD Ryzen 5 9600X
Ryzen 5 9600X, 3900 MHz
68220 MIPS -51%
Intel Core i5-12600K
i5-12600K, 2800 MHz
64260 MIPS -54%
Intel Core i5-13400
i5-13400, 2500 MHz
59510 MIPS -58%
Intel Core i5-12400F
i5-12400F, 2500 MHz
45043 MIPS -68%
7z b 4 -mmt1
AMD Ryzen 9 7950X
R9 7950X, 4500 MHz
8365 MIPS +8%
AMD Ryzen 9 7950X3D
R9 7950X3D, 4200 MHz
8321 MIPS +8%
AMD Ryzen 9 7900X
R9 7900X, 4700 MHz
8282 MIPS +7%
AMD Ryzen 7 7800X3D
R7 7800X3D, 4200 MHz
8235 MIPS +7%
AMD Ryzen 5 7600X
R5 7600X, 4700 MHz
8063 MIPS +5%
AMD Ryzen 5 9600X
Ryzen 5 9600X, 3900 MHz
7796 MIPS +1%
Intel Core i9-14900K
i9-14900K, 3200 MHz
7772 MIPS +1%
AMD Ryzen 9 7945HX
R9 7945HX, 2500 MHz
7711 MIPS
Intel Core i7-14700K
i7-14700K, 2500 MHz
7351 MIPS -5%
AMD Ryzen 7 7745HX
R7 7745HX, 3600 MHz
7275 MIPS -6%
Intel Core i9-13900K
i9-13900K, 3000 MHz
7272 MIPS -6%
AMD Ryzen 9 5950X
R9 5950X, 3400 MHz
6974 MIPS -10%
Intel Core i5-14600K
i5-14600K, 3500 MHz
6910 MIPS -10%
AMD Ryzen 9 7940HS
R9 7940HS, 4000 MHz
6683 MIPS -13%
Intel Core i9-12900K
i9-12900K, 3200 MHz
6571 MIPS -15%
AMD Ryzen 7 7840HS
R7 7840HS, 3800 MHz
6563 MIPS -15%
Intel Core i5-13600K
i5-13600K, 3500 MHz
6502 MIPS -16%
Intel Core i5-12600K
i5-12600K, 2800 MHz
5944 MIPS -23%
Intel Core i5-13400
i5-13400, 2500 MHz
5829 MIPS -24%
Intel Core i5-12400F
i5-12400F, 2500 MHz
5476 MIPS -29%
HWBOT x265 Benchmark v2.2 - 4k Preset
AMD Ryzen 9 7950X
R9 7950X, 4500 MHz
44.4 fps +18%
Intel Core i9-14900K
i9-14900K, 3200 MHz
42.8 fps +14%
Intel Core i9-13900K
i9-13900K, 3000 MHz
42.6 fps +13%
AMD Ryzen 9 7950X3D
R9 7950X3D, 4200 MHz
42.4 fps +13%
AMD Ryzen 9 7945HX
R9 7945HX, 2500 MHz
37.6 fps
Intel Core i7-14700K
i7-14700K, 2500 MHz
36.8 fps -2%
AMD Ryzen 9 7900X
R9 7900X, 4700 MHz
36.2 fps -4%
AMD Ryzen 9 5950X
R9 5950X, 3400 MHz
31.8 fps -15%
Intel Core i5-12600K
i5-12600K, 2800 MHz
30.1 fps -20%
Intel Core i9-12900K
i9-12900K, 3200 MHz
30 fps -20%
Intel Core i5-14600K
i5-14600K, 3500 MHz
28.6 fps -24%
Intel Core i5-13600K
i5-13600K, 3500 MHz
27.6 fps -27%
AMD Ryzen 7 7800X3D
R7 7800X3D, 4200 MHz
24.4 fps -35%
AMD Ryzen 7 7745HX
R7 7745HX, 3600 MHz
24.1 fps -36%
AMD Ryzen 5 9600X
Ryzen 5 9600X, 3900 MHz
23.2 fps -38%
AMD Ryzen 5 7600X
R5 7600X, 4700 MHz
21.1 fps -44%
AMD Ryzen 7 7840HS
R7 7840HS, 3800 MHz
20.9 fps -44%
AMD Ryzen 9 7940HS
R9 7940HS, 4000 MHz
20.7 fps -45%
Intel Core i5-13400
i5-13400, 2500 MHz
19.1 fps -49%
Intel Core i5-12400F
i5-12400F, 2500 MHz
15.2 fps -60%
R Benchmark 2.5 - Overall mean
Intel Core i5-12400F
i5-12400F, 2500 MHz
0.4837 sec * -25%
Intel Core i5-13400
i5-13400, 2500 MHz
0.4654 sec * -20%
AMD Ryzen 9 5950X
R9 5950X, 3400 MHz
0.4556 sec * -17%
Intel Core i5-12600K
i5-12600K, 2800 MHz
0.4456 sec * -15%
AMD Ryzen 7 7840HS
R7 7840HS, 3800 MHz
0.4354 sec * -12%
Intel Core i9-12900K
i9-12900K, 3200 MHz
0.4216 sec * -9%
AMD Ryzen 9 7940HS
R9 7940HS, 4000 MHz
0.4192 sec * -8%
AMD Ryzen 7 7800X3D
R7 7800X3D, 4200 MHz
0.4152 sec * -7%
AMD Ryzen 7 7745HX
R7 7745HX, 3600 MHz
0.4141 sec * -7%
Intel Core i5-13600K
i5-13600K, 3500 MHz
0.405 sec * -4%
Intel Core i5-14600K
i5-14600K, 3500 MHz
0.3937 sec * -1%
AMD Ryzen 9 7945HX
R9 7945HX, 2500 MHz
0.3884 sec *
Intel Core i7-14700K
i7-14700K, 2500 MHz
0.3826 sec * +1%
AMD Ryzen 5 7600X
R5 7600X, 4700 MHz
0.3749 sec * +3%
AMD Ryzen 9 7900X
R9 7900X, 4700 MHz
0.3736 sec * +4%
AMD Ryzen 9 7950X3D
R9 7950X3D, 4200 MHz
0.372 sec * +4%
AMD Ryzen 9 7950X
R9 7950X, 4500 MHz
0.3682 sec * +5%
Intel Core i9-13900K
i9-13900K, 3000 MHz
0.3539 sec * +9%
Intel Core i9-14900K
i9-14900K, 3200 MHz
0.345 sec * +11%
AMD Ryzen 5 9600X
Ryzen 5 9600X, 3900 MHz
0.3389 sec * +13%
LibreOffice - 20 Documents To PDF
Intel Core i5-12600K
i5-12600K, 2800 MHz
71.8 s * -102%
AMD Ryzen 7 7840HS
R7 7840HS, 3800 MHz
53.9 s * -52%
Intel Core i5-12400F
i5-12400F, 2500 MHz
46.5 s * -31%
AMD Ryzen 5 9600X
Ryzen 5 9600X, 3900 MHz
46.4 s * -31%
AMD Ryzen 9 7940HS
R9 7940HS, 4000 MHz
46.3 s * -30%
AMD Ryzen 9 5950X
R9 5950X, 3400 MHz
45.97 s * -29%
AMD Ryzen 7 7745HX
R7 7745HX, 3600 MHz
41.4 s * -17%
AMD Ryzen 7 7800X3D
R7 7800X3D, 4200 MHz
40.7 s * -15%
Intel Core i9-12900K
i9-12900K, 3200 MHz
40.6 s * -14%
Intel Core i7-14700K
i7-14700K, 2500 MHz
39.8 s * -12%
Intel Core i5-13400
i5-13400, 2500 MHz
38.7 s * -9%
AMD Ryzen 9 7950X3D
R9 7950X3D, 4200 MHz
38.6 s * -9%
AMD Ryzen 5 7600X
R5 7600X, 4700 MHz
36.8 s * -4%
Intel Core i9-13900K
i9-13900K, 3000 MHz
36.6 s * -3%
AMD Ryzen 9 7950X
R9 7950X, 4500 MHz
35.5 s * -0%
AMD Ryzen 9 7945HX
R9 7945HX, 2500 MHz
35.5 s *
Intel Core i5-13600K
i5-13600K, 3500 MHz
35 s * +1%
AMD Ryzen 9 7900X
R9 7900X, 4700 MHz
34.9 s * +2%
Intel Core i9-14900K
i9-14900K, 3200 MHz
32.5 s * +8%
Intel Core i5-14600K
i5-14600K, 3500 MHz
31.9 s * +10%
WebXPRT 3 - Overall
AMD Ryzen 9 7950X3D
R9 7950X3D, 4200 MHz
383 Points +6%
Intel Core i9-14900K
i9-14900K, 3200 MHz
382 Points +6%
AMD Ryzen 9 7900X
R9 7900X, 4700 MHz
371 Points +3%
AMD Ryzen 9 7950X
R9 7950X, 4500 MHz
366 Points +1%
AMD Ryzen 5 9600X
Ryzen 5 9600X, 3900 MHz
364 Points +1%
AMD Ryzen 5 7600X
R5 7600X, 4700 MHz
362 Points 0%
Intel Core i9-13900K
i9-13900K, 3000 MHz
361 Points 0%
AMD Ryzen 9 7945HX
R9 7945HX, 2500 MHz
361 Points
Intel Core i5-14600K
i5-14600K, 3500 MHz
354 Points -2%
AMD Ryzen 7 7800X3D
R7 7800X3D, 4200 MHz
353 Points -2%
AMD Ryzen 7 7745HX
R7 7745HX, 3600 MHz
349 Points -3%
Intel Core i7-14700K
i7-14700K, 2500 MHz
339 Points -6%
Intel Core i5-13600K
i5-13600K, 3500 MHz
333 Points -8%
AMD Ryzen 7 7840HS
R7 7840HS, 3800 MHz
324 Points -10%
Intel Core i9-12900K
i9-12900K, 3200 MHz
320 Points -11%
Intel Core i5-13400
i5-13400, 2500 MHz
306 Points -15%
AMD Ryzen 9 7940HS
R9 7940HS, 4000 MHz
302 Points -16%
Intel Core i5-12600K
i5-12600K, 2800 MHz
293 Points -19%
AMD Ryzen 9 5950X
R9 5950X, 3400 MHz
291 Points -19%
Intel Core i5-12400F
i5-12400F, 2500 MHz
272 Points -25%
Mozilla Kraken 1.1 - Total
Intel Core i5-12400F
i5-12400F, 2500 MHz
573 ms * -28%
AMD Ryzen 9 5950X
R9 5950X, 3400 MHz
558 ms * -25%
Intel Core i5-13400
i5-13400, 2500 MHz
535 ms * -20%
AMD Ryzen 7 7840HS
R7 7840HS, 3800 MHz
517 ms * -16%
Intel Core i5-12600K
i5-12600K, 2800 MHz
511 ms * -15%
AMD Ryzen 7 7800X3D
R7 7800X3D, 4200 MHz
487 ms * -9%
AMD Ryzen 9 7940HS
R9 7940HS, 4000 MHz
487 ms * -9%
Intel Core i9-12900K
i9-12900K, 3200 MHz
481 ms * -8%
AMD Ryzen 7 7745HX
R7 7745HX, 3600 MHz
481 ms * -8%
Intel Core i5-13600K
i5-13600K, 3500 MHz
469 ms * -5%
Intel Core i5-14600K
i5-14600K, 3500 MHz
450 ms * -1%
AMD Ryzen 9 7945HX
R9 7945HX, 2500 MHz
446 ms *
AMD Ryzen 5 7600X
R5 7600X, 4700 MHz
441 ms * +1%
Intel Core i7-14700K
i7-14700K, 2500 MHz
439 ms * +2%
AMD Ryzen 9 7950X3D
R9 7950X3D, 4200 MHz
437 ms * +2%
AMD Ryzen 9 7950X
R9 7950X, 4500 MHz
433 ms * +3%
Intel Core i9-13900K
i9-13900K, 3000 MHz
432 ms * +3%
AMD Ryzen 9 7900X
R9 7900X, 4700 MHz
431 ms * +3%
Intel Core i9-14900K
i9-14900K, 3200 MHz
418 ms * +6%
AMD Ryzen 5 9600X
Ryzen 5 9600X, 3900 MHz
389 ms * +13%
3DMark
1920x1080 Fire Strike Physics
Intel Core i9-14900K
i9-14900K, 3200 MHz
56087 Points +43%
Intel Core i9-13900K
i9-13900K, 3000 MHz
53853 Points +38%
Intel Core i7-14700K
i7-14700K, 2500 MHz
49142 Points +26%
AMD Ryzen 9 7950X3D
R9 7950X3D, 4200 MHz
44787 Points +15%
AMD Ryzen 9 7900X
R9 7900X, 4700 MHz
42682 Points +9%
AMD Ryzen 9 7950X
R9 7950X, 4500 MHz
42682 Points +9%
Intel Core i5-14600K
i5-14600K, 3500 MHz
40164 Points +3%
AMD Ryzen 9 5950X
R9 5950X, 3400 MHz
39600 Points +1%
Intel Core i9-12900K
i9-12900K, 3200 MHz
39112 Points 0%
AMD Ryzen 9 7945HX
R9 7945HX, 2500 MHz
39095 Points
Intel Core i5-13600K
i5-13600K, 3500 MHz
35386 Points -9%
AMD Ryzen 5 9600X
Ryzen 5 9600X, 3900 MHz
33462 Points -14%
AMD Ryzen 7 7800X3D
R7 7800X3D, 4200 MHz
33345 Points -15%
AMD Ryzen 5 7600X
R5 7600X, 4700 MHz
30691 Points -21%
Intel Core i5-12600K
i5-12600K, 2800 MHz
29671 Points -24%
AMD Ryzen 7 7840HS
R7 7840HS, 3800 MHz
28906 Points -26%
AMD Ryzen 9 7940HS
R9 7940HS, 4000 MHz
28247 Points -28%
Intel Core i5-13400
i5-13400, 2500 MHz
27135 Points -31%
Intel Core i5-12400F
i5-12400F, 2500 MHz
24023 Points -39%
AMD Ryzen 7 7745HX
R7 7745HX, 3600 MHz
19932 Points -49%
2560x1440 Time Spy CPU
Intel Core i9-14900K
i9-14900K, 3200 MHz
23721 Points +107%
Intel Core i7-14700K
i7-14700K, 2500 MHz
21541 Points +88%
Intel Core i9-13900K
i9-13900K, 3000 MHz
19392 Points +69%
Intel Core i5-14600K
i5-14600K, 3500 MHz
18768 Points +64%
Intel Core i9-12900K
i9-12900K, 3200 MHz
18431 Points +61%
AMD Ryzen 9 7950X3D
R9 7950X3D, 4200 MHz
17206 Points +50%
Intel Core i5-13600K
i5-13600K, 3500 MHz
17124 Points +49%
AMD Ryzen 9 7900X
R9 7900X, 4700 MHz
16616 Points +45%
AMD Ryzen 9 7950X
R9 7950X, 4500 MHz
16616 Points +45%
AMD Ryzen 7 7800X3D
R7 7800X3D, 4200 MHz
14098 Points +23%
Intel Core i5-12600K
i5-12600K, 2800 MHz
13869 Points +21%
AMD Ryzen 9 5950X
R9 5950X, 3400 MHz
13650 Points +19%
Intel Core i5-13400
i5-13400, 2500 MHz
12948 Points +13%
AMD Ryzen 9 7945HX
R9 7945HX, 2500 MHz
11466 Points
AMD Ryzen 7 7840HS
R7 7840HS, 3800 MHz
11159 Points -3%
AMD Ryzen 7 7745HX
R7 7745HX, 3600 MHz
11051 Points -4%
AMD Ryzen 5 9600X
Ryzen 5 9600X, 3900 MHz
10821 Points -6%
AMD Ryzen 9 7940HS
R9 7940HS, 4000 MHz
10563 Points -8%
AMD Ryzen 5 7600X
R5 7600X, 4700 MHz
10458 Points -9%
Intel Core i5-12400F
i5-12400F, 2500 MHz
9745 Points -15%

* ... smaller is better

Cinebench 结果 AMD Ryzen 9 7945HX

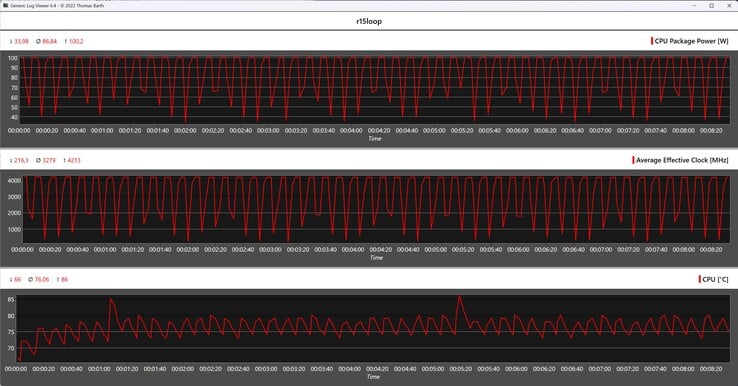
Minisforum BD790i 主板与 AMD Ryzen 9 7945HX 配合使用,出色地完成了 Cinebench R15 连续循环测试。在所有 50 次运行中,16 个核心的性能保持稳定,这意味着在连续负载下性能不会下降。出厂时安装的散热器在这项测试中表现出色。

Cinebench R15 循环期间的 CPU 指标
2440.22740.23040.23340.23640.23940.24240.24540.24840.25140.25440.25740.26040.2Tooltip
AMD Ryzen 9 7945HX Radeon 610M, R9 7945HX, Kingston KC3000 2048G SKC3000D2048G: Ø5075 (4988.15-5158.63)
Intel Core i9-12900K NVIDIA Titan RTX, i9-12900K, Intel Optane 905P 480GB 2.5: Ø3987 (3920.42-4037.55)
Intel Core i5-12600K NVIDIA Titan RTX, i5-12600K, Intel Optane 905P 480GB 2.5: Ø2545 (2497.35-2570.36)
AMD Ryzen 5 7600X NVIDIA GeForce RTX 3090, R5 7600X: Ø2468 (2440.21-2487.56)
AMD Ryzen 9 7900X NVIDIA GeForce RTX 3090, R9 7900X: Ø4785 (4739.9-4829.17)
AMD Ryzen 9 7950X NVIDIA GeForce RTX 3090, R9 7950X, Corsair MP600: Ø6154 (6136.85-6189.08)
Intel Core i9-13900K NVIDIA GeForce RTX 3090, i9-13900K, Corsair MP600: Ø6182 (6045.95-6213.11)
Intel Core i5-13600K NVIDIA GeForce RTX 3090, i5-13600K, Corsair MP600: Ø3620 (3607.83-3632.07)
AMD Ryzen 7 7840HS Radeon 780M, R7 7840HS, Kingston OM8PGP41024Q-A0: Ø2605 (2564.1-2649.53)
AMD Ryzen 5 9600X NVIDIA GeForce RTX 4090, Ryzen 5 9600X: Ø2623 (2586.99-2654.28)
AMD Ryzen 7 7745HX Radeon 610M, R7 7745HX, Fikwot FN955: Ø2867 (2818.49-2955.3)

系统性能

在系统性能基准测试中,基于 Minisforum BD790i 的测试系统并不总能赶上竞争对手。不过,该系统的性能总体上还是相当高的。功能强大同时相对节俭的 AMD Ryzen 9 7945HX在日常使用中没有显示出任何弱点。快速的 NVMe 固态硬盘和 DDR5 内存的组合为它处理高耗能任务提供了足够的余地。

Performance Rating - Percent
AMD Ryzen 9 7950X3D, NVIDIA GeForce RTX 4090 -1!
NVIDIA GeForce RTX 4090, R9 7950X3D
97 pt
AMD Ryzen 9 7950X, NVIDIA GeForce RTX 3090
NVIDIA GeForce RTX 3090, R9 7950X, Corsair MP600
96.8 pt
AMD Ryzen 9 7900X, NVIDIA GeForce RTX 3090
NVIDIA GeForce RTX 3090, R9 7900X
96.8 pt
Intel Core i9-14900K, NVIDIA GeForce RTX 4090
NVIDIA GeForce RTX 4090, i9-14900K, WDC PC SN720 SDAQNTW-512G
96.5 pt
AMD Ryzen 5 7600X, NVIDIA GeForce RTX 3090
NVIDIA GeForce RTX 3090, R5 7600X
96.3 pt
Intel Core i9-13900K, NVIDIA GeForce RTX 3090
NVIDIA GeForce RTX 3090, i9-13900K, Corsair MP600
95.7 pt
Intel Core i5-13600K, NVIDIA GeForce RTX 3090
NVIDIA GeForce RTX 3090, i5-13600K, Corsair MP600
93.5 pt
Intel Core i5-14600K, NVIDIA GeForce RTX 4090
NVIDIA GeForce RTX 4090, i5-14600K, WDC PC SN720 SDAQNTW-512G
93.4 pt
AMD Ryzen 7 7800X3D, NVIDIA GeForce RTX 4090
NVIDIA GeForce RTX 4090, R7 7800X3D, Corsair MP600
92.7 pt
AMD Ryzen 9 5950X, NVIDIA Titan RTX
NVIDIA Titan RTX, R9 5950X, Intel Optane 905P 480GB 2.5
87.6 pt
Intel Core i9-12900K, NVIDIA Titan RTX
NVIDIA Titan RTX, i9-12900K, Intel Optane 905P 480GB 2.5
85.4 pt
Intel Core i5-13400, NVIDIA GeForce RTX 4090
NVIDIA GeForce RTX 4090, i5-13400, Intel Optane 905P 480GB 2.5
84.8 pt
AMD Ryzen 9 7945HX, AMD Radeon 610M
Radeon 610M, R9 7945HX, Kingston KC3000 2048G SKC3000D2048G
84.6 pt
Intel Core i5-12600K, NVIDIA Titan RTX
NVIDIA Titan RTX, i5-12600K, Intel Optane 905P 480GB 2.5
83.9 pt
AMD Ryzen 7 7745HX, AMD Radeon 610M
Radeon 610M, R7 7745HX, Fikwot FN955
82.7 pt
AMD Ryzen 7 7840HS, AMD Radeon 780M
Radeon 780M, R7 7840HS, Kingston OM8PGP41024Q-A0
82 pt
AMD Ryzen 9 7940HS, AMD Radeon 780M
Radeon 780M, R9 7940HS, 2x Kingston OM8PGP4256Q-A0 (RAID 0)
76.7 pt
Intel Core i5-12400F, NVIDIA GeForce RTX 4090
NVIDIA GeForce RTX 4090, i5-12400F, Intel Optane 905P 480GB 2.5
75.5 pt
PCMark 10
Score
Intel Core i9-14900K, NVIDIA GeForce RTX 4090
NVIDIA GeForce RTX 4090, i9-14900K, WDC PC SN720 SDAQNTW-512G
10101 Points +44%
AMD Ryzen 9 7900X, NVIDIA GeForce RTX 3090
NVIDIA GeForce RTX 3090, R9 7900X
9911 Points +41%
AMD Ryzen 9 7950X, NVIDIA GeForce RTX 3090
NVIDIA GeForce RTX 3090, R9 7950X, Corsair MP600
9911 Points +41%
Intel Core i9-13900K, NVIDIA GeForce RTX 3090
NVIDIA GeForce RTX 3090, i9-13900K, Corsair MP600
9788 Points +39%
Intel Core i5-14600K, NVIDIA GeForce RTX 4090
NVIDIA GeForce RTX 4090, i5-14600K, WDC PC SN720 SDAQNTW-512G
9587 Points +37%
AMD Ryzen 7 7800X3D, NVIDIA GeForce RTX 4090
NVIDIA GeForce RTX 4090, R7 7800X3D, Corsair MP600
9500 Points +35%
AMD Ryzen 5 7600X, NVIDIA GeForce RTX 3090
NVIDIA GeForce RTX 3090, R5 7600X
9470 Points +35%
Intel Core i5-13600K, NVIDIA GeForce RTX 3090
NVIDIA GeForce RTX 3090, i5-13600K, Corsair MP600
9362 Points +33%
AMD Ryzen 9 5950X, NVIDIA Titan RTX
NVIDIA Titan RTX, R9 5950X, Intel Optane 905P 480GB 2.5
8778 Points +25%
Intel Core i5-13400, NVIDIA GeForce RTX 4090
NVIDIA GeForce RTX 4090, i5-13400, Intel Optane 905P 480GB 2.5
8614 Points +23%
Intel Core i9-12900K, NVIDIA Titan RTX
NVIDIA Titan RTX, i9-12900K, Intel Optane 905P 480GB 2.5
8604 Points +23%
Intel Core i5-12600K, NVIDIA Titan RTX
NVIDIA Titan RTX, i5-12600K, Intel Optane 905P 480GB 2.5
8259 Points +18%
Intel Core i5-12400F, NVIDIA GeForce RTX 4090
NVIDIA GeForce RTX 4090, i5-12400F, Intel Optane 905P 480GB 2.5
7756 Points +10%
AMD Ryzen 7 7840HS, AMD Radeon 780M
Radeon 780M, R7 7840HS, Kingston OM8PGP41024Q-A0
7526 Points +7%
AMD Ryzen 9 7940HS, AMD Radeon 780M
Radeon 780M, R9 7940HS, 2x Kingston OM8PGP4256Q-A0 (RAID 0)
7048 Points 0%
AMD Ryzen 9 7945HX, AMD Radeon 610M
Radeon 610M, R9 7945HX, Kingston KC3000 2048G SKC3000D2048G
7020 Points
AMD Ryzen 7 7745HX, AMD Radeon 610M
Radeon 610M, R7 7745HX, Fikwot FN955
6751 Points -4%
Essentials
Intel Core i9-13900K, NVIDIA GeForce RTX 3090
NVIDIA GeForce RTX 3090, i9-13900K, Corsair MP600
12868 Points +4%
AMD Ryzen 9 7900X, NVIDIA GeForce RTX 3090
NVIDIA GeForce RTX 3090, R9 7900X
12651 Points +2%
AMD Ryzen 9 7950X, NVIDIA GeForce RTX 3090
NVIDIA GeForce RTX 3090, R9 7950X, Corsair MP600
12651 Points +2%
AMD Ryzen 9 7945HX, AMD Radeon 610M
Radeon 610M, R9 7945HX, Kingston KC3000 2048G SKC3000D2048G
12354 Points
Intel Core i9-14900K, NVIDIA GeForce RTX 4090
NVIDIA GeForce RTX 4090, i9-14900K, WDC PC SN720 SDAQNTW-512G
12352 Points 0%
Intel Core i5-13600K, NVIDIA GeForce RTX 3090
NVIDIA GeForce RTX 3090, i5-13600K, Corsair MP600
12306 Points 0%
AMD Ryzen 5 7600X, NVIDIA GeForce RTX 3090
NVIDIA GeForce RTX 3090, R5 7600X
12259 Points -1%
AMD Ryzen 9 7950X3D, NVIDIA GeForce RTX 4090
NVIDIA GeForce RTX 4090, R9 7950X3D
12130 Points -2%
AMD Ryzen 7 7745HX, AMD Radeon 610M
Radeon 610M, R7 7745HX, Fikwot FN955
12059 Points -2%
Intel Core i5-14600K, NVIDIA GeForce RTX 4090
NVIDIA GeForce RTX 4090, i5-14600K, WDC PC SN720 SDAQNTW-512G
11532 Points -7%
AMD Ryzen 7 7800X3D, NVIDIA GeForce RTX 4090
NVIDIA GeForce RTX 4090, R7 7800X3D, Corsair MP600
11337 Points -8%
AMD Ryzen 9 5950X, NVIDIA Titan RTX
NVIDIA Titan RTX, R9 5950X, Intel Optane 905P 480GB 2.5
11255 Points -9%
Intel Core i9-12900K, NVIDIA Titan RTX
NVIDIA Titan RTX, i9-12900K, Intel Optane 905P 480GB 2.5
11086 Points -10%
AMD Ryzen 7 7840HS, AMD Radeon 780M
Radeon 780M, R7 7840HS, Kingston OM8PGP41024Q-A0
11011 Points -11%
Intel Core i5-12600K, NVIDIA Titan RTX
NVIDIA Titan RTX, i5-12600K, Intel Optane 905P 480GB 2.5
10650 Points -14%
Intel Core i5-13400, NVIDIA GeForce RTX 4090
NVIDIA GeForce RTX 4090, i5-13400, Intel Optane 905P 480GB 2.5
10635 Points -14%
Intel Core i5-12400F, NVIDIA GeForce RTX 4090
NVIDIA GeForce RTX 4090, i5-12400F, Intel Optane 905P 480GB 2.5
10511 Points -15%
AMD Ryzen 9 7940HS, AMD Radeon 780M
Radeon 780M, R9 7940HS, 2x Kingston OM8PGP4256Q-A0 (RAID 0)
10448 Points -15%
Productivity
AMD Ryzen 5 7600X, NVIDIA GeForce RTX 3090
NVIDIA GeForce RTX 3090, R5 7600X
12608 Points +13%
AMD Ryzen 9 7950X3D, NVIDIA GeForce RTX 4090
NVIDIA GeForce RTX 4090, R9 7950X3D
12576 Points +13%
AMD Ryzen 7 7800X3D, NVIDIA GeForce RTX 4090
NVIDIA GeForce RTX 4090, R7 7800X3D, Corsair MP600
12108 Points +9%
Intel Core i5-14600K, NVIDIA GeForce RTX 4090
NVIDIA GeForce RTX 4090, i5-14600K, WDC PC SN720 SDAQNTW-512G
12075 Points +9%
AMD Ryzen 9 7900X, NVIDIA GeForce RTX 3090
NVIDIA GeForce RTX 3090, R9 7900X
11853 Points +7%
AMD Ryzen 9 7950X, NVIDIA GeForce RTX 3090
NVIDIA GeForce RTX 3090, R9 7950X, Corsair MP600
11853 Points +7%
Intel Core i9-14900K, NVIDIA GeForce RTX 4090
NVIDIA GeForce RTX 4090, i9-14900K, WDC PC SN720 SDAQNTW-512G
11784 Points +6%
Intel Core i5-13600K, NVIDIA GeForce RTX 3090
NVIDIA GeForce RTX 3090, i5-13600K, Corsair MP600
11630 Points +5%
Intel Core i9-13900K, NVIDIA GeForce RTX 3090
NVIDIA GeForce RTX 3090, i9-13900K, Corsair MP600
11370 Points +2%
AMD Ryzen 9 5950X, NVIDIA Titan RTX
NVIDIA Titan RTX, R9 5950X, Intel Optane 905P 480GB 2.5
11163 Points 0%
AMD Ryzen 9 7945HX, AMD Radeon 610M
Radeon 610M, R9 7945HX, Kingston KC3000 2048G SKC3000D2048G
11117 Points
AMD Ryzen 7 7745HX, AMD Radeon 610M
Radeon 610M, R7 7745HX, Fikwot FN955
11048 Points -1%
Intel Core i5-12600K, NVIDIA Titan RTX
NVIDIA Titan RTX, i5-12600K, Intel Optane 905P 480GB 2.5
11001 Points -1%
Intel Core i5-13400, NVIDIA GeForce RTX 4090
NVIDIA GeForce RTX 4090, i5-13400, Intel Optane 905P 480GB 2.5
10893 Points -2%
AMD Ryzen 7 7840HS, AMD Radeon 780M
Radeon 780M, R7 7840HS, Kingston OM8PGP41024Q-A0
10832 Points -3%
Intel Core i9-12900K, NVIDIA Titan RTX
NVIDIA Titan RTX, i9-12900K, Intel Optane 905P 480GB 2.5
10699 Points -4%
AMD Ryzen 9 7940HS, AMD Radeon 780M
Radeon 780M, R9 7940HS, 2x Kingston OM8PGP4256Q-A0 (RAID 0)
9971 Points -10%
Intel Core i5-12400F, NVIDIA GeForce RTX 4090
NVIDIA GeForce RTX 4090, i5-12400F, Intel Optane 905P 480GB 2.5
8577 Points -23%
CrossMark / Overall
Intel Core i9-14900K, NVIDIA GeForce RTX 4090
NVIDIA GeForce RTX 4090, i9-14900K, WDC PC SN720 SDAQNTW-512G
2611 Points +17%
Intel Core i9-13900K, NVIDIA GeForce RTX 3090
NVIDIA GeForce RTX 3090, i9-13900K, Corsair MP600
2589 Points +16%
AMD Ryzen 9 7950X, NVIDIA GeForce RTX 3090
NVIDIA GeForce RTX 3090, R9 7950X, Corsair MP600
2512 Points +12%
AMD Ryzen 9 7900X, NVIDIA GeForce RTX 3090
NVIDIA GeForce RTX 3090, R9 7900X
2405 Points +7%
Intel Core i5-14600K, NVIDIA GeForce RTX 4090
NVIDIA GeForce RTX 4090, i5-14600K, WDC PC SN720 SDAQNTW-512G
2310 Points +3%
Intel Core i5-13600K, NVIDIA GeForce RTX 3090
NVIDIA GeForce RTX 3090, i5-13600K, Corsair MP600
2271 Points +1%
AMD Ryzen 9 7945HX, AMD Radeon 610M
Radeon 610M, R9 7945HX, Kingston KC3000 2048G SKC3000D2048G
2240 Points
AMD Ryzen 5 7600X, NVIDIA GeForce RTX 3090
NVIDIA GeForce RTX 3090, R5 7600X
2236 Points 0%
AMD Ryzen 7 7800X3D, NVIDIA GeForce RTX 4090
NVIDIA GeForce RTX 4090, R7 7800X3D, Corsair MP600
2216 Points -1%
AMD Ryzen 9 7950X3D, NVIDIA GeForce RTX 4090
NVIDIA GeForce RTX 4090, R9 7950X3D
2193 Points -2%
AMD Ryzen 7 7745HX, AMD Radeon 610M
Radeon 610M, R7 7745HX, Fikwot FN955
2179 Points -3%
Intel Core i5-13400, NVIDIA GeForce RTX 4090
NVIDIA GeForce RTX 4090, i5-13400, Intel Optane 905P 480GB 2.5
1877 Points -16%
Intel Core i5-12400F, NVIDIA GeForce RTX 4090
NVIDIA GeForce RTX 4090, i5-12400F, Intel Optane 905P 480GB 2.5
1762 Points -21%
AMD Ryzen 7 7840HS, AMD Radeon 780M
Radeon 780M, R7 7840HS, Kingston OM8PGP41024Q-A0
1761 Points -21%
AMD Ryzen 9 7940HS, AMD Radeon 780M
Radeon 780M, R9 7940HS, 2x Kingston OM8PGP4256Q-A0 (RAID 0)
1726 Points -23%
AMD Ryzen 9 5950X, NVIDIA Titan RTX
NVIDIA Titan RTX, R9 5950X, Intel Optane 905P 480GB 2.5
1495 Points -33%
CrossMark / Productivity
Intel Core i9-14900K, NVIDIA GeForce RTX 4090
NVIDIA GeForce RTX 4090, i9-14900K, WDC PC SN720 SDAQNTW-512G
2421 Points +16%
Intel Core i9-13900K, NVIDIA GeForce RTX 3090
NVIDIA GeForce RTX 3090, i9-13900K, Corsair MP600
2388 Points +15%
AMD Ryzen 9 7950X, NVIDIA GeForce RTX 3090
NVIDIA GeForce RTX 3090, R9 7950X, Corsair MP600
2336 Points +12%
AMD Ryzen 9 7900X, NVIDIA GeForce RTX 3090
NVIDIA GeForce RTX 3090, R9 7900X
2211 Points +6%
Intel Core i5-14600K, NVIDIA GeForce RTX 4090
NVIDIA GeForce RTX 4090, i5-14600K, WDC PC SN720 SDAQNTW-512G
2142 Points +3%
Intel Core i5-13600K, NVIDIA GeForce RTX 3090
NVIDIA GeForce RTX 3090, i5-13600K, Corsair MP600
2115 Points +1%
AMD Ryzen 5 7600X, NVIDIA GeForce RTX 3090
NVIDIA GeForce RTX 3090, R5 7600X
2101 Points +1%
AMD Ryzen 9 7945HX, AMD Radeon 610M
Radeon 610M, R9 7945HX, Kingston KC3000 2048G SKC3000D2048G
2085 Points
AMD Ryzen 7 7800X3D, NVIDIA GeForce RTX 4090
NVIDIA GeForce RTX 4090, R7 7800X3D, Corsair MP600
2074 Points -1%
AMD Ryzen 7 7745HX, AMD Radeon 610M
Radeon 610M, R7 7745HX, Fikwot FN955
2061 Points -1%
AMD Ryzen 9 7950X3D, NVIDIA GeForce RTX 4090
NVIDIA GeForce RTX 4090, R9 7950X3D
2014 Points -3%
Intel Core i5-13400, NVIDIA GeForce RTX 4090
NVIDIA GeForce RTX 4090, i5-13400, Intel Optane 905P 480GB 2.5
1741 Points -16%
AMD Ryzen 9 7940HS, AMD Radeon 780M
Radeon 780M, R9 7940HS, 2x Kingston OM8PGP4256Q-A0 (RAID 0)
1675 Points -20%
Intel Core i5-12400F, NVIDIA GeForce RTX 4090
NVIDIA GeForce RTX 4090, i5-12400F, Intel Optane 905P 480GB 2.5
1667 Points -20%
AMD Ryzen 7 7840HS, AMD Radeon 780M
Radeon 780M, R7 7840HS, Kingston OM8PGP41024Q-A0
1656 Points -21%
AMD Ryzen 9 5950X, NVIDIA Titan RTX
NVIDIA Titan RTX, R9 5950X, Intel Optane 905P 480GB 2.5
1359 Points -35%
CrossMark / Creativity
Intel Core i9-14900K, NVIDIA GeForce RTX 4090
NVIDIA GeForce RTX 4090, i9-14900K, WDC PC SN720 SDAQNTW-512G
2891 Points +16%
AMD Ryzen 9 7950X, NVIDIA GeForce RTX 3090
NVIDIA GeForce RTX 3090, R9 7950X, Corsair MP600
2786 Points +12%
Intel Core i9-13900K, NVIDIA GeForce RTX 3090
NVIDIA GeForce RTX 3090, i9-13900K, Corsair MP600
2784 Points +12%
AMD Ryzen 9 7900X, NVIDIA GeForce RTX 3090
NVIDIA GeForce RTX 3090, R9 7900X
2673 Points +7%
Intel Core i5-14600K, NVIDIA GeForce RTX 4090
NVIDIA GeForce RTX 4090, i5-14600K, WDC PC SN720 SDAQNTW-512G
2575 Points +3%
AMD Ryzen 9 7950X3D, NVIDIA GeForce RTX 4090
NVIDIA GeForce RTX 4090, R9 7950X3D
2552 Points +3%
AMD Ryzen 9 7945HX, AMD Radeon 610M
Radeon 610M, R9 7945HX, Kingston KC3000 2048G SKC3000D2048G
2488 Points
AMD Ryzen 7 7800X3D, NVIDIA GeForce RTX 4090
NVIDIA GeForce RTX 4090, R7 7800X3D, Corsair MP600
2434 Points -2%
AMD Ryzen 5 7600X, NVIDIA GeForce RTX 3090
NVIDIA GeForce RTX 3090, R5 7600X
2414 Points -3%
Intel Core i5-13600K, NVIDIA GeForce RTX 3090
NVIDIA GeForce RTX 3090, i5-13600K, Corsair MP600
2412 Points -3%
AMD Ryzen 7 7745HX, AMD Radeon 610M
Radeon 610M, R7 7745HX, Fikwot FN955
2384 Points -4%
AMD Ryzen 7 7840HS, AMD Radeon 780M
Radeon 780M, R7 7840HS, Kingston OM8PGP41024Q-A0
2040 Points -18%
Intel Core i5-13400, NVIDIA GeForce RTX 4090
NVIDIA GeForce RTX 4090, i5-13400, Intel Optane 905P 480GB 2.5
2039 Points -18%
AMD Ryzen 9 7940HS, AMD Radeon 780M
Radeon 780M, R9 7940HS, 2x Kingston OM8PGP4256Q-A0 (RAID 0)
1914 Points -23%
Intel Core i5-12400F, NVIDIA GeForce RTX 4090
NVIDIA GeForce RTX 4090, i5-12400F, Intel Optane 905P 480GB 2.5
1849 Points -26%
AMD Ryzen 9 5950X, NVIDIA Titan RTX
NVIDIA Titan RTX, R9 5950X, Intel Optane 905P 480GB 2.5
1710 Points -31%
CrossMark / Responsiveness
Intel Core i9-13900K, NVIDIA GeForce RTX 3090
NVIDIA GeForce RTX 3090, i9-13900K, Corsair MP600
2653 Points +31%
Intel Core i9-14900K, NVIDIA GeForce RTX 4090
NVIDIA GeForce RTX 4090, i9-14900K, WDC PC SN720 SDAQNTW-512G
2413 Points +19%
Intel Core i5-13600K, NVIDIA GeForce RTX 3090
NVIDIA GeForce RTX 3090, i5-13600K, Corsair MP600
2350 Points +16%
AMD Ryzen 9 7950X, NVIDIA GeForce RTX 3090
NVIDIA GeForce RTX 3090, R9 7950X, Corsair MP600
2288 Points +13%
AMD Ryzen 9 7900X, NVIDIA GeForce RTX 3090
NVIDIA GeForce RTX 3090, R9 7900X
2251 Points +11%
AMD Ryzen 5 7600X, NVIDIA GeForce RTX 3090
NVIDIA GeForce RTX 3090, R5 7600X
2145 Points +6%
Intel Core i5-14600K, NVIDIA GeForce RTX 4090
NVIDIA GeForce RTX 4090, i5-14600K, WDC PC SN720 SDAQNTW-512G
2090 Points +3%
AMD Ryzen 7 7800X3D, NVIDIA GeForce RTX 4090
NVIDIA GeForce RTX 4090, R7 7800X3D, Corsair MP600
2039 Points +1%
AMD Ryzen 9 7945HX, AMD Radeon 610M
Radeon 610M, R9 7945HX, Kingston KC3000 2048G SKC3000D2048G
2026 Points
AMD Ryzen 7 7745HX, AMD Radeon 610M
Radeon 610M, R7 7745HX, Fikwot FN955
1965 Points -3%
Intel Core i5-13400, NVIDIA GeForce RTX 4090
NVIDIA GeForce RTX 4090, i5-13400, Intel Optane 905P 480GB 2.5
1831 Points -10%
Intel Core i5-12400F, NVIDIA GeForce RTX 4090
NVIDIA GeForce RTX 4090, i5-12400F, Intel Optane 905P 480GB 2.5
1799 Points -11%
AMD Ryzen 9 7950X3D, NVIDIA GeForce RTX 4090
NVIDIA GeForce RTX 4090, R9 7950X3D
1795 Points -11%
AMD Ryzen 9 7940HS, AMD Radeon 780M
Radeon 780M, R9 7940HS, 2x Kingston OM8PGP4256Q-A0 (RAID 0)
1382 Points -32%
AMD Ryzen 7 7840HS, AMD Radeon 780M
Radeon 780M, R7 7840HS, Kingston OM8PGP41024Q-A0
1361 Points -33%
AMD Ryzen 9 5950X, NVIDIA Titan RTX
NVIDIA Titan RTX, R9 5950X, Intel Optane 905P 480GB 2.5
1332 Points -34%
AIDA64 / Memory Copy
Intel Core i9-14900K, NVIDIA GeForce RTX 4090
NVIDIA GeForce RTX 4090, i9-14900K, WDC PC SN720 SDAQNTW-512G
85662 MB/s +48%
Intel Core i5-14600K, NVIDIA GeForce RTX 4090
NVIDIA GeForce RTX 4090, i5-14600K, WDC PC SN720 SDAQNTW-512G
82790 MB/s +43%
Intel Core i9-13900K, NVIDIA GeForce RTX 3090
NVIDIA GeForce RTX 3090, i9-13900K, Corsair MP600
74937 MB/s +29%
AMD Ryzen 9 7950X3D, NVIDIA GeForce RTX 4090
NVIDIA GeForce RTX 4090, R9 7950X3D
73868 MB/s +27%
Intel Core i9-12900K, NVIDIA Titan RTX
NVIDIA Titan RTX, i9-12900K, Intel Optane 905P 480GB 2.5
73146 MB/s +26%
AMD Ryzen 9 7950X, NVIDIA GeForce RTX 3090
NVIDIA GeForce RTX 3090, R9 7950X, Corsair MP600
73104 MB/s +26%
Intel Core i5-13400, NVIDIA GeForce RTX 4090
NVIDIA GeForce RTX 4090, i5-13400, Intel Optane 905P 480GB 2.5
71766 MB/s +24%
Intel Core i5-13600K, NVIDIA GeForce RTX 3090
NVIDIA GeForce RTX 3090, i5-13600K, Corsair MP600
71725 MB/s +24%
Intel Core i5-12400F, NVIDIA GeForce RTX 4090
NVIDIA GeForce RTX 4090, i5-12400F, Intel Optane 905P 480GB 2.5
71074 MB/s +23%
Intel Core i5-12600K, NVIDIA Titan RTX
NVIDIA Titan RTX, i5-12600K, Intel Optane 905P 480GB 2.5
70749 MB/s +22%
AMD Ryzen 9 7900X, NVIDIA GeForce RTX 3090
NVIDIA GeForce RTX 3090, R9 7900X
69140 MB/s +19%
AMD Ryzen 7 7840HS, AMD Radeon 780M
Radeon 780M, R7 7840HS, Kingston OM8PGP41024Q-A0
67039 MB/s +16%
Average of class Desktop
  (43747 - 88386, n=15, last 2 years)
66349 MB/s +14%
AMD Ryzen 7 7800X3D, NVIDIA GeForce RTX 4090
NVIDIA GeForce RTX 4090, R7 7800X3D, Corsair MP600
63242 MB/s +9%
AMD Ryzen 9 7940HS, AMD Radeon 780M
Radeon 780M, R9 7940HS, 2x Kingston OM8PGP4256Q-A0 (RAID 0)
62093 MB/s +7%
AMD Ryzen 5 7600X, NVIDIA GeForce RTX 3090
NVIDIA GeForce RTX 3090, R5 7600X
59949 MB/s +3%
AMD Ryzen 9 5950X, NVIDIA Titan RTX
NVIDIA Titan RTX, R9 5950X, Intel Optane 905P 480GB 2.5
59171 MB/s +2%
AMD Ryzen 9 7945HX, AMD Radeon 610M
Radeon 610M, R9 7945HX, Kingston KC3000 2048G SKC3000D2048G
57953 MB/s
AMD Ryzen 7 7745HX, AMD Radeon 610M
Radeon 610M, R7 7745HX, Fikwot FN955
53867 MB/s -7%
Average AMD Ryzen 9 7945HX
  (48948 - 57953, n=5)
51809 MB/s -11%
AIDA64 / Memory Read
Intel Core i9-14900K, NVIDIA GeForce RTX 4090
NVIDIA GeForce RTX 4090, i9-14900K, WDC PC SN720 SDAQNTW-512G
95232 MB/s +41%
Intel Core i5-14600K, NVIDIA GeForce RTX 4090
NVIDIA GeForce RTX 4090, i5-14600K, WDC PC SN720 SDAQNTW-512G
88793 MB/s +31%
Intel Core i9-13900K, NVIDIA GeForce RTX 3090
NVIDIA GeForce RTX 3090, i9-13900K, Corsair MP600
83883 MB/s +24%
Intel Core i9-12900K, NVIDIA Titan RTX
NVIDIA Titan RTX, i9-12900K, Intel Optane 905P 480GB 2.5
81059 MB/s +20%
AMD Ryzen 9 7950X3D, NVIDIA GeForce RTX 4090
NVIDIA GeForce RTX 4090, R9 7950X3D
80946 MB/s +19%
AMD Ryzen 9 7950X, NVIDIA GeForce RTX 3090
NVIDIA GeForce RTX 3090, R9 7950X, Corsair MP600
78282 MB/s +16%
Intel Core i5-13400, NVIDIA GeForce RTX 4090
NVIDIA GeForce RTX 4090, i5-13400, Intel Optane 905P 480GB 2.5
77867 MB/s +15%
Intel Core i5-12600K, NVIDIA Titan RTX
NVIDIA Titan RTX, i5-12600K, Intel Optane 905P 480GB 2.5
76864 MB/s +13%
Intel Core i5-13600K, NVIDIA GeForce RTX 3090
NVIDIA GeForce RTX 3090, i5-13600K, Corsair MP600
75757 MB/s +12%
AMD Ryzen 9 7900X, NVIDIA GeForce RTX 3090
NVIDIA GeForce RTX 3090, R9 7900X
75338 MB/s +11%
Intel Core i5-12400F, NVIDIA GeForce RTX 4090
NVIDIA GeForce RTX 4090, i5-12400F, Intel Optane 905P 480GB 2.5
74338 MB/s +10%
Average of class Desktop
  (47347 - 94830, n=15, last 2 years)
71237 MB/s +5%
AMD Ryzen 9 7945HX, AMD Radeon 610M
Radeon 610M, R9 7945HX, Kingston KC3000 2048G SKC3000D2048G
67753 MB/s
AMD Ryzen 9 5950X, NVIDIA Titan RTX
NVIDIA Titan RTX, R9 5950X, Intel Optane 905P 480GB 2.5
62991 MB/s -7%
AMD Ryzen 7 7800X3D, NVIDIA GeForce RTX 4090
NVIDIA GeForce RTX 4090, R7 7800X3D, Corsair MP600
62528 MB/s -8%
Average AMD Ryzen 9 7945HX
  (59620 - 67753, n=5)
62198 MB/s -8%
AMD Ryzen 7 7840HS, AMD Radeon 780M
Radeon 780M, R7 7840HS, Kingston OM8PGP41024Q-A0
61867 MB/s -9%
AMD Ryzen 9 7940HS, AMD Radeon 780M
Radeon 780M, R9 7940HS, 2x Kingston OM8PGP4256Q-A0 (RAID 0)
61458 MB/s -9%
AMD Ryzen 5 7600X, NVIDIA GeForce RTX 3090
NVIDIA GeForce RTX 3090, R5 7600X
59007 MB/s -13%
AMD Ryzen 7 7745HX, AMD Radeon 610M
Radeon 610M, R7 7745HX, Fikwot FN955
54278 MB/s -20%
AIDA64 / Memory Write
AMD Ryzen 7 7800X3D, NVIDIA GeForce RTX 4090
NVIDIA GeForce RTX 4090, R7 7800X3D, Corsair MP600
87412 MB/s +25%
AMD Ryzen 7 7840HS, AMD Radeon 780M
Radeon 780M, R7 7840HS, Kingston OM8PGP41024Q-A0
86693 MB/s +24%
AMD Ryzen 9 7950X3D, NVIDIA GeForce RTX 4090
NVIDIA GeForce RTX 4090, R9 7950X3D
85951 MB/s +23%
Intel Core i5-14600K, NVIDIA GeForce RTX 4090
NVIDIA GeForce RTX 4090, i5-14600K, WDC PC SN720 SDAQNTW-512G
84101 MB/s +20%
Intel Core i9-14900K, NVIDIA GeForce RTX 4090
NVIDIA GeForce RTX 4090, i9-14900K, WDC PC SN720 SDAQNTW-512G
83670 MB/s +19%
AMD Ryzen 5 7600X, NVIDIA GeForce RTX 3090
NVIDIA GeForce RTX 3090, R5 7600X
81320 MB/s +16%
AMD Ryzen 9 7950X, NVIDIA GeForce RTX 3090
NVIDIA GeForce RTX 3090, R9 7950X, Corsair MP600
79843 MB/s +14%
AMD Ryzen 9 7940HS, AMD Radeon 780M
Radeon 780M, R9 7940HS, 2x Kingston OM8PGP4256Q-A0 (RAID 0)
79298 MB/s +13%
AMD Ryzen 9 7900X, NVIDIA GeForce RTX 3090
NVIDIA GeForce RTX 3090, R9 7900X
76967 MB/s +10%
Average of class Desktop
  (46768 - 84869, n=15, last 2 years)
75988 MB/s +8%
Intel Core i9-13900K, NVIDIA GeForce RTX 3090
NVIDIA GeForce RTX 3090, i9-13900K, Corsair MP600
74140 MB/s +6%
Intel Core i5-13400, NVIDIA GeForce RTX 4090
NVIDIA GeForce RTX 4090, i5-13400, Intel Optane 905P 480GB 2.5
74029 MB/s +6%
Intel Core i5-12600K, NVIDIA Titan RTX
NVIDIA Titan RTX, i5-12600K, Intel Optane 905P 480GB 2.5
73824 MB/s +5%
Intel Core i5-12400F, NVIDIA GeForce RTX 4090
NVIDIA GeForce RTX 4090, i5-12400F, Intel Optane 905P 480GB 2.5
73805 MB/s +5%
Intel Core i9-12900K, NVIDIA Titan RTX
NVIDIA Titan RTX, i9-12900K, Intel Optane 905P 480GB 2.5
73707 MB/s +5%
Intel Core i5-13600K, NVIDIA GeForce RTX 3090
NVIDIA GeForce RTX 3090, i5-13600K, Corsair MP600
73484 MB/s +5%
AMD Ryzen 7 7745HX, AMD Radeon 610M
Radeon 610M, R7 7745HX, Fikwot FN955
70803 MB/s +1%
AMD Ryzen 9 7945HX, AMD Radeon 610M
Radeon 610M, R9 7945HX, Kingston KC3000 2048G SKC3000D2048G
70063 MB/s
Average AMD Ryzen 9 7945HX
  (58602 - 70063, n=5)
62207 MB/s -11%
AMD Ryzen 9 5950X, NVIDIA Titan RTX
NVIDIA Titan RTX, R9 5950X, Intel Optane 905P 480GB 2.5
48748 MB/s -30%
AIDA64 / Memory Latency
AMD Ryzen 7 7840HS, AMD Radeon 780M
Radeon 780M, R7 7840HS, Kingston OM8PGP41024Q-A0
92 ns * -19%
AMD Ryzen 9 7940HS, AMD Radeon 780M
Radeon 780M, R9 7940HS, 2x Kingston OM8PGP4256Q-A0 (RAID 0)
87.6 ns * -14%
Average AMD Ryzen 9 7945HX
  (77.1 - 91.3, n=5)
84 ns * -9%
Intel Core i5-13600K, NVIDIA GeForce RTX 3090
NVIDIA GeForce RTX 3090, i5-13600K, Corsair MP600
81.1 ns * -5%
AMD Ryzen 7 7745HX, AMD Radeon 610M
Radeon 610M, R7 7745HX, Fikwot FN955
80.7 ns * -5%
Intel Core i5-12400F, NVIDIA GeForce RTX 4090
NVIDIA GeForce RTX 4090, i5-12400F, Intel Optane 905P 480GB 2.5
79.2 ns * -3%
Intel Core i5-13400, NVIDIA GeForce RTX 4090
NVIDIA GeForce RTX 4090, i5-13400, Intel Optane 905P 480GB 2.5
77.2 ns * -0%
AMD Ryzen 9 7945HX, AMD Radeon 610M
Radeon 610M, R9 7945HX, Kingston KC3000 2048G SKC3000D2048G
77.1 ns *
Intel Core i9-13900K, NVIDIA GeForce RTX 3090
NVIDIA GeForce RTX 3090, i9-13900K, Corsair MP600
76.5 ns * +1%
Average of class Desktop
  (64.3 - 93.4, n=15, last 2 years)
74.2 ns * +4%
Intel Core i9-14900K, NVIDIA GeForce RTX 4090
NVIDIA GeForce RTX 4090, i9-14900K, WDC PC SN720 SDAQNTW-512G
70.3 ns * +9%
Intel Core i5-14600K, NVIDIA GeForce RTX 4090
NVIDIA GeForce RTX 4090, i5-14600K, WDC PC SN720 SDAQNTW-512G
69.7 ns * +10%
AMD Ryzen 7 7800X3D, NVIDIA GeForce RTX 4090
NVIDIA GeForce RTX 4090, R7 7800X3D, Corsair MP600
68 ns * +12%
AMD Ryzen 9 5950X, NVIDIA Titan RTX
NVIDIA Titan RTX, R9 5950X, Intel Optane 905P 480GB 2.5
67.7 ns * +12%
AMD Ryzen 9 7950X3D, NVIDIA GeForce RTX 4090
NVIDIA GeForce RTX 4090, R9 7950X3D
65.6 ns * +15%
AMD Ryzen 5 7600X, NVIDIA GeForce RTX 3090
NVIDIA GeForce RTX 3090, R5 7600X
63.8 ns * +17%
AMD Ryzen 9 7900X, NVIDIA GeForce RTX 3090
NVIDIA GeForce RTX 3090, R9 7900X
63.3 ns * +18%
AMD Ryzen 9 7950X, NVIDIA GeForce RTX 3090
NVIDIA GeForce RTX 3090, R9 7950X, Corsair MP600
61.7 ns * +20%

* ... smaller is better

DPC 延迟

我们在基于 Minisforum BD790i 的测试系统中记录到了相对较高的延迟。即使在简单的网上冲浪时,我们也记录到了延迟值的增加。在播放 4K 测试视频时,延迟值进一步增加,这意味着该系统似乎不适合在这种配置下处理实时视频和音频资料。

打开多个浏览器标签页时的最大延迟
打开多个浏览器标签页时的最大延迟
播放 4K 视频材料时的最大延迟
播放 4K 视频材料时的最大延迟
Prime95 十秒后的最大延迟时间
Prime95 十秒后的最大延迟时间
按最长执行时间排列的驱动程序
按最长执行时间排列的驱动程序
DPC Latencies / LatencyMon - interrupt to process latency (max), Web, Youtube, Prime95
Minisforum BD790i
Radeon 610M, R9 7945HX, Kingston KC3000 2048G SKC3000D2048G
3954 μs *
Minisforum EliteMini UM780 XTX
Radeon 780M, R7 7840HS, Kingston OM8PGP41024Q-A0
1178.9 μs * +70%
Minisforum Venus Series UM790 Pro
Radeon 780M, R9 7940HS, 2x Kingston OM8PGP4256Q-A0 (RAID 0)
1063 μs * +73%
Minisforum BD770i
Radeon 610M, R7 7745HX, Fikwot FN955
422.4 μs * +89%

* ... smaller is better

存储设备

金斯顿 KC3000
金斯顿 KC3000

如评测开头所述,Minisforum 仅提供 BD790i 主板本身。为了能够将一个完整的系统投入运行,你必须自行解决缺少的组件,如内存、固态硬盘、电源和 CPU 风扇。在固态硬盘方面,我们选择了容量为 2 TB 的金士顿 KC3000。该型号通过 PCIe 4.0 x4 接口连接,并没有充分利用该接口,因为 Minisforum BD790i 在技术上支持两个 PCIe 5.0 固态硬盘。两个 M.2 接口都位于主板顶部。我们的固态硬盘被一个小型散热片覆盖,散热片上还装有一个小型风扇,在提供稳定性能方面没有任何问题。我们可以向那些认为这个小风扇会导致耳痛的人保证,这个风扇非常安静,在 CPU 风扇旁边也听不到它的声音。

有关进一步的比较和基准测试,请参阅我们的 比较表.

AS 固态硬盘
AS 固态硬盘
CDM 3
CDM 3
CDM 5
CDM 5
CDM 6
CDM 6
CDI
CDI
Kingston KC3000 2048G SKC3000D2048G
Sequential Read: 4718 MB/s
Sequential Write: 6075 MB/s
512K Read: 3179 MB/s
512K Write: 5375 MB/s
4K Read: 81.57 MB/s
4K Write: 275.6 MB/s
4K QD32 Read: 800.2 MB/s
4K QD32 Write: 648.4 MB/s

Reading continuous performance: DiskSpd Read Loop, Queue Depth 8

037074011101480185022202590296033303700407044404810518055505920629066607030Tooltip
Minisforum BD790i Kingston KC3000 2048G SKC3000D2048G; diskspd 2.0.17 f: Ø7357 (6532.21-7378.41)
Minisforum EliteMini UM780 XTX Kingston OM8PGP41024Q-A0; diskspd 2.0.17 f: Ø4795 (3366.33-4823.24)
Minisforum Venus Series UM790 Pro 2x Kingston OM8PGP4256Q-A0 (RAID 0): Ø6430 (5686.85-6828.93)
Minisforum BD770i Fikwot FN955; diskspd 2.0.17 f: Ø7151 (6786.02-7165.06)

显卡 - AMD Radeon 610M iGPU

......(英文 AMD Ryzen 9 7945HX只配备了一个简单的 iGPU 图形解决方案,其名称为 AMD Radeon 610M.它仍然基于 RDNA2 架构,只提供 2 个 CU,这意味着总共只有 128 个着色器单元可用于 3D 计算。与 AMD Ryzen 7 7745HX相比,安装在 Minisforum BD770i相比,3D 性能并没有提高。有鉴于此,它们的结果几乎完全相同。与 AMD Radeon 780M相比,AMD Radeon 610M 毫无胜算。我们认为,除了简单的图像输出外,不应该指望这种薄弱的图形解决方案能完成更多任务。

更多比较和基准测试可参见我们的 图形处理器比较表.

Performance Rating - Percent
AMD Radeon 780M, AMD Ryzen 7 7840HS
Radeon 780M, R7 7840HS, Kingston OM8PGP41024Q-A0
100 pt
AMD Radeon 780M, AMD Ryzen 9 7940HS
Radeon 780M, R9 7940HS, 2x Kingston OM8PGP4256Q-A0 (RAID 0)
90.5 pt
AMD Radeon RX Vega 7, AMD Ryzen 5 5600U
Vega 7, R5 5600U, ESO512GYLCT
44.5 pt
Intel UHD Graphics 64EUs (Alder Lake 12th Gen), Intel Core i7-12650H
UHD Graphics 64EUs, i7-12650H, Netac NS512GSSD530
42.3 pt
Intel UHD Graphics Xe 32EUs (Tiger Lake-H), Intel Core i7-11800H
UHD Graphics Xe 32EUs (Tiger Lake-H), i7-11800H, Netac NS512GSSD340
26.9 pt
AMD Radeon 610M, AMD Ryzen 9 7945HX
Radeon 610M, R9 7945HX, Kingston KC3000 2048G SKC3000D2048G
25.8 pt
AMD Radeon 610M, AMD Ryzen 7 7745HX
Radeon 610M, R7 7745HX, Fikwot FN955
23.1 pt
Average AMD Radeon 610M
 
20.8 pt
3DMark 11 - 1280x720 Performance GPU
AMD Radeon 780M, AMD Ryzen 7 7840HS
Radeon 780M, R7 7840HS, Kingston OM8PGP41024Q-A0
13347 Points +293%
AMD Radeon 780M, AMD Ryzen 9 7940HS
Radeon 780M, R9 7940HS, 2x Kingston OM8PGP4256Q-A0 (RAID 0)
12384 Points +264%
AMD Radeon RX Vega 7, AMD Ryzen 5 5600U
Vega 7, R5 5600U, ESO512GYLCT
5923 Points +74%
Intel UHD Graphics 64EUs (Alder Lake 12th Gen), Intel Core i7-12650H
UHD Graphics 64EUs, i7-12650H, Netac NS512GSSD530
5047 Points +48%
AMD Radeon 610M, AMD Ryzen 9 7945HX
Radeon 610M, R9 7945HX, Kingston KC3000 2048G SKC3000D2048G
3399 Points
AMD Radeon 610M, AMD Ryzen 7 7745HX
Radeon 610M, R7 7745HX, Fikwot FN955
3347 Points -2%
Intel UHD Graphics Xe 32EUs (Tiger Lake-H), Intel Core i7-11800H
UHD Graphics Xe 32EUs (Tiger Lake-H), i7-11800H, Netac NS512GSSD340
3168 Points -7%
Average AMD Radeon 610M
  (1029 - 3399, n=4)
2539 Points -25%
3DMark
2560x1440 Time Spy Graphics
AMD Radeon 780M, AMD Ryzen 7 7840HS
Radeon 780M, R7 7840HS, Kingston OM8PGP41024Q-A0
2832 Points +323%
AMD Radeon 780M, AMD Ryzen 9 7940HS
Radeon 780M, R9 7940HS, 2x Kingston OM8PGP4256Q-A0 (RAID 0)
2632 Points +293%
AMD Radeon RX Vega 7, AMD Ryzen 5 5600U
Vega 7, R5 5600U, ESO512GYLCT
1153 Points +72%
Intel UHD Graphics 64EUs (Alder Lake 12th Gen), Intel Core i7-12650H
UHD Graphics 64EUs, i7-12650H, Netac NS512GSSD530
1114 Points +67%
AMD Radeon 610M, AMD Ryzen 9 7945HX
Radeon 610M, R9 7945HX, Kingston KC3000 2048G SKC3000D2048G
669 Points
Intel UHD Graphics Xe 32EUs (Tiger Lake-H), Intel Core i7-11800H
UHD Graphics Xe 32EUs (Tiger Lake-H), i7-11800H, Netac NS512GSSD340
658 Points -2%
AMD Radeon 610M, AMD Ryzen 7 7745HX
Radeon 610M, R7 7745HX, Fikwot FN955
636 Points -5%
Average AMD Radeon 610M
  (224 - 669, n=4)
511 Points -24%
1920x1080 Fire Strike Graphics
AMD Radeon 780M, AMD Ryzen 7 7840HS
Radeon 780M, R7 7840HS, Kingston OM8PGP41024Q-A0
8348 Points +267%
AMD Radeon 780M, AMD Ryzen 9 7940HS
Radeon 780M, R9 7940HS, 2x Kingston OM8PGP4256Q-A0 (RAID 0)
7284 Points +220%
Intel UHD Graphics 64EUs (Alder Lake 12th Gen), Intel Core i7-12650H
UHD Graphics 64EUs, i7-12650H, Netac NS512GSSD530
3905 Points +71%
AMD Radeon RX Vega 7, AMD Ryzen 5 5600U
Vega 7, R5 5600U, ESO512GYLCT
3819 Points +68%
Intel UHD Graphics Xe 32EUs (Tiger Lake-H), Intel Core i7-11800H
UHD Graphics Xe 32EUs (Tiger Lake-H), i7-11800H, Netac NS512GSSD340
2495 Points +10%
AMD Radeon 610M, AMD Ryzen 7 7745HX
Radeon 610M, R7 7745HX, Fikwot FN955
2305 Points +1%
AMD Radeon 610M, AMD Ryzen 9 7945HX
Radeon 610M, R9 7945HX, Kingston KC3000 2048G SKC3000D2048G
2277 Points
Average AMD Radeon 610M
  (781 - 2305, n=4)
1754 Points -23%
Fire Strike Extreme Score
AMD Radeon 780M, AMD Ryzen 7 7840HS
Radeon 780M, R7 7840HS, Kingston OM8PGP41024Q-A0
4120 Points +296%
AMD Radeon 780M, AMD Ryzen 9 7940HS
Radeon 780M, R9 7940HS, 2x Kingston OM8PGP4256Q-A0 (RAID 0)
3506 Points +237%
Intel UHD Graphics 64EUs (Alder Lake 12th Gen), Intel Core i7-12650H
UHD Graphics 64EUs, i7-12650H, Netac NS512GSSD530
1733 Points +66%
AMD Radeon RX Vega 7, AMD Ryzen 5 5600U
Vega 7, R5 5600U, ESO512GYLCT
1560 Points +50%
Intel UHD Graphics Xe 32EUs (Tiger Lake-H), Intel Core i7-11800H
UHD Graphics Xe 32EUs (Tiger Lake-H), i7-11800H, Netac NS512GSSD340
1104 Points +6%
AMD Radeon 610M, AMD Ryzen 9 7945HX
Radeon 610M, R9 7945HX, Kingston KC3000 2048G SKC3000D2048G
1041 Points
Average AMD Radeon 610M
  (530 - 1041, n=2)
786 Points -24%
AMD Radeon 610M, AMD Ryzen 7 7745HX
Radeon 610M, R7 7745HX, Fikwot FN955
530 Points -49%
1280x720 Cloud Gate Standard Graphics
AMD Radeon 780M, AMD Ryzen 7 7840HS
Radeon 780M, R7 7840HS, Kingston OM8PGP41024Q-A0
50924 Points +269%
AMD Radeon 780M, AMD Ryzen 9 7940HS
Radeon 780M, R9 7940HS, 2x Kingston OM8PGP4256Q-A0 (RAID 0)
47968 Points +247%
AMD Radeon RX Vega 7, AMD Ryzen 5 5600U
Vega 7, R5 5600U, ESO512GYLCT
27497 Points +99%
Intel UHD Graphics 64EUs (Alder Lake 12th Gen), Intel Core i7-12650H
UHD Graphics 64EUs, i7-12650H, Netac NS512GSSD530
23061 Points +67%
Intel UHD Graphics Xe 32EUs (Tiger Lake-H), Intel Core i7-11800H
UHD Graphics Xe 32EUs (Tiger Lake-H), i7-11800H, Netac NS512GSSD340
15662 Points +13%
AMD Radeon 610M, AMD Ryzen 7 7745HX
Radeon 610M, R7 7745HX, Fikwot FN955
13981 Points +1%
AMD Radeon 610M, AMD Ryzen 9 7945HX
Radeon 610M, R9 7945HX, Kingston KC3000 2048G SKC3000D2048G
13814 Points
Average AMD Radeon 610M
  (11389 - 15902, n=4)
13772 Points 0%
Performance Rating - Percent
Minisforum EliteMini UM780 XTX
Radeon 780M, R7 7840HS, Kingston OM8PGP41024Q-A0
91.3 pt
Minisforum Venus Series UM790 Pro
Radeon 780M, R9 7940HS, 2x Kingston OM8PGP4256Q-A0 (RAID 0)
86 pt
NiPoGi AD08
UHD Graphics 64EUs, i7-12650H, Netac NS512GSSD530
42.7 pt
Minisforum Mars Series MC560
Vega 7, R5 5600U, ESO512GYLCT
40.6 pt
Minisforum BD790i
Radeon 610M, R9 7945HX, Kingston KC3000 2048G SKC3000D2048G
36.5 pt
Average AMD Radeon 610M
 
30 pt
Acemagic AD15
UHD Graphics Xe 32EUs (Tiger Lake-H), i7-11800H, Netac NS512GSSD340
29.2 pt
Minisforum BD770i
Radeon 610M, R7 7745HX, Fikwot FN955
29.1 pt
Unigine Heaven 4.0
Extreme Preset OpenGL
Minisforum EliteMini UM780 XTX
Radeon 780M, R7 7840HS, Kingston OM8PGP41024Q-A0
34.5 fps +165%
Minisforum Venus Series UM790 Pro
Radeon 780M, R9 7940HS, 2x Kingston OM8PGP4256Q-A0 (RAID 0)
29.7 fps +128%
NiPoGi AD08
UHD Graphics 64EUs, i7-12650H, Netac NS512GSSD530
25 fps +92%
Minisforum Mars Series MC560
Vega 7, R5 5600U, ESO512GYLCT
18.6 fps +43%
Minisforum BD770i
Radeon 610M, R7 7745HX, Fikwot FN955
13.6 fps +5%
Acemagic AD15
UHD Graphics Xe 32EUs (Tiger Lake-H), i7-11800H, Netac NS512GSSD340
13.3 fps +2%
Minisforum BD790i
Radeon 610M, R9 7945HX, Kingston KC3000 2048G SKC3000D2048G
13 fps
Average AMD Radeon 610M
  (12.3 - 13.6, n=3)
13 fps 0%
Extreme Preset DX11
Minisforum EliteMini UM780 XTX
Radeon 780M, R7 7840HS, Kingston OM8PGP41024Q-A0
35.5 fps +191%
Minisforum Venus Series UM790 Pro
Radeon 780M, R9 7940HS, 2x Kingston OM8PGP4256Q-A0 (RAID 0)
31.1 fps +155%
NiPoGi AD08
UHD Graphics 64EUs, i7-12650H, Netac NS512GSSD530
19.1 fps +57%
Minisforum Mars Series MC560
Vega 7, R5 5600U, ESO512GYLCT
18.2 fps +49%
Acemagic AD15
UHD Graphics Xe 32EUs (Tiger Lake-H), i7-11800H, Netac NS512GSSD340
14 fps +15%
Minisforum BD770i
Radeon 610M, R7 7745HX, Fikwot FN955
12.3 fps +1%
Minisforum BD790i
Radeon 610M, R9 7945HX, Kingston KC3000 2048G SKC3000D2048G
12.2 fps
Average AMD Radeon 610M
  (11 - 12.3, n=3)
11.8 fps -3%
Unigine Valley 1.0
1920x1080 Extreme HD DirectX AA:x8
Minisforum EliteMini UM780 XTX
Radeon 780M, R7 7840HS, Kingston OM8PGP41024Q-A0
24 fps +140%
Minisforum Venus Series UM790 Pro
Radeon 780M, R9 7940HS, 2x Kingston OM8PGP4256Q-A0 (RAID 0)
20.4 fps +104%
Minisforum Mars Series MC560
Vega 7, R5 5600U, ESO512GYLCT
12.3 fps +23%
NiPoGi AD08
UHD Graphics 64EUs, i7-12650H, Netac NS512GSSD530
11.8 fps +18%
Minisforum BD770i
Radeon 610M, R7 7745HX, Fikwot FN955
10 fps 0%
Minisforum BD790i
Radeon 610M, R9 7945HX, Kingston KC3000 2048G SKC3000D2048G
10 fps
Average AMD Radeon 610M
  (10 - 10, n=2)
10 fps 0%
Acemagic AD15
UHD Graphics Xe 32EUs (Tiger Lake-H), i7-11800H, Netac NS512GSSD340
8.8 fps -12%
1920x1080 Extreme HD Preset OpenGL AA:x8
Minisforum EliteMini UM780 XTX
Radeon 780M, R7 7840HS, Kingston OM8PGP41024Q-A0
20.8 fps +119%
Minisforum Venus Series UM790 Pro
Radeon 780M, R9 7940HS, 2x Kingston OM8PGP4256Q-A0 (RAID 0)
17.7 fps +86%
NiPoGi AD08
UHD Graphics 64EUs, i7-12650H, Netac NS512GSSD530
13 fps +37%
Minisforum Mars Series MC560
Vega 7, R5 5600U, ESO512GYLCT
12.2 fps +28%
Acemagic AD15
UHD Graphics Xe 32EUs (Tiger Lake-H), i7-11800H, Netac NS512GSSD340
10.1 fps +6%
Minisforum BD770i
Radeon 610M, R7 7745HX, Fikwot FN955
9.6 fps +1%
Average AMD Radeon 610M
  (9.5 - 9.6, n=2)
9.55 fps +1%
Minisforum BD790i
Radeon 610M, R9 7945HX, Kingston KC3000 2048G SKC3000D2048G
9.5 fps
ComputeMark v2.1
1024x600 Normal, Score
Minisforum Venus Series UM790 Pro
Radeon 780M, R9 7940HS, 2x Kingston OM8PGP4256Q-A0 (RAID 0)
10495 Points +544%
Minisforum EliteMini UM780 XTX
Radeon 780M, R7 7840HS, Kingston OM8PGP41024Q-A0
10102 Points +520%
Minisforum Mars Series MC560
Vega 7, R5 5600U, ESO512GYLCT
2999 Points +84%
NiPoGi AD08
UHD Graphics 64EUs, i7-12650H, Netac NS512GSSD530
2370 Points +45%
Minisforum BD770i
Radeon 610M, R7 7745HX, Fikwot FN955
1632 Points 0%
Minisforum BD790i
Radeon 610M, R9 7945HX, Kingston KC3000 2048G SKC3000D2048G
1629 Points
Acemagic AD15
UHD Graphics Xe 32EUs (Tiger Lake-H), i7-11800H, Netac NS512GSSD340
1422 Points -13%
Average AMD Radeon 610M
  (517 - 1632, n=3)
1259 Points -23%
1024x600 Normal, Fluid 3DTex
Minisforum EliteMini UM780 XTX
Radeon 780M, R7 7840HS, Kingston OM8PGP41024Q-A0
468 Points +107%
Minisforum Venus Series UM790 Pro
Radeon 780M, R9 7940HS, 2x Kingston OM8PGP4256Q-A0 (RAID 0)
427 Points +89%
Minisforum Mars Series MC560
Vega 7, R5 5600U, ESO512GYLCT
243 Points +8%
Minisforum BD770i
Radeon 610M, R7 7745HX, Fikwot FN955
227 Points 0%
Minisforum BD790i
Radeon 610M, R9 7945HX, Kingston KC3000 2048G SKC3000D2048G
226 Points
NiPoGi AD08
UHD Graphics 64EUs, i7-12650H, Netac NS512GSSD530
207 Points -8%
Average AMD Radeon 610M
  (109 - 227, n=3)
187.3 Points -17%
Acemagic AD15
UHD Graphics Xe 32EUs (Tiger Lake-H), i7-11800H, Netac NS512GSSD340
182 Points -19%
1024x600 Normal, Fluid 2DTexArr
Minisforum EliteMini UM780 XTX
Radeon 780M, R7 7840HS, Kingston OM8PGP41024Q-A0
488 Points +153%
Minisforum Venus Series UM790 Pro
Radeon 780M, R9 7940HS, 2x Kingston OM8PGP4256Q-A0 (RAID 0)
427 Points +121%
Minisforum Mars Series MC560
Vega 7, R5 5600U, ESO512GYLCT
231 Points +20%
NiPoGi AD08
UHD Graphics 64EUs, i7-12650H, Netac NS512GSSD530
212 Points +10%
Minisforum BD770i
Radeon 610M, R7 7745HX, Fikwot FN955
194 Points +1%
Minisforum BD790i
Radeon 610M, R9 7945HX, Kingston KC3000 2048G SKC3000D2048G
193 Points
Acemagic AD15
UHD Graphics Xe 32EUs (Tiger Lake-H), i7-11800H, Netac NS512GSSD340
170 Points -12%
Average AMD Radeon 610M
  (84 - 194, n=3)
157 Points -19%
1024x600 Normal, Mandel Vector
Minisforum Venus Series UM790 Pro
Radeon 780M, R9 7940HS, 2x Kingston OM8PGP4256Q-A0 (RAID 0)
2984 Points +838%
Minisforum EliteMini UM780 XTX
Radeon 780M, R7 7840HS, Kingston OM8PGP41024Q-A0
2637 Points +729%
Minisforum Mars Series MC560
Vega 7, R5 5600U, ESO512GYLCT
790 Points +148%
NiPoGi AD08
UHD Graphics 64EUs, i7-12650H, Netac NS512GSSD530
450 Points +42%
Minisforum BD770i
Radeon 610M, R7 7745HX, Fikwot FN955
321 Points +1%
Minisforum BD790i
Radeon 610M, R9 7945HX, Kingston KC3000 2048G SKC3000D2048G
318 Points
Acemagic AD15
UHD Graphics Xe 32EUs (Tiger Lake-H), i7-11800H, Netac NS512GSSD340
254 Points -20%
Average AMD Radeon 610M
  (109 - 321, n=3)
249 Points -22%
1024x600 Normal, Mandel Scalar
Minisforum Venus Series UM790 Pro
Radeon 780M, R9 7940HS, 2x Kingston OM8PGP4256Q-A0 (RAID 0)
2808 Points +473%
Minisforum EliteMini UM780 XTX
Radeon 780M, R7 7840HS, Kingston OM8PGP41024Q-A0
2757 Points +463%
Minisforum Mars Series MC560
Vega 7, R5 5600U, ESO512GYLCT
877 Points +79%
NiPoGi AD08
UHD Graphics 64EUs, i7-12650H, Netac NS512GSSD530
743 Points +52%
Minisforum BD790i
Radeon 610M, R9 7945HX, Kingston KC3000 2048G SKC3000D2048G
490 Points
Minisforum BD770i
Radeon 610M, R7 7745HX, Fikwot FN955
487 Points -1%
Acemagic AD15
UHD Graphics Xe 32EUs (Tiger Lake-H), i7-11800H, Netac NS512GSSD340
378 Points -23%
Average AMD Radeon 610M
  (87 - 490, n=3)
355 Points -28%
1024x600 Normal, QJuliaRayTrace
Minisforum Venus Series UM790 Pro
Radeon 780M, R9 7940HS, 2x Kingston OM8PGP4256Q-A0 (RAID 0)
3849 Points +855%
Minisforum EliteMini UM780 XTX
Radeon 780M, R7 7840HS, Kingston OM8PGP41024Q-A0
3752 Points +831%
Minisforum Mars Series MC560
Vega 7, R5 5600U, ESO512GYLCT
857 Points +113%
NiPoGi AD08
UHD Graphics 64EUs, i7-12650H, Netac NS512GSSD530
759 Points +88%
Acemagic AD15
UHD Graphics Xe 32EUs (Tiger Lake-H), i7-11800H, Netac NS512GSSD340
457 Points +13%
Minisforum BD770i
Radeon 610M, R7 7745HX, Fikwot FN955
403 Points 0%
Minisforum BD790i
Radeon 610M, R9 7945HX, Kingston KC3000 2048G SKC3000D2048G
403 Points
Average AMD Radeon 610M
  (128 - 403, n=3)
311 Points -23%
Affinity Photo 2 - Combined (Single / Multi GPU)
Minisforum BD790i
Radeon 610M, R9 7945HX, Kingston KC3000 2048G SKC3000D2048G
5750 Points
NiPoGi AD08
UHD Graphics 64EUs, i7-12650H, Netac NS512GSSD530
3442 Points -40%
Average AMD Radeon 610M
  (889 - 5750, n=2)
3320 Points -42%
Acemagic AD15
UHD Graphics Xe 32EUs (Tiger Lake-H), i7-11800H, Netac NS512GSSD340
2123 Points -63%
Minisforum EliteMini UM780 XTX
Radeon 780M, R7 7840HS, Kingston OM8PGP41024Q-A0
1399 Points -76%
Minisforum Mars Series MC560
Vega 7, R5 5600U, ESO512GYLCT
1360 Points -76%
Minisforum Venus Series UM790 Pro
Radeon 780M, R9 7940HS, 2x Kingston OM8PGP4256Q-A0 (RAID 0)
1331 Points -77%
Minisforum BD770i
Radeon 610M, R7 7745HX, Fikwot FN955
889 Points -85%
3DMark 06 Standard Score
20555 points
3DMark Vantage P Result
12092 points
3DMark 11 Performance
3873 points
3DMark Ice Storm Standard Score
41556 points
3DMark Cloud Gate Standard Score
14629 points
3DMark Fire Strike Score
2156 points
3DMark Fire Strike Extreme Score
530 points
3DMark Time Spy Score
740 points
Help

游戏性能 - AMD Radeon 610M

为了更好地评估 AMD Radeon 610M的 3D 性能,我们对它进行了一些游戏测试。遗憾的是,这款低性能 iGPU 无法获得良好的帧速率。即使在玩老游戏时,AMD Radeon 610M 也很难在屏幕上显示足够的帧率。配备 AMD Radeon 780M 的机型性能明显更好。即便如此,AMD Radeon 780M AMD Radeon 780M也很快就达到了极限,如果你想体验最新的游戏,只能选择使用专用显卡。

要了解 iGPU 与其他显卡相比的性能,请查看我们的 GPU 游戏列表.

The Witcher 3
1024x768 Low Graphics & Postprocessing
Minisforum EliteMini UM780 XTX
Radeon 780M, R7 7840HS, Kingston OM8PGP41024Q-A0
153.5 (20.1min, 43.1P0.1, 107.8P1 - 370max) fps +245%
Minisforum Venus Series UM790 Pro
Radeon 780M, R9 7940HS, 2x Kingston OM8PGP4256Q-A0 (RAID 0)
135.1 fps +204%
NiPoGi AD08
UHD Graphics 64EUs, i7-12650H, Netac NS512GSSD530
74 (26min, 29.9P0.1, 42.4P1 - 267max) fps +66%
Minisforum Mars Series MC560
Vega 7, R5 5600U, ESO512GYLCT
63.6 fps +43%
Acemagic AD15
UHD Graphics Xe 32EUs (Tiger Lake-H), i7-11800H, Netac NS512GSSD340
47.3 (4.78min, 19.9P0.1, 25.3P1 - 232max) fps +6%
Minisforum BD790i
Radeon 610M, R9 7945HX, Kingston KC3000 2048G SKC3000D2048G
44.5 (8.12min, 22.4P0.1, 30.4P1 - 506max) fps
Minisforum BD770i
Radeon 610M, R7 7745HX, Fikwot FN955
44 (17.6min, 23.6P0.1, 29.2P1 - 484max) fps -1%
1920x1080 High Graphics & Postprocessing (Nvidia HairWorks Off)
Minisforum EliteMini UM780 XTX
Radeon 780M, R7 7840HS, Kingston OM8PGP41024Q-A0
49.1 (23.1min, 38.4P0.1, 40.8P1 - 125.3max) fps +253%
Minisforum Venus Series UM790 Pro
Radeon 780M, R9 7940HS, 2x Kingston OM8PGP4256Q-A0 (RAID 0)
43.3 fps +212%
NiPoGi AD08
UHD Graphics 64EUs, i7-12650H, Netac NS512GSSD530
30.2 (5.17min, 14.7P0.1, 16.3P1 - 162.3max) fps +117%
Minisforum Mars Series MC560
Vega 7, R5 5600U, ESO512GYLCT
20.7 fps +49%
Acemagic AD15
UHD Graphics Xe 32EUs (Tiger Lake-H), i7-11800H, Netac NS512GSSD340
16.1 (8.34min, 8.6P0.1, 8.83P1 - 61max) fps +16%
Minisforum BD790i
Radeon 610M, R9 7945HX, Kingston KC3000 2048G SKC3000D2048G
13.9 (7.02min, 10.1P0.1, 12.1P1 - 16.8max) fps
Minisforum BD770i
Radeon 610M, R7 7745HX, Fikwot FN955
13.5 (6.61min, 9.9P0.1, 11.5P1 - 16.8max) fps -3%
Borderlands 3
1280x720 Very Low Overall Quality (DX11)
Minisforum EliteMini UM780 XTX
Radeon 780M, R7 7840HS, Kingston OM8PGP41024Q-A0
97.3 fps +155%
Minisforum Venus Series UM790 Pro
Radeon 780M, R9 7940HS, 2x Kingston OM8PGP4256Q-A0 (RAID 0)
90.4 fps +137%
Minisforum Mars Series MC560
Vega 7, R5 5600U, ESO512GYLCT
54.3 fps +43%
NiPoGi AD08
UHD Graphics 64EUs, i7-12650H, Netac NS512GSSD530
42.2 fps +11%
Minisforum BD770i
Radeon 610M, R7 7745HX, Fikwot FN955
40.3 fps +6%
Minisforum BD790i
Radeon 610M, R9 7945HX, Kingston KC3000 2048G SKC3000D2048G
38.1 fps
Acemagic AD15
UHD Graphics Xe 32EUs (Tiger Lake-H), i7-11800H, Netac NS512GSSD340
24.5 fps -36%
1920x1080 High Overall Quality (DX11)
Minisforum EliteMini UM780 XTX
Radeon 780M, R7 7840HS, Kingston OM8PGP41024Q-A0
33.3 fps +295%
Minisforum Venus Series UM790 Pro
Radeon 780M, R9 7940HS, 2x Kingston OM8PGP4256Q-A0 (RAID 0)
29 fps +244%
Minisforum Mars Series MC560
Vega 7, R5 5600U, ESO512GYLCT
13.2 fps +57%
NiPoGi AD08
UHD Graphics 64EUs, i7-12650H, Netac NS512GSSD530
11.2 fps +33%
Minisforum BD770i
Radeon 610M, R7 7745HX, Fikwot FN955
9.04 fps +7%
Minisforum BD790i
Radeon 610M, R9 7945HX, Kingston KC3000 2048G SKC3000D2048G
8.43 fps
Acemagic AD15
UHD Graphics Xe 32EUs (Tiger Lake-H), i7-11800H, Netac NS512GSSD340
6.23 fps -26%
GTA V
1024x768 Lowest Settings possible
Minisforum EliteMini UM780 XTX
Radeon 780M, R7 7840HS, Kingston OM8PGP41024Q-A0
164.4 (4.9min, 111.1P1 - 324max) fps +25%
Minisforum Venus Series UM790 Pro
Radeon 780M, R9 7940HS, 2x Kingston OM8PGP4256Q-A0 (RAID 0)
157.8 (4.54min, 111.1P1 - 295max) fps +20%
Minisforum BD770i
Radeon 610M, R7 7745HX, Fikwot FN955
134.5 (7.24min, 90.9P1 - 367max) fps +3%
Minisforum BD790i
Radeon 610M, R9 7945HX, Kingston KC3000 2048G SKC3000D2048G
131.2 (7.24min, 90.9P1 - 448max) fps
Minisforum Mars Series MC560
Vega 7, R5 5600U, ESO512GYLCT
121.3 (9.08min, 83.3P1 - 273max) fps -8%
NiPoGi AD08
UHD Graphics 64EUs, i7-12650H, Netac NS512GSSD530
118.3 (10.2min, 76.9P1 - 249max) fps -10%
Acemagic AD15
UHD Graphics Xe 32EUs (Tiger Lake-H), i7-11800H, Netac NS512GSSD340
100.8 (23.7min, 71.4P1 - 196.9max) fps -23%
1920x1080 High/On (Advanced Graphics Off) AA:2xMSAA + FX AF:8x
Minisforum EliteMini UM780 XTX
Radeon 780M, R7 7840HS, Kingston OM8PGP41024Q-A0
66.9 (3.09min, 45.5P1 - 259max) fps +210%
Minisforum Venus Series UM790 Pro
Radeon 780M, R9 7940HS, 2x Kingston OM8PGP4256Q-A0 (RAID 0)
59.7 (4.52min, 40P1 - 219max) fps +176%
Minisforum Mars Series MC560
Vega 7, R5 5600U, ESO512GYLCT
28.5 (10.1min, 21.3P1 - 207max) fps +32%
Minisforum BD770i
Radeon 610M, R7 7745HX, Fikwot FN955
23.1 (9.37min, 16.4P1 - 192max) fps +7%
Minisforum BD790i
Radeon 610M, R9 7945HX, Kingston KC3000 2048G SKC3000D2048G
21.6 (6.51min, 16.1P1 - 189.5max) fps
NiPoGi AD08
UHD Graphics 64EUs, i7-12650H, Netac NS512GSSD530
16.9 (5.82min, 13P1 - 41.6max) fps -22%
Acemagic AD15
UHD Graphics Xe 32EUs (Tiger Lake-H), i7-11800H, Netac NS512GSSD340
13.7 (7.54min, 9.71P1 - 58.8max) fps -37%
Far Cry 5
1280x720 Low Preset AA:T
Minisforum EliteMini UM780 XTX
Radeon 780M, R7 7840HS, Kingston OM8PGP41024Q-A0
87 (75min - 104max) fps +248%
Minisforum Venus Series UM790 Pro
Radeon 780M, R9 7940HS, 2x Kingston OM8PGP4256Q-A0 (RAID 0)
80 (69min - 98max) fps +220%
Minisforum Mars Series MC560
Vega 7, R5 5600U, ESO512GYLCT
49 (42min - 63max) fps +96%
NiPoGi AD08
UHD Graphics 64EUs, i7-12650H, Netac NS512GSSD530
46 (38min - 52max) fps +84%
Minisforum BD770i
Radeon 610M, R7 7745HX, Fikwot FN955
34 (29min - 43max) fps +36%
Acemagic AD15
UHD Graphics Xe 32EUs (Tiger Lake-H), i7-11800H, Netac NS512GSSD340
30 (26min - 36max) fps +20%
Minisforum BD790i
Radeon 610M, R9 7945HX, Kingston KC3000 2048G SKC3000D2048G
25 (21min - 33max) fps
1920x1080 High Preset AA:T
Minisforum EliteMini UM780 XTX
Radeon 780M, R7 7840HS, Kingston OM8PGP41024Q-A0
47 (42min - 56max) fps +292%
Minisforum Venus Series UM790 Pro
Radeon 780M, R9 7940HS, 2x Kingston OM8PGP4256Q-A0 (RAID 0)
41 (36min - 49max) fps +242%
NiPoGi AD08
UHD Graphics 64EUs, i7-12650H, Netac NS512GSSD530
21 (18min - 25max) fps +75%
Minisforum Mars Series MC560
Vega 7, R5 5600U, ESO512GYLCT
20 (17min - 25max) fps +67%
Minisforum BD770i
Radeon 610M, R7 7745HX, Fikwot FN955
14 (12min - 19max) fps +17%
Acemagic AD15
UHD Graphics Xe 32EUs (Tiger Lake-H), i7-11800H, Netac NS512GSSD340
12 (10min - 16max) fps 0%
Minisforum BD790i
Radeon 610M, R9 7945HX, Kingston KC3000 2048G SKC3000D2048G
12 (10min - 16max) fps
Far Cry New Dawn
1280x720 Low Preset
Minisforum EliteMini UM780 XTX
Radeon 780M, R7 7840HS, Kingston OM8PGP41024Q-A0
75 (58min - 97max) fps +134%
Minisforum Venus Series UM790 Pro
Radeon 780M, R9 7940HS, 2x Kingston OM8PGP4256Q-A0 (RAID 0)
70 (50min - 89max) fps +119%
NiPoGi AD08
UHD Graphics 64EUs, i7-12650H, Netac NS512GSSD530
45 (29min - 56max) fps +41%
Minisforum Mars Series MC560
Vega 7, R5 5600U, ESO512GYLCT
43 (33min - 55max) fps +34%
Minisforum BD770i
Radeon 610M, R7 7745HX, Fikwot FN955
35 (27min - 43max) fps +9%
Minisforum BD790i
Radeon 610M, R9 7945HX, Kingston KC3000 2048G SKC3000D2048G
32 (26min - 40max) fps
Acemagic AD15
UHD Graphics Xe 32EUs (Tiger Lake-H), i7-11800H, Netac NS512GSSD340
27 (17min - 35max) fps -16%
1920x1080 High Preset
Minisforum EliteMini UM780 XTX
Radeon 780M, R7 7840HS, Kingston OM8PGP41024Q-A0
45 (37min - 53max) fps +221%
Minisforum Venus Series UM790 Pro
Radeon 780M, R9 7940HS, 2x Kingston OM8PGP4256Q-A0 (RAID 0)
40 (32min - 47max) fps +186%
NiPoGi AD08
UHD Graphics 64EUs, i7-12650H, Netac NS512GSSD530
22 (16min - 27max) fps +57%
Minisforum Mars Series MC560
Vega 7, R5 5600U, ESO512GYLCT
20 (12min - 24max) fps +43%
Minisforum BD770i
Radeon 610M, R7 7745HX, Fikwot FN955
16 (12min - 19max) fps +14%
Minisforum BD790i
Radeon 610M, R9 7945HX, Kingston KC3000 2048G SKC3000D2048G
14 (11min - 17max) fps
Acemagic AD15
UHD Graphics Xe 32EUs (Tiger Lake-H), i7-11800H, Netac NS512GSSD340
13 (9min - 16max) fps -7%
Tiny Tina's Wonderlands
1280x720 Lowest Preset (DX12)
Minisforum EliteMini UM780 XTX
Radeon 780M, R7 7840HS, Kingston OM8PGP41024Q-A0
151.2 fps +311%
Minisforum Venus Series UM790 Pro
Radeon 780M, R9 7940HS, 2x Kingston OM8PGP4256Q-A0 (RAID 0)
131.4 fps +257%
Minisforum Mars Series MC560
Vega 7, R5 5600U, ESO512GYLCT
56.9 fps +55%
Minisforum BD770i
Radeon 610M, R7 7745HX, Fikwot FN955
40.9 fps +11%
Minisforum BD790i
Radeon 610M, R9 7945HX, Kingston KC3000 2048G SKC3000D2048G
36.8 fps
Acemagic AD15
UHD Graphics Xe 32EUs (Tiger Lake-H), i7-11800H, Netac NS512GSSD340
25.7 fps -30%
1920x1080 High Preset (DX12)
Minisforum EliteMini UM780 XTX
Radeon 780M, R7 7840HS, Kingston OM8PGP41024Q-A0
38.8 fps +361%
Minisforum Venus Series UM790 Pro
Radeon 780M, R9 7940HS, 2x Kingston OM8PGP4256Q-A0 (RAID 0)
33.3 fps +296%
Minisforum Mars Series MC560
Vega 7, R5 5600U, ESO512GYLCT
13.5 fps +61%
Minisforum BD770i
Radeon 610M, R7 7745HX, Fikwot FN955
9.24 fps +10%
Minisforum BD790i
Radeon 610M, R9 7945HX, Kingston KC3000 2048G SKC3000D2048G
8.41 fps
Acemagic AD15
UHD Graphics Xe 32EUs (Tiger Lake-H), i7-11800H, Netac NS512GSSD340
6.35 fps -24%
Metro Exodus
1280x720 Low Quality AF:4x
Minisforum EliteMini UM780 XTX
Radeon 780M, R7 7840HS, Kingston OM8PGP41024Q-A0
92.5 (56.63min - 130.99max) fps +269%
Minisforum Venus Series UM790 Pro
Radeon 780M, R9 7940HS, 2x Kingston OM8PGP4256Q-A0 (RAID 0)
81.1 (49.18min - 114.94max) fps +223%
NiPoGi AD08
UHD Graphics 64EUs, i7-12650H, Netac NS512GSSD530
33.1 (19.24min - 49.3max) fps +32%
Minisforum BD770i
Radeon 610M, R7 7745HX, Fikwot FN955
28.4 (18.34min - 40.02max) fps +13%
Minisforum BD790i
Radeon 610M, R9 7945HX, Kingston KC3000 2048G SKC3000D2048G
25.1 (15.39min - 37.85max) fps
1920x1080 High Quality AF:16x
Minisforum EliteMini UM780 XTX
Radeon 780M, R7 7840HS, Kingston OM8PGP41024Q-A0
28.7 (14.33min - 42.03max) fps +271%
Minisforum Venus Series UM790 Pro
Radeon 780M, R9 7940HS, 2x Kingston OM8PGP4256Q-A0 (RAID 0)
25 (12.18min - 37.05max) fps +223%
NiPoGi AD08
UHD Graphics 64EUs, i7-12650H, Netac NS512GSSD530
11.7 (6.1min - 17.86max) fps +51%
Minisforum BD770i
Radeon 610M, R7 7745HX, Fikwot FN955
8.4 (4.14min - 13.6max) fps +9%
Minisforum BD790i
Radeon 610M, R9 7945HX, Kingston KC3000 2048G SKC3000D2048G
7.73 (3.74min - 13.13max) fps
Shadow of the Tomb Raider
1280x720 Lowest Preset
Minisforum EliteMini UM780 XTX
Radeon 780M, R7 7840HS, Kingston OM8PGP41024Q-A0
109.2 fps +206%
Minisforum Venus Series UM790 Pro
Radeon 780M, R9 7940HS, 2x Kingston OM8PGP4256Q-A0 (RAID 0)
94.1 fps +164%
NiPoGi AD08
UHD Graphics 64EUs, i7-12650H, Netac NS512GSSD530
40.5 fps +13%
Minisforum BD770i
Radeon 610M, R7 7745HX, Fikwot FN955
40 fps +12%
Minisforum BD790i
Radeon 610M, R9 7945HX, Kingston KC3000 2048G SKC3000D2048G
35.7 fps
Acemagic AD15
UHD Graphics Xe 32EUs (Tiger Lake-H), i7-11800H, Netac NS512GSSD340
33.2 fps -7%
1920x1080 High Preset AA:SM
Minisforum EliteMini UM780 XTX
Radeon 780M, R7 7840HS, Kingston OM8PGP41024Q-A0
41.2 fps +258%
Minisforum Venus Series UM790 Pro
Radeon 780M, R9 7940HS, 2x Kingston OM8PGP4256Q-A0 (RAID 0)
36.3 fps +216%
NiPoGi AD08
UHD Graphics 64EUs, i7-12650H, Netac NS512GSSD530
17.6 fps +53%
Minisforum BD770i
Radeon 610M, R7 7745HX, Fikwot FN955
12.6 fps +10%
Acemagic AD15
UHD Graphics Xe 32EUs (Tiger Lake-H), i7-11800H, Netac NS512GSSD340
12.1 fps +5%
Minisforum BD790i
Radeon 610M, R9 7945HX, Kingston KC3000 2048G SKC3000D2048G
11.5 fps
Strange Brigade
1280x720 lowest AF:1
Minisforum EliteMini UM780 XTX
Radeon 780M, R7 7840HS, Kingston OM8PGP41024Q-A0
168.8 (121.6min, 142.3P1 - 233max) fps +708%
Minisforum Venus Series UM790 Pro
Radeon 780M, R9 7940HS, 2x Kingston OM8PGP4256Q-A0 (RAID 0)
148.8 (53.7min, 130P1 - 285max) fps +612%
Minisforum Mars Series MC560
Vega 7, R5 5600U, ESO512GYLCT
86.3 (51.6min, 72P1 - 163.3max) fps +313%
NiPoGi AD08
UHD Graphics 64EUs, i7-12650H, Netac NS512GSSD530
78.1 (17.5min, 24P1 - 419max) fps +274%
Minisforum BD770i
Radeon 610M, R7 7745HX, Fikwot FN955
67.7 (53.7min, 60.2P1 - 86.8max) fps +224%
Acemagic AD15
UHD Graphics Xe 32EUs (Tiger Lake-H), i7-11800H, Netac NS512GSSD340
55.6 (12.4min, 18P1 - 448max) fps +166%
Minisforum BD790i
Radeon 610M, R9 7945HX, Kingston KC3000 2048G SKC3000D2048G
20.9 (18.4min, 19.1P1 - 24.8max) fps
1920x1080 high AA:high AF:8
Minisforum EliteMini UM780 XTX
Radeon 780M, R7 7840HS, Kingston OM8PGP41024Q-A0
56.5 (37.2min, 44.1P1 - 77.4max) fps +295%
Minisforum Venus Series UM790 Pro
Radeon 780M, R9 7940HS, 2x Kingston OM8PGP4256Q-A0 (RAID 0)
50.7 (14.7min, 38.5P1 - 320max) fps +255%
Minisforum Mars Series MC560
Vega 7, R5 5600U, ESO512GYLCT
26 (19.1min, 20.7P1 - 45.9max) fps +82%
NiPoGi AD08
UHD Graphics 64EUs, i7-12650H, Netac NS512GSSD530
25.6 (5min, 9.18P1 - 212max) fps +79%
Minisforum BD770i
Radeon 610M, R7 7745HX, Fikwot FN955
17 (13.4min, 13.9P1 - 22.4max) fps +19%
Acemagic AD15
UHD Graphics Xe 32EUs (Tiger Lake-H), i7-11800H, Netac NS512GSSD340
16.6 (5min, 5.93P1 - 306max) fps +16%
Minisforum BD790i
Radeon 610M, R9 7945HX, Kingston KC3000 2048G SKC3000D2048G
14.3 (10.6min, 11P1 - 20max) fps
lowmed.highultra
GTA V (2015) 131.2 99.5 21.6 9.61
The Witcher 3 (2015) 44.5 27 13.9 7.8
Final Fantasy XV Benchmark (2018) 25.9 11.4 7.97
X-Plane 11.11 (2018) 39.8 23.5 20.8
Far Cry 5 (2018) 25 13 12 11
Strange Brigade (2018) 20.9 18.8 14.3 12
Shadow of the Tomb Raider (2018) 35.7 12.5 11.5 9.4
Far Cry New Dawn (2019) 32 15 14 12
Metro Exodus (2019) 25.1 10.6 7.73 6.41
Borderlands 3 (2019) 38.1 14.3 8.43 6.4
Tiny Tina's Wonderlands (2022) 16.3 12.8 8.41

配备 NvidiaGeForce RTX 4090 的 Minisforum BD790i

Minisforum BD790i 主板是紧凑型游戏系统的理想之选。AMD Ryzen 9 7945HX 提供了充足的性能,即使是对 CPU 要求较高的游戏也不会对 16 核组件造成任何过度消耗。合成基准测试显示,不同系统之间的差异很小。Minisforum BD790i 主板拥有完整的 PCIe x16 接口,已支持 5.0 标准。这意味着未来几个月可能发布的显卡也能以其全带宽运行,进一步巩固了该组件面向未来的品质。我们使用了 PalitGeForce RTX 4090 Gamerock OC进行游戏测试。由于显卡的尺寸,我们不得不在开放式设置中使用 Minisforum BD790i 进行测试。对于 Phanteks Enthoo Evolv Shift XT 机箱来说,显卡实在是太大了。

要分析游戏基准,我们首先来看看 CPU 极限性能。这是不同处理器之间差异最大的地方。我们的测试系统大致达到了 AMD Ryzen 5 9600X 的预期性能水平。英特尔酷睿 i9-14900K 在可承受范围之内,只是性能略高一些。当我们提高分辨率和细节级别时,处理器的性能越来越落后。到了 GPU 的极限,所有对比设备的性能都相差无几,这意味着真正的差异几乎无法察觉。AMD Ryzen 9 7945HX 和 PalitGeForce RTX 4090 Gamerock OC 的组合始终确保了令人印象深刻的游戏性能,丝毫不逊于传统台式电脑。

本比较中列出的所有系统均使用相同的显卡进行测试,即 PalitGeForce RTX 4090 Gamerock OC.

Minisforum BD790i 与 NvidiaGeForce RTX 4090 的组合
NvidiaGeForce RTX 4090
Performance Rating - Percent
AMD Ryzen 5 9600X, NVIDIA GeForce RTX 4090
97.8 pt
Intel Core i9-14900K, NVIDIA GeForce RTX 4090
96.3 pt
Intel Core i5-14600K, NVIDIA GeForce RTX 4090
96 pt
AMD Ryzen 7 7745HX, NVIDIA GeForce RTX 4090
95.5 pt
AMD Ryzen 9 7950X, NVIDIA GeForce RTX 4090
94.9 pt
AMD Ryzen 7 7800X3D, NVIDIA GeForce RTX 4090
94.9 pt
Intel Core i7-13700, NVIDIA GeForce RTX 4090
94.6 pt
AMD Ryzen 9 7945HX, NVIDIA GeForce RTX 4090
91.7 pt
Intel Core i7-12700, NVIDIA GeForce RTX 4090
90.8 pt
Intel Core i5-13400, NVIDIA GeForce RTX 4090
88.5 pt
3DMark 11 - 1280x720 Performance GPU
AMD Ryzen 7 7745HX, NVIDIA GeForce RTX 4090
115253 Points +3291%
AMD Ryzen 7 7800X3D, NVIDIA GeForce RTX 4090
114641 Points +3273%
Intel Core i5-14600K, NVIDIA GeForce RTX 4090
110994 Points +3165%
AMD Ryzen 9 7950X, NVIDIA GeForce RTX 4090
107723 Points +3069%
Intel Core i7-13700, NVIDIA GeForce RTX 4090
105473 Points +3003%
Intel Core i7-12700, NVIDIA GeForce RTX 4090
104876 Points +2985%
Intel Core i5-13400, NVIDIA GeForce RTX 4090
104598 Points +2977%
AMD Ryzen 5 9600X, NVIDIA GeForce RTX 4090
104516 Points +2975%
Intel Core i9-14900K, NVIDIA GeForce RTX 4090
103741 Points +2952%
AMD Ryzen 9 7945HX, NVIDIA GeForce RTX 4090
99614 Points +2831%
3399 Points
3DMark
2560x1440 Time Spy Graphics
AMD Ryzen 7 7745HX, NVIDIA GeForce RTX 4090
37809 Points +5552%
Intel Core i5-14600K, NVIDIA GeForce RTX 4090
37769 Points +5546%
Intel Core i9-14900K, NVIDIA GeForce RTX 4090
37714 Points +5537%
AMD Ryzen 7 7800X3D, NVIDIA GeForce RTX 4090
37664 Points +5530%
AMD Ryzen 5 9600X, NVIDIA GeForce RTX 4090
37161 Points +5455%
Intel Core i7-13700, NVIDIA GeForce RTX 4090
37106 Points +5446%
AMD Ryzen 9 7950X, NVIDIA GeForce RTX 4090
36836 Points +5406%
Intel Core i7-12700, NVIDIA GeForce RTX 4090
34580 Points +5069%
Intel Core i5-13400, NVIDIA GeForce RTX 4090
33624 Points +4926%
AMD Ryzen 9 7945HX, NVIDIA GeForce RTX 4090
32488 Points +4756%
669 Points
1920x1080 Fire Strike Graphics
AMD Ryzen 7 7745HX, NVIDIA GeForce RTX 4090
87786 Points +3755%
Intel Core i5-14600K, NVIDIA GeForce RTX 4090
86031 Points +3678%
Intel Core i7-12700, NVIDIA GeForce RTX 4090
79398 Points +3387%
Intel Core i7-13700, NVIDIA GeForce RTX 4090
78878 Points +3364%
AMD Ryzen 5 9600X, NVIDIA GeForce RTX 4090
78579 Points +3351%
Intel Core i5-13400, NVIDIA GeForce RTX 4090
77224 Points +3291%
AMD Ryzen 7 7800X3D, NVIDIA GeForce RTX 4090
73447 Points +3126%
AMD Ryzen 9 7950X, NVIDIA GeForce RTX 4090
72678 Points +3092%
AMD Ryzen 9 7945HX, NVIDIA GeForce RTX 4090
72177 Points +3070%
Intel Core i9-14900K, NVIDIA GeForce RTX 4090
66973 Points +2841%
2277 Points
3840x2160 Fire Strike Ultra Graphics
AMD Ryzen 7 7800X3D, NVIDIA GeForce RTX 4090
25571 Points +5306%
AMD Ryzen 7 7745HX, NVIDIA GeForce RTX 4090
25435 Points +5277%
Intel Core i5-14600K, NVIDIA GeForce RTX 4090
25342 Points +5258%
Intel Core i7-13700, NVIDIA GeForce RTX 4090
25254 Points +5239%
Intel Core i5-13400, NVIDIA GeForce RTX 4090
25052 Points +5196%
AMD Ryzen 9 7950X, NVIDIA GeForce RTX 4090
25018 Points +5189%
Intel Core i9-14900K, NVIDIA GeForce RTX 4090
24968 Points +5179%
AMD Ryzen 5 9600X, NVIDIA GeForce RTX 4090
24915 Points +5167%
AMD Ryzen 9 7945HX, NVIDIA GeForce RTX 4090
24906 Points +5166%
Intel Core i7-12700, NVIDIA GeForce RTX 4090
24669 Points +5115%
473 Points
Unigine Superposition
1280x720 720p Low
AMD Ryzen 5 9600X, NVIDIA GeForce RTX 4090
63603 Points +1278%
Intel Core i9-14900K, NVIDIA GeForce RTX 4090
57833 Points +1153%
AMD Ryzen 7 7800X3D, NVIDIA GeForce RTX 4090
56805 Points +1131%
AMD Ryzen 9 7950X, NVIDIA GeForce RTX 4090
51741 Points +1021%
AMD Ryzen 7 7745HX, NVIDIA GeForce RTX 4090
50617 Points +997%
Intel Core i7-13700, NVIDIA GeForce RTX 4090
50107 Points +986%
Intel Core i5-14600K, NVIDIA GeForce RTX 4090
49203 Points +966%
AMD Ryzen 9 7945HX, NVIDIA GeForce RTX 4090
45591 Points +888%
Intel Core i7-12700, NVIDIA GeForce RTX 4090
40758 Points +783%
Intel Core i5-13400, NVIDIA GeForce RTX 4090
35207 Points +663%
4614 Points
1920x1080 1080p High
Intel Core i9-14900K, NVIDIA GeForce RTX 4090
50390 Points +5353%
AMD Ryzen 5 9600X, NVIDIA GeForce RTX 4090
50230 Points +5336%
AMD Ryzen 7 7800X3D, NVIDIA GeForce RTX 4090
49328 Points +5239%
AMD Ryzen 9 7950X, NVIDIA GeForce RTX 4090
46814 Points +4966%
AMD Ryzen 7 7745HX, NVIDIA GeForce RTX 4090
45532 Points +4828%
Intel Core i7-13700, NVIDIA GeForce RTX 4090
45368 Points +4810%
Intel Core i5-14600K, NVIDIA GeForce RTX 4090
45162 Points +4788%
AMD Ryzen 9 7945HX, NVIDIA GeForce RTX 4090
41353 Points +4375%
Intel Core i7-12700, NVIDIA GeForce RTX 4090
37819 Points +3993%
Intel Core i5-13400, NVIDIA GeForce RTX 4090
32711 Points +3440%
924 Points
1920x1080 1080p Extreme
AMD Ryzen 7 7800X3D, NVIDIA GeForce RTX 4090
22618 Points +7978%
AMD Ryzen 7 7745HX, NVIDIA GeForce RTX 4090
22416 Points +7906%
Intel Core i5-14600K, NVIDIA GeForce RTX 4090
21954 Points +7741%
Intel Core i9-14900K, NVIDIA GeForce RTX 4090
21917 Points +7728%
AMD Ryzen 9 7950X, NVIDIA GeForce RTX 4090
21824 Points +7694%
Intel Core i7-13700, NVIDIA GeForce RTX 4090
21808 Points +7689%
Intel Core i5-13400, NVIDIA GeForce RTX 4090
21646 Points +7631%
Intel Core i7-12700, NVIDIA GeForce RTX 4090
21615 Points +7620%
AMD Ryzen 9 7945HX, NVIDIA GeForce RTX 4090
21604 Points +7616%
AMD Ryzen 5 9600X, NVIDIA GeForce RTX 4090
21586 Points +7609%
280 Points
3840x2160 4k Optimized
AMD Ryzen 9 7950X, NVIDIA GeForce RTX 4090
33943 Points
Intel Core i7-13700, NVIDIA GeForce RTX 4090
33765 Points
Intel Core i9-14900K, NVIDIA GeForce RTX 4090
33737 Points
Intel Core i5-14600K, NVIDIA GeForce RTX 4090
33700 Points
AMD Ryzen 7 7800X3D, NVIDIA GeForce RTX 4090
33601 Points
AMD Ryzen 7 7745HX, NVIDIA GeForce RTX 4090
33540 Points
AMD Ryzen 5 9600X, NVIDIA GeForce RTX 4090
33095 Points
AMD Ryzen 9 7945HX, NVIDIA GeForce RTX 4090
32629 Points
Intel Core i7-12700, NVIDIA GeForce RTX 4090
32608 Points
Intel Core i5-13400, NVIDIA GeForce RTX 4090
30877 Points
7680x4320 8k Optimized
AMD Ryzen 9 7950X, NVIDIA GeForce RTX 4090
13082 Points
Intel Core i7-13700, NVIDIA GeForce RTX 4090
13081 Points
Intel Core i7-12700, NVIDIA GeForce RTX 4090
13070 Points
Intel Core i5-13400, NVIDIA GeForce RTX 4090
13011 Points
Intel Core i9-14900K, NVIDIA GeForce RTX 4090
12801 Points
Intel Core i5-14600K, NVIDIA GeForce RTX 4090
12791 Points
AMD Ryzen 7 7800X3D, NVIDIA GeForce RTX 4090
12770 Points
AMD Ryzen 7 7745HX, NVIDIA GeForce RTX 4090
12752 Points
AMD Ryzen 9 7945HX, NVIDIA GeForce RTX 4090
12526 Points
AMD Ryzen 5 9600X, NVIDIA GeForce RTX 4090
12498 Points
Unigine Valley 1.0
1920x1080 Extreme HD DirectX AA:x8
AMD Ryzen 5 9600X, NVIDIA GeForce RTX 4090
324 fps +3140%
Intel Core i9-14900K, NVIDIA GeForce RTX 4090
304.6 fps +2946%
Intel Core i5-14600K, NVIDIA GeForce RTX 4090
283.4 fps +2734%
AMD Ryzen 9 7950X, NVIDIA GeForce RTX 4090
270.7 fps +2607%
Intel Core i7-13700, NVIDIA GeForce RTX 4090
266.6 fps +2566%
AMD Ryzen 9 7945HX, NVIDIA GeForce RTX 4090
257.5 fps +2475%
AMD Ryzen 7 7745HX, NVIDIA GeForce RTX 4090
249.8 fps +2398%
AMD Ryzen 7 7800X3D, NVIDIA GeForce RTX 4090
246.7 fps +2367%
Intel Core i7-12700, NVIDIA GeForce RTX 4090
238.4 fps +2284%
Intel Core i5-13400, NVIDIA GeForce RTX 4090
226.2 fps +2162%
10 fps
1920x1080 Extreme HD Preset OpenGL AA:x8
AMD Ryzen 5 9600X, NVIDIA GeForce RTX 4090
331.8 fps +3393%
Intel Core i9-14900K, NVIDIA GeForce RTX 4090
320.9 fps +3278%
Intel Core i5-14600K, NVIDIA GeForce RTX 4090
303.2 fps +3092%
Intel Core i7-13700, NVIDIA GeForce RTX 4090
293.1 fps +2985%
AMD Ryzen 9 7950X, NVIDIA GeForce RTX 4090
288 fps +2932%
AMD Ryzen 7 7745HX, NVIDIA GeForce RTX 4090
270 fps +2742%
AMD Ryzen 7 7800X3D, NVIDIA GeForce RTX 4090
260.9 fps +2646%
AMD Ryzen 9 7945HX, NVIDIA GeForce RTX 4090
260.9 fps +2646%
Intel Core i7-12700, NVIDIA GeForce RTX 4090
258.5 fps +2621%
Intel Core i5-13400, NVIDIA GeForce RTX 4090
242.8 fps +2456%
9.5 fps
Unigine Heaven 4.0
Extreme Preset OpenGL
AMD Ryzen 5 9600X, NVIDIA GeForce RTX 4090
472.4 fps +3534%
Intel Core i9-14900K, NVIDIA GeForce RTX 4090
463.3 fps +3464%
AMD Ryzen 7 7745HX, NVIDIA GeForce RTX 4090
461 fps +3446%
AMD Ryzen 9 7945HX, NVIDIA GeForce RTX 4090
458 fps +3423%
Intel Core i5-14600K, NVIDIA GeForce RTX 4090
456.3 fps +3410%
AMD Ryzen 9 7950X, NVIDIA GeForce RTX 4090
450.4 fps +3365%
Intel Core i7-13700, NVIDIA GeForce RTX 4090
450.4 fps +3365%
AMD Ryzen 7 7800X3D, NVIDIA GeForce RTX 4090
442.4 fps +3303%
Intel Core i7-12700, NVIDIA GeForce RTX 4090
433.8 fps +3237%
Intel Core i5-13400, NVIDIA GeForce RTX 4090
420 fps +3131%
13 fps
Extreme Preset DX11
AMD Ryzen 9 7950X, NVIDIA GeForce RTX 4090
491.5 fps +3929%
Intel Core i9-14900K, NVIDIA GeForce RTX 4090
484.4 fps +3870%
AMD Ryzen 9 7945HX, NVIDIA GeForce RTX 4090
476.3 fps +3804%
AMD Ryzen 5 9600X, NVIDIA GeForce RTX 4090
473.9 fps +3784%
AMD Ryzen 7 7745HX, NVIDIA GeForce RTX 4090
473.1 fps +3778%
Intel Core i5-14600K, NVIDIA GeForce RTX 4090
473 fps +3777%
AMD Ryzen 7 7800X3D, NVIDIA GeForce RTX 4090
463.8 fps +3702%
Intel Core i7-13700, NVIDIA GeForce RTX 4090
462.5 fps +3691%
Intel Core i7-12700, NVIDIA GeForce RTX 4090
435.2 fps +3467%
Intel Core i5-13400, NVIDIA GeForce RTX 4090
416.6 fps +3315%
12.2 fps
ComputeMark v2.1
1024x600 Normal, Score
AMD Ryzen 7 7745HX, NVIDIA GeForce RTX 4090
92521 Points +5580%
Intel Core i5-14600K, NVIDIA GeForce RTX 4090
92397 Points +5572%
AMD Ryzen 9 7945HX, NVIDIA GeForce RTX 4090
92292 Points +5566%
AMD Ryzen 5 9600X, NVIDIA GeForce RTX 4090
92222 Points +5561%
AMD Ryzen 9 7950X, NVIDIA GeForce RTX 4090
92171 Points +5558%
Intel Core i9-14900K, NVIDIA GeForce RTX 4090
91722 Points +5531%
Intel Core i7-12700, NVIDIA GeForce RTX 4090
91703 Points +5529%
AMD Ryzen 7 7800X3D, NVIDIA GeForce RTX 4090
91665 Points +5527%
Intel Core i5-13400, NVIDIA GeForce RTX 4090
91659 Points +5527%
Intel Core i7-13700, NVIDIA GeForce RTX 4090
91616 Points +5524%
1629 Points
1024x600 Normal, Fluid 3DTex
AMD Ryzen 7 7800X3D, NVIDIA GeForce RTX 4090
10875 Points +4712%
Intel Core i5-14600K, NVIDIA GeForce RTX 4090
10797 Points +4677%
Intel Core i7-13700, NVIDIA GeForce RTX 4090
10759 Points +4661%
AMD Ryzen 9 7945HX, NVIDIA GeForce RTX 4090
10758 Points +4660%
Intel Core i5-13400, NVIDIA GeForce RTX 4090
10756 Points +4659%
AMD Ryzen 5 9600X, NVIDIA GeForce RTX 4090
10756 Points +4659%
Intel Core i7-12700, NVIDIA GeForce RTX 4090
10749 Points +4656%
AMD Ryzen 9 7950X, NVIDIA GeForce RTX 4090
10724 Points +4645%
AMD Ryzen 7 7745HX, NVIDIA GeForce RTX 4090
10707 Points +4638%
Intel Core i9-14900K, NVIDIA GeForce RTX 4090
10498 Points +4545%
226 Points
1024x600 Normal, Fluid 2DTexArr
AMD Ryzen 9 7945HX, NVIDIA GeForce RTX 4090
6960 Points +3506%
AMD Ryzen 5 9600X, NVIDIA GeForce RTX 4090
6948 Points +3500%
AMD Ryzen 7 7745HX, NVIDIA GeForce RTX 4090
6924 Points +3488%
Intel Core i5-14600K, NVIDIA GeForce RTX 4090
6920 Points +3485%
Intel Core i9-14900K, NVIDIA GeForce RTX 4090
6901 Points +3476%
AMD Ryzen 9 7950X, NVIDIA GeForce RTX 4090
6891 Points +3470%
Intel Core i7-12700, NVIDIA GeForce RTX 4090
6891 Points +3470%
Intel Core i7-13700, NVIDIA GeForce RTX 4090
6891 Points +3470%
AMD Ryzen 7 7800X3D, NVIDIA GeForce RTX 4090
6887 Points +3468%
Intel Core i5-13400, NVIDIA GeForce RTX 4090
6879 Points +3464%
193 Points
1024x600 Normal, Mandel Vector
AMD Ryzen 7 7745HX, NVIDIA GeForce RTX 4090
17390 Points +5369%
AMD Ryzen 9 7945HX, NVIDIA GeForce RTX 4090
17369 Points +5362%
Intel Core i5-14600K, NVIDIA GeForce RTX 4090
17355 Points +5358%
AMD Ryzen 9 7950X, NVIDIA GeForce RTX 4090
17336 Points +5352%
AMD Ryzen 5 9600X, NVIDIA GeForce RTX 4090
17307 Points +5342%
Intel Core i9-14900K, NVIDIA GeForce RTX 4090
17246 Points +5323%
Intel Core i7-13700, NVIDIA GeForce RTX 4090
17207 Points +5311%
Intel Core i7-12700, NVIDIA GeForce RTX 4090
17196 Points +5308%
AMD Ryzen 7 7800X3D, NVIDIA GeForce RTX 4090
17156 Points +5295%
Intel Core i5-13400, NVIDIA GeForce RTX 4090
17154 Points +5294%
318 Points
1024x600 Normal, Mandel Scalar
AMD Ryzen 7 7745HX, NVIDIA GeForce RTX 4090
23006 Points +4595%
Intel Core i5-14600K, NVIDIA GeForce RTX 4090
22992 Points +4592%
Intel Core i9-14900K, NVIDIA GeForce RTX 4090
22970 Points +4588%
AMD Ryzen 9 7945HX, NVIDIA GeForce RTX 4090
22936 Points +4581%
AMD Ryzen 7 7800X3D, NVIDIA GeForce RTX 4090
22926 Points +4579%
AMD Ryzen 9 7950X, NVIDIA GeForce RTX 4090
22889 Points +4571%
AMD Ryzen 5 9600X, NVIDIA GeForce RTX 4090
22843 Points +4562%
Intel Core i7-12700, NVIDIA GeForce RTX 4090
22834 Points +4560%
Intel Core i7-13700, NVIDIA GeForce RTX 4090
22825 Points +4558%
Intel Core i5-13400, NVIDIA GeForce RTX 4090
22813 Points +4556%
490 Points
1024x600 Normal, QJuliaRayTrace
AMD Ryzen 7 7745HX, NVIDIA GeForce RTX 4090
34494 Points +8459%
AMD Ryzen 5 9600X, NVIDIA GeForce RTX 4090
34367 Points +8428%
Intel Core i5-14600K, NVIDIA GeForce RTX 4090
34333 Points +8419%
AMD Ryzen 9 7950X, NVIDIA GeForce RTX 4090
34332 Points +8419%
AMD Ryzen 9 7945HX, NVIDIA GeForce RTX 4090
34269 Points +8403%
Intel Core i9-14900K, NVIDIA GeForce RTX 4090
34107 Points +8363%
Intel Core i5-13400, NVIDIA GeForce RTX 4090
34057 Points +8351%
Intel Core i7-12700, NVIDIA GeForce RTX 4090
34033 Points +8345%
Intel Core i7-13700, NVIDIA GeForce RTX 4090
33935 Points +8321%
AMD Ryzen 7 7800X3D, NVIDIA GeForce RTX 4090
33822 Points +8293%
403 Points

Performance comparison at CPU limit at 720p

Performance Rating - Percent
AMD Ryzen 7 7800X3D, NVIDIA GeForce RTX 4090
98.8 pt
Intel Core i9-14900K, NVIDIA GeForce RTX 4090
90.2 pt
AMD Ryzen 5 9600X, NVIDIA GeForce RTX 4090
86.7 pt
AMD Ryzen 9 7950X, NVIDIA GeForce RTX 4090
85.2 pt
Intel Core i5-14600K, NVIDIA GeForce RTX 4090
79.4 pt
Intel Core i7-13700, NVIDIA GeForce RTX 4090
76.5 pt
AMD Ryzen 7 7745HX, NVIDIA GeForce RTX 4090
76.4 pt
AMD Ryzen 9 7945HX, NVIDIA GeForce RTX 4090
74.1 pt
Intel Core i7-12700, NVIDIA GeForce RTX 4090
65.9 pt
Intel Core i5-13400, NVIDIA GeForce RTX 4090
57.3 pt
F1 22 - 1280x720 Ultra Low Preset AA:T AF:16x
AMD Ryzen 7 7800X3D, NVIDIA GeForce RTX 4090
629 (477min, 404P1 - 691max) fps
Intel Core i9-14900K, NVIDIA GeForce RTX 4090
575 (428min, 366P1 - 631max) fps
AMD Ryzen 9 7950X, NVIDIA GeForce RTX 4090
533 (379min, 335P1 - 591max) fps
AMD Ryzen 5 9600X, NVIDIA GeForce RTX 4090
507 (370min, 322P1 - 562max) fps
Intel Core i5-14600K, NVIDIA GeForce RTX 4090
463 (344min, 290P1 - 519max) fps
AMD Ryzen 7 7745HX, NVIDIA GeForce RTX 4090
461 (332min, 291P1 - 514max) fps
Intel Core i7-13700, NVIDIA GeForce RTX 4090
447 (342min, 277P1 - 503max) fps
AMD Ryzen 9 7945HX, NVIDIA GeForce RTX 4090
436 (316min, 273P1 - 499max) fps
Intel Core i7-12700, NVIDIA GeForce RTX 4090
370 (291min, 235P1 - 403max) fps
Intel Core i5-13400, NVIDIA GeForce RTX 4090
276 (223min, 175P1 - 302max) fps
Far Cry 5 - 1280x720 Low Preset AA:T
AMD Ryzen 7 7800X3D, NVIDIA GeForce RTX 4090
344 (220min - 464max) fps +1276%
AMD Ryzen 5 9600X, NVIDIA GeForce RTX 4090
263 (201min - 342max) fps +952%
Intel Core i9-14900K, NVIDIA GeForce RTX 4090
256 (194min - 336max) fps +924%
Intel Core i5-14600K, NVIDIA GeForce RTX 4090
255 (199min - 343max) fps +920%
AMD Ryzen 9 7950X, NVIDIA GeForce RTX 4090
238 (182min - 313max) fps +852%
Intel Core i7-13700, NVIDIA GeForce RTX 4090
232 (161min - 306max) fps +828%
AMD Ryzen 7 7745HX, NVIDIA GeForce RTX 4090
205 (155min - 280max) fps +720%
Intel Core i7-12700, NVIDIA GeForce RTX 4090
204 (156min - 270max) fps +716%
AMD Ryzen 9 7945HX, NVIDIA GeForce RTX 4090
191 (154min - 245max) fps +664%
Intel Core i5-13400, NVIDIA GeForce RTX 4090
185 (144min - 241max) fps +640%
25 (21min - 33max) fps
X-Plane 11.11 - 1280x720 low (fps_test=1)
Intel Core i9-14900K, NVIDIA GeForce RTX 4090
263 fps +561%
AMD Ryzen 5 9600X, NVIDIA GeForce RTX 4090
245 fps +516%
Intel Core i5-14600K, NVIDIA GeForce RTX 4090
228 fps +473%
AMD Ryzen 9 7950X, NVIDIA GeForce RTX 4090
223 fps +460%
AMD Ryzen 7 7800X3D, NVIDIA GeForce RTX 4090
219 fps +450%
Intel Core i7-13700, NVIDIA GeForce RTX 4090
218 fps +448%
AMD Ryzen 9 7945HX, NVIDIA GeForce RTX 4090
196.4 fps +393%
AMD Ryzen 7 7745HX, NVIDIA GeForce RTX 4090
195.9 fps +392%
Intel Core i7-12700, NVIDIA GeForce RTX 4090
181.4 fps +356%
Intel Core i5-13400, NVIDIA GeForce RTX 4090
155.7 fps +291%
39.8 fps
Final Fantasy XV Benchmark - 1280x720 Lite Quality
AMD Ryzen 7 7745HX, NVIDIA GeForce RTX 4090
237 fps +815%
AMD Ryzen 5 9600X, NVIDIA GeForce RTX 4090
237 fps +815%
AMD Ryzen 9 7950X, NVIDIA GeForce RTX 4090
236 fps +811%
Intel Core i7-13700, NVIDIA GeForce RTX 4090
236 fps +811%
AMD Ryzen 7 7800X3D, NVIDIA GeForce RTX 4090
236 fps +811%
Intel Core i5-14600K, NVIDIA GeForce RTX 4090
236 fps +811%
Intel Core i9-14900K, NVIDIA GeForce RTX 4090
236 fps +811%
AMD Ryzen 9 7945HX, NVIDIA GeForce RTX 4090
234 fps +803%
Intel Core i7-12700, NVIDIA GeForce RTX 4090
232 fps +796%
Intel Core i5-13400, NVIDIA GeForce RTX 4090
217 fps +738%
25.9 fps
Dota 2 Reborn - 1280x720 min (0/3) fastest
AMD Ryzen 7 7800X3D, NVIDIA GeForce RTX 4090
322.9 (268min) fps
AMD Ryzen 9 7950X, NVIDIA GeForce RTX 4090
310.6 (261.3min) fps
Intel Core i9-14900K, NVIDIA GeForce RTX 4090
292.5 (254min) fps
AMD Ryzen 5 9600X, NVIDIA GeForce RTX 4090
291 (244.2min) fps
AMD Ryzen 9 7945HX, NVIDIA GeForce RTX 4090
268.7 (228.5min) fps
Intel Core i5-14600K, NVIDIA GeForce RTX 4090
261.5 (226.3min) fps
AMD Ryzen 7 7745HX, NVIDIA GeForce RTX 4090
252 (207.9min) fps
Intel Core i7-13700, NVIDIA GeForce RTX 4090
245 (213.8min) fps
Intel Core i7-12700, NVIDIA GeForce RTX 4090
202.4 (178min) fps
Intel Core i5-13400, NVIDIA GeForce RTX 4090
182.1 (160.5min) fps
The Witcher 3 - 1024x768 Low Graphics & Postprocessing
AMD Ryzen 7 7800X3D, NVIDIA GeForce RTX 4090
858.4 fps +1829%
AMD Ryzen 9 7950X, NVIDIA GeForce RTX 4090
826 (23.6min, 360P0.1, 574P1 - 1357max) fps +1756%
Intel Core i9-14900K, NVIDIA GeForce RTX 4090
826 (25.6min, 359P0.1, 581P1 - 1348max) fps +1756%
AMD Ryzen 5 9600X, NVIDIA GeForce RTX 4090
762 (66min, 266P0.1, 520P1 - 1355max) fps +1612%
AMD Ryzen 9 7945HX, NVIDIA GeForce RTX 4090
709 (68min, 283P0.1, 492P1 - 1116max) fps +1493%
AMD Ryzen 7 7745HX, NVIDIA GeForce RTX 4090
692 (27.9min, 218P0.1, 476P1 - 1085max) fps +1455%
Intel Core i7-13700, NVIDIA GeForce RTX 4090
670.4 fps +1407%
Intel Core i5-14600K, NVIDIA GeForce RTX 4090
632 (29.4min, 209P0.1, 471P1 - 1028max) fps +1320%
Intel Core i7-12700, NVIDIA GeForce RTX 4090
522 fps +1073%
Intel Core i5-13400, NVIDIA GeForce RTX 4090
451.7 fps +915%
44.5 (8.12min, 22.4P0.1, 30.4P1 - 506max) fps
GTA V - 1024x768 Lowest Settings possible
AMD Ryzen 7 7800X3D, NVIDIA GeForce RTX 4090
188.5 fps +44%
AMD Ryzen 9 7950X, NVIDIA GeForce RTX 4090
188.2 (5.44min, 200P1 - 724max) fps +43%
AMD Ryzen 5 9600X, NVIDIA GeForce RTX 4090
188.1 (3min, 200P1 - 713max) fps +43%
Intel Core i9-14900K, NVIDIA GeForce RTX 4090
188 (2.39min, 200P1 - 739max) fps +43%
Intel Core i7-13700, NVIDIA GeForce RTX 4090
187.7 (5.01min, 200P1 - 613max) fps +43%
Intel Core i5-14600K, NVIDIA GeForce RTX 4090
187.7 (4.67min, 200P1 - 640max) fps +43%
AMD Ryzen 7 7745HX, NVIDIA GeForce RTX 4090
187.6 (6.27min, 200P1 - 666max) fps +43%
AMD Ryzen 9 7945HX, NVIDIA GeForce RTX 4090
187.6 (6.33min, 200P1 - 591max) fps +43%
Intel Core i7-12700, NVIDIA GeForce RTX 4090
187.1 (2.4min, 200P1 - 499max) fps +43%
Intel Core i5-13400, NVIDIA GeForce RTX 4090
186.8 (1.87min, 166.7P1 - 445max) fps +42%
131.2 (7.24min, 90.9P1 - 448max) fps
Borderlands 3 - 1280x720 Very Low Overall Quality (DX11)
AMD Ryzen 7 7800X3D, NVIDIA GeForce RTX 4090
310 fps +714%
Intel Core i9-14900K, NVIDIA GeForce RTX 4090
258 fps +577%
AMD Ryzen 9 7950X, NVIDIA GeForce RTX 4090
242 fps +535%
Intel Core i5-14600K, NVIDIA GeForce RTX 4090
237 fps +522%
AMD Ryzen 5 9600X, NVIDIA GeForce RTX 4090
228 fps +498%
Intel Core i7-13700, NVIDIA GeForce RTX 4090
222 fps +483%
AMD Ryzen 9 7945HX, NVIDIA GeForce RTX 4090
213 fps +459%
AMD Ryzen 7 7745HX, NVIDIA GeForce RTX 4090
203 fps +433%
Intel Core i7-12700, NVIDIA GeForce RTX 4090
185.6 fps +387%
Intel Core i5-13400, NVIDIA GeForce RTX 4090
169 fps +344%
38.1 fps
Far Cry New Dawn - 1280x720 Low Preset
AMD Ryzen 7 7800X3D, NVIDIA GeForce RTX 4090
291 (218min - 442max) fps +809%
Intel Core i9-14900K, NVIDIA GeForce RTX 4090
231 (150min - 345max) fps +622%
AMD Ryzen 5 9600X, NVIDIA GeForce RTX 4090
226 (163min - 362max) fps +606%
Intel Core i5-14600K, NVIDIA GeForce RTX 4090
216 (168min - 312max) fps +575%
Intel Core i7-13700, NVIDIA GeForce RTX 4090
203 (144min - 297max) fps +534%
AMD Ryzen 9 7950X, NVIDIA GeForce RTX 4090
200 (140min - 302max) fps +525%
Intel Core i7-12700, NVIDIA GeForce RTX 4090
174 (103min - 253max) fps +444%
AMD Ryzen 7 7745HX, NVIDIA GeForce RTX 4090
170 (123min - 265max) fps +431%
AMD Ryzen 9 7945HX, NVIDIA GeForce RTX 4090
165 (119min - 255max) fps +416%
Intel Core i5-13400, NVIDIA GeForce RTX 4090
159 (110min - 233max) fps +397%
32 (26min - 40max) fps
Shadow of the Tomb Raider - 1280x720 Lowest Preset
AMD Ryzen 7 7800X3D, NVIDIA GeForce RTX 4090
407 fps +1040%
Intel Core i9-14900K, NVIDIA GeForce RTX 4090
337 fps +844%
AMD Ryzen 9 7950X, NVIDIA GeForce RTX 4090
332 fps +830%
AMD Ryzen 5 9600X, NVIDIA GeForce RTX 4090
319 fps +794%
Intel Core i5-14600K, NVIDIA GeForce RTX 4090
281 fps +687%
AMD Ryzen 7 7745HX, NVIDIA GeForce RTX 4090
275 fps +670%
AMD Ryzen 9 7945HX, NVIDIA GeForce RTX 4090
273 fps +665%
Intel Core i7-13700, NVIDIA GeForce RTX 4090
272 fps +662%
Intel Core i7-12700, NVIDIA GeForce RTX 4090
231 fps +547%
Intel Core i5-13400, NVIDIA GeForce RTX 4090
204 fps +471%
35.7 fps
Tiny Tina's Wonderlands - 1280x720 Lowest Preset (DX12)
AMD Ryzen 7 7800X3D, NVIDIA GeForce RTX 4090
548 fps +1389%
Intel Core i9-14900K, NVIDIA GeForce RTX 4090
536 fps +1357%
AMD Ryzen 9 7950X, NVIDIA GeForce RTX 4090
459 fps +1147%
Intel Core i5-14600K, NVIDIA GeForce RTX 4090
457 fps +1142%
AMD Ryzen 5 9600X, NVIDIA GeForce RTX 4090
438 fps +1090%
AMD Ryzen 7 7745HX, NVIDIA GeForce RTX 4090
414 fps +1025%
Intel Core i7-13700, NVIDIA GeForce RTX 4090
410 fps +1014%
AMD Ryzen 9 7945HX, NVIDIA GeForce RTX 4090
382 fps +938%
Intel Core i7-12700, NVIDIA GeForce RTX 4090
342 fps +829%
Intel Core i5-13400, NVIDIA GeForce RTX 4090
299 fps +713%
36.8 fps
Strange Brigade - 1280x720 lowest AF:1
Intel Core i9-14900K, NVIDIA GeForce RTX 4090
766 (267min, 595P1 - 1030max) fps +3565%
AMD Ryzen 7 7800X3D, NVIDIA GeForce RTX 4090
760 (257min, 602P1 - 1084max) fps +3536%
AMD Ryzen 5 9600X, NVIDIA GeForce RTX 4090
735 (154.9min, 595P1 - 998max) fps +3417%
Intel Core i5-14600K, NVIDIA GeForce RTX 4090
717 (186min, 554P1 - 1036max) fps +3331%
AMD Ryzen 9 7950X, NVIDIA GeForce RTX 4090
698 (182.7min, 569P1 - 937max) fps +3240%
AMD Ryzen 7 7745HX, NVIDIA GeForce RTX 4090
676 (174.6min, 524P1 - 975max) fps +3134%
Intel Core i7-13700, NVIDIA GeForce RTX 4090
626 (284min, 497P1 - 830max) fps +2895%
AMD Ryzen 9 7945HX, NVIDIA GeForce RTX 4090
592 (145.4min, 461P1 - 800max) fps +2733%
Intel Core i7-12700, NVIDIA GeForce RTX 4090
523 (243min, 410P1 - 698max) fps +2402%
Intel Core i5-13400, NVIDIA GeForce RTX 4090
408 (153.5min, 319P1 - 565max) fps +1852%
20.9 (18.4min, 19.1P1 - 24.8max) fps
Metro Exodus - 1280x720 Low Quality AF:4x
AMD Ryzen 7 7800X3D, NVIDIA GeForce RTX 4090
374 (214.41min - 571.76max) fps +1390%
AMD Ryzen 5 9600X, NVIDIA GeForce RTX 4090
349 (182.25min - 551.57max) fps +1290%
Intel Core i9-14900K, NVIDIA GeForce RTX 4090
318 (165.98min - 520.02max) fps +1167%
AMD Ryzen 9 7950X, NVIDIA GeForce RTX 4090
300 (162.95min - 476.42max) fps +1095%
Intel Core i5-14600K, NVIDIA GeForce RTX 4090
296 (170.68min - 455.17max) fps +1079%
AMD Ryzen 7 7745HX, NVIDIA GeForce RTX 4090
287 (154.34min - 426.99max) fps +1043%
AMD Ryzen 9 7945HX, NVIDIA GeForce RTX 4090
270 (148.35min - 431.03max) fps +976%
Intel Core i7-13700, NVIDIA GeForce RTX 4090
268 (127.73min - 445.04max) fps +968%
Intel Core i7-12700, NVIDIA GeForce RTX 4090
233 (124.52min - 364.56max) fps +828%
Intel Core i5-13400, NVIDIA GeForce RTX 4090
196.9 (110.05min - 286.04max) fps +684%
25.1 (15.39min - 37.85max) fps
F1 2020 - 1280x720 Ultra Low Preset
AMD Ryzen 7 7800X3D, NVIDIA GeForce RTX 4090
681 (531min - 769max) fps
AMD Ryzen 5 9600X, NVIDIA GeForce RTX 4090
630 (468min - 710max) fps
Intel Core i9-14900K, NVIDIA GeForce RTX 4090
584 (467min - 677max) fps
AMD Ryzen 9 7950X, NVIDIA GeForce RTX 4090
563 (437min - 628max) fps
AMD Ryzen 7 7745HX, NVIDIA GeForce RTX 4090
529 (400min - 599max) fps
AMD Ryzen 9 7945HX, NVIDIA GeForce RTX 4090
470 (364min - 522max) fps
Intel Core i7-13700, NVIDIA GeForce RTX 4090
461 (323min - 528max) fps
Intel Core i5-14600K, NVIDIA GeForce RTX 4090
403 (333min - 436max) fps
Intel Core i7-12700, NVIDIA GeForce RTX 4090
388 (314min - 434max) fps
Intel Core i5-13400, NVIDIA GeForce RTX 4090
292 (253min - 317max) fps
F1 2021 - 1280x720 Ultra Low Preset
AMD Ryzen 7 7800X3D, NVIDIA GeForce RTX 4090
830 (632min, 515P1 - 919max) fps
Intel Core i9-14900K, NVIDIA GeForce RTX 4090
720 (552min, 445P1 - 791max) fps
AMD Ryzen 9 7950X, NVIDIA GeForce RTX 4090
677 (504min, 418P1 - 754max) fps
AMD Ryzen 5 9600X, NVIDIA GeForce RTX 4090
669 (451min, 412P1 - 741max) fps
AMD Ryzen 7 7745HX, NVIDIA GeForce RTX 4090
589 (432min, 369P1 - 647max) fps
Intel Core i7-13700, NVIDIA GeForce RTX 4090
572 (447min, 359P1 - 620max) fps
Intel Core i5-14600K, NVIDIA GeForce RTX 4090
562 (468min, 364P1 - 618max) fps
AMD Ryzen 9 7945HX, NVIDIA GeForce RTX 4090
562 (420min, 351P1 - 627max) fps
Intel Core i7-12700, NVIDIA GeForce RTX 4090
448 (363min, 297P1 - 477max) fps
Intel Core i5-13400, NVIDIA GeForce RTX 4090
337 (277min, 237P1 - 358max) fps

Performance comparison at GPU limit at 2,160p

Performance Rating - Percent
AMD Ryzen 7 7800X3D, NVIDIA GeForce RTX 4090
99.2 pt
Intel Core i9-14900K, NVIDIA GeForce RTX 4090 -1!
97.5 pt
Intel Core i5-14600K, NVIDIA GeForce RTX 4090
96.5 pt
AMD Ryzen 9 7950X, NVIDIA GeForce RTX 4090
95.6 pt
AMD Ryzen 5 9600X, NVIDIA GeForce RTX 4090
95.2 pt
Intel Core i7-13700, NVIDIA GeForce RTX 4090
93.6 pt
AMD Ryzen 7 7745HX, NVIDIA GeForce RTX 4090
92.4 pt
AMD Ryzen 9 7945HX, NVIDIA GeForce RTX 4090
92.1 pt
Intel Core i7-12700, NVIDIA GeForce RTX 4090
89.7 pt
Intel Core i5-13400, NVIDIA GeForce RTX 4090
85.3 pt
F1 22 - 3840x2160 Ultra High Preset AA:T AF:16x
AMD Ryzen 5 9600X, NVIDIA GeForce RTX 4090
85 (73min, 72P1 - 99max) fps
AMD Ryzen 9 7945HX, NVIDIA GeForce RTX 4090
85 (60min, 65P1 - 98max) fps
AMD Ryzen 7 7745HX, NVIDIA GeForce RTX 4090
84.9 (73min, 72P1 - 98max) fps
AMD Ryzen 7 7800X3D, NVIDIA GeForce RTX 4090
84.5 (72min, 71P1 - 97max) fps
Intel Core i9-14900K, NVIDIA GeForce RTX 4090
83.8 (73min, 72P1 - 96max) fps
Intel Core i5-14600K, NVIDIA GeForce RTX 4090
83.5 (72min, 71P1 - 96max) fps
AMD Ryzen 9 7950X, NVIDIA GeForce RTX 4090
82.5 (72min, 71P1 - 96max) fps
Intel Core i7-13700, NVIDIA GeForce RTX 4090
81.6 (71min, 70P1 - 93max) fps
Intel Core i7-12700, NVIDIA GeForce RTX 4090
81.3 (71min, 68P1 - 93max) fps
Intel Core i5-13400, NVIDIA GeForce RTX 4090
81.2 (72min, 67P1 - 93max) fps
Far Cry 5 - 3840x2160 Ultra Preset AA:T
AMD Ryzen 7 7800X3D, NVIDIA GeForce RTX 4090
187 (166min - 215max) fps
Intel Core i5-14600K, NVIDIA GeForce RTX 4090
181 (151min - 215max) fps
Intel Core i9-14900K, NVIDIA GeForce RTX 4090
181 (150min - 215max) fps
AMD Ryzen 9 7950X, NVIDIA GeForce RTX 4090
175 (140min - 212max) fps
Intel Core i7-13700, NVIDIA GeForce RTX 4090
171 (140min - 207max) fps
AMD Ryzen 5 9600X, NVIDIA GeForce RTX 4090
170 (136min - 198max) fps
Intel Core i7-12700, NVIDIA GeForce RTX 4090
153 (117min - 203max) fps
AMD Ryzen 7 7745HX, NVIDIA GeForce RTX 4090
152 (115min - 207max) fps
AMD Ryzen 9 7945HX, NVIDIA GeForce RTX 4090
146 (112min - 198max) fps
Intel Core i5-13400, NVIDIA GeForce RTX 4090
142 (108min - 190max) fps
Final Fantasy XV Benchmark - 3840x2160 High Quality
Intel Core i9-14900K, NVIDIA GeForce RTX 4090
161.9 fps
Intel Core i5-14600K, NVIDIA GeForce RTX 4090
161.5 fps
AMD Ryzen 9 7950X, NVIDIA GeForce RTX 4090
161.1 fps
AMD Ryzen 7 7745HX, NVIDIA GeForce RTX 4090
160.2 fps
AMD Ryzen 7 7800X3D, NVIDIA GeForce RTX 4090
158.2 fps
Intel Core i7-13700, NVIDIA GeForce RTX 4090
157.9 fps
Intel Core i7-12700, NVIDIA GeForce RTX 4090
153.4 fps
AMD Ryzen 9 7945HX, NVIDIA GeForce RTX 4090
152 fps
AMD Ryzen 5 9600X, NVIDIA GeForce RTX 4090
150.9 fps
Intel Core i5-13400, NVIDIA GeForce RTX 4090
149.8 fps
Dota 2 Reborn - 3840x2160 ultra (3/3) best looking
AMD Ryzen 7 7800X3D, NVIDIA GeForce RTX 4090
258.2 (201.3min) fps
AMD Ryzen 9 7950X, NVIDIA GeForce RTX 4090
234.4 (192.2min) fps
Intel Core i9-14900K, NVIDIA GeForce RTX 4090
228.7 (190.7min) fps
AMD Ryzen 5 9600X, NVIDIA GeForce RTX 4090
225 (189.1min) fps
Intel Core i5-14600K, NVIDIA GeForce RTX 4090
211.5 (179.5min) fps
Intel Core i7-13700, NVIDIA GeForce RTX 4090
196.8 (166.7min) fps
AMD Ryzen 9 7945HX, NVIDIA GeForce RTX 4090
196.7 (164.3min) fps
AMD Ryzen 7 7745HX, NVIDIA GeForce RTX 4090
192.8 (156.7min) fps
Intel Core i7-12700, NVIDIA GeForce RTX 4090
163.7 (141.2min) fps
Intel Core i5-13400, NVIDIA GeForce RTX 4090
149.8 (129.3min) fps
The Witcher 3 - 3840x2160 High Graphics & Postprocessing (Nvidia HairWorks Off)
AMD Ryzen 9 7945HX, NVIDIA GeForce RTX 4090
292 (41.8min, 168.4P0.1, 232P1 - 689max) fps
Intel Core i5-14600K, NVIDIA GeForce RTX 4090
288 (85.6min, 166.1P0.1, 233P1 - 721max) fps
AMD Ryzen 9 7950X, NVIDIA GeForce RTX 4090
284 (88.3min, 166.6P0.1, 240P1 - 831max) fps
Intel Core i5-13400, NVIDIA GeForce RTX 4090
282.2 fps
Intel Core i7-13700, NVIDIA GeForce RTX 4090
282.1 fps
Intel Core i7-12700, NVIDIA GeForce RTX 4090
282 fps
AMD Ryzen 7 7800X3D, NVIDIA GeForce RTX 4090
281 fps
AMD Ryzen 7 7745HX, NVIDIA GeForce RTX 4090
277 (60.5min, 160.4P0.1, 218P1 - 675max) fps
AMD Ryzen 5 9600X, NVIDIA GeForce RTX 4090
277 (20.2min, 154.7P0.1, 219P1 - 925max) fps
GTA V - 3840x2160 Highest Settings possible AA:4xMSAA + FX AF:16x
AMD Ryzen 7 7800X3D, NVIDIA GeForce RTX 4090
146.2 (8.5min, 90.9P1 - 331max) fps
Intel Core i9-14900K, NVIDIA GeForce RTX 4090
145 (6.06min, 100P1 - 295max) fps
Intel Core i5-14600K, NVIDIA GeForce RTX 4090
141.9 (11.7min, 100P1 - 301max) fps
AMD Ryzen 5 9600X, NVIDIA GeForce RTX 4090
140.8 (8.91min, 90.9P1 - 270max) fps
AMD Ryzen 9 7950X, NVIDIA GeForce RTX 4090
138 (8.49min, 90.9P1 - 306max) fps
Intel Core i7-13700, NVIDIA GeForce RTX 4090
133.3 (8.35min, 90.9P1 - 273max) fps
AMD Ryzen 7 7745HX, NVIDIA GeForce RTX 4090
133 (6.57min, 90.9P1 - 255max) fps
AMD Ryzen 9 7945HX, NVIDIA GeForce RTX 4090
130.6 (8.29min, 90.9P1 - 245max) fps
Intel Core i7-12700, NVIDIA GeForce RTX 4090
126.9 (5min, 90.9P1 - 249max) fps
Intel Core i5-13400, NVIDIA GeForce RTX 4090
122.2 (8.01min, 90.9P1 - 227max) fps
Borderlands 3 - 3840x2160 Badass Overall Quality (DX11)
Intel Core i9-14900K, NVIDIA GeForce RTX 4090
137.9 fps
AMD Ryzen 7 7800X3D, NVIDIA GeForce RTX 4090
137.4 fps
Intel Core i5-14600K, NVIDIA GeForce RTX 4090
136.1 fps
AMD Ryzen 9 7950X, NVIDIA GeForce RTX 4090
135 fps
AMD Ryzen 9 7945HX, NVIDIA GeForce RTX 4090
134.1 fps
Intel Core i7-13700, NVIDIA GeForce RTX 4090
132.4 fps
AMD Ryzen 5 9600X, NVIDIA GeForce RTX 4090
131.8 fps
AMD Ryzen 7 7745HX, NVIDIA GeForce RTX 4090
127.9 fps
Intel Core i7-12700, NVIDIA GeForce RTX 4090
125.5 fps
Intel Core i5-13400, NVIDIA GeForce RTX 4090
120.5 fps
Far Cry New Dawn - 3840x2160 Ultra Preset
AMD Ryzen 7 7800X3D, NVIDIA GeForce RTX 4090
180 (147min - 219max) fps
Intel Core i9-14900K, NVIDIA GeForce RTX 4090
159 (120min - 220max) fps
Intel Core i5-14600K, NVIDIA GeForce RTX 4090
153 (115min - 219max) fps
AMD Ryzen 5 9600X, NVIDIA GeForce RTX 4090
148 (110min - 200max) fps
AMD Ryzen 9 7950X, NVIDIA GeForce RTX 4090
145 (104min - 215max) fps
Intel Core i7-13700, NVIDIA GeForce RTX 4090
145 (106min - 212max) fps
Intel Core i7-12700, NVIDIA GeForce RTX 4090
127 (92min - 198max) fps
AMD Ryzen 7 7745HX, NVIDIA GeForce RTX 4090
124 (84min - 203max) fps
AMD Ryzen 9 7945HX, NVIDIA GeForce RTX 4090
123 (85min - 195max) fps
Intel Core i5-13400, NVIDIA GeForce RTX 4090
119 (88min - 182max) fps
Shadow of the Tomb Raider - 3840x2160 Highest Preset AA:T
Intel Core i5-14600K, NVIDIA GeForce RTX 4090
188.8 fps
Intel Core i9-14900K, NVIDIA GeForce RTX 4090
188.2 fps
AMD Ryzen 5 9600X, NVIDIA GeForce RTX 4090
188.1 fps
AMD Ryzen 7 7800X3D, NVIDIA GeForce RTX 4090
187.7 fps
Intel Core i7-13700, NVIDIA GeForce RTX 4090
187.6 fps
AMD Ryzen 9 7945HX, NVIDIA GeForce RTX 4090
186.8 fps
AMD Ryzen 7 7745HX, NVIDIA GeForce RTX 4090
186.4 fps
AMD Ryzen 9 7950X, NVIDIA GeForce RTX 4090
186 fps
Intel Core i7-12700, NVIDIA GeForce RTX 4090
184.5 fps
Intel Core i5-13400, NVIDIA GeForce RTX 4090
173.1 fps
Tiny Tina's Wonderlands - 3840x2160 Badass Preset (DX12)
Intel Core i9-14900K, NVIDIA GeForce RTX 4090
131.6 fps
AMD Ryzen 7 7745HX, NVIDIA GeForce RTX 4090
130.8 fps
Intel Core i5-14600K, NVIDIA GeForce RTX 4090
130.4 fps
AMD Ryzen 9 7950X, NVIDIA GeForce RTX 4090
130.3 fps
Intel Core i7-13700, NVIDIA GeForce RTX 4090
130.2 fps
AMD Ryzen 5 9600X, NVIDIA GeForce RTX 4090
130 fps
AMD Ryzen 7 7800X3D, NVIDIA GeForce RTX 4090
129.8 fps
AMD Ryzen 9 7945HX, NVIDIA GeForce RTX 4090
129.8 fps
Intel Core i7-12700, NVIDIA GeForce RTX 4090
129.7 fps
Intel Core i5-13400, NVIDIA GeForce RTX 4090
129.7 fps
Strange Brigade - 3840x2160 ultra AA:ultra AF:16
Intel Core i9-14900K, NVIDIA GeForce RTX 4090
291 (43.8min, 249P1 - 489max) fps
AMD Ryzen 7 7800X3D, NVIDIA GeForce RTX 4090
289 (119.3min, 246P1 - 463max) fps
Intel Core i5-14600K, NVIDIA GeForce RTX 4090
289 (243min, 249P1 - 426max) fps
AMD Ryzen 9 7945HX, NVIDIA GeForce RTX 4090
289 (68.9min, 245P1 - 450max) fps
AMD Ryzen 7 7745HX, NVIDIA GeForce RTX 4090
287 (131.6min, 246P1 - 435max) fps
AMD Ryzen 5 9600X, NVIDIA GeForce RTX 4090
286 (37.1min, 244P1 - 520max) fps
Intel Core i7-12700, NVIDIA GeForce RTX 4090
284 (44.1min, 236P1 - 407max) fps
Intel Core i7-13700, NVIDIA GeForce RTX 4090
282 (28.1min, 238P1 - 533max) fps
AMD Ryzen 9 7950X, NVIDIA GeForce RTX 4090
281 (31.7min, 239P1 - 482max) fps
Intel Core i5-13400, NVIDIA GeForce RTX 4090
278 (59.8min, 227P1 - 408max) fps
Metro Exodus - 3840x2160 Ultra Quality AF:16x
Intel Core i9-14900K, NVIDIA GeForce RTX 4090
142.9 (82.83min - 229.52max) fps
Intel Core i5-14600K, NVIDIA GeForce RTX 4090
142.1 (81.45min - 230.73max) fps
AMD Ryzen 7 7800X3D, NVIDIA GeForce RTX 4090
141.6 (85.41min - 213.31max) fps
AMD Ryzen 9 7950X, NVIDIA GeForce RTX 4090
139.7 (76.95min - 229.15max) fps
AMD Ryzen 5 9600X, NVIDIA GeForce RTX 4090
138 (71.03min - 235.4max) fps
Intel Core i7-13700, NVIDIA GeForce RTX 4090
136.9 (71.43min - 234.36max) fps
AMD Ryzen 7 7745HX, NVIDIA GeForce RTX 4090
135.8 (71.78min - 226.91max) fps
AMD Ryzen 9 7945HX, NVIDIA GeForce RTX 4090
133.7 (72.8min - 223.61max) fps
Intel Core i7-12700, NVIDIA GeForce RTX 4090
132.4 (68.05min - 211.86max) fps
Intel Core i5-13400, NVIDIA GeForce RTX 4090
126.7 (68.66min - 196.97max) fps
F1 2020 - 3840x2160 Ultra High Preset AA:T AF:16x
AMD Ryzen 7 7800X3D, NVIDIA GeForce RTX 4090
288 (242min - 333max) fps
Intel Core i5-14600K, NVIDIA GeForce RTX 4090
288 (242min - 338max) fps
AMD Ryzen 7 7745HX, NVIDIA GeForce RTX 4090
287 (245min - 337max) fps
AMD Ryzen 5 9600X, NVIDIA GeForce RTX 4090
287 (243min - 337max) fps
AMD Ryzen 9 7950X, NVIDIA GeForce RTX 4090
286 (245min - 335max) fps
Intel Core i9-14900K, NVIDIA GeForce RTX 4090
286 (243min - 338max) fps
Intel Core i7-13700, NVIDIA GeForce RTX 4090
283 (240min - 332max) fps
AMD Ryzen 9 7945HX, NVIDIA GeForce RTX 4090
283 (239min - 331max) fps
Intel Core i7-12700, NVIDIA GeForce RTX 4090
275 (197min - 319max) fps
Intel Core i5-13400, NVIDIA GeForce RTX 4090
229 (184min - 265max) fps
F1 2021 - 3840x2160 Ultra High Preset + Raytracing AA:T AF:16x
AMD Ryzen 7 7800X3D, NVIDIA GeForce RTX 4090
207 (179min, 176P1 - 230max) fps
AMD Ryzen 7 7745HX, NVIDIA GeForce RTX 4090
207 (175min, 170P1 - 231max) fps
AMD Ryzen 5 9600X, NVIDIA GeForce RTX 4090
205 (176min, 168P1 - 232max) fps
AMD Ryzen 9 7945HX, NVIDIA GeForce RTX 4090
203 (170min, 156P1 - 223max) fps
Intel Core i5-14600K, NVIDIA GeForce RTX 4090
201 (173min, 153P1 - 227max) fps
Intel Core i9-14900K, NVIDIA GeForce RTX 4090
201 (173min, 158P1 - 226max) fps
AMD Ryzen 9 7950X, NVIDIA GeForce RTX 4090
199.1 (168min, 166P1 - 223max) fps
Intel Core i7-13700, NVIDIA GeForce RTX 4090
196.8 (166min, 156P1 - 217max) fps
Intel Core i7-12700, NVIDIA GeForce RTX 4090
193.1 (162min, 137P1 - 211max) fps
Intel Core i5-13400, NVIDIA GeForce RTX 4090
176.2 (144min, 127P1 - 189max) fps
lowmed.highultraQHD4K
GTA V (2015) 187.6 187.3 183 141 140.5 183.6
The Witcher 3 (2015) 709 618 563 310 272 292
Dota 2 Reborn (2015) 268.7 234.8 221.4 202.6 196.7
Final Fantasy XV Benchmark (2018) 234 234 213 208 152
X-Plane 11.11 (2018) 196.4 169.4 127.6 105.9
Far Cry 5 (2018) 191 168 163 151 151 146
Strange Brigade (2018) 592 470 465 463 461 289
Shadow of the Tomb Raider (2018) 273 266 264 263 252 186.8
Far Cry New Dawn (2019) 165 142 139 124 129 123
Metro Exodus (2019) 270 243 210 183.2 167.7 133.7
Borderlands 3 (2019) 213 189.6 175.5 165.6 163.2 134.1
F1 2020 (2020) 470 390 379 359 354 283
F1 2021 (2021) 562 533 455 220 222 203
Tiny Tina's Wonderlands (2022) 365 308 269 258 222 129.8
F1 22 (2022) 382 366 339 170 159.4 85
F1 23 (2023) 368 390 373 164.3 147.9 80.9
Cyberpunk 2077 2.1 Phantom Liberty (2023) 186 183.2 177.4 163.9 151.4 75.3
Assassin's Creed Mirage (2023) 250 244 236 167 163 128
Avatar Frontiers of Pandora (2023) 232 212 202 170 126 70
F1 24 (2024) 350 371 345 176.7 146.3 80

功耗和温度

Minisforum 提供的 BD790i 主板预装了热管冷却装置,用于冷却主板上的处理器和电压转换器。风扇的选择由用户决定,必须自行安装。安装 120 毫米风扇所需的相应安装材料随附其中。我们选择了 Noctua NF-A12x25 风扇,我们在测试 Minisforum BD770i 时已经使用过该风扇。与传统台式电脑相比,Minisforum BD790i 的最大优势是功耗低。在 Cinebench R15 多重测试中,我们测得的功耗仅为 140 瓦左右,相对于它的性能而言,这是非常高的效率。

关于其整体运行和运行时的噪音水平,我们只能说,在我们的测试设置中,内置电源装置是可以听到的。无论是在空闲模式还是在负载情况下,我们都无法测量到任何会受到已安装电源装置影响的数据。在封闭的机箱内,CPU 风扇和预装的固态硬盘散热风扇都听不到声音。散热效果非常好,我们没有记录到负载情况下的任何临界值。尽管如此,我们认为将 CPU 和 VRM 冷却器分开,以便为处理器本身安装冷却解决方案是有意义的。采用 AiO 解决方案肯定能更有效地冷却 SoC。

与知名主板制造商相比,Minisforum BD790i 主板 BIOS 中的设置选项非常有限。处理器的功耗可以更改,但风扇曲线不能单独调整。如果 Minisforum 继续覆盖这一市场,我们将非常欢迎更加人性化的选项。

压力测试 Prime95,单人
压力测试 Prime95,单人
压力测试 FurMark,独奏
压力测试 FurMark,独奏
压力测试 Prime95 + FurMark

Efficiency overview

Performance Rating - Percent
Minisforum BD790i
AMD Ryzen 9 7945HX, Radeon 610M
93.8 pt
Minisforum BD770i
AMD Ryzen 7 7745HX, Radeon 610M
85.5 pt
Power Consumption
Cinebench R23 Multi Power Efficiency - external Monitor
Minisforum BD790i
AMD Ryzen 9 7945HX, Radeon 610M
237 Points per Watt
Minisforum BD770i
AMD Ryzen 7 7745HX, Radeon 610M
224 Points per Watt -5%
Cinebench R23 Single Power Efficiency - external Monitor
Minisforum BD770i
AMD Ryzen 7 7745HX, Radeon 610M
41.8 Points per Watt +23%
Minisforum BD790i
AMD Ryzen 9 7945HX, Radeon 610M
34 Points per Watt
Cinebench R15 Multi Efficiency (external Monitor)
Minisforum BD790i
AMD Ryzen 9 7945HX, Radeon 610M
38 Points per Watt
Minisforum BD770i
AMD Ryzen 7 7745HX, Radeon 610M
23.5 Points per Watt -38%
Power Consumption / Cinebench R15 Multi (external Monitor)
Intel Core i9-14900K
548 (545min, 545P1 - 551max) Watt * -294%
Intel Core i9-13900K
480 (263min, 277P1 - 553max) Watt * -245%
AMD Ryzen 9 7950X (Idle: 95.2 W)
364 (357min, 357P1 - 373max) Watt * -162%
Intel Core i7-13700K
357 (356min, 356P1 - 362max) Watt * -157%
Intel Core i5-14600K
329 (323min, 324P1 - 331max) Watt * -137%
Intel Core i5-13600K
286 (232min, 235P1 - 343max) Watt * -106%
Intel Core i7-12700
284 (282min, 282P1 - 287max) Watt * -104%
AMD Ryzen 9 7950X3D
273 (264min, 264P1 - 304max) Watt * -96%
AMD Ryzen 7 7800X3D
207 (203min, 203P1 - 216max) Watt * -49%
Intel Core i5-13400
196.6 (194.6min, 194.6P1 - 207max) Watt * -41%
Intel Core i5-12400F
194.4 (192.3min, 192.3P1 - 200max) Watt * -40%
AMD Ryzen 9 7945HX
139.1 (131.4min, 132P1 - 140.9max) Watt *
AMD Ryzen 7 7745HX
127.5 (126.9min, 126.9P1 - 127.9max) Watt * +8%
Power Consumption / Prime95 V2810 Stress (external Monitor)
Intel Core i9-14900K
537 (508min, 510P1 - 606max) Watt * -270%
Intel Core i9-13900K
471 (414min, 427P1 - 561max) Watt * -224%
Intel Core i5-14600K
370 (349min, 349P1 - 422max) Watt * -155%
Intel Core i7-13700K
357 (341min, 342P1 - 458max) Watt * -146%
Intel Core i5-13600K
348 (283min, 288P1 - 496max) Watt * -140%
AMD Ryzen 9 7950X (Idle: 95.2 W)
335 (311min, 312P1 - 364max) Watt * -131%
Intel Core i7-12700
327 (304min, 305P1 - 394max) Watt * -125%
AMD Ryzen 9 7950X3D
276 (267min, 267P1 - 329max) Watt * -90%
Intel Core i5-12400F
239 (225min, 226P1 - 252max) Watt * -65%
Intel Core i5-13400
229 (224min, 224P1 - 247max) Watt * -58%
AMD Ryzen 7 7800X3D
218 (214min, 215P1 - 223max) Watt * -50%
AMD Ryzen 9 7945HX
145.2 (140.8min, 141.7P1 - 151.2max) Watt *
AMD Ryzen 7 7745HX
130.1 (125.2min, 125.3P1 - 132.3max) Watt * +10%
Power Consumption / Cinebench R23 Multi (external Monitor)
Intel Core i9-14900K
531 (470min, 479P1 - 573max) Watt * -277%
AMD Ryzen 9 7950X (95.2)
353 (346min, 347P1 - 362max) Watt * -150%
Intel Core i5-14600K
332 (329min, 329P1 - 336max) Watt * -135%
AMD Ryzen 9 7950X3D
289 (287min, 287P1 - 290max) Watt * -105%
AMD Ryzen 7 7800X3D
203 (202min, 202P1 - 204max) Watt * -44%
AMD Ryzen 9 7945HX
141 (140.6min, 140.6P1 - 141.7max) Watt *
AMD Ryzen 7 7745HX
84.1 (81.1min, 81.5P1 - 88.8max) Watt * +40%
Power Consumption / Cinebench R23 Single (external Monitor)
AMD Ryzen 7 7800X3D
190.8 (180min, 184.6P1 - 261max) Watt * -234%
AMD Ryzen 9 7950X (95.2)
153.9 (148.8min, 149.8P1 - 179.2max) Watt * -169%
Intel Core i9-14900K
151.5 (145.4min, 146.4P1 - 205max) Watt * -165%
Intel Core i5-14600K
149.7 (143.8min, 144.7P1 - 227max) Watt * -162%
AMD Ryzen 9 7945HX
57.2 (50.9min, 52.3P1 - 68max) Watt *
AMD Ryzen 7 7745HX
44.4 (42.7min, 43P1 - 64max) Watt * +22%
Power Consumption / Cinebench R15 Multi Efficiency (external Monitor)
AMD Ryzen 9 7945HX
38 Points per Watt
AMD Ryzen 7 7745HX
23.5 Points per Watt -38%
AMD Ryzen 9 7950X3D
21.9 Points per Watt -42%
AMD Ryzen 9 7950X
17.1 Points per Watt -55%
AMD Ryzen 7 7800X3D
14.4 Points per Watt -62%
Intel Core i9-13900K
12.9 Points per Watt -66%
Intel Core i5-13600K
12.7 Points per Watt -67%
Intel Core i9-14900K
11.5 Points per Watt -70%
Intel Core i5-14600K
11.1 Points per Watt -71%

* ... smaller is better

Power consumption with and without dedicated graphics card

0102030405060708090100110120130140150Tooltip
Minisforum BD790i; Prime95 V2810 Stress (external Monitor): Ø145.2 (140.8-151.2)
Minisforum BD790i; Cinebench R15 Multi (external Monitor): Ø139.1 (131.4-140.9)
Minisforum BD790i; 1280x720 FurMark 1.19 GPU Stress Test (external Monitor): Ø79.9 (72.2-98.6)
Minisforum BD790i; 1920x1080 The Witcher 3 ultra (external Monitor): Ø69 (64.1-104.3)
Minisforum BD790i; Idle 1min (external Monitor): Ø28.9 (27.2-32.8)
Minisforum BD790i; Cinebench R23 Multi (external Monitor): Ø141 (140.6-141.7)
Minisforum BD790i; Cinebench R23 Single (external Monitor): Ø57.2 (50.9-68)
Minisforum BD790i; 3DMark06 Return To Proxycon: Ø76.6 (73.3-90.5)
Minisforum BD790i; Cyberpunk 2077 FHD ultra no FSR - external Monitor: Ø81.2 (71.4-107.1)

Power consumption with Nvidia GeForce RTX 4090

0306090120150180210240270300330360390420450480510540Tooltip
Minisforum BD790i, RTX 4090; 1280x720 FurMark 1.19 GPU Stress Test (external Monitor): Ø534 (520-560)
Minisforum BD790i, RTX 4090; 1920x1080 The Witcher 3 ultra (external Monitor): Ø487 (475-502)
Minisforum BD790i, RTX 4090; Idle 1min (external Monitor): Ø68.7 (67.5-72.1)
Minisforum BD790i, RTX 4090; 3DMark06 Return To Proxycon: Ø147.6 (134.1-200)
Minisforum BD790i, RTX 4090; Cyberpunk 2077 FHD ultra no FSR - external Monitor: Ø457 (446-468)

Pros

+ AMD Ryzen 9 7945HX(16 核、32 线程)
+ 支持 PCIe 5.0 固态硬盘和图形处理器
+ 处理器比较容易冷却
+ SoC 拥有极高的效率
+ 标准 Mini-ITX 格式
+ 静音主动式固态硬盘冷却器

Cons

- 处理器固定不动
- iGPU 性能较弱
- 供货范围不包括风扇
- 不支持其他冷却装置
- BIOS 选项有限
- 没有用于风扇控制的制造商软件
- 只能安装两个固态硬盘,没有 SATA 接口

结论 - 功能强大的 AMD Ryzen 9 7945HX

Minisforum BD790i 评论:Minisforum 提供的测试样品

Minisforum BD790i 是一款功能非常强大的主板,包含一个 SoC,作为 Mini-ITX 主板,它为构建小型系统提供了完美的基础。由于这只是一块主板,制造商将目标客户定位为愿意自己构建系统的用户。与现成的迷你 PC 不同,您仍需考虑其他组件。不言而喻,这会产生额外的成本。

Minisforum BD790i 与 AMD Ryzen 9 7945HX 结合使用,不仅性能出众、效率极高,而且由于支持 PCIe-5.0,还为显卡和固态硬盘提供了良好的未来保障。

根据我们对 Minisforum BD790i 本身的测试,我们可以说 AMD Ryzen 9 7945HX 是一款非常强大的处理器,目前可以轻松处理所有任务。与英特尔酷睿 i9-14900K 或 AMD Ryzen 9 7950X 相比,AMD Ryzen 9 7945HX 不得不认输--尽管性能上的差距非常微小。在功耗方面,传统台式机处理器已经跟不上了。在效率方面,在传统主板上采用笔记本电脑技术是一个明智的决定。不过,最大的缺点是不能简单地更换 SoC。此外,你只能使用固定的冷却装置,这意味着你不能使用其他冷却装置。

乍一看,它目前略低于 500 美元的价格似乎很高。不过,在比较性能值时,AMD Ryzen 9 7945HX 当然不需要躲在最快的台式机处理器后面。因此,我们认为它目前的价格是合理的,如果你以后不想升级 CPU,可以毫不犹豫地购买。

价格和供应情况

在撰写本文时,您可以从亚马逊以479.99 美元的价格购买 Minisforum BD790i。

Transparency

The selection of devices to be reviewed is made by our editorial team. The test sample was given to the author by the manufacturer free of charge for the purposes of review. There was no third-party influence on this review, nor did the manufacturer receive a copy of this review before publication. There was no obligation to publish this review. We never accept compensation or payment in return for our reviews. As an independent media company, Notebookcheck is not subjected to the authority of manufacturers, retailers or publishers.

This is how Notebookcheck is testing

Every year, Notebookcheck independently reviews hundreds of laptops and smartphones using standardized procedures to ensure that all results are comparable. We have continuously developed our test methods for around 20 years and set industry standards in the process. In our test labs, high-quality measuring equipment is utilized by experienced technicians and editors. These tests involve a multi-stage validation process. Our complex rating system is based on hundreds of well-founded measurements and benchmarks, which maintains objectivity. Further information on our test methods can be found here.

Please share our article, every link counts!
Mail Logo
> Notebookcheck中文版(NBC中国) > 评测 > Minisforum BD790i 评测:配备 AMD Ryzen 9 7945HX 和 PCIe 5.0 的 Mini-ITX 主板是小型游戏 PC 的基础
Sebastian Bade, 2024-10- 5 (Update: 2024-10- 5)