

XMG Pro 16 Studio (Mid 24) 评测:面向游戏玩家和创作者的酷睿 i9 和 RTX 4070
造物主的喜悦?
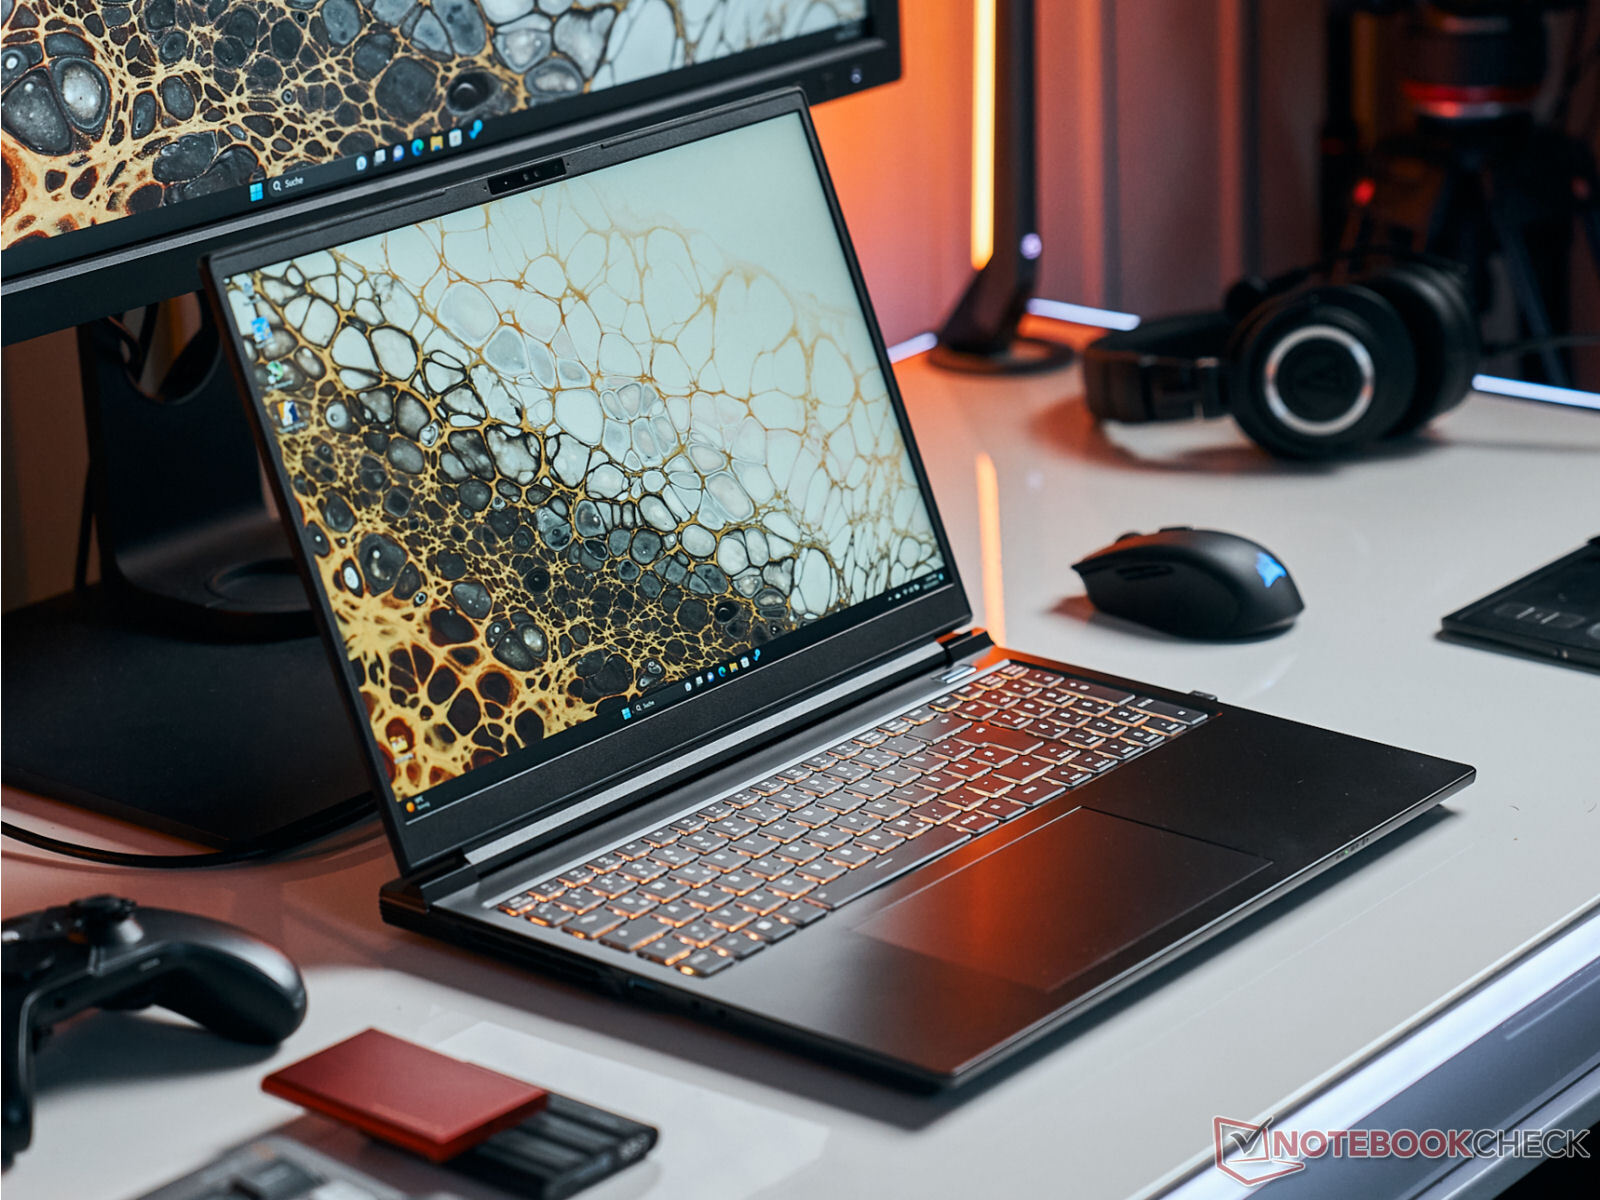
内容创作者和游戏玩家是 XMG Pro 16 Studio 的目标市场:申克提供的产品包括酷睿 i9 处理器、RTX 4070、雷电 4 端口和 16:10 显示屏(QHD+、240Hz、sRGB)。据称,通过使用 Vapor Chamber,可以确保良好的散热效果。Sascha Mölck, 👁 Florian Glaser (translated by DeepL / Ninh Duy) Published 🇺🇸 🇩🇪 ...
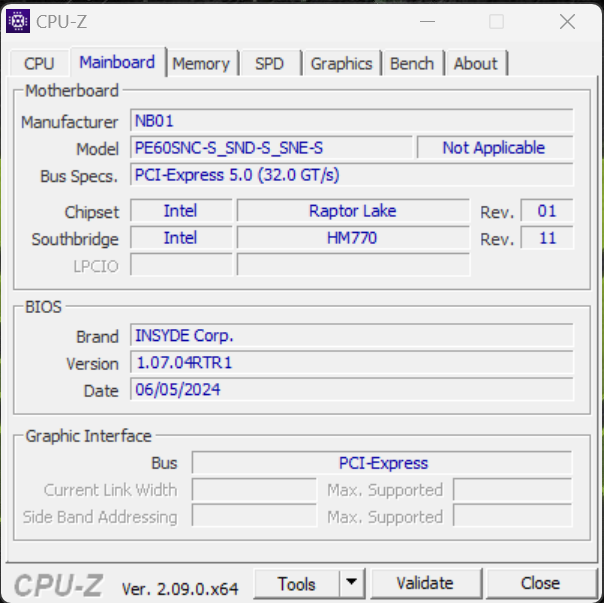
XMG Pro 16 Studio(Mid 24)面向游戏玩家和创作者。它配备了相应的硬件:酷睿 i9-14900HX、GeForce RTX 4070 以及经过校准(X-Rite)的 16 英寸显示屏,宽高比为 16:10。这是由制造商 Clevo 提供的裸机(PE60SNE-S)作为基础。它是 XMG Pro 16(23 中)的后续机型,外观与 XMG Pro 16(中 23)相同。竞争对手包括 联想Legion Pro 5 16IRX9, 宏碁掠夺者 Helios Neo 16 (2024), 联想Legion 7 16 G9和 Aorus 16X (2024).
潜在的竞争对手比较
Rating | Version | Date | Model | Weight | Height | Size | Resolution | Price |
|---|---|---|---|---|---|---|---|---|
| 81.2 % | v8 | 07 / 2024 | SCHENKER XMG Pro 16 Studio (Mid 24) i9-14900HX, NVIDIA GeForce RTX 4070 Laptop GPU | 2.3 kg | 19.9 mm | 16.00" | 2560x1600 | |
| 86.8 % v7 (old) | v7 (old) | 05 / 2024 | Acer Predator Helios Neo 16 (2024) i7-14700HX, NVIDIA GeForce RTX 4070 Laptop GPU | 2.6 kg | 25.95 mm | 16.00" | 2560x1600 | |
| 89.3 % v7 (old) | v7 (old) | 04 / 2024 | Lenovo Legion Pro 5 16IRX9 i9-14900HX, NVIDIA GeForce RTX 4070 Laptop GPU | 2.5 kg | 26.95 mm | 16.00" | 2560x1600 | |
| 87.4 % v7 (old) | v7 (old) | 04 / 2024 | Aorus 16X 2024 i9-14900HX, NVIDIA GeForce RTX 4070 Laptop GPU | 2.3 kg | 20 mm | 16.00" | 2560x1600 | |
| 90.8 % v7 (old) | v7 (old) | 04 / 2024 | Lenovo Legion 7 16 IRX G9 i9-14900HX, NVIDIA GeForce RTX 4070 Laptop GPU | 2.3 kg | 19.8 mm | 16.00" | 3200x2000 |
请注意:我们最近更新了评级系统,第 8 版的结果无法与第 7 版的结果进行比较。更多信息 请点击此处.
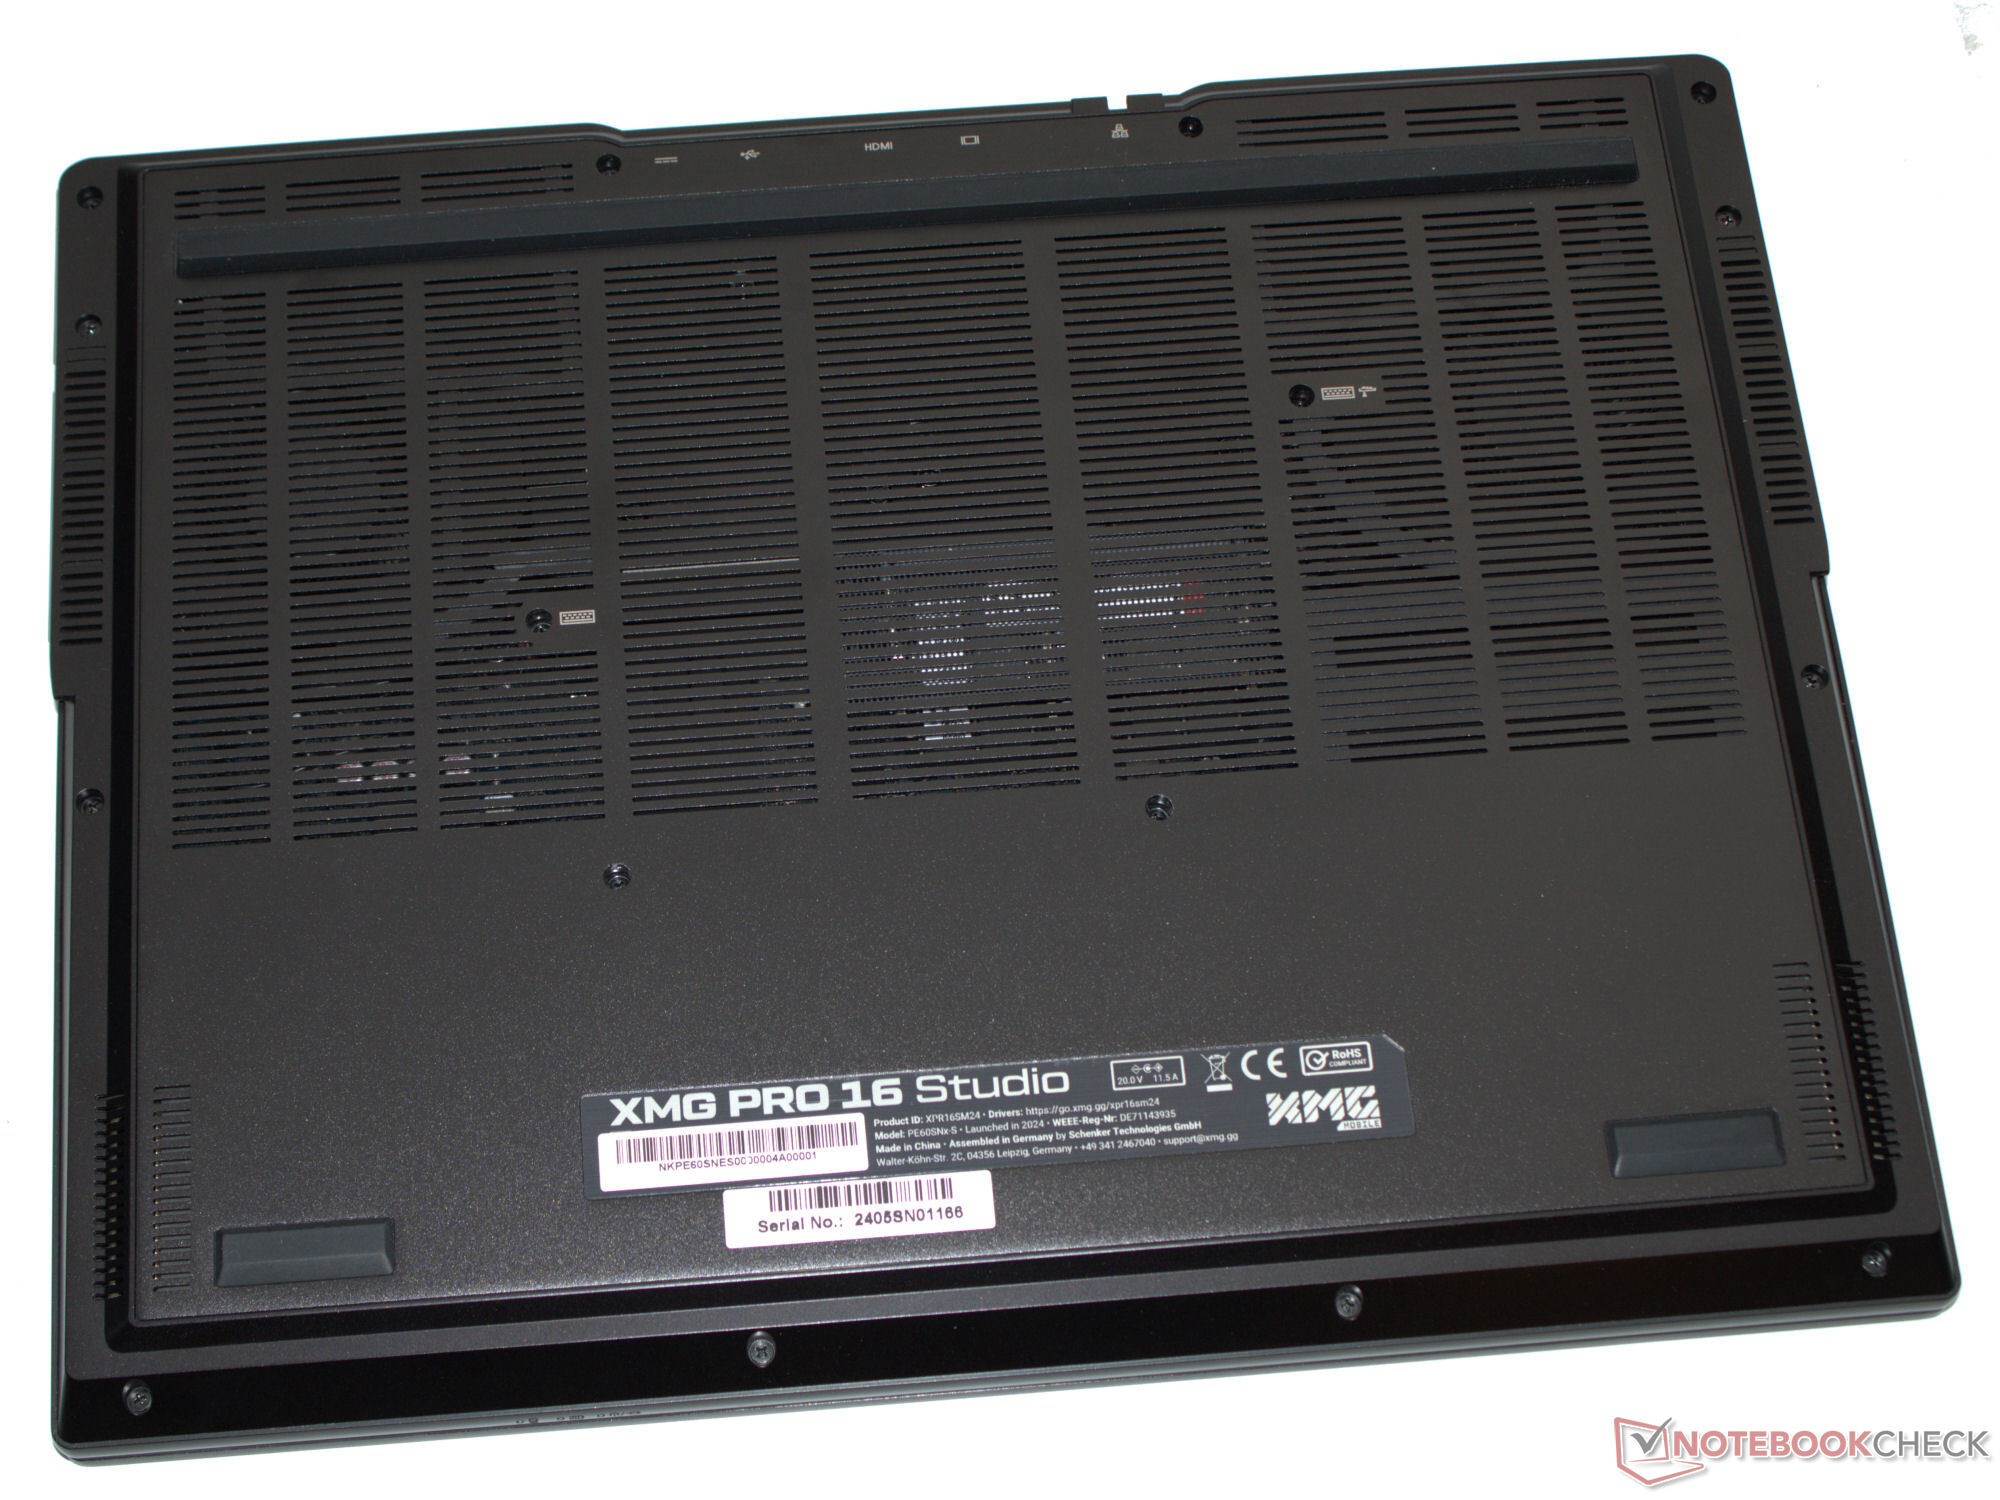
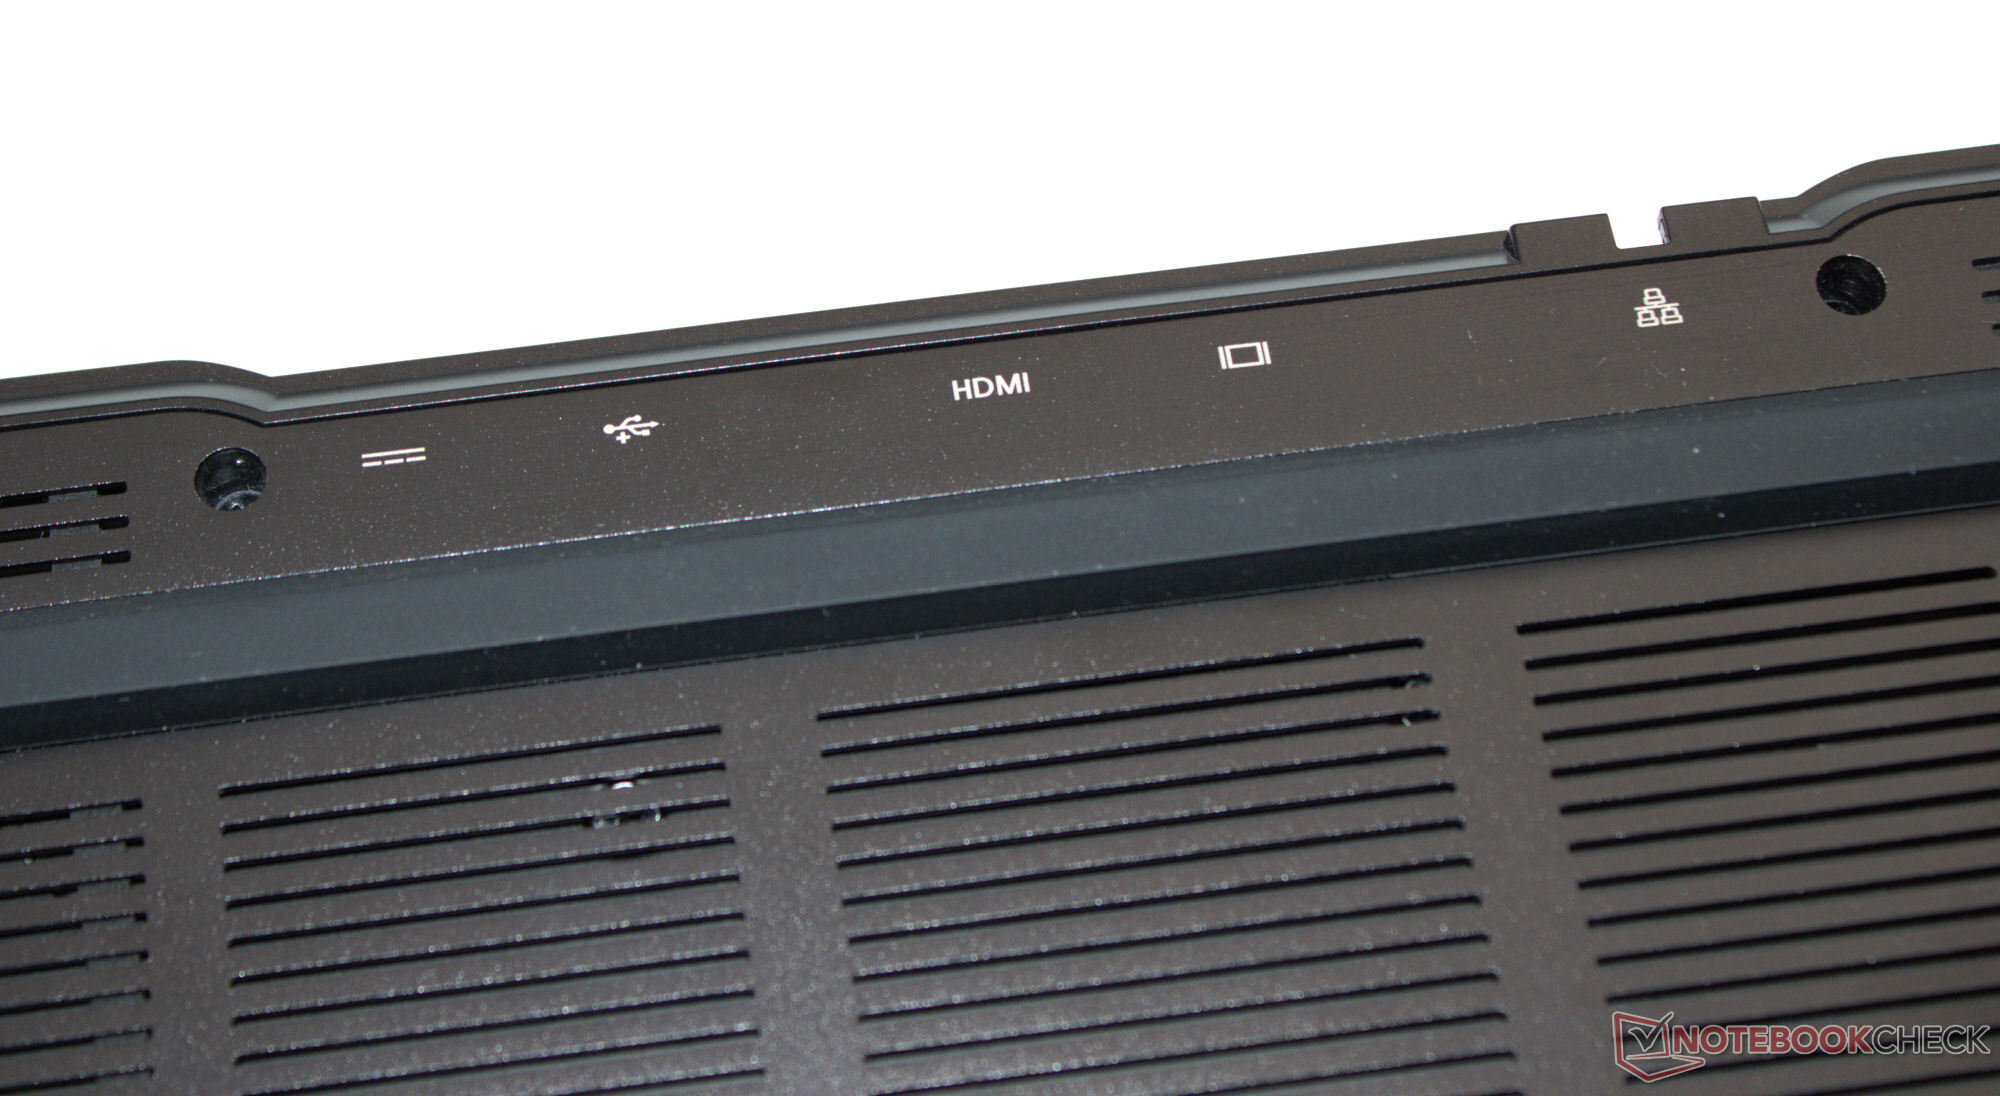
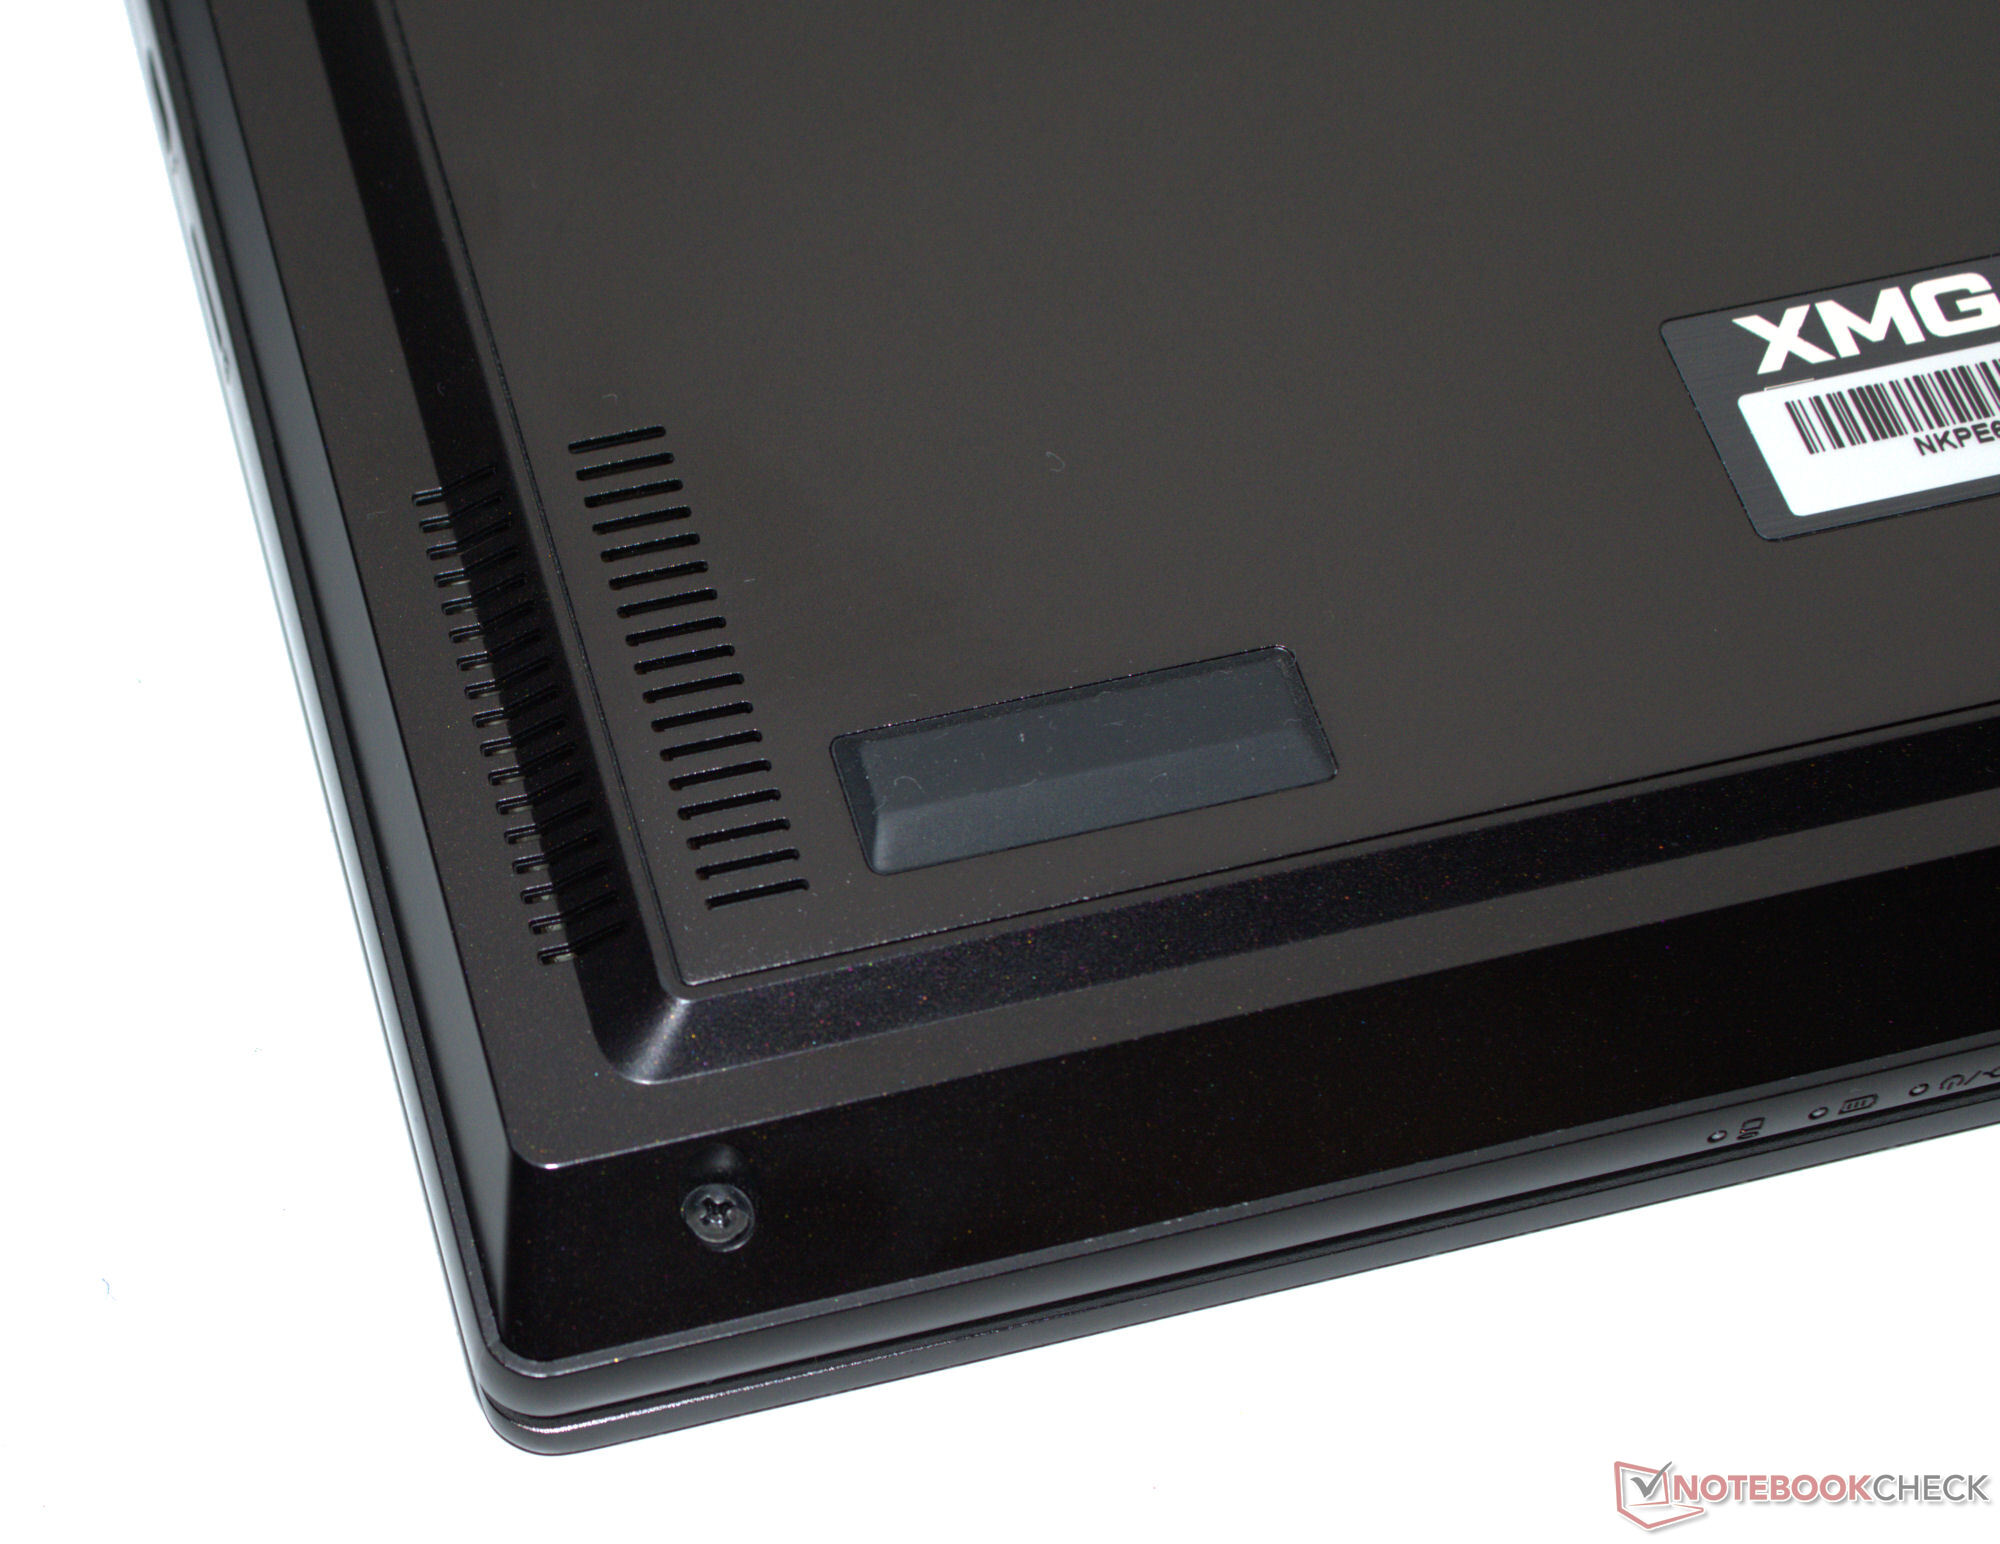
机箱和连接 - 德铁信可使用 Clevo 的裸机
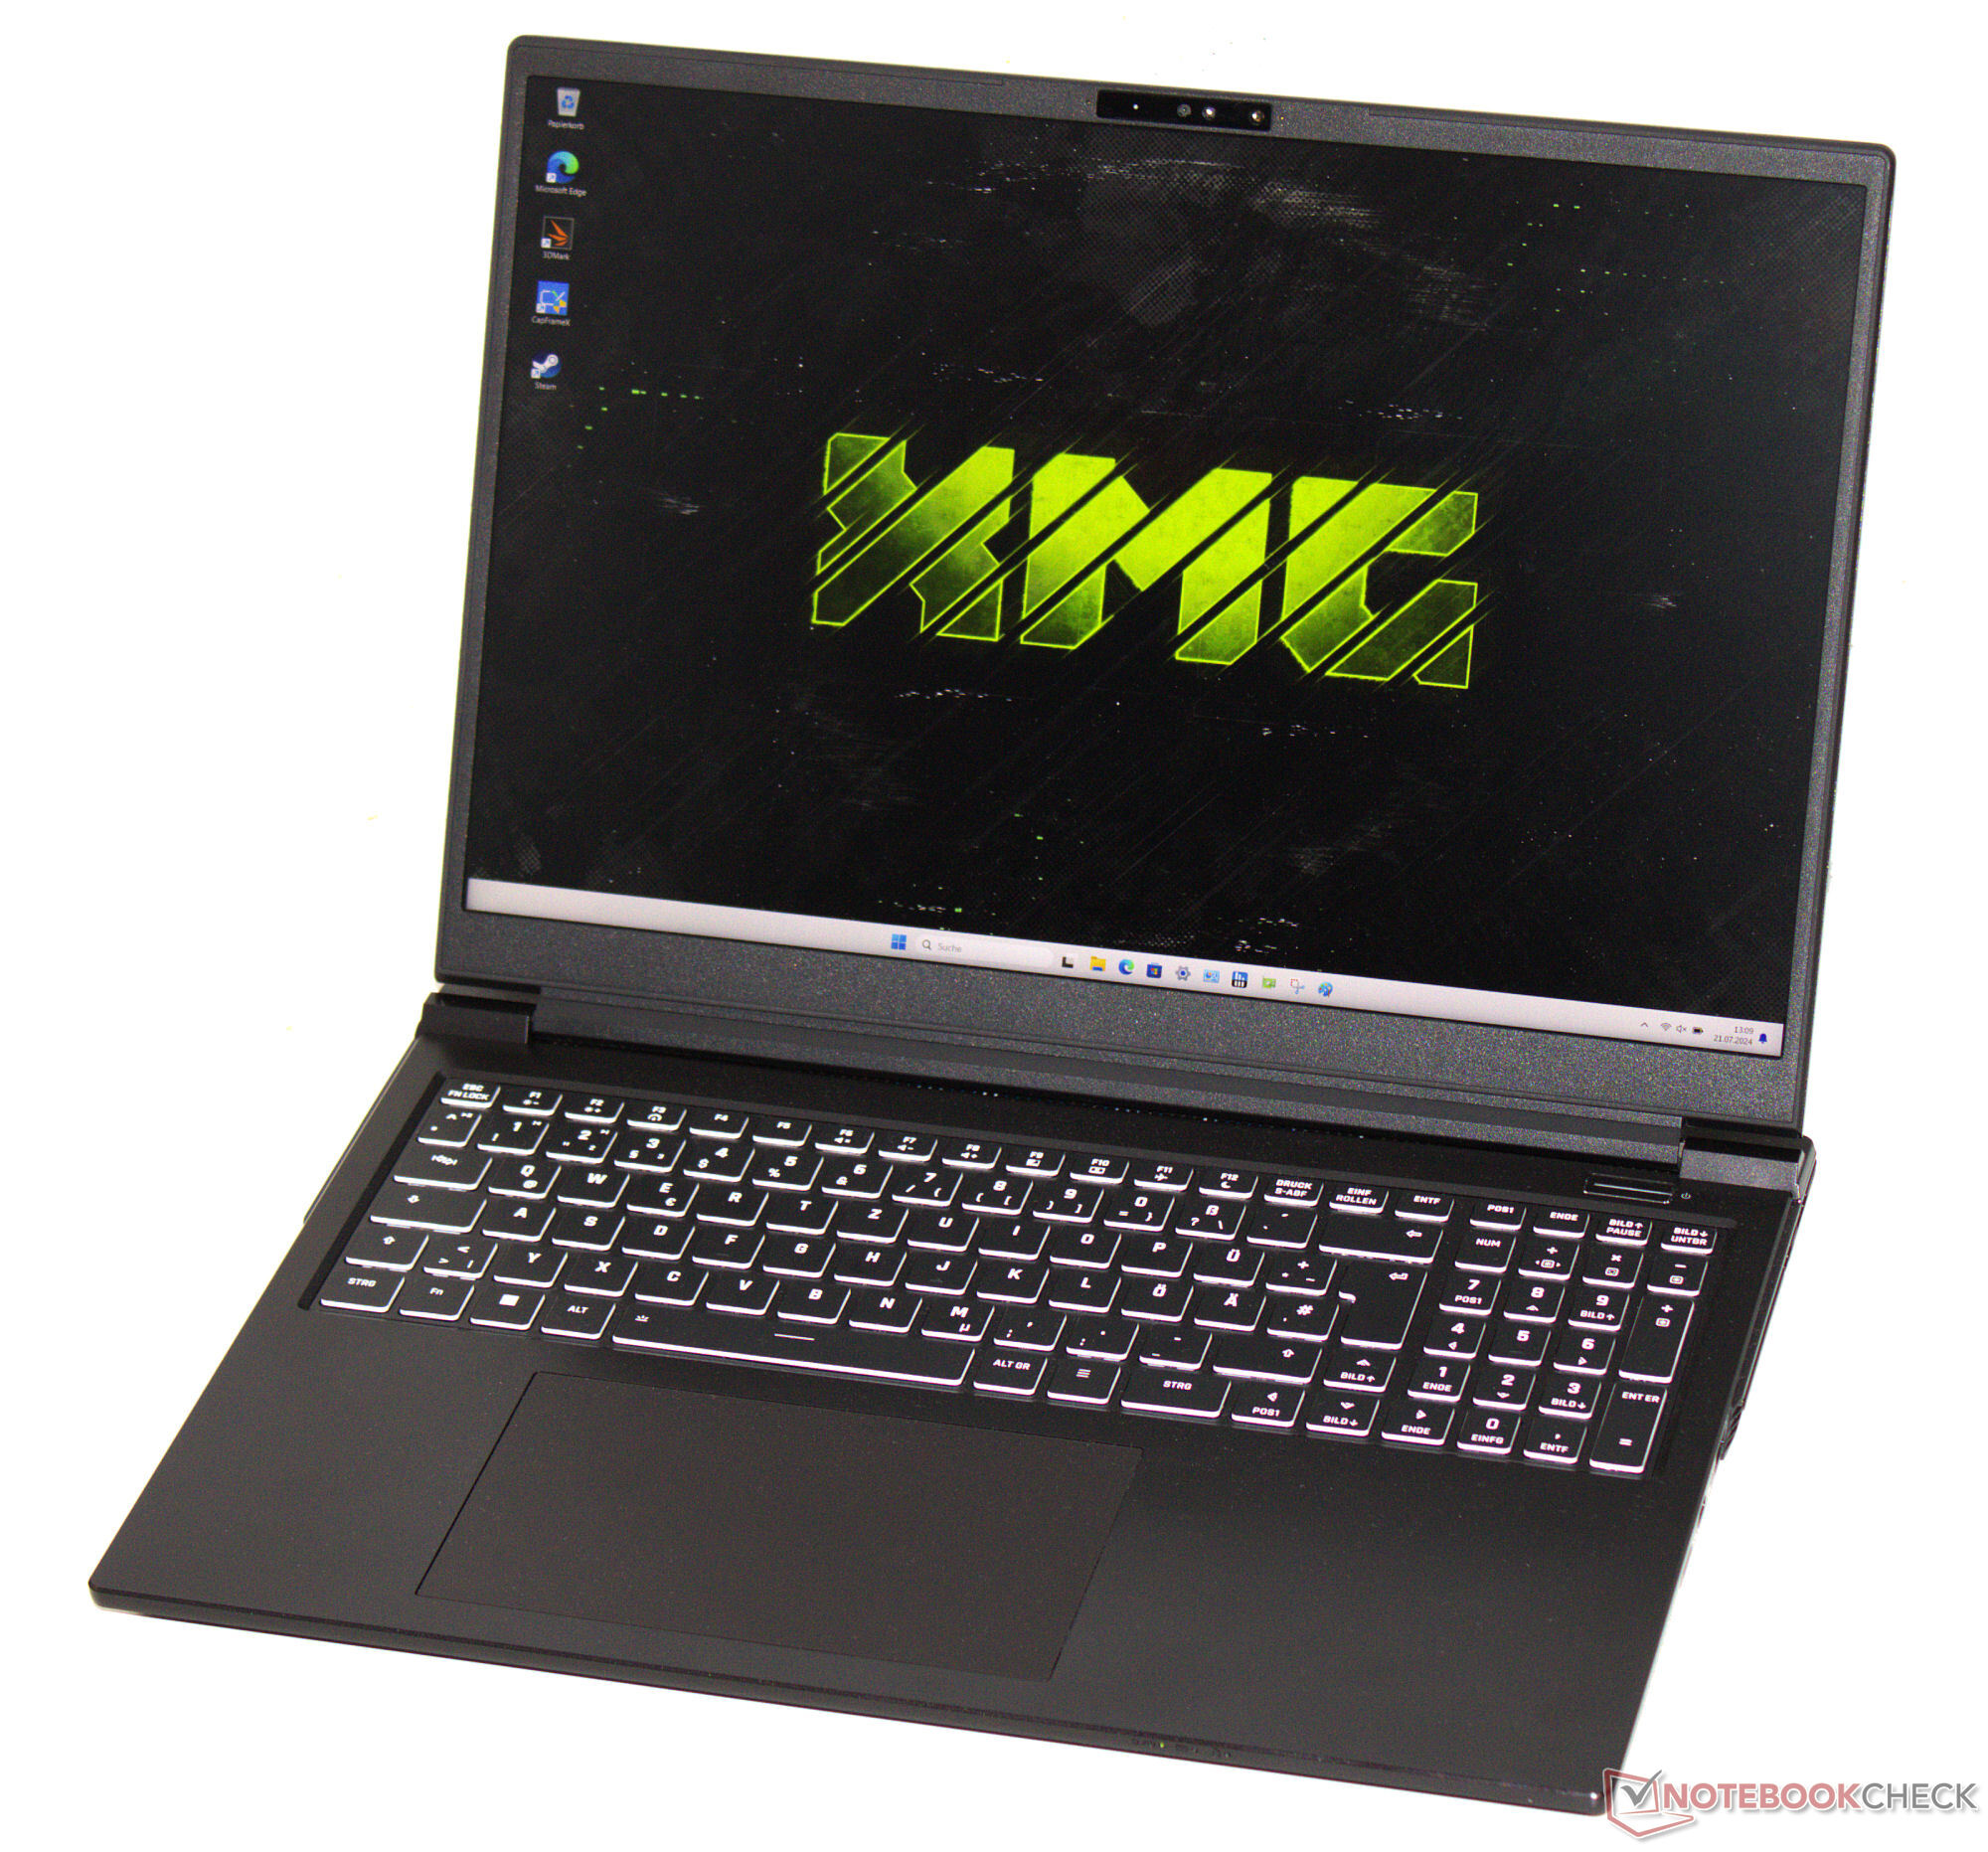
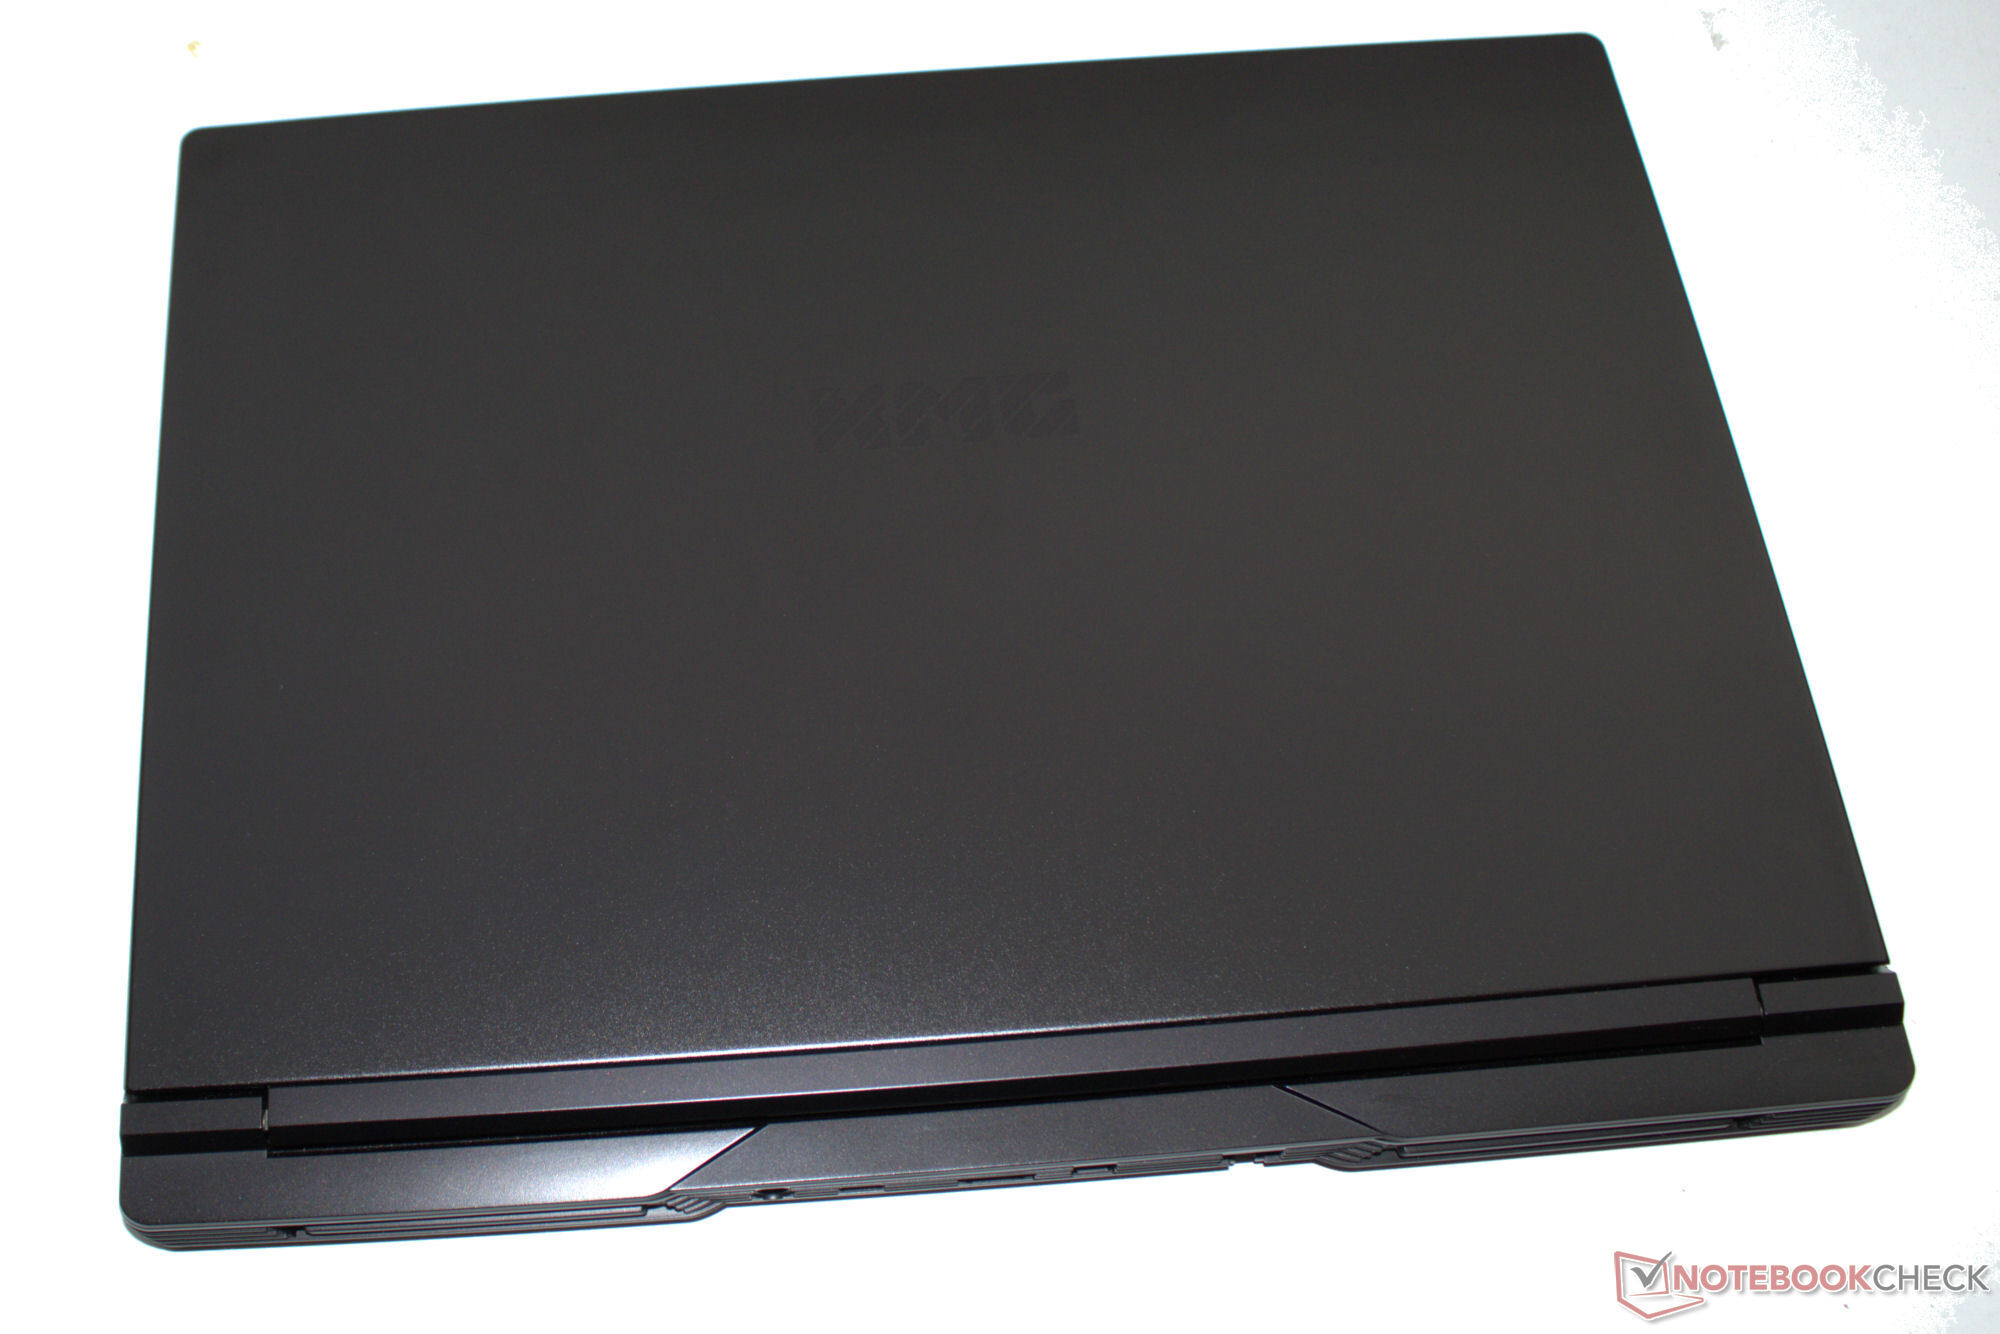
从外观上看,一切都没有改变:最新的 Pro 16 采用了与去年相同的黑色哑光铝合金外壳--这也是 Pro 16 的一大特色。 去年的型号如果只看外壳的话。底座和盖子可能会有轻微的扭曲,但它们的制造质量还是不错的。在外观如此严肃的机箱上寻找 LED 灯带是徒劳的。盖子的最大开启角度为 130 度。
两个 USB-A 端口(USB 3.2 Gen 1)、两个 USB-C 端口(1x USB 3.2 Gen 2、1x TB 4/USB 4)以及三个视频输出口应足以满足大多数用户的需求,最坏的情况下,您可能不得不使用扩展坞。TB4 端口支持电力传输。千兆以太网端口允许高达 2.5 Gbit/s 的数据传输速率。
在最佳条件下(附近没有 WiFi 设备,笔记本电脑和服务器 PC 之间的距离较短),英特尔 WiFi-6E 芯片(AX211)可产生良好甚至非常好的数据传输速率。全高清网络摄像头(210 万像素,无盖)拍出的照片并不出人意料。MicroSD 读卡器(参考卡:AV PRO microSD 128 GB V60)速度一般。


| SD Card Reader | |
| average JPG Copy Test (av. of 3 runs) | |
| Aorus 16X 2024 (AV PRO microSD 128 GB V60) | |
| Average of class Gaming (19 - 197.3, n=68, last 2 years) | |
| SCHENKER XMG Pro 16 Studio (Mid 23) (AV PRO microSD 128 GB V60) | |
| SCHENKER XMG Pro 16 Studio (Mid 24) (AV PRO microSD 128 GB V60) | |
| Lenovo Legion 7 16 IRX G9 (Angelbird AV Pro V60) | |
| Acer Predator Helios Neo 16 (2024) (AV PRO microSD 128 GB V60) | |
| maximum AS SSD Seq Read Test (1GB) | |
| Aorus 16X 2024 (AV PRO microSD 128 GB V60) | |
| Average of class Gaming (25.8 - 263, n=67, last 2 years) | |
| SCHENKER XMG Pro 16 Studio (Mid 23) (AV PRO microSD 128 GB V60) | |
| Lenovo Legion 7 16 IRX G9 (Angelbird AV Pro V60) | |
| SCHENKER XMG Pro 16 Studio (Mid 24) (AV PRO microSD 128 GB V60) | |
| Acer Predator Helios Neo 16 (2024) (AV PRO microSD 128 GB V60) | |

 NVIDIA GeForce RTX 4070 Laptop GPU, i9-14900HX, Samsung 990 Pro 1 TB")
 NVIDIA GeForce RTX 4070 Laptop GPU, i9-14900HX, Samsung 990 Pro 1 TB")
可持续性
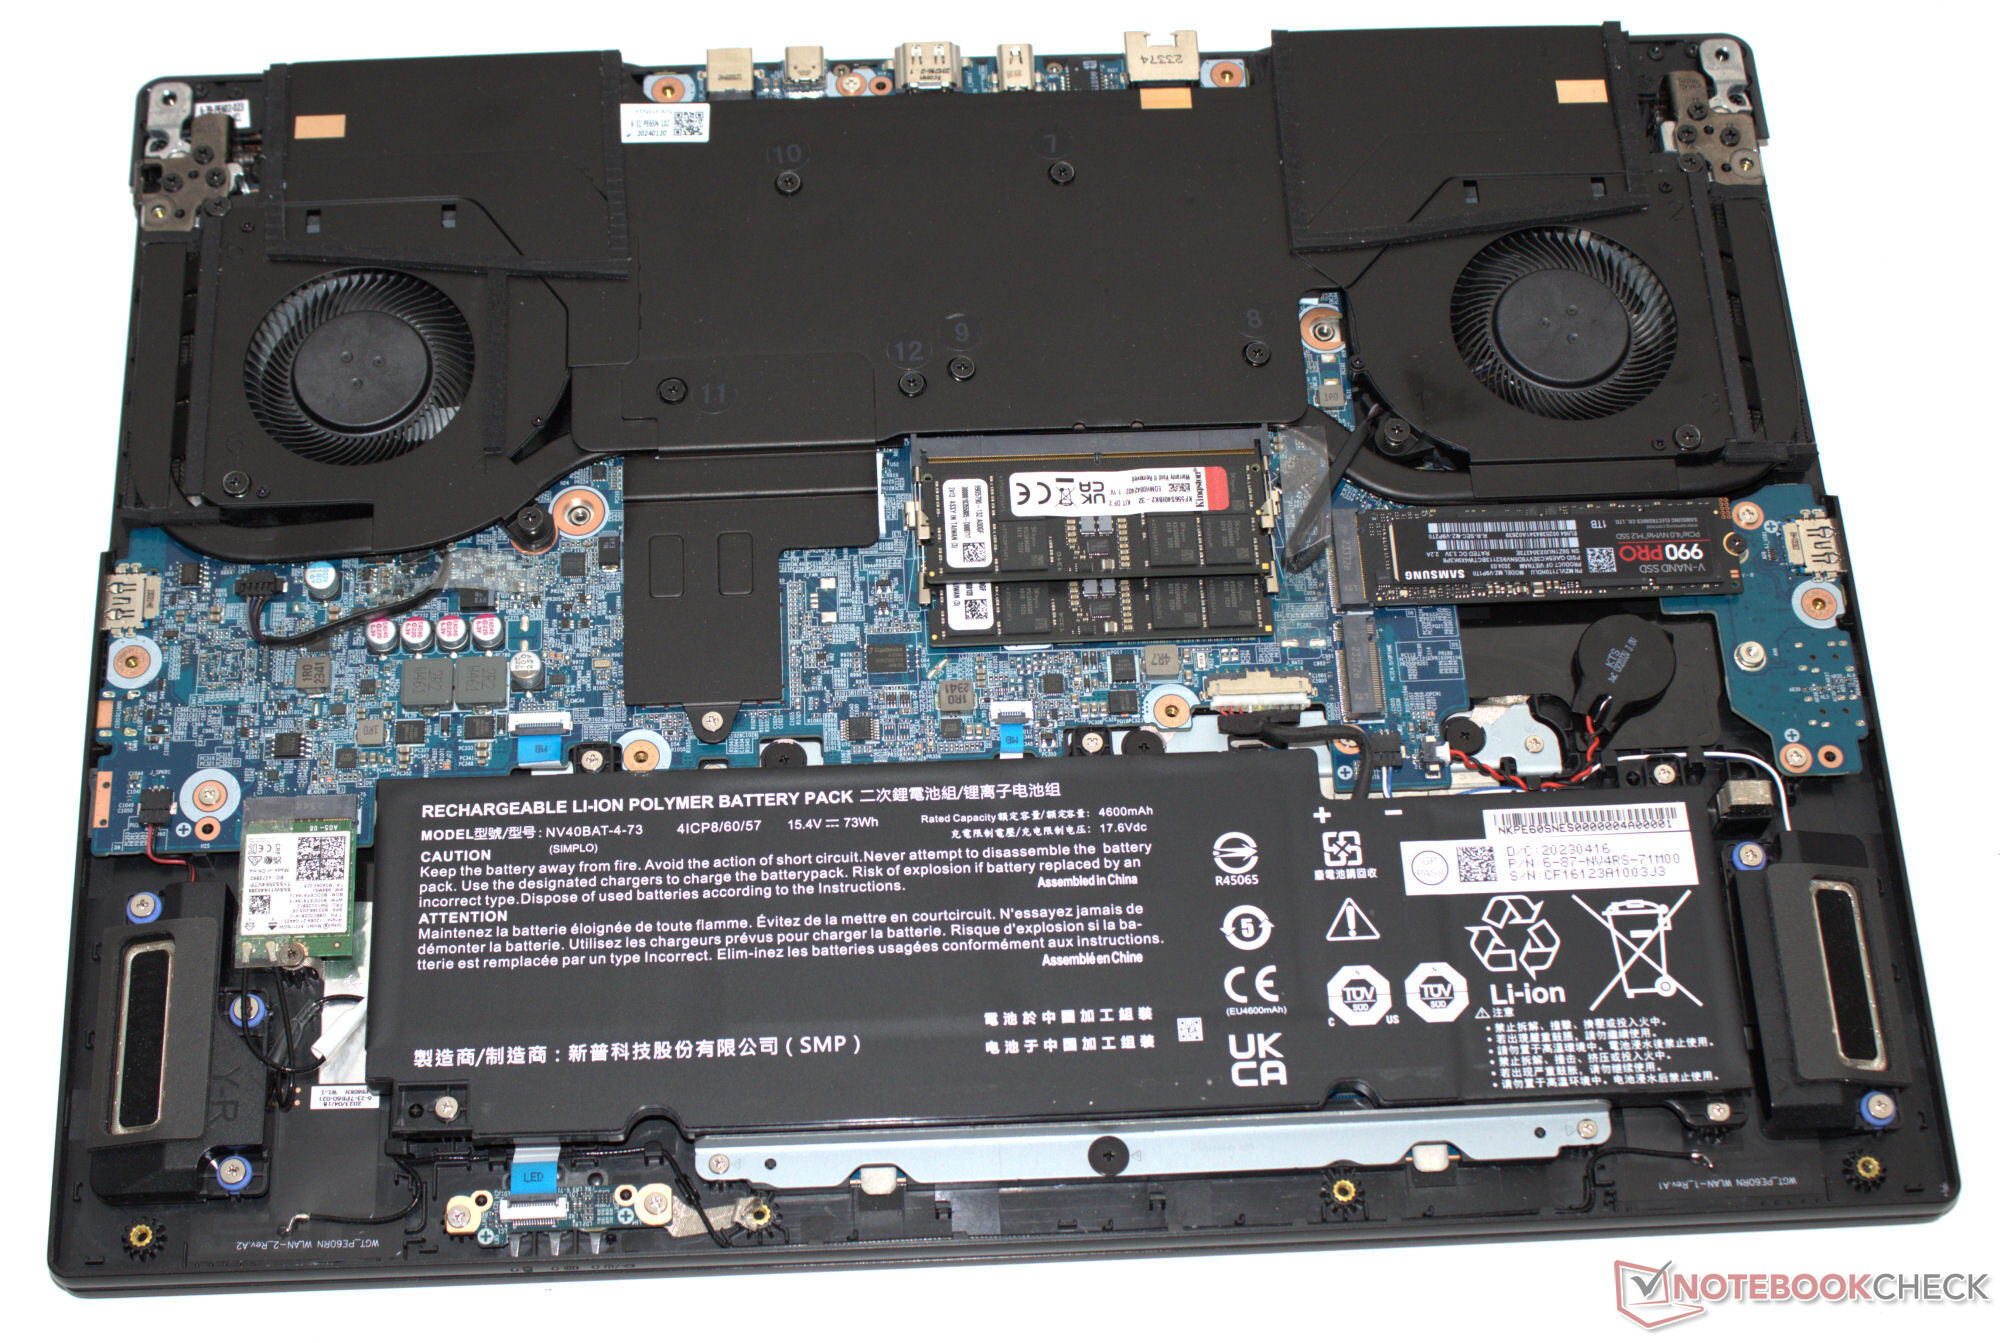
笔记本电脑和配件由各种塑料套(泡沫塑料载体、薄膜、袋子)保护。上面印有所用塑料的名称。例外情况:盖子上的透明薄膜盖没有相应的信息。取下底板后可以接触到设备的硬件,因此可以进行维护和修理工作。软件更新在未来几年都有保障。
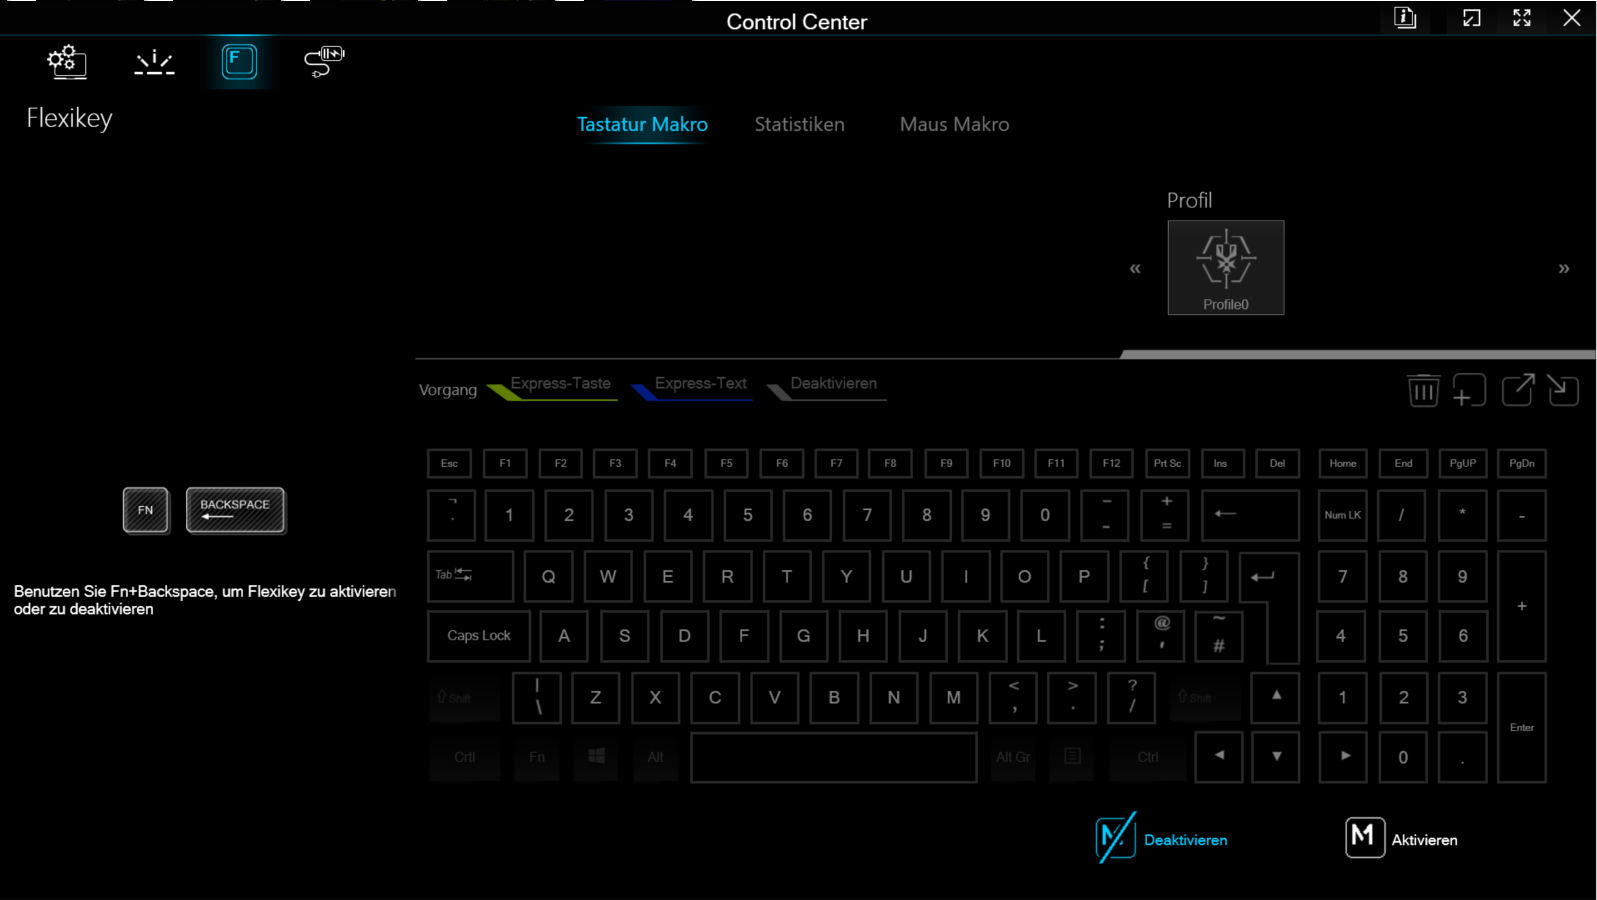
输入设备 - 配有可更换键盘的 XMG 笔记本电脑
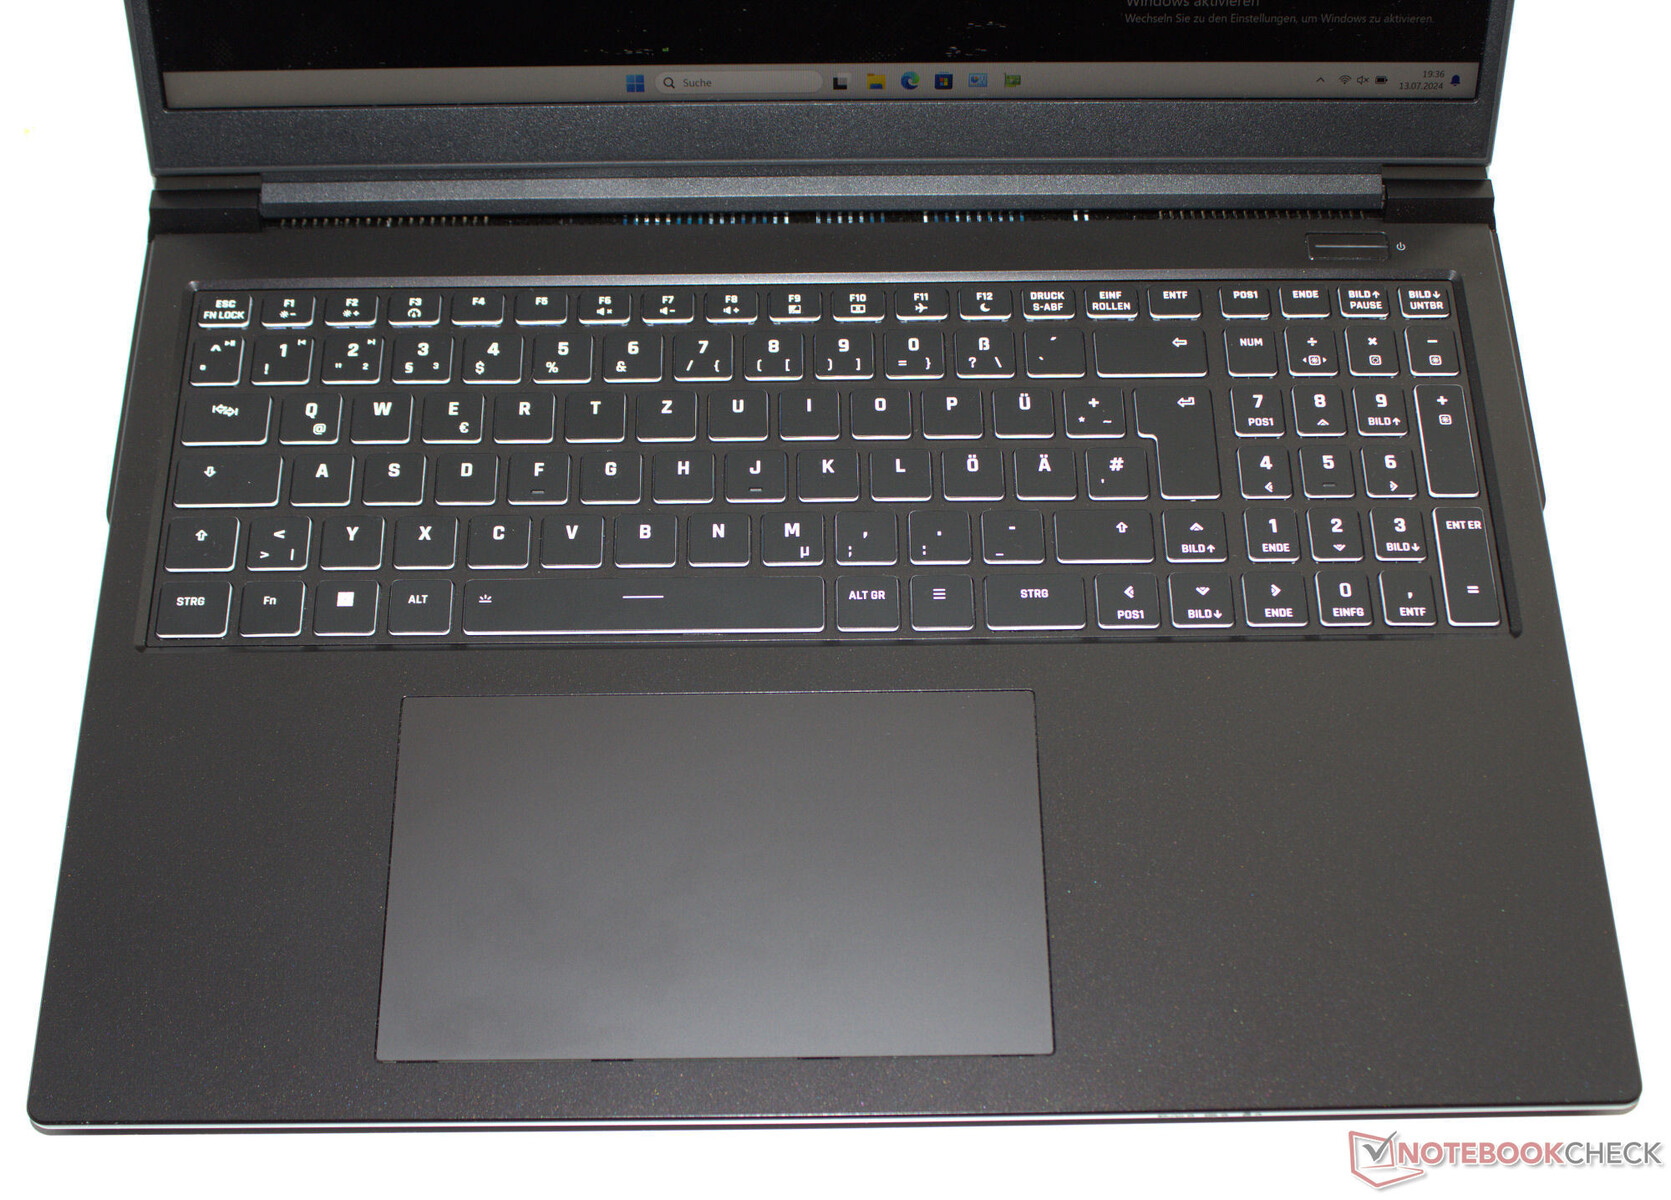
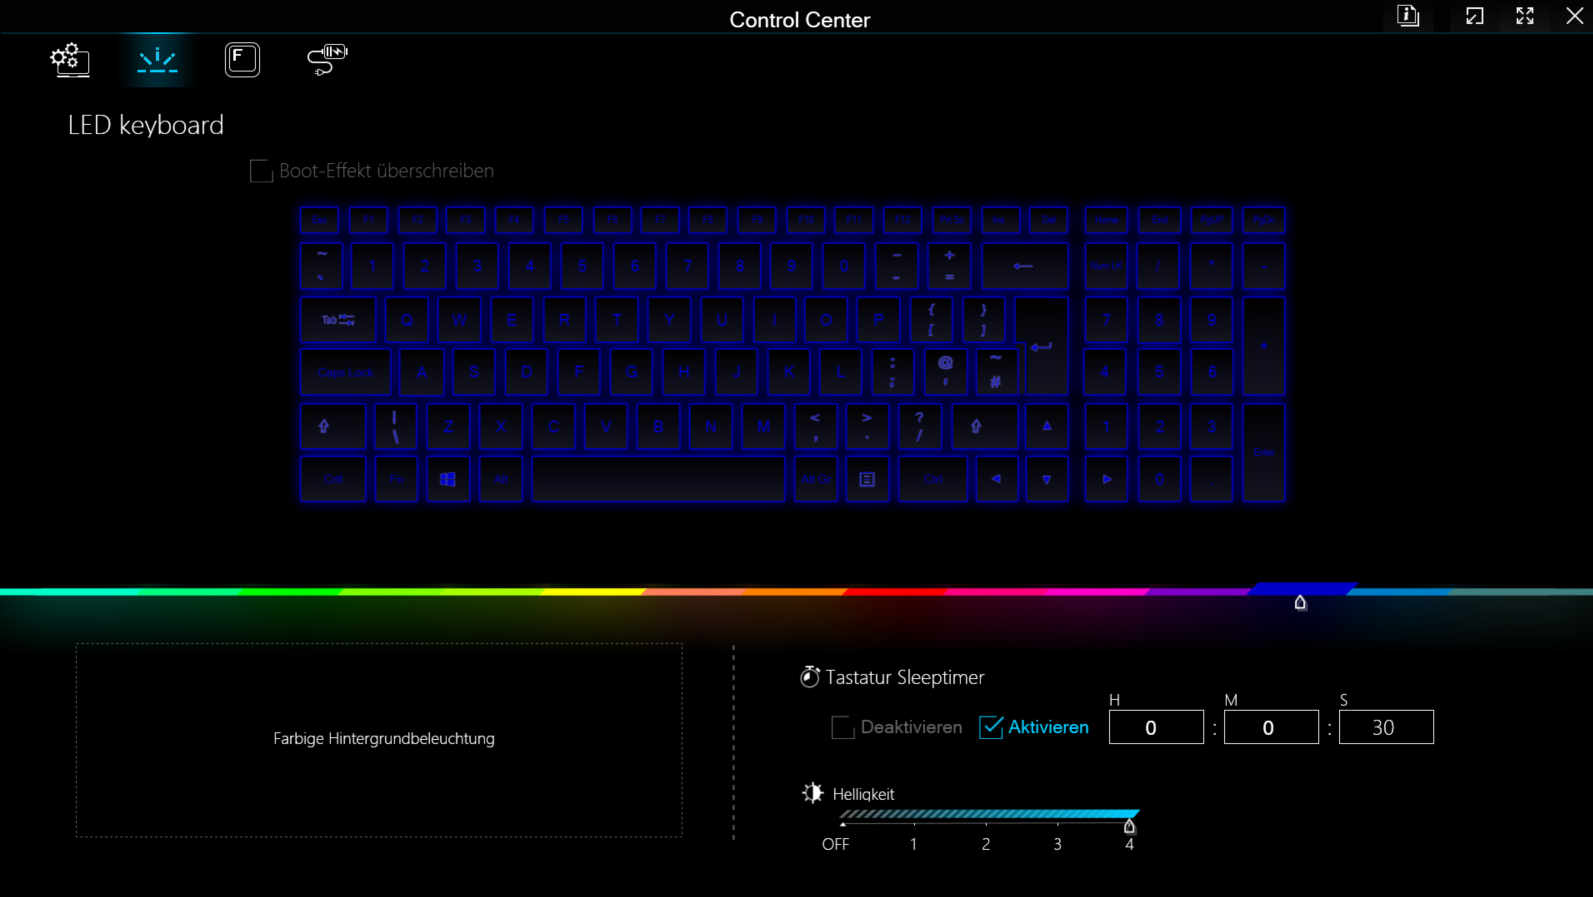
这通常是申克公司的惯例,而其他制造商则是例外:背光(RGB,四级)木格子键盘很容易更换,因为它只用两颗螺丝(和几个夹子)固定。键盘平整光滑,键程适中,按压点清晰。按键的阻力可以更小一些,但这是品味问题。在日常使用中,键盘的轻微回弹不会影响您的使用。正面:四个方向键大小适中。宽大的多点触控板(15.1 x 9.1 厘米)用于控制鼠标指针。
显示屏 - 16:10、IPS、sRGB
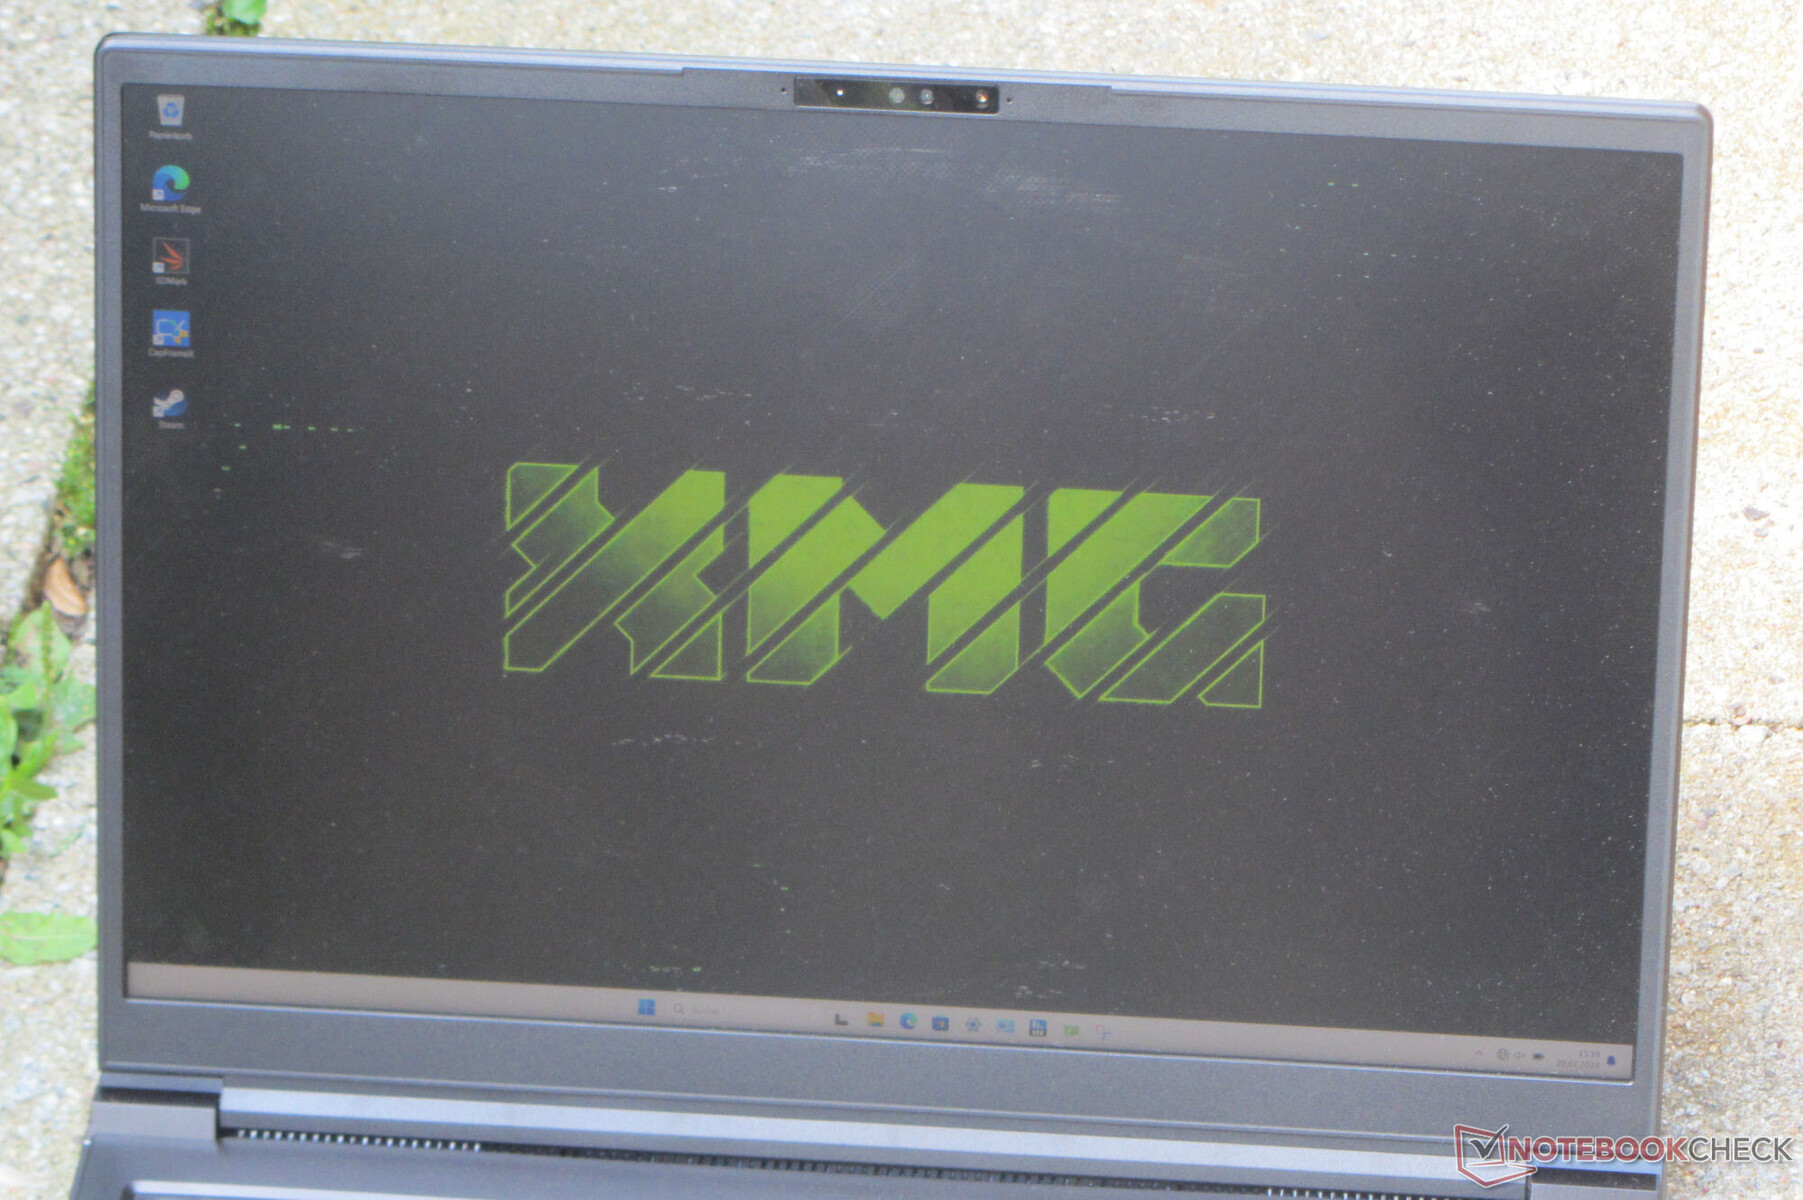
熟悉的 16 英寸显示屏(2560 x 1600 像素),16:10 的宽高比:这款笔记本电脑采用了京东方的 IPS 面板,该面板已在 2023 版 Pro 16.不过,它的最大亮度略有提高。总而言之,我们测量的屏幕数值足以满足室内使用。只要阳光不是太强烈,在室外也可以进行阅读。正面:反应灵敏的 240 Hz 面板不会出现 PWM 闪烁。没有其他显示选项。
| |||||||||||||||||||||||||
Brightness Distribution: 86 %
Center on Battery: 416 cd/m²
Contrast: 1095:1 (Black: 0.38 cd/m²)
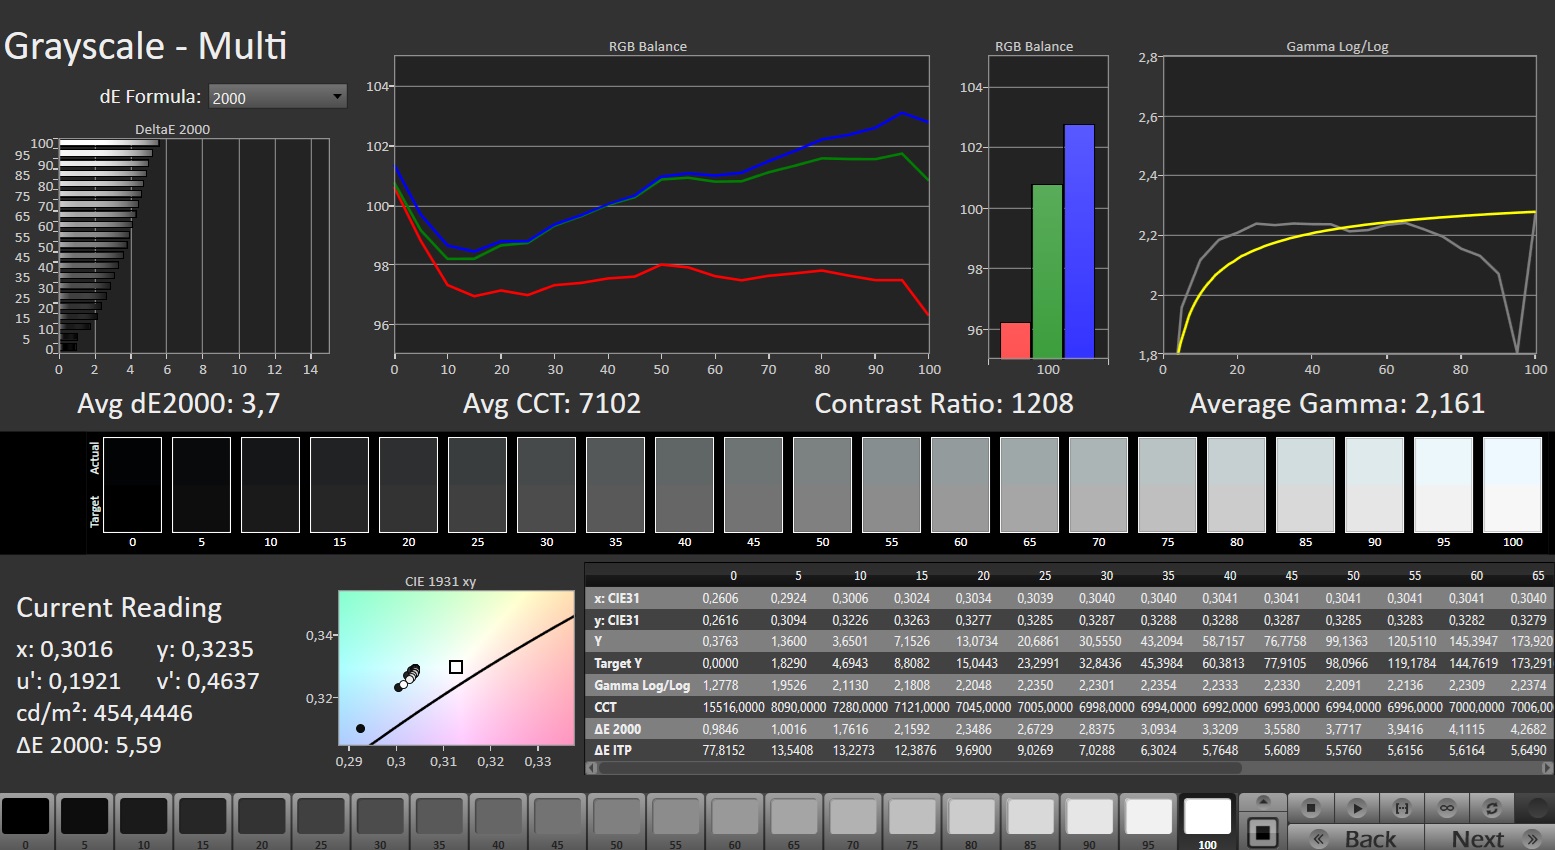
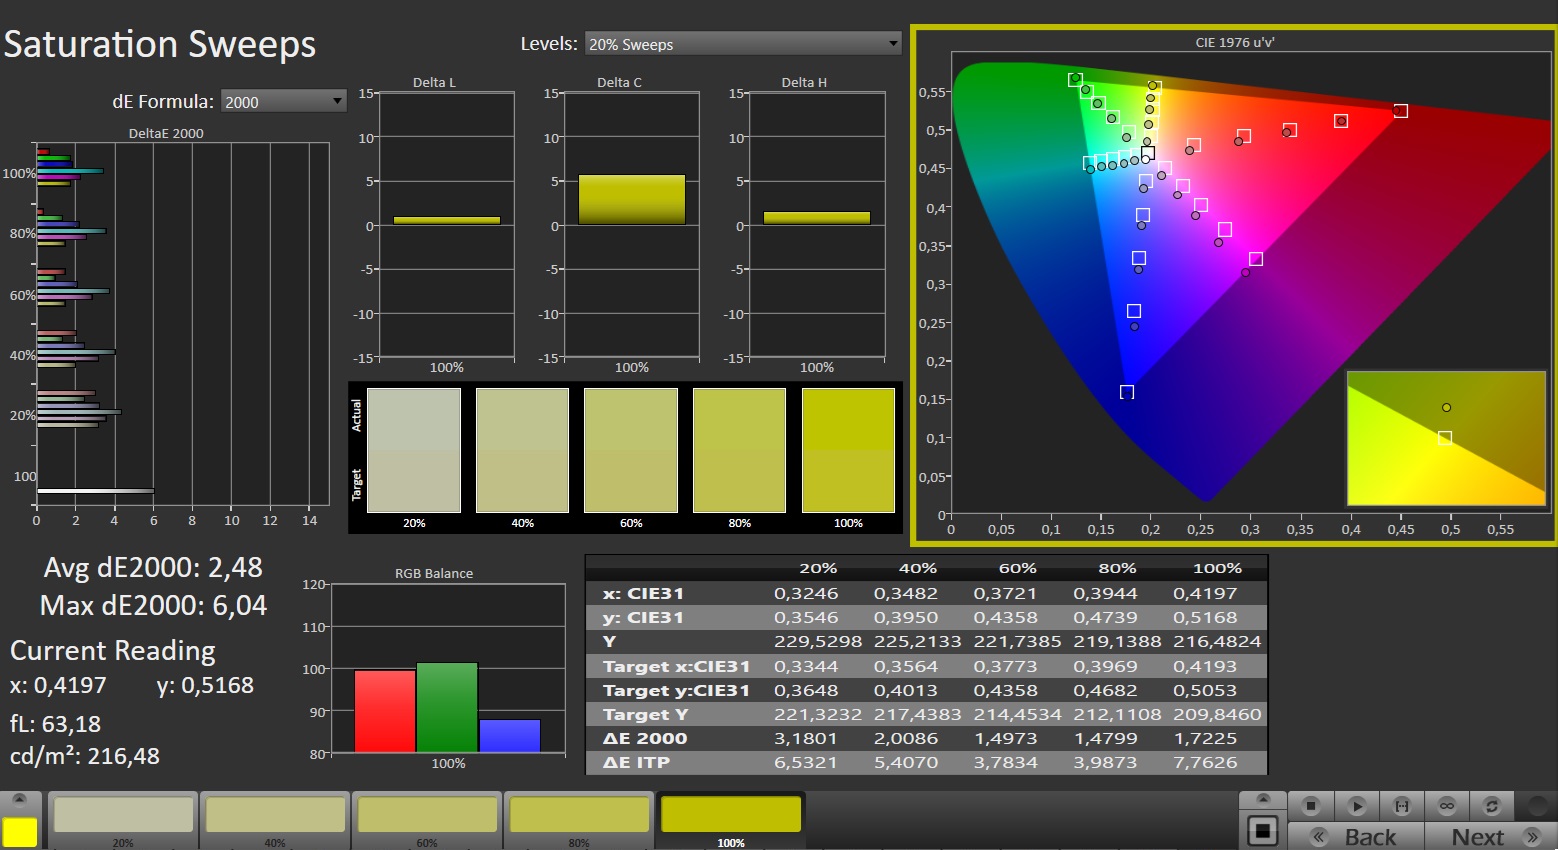
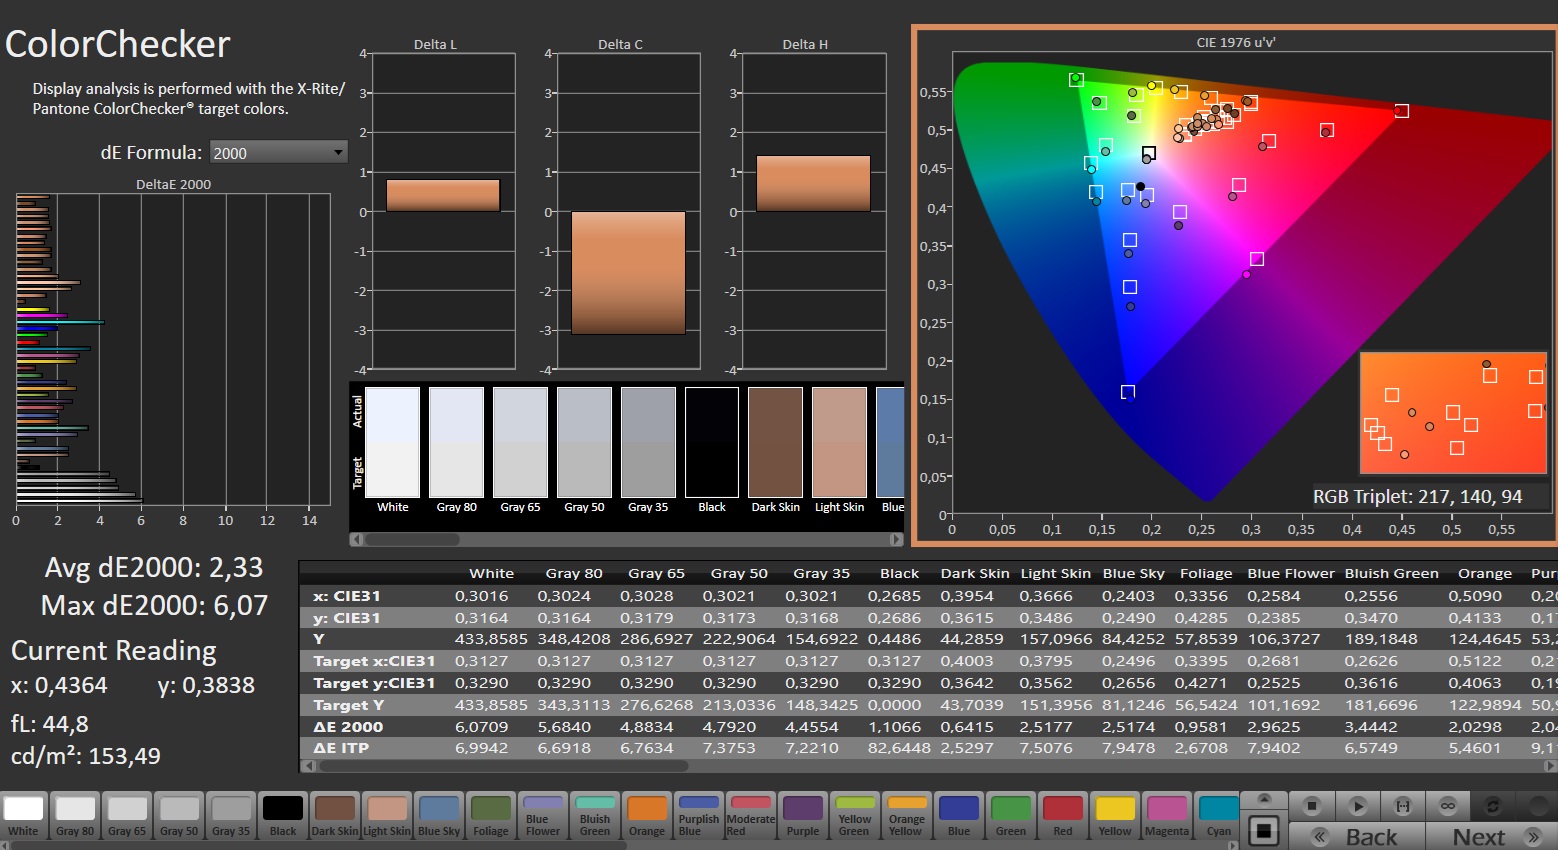
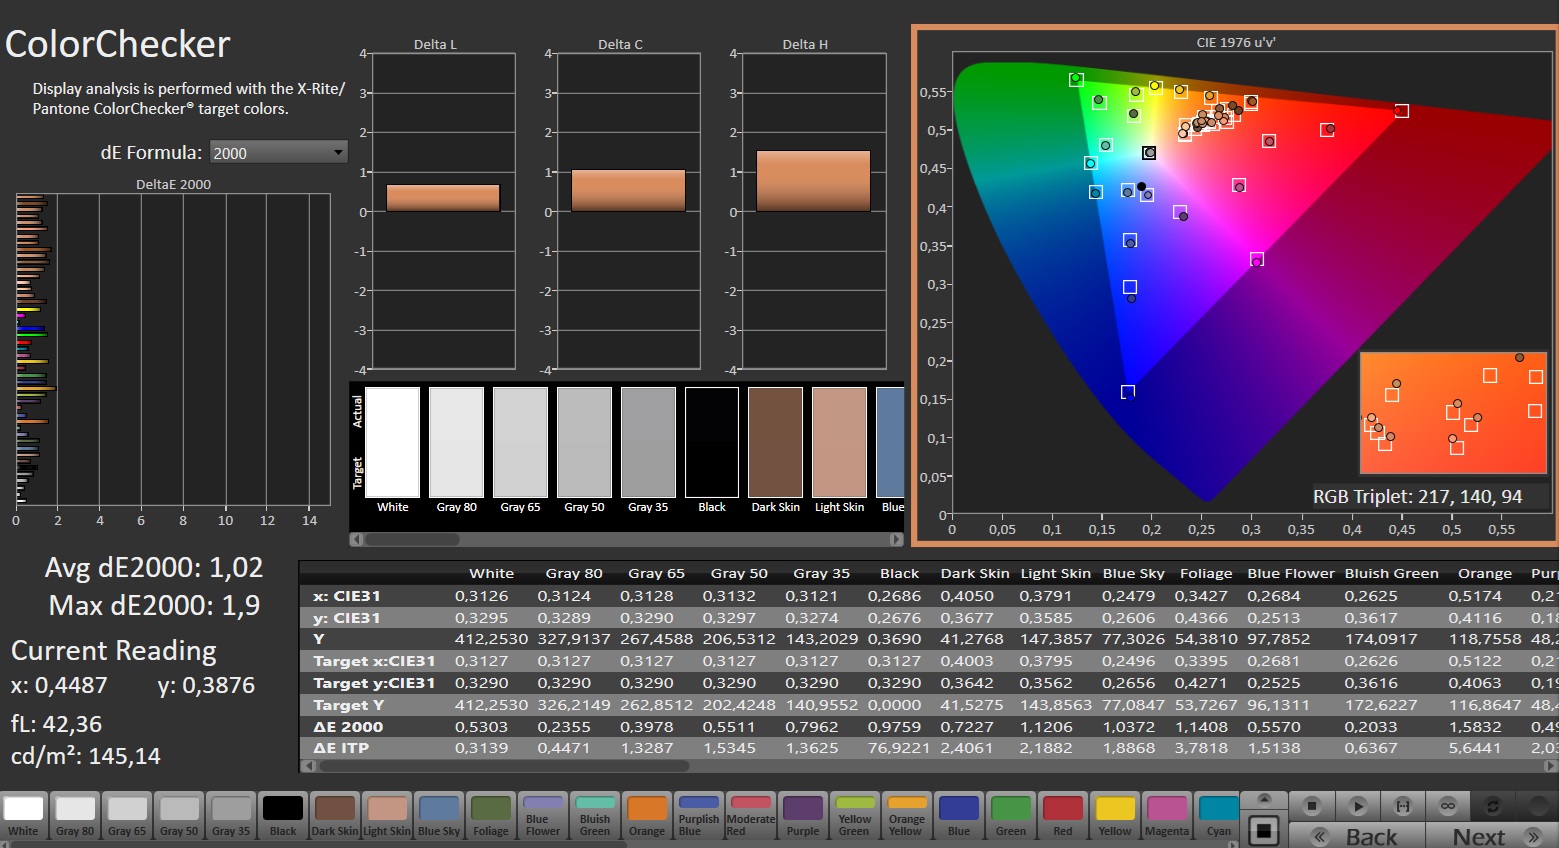
ΔE Color 2.33 | 0.5-29.43 Ø4.87, calibrated: 1.02
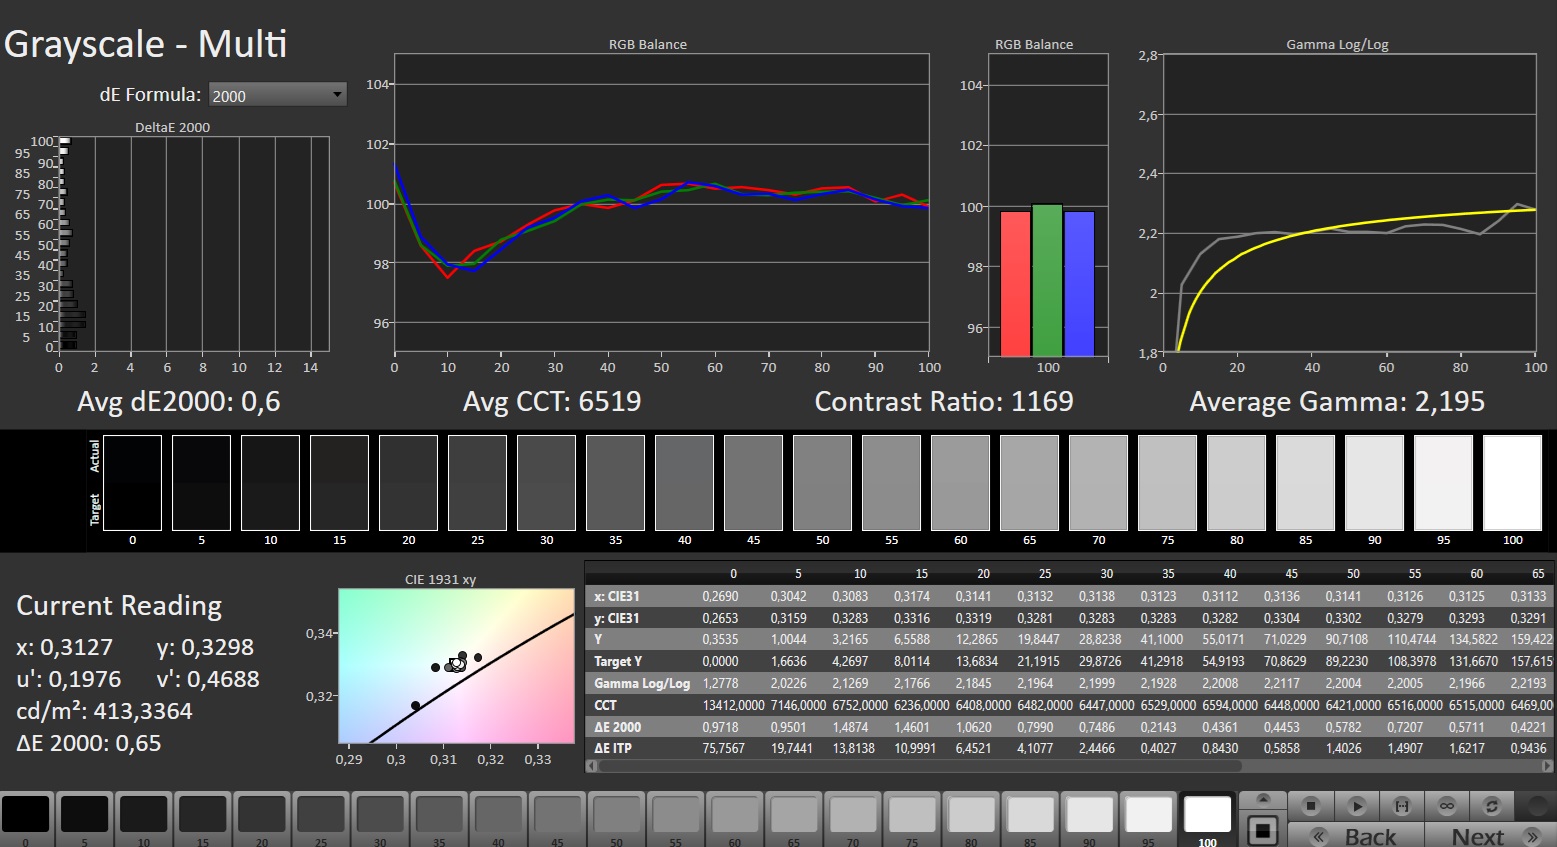
ΔE Greyscale 3.7 | 0.5-98 Ø5.1
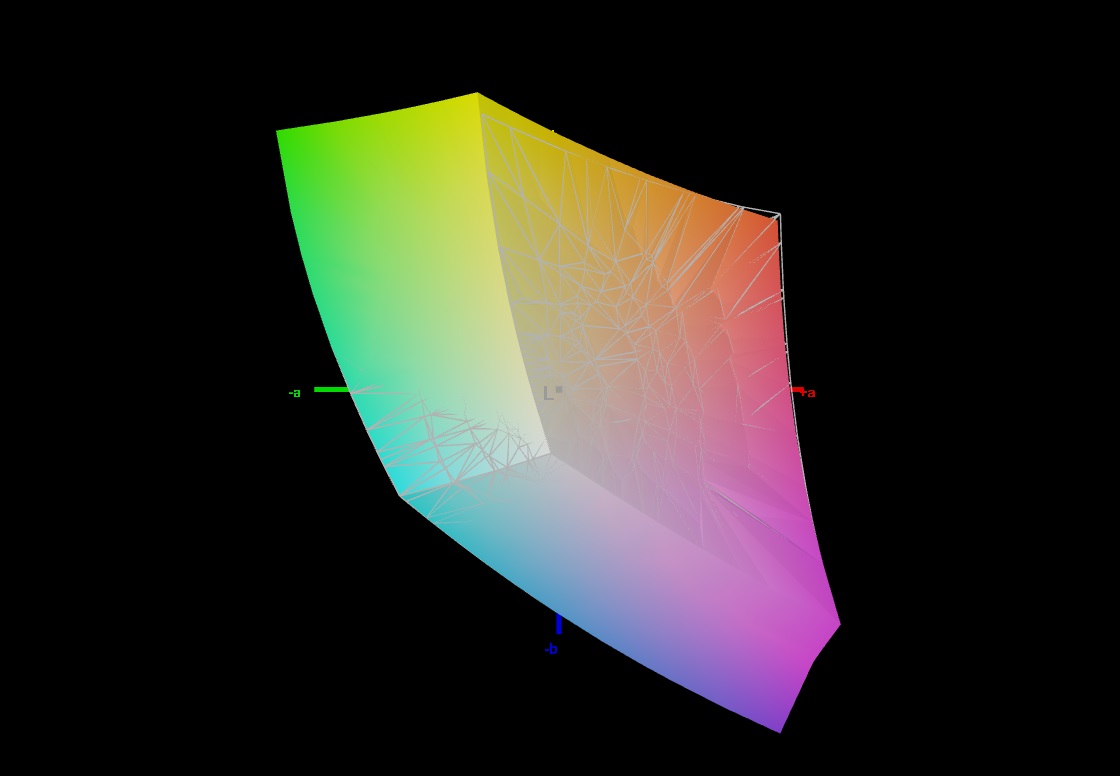
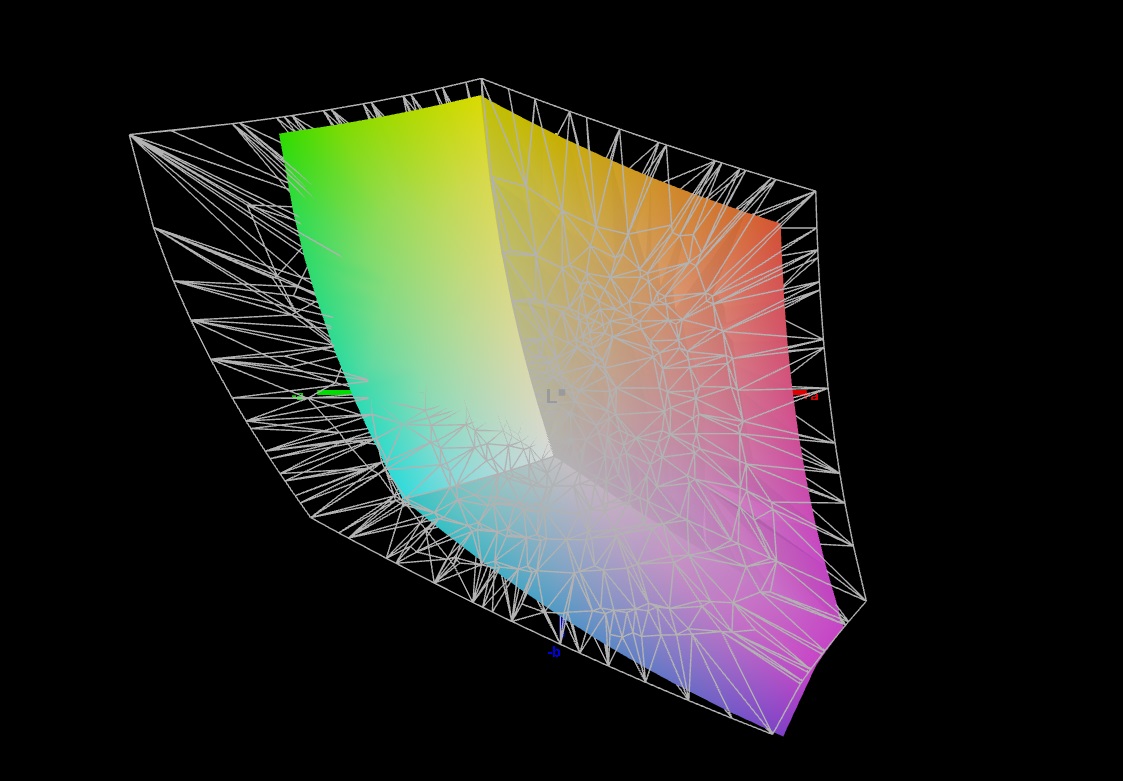
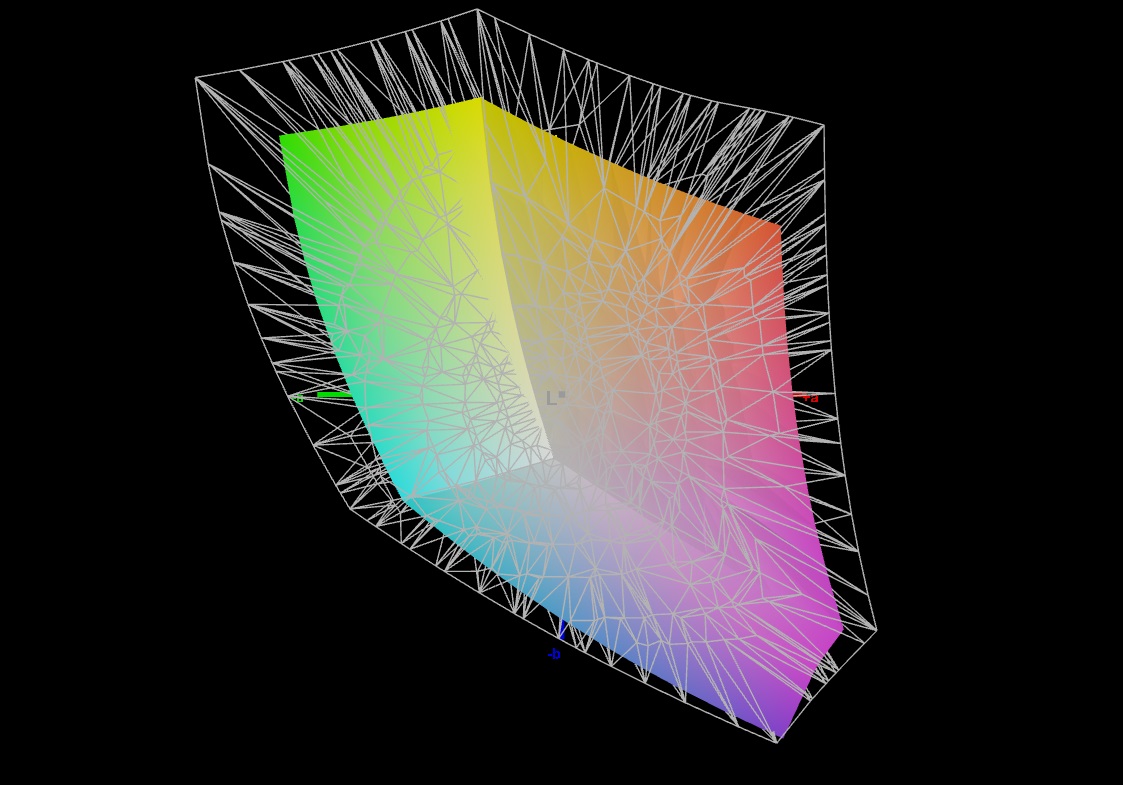
70.8% AdobeRGB 1998 (Argyll 2.2.0 3D)
99.5% sRGB (Argyll 2.2.0 3D)
68.8% Display P3 (Argyll 2.2.0 3D)
Gamma: 2.161
| SCHENKER XMG Pro 16 Studio (Mid 24) BOE CQ NE160QDM-NZ1, IPS, 2560x1600, 16" | Acer Predator Helios Neo 16 (2024) Chi Mei N160GME-GTB, LED, 2560x1600, 16" | Lenovo Legion Pro 5 16IRX9 BOE NE160QDM-NYC, IPS, 2560x1600, 16" | Aorus 16X 2024 BOE CQ NE160QDM-NY1, IPS, 2560x1600, 16" | SCHENKER XMG Pro 16 Studio (Mid 23) BOE CQ NE160QDM-NZ1, IPS, 2560x1600, 16" | Lenovo Legion 7 16 IRX G9 MNG007ZA1-2, IPS, 3200x2000, 16" | |
|---|---|---|---|---|---|---|
| Display | 20% | 0% | -2% | -0% | 21% | |
| Display P3 Coverage | 68.8 | 95.9 39% | 69.3 1% | 67.2 -2% | 69.4 1% | 95 38% |
| sRGB Coverage | 99.5 | 99.8 0% | 99.4 0% | 96.7 -3% | 98.2 -1% | 100 1% |
| AdobeRGB 1998 Coverage | 70.8 | 86.4 22% | 70.1 -1% | 69.3 -2% | 70.1 -1% | 87.2 23% |
| Response Times | 11% | -18% | 28% | -9% | -14% | |
| Response Time Grey 50% / Grey 80% * | 12.7 ? | 5 ? 61% | 11.9 ? 6% | 7.5 ? 41% | 12.2 ? 4% | 14.4 ? -13% |
| Response Time Black / White * | 6.3 ? | 8.8 ? -40% | 8.9 ? -41% | 5.4 ? 14% | 7.7 ? -22% | 7.2 ? -14% |
| PWM Frequency | ||||||
| Screen | 19% | 20% | 4% | -5% | 23% | |
| Brightness middle | 416 | 521 25% | 384 -8% | 542 30% | 349 -16% | 412 -1% |
| Brightness | 392 | 506 29% | 366 -7% | 504 29% | 348 -11% | 396 1% |
| Brightness Distribution | 86 | 85 -1% | 91 6% | 86 0% | 93 8% | 89 3% |
| Black Level * | 0.38 | 0.44 -16% | 0.35 8% | 0.45 -18% | 0.32 16% | 0.43 -13% |
| Contrast | 1095 | 1184 8% | 1097 0% | 1204 10% | 1091 0% | 958 -13% |
| Colorchecker dE 2000 * | 2.33 | 1.74 25% | 0.97 58% | 2.73 -17% | 1.98 15% | 0.9 61% |
| Colorchecker dE 2000 max. * | 6.07 | 3.88 36% | 3.57 41% | 5.29 13% | 7.56 -25% | 2 67% |
| Colorchecker dE 2000 calibrated * | 1.02 | 0.52 49% | 0.77 25% | 1.32 -29% | 1.45 -42% | 0.6 41% |
| Greyscale dE 2000 * | 3.7 | 3 19% | 1.5 59% | 2.9 22% | 3.3 11% | 1.4 62% |
| Gamma | 2.161 102% | 2.164 102% | 2.24 98% | 2.192 100% | 2.137 103% | 2.23 99% |
| CCT | 7102 92% | 6816 95% | 6709 97% | 6173 105% | 6672 97% | 6731 97% |
| Total Average (Program / Settings) | 17% /
18% | 1% /
11% | 10% /
6% | -5% /
-5% | 10% /
17% |
* ... smaller is better
已安装面板的色彩空间覆盖范围令人失望。只能再现 sRGB 空间,而不能再现 AdobeRGB 和 DCI-P3 空间。不过,这与大多数竞争对手的显示屏并无不同。不过,作为一款以 "内容创作专业工作站 "为卖点的笔记本电脑,其屏幕确实应该提供完整的色彩范围。它的色彩还原看起来更好:2.26 的轻微偏差(目标:DeltaE < 3)可通过校准降至 1.03。
Display Response Times
| ↔ Response Time Black to White | ||
|---|---|---|
| 6.3 ms ... rise ↗ and fall ↘ combined | ↗ 2.5 ms rise | 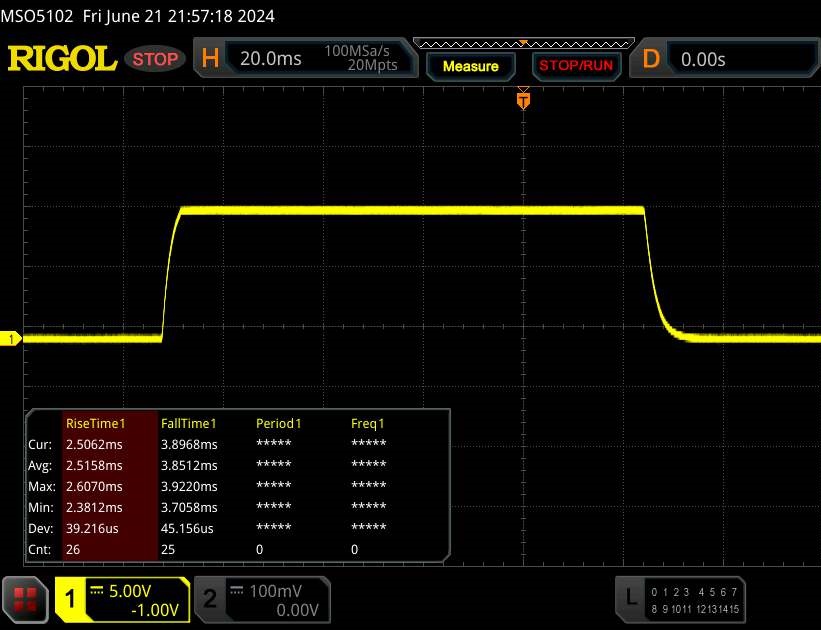 |
| ↘ 3.8 ms fall | ||
| The screen shows very fast response rates in our tests and should be very well suited for fast-paced gaming. In comparison, all tested devices range from 0.1 (minimum) to 240 (maximum) ms. » 17 % of all devices are better. This means that the measured response time is better than the average of all tested devices (20.8 ms). | ||
| ↔ Response Time 50% Grey to 80% Grey | ||
| 12.7 ms ... rise ↗ and fall ↘ combined | ↗ 6 ms rise | 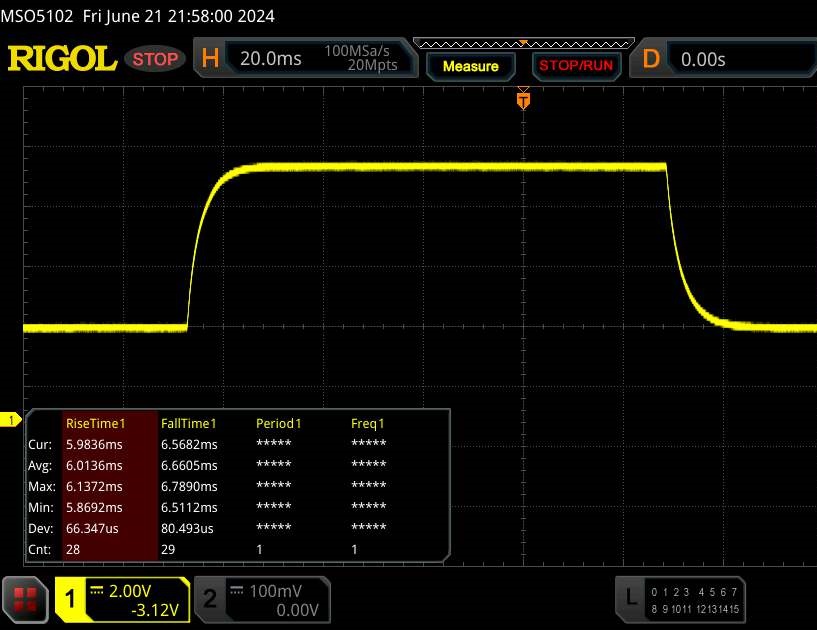 |
| ↘ 6.7 ms fall | ||
| The screen shows good response rates in our tests, but may be too slow for competitive gamers. In comparison, all tested devices range from 0.165 (minimum) to 636 (maximum) ms. » 23 % of all devices are better. This means that the measured response time is better than the average of all tested devices (32.5 ms). | ||
Screen Flickering / PWM (Pulse-Width Modulation)
| Screen flickering / PWM not detected |  | ||
In comparison: 53 % of all tested devices do not use PWM to dim the display. If PWM was detected, an average of 8529 (minimum: 5 - maximum: 343500) Hz was measured. | |||
性能 - Raptor Lake Refresh 取代 Raptor Lake
XMG Pro 16 Studio(Mid 24)被申克称为 "内容创作笔记本电脑",主要面向游戏玩家和创作者。所有型号都配备了酷睿 i9-14900HX,可选的 GPU 包括 RTX 4060 和 RTX 4070,我们的测试设备配备的是 RTX 4070。该型号的售价约为 2,500 美元。起价约为 1,800 美元。

测试条件
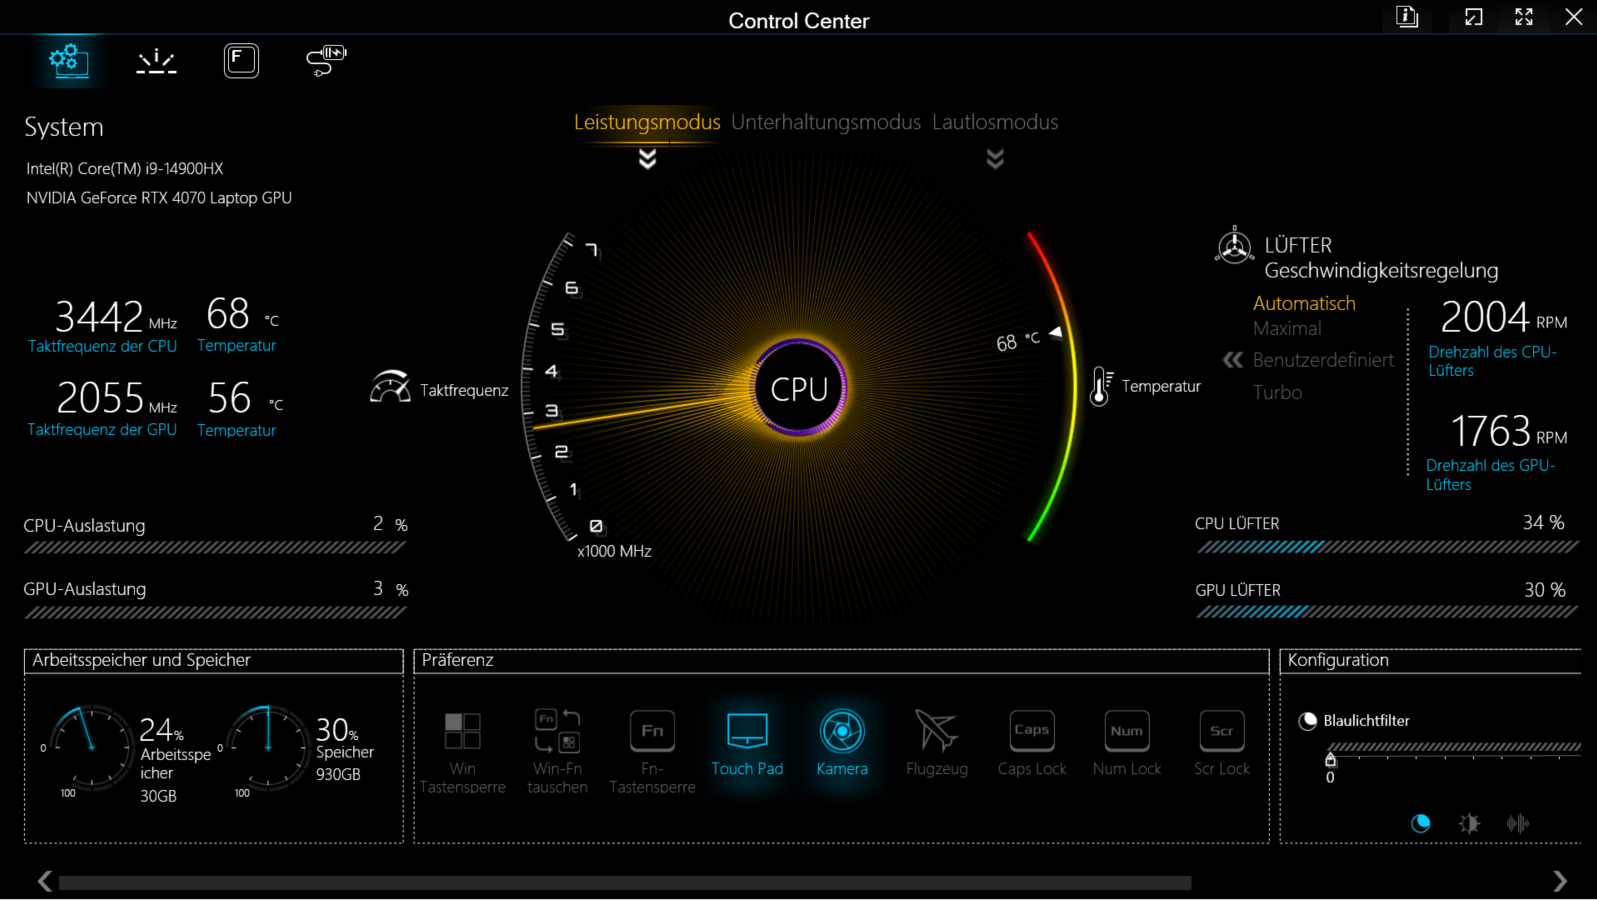
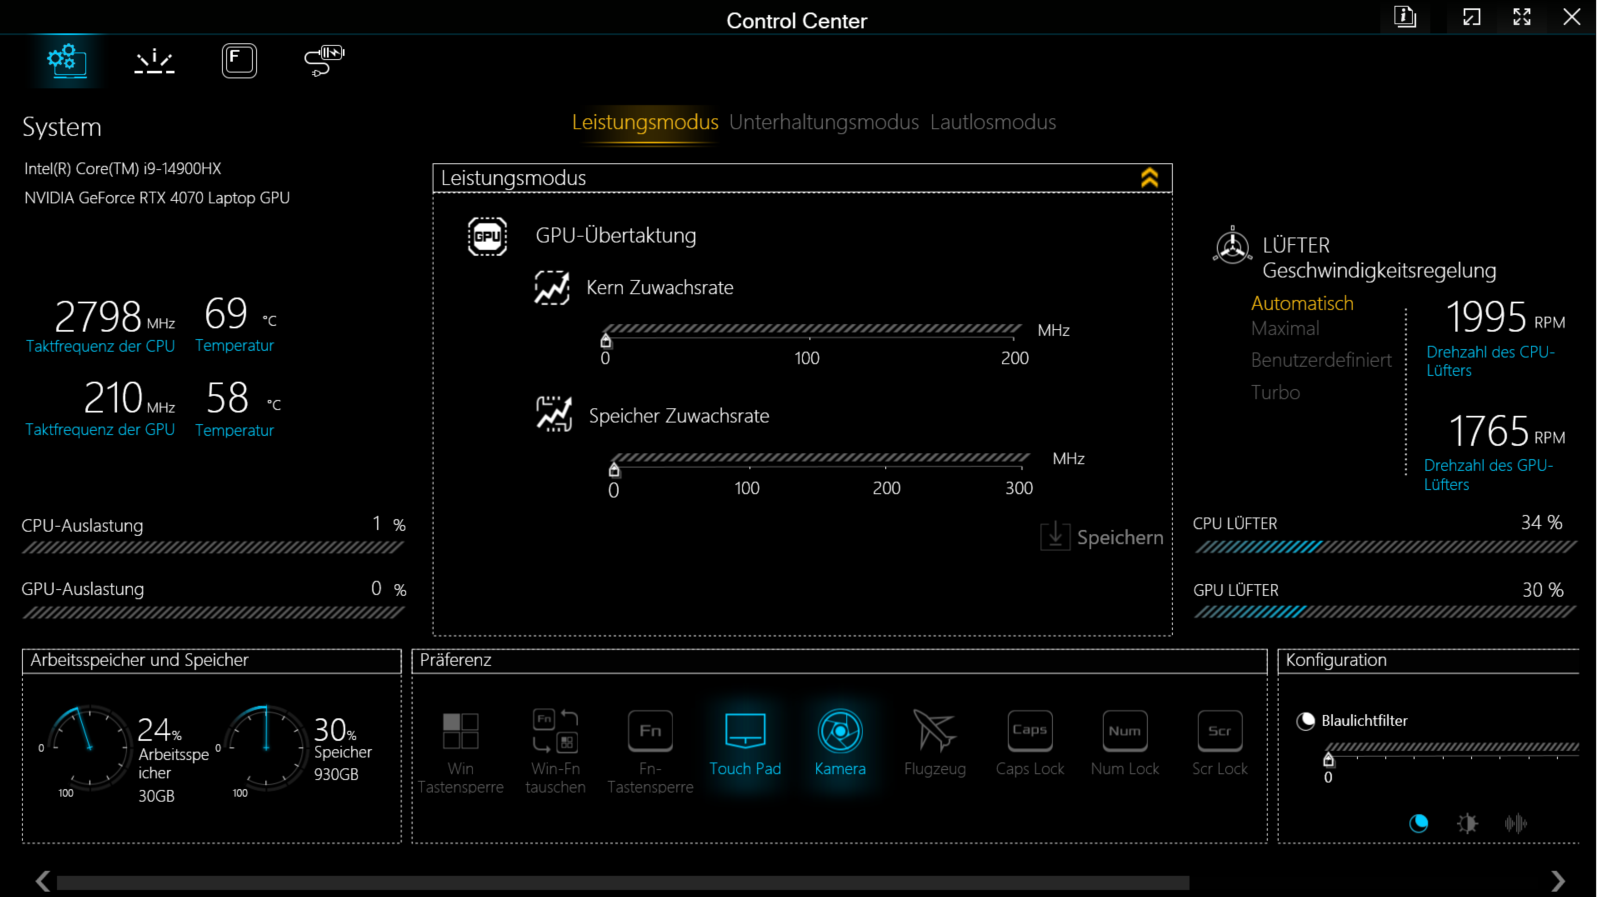
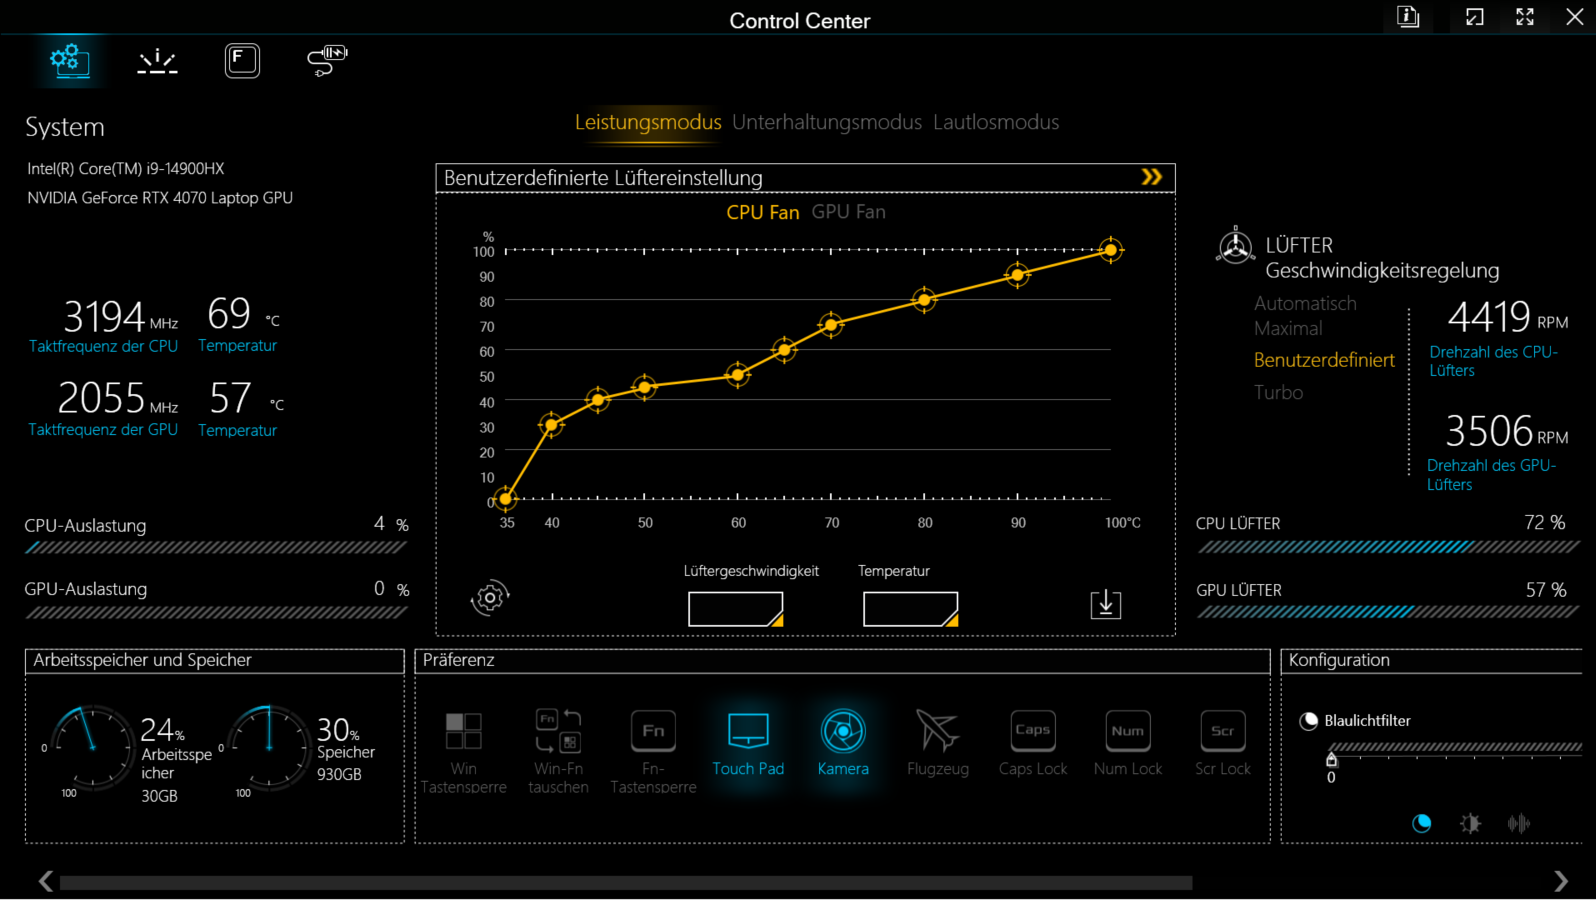
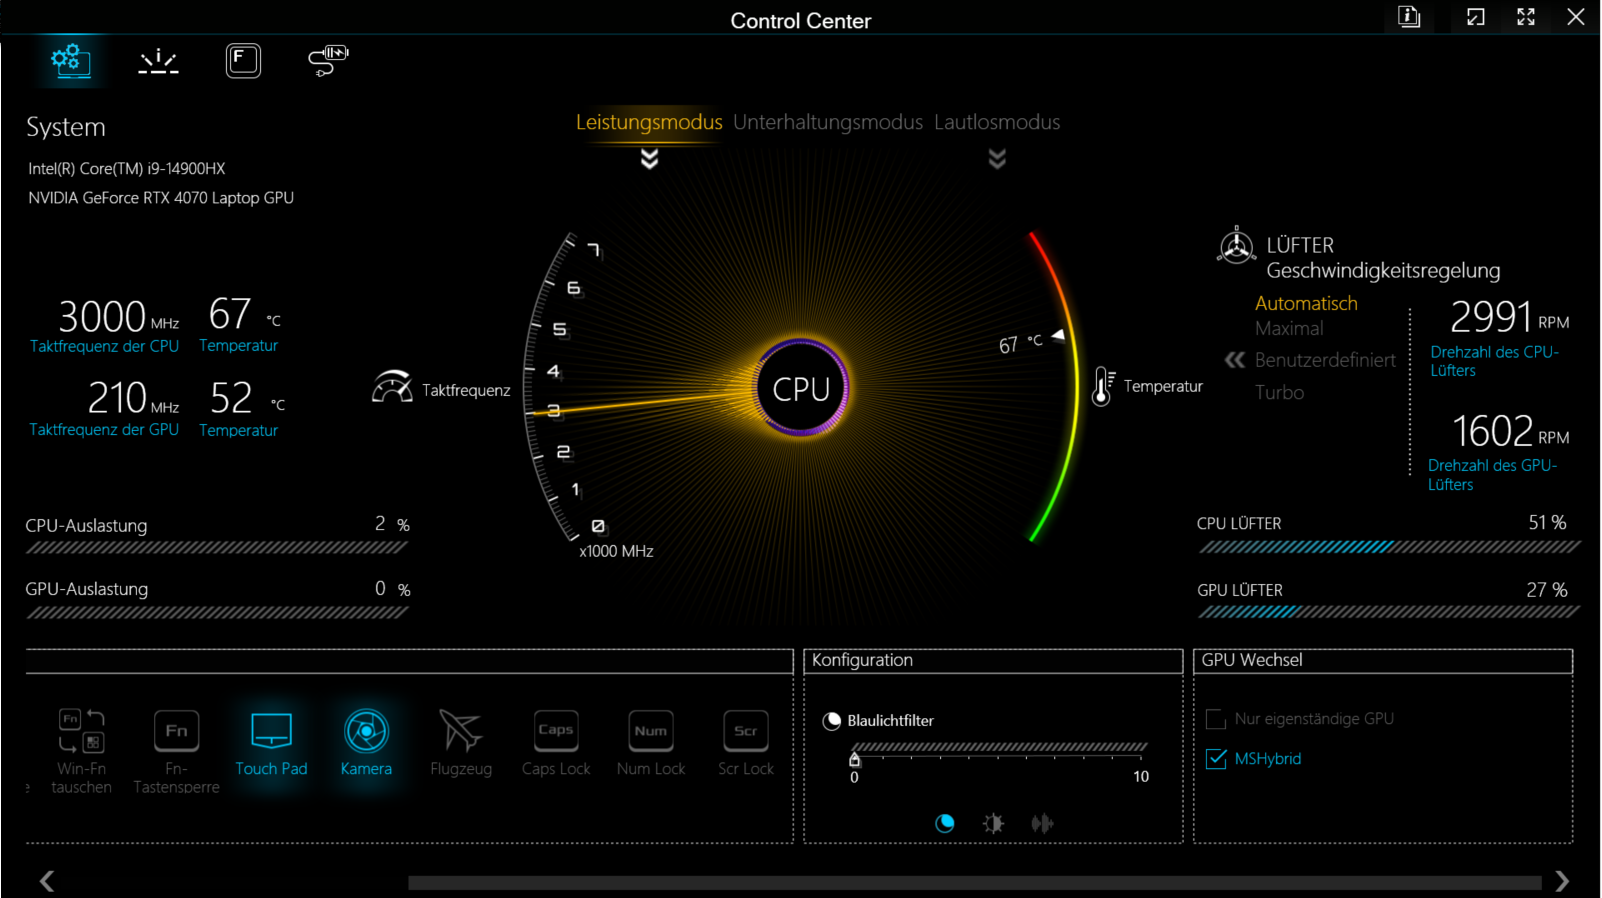
有三种制造商特定的性能模式可供选择(见表),可使用控制中心软件(笔记本电脑的控制中心)在三种模式之间切换。 我们使用了性能模式(基准测试)和静音模式(电池测试)。Optimus 处于激活状态。
| 性能模式 | 娱乐模式 | 静音模式(dGPU 关闭) | |
|---|---|---|---|
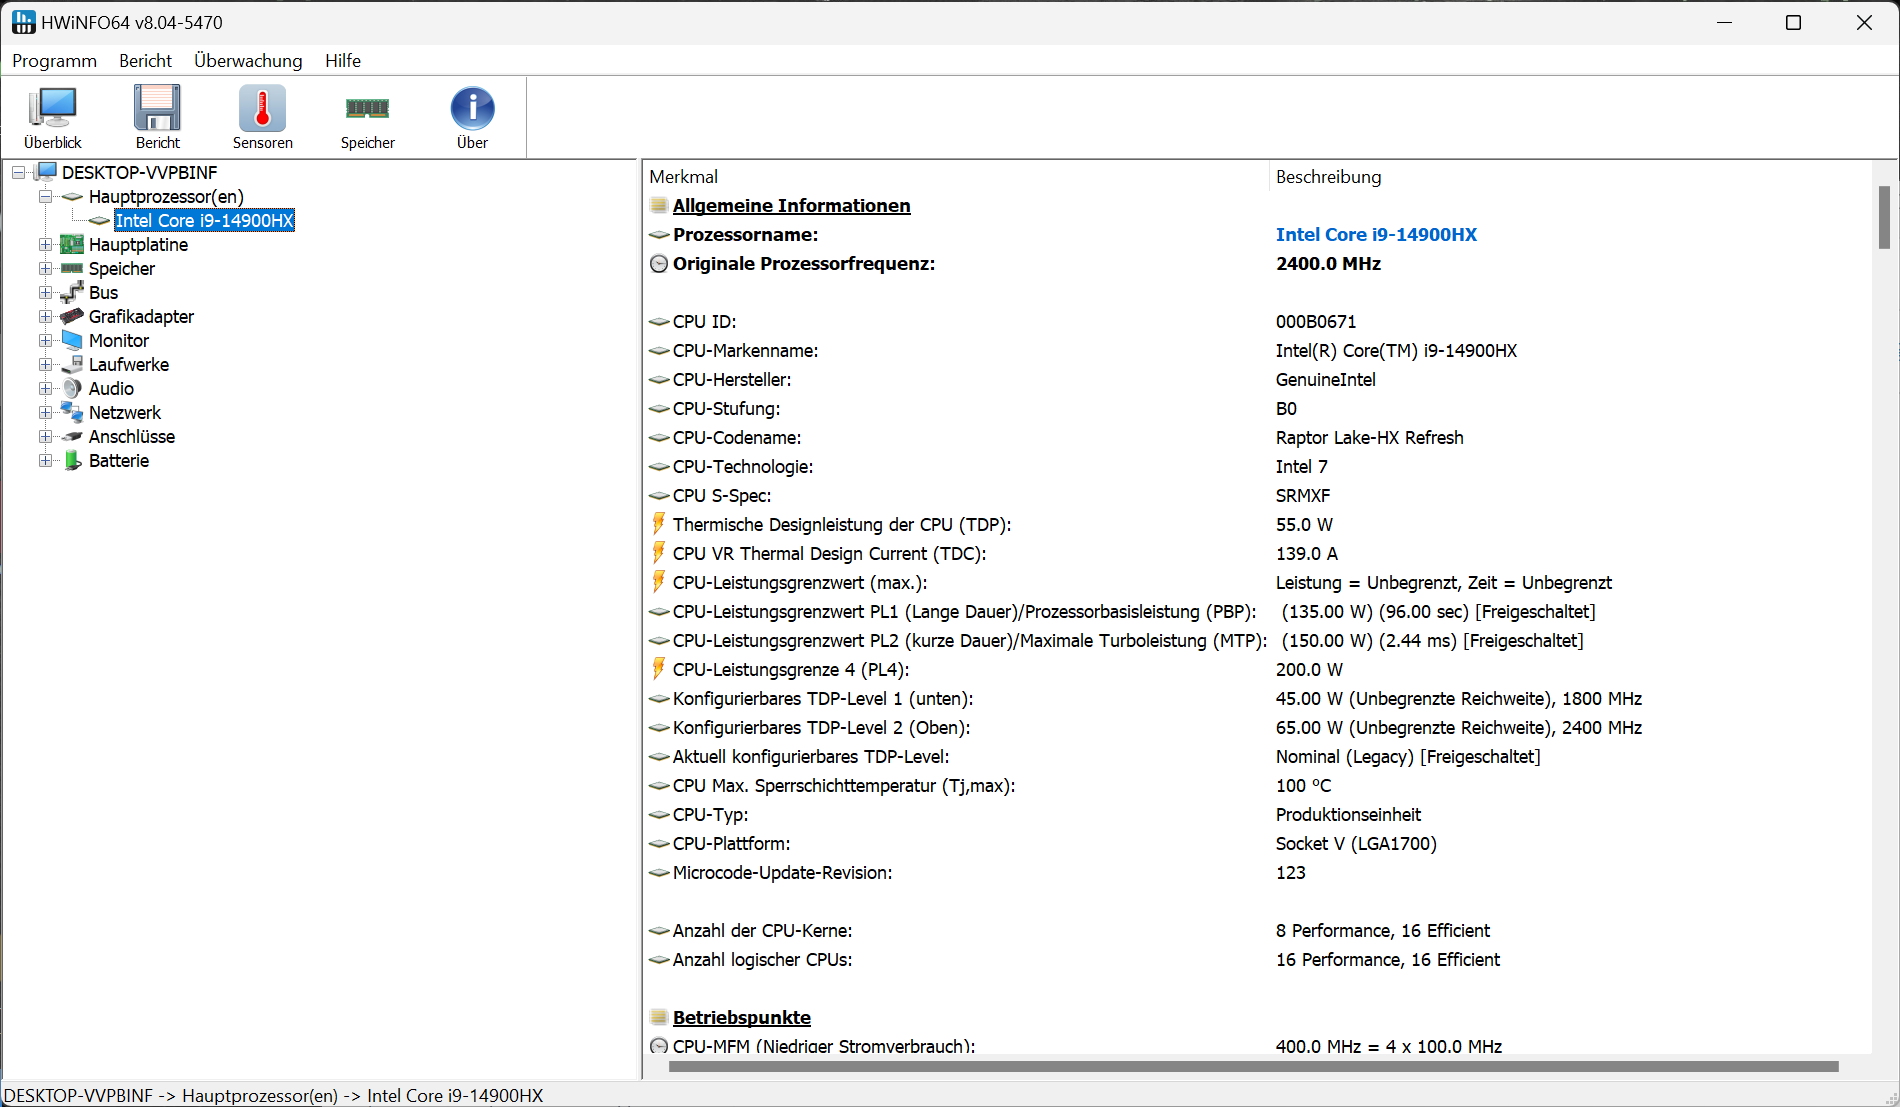
| 功率限制 1 (HWInfo) | 135 瓦 | 55 瓦 | 25 瓦 |
| 功率限制 2 (HWInfo) | 150 瓦 | 135 瓦 | 35 瓦 |
| 噪音(CP 2077 Phantom) | 53 dB (A) | 49 dB (A) | - |
| 性能(CP 2077 Phantom) | 78 fps | 73 fps | - |
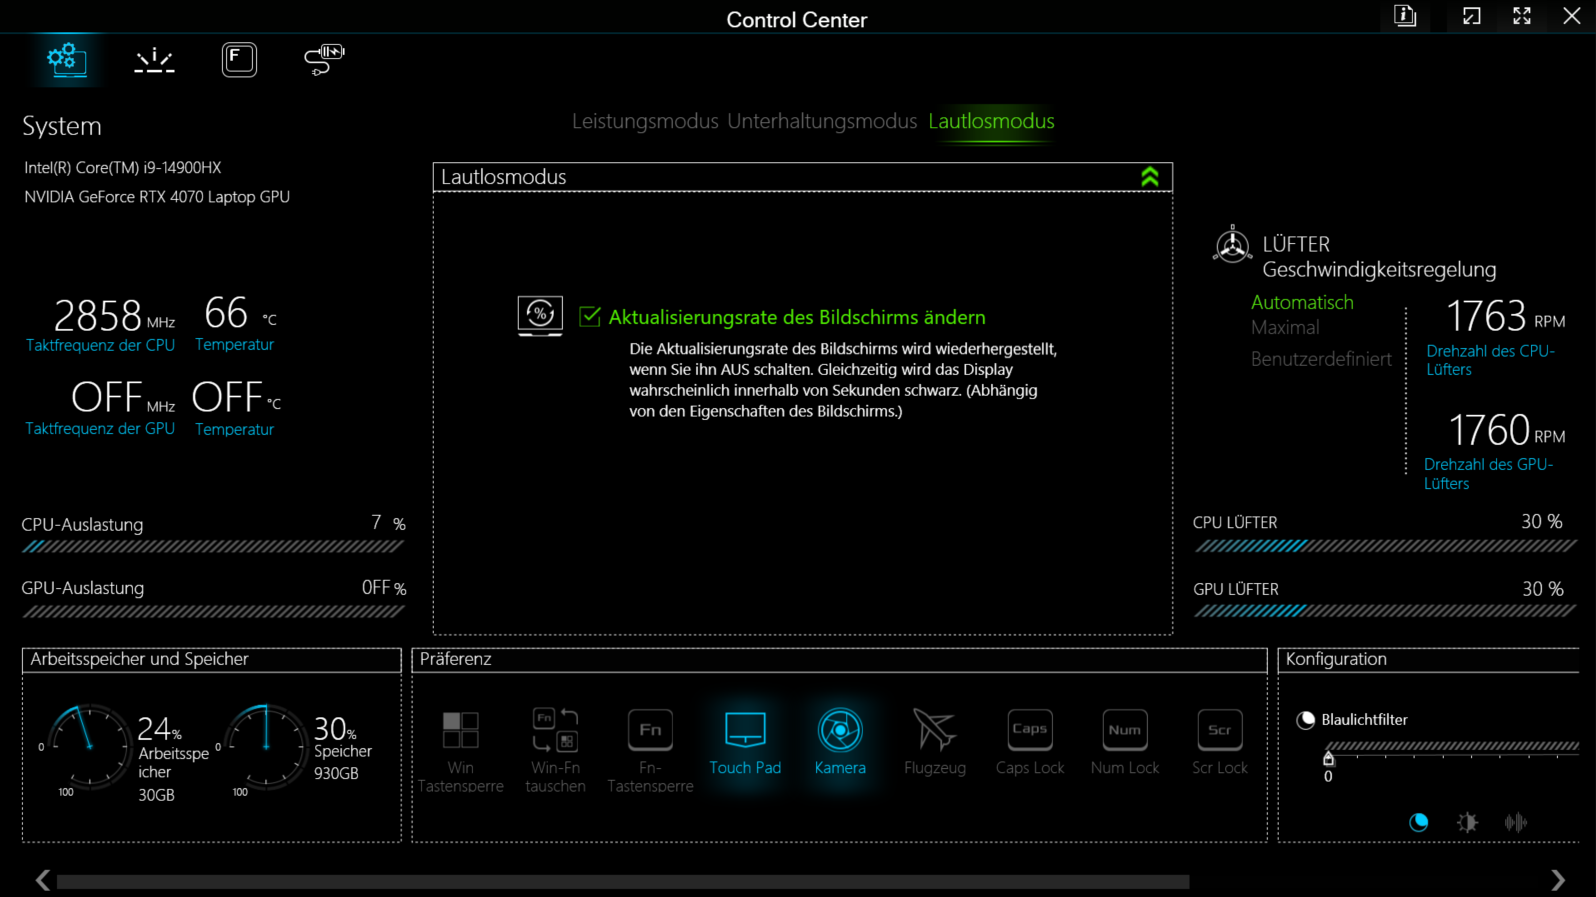
娱乐模式的问题
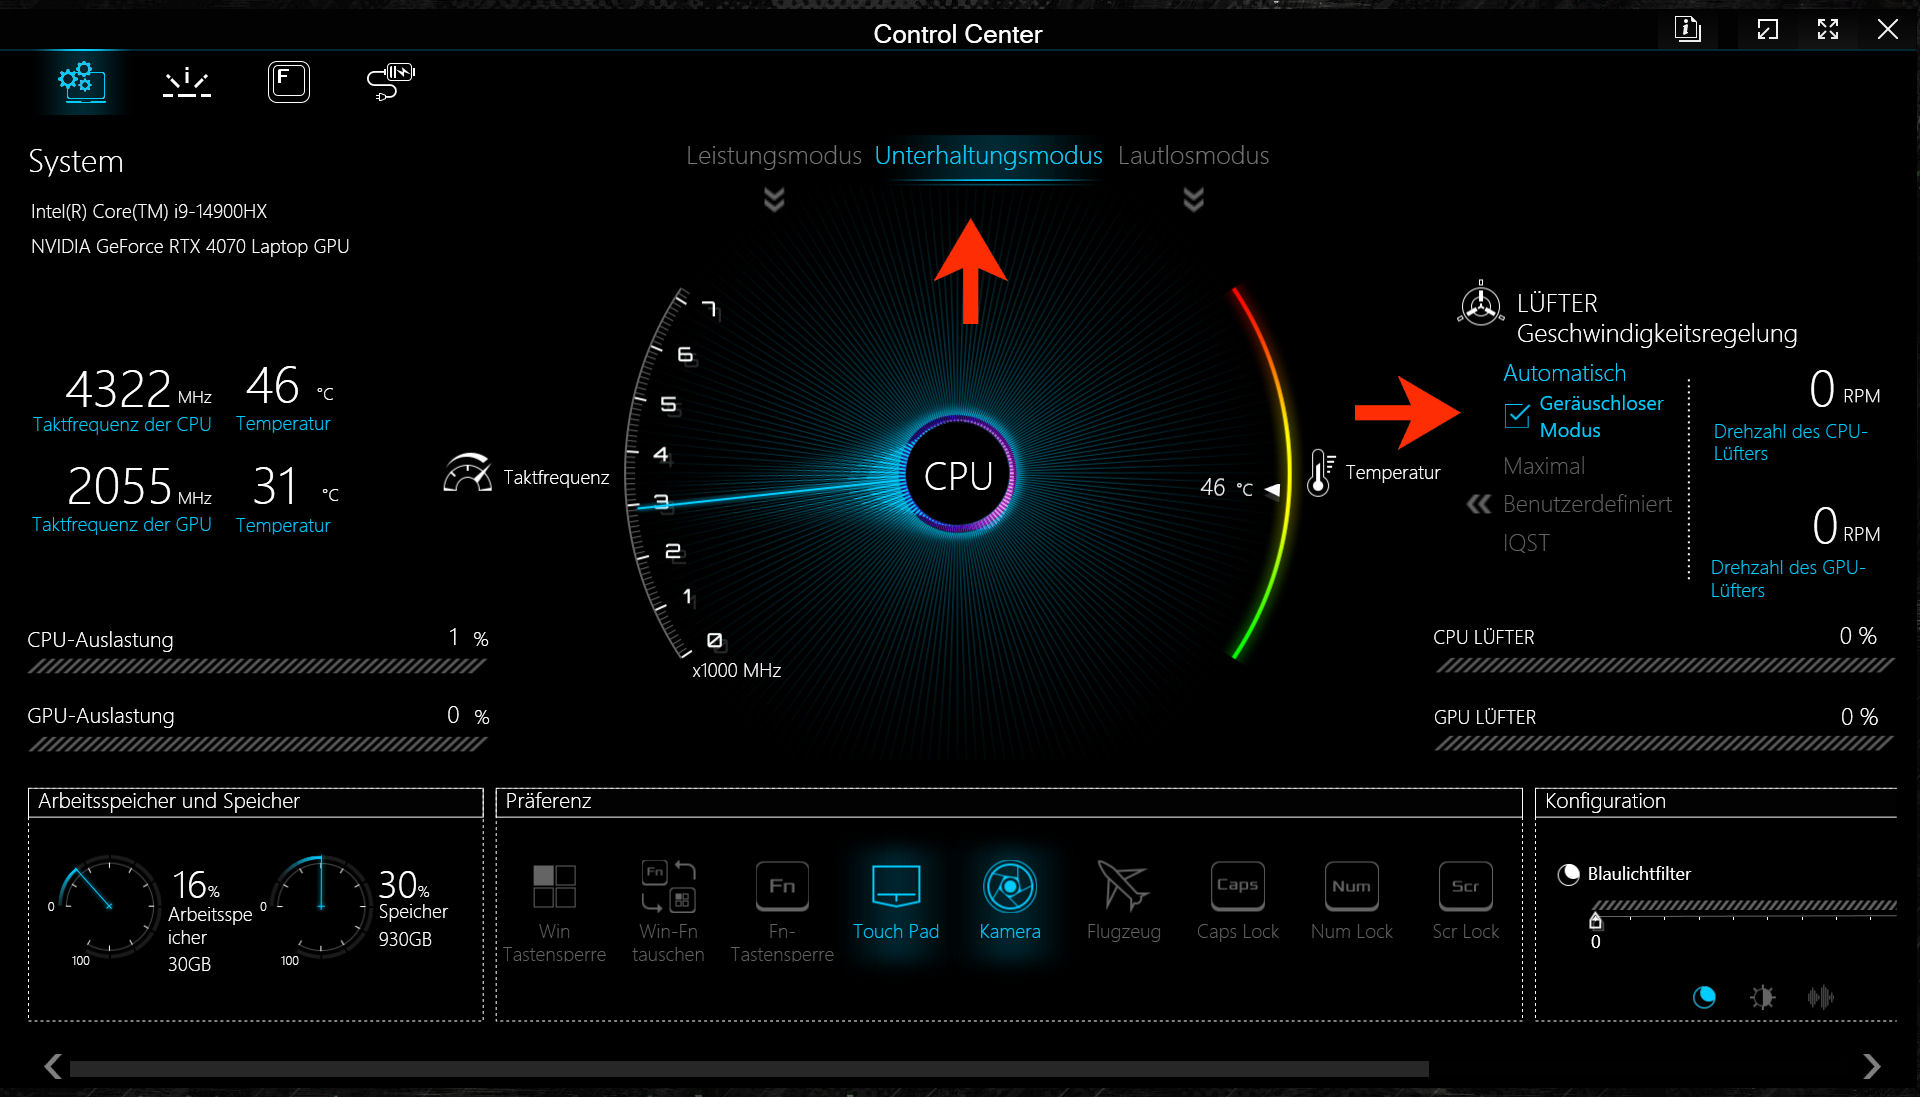
在测试过程中,"娱乐 "配置文件导致性能大幅波动。因此,我们没有使用它。在测试过程中,Schenker 找到了解决问题的方法:激活控制中心的 "静音模式 "风扇选项。未来的 BIOS 更新有望修复这一错误。
处理器
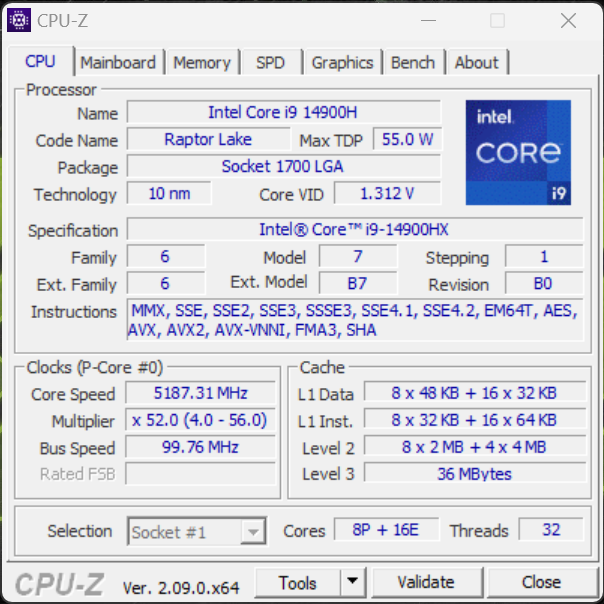
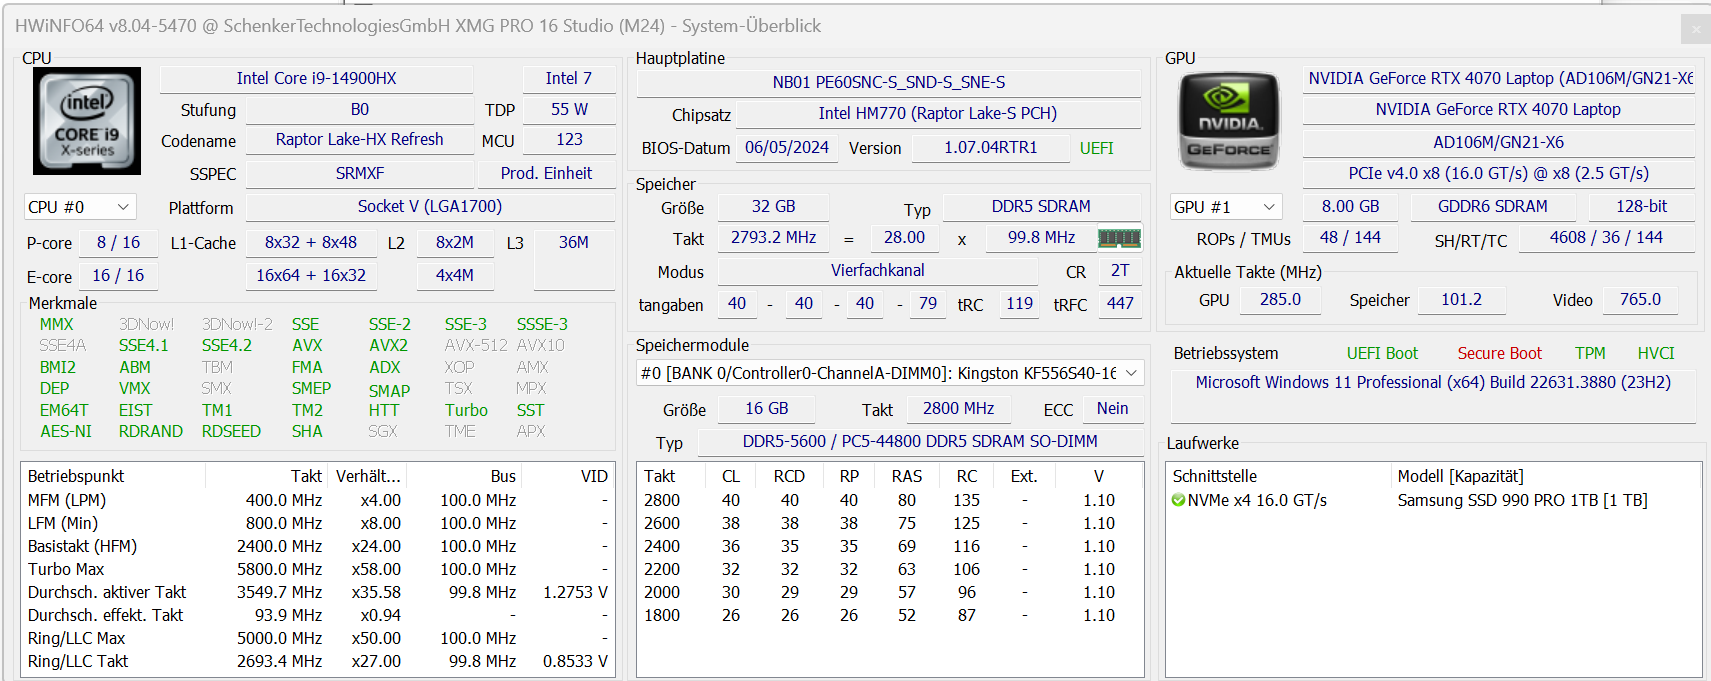
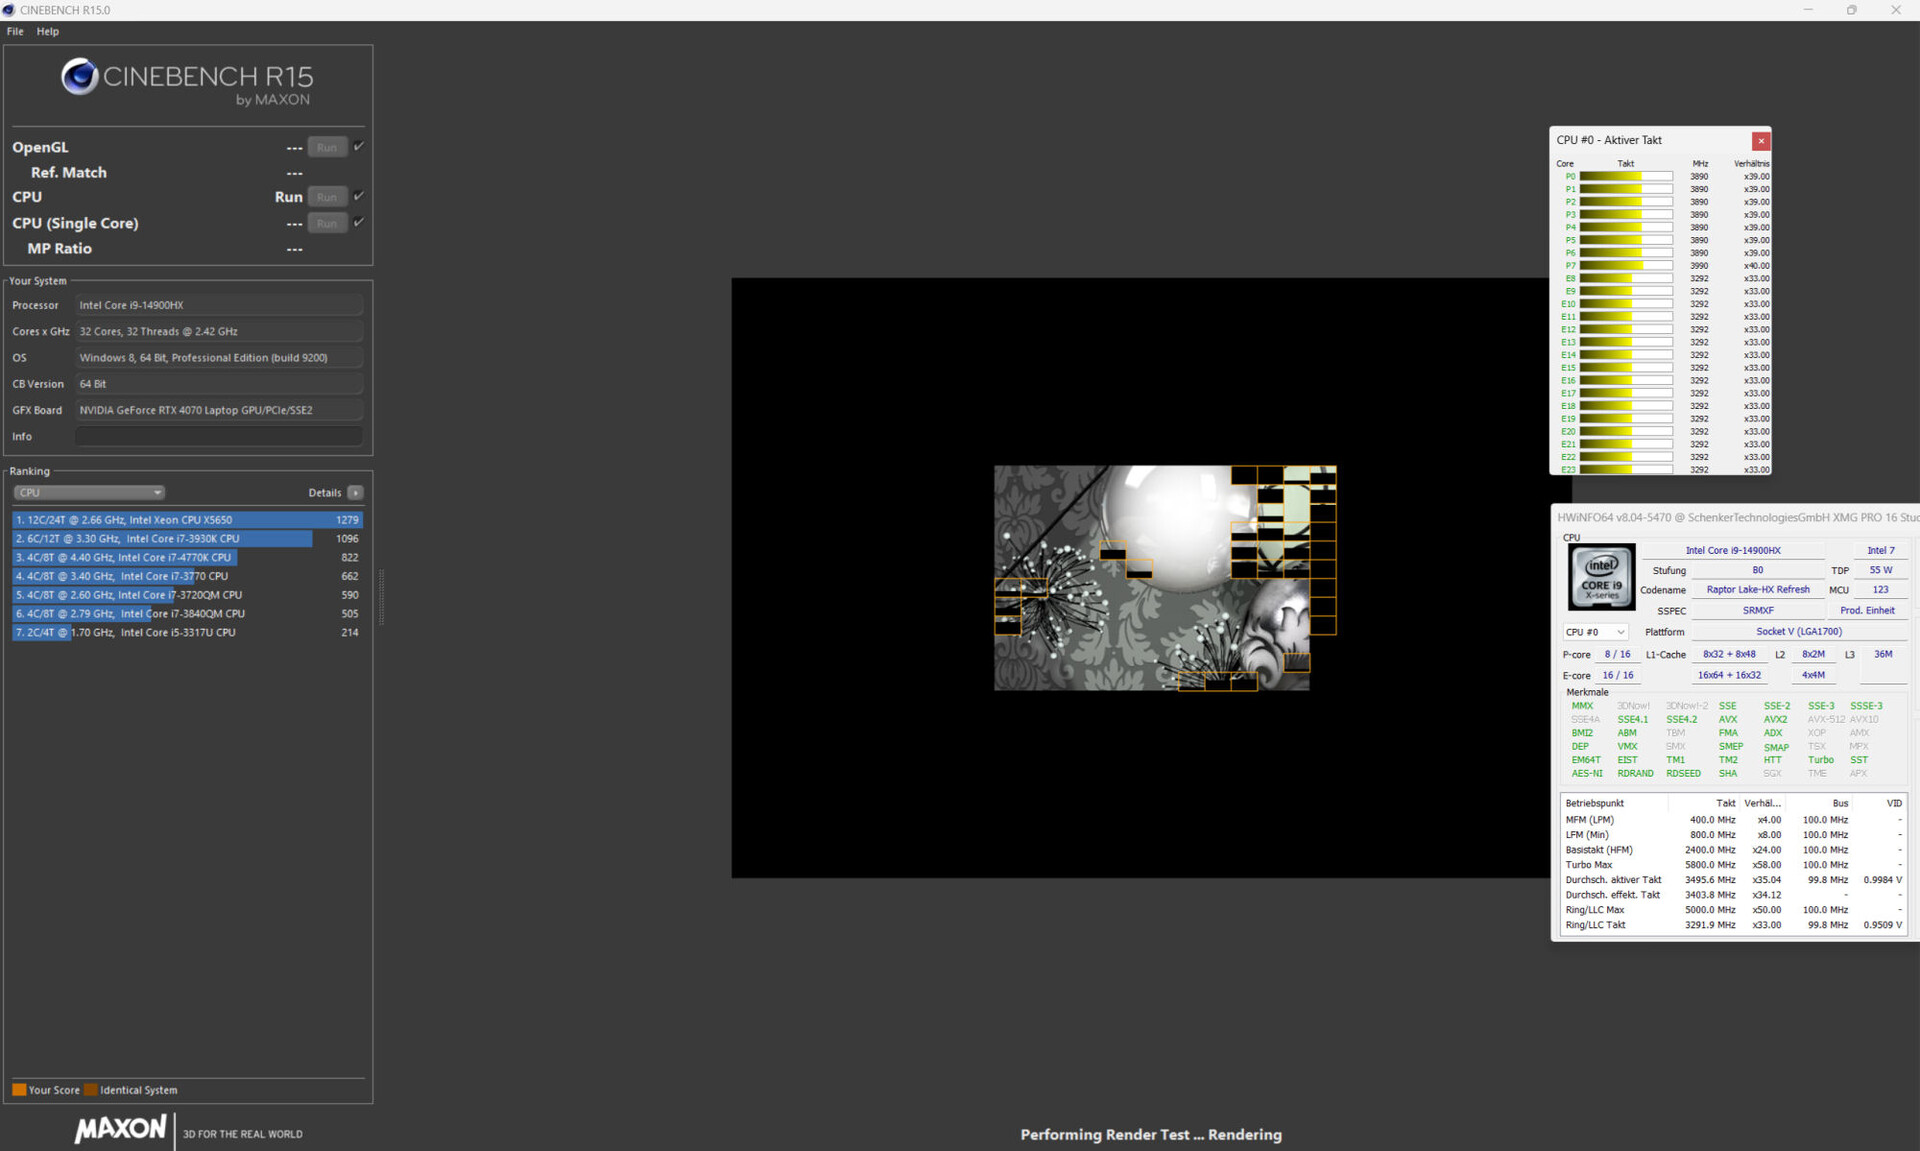
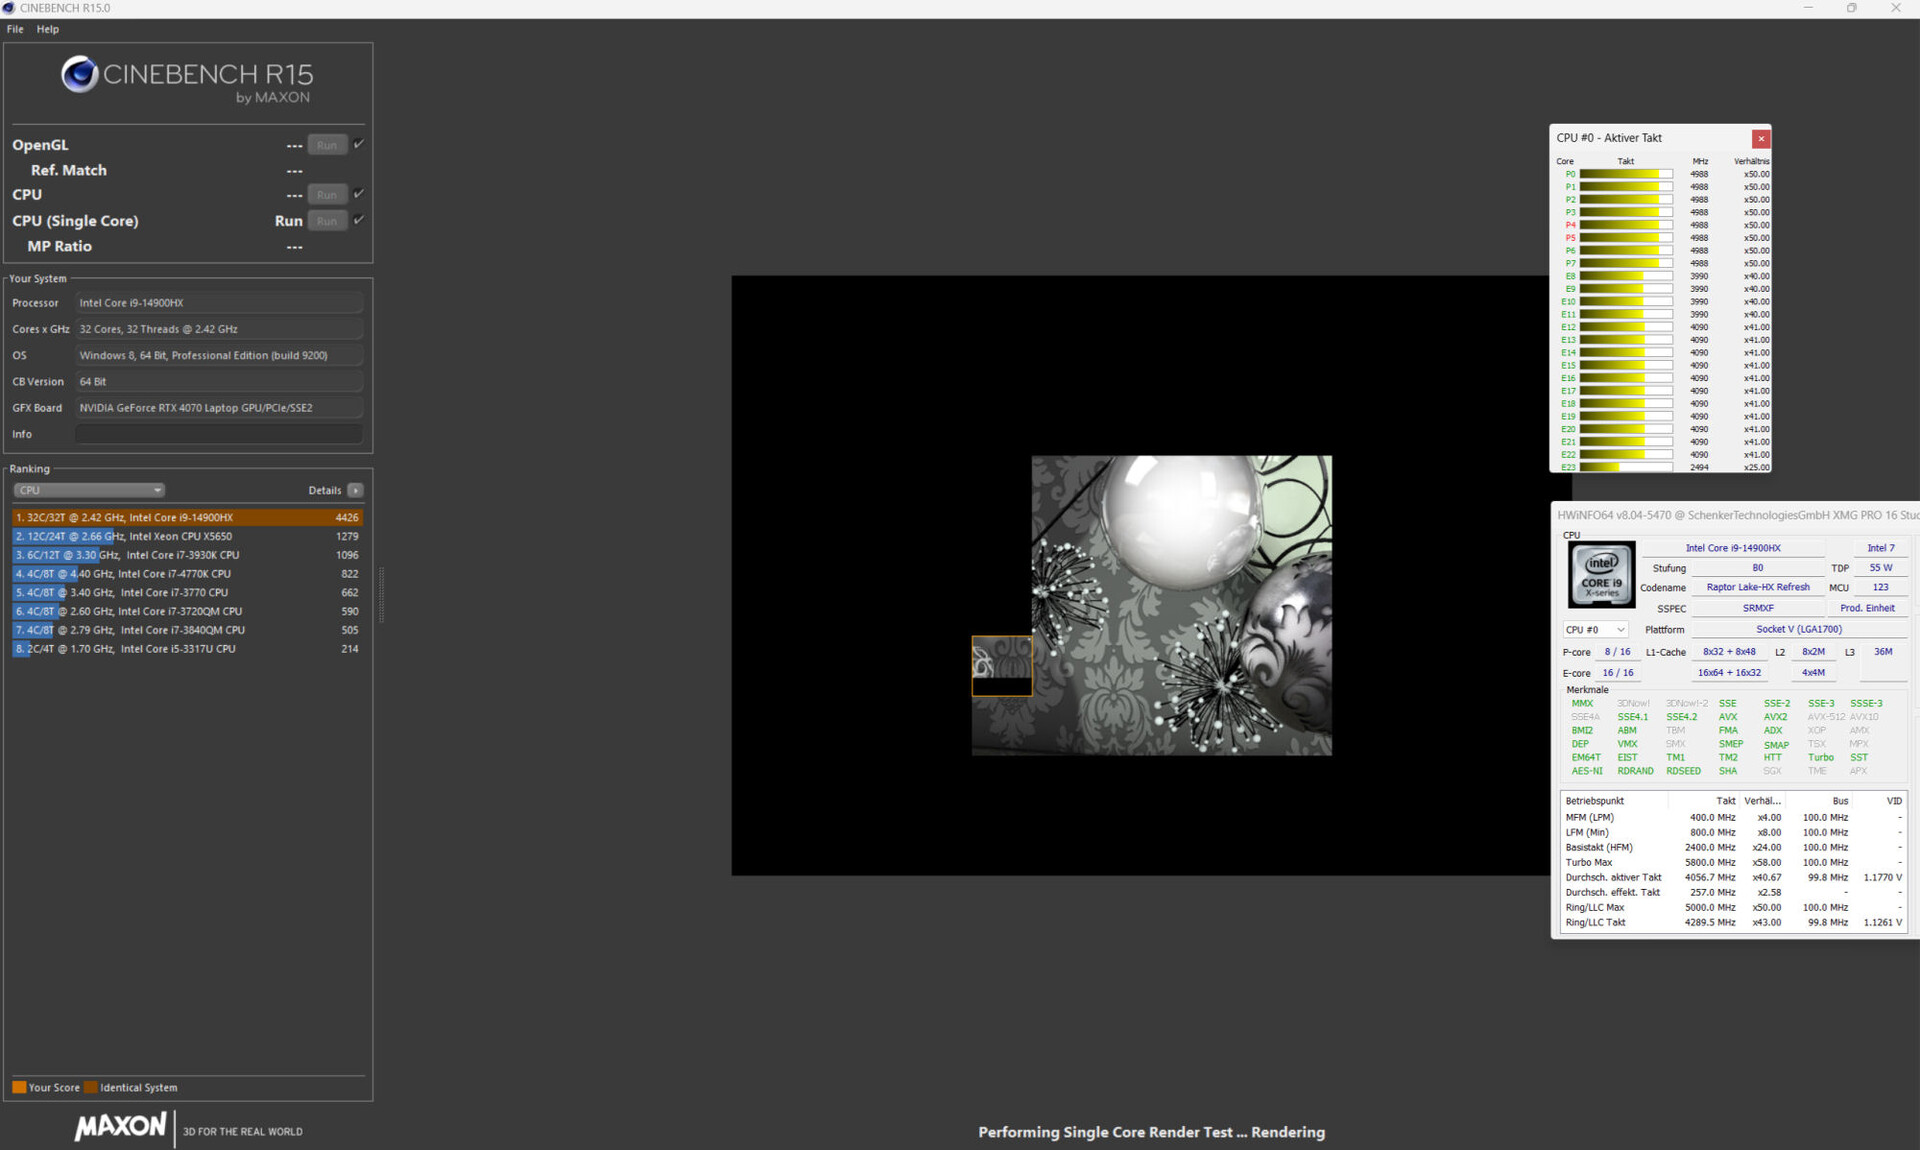
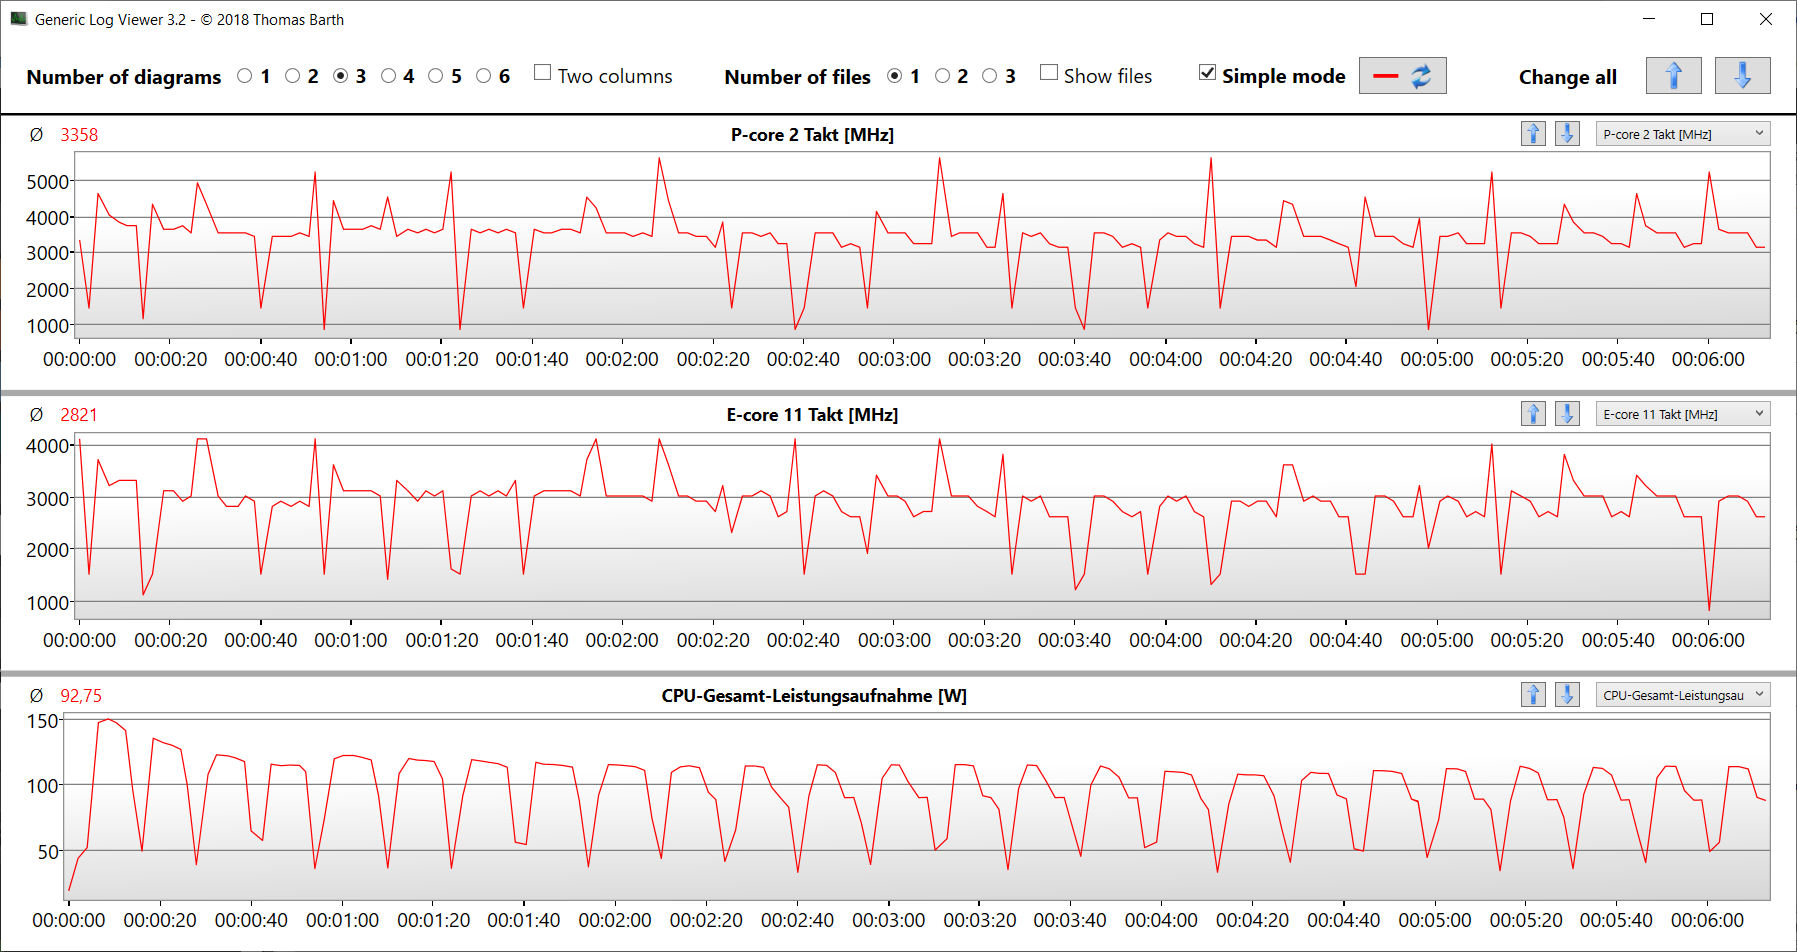
酷睿 i9-14900HX 酷睿 i9-14900HX(猛禽湖)用于所有 Pro 16 配置变体。它的 24 个内核(8P + 16E)总共可处理 32 个线程。一个惊喜:即使激活了性能模式,处理器也不能一直满负荷工作。连续的多线程负载(CB15 循环)导致 CPU 时钟从第一次运行到第五次运行时明显下降。之后,曲线趋于平缓。其基准测试结果低于之前的 CPU 平均值。
Cinebench R15 Multi continuous test
* ... smaller is better
AIDA64: FP32 Ray-Trace | FPU Julia | CPU SHA3 | CPU Queen | FPU SinJulia | FPU Mandel | CPU AES | CPU ZLib | FP64 Ray-Trace | CPU PhotoWorxx
| Performance Rating | |
| Lenovo Legion Pro 5 16IRX9 | |
| Average Intel Core i9-14900HX | |
| Aorus 16X 2024 | |
| Lenovo Legion 7 16 IRX G9 | |
| SCHENKER XMG Pro 16 Studio (Mid 24) | |
| Acer Predator Helios Neo 16 (2024) | |
| Average of class Gaming | |
| SCHENKER XMG Pro 16 Studio (Mid 23) | |
| AIDA64 / FP32 Ray-Trace | |
| Lenovo Legion 7 16 IRX G9 | |
| Lenovo Legion Pro 5 16IRX9 | |
| Average Intel Core i9-14900HX (13098 - 33474, n=36) | |
| Aorus 16X 2024 | |
| Average of class Gaming (4986 - 81639, n=147, last 2 years) | |
| Acer Predator Helios Neo 16 (2024) | |
| SCHENKER XMG Pro 16 Studio (Mid 24) | |
| SCHENKER XMG Pro 16 Studio (Mid 23) | |
| AIDA64 / FPU Julia | |
| Lenovo Legion Pro 5 16IRX9 | |
| Average Intel Core i9-14900HX (67573 - 166040, n=36) | |
| Lenovo Legion 7 16 IRX G9 | |
| Aorus 16X 2024 | |
| SCHENKER XMG Pro 16 Studio (Mid 24) | |
| Acer Predator Helios Neo 16 (2024) | |
| Average of class Gaming (25360 - 252486, n=147, last 2 years) | |
| SCHENKER XMG Pro 16 Studio (Mid 23) | |
| AIDA64 / CPU SHA3 | |
| Lenovo Legion Pro 5 16IRX9 | |
| Average Intel Core i9-14900HX (3589 - 7979, n=36) | |
| Aorus 16X 2024 | |
| Lenovo Legion 7 16 IRX G9 | |
| SCHENKER XMG Pro 16 Studio (Mid 24) | |
| Acer Predator Helios Neo 16 (2024) | |
| Average of class Gaming (1339 - 10389, n=147, last 2 years) | |
| SCHENKER XMG Pro 16 Studio (Mid 23) | |
| AIDA64 / CPU Queen | |
| Acer Predator Helios Neo 16 (2024) | |
| Lenovo Legion Pro 5 16IRX9 | |
| Lenovo Legion 7 16 IRX G9 | |
| Aorus 16X 2024 | |
| Average Intel Core i9-14900HX (118405 - 148966, n=36) | |
| SCHENKER XMG Pro 16 Studio (Mid 24) | |
| Average of class Gaming (50699 - 200651, n=147, last 2 years) | |
| SCHENKER XMG Pro 16 Studio (Mid 23) | |
| AIDA64 / FPU SinJulia | |
| Lenovo Legion Pro 5 16IRX9 | |
| Average Intel Core i9-14900HX (10475 - 18517, n=36) | |
| Aorus 16X 2024 | |
| Lenovo Legion 7 16 IRX G9 | |
| SCHENKER XMG Pro 16 Studio (Mid 24) | |
| Acer Predator Helios Neo 16 (2024) | |
| Average of class Gaming (4800 - 32988, n=147, last 2 years) | |
| SCHENKER XMG Pro 16 Studio (Mid 23) | |
| AIDA64 / FPU Mandel | |
| Lenovo Legion Pro 5 16IRX9 | |
| Average Intel Core i9-14900HX (32543 - 83662, n=36) | |
| Aorus 16X 2024 | |
| Acer Predator Helios Neo 16 (2024) | |
| Average of class Gaming (12321 - 134044, n=147, last 2 years) | |
| SCHENKER XMG Pro 16 Studio (Mid 24) | |
| Lenovo Legion 7 16 IRX G9 | |
| SCHENKER XMG Pro 16 Studio (Mid 23) | |
| AIDA64 / CPU AES | |
| SCHENKER XMG Pro 16 Studio (Mid 23) | |
| Average Intel Core i9-14900HX (86964 - 241777, n=36) | |
| Lenovo Legion Pro 5 16IRX9 | |
| Aorus 16X 2024 | |
| Lenovo Legion 7 16 IRX G9 | |
| SCHENKER XMG Pro 16 Studio (Mid 24) | |
| Average of class Gaming (19065 - 328679, n=147, last 2 years) | |
| Acer Predator Helios Neo 16 (2024) | |
| AIDA64 / CPU ZLib | |
| Lenovo Legion Pro 5 16IRX9 | |
| Average Intel Core i9-14900HX (1054 - 2292, n=36) | |
| Aorus 16X 2024 | |
| SCHENKER XMG Pro 16 Studio (Mid 24) | |
| Lenovo Legion 7 16 IRX G9 | |
| Acer Predator Helios Neo 16 (2024) | |
| Average of class Gaming (373 - 2531, n=147, last 2 years) | |
| SCHENKER XMG Pro 16 Studio (Mid 23) | |
| AIDA64 / FP64 Ray-Trace | |
| Lenovo Legion Pro 5 16IRX9 | |
| Average Intel Core i9-14900HX (6809 - 18349, n=36) | |
| Lenovo Legion 7 16 IRX G9 | |
| Aorus 16X 2024 | |
| Average of class Gaming (2540 - 43430, n=147, last 2 years) | |
| SCHENKER XMG Pro 16 Studio (Mid 24) | |
| Acer Predator Helios Neo 16 (2024) | |
| SCHENKER XMG Pro 16 Studio (Mid 23) | |
| AIDA64 / CPU PhotoWorxx | |
| Lenovo Legion Pro 5 16IRX9 | |
| Aorus 16X 2024 | |
| SCHENKER XMG Pro 16 Studio (Mid 24) | |
| Lenovo Legion 7 16 IRX G9 | |
| SCHENKER XMG Pro 16 Studio (Mid 23) | |
| Average Intel Core i9-14900HX (23903 - 54702, n=36) | |
| Acer Predator Helios Neo 16 (2024) | |
| Average of class Gaming (10805 - 60161, n=147, last 2 years) | |
系统性能
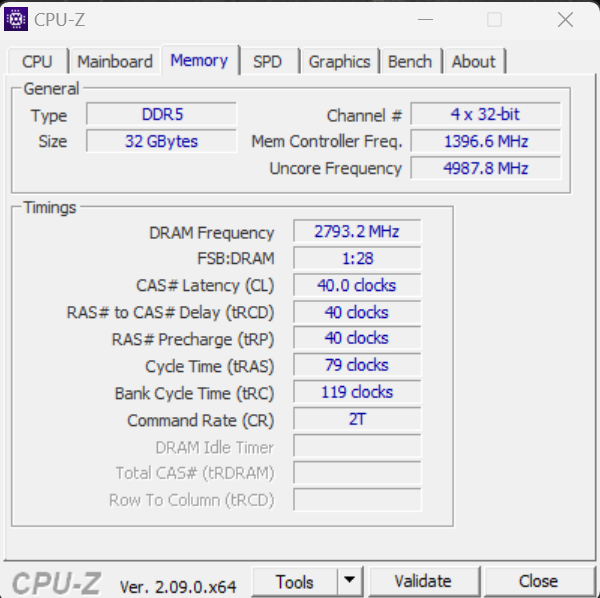
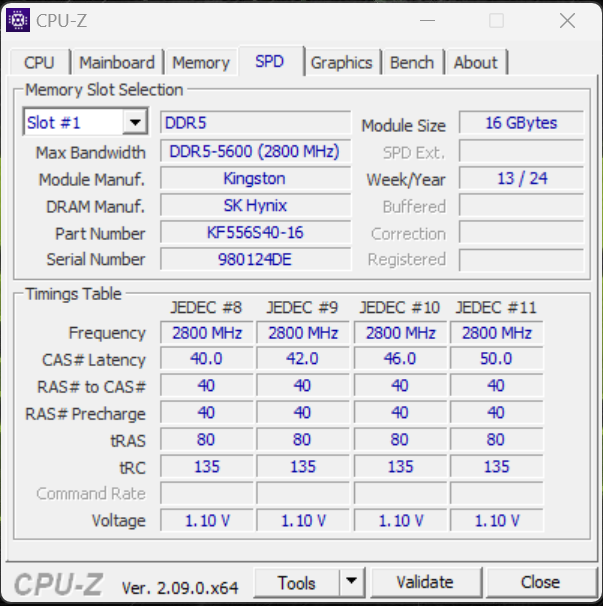
运行流畅的系统为游戏、渲染和流媒体传输提供了足够的性能,但所安装的硬件无法创造任何新纪录。内存的传输速率处于 DDR5-5600 内存的正常水平。

CrossMark: Overall | Productivity | Creativity | Responsiveness
WebXPRT 3: Overall
WebXPRT 4: Overall
Mozilla Kraken 1.1: Total
| PCMark 10 / Score | |
| Lenovo Legion Pro 5 16IRX9 | |
| Aorus 16X 2024 | |
| Acer Predator Helios Neo 16 (2024) | |
| Average Intel Core i9-14900HX, NVIDIA GeForce RTX 4070 Laptop GPU (7768 - 8550, n=8) | |
| SCHENKER XMG Pro 16 Studio (Mid 24) | |
| Lenovo Legion 7 16 IRX G9 | |
| SCHENKER XMG Pro 16 Studio (Mid 23) | |
| Average of class Gaming (5776 - 9852, n=133, last 2 years) | |
| PCMark 10 / Essentials | |
| SCHENKER XMG Pro 16 Studio (Mid 23) | |
| Acer Predator Helios Neo 16 (2024) | |
| Lenovo Legion Pro 5 16IRX9 | |
| Aorus 16X 2024 | |
| Lenovo Legion 7 16 IRX G9 | |
| Average Intel Core i9-14900HX, NVIDIA GeForce RTX 4070 Laptop GPU (10104 - 11815, n=8) | |
| Average of class Gaming (9057 - 12600, n=133, last 2 years) | |
| SCHENKER XMG Pro 16 Studio (Mid 24) | |
| PCMark 10 / Productivity | |
| Aorus 16X 2024 | |
| SCHENKER XMG Pro 16 Studio (Mid 24) | |
| Average Intel Core i9-14900HX, NVIDIA GeForce RTX 4070 Laptop GPU (9577 - 11103, n=8) | |
| SCHENKER XMG Pro 16 Studio (Mid 23) | |
| Acer Predator Helios Neo 16 (2024) | |
| Lenovo Legion Pro 5 16IRX9 | |
| Average of class Gaming (6662 - 14612, n=133, last 2 years) | |
| Lenovo Legion 7 16 IRX G9 | |
| PCMark 10 / Digital Content Creation | |
| Lenovo Legion Pro 5 16IRX9 | |
| Lenovo Legion 7 16 IRX G9 | |
| Average Intel Core i9-14900HX, NVIDIA GeForce RTX 4070 Laptop GPU (12114 - 14827, n=8) | |
| Aorus 16X 2024 | |
| Acer Predator Helios Neo 16 (2024) | |
| SCHENKER XMG Pro 16 Studio (Mid 24) | |
| Average of class Gaming (6807 - 18475, n=133, last 2 years) | |
| SCHENKER XMG Pro 16 Studio (Mid 23) | |
| CrossMark / Overall | |
| Aorus 16X 2024 | |
| Lenovo Legion 7 16 IRX G9 | |
| Acer Predator Helios Neo 16 (2024) | |
| Average Intel Core i9-14900HX, NVIDIA GeForce RTX 4070 Laptop GPU (2002 - 2312, n=7) | |
| SCHENKER XMG Pro 16 Studio (Mid 24) | |
| Lenovo Legion Pro 5 16IRX9 | |
| SCHENKER XMG Pro 16 Studio (Mid 23) | |
| Average of class Gaming (1247 - 2344, n=114, last 2 years) | |
| CrossMark / Productivity | |
| Aorus 16X 2024 | |
| Lenovo Legion 7 16 IRX G9 | |
| Acer Predator Helios Neo 16 (2024) | |
| Average Intel Core i9-14900HX, NVIDIA GeForce RTX 4070 Laptop GPU (1827 - 2191, n=7) | |
| SCHENKER XMG Pro 16 Studio (Mid 24) | |
| SCHENKER XMG Pro 16 Studio (Mid 23) | |
| Lenovo Legion Pro 5 16IRX9 | |
| Average of class Gaming (1299 - 2204, n=114, last 2 years) | |
| CrossMark / Creativity | |
| Aorus 16X 2024 | |
| Acer Predator Helios Neo 16 (2024) | |
| Lenovo Legion 7 16 IRX G9 | |
| SCHENKER XMG Pro 16 Studio (Mid 24) | |
| Average Intel Core i9-14900HX, NVIDIA GeForce RTX 4070 Laptop GPU (2258 - 2458, n=7) | |
| Lenovo Legion Pro 5 16IRX9 | |
| Average of class Gaming (1275 - 2660, n=114, last 2 years) | |
| SCHENKER XMG Pro 16 Studio (Mid 23) | |
| CrossMark / Responsiveness | |
| Lenovo Legion 7 16 IRX G9 | |
| Aorus 16X 2024 | |
| Average Intel Core i9-14900HX, NVIDIA GeForce RTX 4070 Laptop GPU (1734 - 2330, n=7) | |
| Acer Predator Helios Neo 16 (2024) | |
| SCHENKER XMG Pro 16 Studio (Mid 23) | |
| Lenovo Legion Pro 5 16IRX9 | |
| SCHENKER XMG Pro 16 Studio (Mid 24) | |
| Average of class Gaming (1030 - 2330, n=114, last 2 years) | |
| WebXPRT 3 / Overall | |
| Lenovo Legion 7 16 IRX G9 | |
| Aorus 16X 2024 | |
| Acer Predator Helios Neo 16 (2024) | |
| Lenovo Legion Pro 5 16IRX9 | |
| Average Intel Core i9-14900HX, NVIDIA GeForce RTX 4070 Laptop GPU (269 - 342, n=8) | |
| SCHENKER XMG Pro 16 Studio (Mid 23) | |
| SCHENKER XMG Pro 16 Studio (Mid 24) | |
| Average of class Gaming (215 - 480, n=127, last 2 years) | |
| WebXPRT 4 / Overall | |
| Acer Predator Helios Neo 16 (2024) | |
| SCHENKER XMG Pro 16 Studio (Mid 24) | |
| Average Intel Core i9-14900HX, NVIDIA GeForce RTX 4070 Laptop GPU (291 - 304, n=6) | |
| Lenovo Legion 7 16 IRX G9 | |
| Lenovo Legion Pro 5 16IRX9 | |
| Average of class Gaming (176.4 - 335, n=115, last 2 years) | |
| Mozilla Kraken 1.1 / Total | |
| SCHENKER XMG Pro 16 Studio (Mid 23) | |
| Average of class Gaming (409 - 674, n=139, last 2 years) | |
| SCHENKER XMG Pro 16 Studio (Mid 24) | |
| Lenovo Legion Pro 5 16IRX9 | |
| Average Intel Core i9-14900HX, NVIDIA GeForce RTX 4070 Laptop GPU (431 - 469, n=8) | |
| Acer Predator Helios Neo 16 (2024) | |
| Lenovo Legion 7 16 IRX G9 | |
| Aorus 16X 2024 | |
* ... smaller is better
| PCMark 10 Score | 8166 points | |
Help | ||
| AIDA64 / Memory Copy | |
| Lenovo Legion Pro 5 16IRX9 | |
| Lenovo Legion 7 16 IRX G9 | |
| Aorus 16X 2024 | |
| SCHENKER XMG Pro 16 Studio (Mid 24) | |
| Acer Predator Helios Neo 16 (2024) | |
| Average Intel Core i9-14900HX (38028 - 83392, n=36) | |
| SCHENKER XMG Pro 16 Studio (Mid 23) | |
| Average of class Gaming (21750 - 97515, n=147, last 2 years) | |
| AIDA64 / Memory Read | |
| Aorus 16X 2024 | |
| Lenovo Legion Pro 5 16IRX9 | |
| Lenovo Legion 7 16 IRX G9 | |
| SCHENKER XMG Pro 16 Studio (Mid 24) | |
| Acer Predator Helios Neo 16 (2024) | |
| Average Intel Core i9-14900HX (43306 - 87568, n=36) | |
| SCHENKER XMG Pro 16 Studio (Mid 23) | |
| Average of class Gaming (22956 - 102937, n=147, last 2 years) | |
| AIDA64 / Memory Write | |
| Aorus 16X 2024 | |
| Lenovo Legion Pro 5 16IRX9 | |
| Lenovo Legion 7 16 IRX G9 | |
| SCHENKER XMG Pro 16 Studio (Mid 24) | |
| Average Intel Core i9-14900HX (37146 - 80589, n=36) | |
| SCHENKER XMG Pro 16 Studio (Mid 23) | |
| Acer Predator Helios Neo 16 (2024) | |
| Average of class Gaming (22297 - 108954, n=147, last 2 years) | |
| AIDA64 / Memory Latency | |
| Average of class Gaming (59.5 - 259, n=147, last 2 years) | |
| Acer Predator Helios Neo 16 (2024) | |
| SCHENKER XMG Pro 16 Studio (Mid 23) | |
| Average Intel Core i9-14900HX (76.1 - 105, n=36) | |
| SCHENKER XMG Pro 16 Studio (Mid 24) | |
| Lenovo Legion 7 16 IRX G9 | |
| Lenovo Legion Pro 5 16IRX9 | |
| Aorus 16X 2024 | |
* ... smaller is better
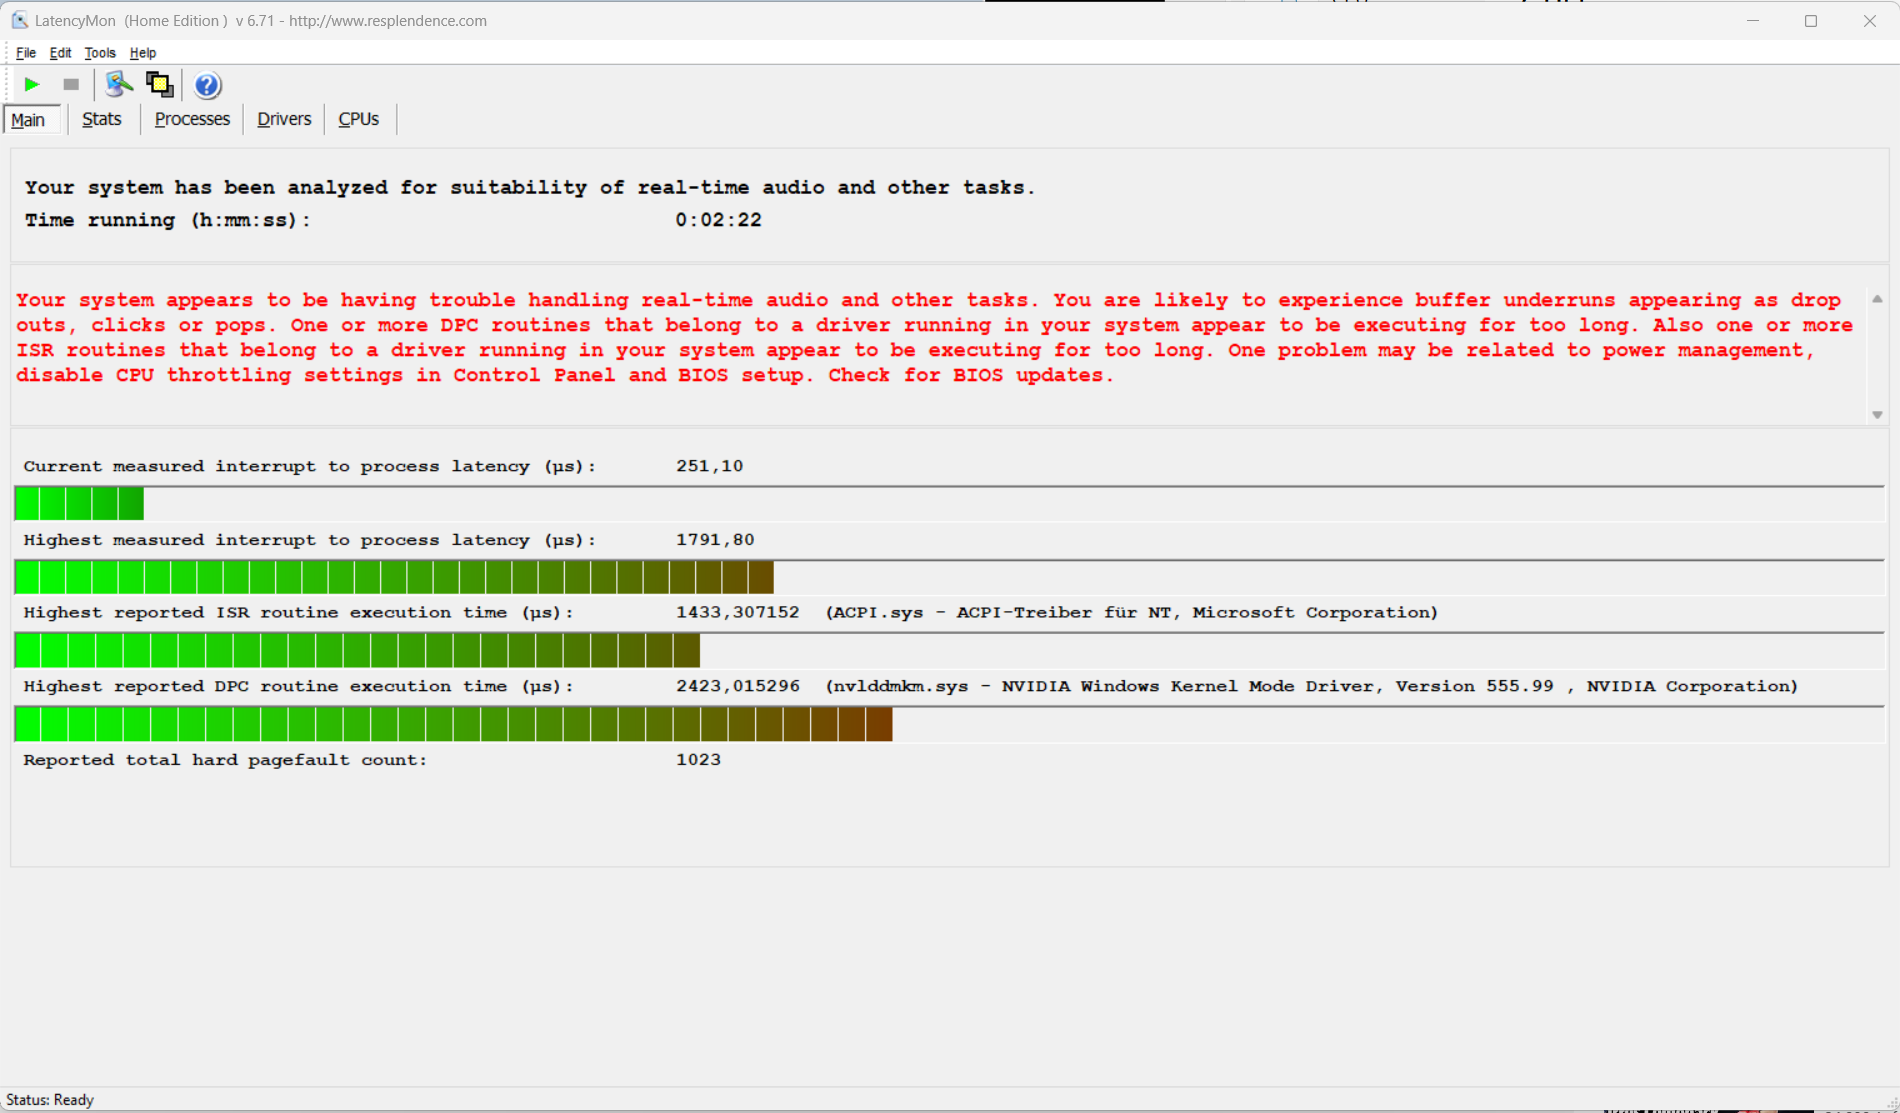
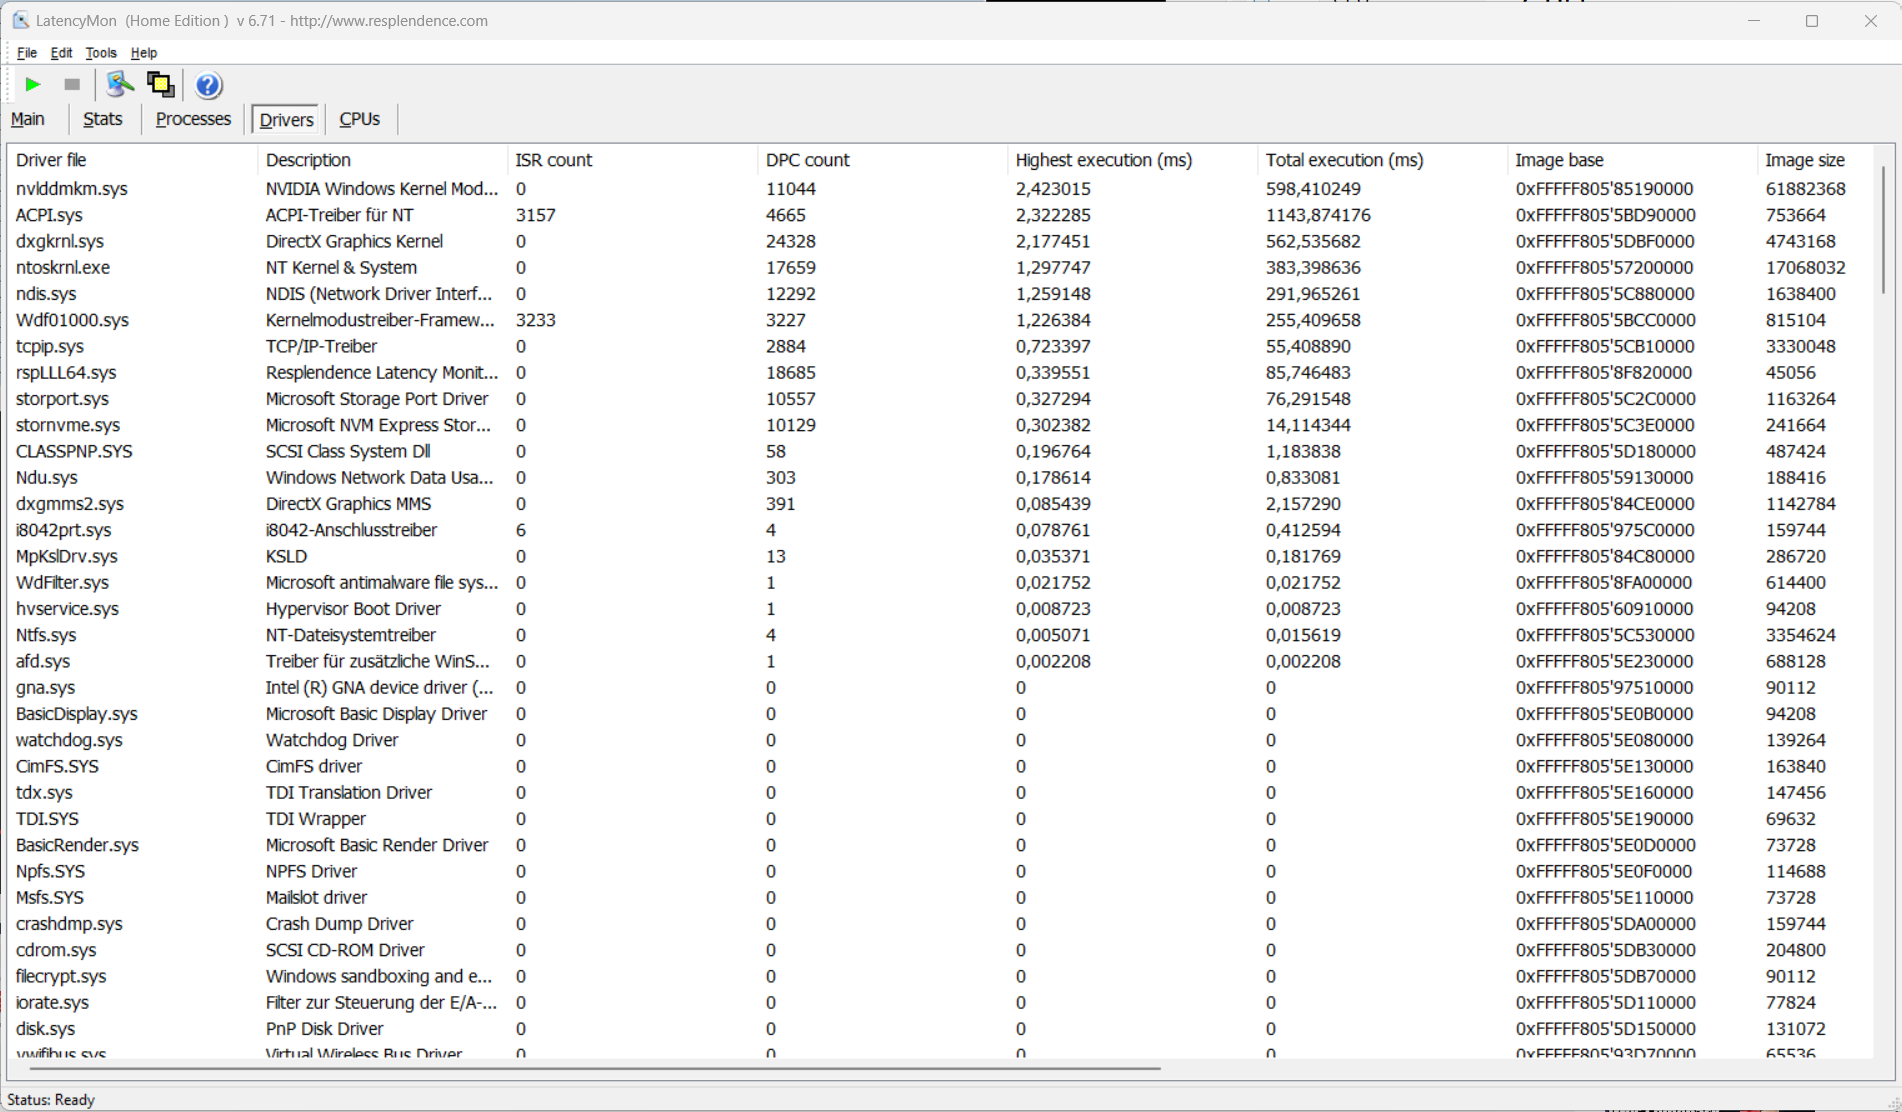
DPC 延迟
由于笔记本电脑的延迟相对较高,因此无法进行实时视频和音频编辑。不过,未来的软件更新可能会带来这方面的变化。
| DPC Latencies / LatencyMon - interrupt to process latency (max), Web, Youtube, Prime95 | |
| SCHENKER XMG Pro 16 Studio (Mid 23) | |
| SCHENKER XMG Pro 16 Studio (Mid 24) | |
| Lenovo Legion 7 16 IRX G9 | |
| Acer Predator Helios Neo 16 (2024) | |
| Aorus 16X 2024 | |
| Lenovo Legion Pro 5 16IRX9 | |
* ... smaller is better
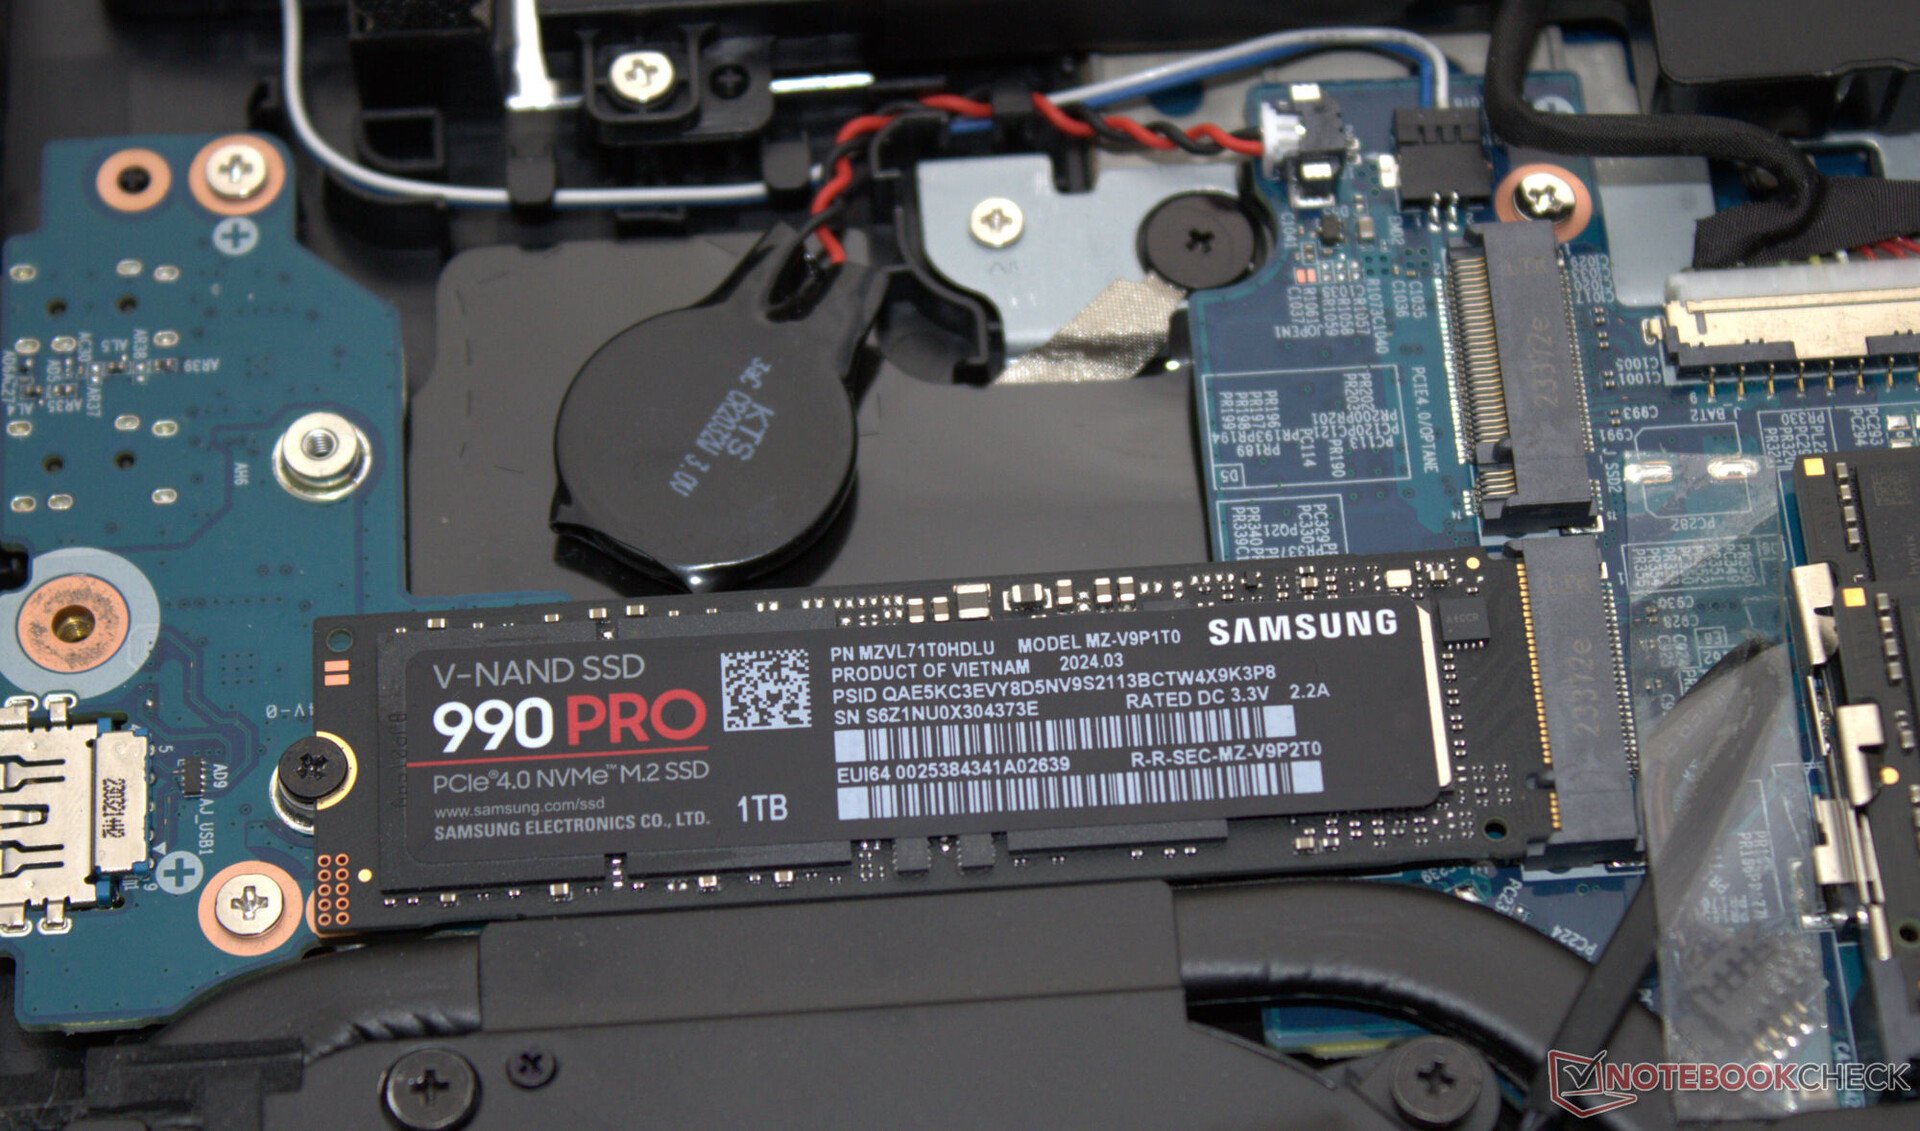
存储设备
申克在线商店有多种固态硬盘可供选择--我们的测试设备采用了三星的一款快如闪电的型号(1 TB、PCIe 4、M.2-2280)。正面:没有出现热引起的节流现象。笔记本电脑最多可容纳两个 PCIe 4 SSD(M.2-2280)。支持 RAID-0/1。

* ... smaller is better
Reading continuous performance: DiskSpd Read Loop, Queue Depth 8
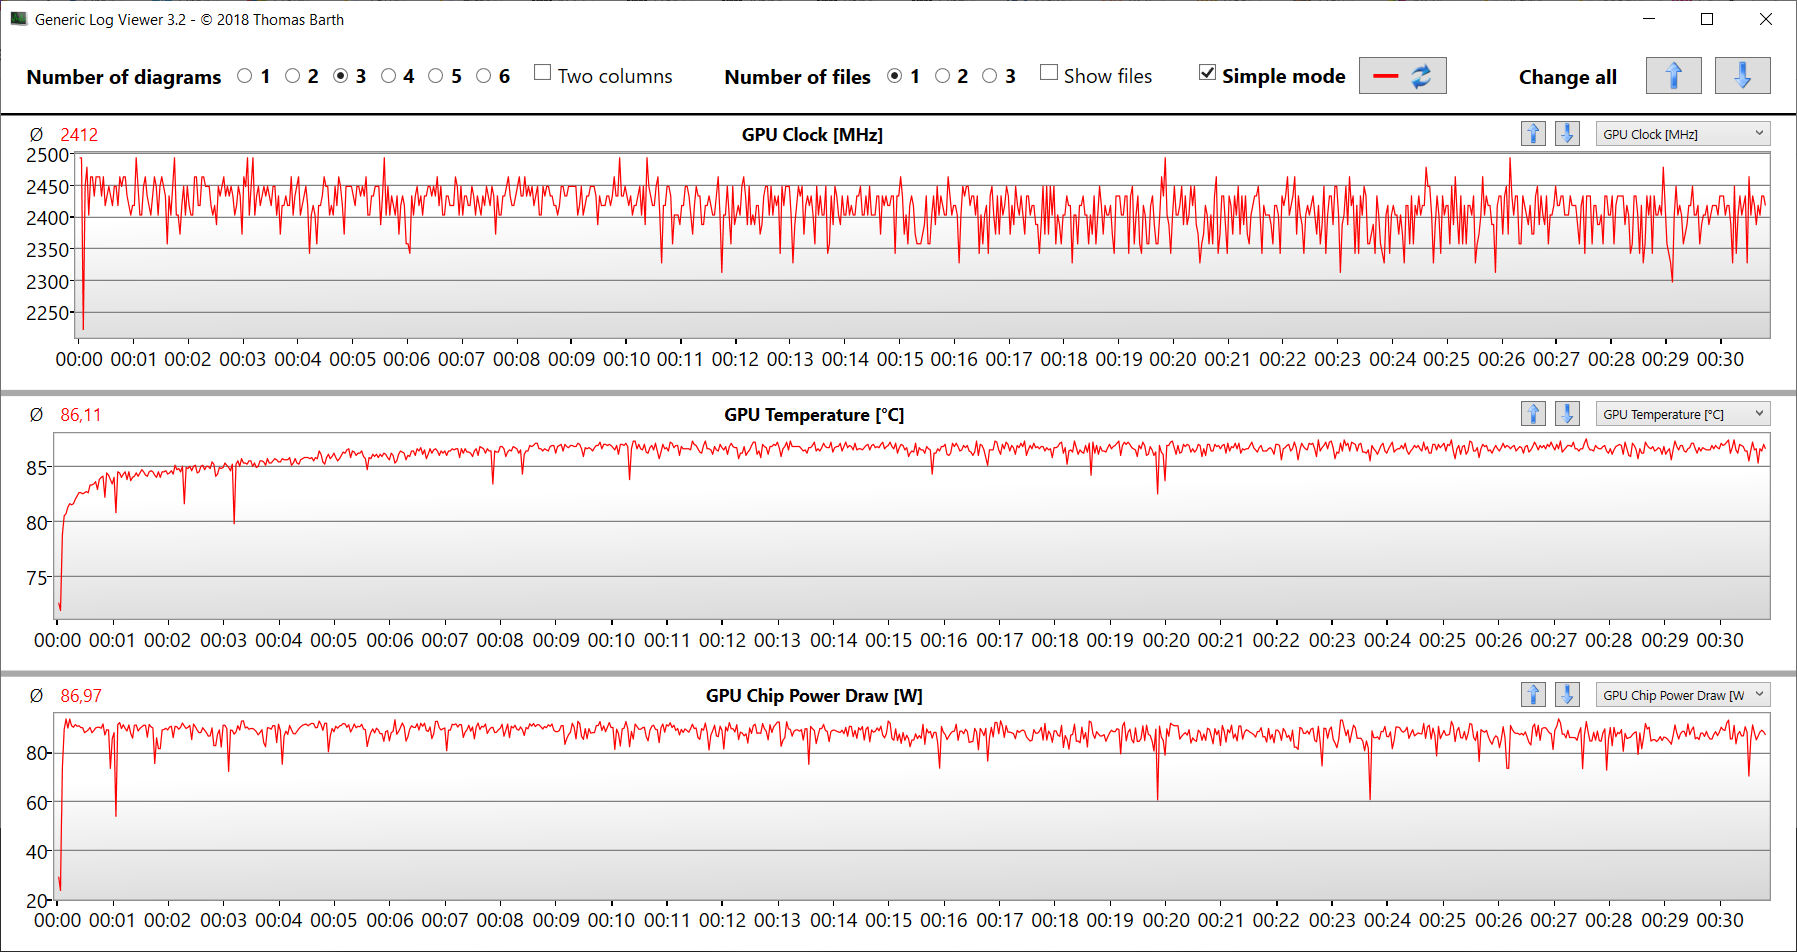
图形卡
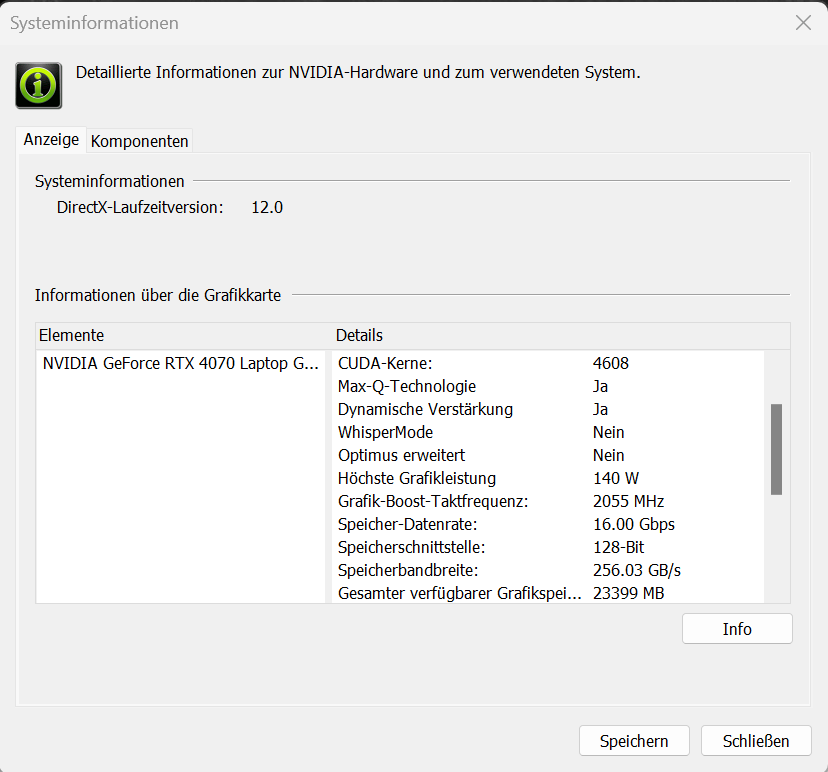
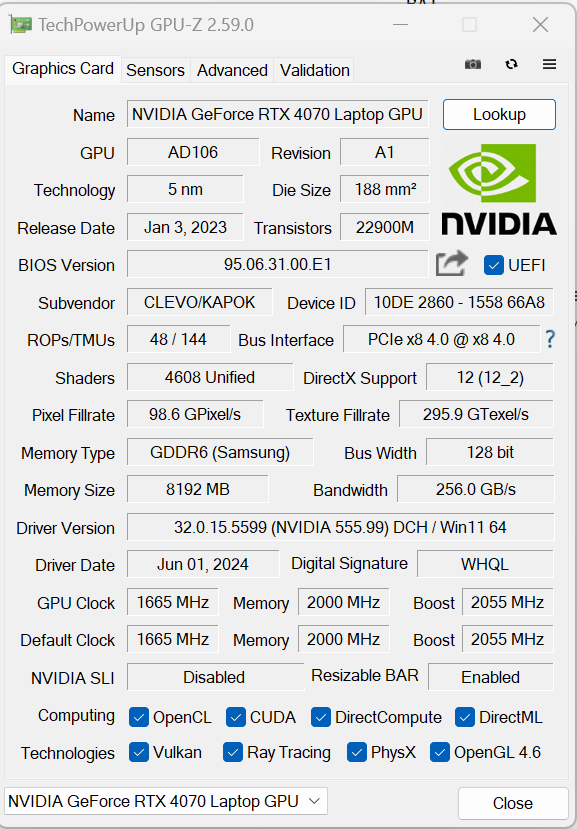
高至最高设置下的 QHD 游戏对已安装的 GeForce RTX 4070(TGP:140 瓦)也不在话下:它提供的帧率(和基准测试结果)略高于 GPU 的平均水平。对于今天的要求来说,有点紧张:GPU 只有 8 GB 的 VRAM(GDDR6)可用。在 dGPU 和 Optimus 之间切换需要重新启动。

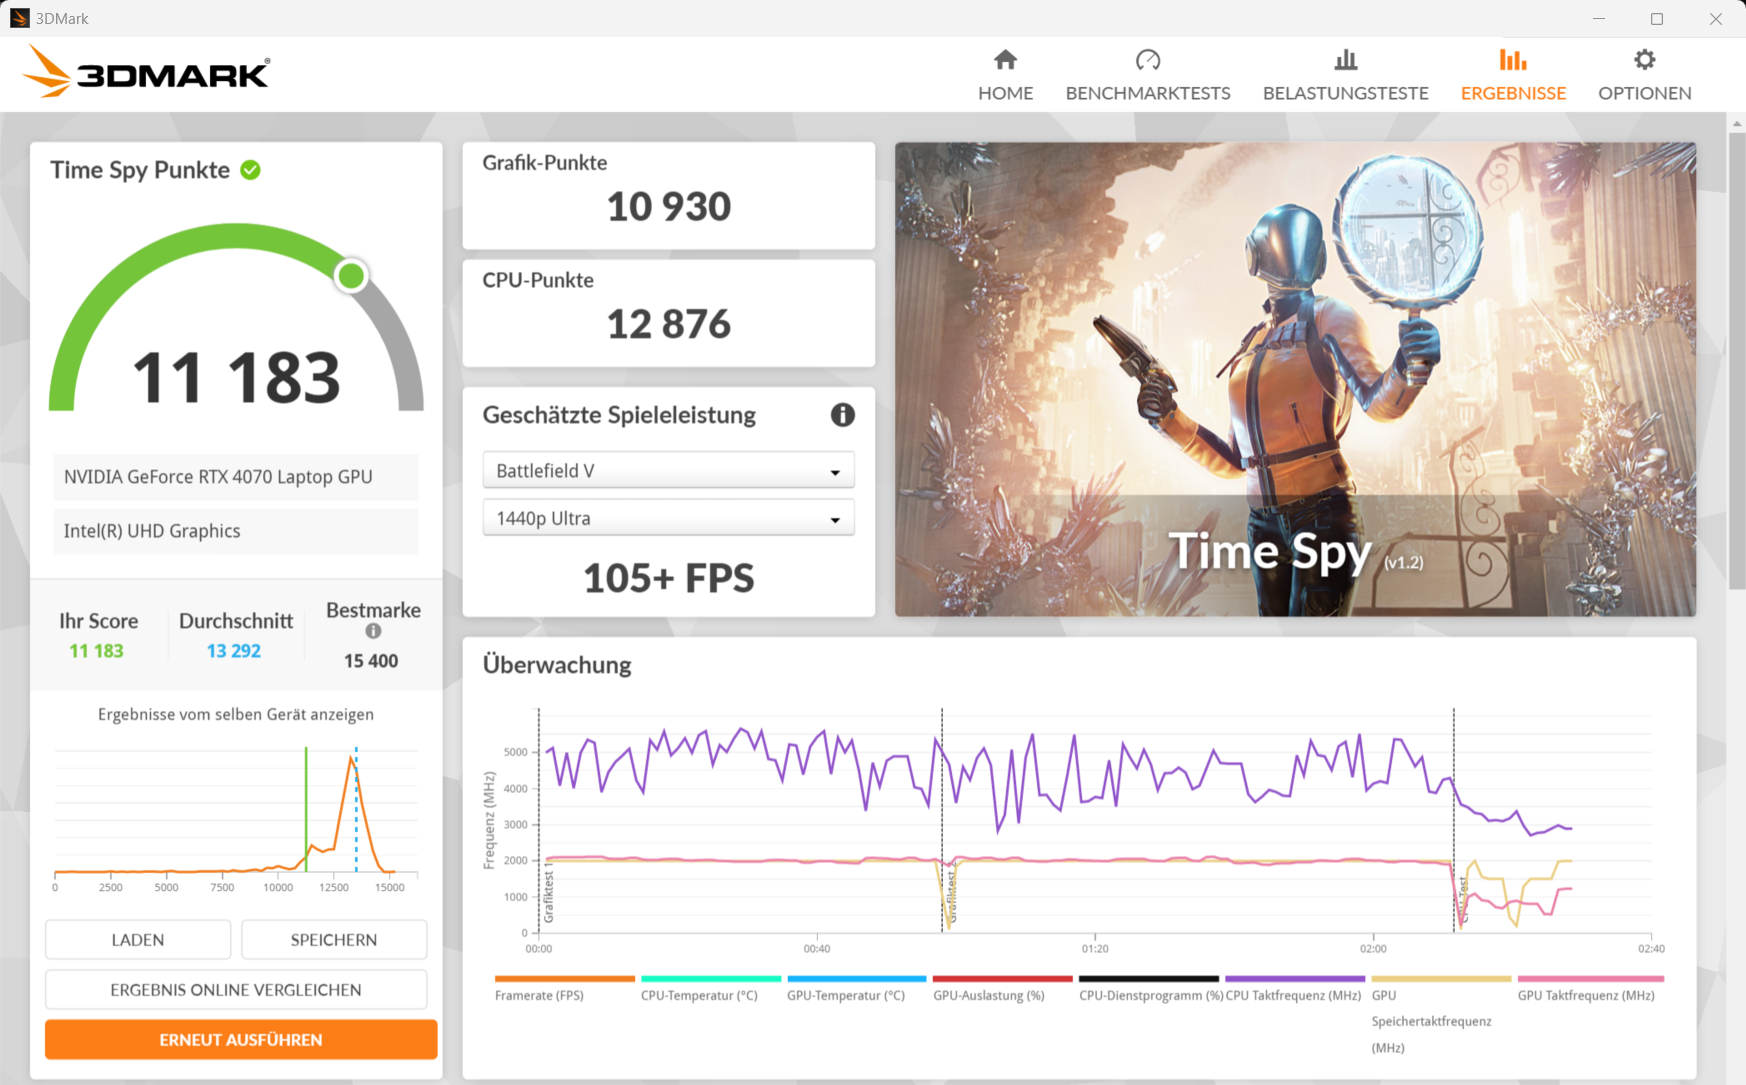
| 3DMark 11 Performance | 34173 points | |
| 3DMark Fire Strike Score | 23584 points | |
| 3DMark Time Spy Score | 12286 points | |
| 3DMark Steel Nomad Score | 2598 points | |
Help | ||
* ... smaller is better
| Cyberpunk 2077 2.2 Phantom Liberty - 1920x1080 Ultra Preset (FSR off) | |
| Average of class Gaming (6.76 - 158, n=90, last 2 years) | |
| SCHENKER XMG Pro 16 Studio (Mid 23) | |
| Lenovo Legion Pro 5 16IRX9 | |
| Lenovo Legion 7 16 IRX G9 | |
| Acer Predator Helios Neo 16 (2024) | |
| SCHENKER XMG Pro 16 Studio (Mid 24) | |
| Average NVIDIA GeForce RTX 4070 Laptop GPU (30.7 - 90.7, n=38) | |
| Aorus 16X 2024 | |
| GTA V - 1920x1080 Highest Settings possible AA:4xMSAA + FX AF:16x | |
| Acer Predator Helios Neo 16 (2024) | |
| Lenovo Legion Pro 5 16IRX9 | |
| SCHENKER XMG Pro 16 Studio (Mid 24) | |
| SCHENKER XMG Pro 16 Studio (Mid 23) | |
| Lenovo Legion 7 16 IRX G9 | |
| Average of class Gaming (12.1 - 168.2, n=132, last 2 years) | |
| Average NVIDIA GeForce RTX 4070 Laptop GPU (48.3 - 141.6, n=62) | |
| Aorus 16X 2024 | |
| Senua's Saga Hellblade 2 | |
| 1920x1080 High Preset | |
| Average of class Gaming (38.4 - 78.8, n=6, last 2 years) | |
| SCHENKER XMG Pro 16 Studio (Mid 24) | |
| Average NVIDIA GeForce RTX 4070 Laptop GPU (34.3 - 51.2, n=4) | |
| 2560x1440 High Preset | |
| Average of class Gaming (27.1 - 57.3, n=4, last 2 years) | |
| SCHENKER XMG Pro 16 Studio (Mid 24) | |
| Average NVIDIA GeForce RTX 4070 Laptop GPU (23.7 - 33.3, n=4) | |
| 2560x1440 High Preset + Quality DLSS | |
| Average of class Gaming (42.2 - 83.1, n=3, last 2 years) | |
| SCHENKER XMG Pro 16 Studio (Mid 24) | |
| Average NVIDIA GeForce RTX 4070 Laptop GPU (42.2 - 47.8, n=2) | |
| Ghost of Tsushima | |
| 1920x1080 Very High Preset AA:T | |
| SCHENKER XMG Pro 16 Studio (Mid 24) | |
| Average NVIDIA GeForce RTX 4070 Laptop GPU (55.3 - 73.7, n=5) | |
| Average of class Gaming (28.5 - 73.7, n=7, last 2 years) | |
| 2560x1440 Very High Preset AA:T | |
| SCHENKER XMG Pro 16 Studio (Mid 24) | |
| Average NVIDIA GeForce RTX 4070 Laptop GPU (43.6 - 56.1, n=5) | |
| Average of class Gaming (22.7 - 56.1, n=5, last 2 years) | |
| 2560x1440 Very High Preset + Quality DLSS | |
| SCHENKER XMG Pro 16 Studio (Mid 24) | |
| Average of class Gaming (63.6 - 74.2, n=3, last 2 years) | |
| Average NVIDIA GeForce RTX 4070 Laptop GPU (57 - 74.2, n=3) | |
| The First Descendant | |
| 1920x1080 Ultra Preset | |
| SCHENKER XMG Pro 16 Studio (Mid 24) | |
| Average NVIDIA GeForce RTX 4070 Laptop GPU (73.7 - 83.6, n=5) | |
| Average of class Gaming (15.4 - 80, n=5, last 2 years) | |
| 2560x1440 Ultra Preset | |
| SCHENKER XMG Pro 16 Studio (Mid 24) | |
| Average NVIDIA GeForce RTX 4070 Laptop GPU (48.2 - 52.5, n=5) | |
| Average of class Gaming (43.7 - 51.2, n=3, last 2 years) | |
| 2560x1440 Ultra Preset + Ultra Ray Tracing + DLSS Quality | |
| SCHENKER XMG Pro 16 Studio (Mid 24) | |
| Average NVIDIA GeForce RTX 4070 Laptop GPU (48.6 - 51.8, n=2) | |
| Average of class Gaming (43.3 - 51.8, n=2, last 2 years) | |
| F1 24 | |
| 1920x1080 Ultra High Preset AA:T AF:16x | |
| Average of class Gaming (54.1 - 148, n=19, last 2 years) | |
| SCHENKER XMG Pro 16 Studio (Mid 24) | |
| Average NVIDIA GeForce RTX 4070 Laptop GPU (58.4 - 78.1, n=9) | |
| 2560x1440 Ultra High Preset AA:T AF:16x | |
| Average of class Gaming (36.7 - 100, n=16, last 2 years) | |
| SCHENKER XMG Pro 16 Studio (Mid 24) | |
| Average NVIDIA GeForce RTX 4070 Laptop GPU (36.8 - 50.9, n=9) | |
| 2560x1440 Ultra High Preset + Quality DLSS AF:16x | |
| Average of class Gaming (59.2 - 150.4, n=12, last 2 years) | |
| SCHENKER XMG Pro 16 Studio (Mid 24) | |
| Average NVIDIA GeForce RTX 4070 Laptop GPU (57 - 73.9, n=6) | |
Cyberpunk 2077 ultra FPS diagram
| low | med. | high | ultra | QHD DLSS | QHD | |
|---|---|---|---|---|---|---|
| GTA V (2015) | 186.7 | 184.9 | 180.9 | 126 | 95.9 | |
| Dota 2 Reborn (2015) | 231 | 196.2 | 181.6 | 160.8 | ||
| Final Fantasy XV Benchmark (2018) | 214 | 163.6 | 119.7 | 86.8 | ||
| X-Plane 11.11 (2018) | 178 | 147.3 | 119.5 | |||
| Strange Brigade (2018) | 457 | 297 | 236 | 206 | 135.9 | |
| Baldur's Gate 3 (2023) | 171.8 | 132 | 115.3 | 111.8 | 77.2 | |
| Cyberpunk 2077 2.2 Phantom Liberty (2023) | 126.3 | 112.1 | 95.5 | 82.5 | 48.6 | |
| Dragon's Dogma 2 (2024) | 81 | 70.4 | 58.5 | |||
| Ghost of Tsushima (2024) | 114.9 | 102.8 | 93 | 73.7 | 74.2 | 56.1 |
| Senua's Saga Hellblade 2 (2024) | 78.3 | 64.9 | 51.2 | 47.8 | 33.3 | |
| F1 24 (2024) | 239 | 238 | 203 | 70.4 | 45.1 | |
| The First Descendant (2024) | 171 | 110.9 | 91.3 | 80 | 51.2 |
排放与功率 - XMG Pro 功耗高
噪音排放
赛博朋克 2077》将笔记本电脑的噪音值提高到 53 dB(A)(性能模式),而娱乐模式的噪音值则略微适中。静音模式不适合游戏,因为 dGPU 已关闭。设备在空转和日常使用(办公、上网)时的噪音水平较低:风扇转速不会过高,偶尔也会静止不动。有时,笔记本电脑内部会发出噼里啪啦的电子声。
Noise Level
| Idle |
| 28 / 31 / 35 dB(A) |
| Load |
| 52 / 52 dB(A) |
 | ||
30 dB silent 40 dB(A) audible 50 dB(A) loud |
||
min: | ||
| SCHENKER XMG Pro 16 Studio (Mid 24) NVIDIA GeForce RTX 4070 Laptop GPU, i9-14900HX, Samsung 990 Pro 1 TB | Acer Predator Helios Neo 16 (2024) NVIDIA GeForce RTX 4070 Laptop GPU, i7-14700HX, Samsung PM9A1a MZVL21T0HDLU | Lenovo Legion Pro 5 16IRX9 NVIDIA GeForce RTX 4070 Laptop GPU, i9-14900HX, Samsung PM9A1 MZVL21T0HCLR | Aorus 16X 2024 NVIDIA GeForce RTX 4070 Laptop GPU, i9-14900HX, Gigabyte AG450E1024-SI | SCHENKER XMG Pro 16 Studio (Mid 23) NVIDIA GeForce RTX 4070 Laptop GPU, i9-13900H, Samsung 990 Pro 1 TB | Lenovo Legion 7 16 IRX G9 NVIDIA GeForce RTX 4070 Laptop GPU, i9-14900HX, SK Hynix HFS001TEJ9X115N | |
|---|---|---|---|---|---|---|
| Noise | 3% | 10% | -3% | 7% | 16% | |
| off / environment * | 25 | 25.2 -1% | 23.9 4% | 26 -4% | 25 -0% | 24.5 2% |
| Idle Minimum * | 28 | 27.8 1% | 24.3 13% | 26 7% | 26 7% | 24.5 12% |
| Idle Average * | 31 | 32 -3% | 24.3 22% | 32 -3% | 29 6% | 24.5 21% |
| Idle Maximum * | 35 | 29.6 15% | 28.9 17% | 38 -9% | 34 3% | 24.5 30% |
| Load Average * | 52 | 45.2 13% | 45.8 12% | 54 -4% | 43 17% | 34.8 33% |
| Cyberpunk 2077 ultra * | 53 | |||||
| Load Maximum * | 52 | 55.8 -7% | 56.6 -9% | 55 -6% | 48 8% | 54.1 -4% |
| Witcher 3 ultra * | 51 | 50 | 48 | 54.1 |
* ... smaller is better
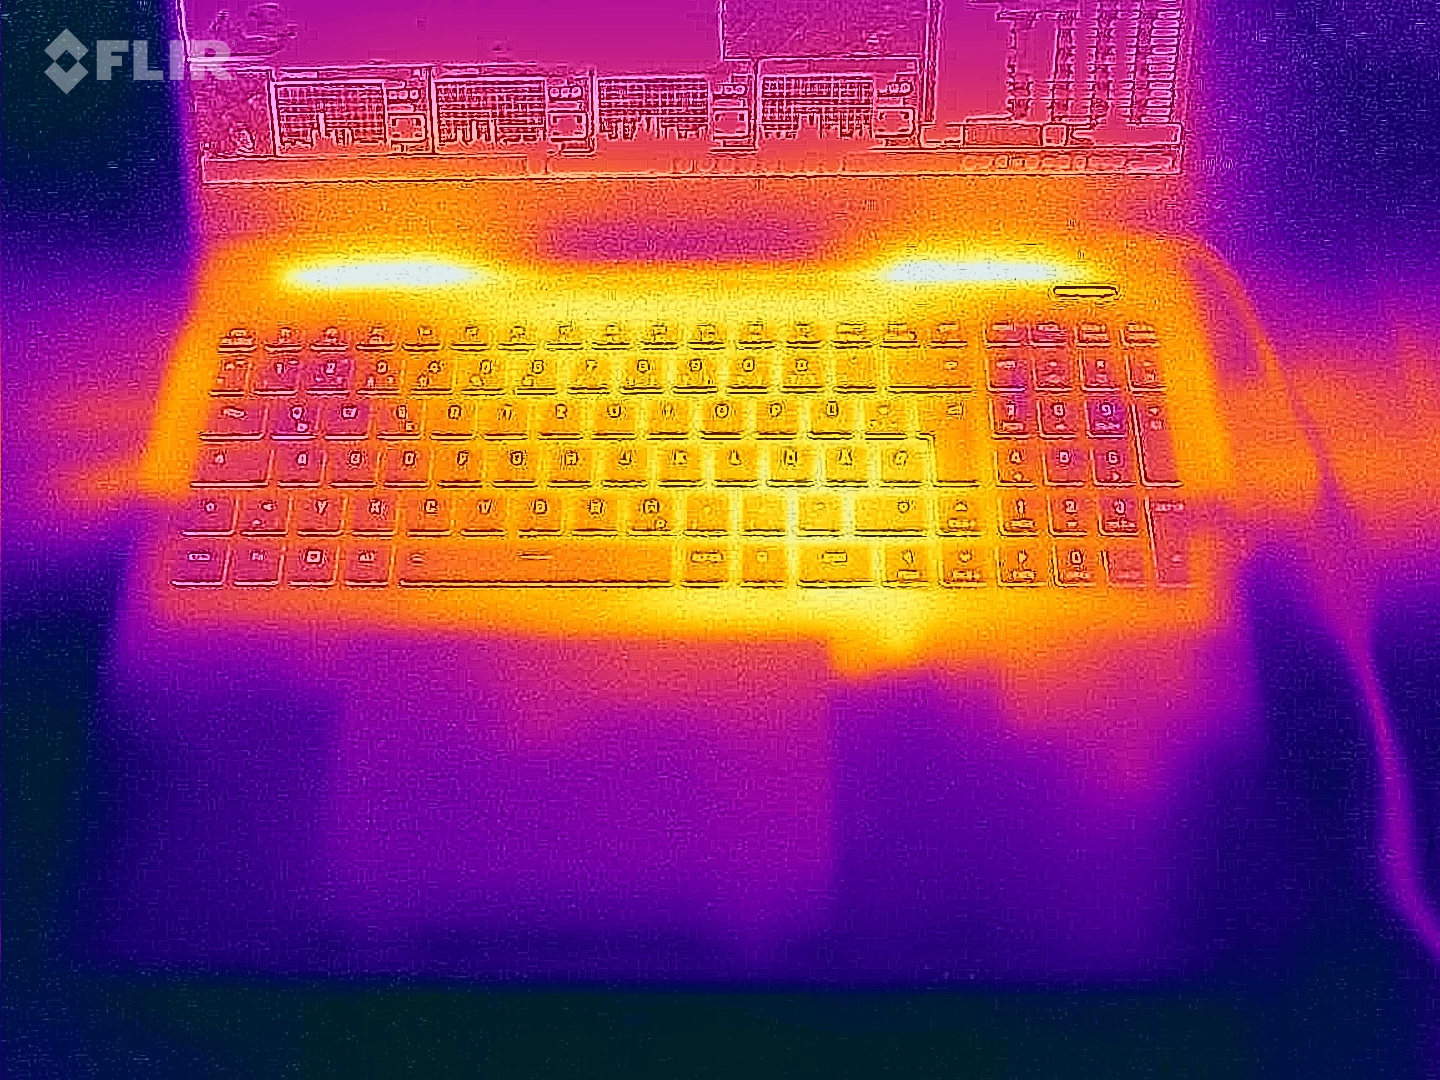
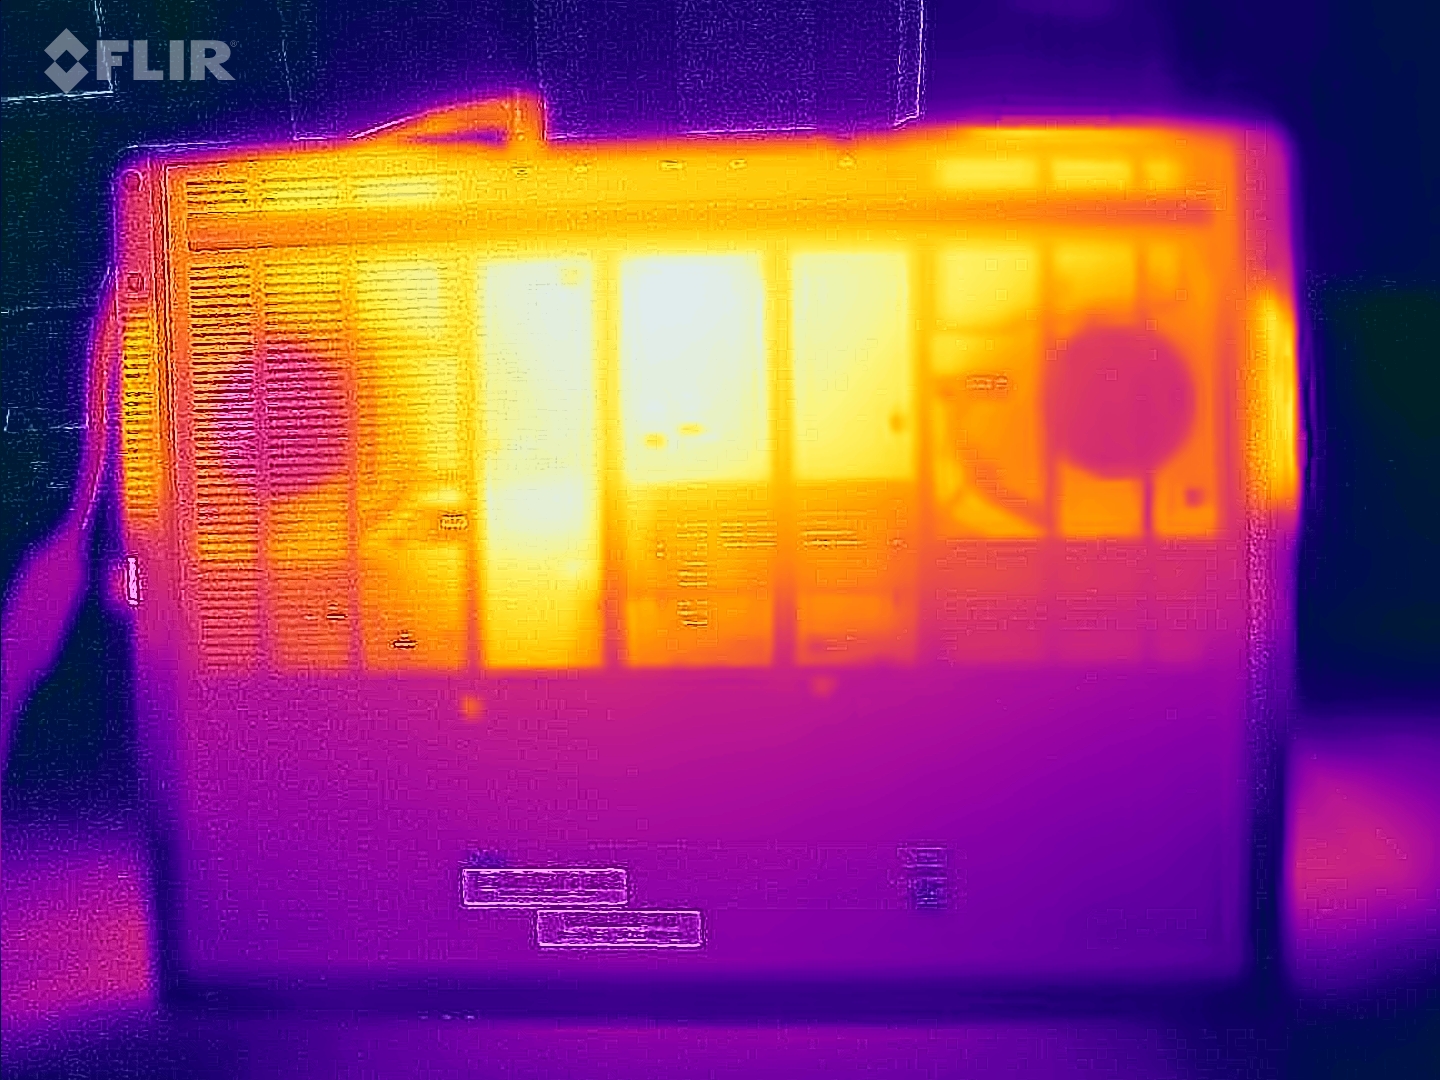
温度
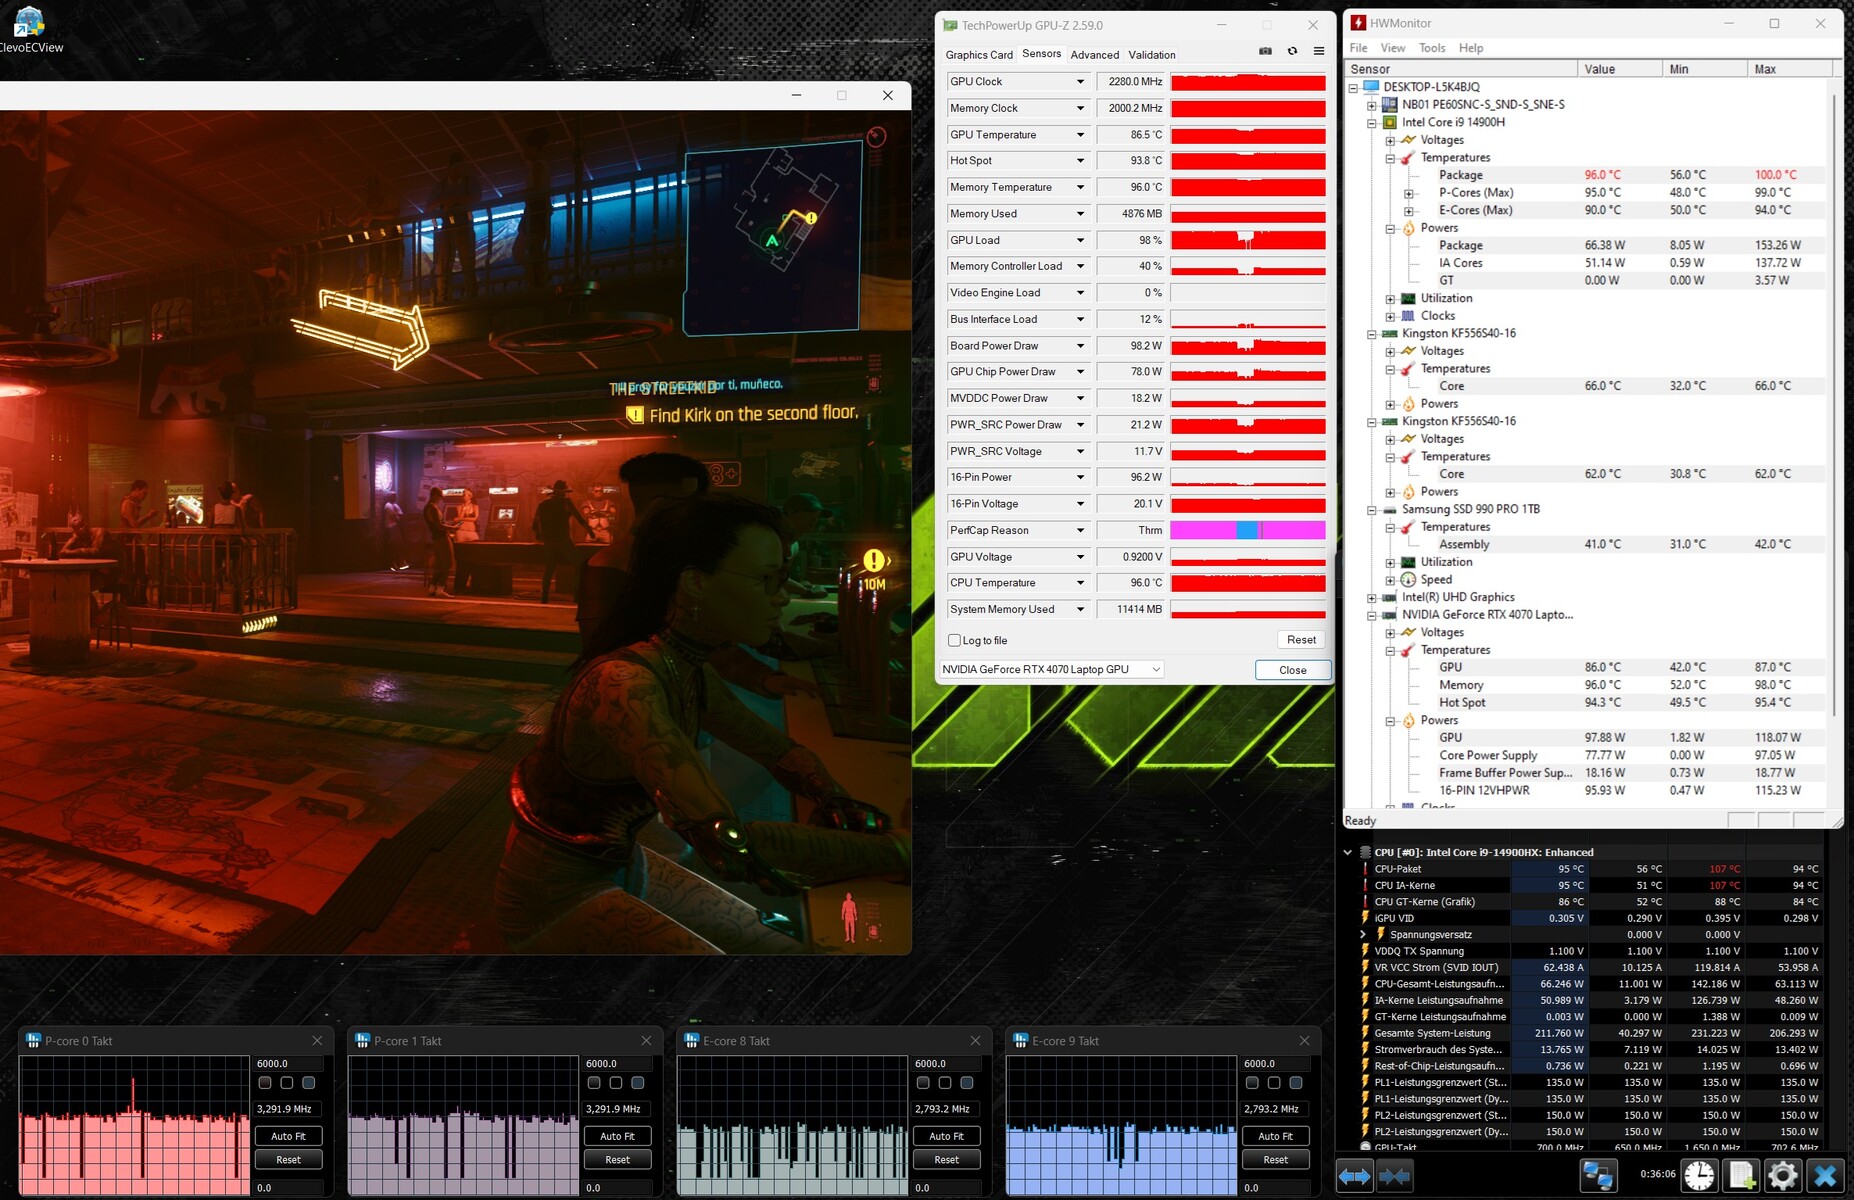
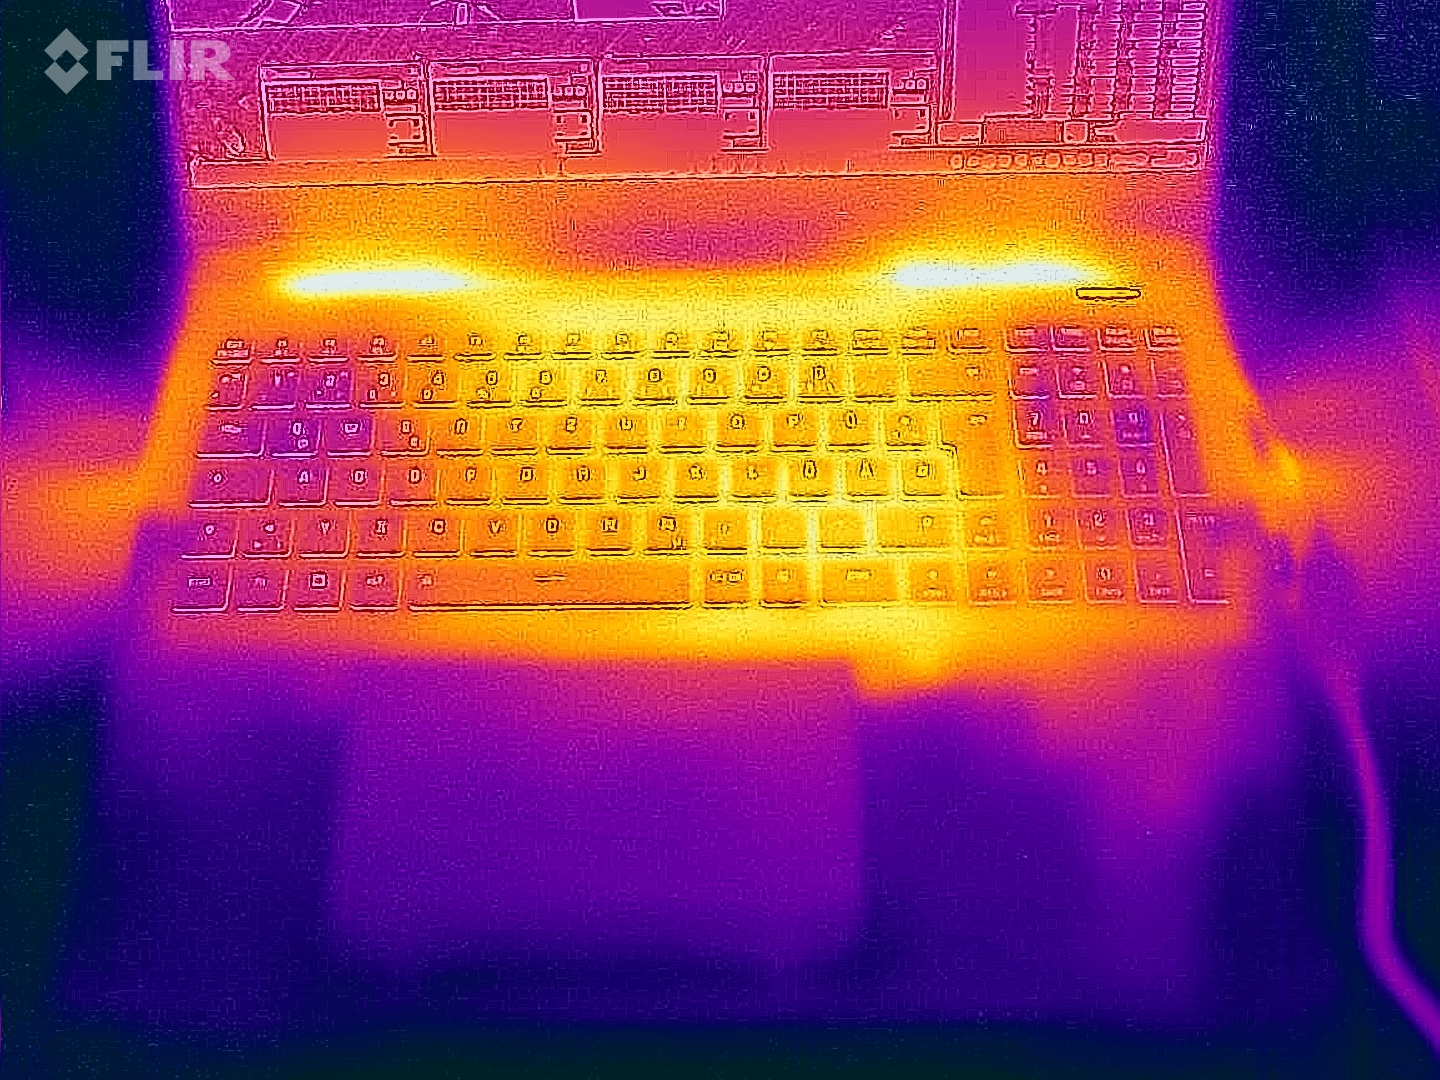
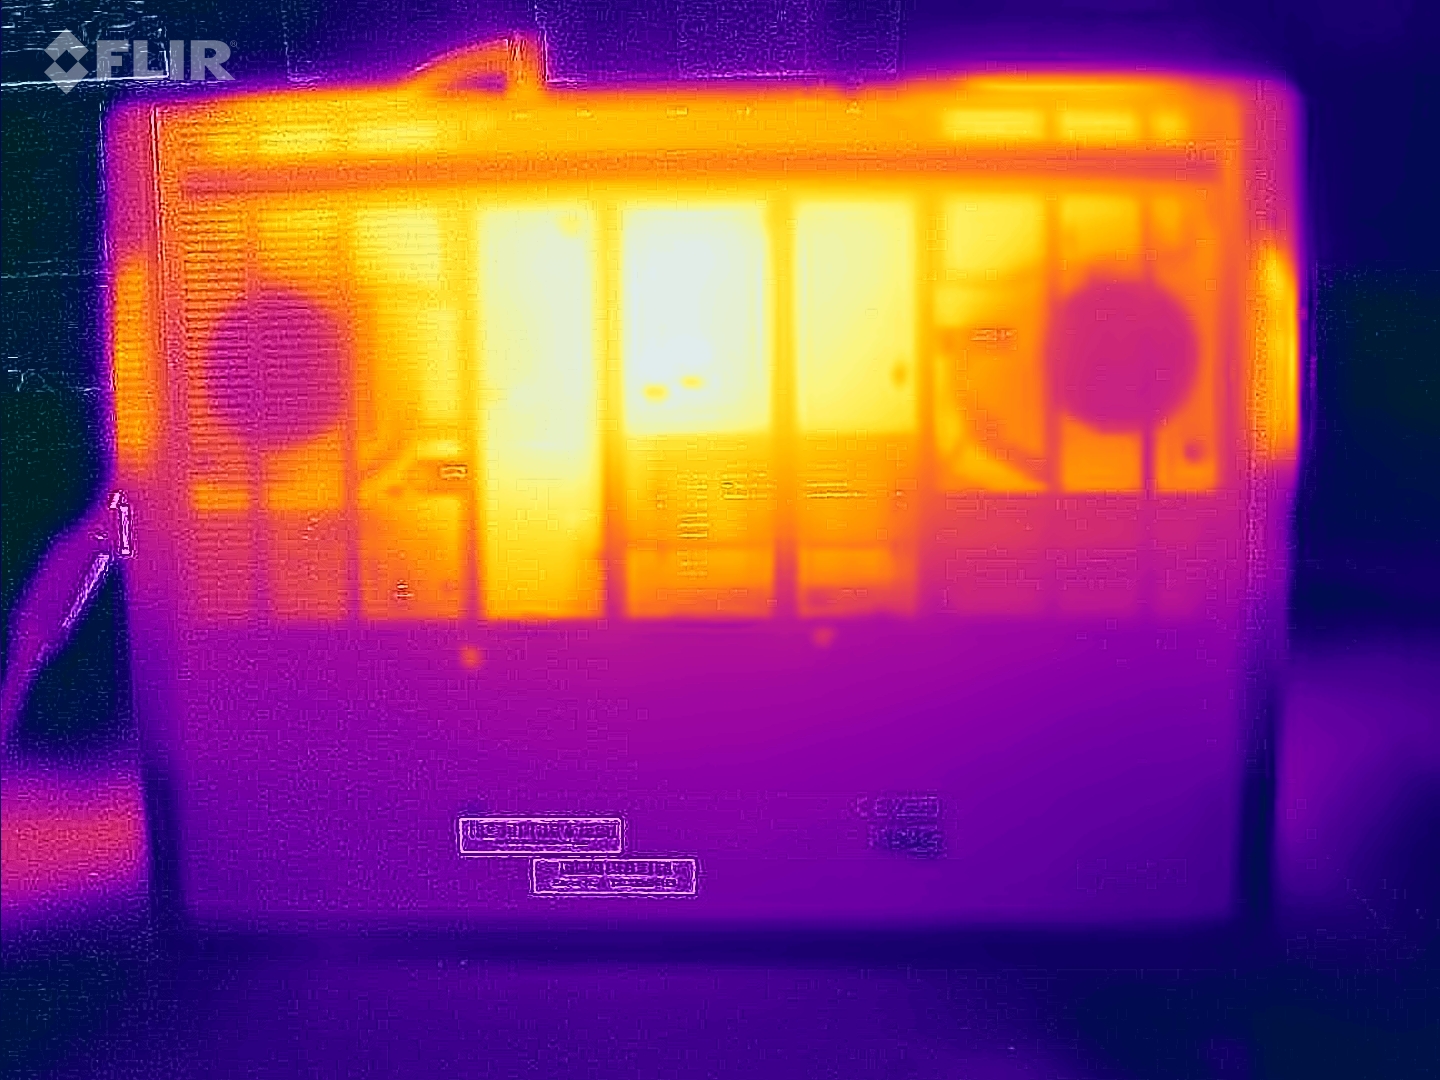
笔记本电脑发热明显:赛博朋克》和压力测试导致某些点的温度超过 60 摄氏度。日常使用(办公、上网)时也会达到高于平均值的温度。掌托的温度没有那么糟糕。
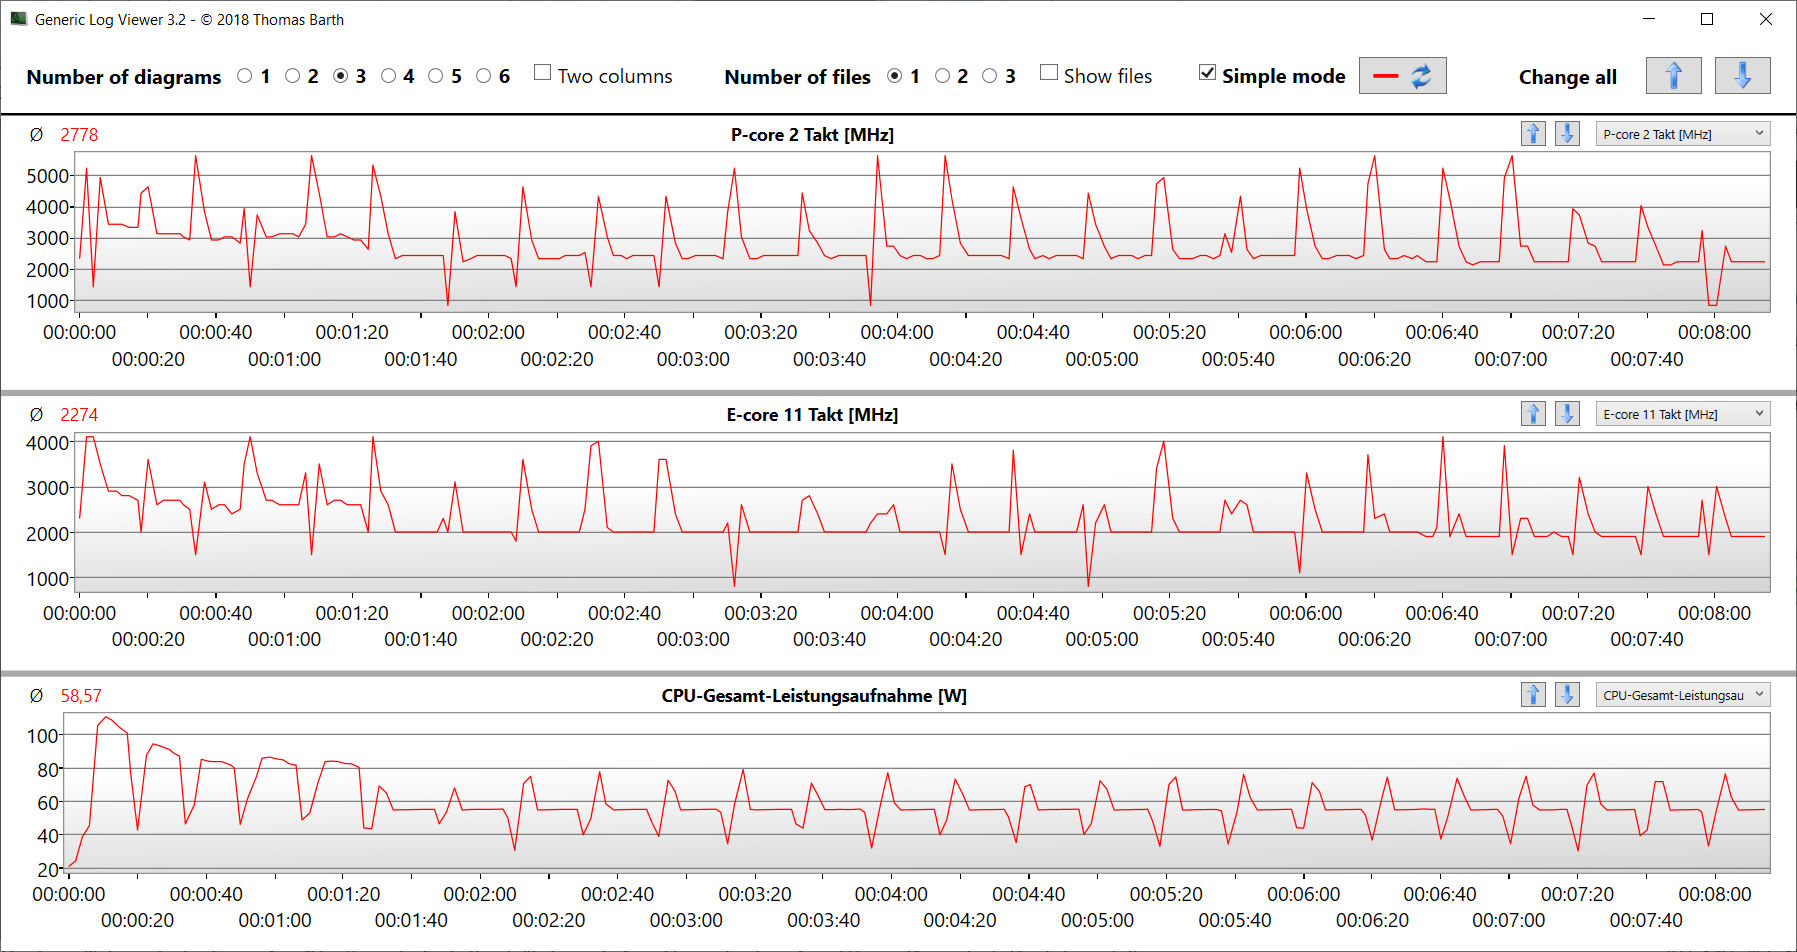
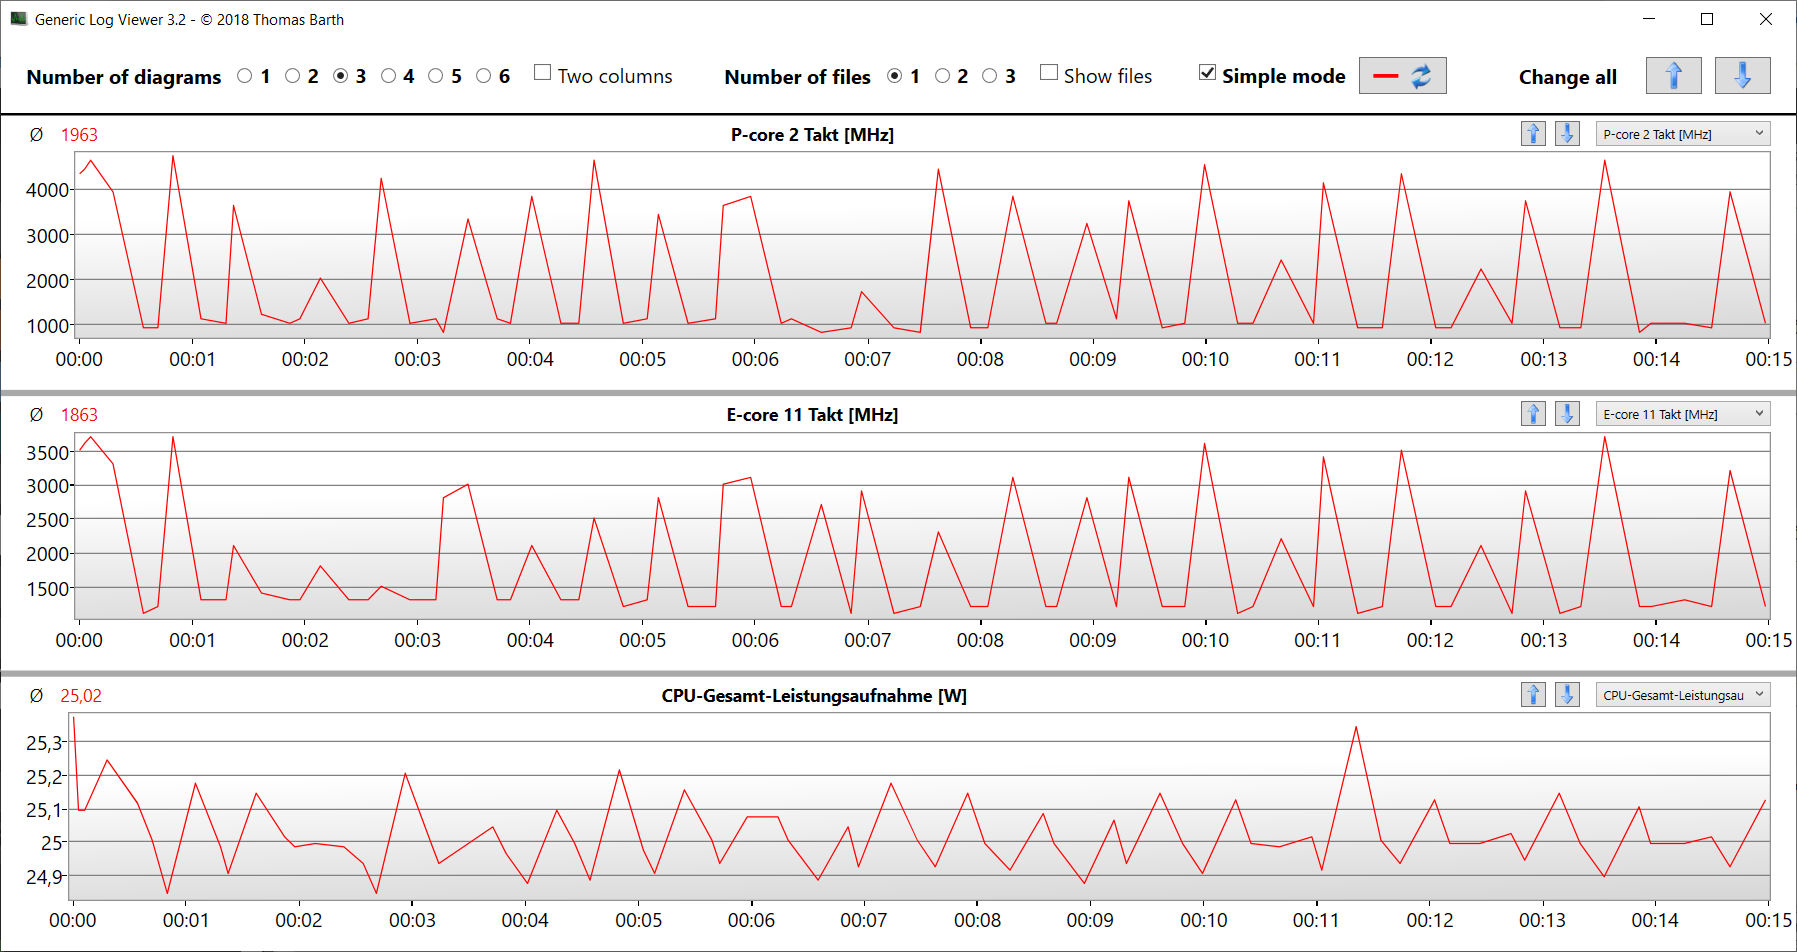
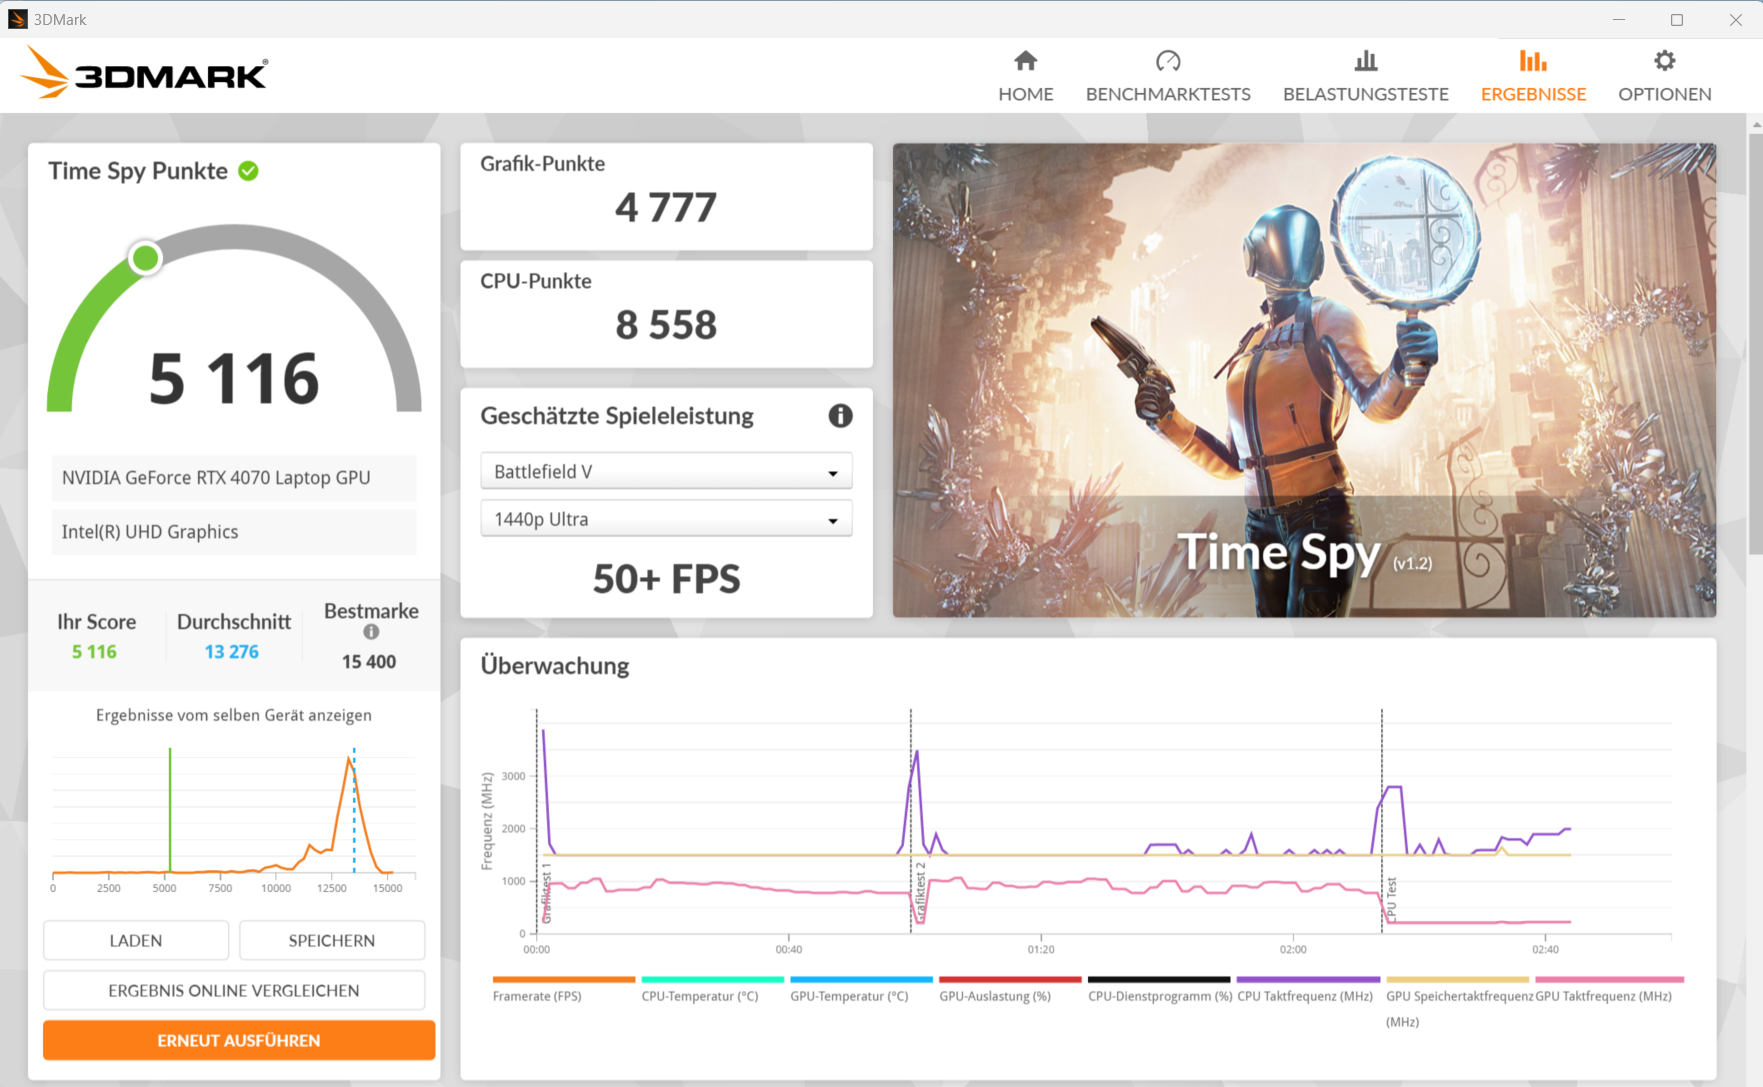
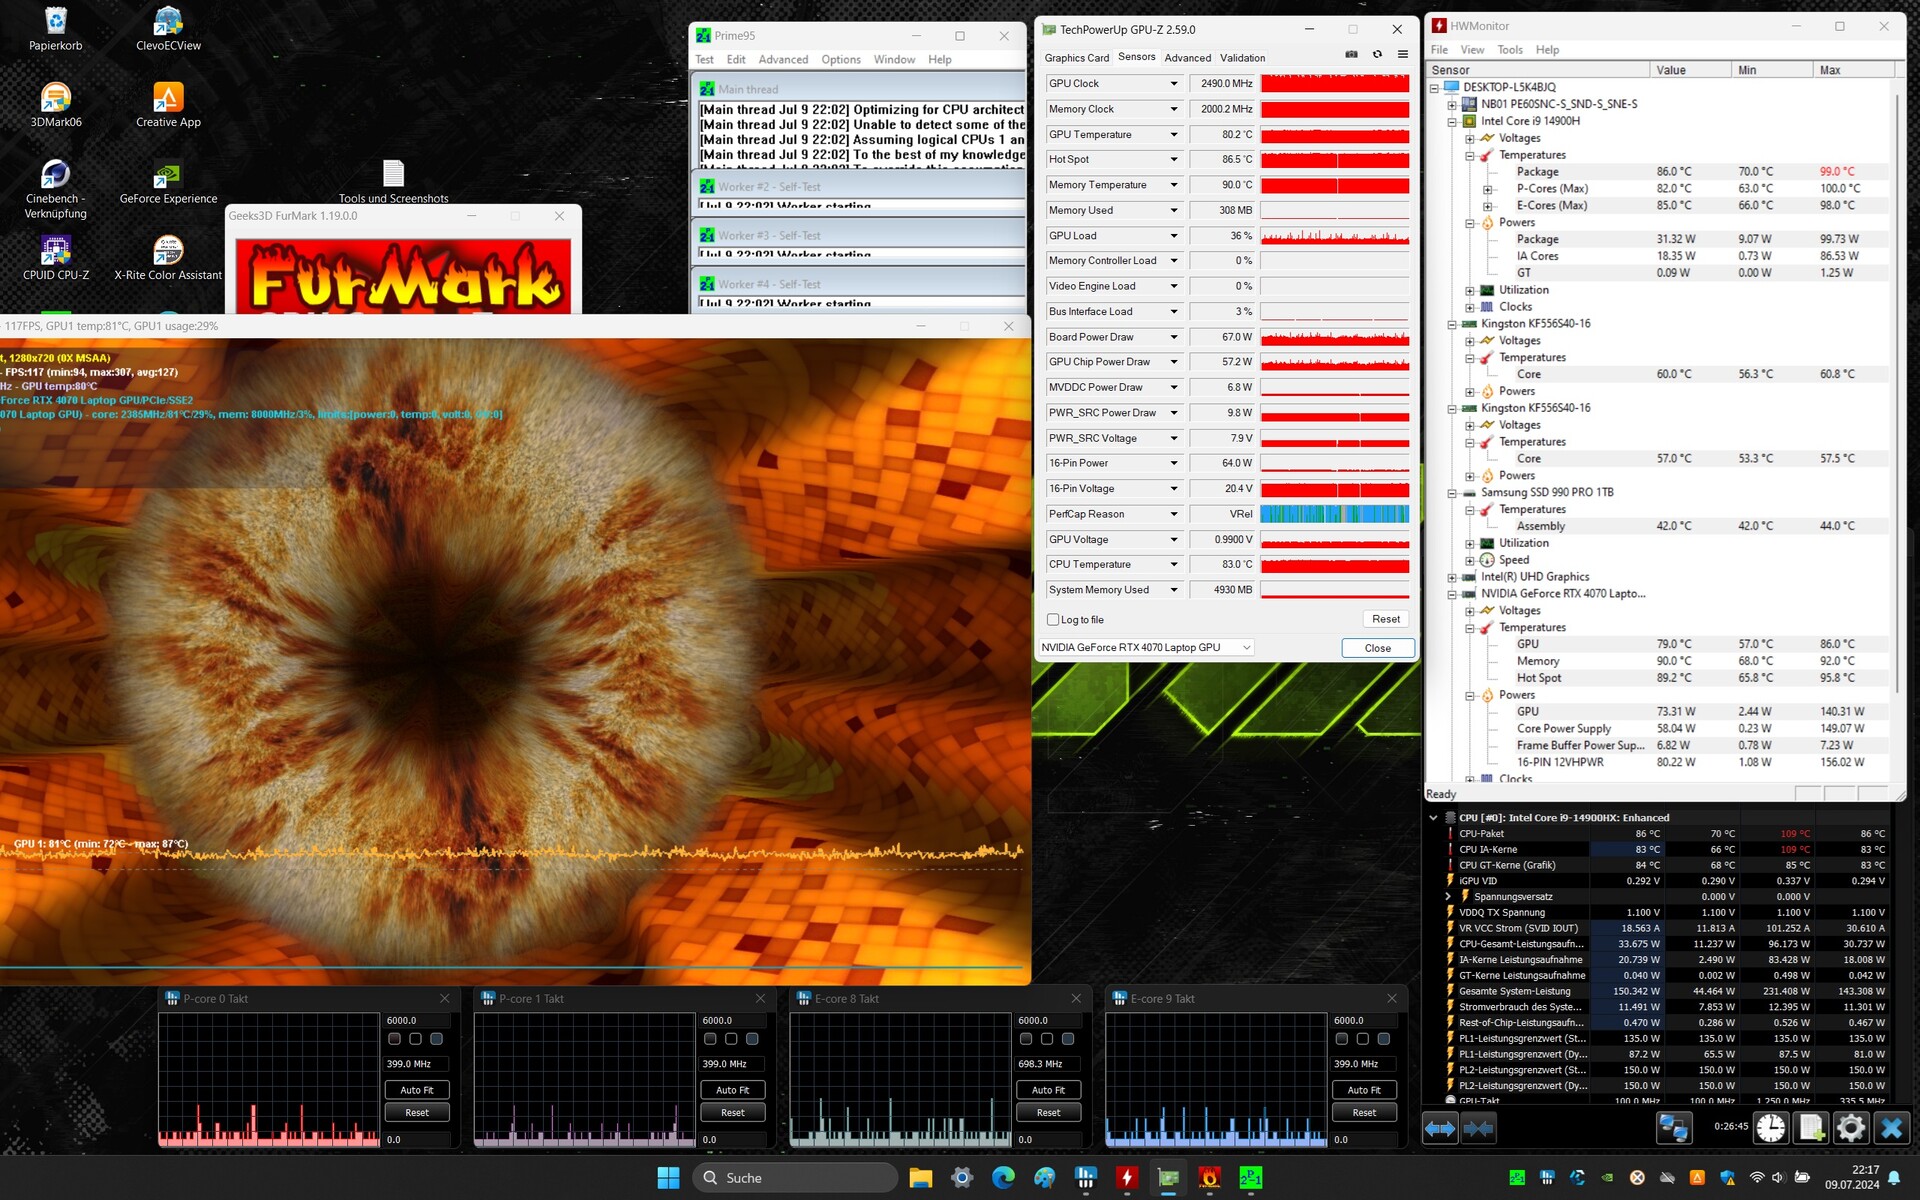
极限压力测试场景(Prime95 和 Furmark 连续运行)检查了系统在满负荷情况下的稳定性。设备的优先级分布非常明显:当 GPU 全功率工作时,CPU 时钟(400 MHz 至 2 GHz)低于基本时钟。
(-) The maximum temperature on the upper side is 51 °C / 124 F, compared to the average of 40.4 °C / 105 F, ranging from 21.2 to 68.8 °C for the class Gaming.
(-) The bottom heats up to a maximum of 66 °C / 151 F, compared to the average of 43.2 °C / 110 F
(±) In idle usage, the average temperature for the upper side is 32.3 °C / 90 F, compared to the device average of 33.9 °C / 93 F.
(-) 3: The average temperature for the upper side is 42.2 °C / 108 F, compared to the average of 33.9 °C / 93 F for the class Gaming.
(+) The palmrests and touchpad are cooler than skin temperature with a maximum of 31 °C / 87.8 F and are therefore cool to the touch.
(-) The average temperature of the palmrest area of similar devices was 28.9 °C / 84 F (-2.1 °C / -3.8 F).
| SCHENKER XMG Pro 16 Studio (Mid 24) Intel Core i9-14900HX, NVIDIA GeForce RTX 4070 Laptop GPU | Acer Predator Helios Neo 16 (2024) Intel Core i7-14700HX, NVIDIA GeForce RTX 4070 Laptop GPU | Lenovo Legion Pro 5 16IRX9 Intel Core i9-14900HX, NVIDIA GeForce RTX 4070 Laptop GPU | Aorus 16X 2024 Intel Core i9-14900HX, NVIDIA GeForce RTX 4070 Laptop GPU | SCHENKER XMG Pro 16 Studio (Mid 23) Intel Core i9-13900H, NVIDIA GeForce RTX 4070 Laptop GPU | Lenovo Legion 7 16 IRX G9 Intel Core i9-14900HX, NVIDIA GeForce RTX 4070 Laptop GPU | |
|---|---|---|---|---|---|---|
| Heat | 9% | 11% | 14% | 2% | 22% | |
| Maximum Upper Side * | 51 | 58 -14% | 43.8 14% | 41 20% | 55 -8% | 43.7 14% |
| Maximum Bottom * | 66 | 45.2 32% | 55.4 16% | 41 38% | 66 -0% | 42.9 35% |
| Idle Upper Side * | 35 | 31.1 11% | 32.8 6% | 37 -6% | 33 6% | 29.1 17% |
| Idle Bottom * | 39 | 37.2 5% | 36 8% | 38 3% | 35 10% | 30.6 22% |
* ... smaller is better
发言人
低音明显不足。除此之外,立体声扬声器发出的声音还是可以接受的。其最大音量可以稍高一些。
SCHENKER XMG Pro 16 Studio (Mid 24) audio analysis
(±) | speaker loudness is average but good (79 dB)
Bass 100 - 315 Hz
(-) | nearly no bass - on average 15.1% lower than median
(±) | linearity of bass is average (13.6% delta to prev. frequency)
Mids 400 - 2000 Hz
(±) | higher mids - on average 5.3% higher than median
(+) | mids are linear (4.4% delta to prev. frequency)
Highs 2 - 16 kHz
(+) | balanced highs - only 4.4% away from median
(+) | highs are linear (4.9% delta to prev. frequency)
Overall 100 - 16.000 Hz
(±) | linearity of overall sound is average (17.7% difference to median)
Compared to same class
» 50% of all tested devices in this class were better, 10% similar, 40% worse
» The best had a delta of 6%, average was 18%, worst was 132%
Compared to all devices tested
» 32% of all tested devices were better, 8% similar, 59% worse
» The best had a delta of 4%, average was 24%, worst was 134%
Lenovo Legion Pro 5 16IRX9 audio analysis
(±) | speaker loudness is average but good (80.7 dB)
Bass 100 - 315 Hz
(-) | nearly no bass - on average 19% lower than median
(±) | linearity of bass is average (10.1% delta to prev. frequency)
Mids 400 - 2000 Hz
(+) | balanced mids - only 4.7% away from median
(+) | mids are linear (5.7% delta to prev. frequency)
Highs 2 - 16 kHz
(+) | balanced highs - only 3.3% away from median
(+) | highs are linear (5.6% delta to prev. frequency)
Overall 100 - 16.000 Hz
(±) | linearity of overall sound is average (17.2% difference to median)
Compared to same class
» 45% of all tested devices in this class were better, 11% similar, 44% worse
» The best had a delta of 6%, average was 18%, worst was 132%
Compared to all devices tested
» 29% of all tested devices were better, 8% similar, 63% worse
» The best had a delta of 4%, average was 24%, worst was 134%
耗电量
在空闲模式下,笔记本电脑的功耗过高,明显高于配置类似的前代机型。在运行赛博朋克和压力测试时,功耗略有下降,且持续波动。230 瓦的电源装置仍然足够大。短期负载峰值(如压力测试开始时)对它来说不成问题。
| Off / Standby | |
| Idle | |
| Load |
|
Key:
min: | |
| SCHENKER XMG Pro 16 Studio (Mid 24) NVIDIA GeForce RTX 4070 Laptop GPU, i9-14900HX, Samsung 990 Pro 1 TB | Acer Predator Helios Neo 16 (2024) NVIDIA GeForce RTX 4070 Laptop GPU, i7-14700HX, Samsung PM9A1a MZVL21T0HDLU | Lenovo Legion Pro 5 16IRX9 NVIDIA GeForce RTX 4070 Laptop GPU, i9-14900HX, Samsung PM9A1 MZVL21T0HCLR | Aorus 16X 2024 NVIDIA GeForce RTX 4070 Laptop GPU, i9-14900HX, Gigabyte AG450E1024-SI | SCHENKER XMG Pro 16 Studio (Mid 23) NVIDIA GeForce RTX 4070 Laptop GPU, i9-13900H, Samsung 990 Pro 1 TB | |
|---|---|---|---|---|---|
| Power Consumption | 11% | 23% | 22% | 43% | |
| Idle Minimum * | 31 | 26.7 14% | 12.5 60% | 13 58% | 8 74% |
| Idle Average * | 33 | 24.4 26% | 24.6 25% | 18 45% | 12 64% |
| Idle Maximum * | 41 | 32.7 20% | 24.8 40% | 35 15% | 23 44% |
| Load Average * | 114 | 122.1 -7% | 109.6 4% | 138 -21% | 94 18% |
| Cyberpunk 2077 ultra * | 218 | ||||
| Cyberpunk 2077 ultra external monitor * | 196.8 | ||||
| Load Maximum * | 250 | 241 4% | 284.9 -14% | 222 11% | 215 14% |
| Witcher 3 ultra * | 190.6 | 218 | 172.6 | 181.5 |
* ... smaller is better
Power consumption Cyberpunk / stress test
Power consumption with external monitor
运行时间
在电池模式下,Pro 16 在低负载情况下所需的电量也比前代产品多。因此,在 WiFi 测试中,它的运行时间仅为 5:37 小时(映射使用脚本访问网站时的负载)。这让它比前一代 前代-它的电池容量同样为 73 Wh。
Pros
Cons
结论--有问题的动力
Pro 16 的重点在于永久性的高 GPU 性能,其性能值略高于 GPU 的平均值。中央处理器在使用一段时间后已经需要放松--CB15 Loop 就揭示了这一点。
XMG Pro 16 Studio(Mid 24)可以分配到模型维护部门。除了从 Raptor Lake 切换到 Raptor Lake Refresh 之外,这款笔记本电脑没有拥有任何重要的新功能。
该设备的噪音和发热量以及空闲模式下的功耗都(太)高。关于这款笔记本电脑的耗电量,我们不能排除我们的测试样品存在缺陷。运行时间尚可。
它安装的 16:10 面板(16 英寸、2,560 x 1,600 像素、sRGB、IPS、240 Hz)还不错,但缺少 DCI-P3 色彩空间,而这是创造者笔记本电脑的先决条件。该设备仍可容纳两个 PCIe 4 固态硬盘,并支持 RAID 0/1。一个 TB-4 端口提供了扩展选项(外置 GPU、基座),并支持 Power Delivery。
另一种选择是 Aorus 16X (2024).它能从相同的 CPU 中获得更强的计算能力,屏幕更亮(包括杜比视界),而且运行时间更长。
价格和供应情况
新型 XMG Pro 16 Studio(Mid 24)可通过bestware.com 进行配置和订购。目前测试设备的价格约为 2,500 美元。
请注意:我们最近更新了评级系统,第 8 版的结果无法与第 7 版的结果进行比较。更多信息 请点击此处.
SCHENKER XMG Pro 16 Studio (Mid 24)
- 07/23/2024 v8
Sascha Mölck
 Total Sustainability Score:
 Transparency
The selection of devices to be reviewed is made by our editorial team. The test sample was provided to the author as a loan by the manufacturer or retailer for the purpose of this review. The lender had no influence on this review, nor did the manufacturer receive a copy of this review before publication. There was no obligation to publish this review. We never accept compensation or payment in return for our reviews. As an independent media company, Notebookcheck is not subjected to the authority of manufacturers, retailers or publishers.
This is how Notebookcheck is testing
Every year, Notebookcheck independently reviews hundreds of laptops and smartphones using standardized procedures to ensure that all results are comparable. We have continuously developed our test methods for around 20 years and set industry standards in the process. In our test labs, high-quality measuring equipment is utilized by experienced technicians and editors. These tests involve a multi-stage validation process. Our complex rating system is based on hundreds of well-founded measurements and benchmarks, which maintains objectivity. Further information on our test methods can be found here.
Price comparison

