

酷睿i7-1265U与酷睿i5-1250P:联想ThinkPad X1 Carbon 10代笔记本电脑评测

ThinkPad X1 Carbon G10是联想最新推出的超轻商务笔记本电脑,采用12代英特尔Core-U和Core-P CPU。选择范围从Core i5-1240P到Core i7-1280P或Core i5-1235U到Core i7-1265U。
我们最近审查了酷睿i5-1250P版本,现在我们这次审查的重点将是同一ThinkPad X1 Carbon G10型号的酷睿i7-1265U版本。请看我们的 现有的Core-P版本来了解更多关于该机型的机箱、端口、键盘和其他物理特征。
ThinkPad X1 Carbon G10的竞争者包括其他高端商务副本,如戴尔Latitude 7420,华硕ExpertBook B1,HP EliteBook 845 G9, 或 微星峰会系列.
更多联想评论。
潜在的竞争对手比较
Rating | Date | Model | Weight | Height | Size | Resolution | Price |
|---|---|---|---|---|---|---|---|
| 90.2 % v7 (old) | 12 / 2022 | Lenovo ThinkPad X1 Carbon G10 Core i7-1265U i7-1265U, Iris Xe G7 96EUs | 1.2 kg | 15.36 mm | 14.00" | 1920x1200 | |
| 90.2 % v7 (old) | 06 / 2022 | Lenovo ThinkPad X1 Carbon G10 21CC001RGE i5-1250P, Iris Xe G7 80EUs | 1.2 kg | 15.36 mm | 14.00" | 1920x1200 | |
| 88.6 % v7 (old) | 11 / 2022 | HP EliteBook 845 G9 6F6H9EA R5 PRO 6650U, Radeon 660M | 1.4 kg | 19 mm | 14.00" | 1920x1200 | |
| 86.6 % v7 (old) | 10 / 2022 | LG Gram 14Z90Q i5-1240P, Iris Xe G7 80EUs | 980 g | 16.8 mm | 14.00" | 1920x1200 | |
| 90.1 % v7 (old) | 04 / 2022 | Dell Latitude 7420 JW6MH i5-1145G7, Iris Xe G7 80EUs | 1.3 kg | 17.3 mm | 14.00" | 1920x1080 | |
| 83.9 % v7 (old) | 12 / 2021 | Asus ExpertBook B1 B1400CEAE, i5-1135G7 i5-1135G7, Iris Xe G7 80EUs | 1.5 kg | 19.2 mm | 14.00" | 1920x1080 |
案例

沟通
| Networking | |
| iperf3 transmit AX12 | |
| Asus ExpertBook B1 B1400CEAE, i5-1135G7 | |
| Dell Latitude 7420 JW6MH | |
| iperf3 receive AX12 | |
| Dell Latitude 7420 JW6MH | |
| Asus ExpertBook B1 B1400CEAE, i5-1135G7 | |
| iperf3 receive AXE11000 6GHz | |
| LG Gram 14Z90Q | |
| Lenovo ThinkPad X1 Carbon G10 21CC001RGE | |
| Lenovo ThinkPad X1 Carbon G10 Core i7-1265U | |
| iperf3 receive AXE11000 | |
| HP EliteBook 845 G9 6F6H9EA | |
| Lenovo ThinkPad X1 Carbon G10 Core i7-1265U | |
| iperf3 transmit AXE11000 | |
| Lenovo ThinkPad X1 Carbon G10 Core i7-1265U | |
| iperf3 transmit AXE11000 6GHz | |
| Lenovo ThinkPad X1 Carbon G10 21CC001RGE | |
| Lenovo ThinkPad X1 Carbon G10 Core i7-1265U | |
网络摄像头


配件和保修
除了交流电适配器外,盒子里没有任何额外的东西。如果在美国购买,则有一年的现场制造商保修。
显示
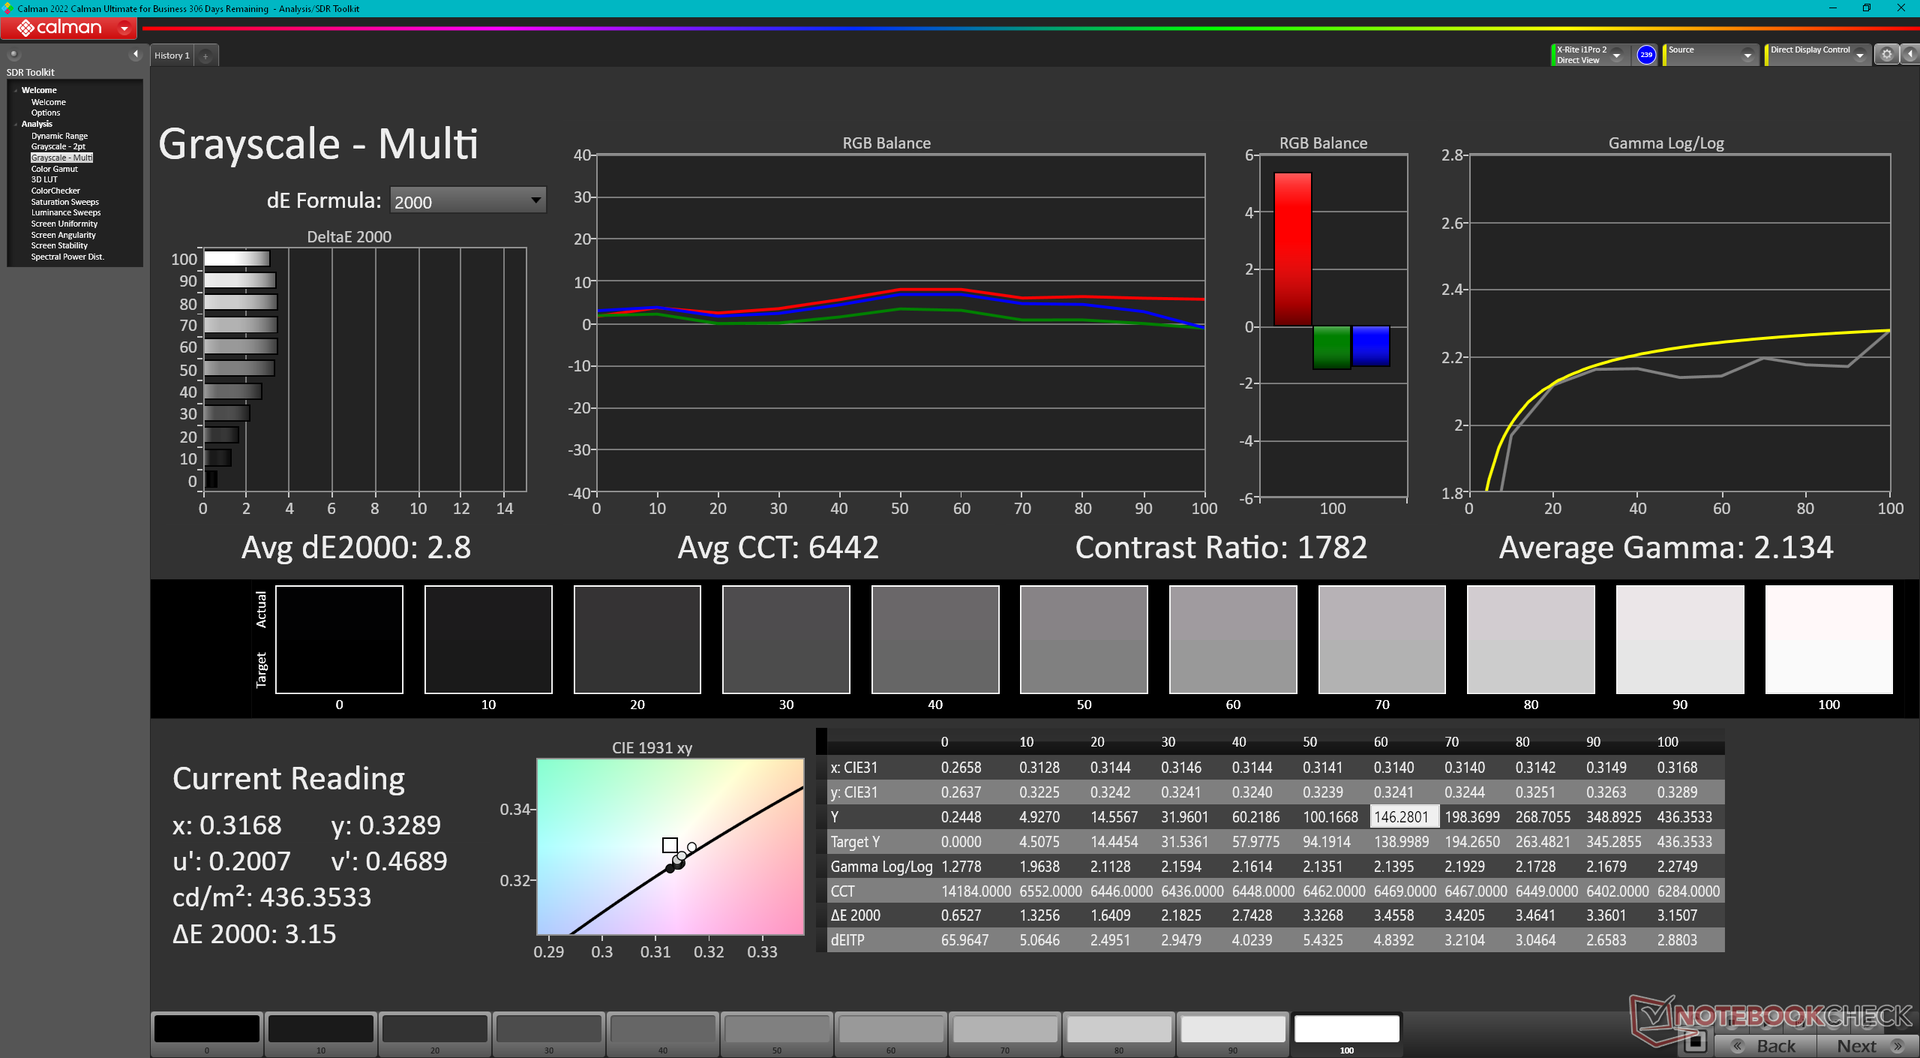
有趣的是,我们的Core-U单元使用了IVO的1200p IPS面板,而不是Core-P单元上的AU Optronics的B140UAN02.1面板。尽管它们都完全覆盖了sRGB标准,但IVO面板似乎提供了较慢的响应时间,而且对比度也不如AUO面板,正如我们在下面的测量中所显示的。因此,IVO面板上的重影现象更加明显。
不过,IVO面板也有一些好处。我们评测单位的背光平均略微明亮,而且它没有像我们Core-P配置的AUO面板那样表现出脉宽调制。因此,对屏幕闪烁敏感的用户可能更喜欢IVO面板。不幸的是,如果在网上订购,没有办法知道或保证你会得到这两种面板中的哪一种。


| |||||||||||||||||||||||||
Brightness Distribution: 87 %
Center on Battery: 421.9 cd/m²
Contrast: 1455:1 (Black: 0.29 cd/m²)
ΔE Color 1.69 | 0.5-29.43 Ø4.86, calibrated: 0.5
ΔE Greyscale 2.8 | 0.5-98 Ø5.1
70.2% AdobeRGB 1998 (Argyll 2.2.0 3D)
99.5% sRGB (Argyll 2.2.0 3D)
68.7% Display P3 (Argyll 2.2.0 3D)
Gamma: 2.13
| Lenovo ThinkPad X1 Carbon G10 Core i7-1265U R140NW4D R0, IPS, 1920x1200, 14" | Lenovo ThinkPad X1 Carbon G10 21CC001RGE B140UAN02.1, IPS LED, 1920x1200, 14" | HP EliteBook 845 G9 6F6H9EA AUOA49A, IPS, 1920x1200, 14" | LG Gram 14Z90Q LG LP140WU1-SPF1, IPS, 1920x1200, 14" | Dell Latitude 7420 JW6MH Chi Mei CMN1416 CHF07 140HCG, IPS, 1920x1080, 14" | Asus ExpertBook B1 B1400CEAE, i5-1135G7 Chi Mei CMN14D4, IPS, 1920x1080, 14" | |
|---|---|---|---|---|---|---|
| Display | 6% | 7% | 22% | -1% | -37% | |
| Display P3 Coverage | 68.7 | 74.6 9% | 75.4 10% | 98.4 43% | 68 -1% | 42.8 -38% |
| sRGB Coverage | 99.5 | 98.6 -1% | 100 1% | 99.9 0% | 99 -1% | 63.9 -36% |
| AdobeRGB 1998 Coverage | 70.2 | 76.5 9% | 76.6 9% | 85.9 22% | 70 0% | 44.3 -37% |
| Response Times | 31% | 16% | 29% | 20% | 41% | |
| Response Time Grey 50% / Grey 80% * | 55.2 ? | 45.5 ? 18% | 58.8 ? -7% | 47.5 ? 14% | 55 ? -0% | 35.2 ? 36% |
| Response Time Black / White * | 43.2 ? | 24 ? 44% | 26.7 ? 38% | 24.5 ? 43% | 26 ? 40% | 23.2 ? 46% |
| PWM Frequency | 53050 ? | 25000 ? | ||||
| Screen | -49% | -23% | -47% | -2% | -168% | |
| Brightness middle | 421.9 | 372 -12% | 408 -3% | 341 -19% | 408 -3% | 256 -39% |
| Brightness | 420 | 362 -14% | 402 -4% | 305 -27% | 378 -10% | 239 -43% |
| Brightness Distribution | 87 | 94 8% | 92 6% | 87 0% | 86 -1% | 83 -5% |
| Black Level * | 0.29 | 0.18 38% | 0.24 17% | 0.26 10% | 0.22 24% | 0.23 21% |
| Contrast | 1455 | 2067 42% | 1700 17% | 1312 -10% | 1855 27% | 1113 -24% |
| Colorchecker dE 2000 * | 1.69 | 3.4 -101% | 2.09 -24% | 3.11 -84% | 1.54 9% | 6.2 -267% |
| Colorchecker dE 2000 max. * | 3.55 | 6.7 -89% | 5.09 -43% | 8.29 -134% | 2.72 23% | 18.2 -413% |
| Colorchecker dE 2000 calibrated * | 0.5 | 1.8 -260% | 1.56 -212% | 0.83 -66% | 1.08 -116% | 3.8 -660% |
| Greyscale dE 2000 * | 2.8 | 4.3 -54% | 1.7 39% | 5.3 -89% | 1.95 30% | 5 -79% |
| Gamma | 2.13 103% | 2.13 103% | 2.138 103% | 2.037 108% | 2.33 94% | 1.97 112% |
| CCT | 6442 101% | 6158 106% | 6628 98% | 7571 86% | 6806 96% | 7364 88% |
| Total Average (Program / Settings) | -4% /
-26% | 0% /
-11% | 1% /
-21% | 6% /
2% | -55% /
-110% |
* ... smaller is better


该面板在开箱后已经被很好地校准,平均灰度和色彩deltaE值分别只有2.8和1.69。我们自己的X-Rite色度计校准将进一步改善这些平均值,使其<1,但这对大多数用户来说没有必要。我们校准过的ICM配置文件可在上面免费提供给想要尝试的用户。


Display Response Times
| ↔ Response Time Black to White | ||
|---|---|---|
| 43.2 ms ... rise ↗ and fall ↘ combined | ↗ 22 ms rise |  |
| ↘ 21.2 ms fall | ||
| The screen shows slow response rates in our tests and will be unsatisfactory for gamers. In comparison, all tested devices range from 0.1 (minimum) to 240 (maximum) ms. » 98 % of all devices are better. This means that the measured response time is worse than the average of all tested devices (20.7 ms). | ||
| ↔ Response Time 50% Grey to 80% Grey | ||
| 55.2 ms ... rise ↗ and fall ↘ combined | ↗ 28.4 ms rise |  |
| ↘ 26.8 ms fall | ||
| The screen shows slow response rates in our tests and will be unsatisfactory for gamers. In comparison, all tested devices range from 0.165 (minimum) to 636 (maximum) ms. » 91 % of all devices are better. This means that the measured response time is worse than the average of all tested devices (32.4 ms). | ||
Screen Flickering / PWM (Pulse-Width Modulation)
| Screen flickering / PWM not detected |  | ||
In comparison: 53 % of all tested devices do not use PWM to dim the display. If PWM was detected, an average of 8482 (minimum: 5 - maximum: 343500) Hz was measured. | |||


性能 - 英特尔第12代产品


测试条件
在运行下面的任何基准测试之前,我们通过Windows将我们的设备设置为 "最佳性能 "模式。预装的Vantage软件不包括默认启用智能冷却的电源配置文件选项,如下面的截图所示。


处理器
在循环运行CineBench R15 xT时,我们的 酷睿i7-1265U 的速度会比 酷睿i5-1250P在测试开始时,我们的酷睿i7-1265U会比酷睿i5-1250P稍慢。然而,随着循环基准测试的进行,i7-1265U将超过i5-1250P,正如我们下面的对比图所示。这些结果表明,酷睿i5-1250P可以比我们的i7-1265U有更高的初始Turbo Boost性能,但这种收益是短暂的。
这并不是说应该避免使用Core-P SKU。例如,升级到最高端的酷睿i7-1280P配置,根据我们对Yoga Slim 9 14的经验,可能比我们的酷睿i7-1265U提高50%到60%的多线程性能。
Cinebench R15 Multi Loop
Cinebench R23: Multi Core | Single Core
Cinebench R15: CPU Multi 64Bit | CPU Single 64Bit
Blender: v2.79 BMW27 CPU
7-Zip 18.03: 7z b 4 | 7z b 4 -mmt1
Geekbench 5.5: Multi-Core | Single-Core
HWBOT x265 Benchmark v2.2: 4k Preset
LibreOffice : 20 Documents To PDF
R Benchmark 2.5: Overall mean
Cinebench R23: Multi Core | Single Core
Cinebench R15: CPU Multi 64Bit | CPU Single 64Bit
Blender: v2.79 BMW27 CPU
7-Zip 18.03: 7z b 4 | 7z b 4 -mmt1
Geekbench 5.5: Multi-Core | Single-Core
HWBOT x265 Benchmark v2.2: 4k Preset
LibreOffice : 20 Documents To PDF
R Benchmark 2.5: Overall mean
* ... smaller is better
* ... smaller is better
AIDA64: FP32 Ray-Trace | FPU Julia | CPU SHA3 | CPU Queen | FPU SinJulia | FPU Mandel | CPU AES | CPU ZLib | FP64 Ray-Trace | CPU PhotoWorxx
| AIDA64 / FP32 Ray-Trace | |
| HP EliteBook 845 G9 6F6H9EA | |
| Asus ExpertBook B1 B1400CEAE, i5-1135G7 | |
| Lenovo ThinkPad X1 Carbon G10 Core i7-1265U | |
| Dell Latitude 7420 JW6MH | |
| Average Intel Core i7-1265U (2619 - 8178, n=10) | |
| LG Gram 14Z90Q | |
| Lenovo ThinkPad X1 Carbon G10 21CC001RGE | |
| AIDA64 / FPU SinJulia | |
| HP EliteBook 845 G9 6F6H9EA | |
| Lenovo ThinkPad X1 Carbon G10 21CC001RGE | |
| Dell Latitude 7420 JW6MH | |
| Lenovo ThinkPad X1 Carbon G10 Core i7-1265U | |
| Asus ExpertBook B1 B1400CEAE, i5-1135G7 | |
| Average Intel Core i7-1265U (3105 - 5135, n=10) | |
| LG Gram 14Z90Q | |
| AIDA64 / FP64 Ray-Trace | |
| HP EliteBook 845 G9 6F6H9EA | |
| Lenovo ThinkPad X1 Carbon G10 Core i7-1265U | |
| Asus ExpertBook B1 B1400CEAE, i5-1135G7 | |
| Dell Latitude 7420 JW6MH | |
| Average Intel Core i7-1265U (1473 - 4376, n=10) | |
| LG Gram 14Z90Q | |
| Lenovo ThinkPad X1 Carbon G10 21CC001RGE | |
| AIDA64 / CPU PhotoWorxx | |
| Lenovo ThinkPad X1 Carbon G10 Core i7-1265U | |
| Dell Latitude 7420 JW6MH | |
| Average Intel Core i7-1265U (20213 - 47031, n=10) | |
| Lenovo ThinkPad X1 Carbon G10 21CC001RGE | |
| LG Gram 14Z90Q | |
| HP EliteBook 845 G9 6F6H9EA | |
| Asus ExpertBook B1 B1400CEAE, i5-1135G7 | |
系统性能
PCMark 10的结果始终高于我们采用Core-i5-P的ThinkPad X1 Carbon G10,特别是在图形性能最重要的数字竞争创造分测试中。

CrossMark: Overall | Productivity | Creativity | Responsiveness
| PCMark 10 / Score | |
| HP EliteBook 845 G9 6F6H9EA | |
| Lenovo ThinkPad X1 Carbon G10 Core i7-1265U | |
| Average Intel Core i7-1265U, Intel Iris Xe Graphics G7 96EUs (4753 - 5766, n=7) | |
| Lenovo ThinkPad X1 Carbon G10 21CC001RGE | |
| LG Gram 14Z90Q | |
| Dell Latitude 7420 JW6MH | |
| Asus ExpertBook B1 B1400CEAE, i5-1135G7 | |
| PCMark 10 / Essentials | |
| Average Intel Core i7-1265U, Intel Iris Xe Graphics G7 96EUs (9278 - 11418, n=7) | |
| Lenovo ThinkPad X1 Carbon G10 Core i7-1265U | |
| Lenovo ThinkPad X1 Carbon G10 21CC001RGE | |
| Dell Latitude 7420 JW6MH | |
| HP EliteBook 845 G9 6F6H9EA | |
| LG Gram 14Z90Q | |
| Asus ExpertBook B1 B1400CEAE, i5-1135G7 | |
| PCMark 10 / Productivity | |
| HP EliteBook 845 G9 6F6H9EA | |
| Lenovo ThinkPad X1 Carbon G10 Core i7-1265U | |
| Average Intel Core i7-1265U, Intel Iris Xe Graphics G7 96EUs (5828 - 7311, n=7) | |
| Lenovo ThinkPad X1 Carbon G10 21CC001RGE | |
| Dell Latitude 7420 JW6MH | |
| LG Gram 14Z90Q | |
| Asus ExpertBook B1 B1400CEAE, i5-1135G7 | |
| PCMark 10 / Digital Content Creation | |
| Lenovo ThinkPad X1 Carbon G10 Core i7-1265U | |
| HP EliteBook 845 G9 6F6H9EA | |
| Average Intel Core i7-1265U, Intel Iris Xe Graphics G7 96EUs (5127 - 6330, n=7) | |
| LG Gram 14Z90Q | |
| Lenovo ThinkPad X1 Carbon G10 21CC001RGE | |
| Dell Latitude 7420 JW6MH | |
| Asus ExpertBook B1 B1400CEAE, i5-1135G7 | |
| CrossMark / Overall | |
| Lenovo ThinkPad X1 Carbon G10 Core i7-1265U | |
| Lenovo ThinkPad X1 Carbon G10 21CC001RGE | |
| Average Intel Core i7-1265U, Intel Iris Xe Graphics G7 96EUs (1301 - 1615, n=7) | |
| Dell Latitude 7420 JW6MH | |
| CrossMark / Productivity | |
| Lenovo ThinkPad X1 Carbon G10 Core i7-1265U | |
| Lenovo ThinkPad X1 Carbon G10 21CC001RGE | |
| Average Intel Core i7-1265U, Intel Iris Xe Graphics G7 96EUs (1230 - 1586, n=7) | |
| Dell Latitude 7420 JW6MH | |
| CrossMark / Creativity | |
| Lenovo ThinkPad X1 Carbon G10 21CC001RGE | |
| Lenovo ThinkPad X1 Carbon G10 Core i7-1265U | |
| Average Intel Core i7-1265U, Intel Iris Xe Graphics G7 96EUs (1413 - 1706, n=7) | |
| Dell Latitude 7420 JW6MH | |
| CrossMark / Responsiveness | |
| Lenovo ThinkPad X1 Carbon G10 Core i7-1265U | |
| Lenovo ThinkPad X1 Carbon G10 21CC001RGE | |
| Average Intel Core i7-1265U, Intel Iris Xe Graphics G7 96EUs (1193 - 1521, n=7) | |
| Dell Latitude 7420 JW6MH | |
| PCMark 10 Score | 5467 points | |
Help | ||
| AIDA64 / Memory Write | |
| Lenovo ThinkPad X1 Carbon G10 Core i7-1265U | |
| LG Gram 14Z90Q | |
| Lenovo ThinkPad X1 Carbon G10 21CC001RGE | |
| Average Intel Core i7-1265U (41382 - 76027, n=10) | |
| Dell Latitude 7420 JW6MH | |
| HP EliteBook 845 G9 6F6H9EA | |
| Asus ExpertBook B1 B1400CEAE, i5-1135G7 | |
* ... smaller is better
DPC延时
LatencyMon显示了在打开我们的主页的多个浏览器标签时的DPC问题。在60FPS下的4K视频播放在其他方面是完美的,CPU利用率低,没有丢帧。


| DPC Latencies / LatencyMon - interrupt to process latency (max), Web, Youtube, Prime95 | |
| Lenovo ThinkPad X1 Carbon G10 Core i7-1265U | |
| Lenovo ThinkPad X1 Carbon G10 21CC001RGE | |
| HP EliteBook 845 G9 6F6H9EA | |
| Asus ExpertBook B1 B1400CEAE, i5-1135G7 | |
| LG Gram 14Z90Q | |
| Dell Latitude 7420 JW6MH | |
* ... smaller is better
存储设备 - 只有一个驱动器
我们的设备配备了一个 512GB PCIe3 x4 Kioxia NVMe SSD尽管该系统支持PCie4 x4驱动器。与我们在Core-P配置中的PCIe4 x4三星驱动器上观察到的情况不同,传输率很稳定,没有任何重大的性能缩减。这表明,由于温度问题,大多数PCIe4 x4 NVMe固态硬盘无法在ThinkPad内部长时间以最高速度运行。


* ... smaller is better
Disk Throttling: DiskSpd Read Loop, Queue Depth 8
GPU性能
图形性能可较之以前快20%至40%。 Iris Xe 80 EUs同一型号的ThinkPad X1 Carbon G10的Core i5-1250P SKU中的图形性能可以快20%到40%。


| 3DMark 11 Performance | 6479 points | |
| 3DMark Cloud Gate Standard Score | 21103 points | |
| 3DMark Fire Strike Score | 4794 points | |
| 3DMark Time Spy Score | 1744 points | |
Help | ||
Witcher 3 FPS Chart
| low | med. | high | ultra | |
|---|---|---|---|---|
| GTA V (2015) | 108.4 | 88 | 22.2 | 9.7 |
| The Witcher 3 (2015) | 95.6 | 60.3 | 33.9 | 15.4 |
| Dota 2 Reborn (2015) | 106.8 | 82 | 65.9 | 59.8 |
| Final Fantasy XV Benchmark (2018) | 43.7 | 23.6 | 16.5 | |
| X-Plane 11.11 (2018) | 40.4 | 35 | 31.3 | |
| Strange Brigade (2018) | 89.6 | 38.5 | 30.3 | 24.3 |
| Cyberpunk 2077 1.6 (2022) | 21.9 | 18 | 13.6 | 10.9 |
排放
系统噪音 - 大一点
总的来说,风扇噪音比我们在Core i5 Core-P配置上记录的要大。尽管该系统在较低负载下保持安静方面做得很好,但当像3DMark 06这样的高负载被引入时,双内部风扇往往会更快地升温。在运行3DMark 06时,我们能够记录到近39 dB(A)的最大风扇噪音。 Witcher 3而Core-P SKU则为36 dB(A)。

Noise Level
| Idle |
| 23.2 / 23.2 / 23.2 dB(A) |
| Load |
| 38.6 / 38.3 dB(A) |
 | ||
30 dB silent 40 dB(A) audible 50 dB(A) loud |
||
min: | ||
| Lenovo ThinkPad X1 Carbon G10 Core i7-1265U Iris Xe G7 96EUs, i7-1265U, Kioxia BG5 KBG5AZNV1T02 | Lenovo ThinkPad X1 Carbon G10 21CC001RGE Iris Xe G7 80EUs, i5-1250P, Samsung PM9A1 MZVL2512HCJQ | HP EliteBook 845 G9 6F6H9EA Radeon 660M, R5 PRO 6650U, Samsung PM991 MZVLQ512HBLU | LG Gram 14Z90Q Iris Xe G7 80EUs, i5-1240P, Samsung PM9A1 MZVL2512HCJQ | Dell Latitude 7420 JW6MH Iris Xe G7 80EUs, i5-1145G7, SK Hynix BC711 HFM512GD3HX015N | Asus ExpertBook B1 B1400CEAE, i5-1135G7 Iris Xe G7 80EUs, i5-1135G7, WDC PC SN530 SDBPNPZ-512G | |
|---|---|---|---|---|---|---|
| Noise | 6% | -2% | -5% | -12% | 4% | |
| off / environment * | 23.2 | 22.81 2% | 24 -3% | 25 -8% | 25.3 -9% | 23.8 -3% |
| Idle Minimum * | 23.2 | 22.81 2% | 24 -3% | 26 -12% | 25.3 -9% | 23.8 -3% |
| Idle Average * | 23.2 | 22.81 2% | 25 -8% | 27 -16% | 25.3 -9% | 23.8 -3% |
| Idle Maximum * | 23.2 | 22.81 2% | 26 -12% | 28 -21% | 25.3 -9% | 26.5 -14% |
| Load Average * | 38.6 | 31.59 18% | 34 12% | 35 9% | 44.9 -16% | 28.6 26% |
| Witcher 3 ultra * | 38.5 | 35.59 8% | 38 1% | 36 6% | 30.6 21% | |
| Load Maximum * | 38.3 | 35.47 7% | 38 1% | 36 6% | 44.9 -17% | 37.4 2% |
* ... smaller is better
温度
由于冷却解决方案和处理器的位置,笔记本电脑左半部分的表面温度总是比右半部分要高。事实上,键盘甲板上的热点温度可以达到42℃,而掌托上的温度只有20℃。然而,尽管有性能上的差异,温度仍可与采用Core-P处理器的X1 Carbon G10相媲美。


(±) The maximum temperature on the upper side is 41.2 °C / 106 F, compared to the average of 34.3 °C / 94 F, ranging from 21.2 to 62.5 °C for the class Office.
(±) The bottom heats up to a maximum of 41 °C / 106 F, compared to the average of 36.8 °C / 98 F
(+) In idle usage, the average temperature for the upper side is 21.4 °C / 71 F, compared to the device average of 29.5 °C / 85 F.
(+) The palmrests and touchpad are cooler than skin temperature with a maximum of 25.2 °C / 77.4 F and are therefore cool to the touch.
(+) The average temperature of the palmrest area of similar devices was 27.6 °C / 81.7 F (+2.4 °C / 4.3 F).


| Lenovo ThinkPad X1 Carbon G10 Core i7-1265U Intel Core i7-1265U, Intel Iris Xe Graphics G7 96EUs | Lenovo ThinkPad X1 Carbon G10 21CC001RGE Intel Core i5-1250P, Intel Iris Xe Graphics G7 80EUs | HP EliteBook 845 G9 6F6H9EA AMD Ryzen 5 PRO 6650U, AMD Radeon 660M | LG Gram 14Z90Q Intel Core i5-1240P, Intel Iris Xe Graphics G7 80EUs | Dell Latitude 7420 JW6MH Intel Core i5-1145G7, Intel Iris Xe Graphics G7 80EUs | Asus ExpertBook B1 B1400CEAE, i5-1135G7 Intel Core i5-1135G7, Intel Iris Xe Graphics G7 80EUs | |
|---|---|---|---|---|---|---|
| Heat | -23% | -12% | -13% | -6% | -15% | |
| Maximum Upper Side * | 41.2 | 45 -9% | 44 -7% | 43 -4% | 37.1 10% | 41.7 -1% |
| Maximum Bottom * | 41 | 44 -7% | 45 -10% | 45 -10% | 38.7 6% | 54.3 -32% |
| Idle Upper Side * | 23.2 | 31.2 -34% | 27 -16% | 27 -16% | 27.3 -18% | 26 -12% |
| Idle Bottom * | 23.4 | 33.2 -42% | 27 -15% | 28 -20% | 28.1 -20% | 27.1 -16% |
* ... smaller is better
压力测试
当在Prime95下受压时,CPU将提升到3.7 GHz、51 W和98 C,时间只有几秒钟。然后,时钟频率和功耗将分别下降到2.7 GHz和35 W,直到几分钟后最终稳定在2.3 GHz、24 W和82 C。核心温度飙升至近100摄氏度,这表明冷却方案不足以最大限度地提高Turbo Boost性能。
用电池供电运行似乎对CPU或GPU的性能没有明显影响。在主电源上进行3DMark 11测试,然后在电池上进行测试,最终得分几乎没有差别。


| CPU时钟(GHz) | GPU时钟(MHz) | CPU平均温度(°C) | |
| 系统空闲 | -- | -- | 46 |
| Prime95压力 | 2.3 | -- | 82 |
| Prime95 + FurMark 压力 | 1.5 | 648 | 68 |
| Witcher 3 应力 | ~2.2 | 1147 | 69 |
发言人

Lenovo ThinkPad X1 Carbon G10 Core i7-1265U audio analysis
(+) | speakers can play relatively loud (85.5 dB)
Bass 100 - 315 Hz
(±) | reduced bass - on average 13.4% lower than median
(±) | linearity of bass is average (11.3% delta to prev. frequency)
Mids 400 - 2000 Hz
(+) | balanced mids - only 3.2% away from median
(+) | mids are linear (3.3% delta to prev. frequency)
Highs 2 - 16 kHz
(+) | balanced highs - only 2.7% away from median
(+) | highs are linear (4.4% delta to prev. frequency)
Overall 100 - 16.000 Hz
(+) | overall sound is linear (10.8% difference to median)
Compared to same class
» 1% of all tested devices in this class were better, 1% similar, 98% worse
» The best had a delta of 7%, average was 21%, worst was 53%
Compared to all devices tested
» 5% of all tested devices were better, 1% similar, 93% worse
» The best had a delta of 4%, average was 24%, worst was 134%
Apple MacBook Pro 16 2021 M1 Pro audio analysis
(+) | speakers can play relatively loud (84.7 dB)
Bass 100 - 315 Hz
(+) | good bass - only 3.8% away from median
(+) | bass is linear (5.2% delta to prev. frequency)
Mids 400 - 2000 Hz
(+) | balanced mids - only 1.3% away from median
(+) | mids are linear (2.1% delta to prev. frequency)
Highs 2 - 16 kHz
(+) | balanced highs - only 1.9% away from median
(+) | highs are linear (2.7% delta to prev. frequency)
Overall 100 - 16.000 Hz
(+) | overall sound is linear (4.6% difference to median)
Compared to same class
» 0% of all tested devices in this class were better, 0% similar, 100% worse
» The best had a delta of 5%, average was 18%, worst was 45%
Compared to all devices tested
» 0% of all tested devices were better, 0% similar, 100% worse
» The best had a delta of 4%, average was 24%, worst was 134%
能源管理
耗电量 - 要求更高
我们的酷睿i7-1265U设备在运行更高的负载时,比酷睿i5-1250P设备要求更高,约为40%至80%,这与我们上面记录的更快的CPU和GPU结果一致。事实上,这种特殊的Core-i7-U配置可以比大多数没有独立显卡的14英寸商务笔记本电脑要求更高。
在启动Prime95压力时,我们能够从小型(约10.8 x 4.7 x 3厘米)的65瓦USB-C交流适配器中记录到56瓦的最大功耗,正如我们下面的屏幕截图所示。这比我们在Core i5-1250P配置上记录的63瓦要低,因为后者受益于更高的初始Turbo Boost性能,正如我们上面的CineBench结果所体现的。


| Off / Standby | |
| Idle | |
| Load |
|
Key:
min: | |
| Lenovo ThinkPad X1 Carbon G10 Core i7-1265U i7-1265U, Iris Xe G7 96EUs, Kioxia BG5 KBG5AZNV1T02, IPS, 1920x1200, 14" | Lenovo ThinkPad X1 Carbon G10 21CC001RGE i5-1250P, Iris Xe G7 80EUs, Samsung PM9A1 MZVL2512HCJQ, IPS LED, 1920x1200, 14" | HP EliteBook 845 G9 6F6H9EA R5 PRO 6650U, Radeon 660M, Samsung PM991 MZVLQ512HBLU, IPS, 1920x1200, 14" | LG Gram 14Z90Q i5-1240P, Iris Xe G7 80EUs, Samsung PM9A1 MZVL2512HCJQ, IPS, 1920x1200, 14" | Dell Latitude 7420 JW6MH i5-1145G7, Iris Xe G7 80EUs, SK Hynix BC711 HFM512GD3HX015N, IPS, 1920x1080, 14" | Asus ExpertBook B1 B1400CEAE, i5-1135G7 i5-1135G7, Iris Xe G7 80EUs, WDC PC SN530 SDBPNPZ-512G, IPS, 1920x1080, 14" | |
|---|---|---|---|---|---|---|
| Power Consumption | 20% | 16% | 4% | 14% | 21% | |
| Idle Minimum * | 2.8 | 2.9 -4% | 3 -7% | 3 -7% | 2.7 4% | 3.2 -14% |
| Idle Average * | 6 | 4.9 18% | 5 17% | 6 -0% | 6 -0% | 5.2 13% |
| Idle Maximum * | 10.9 | 6 45% | 9 17% | 12 -10% | 7.6 30% | 6.1 44% |
| Load Average * | 51.8 | 29.3 43% | 41 21% | 40 23% | 37 29% | 25.2 51% |
| Witcher 3 ultra * | 51.6 | 36.6 29% | 32.6 37% | 36.5 29% | 33.2 36% | 27.7 46% |
| Load Maximum * | 55.6 | 63.3 -14% | 50 10% | 63 -13% | 65 -17% | 64.3 -16% |
* ... smaller is better
Power Consumption Witcher 3 / Stresstest
Power Consumption external Monitor
电池寿命 - 更短的运行时间
WLAN运行时间明显短于我们在ThinkPad X1 Carbon G10的Core-P版本上记录的时间,当时两者都设置为类似的平衡电源配置文件和150尼特亮度条件。我们甚至重复了测试以确保,但结果在我们的测试设备上没有改善。预计实际浏览时间只有6.5小时,而Core-P SKU的浏览时间超过10小时。较短的运行时间与我们上述总体较高的功耗读数相一致。
从空电到满电的充电时间比预期的慢,大约为2.5小时。
| Lenovo ThinkPad X1 Carbon G10 Core i7-1265U i7-1265U, Iris Xe G7 96EUs, 57 Wh | Lenovo ThinkPad X1 Carbon G10 21CC001RGE i5-1250P, Iris Xe G7 80EUs, 57 Wh | HP EliteBook 845 G9 6F6H9EA R5 PRO 6650U, Radeon 660M, 51 Wh | LG Gram 14Z90Q i5-1240P, Iris Xe G7 80EUs, 72 Wh | Dell Latitude 7420 JW6MH i5-1145G7, Iris Xe G7 80EUs, 63 Wh | Asus ExpertBook B1 B1400CEAE, i5-1135G7 i5-1135G7, Iris Xe G7 80EUs, 42 Wh | |
|---|---|---|---|---|---|---|
| Battery Runtime | 55% | 85% | 81% | 116% | 6% | |
| WiFi v1.3 | 393 | 610 55% | 728 85% | 712 81% | 848 116% | 416 6% |
| H.264 | 654 | |||||
| Load | 142 | 169 | 155 | |||
| Reader / Idle | 1736 | 1411 |
Pros
Cons
结论 - 酷睿i7 U击败酷睿i5 P

笔记本 酷睿i7-1265U和 酷睿i5-1250P配置在配备类似的存储和内存容量时,零售价都在1900美元左右。如果你正在寻找更快的整体CPU和GPU性能,那么建议选择酷睿i7-1265U。它的优势也不小,因为仅集成的GPU就可以快40%,而CPU随着时间的推移节流得更少。
ThinkPad X1 Carbon G10的酷睿i7-1265U版本比酷睿i5-1250P版本要快得多,但它的代价是电池寿命更短。
然而,要想获得更长的电池寿命、更低的功耗和潜在的更安静的风扇噪音,酷睿i5-1250P的选择将是正确的选择。该系统可以比酷睿i7-1265U选项多持续几个小时,一些用户可能会喜欢。否则,如果电池寿命不那么重要的话,选择酷睿i7-1265U就能获得更多的收益。
价格和可用性
我们的确切配置是,目前在亚马逊上发货售价略低于1900美元。截至目前,联想没有通过其官方网站提供Core i7-1265U的配置。
Lenovo ThinkPad X1 Carbon G10 Core i7-1265U
- 12/14/2022 v7 (old)
Allen Ngo
Price comparison

