Notebookcheck Logo
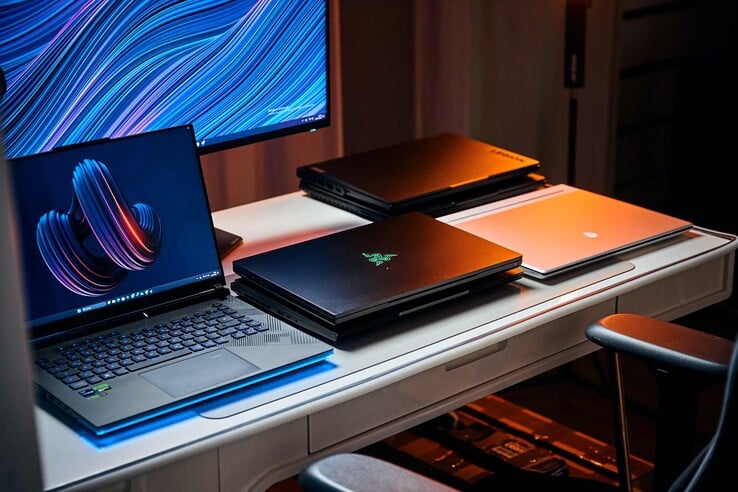
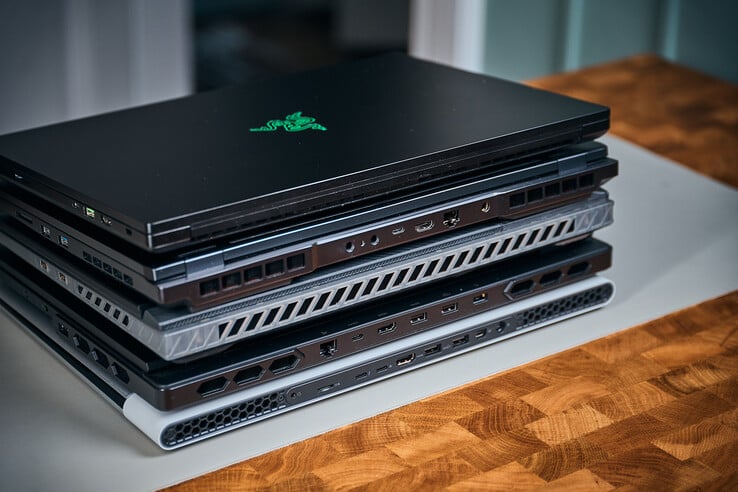
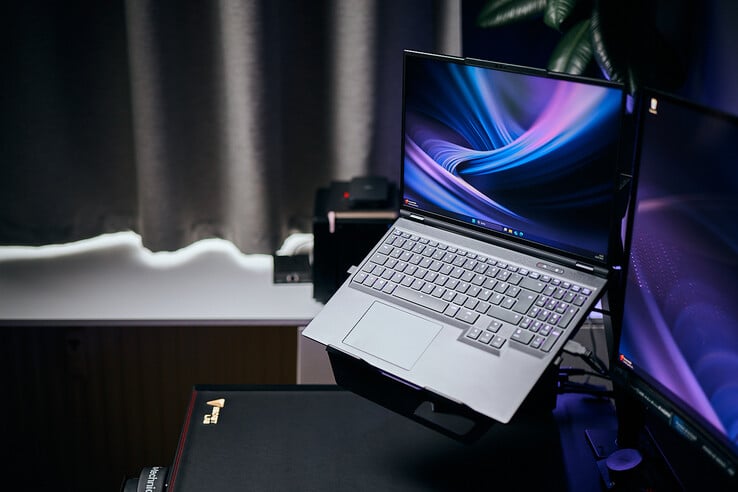
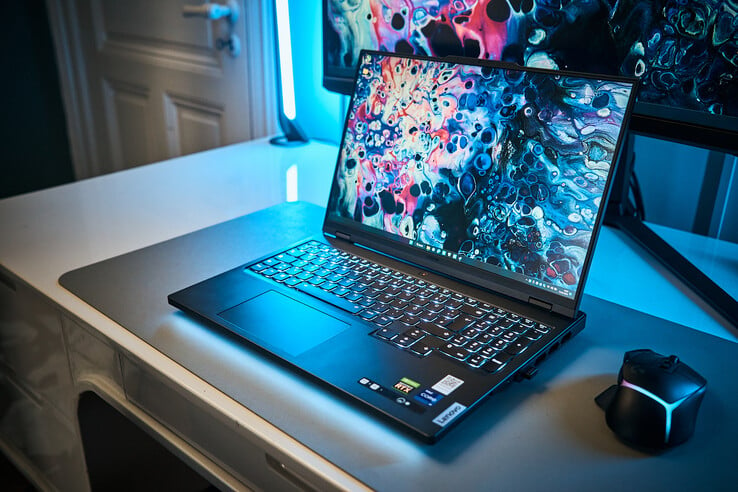
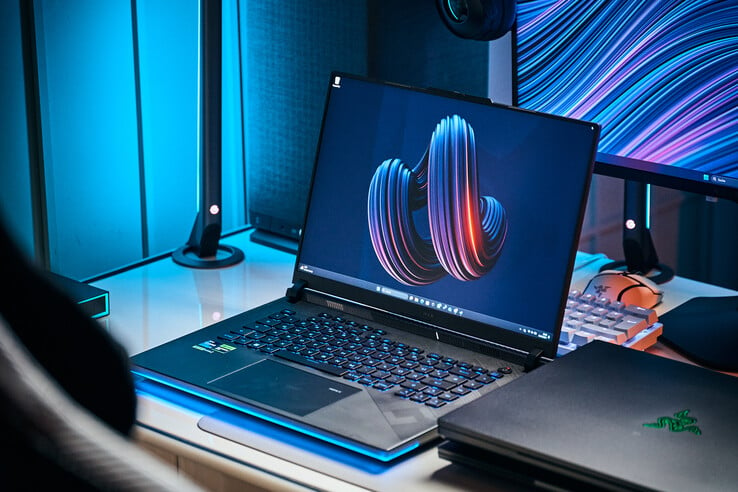
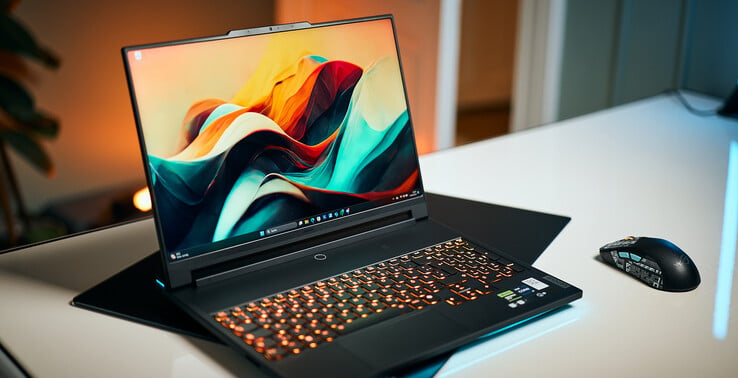
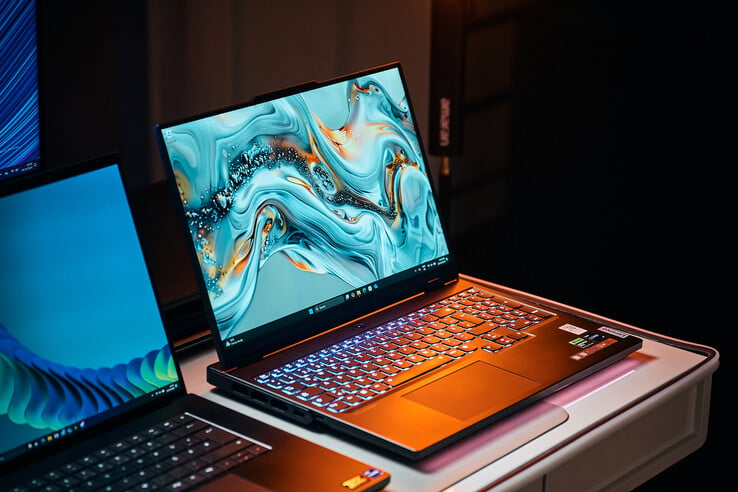
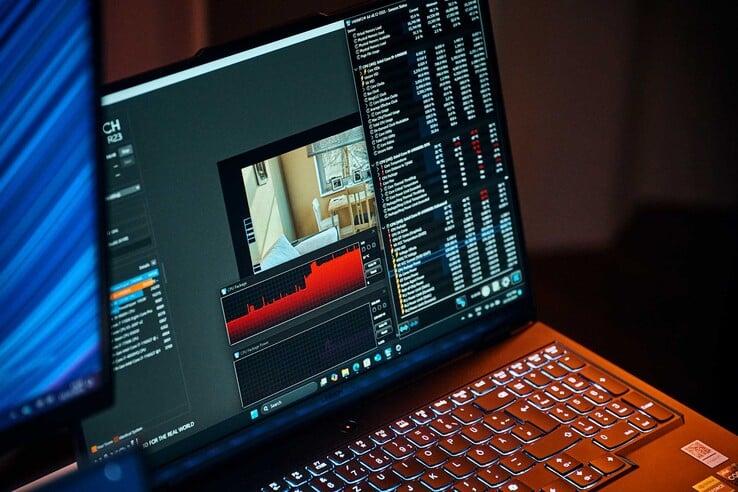
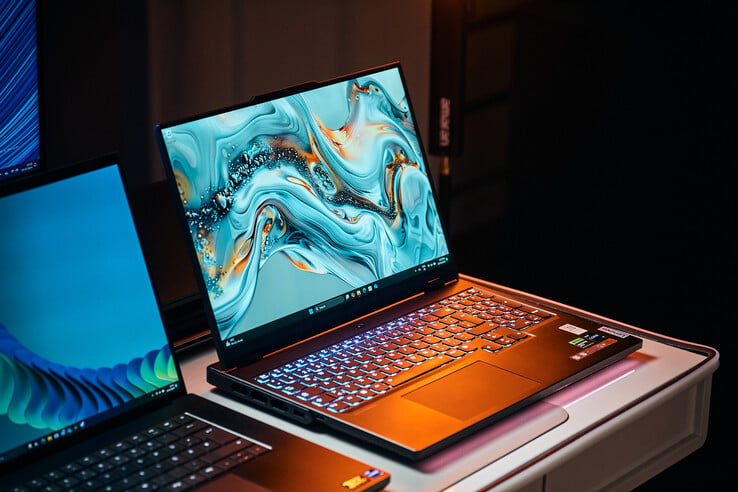
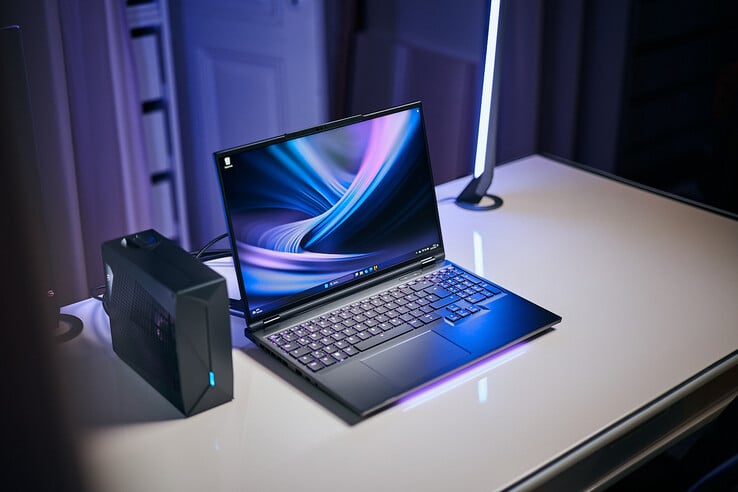
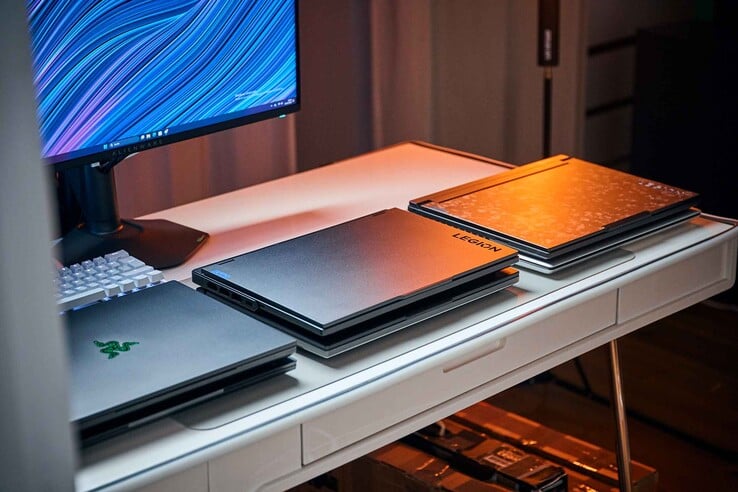
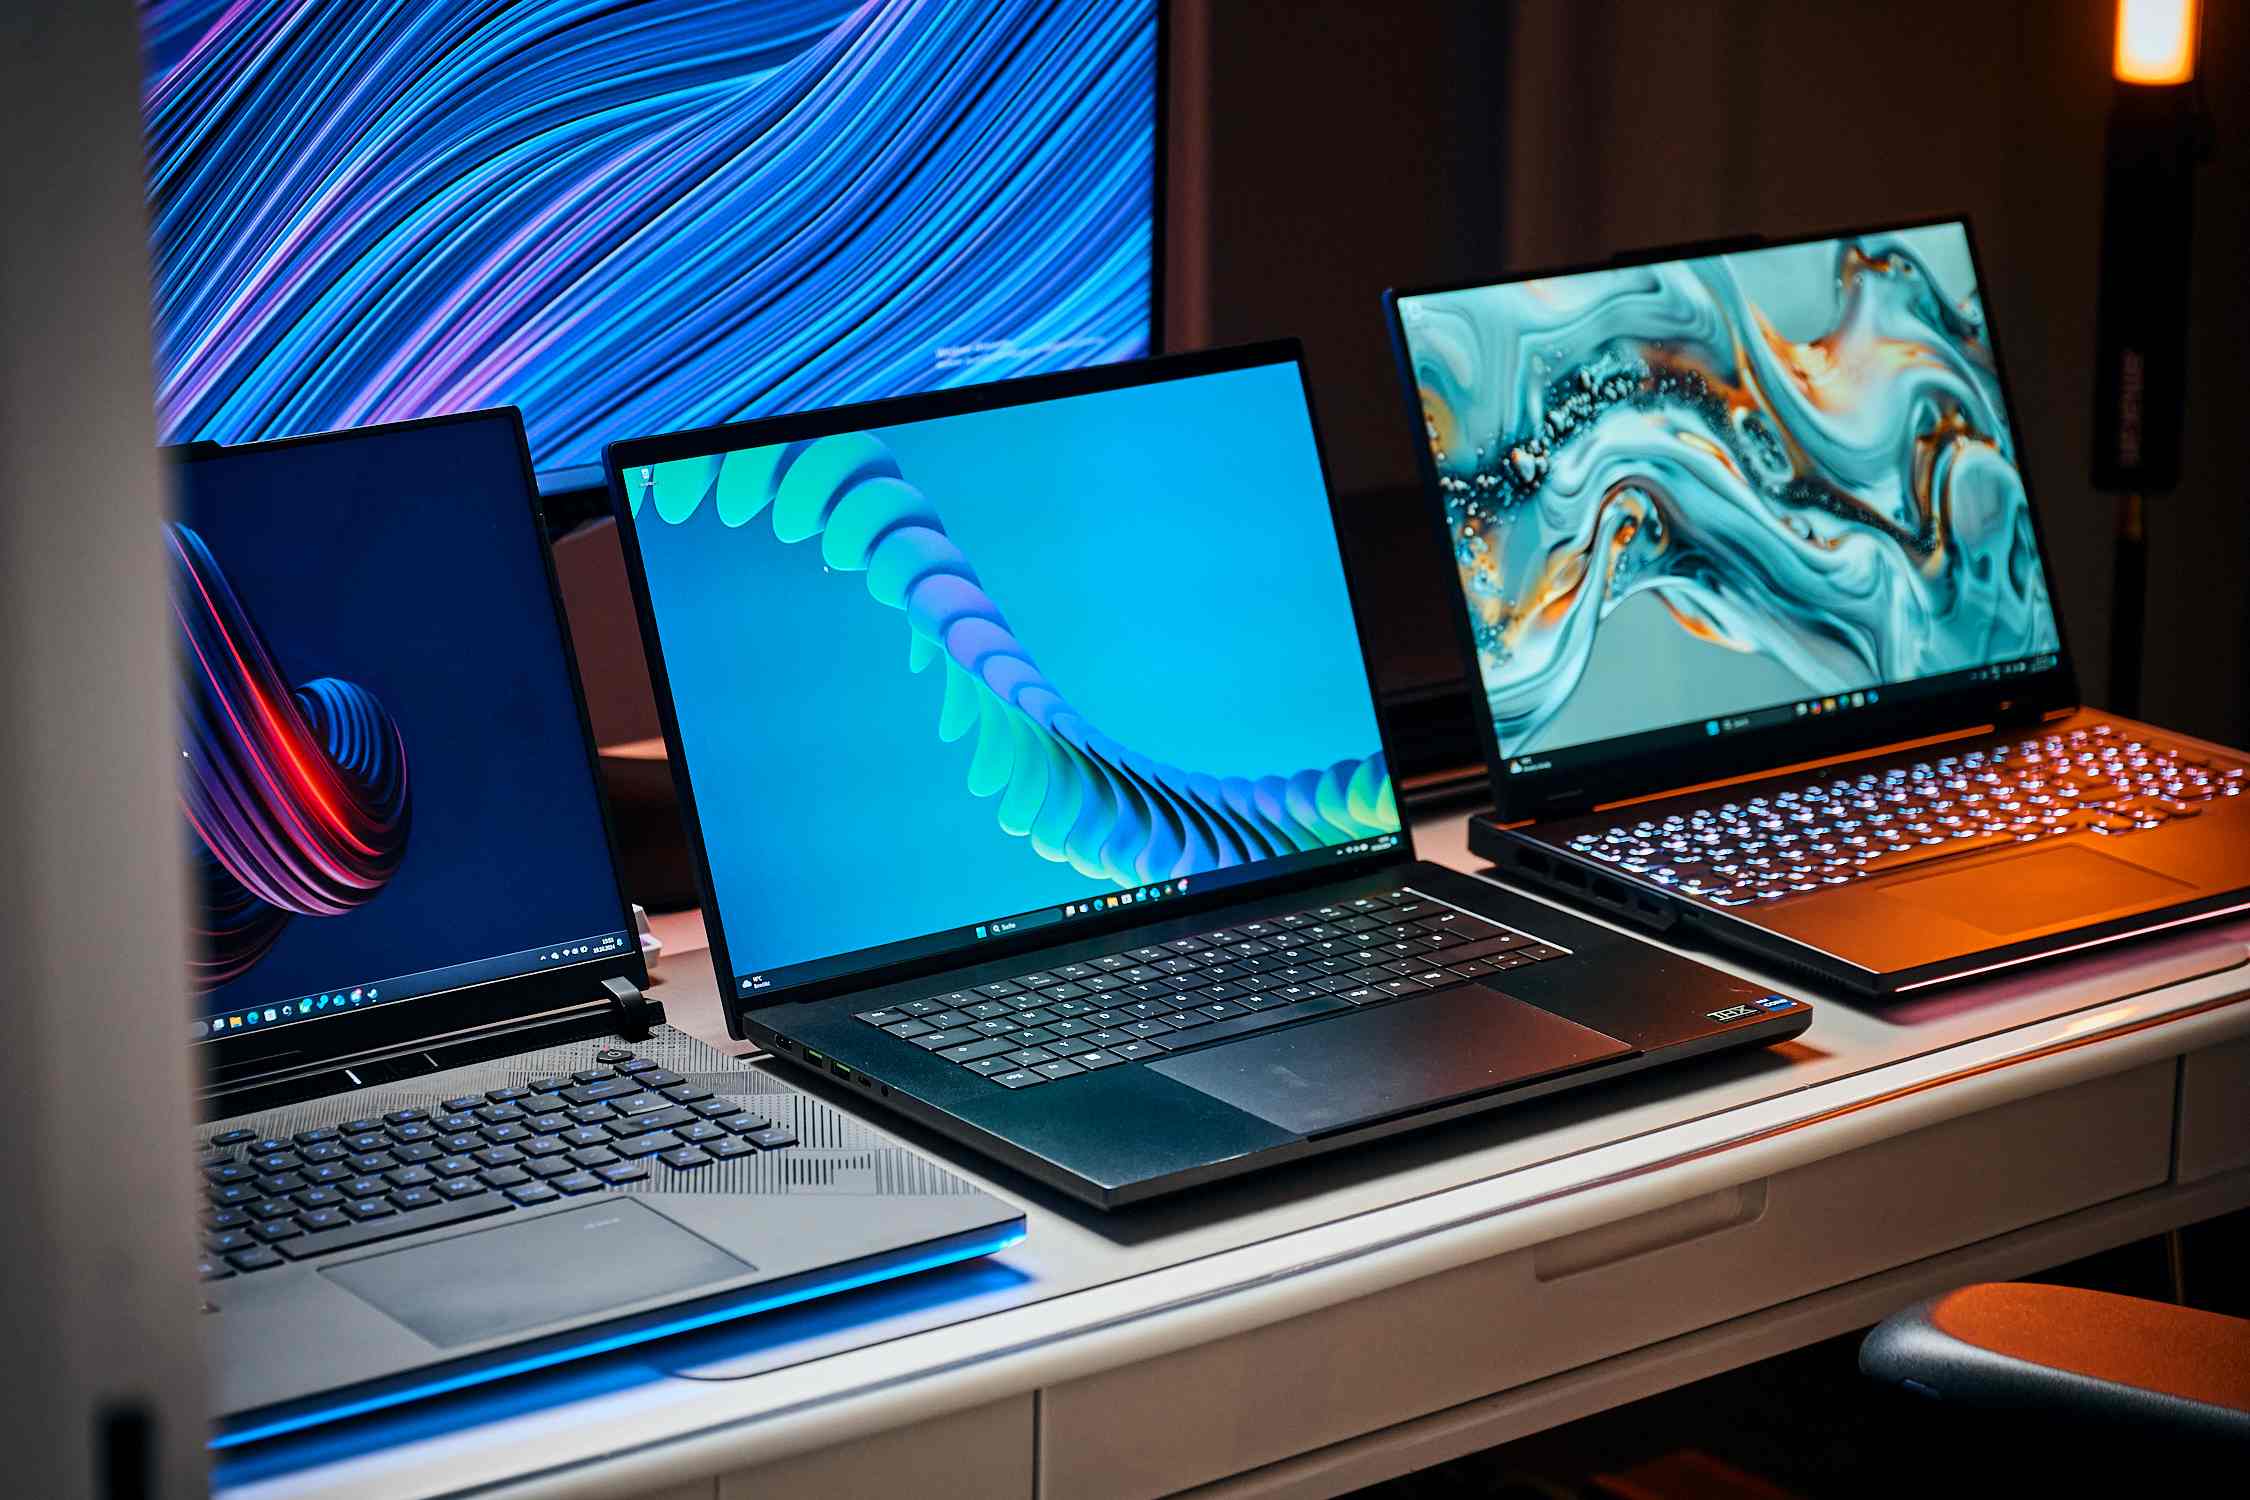
用钱能买到的最佳 16 英寸游戏笔记本电脑?我们有一些想法。(图片来源:Notebookcheck)

巨人之战2024 年 16 英寸游戏笔记本电脑终极对决

力量与时尚的完美结合(大部分)--高端游戏笔记本电脑终极对比。

强大的 CPU、Nvidia 最快的移动 GPU、最好的 MiniLED 或 OLED 屏幕,以及大量其他功能和特性,这些都是为了提供最佳的高端移动游戏体验。我们将对来自 Razer、Alienware、联想、华硕 ROG 和 XMG 的旗舰产品进行测试,看看它们能带来什么,以及是否值得令人瞠目的标价。
Sambit Saha, Alexander Wätzel, 👁 Alexander Wätzel (translated by DeepL / Ninh Duy) Published 🇺🇸 🇩🇪 ...
Gaming Laptop / Notebook

结论--结果可能会让你大吃一惊

这里没有错误的选择吗?
这里没有错误的选择吗?

说到整体性能,我们有一个明显的例外:Alienware X16。 Alienware X16.虽然它在平衡模式下能够做到相对安静,但却无法以更长的电池续航时间来支持较低的性能分数,而且考虑到显示屏的情况,它也是目前最难推荐的笔记本电脑之一。
对于那些追求各种尺寸的最快游戏笔记本电脑,同时又能忍受扎实但有些 "乏味 "的 IPS 显示屏的用户,XMG Neo 16 可以满足他们的需求。 XMG Neo 16是您的最佳选择。XMG Neo 16 拥有出色的制造质量、可选的水冷散热器和充足的调整潜力,是速度爱好者的不二之选。

... Legion 9有点喜忧参半。它的整体感觉和机箱质量都非常出色;我们喜欢它的键盘,它的美学设计令人印象深刻,显示屏让游戏看起来非常华丽。性能方面可好可坏。它的整体性能还是不错的,但话说回来,这是一款非常昂贵的笔记本电脑,而且鉴于其低端同类产品的速度几乎与之相当,你真的很想要那块 MiniLED 面板......我们当然可以理解。

Pro 7 Legion Pro 7是当今笔记本电脑的主力机型,几乎能胜任任何工作。它非常适合玩游戏,也擅长内容创作。和 Alienware 一样,联想也经常打折促销,所以你一定能买到物美价廉的笔记本电脑。

今天的每一位竞争者都有自己独特的个性。
今天的每一位竞争者都有自己独特的个性。

雷蛇刀锋 16可能是创作者的最佳选择,因为如果用于创收工作,其成本是合理的。它拥有出色的 OLED 显示屏、稳固的输入/输出接口、足够的性能(即使不是同类领先)、时尚的设计以及良好的噪音控制,使其成为工作和娱乐的最佳选择。
至于 ROG Scar Strix 16如果我们忽略它的外观,只关注性能、端口、显示屏和风扇噪音,它将是当今最好的笔记本电脑之一。但是,虽然它的机箱很坚固,但它给人的感觉并不像其他竞争者那样高级,而且你必须喜欢或能够接受它更 "激进 "的造型。

价格和供应情况

对于那些追求顶级配置的用户来说,他们需要支付顶级的价格,这一点不足为奇。Razer Blade 16售价高达 4199 美元,除了配备强大的酷睿 i9-14900HX 处理器、32 GB 内存和 2 TB 固态硬盘外,还配备了 RTX 4090。联想的Legion Pro 7售价略低,仅为 3604 美元,配备了功能相当强大的 RTX 4090、酷睿 i9-14900HX、32 GB 内存和较小的 1 TB SSD。

同样来自联想的Legion 9 在存储和内存方面加倍,配备了 2 TB SSD 和 64 GB 内存,售价高达令人瞠目的 4594 美元。XMG Neo 16 的价格约为 3800 美元,配备了 RTX 4090 和酷睿 i9-14900HX,以及 32 GB 内存和 1 TB SSD。最后,华硕 Strix Scar 16提供了强大的 RTX 4090 和 i9-14900HX 配置,以及 16 GB 内存和 2 TB 存储空间。

可能的替代品比较

Image
Model / Review
Price
Weight
Height
Display
1.
89.5% v7 (old)
Lenovo Legion Pro 7 16IRX9H
Intel Core i9-14900HX ⎘
NVIDIA GeForce RTX 4080 Laptop GPU ⎘
32 GB Memory, 1024 GB SSD
Amazon: $2,678.00
List Price: 2999 Euro
2.7 kg21.95 mm16.00"
2560x1600
189 PPI
IPS
2.
87.6% v7 (old)
Asus ROG Strix Scar 16 G634JZR
Intel Core i9-14900HX ⎘
NVIDIA GeForce RTX 4080 Laptop GPU ⎘
32 GB Memory, 2048 GB SSD
Amazon: $2,799.00
List Price: 3199 EUR
2.7 kg30.4 mm16.00"
2560x1600
189 PPI
Mini LED
3.
Asus ROG Strix Scar 16 G634JYR
Intel Core i9-14900HX ⎘
NVIDIA GeForce RTX 4090 Laptop GPU ⎘
32 GB Memory
Amazon: $3,636.00
List Price: 3499€
2.7 kg30.4 mm16.00"
2560x1600
189 PPI
IPS
4.
91.1% v7 (old)
Razer Blade 16 2024, RTX 4090
Intel Core i9-14900HX ⎘
NVIDIA GeForce RTX 4090 Laptop GPU ⎘
32 GB Memory, 2048 GB SSD
Amazon: $3,699.99
List Price: 4850 Euro
2.5 kg22 mm16.00"
2560x1600
189 PPI
OLED
5.
88.4% v7 (old)
Alienware x16 R2 P120F
Intel Core Ultra 9 185H ⎘
NVIDIA GeForce RTX 4080 Laptop GPU ⎘
32 GB Memory, 1024 GB SSD
Amazon: $2,789.00
List Price: 3200 USD
2.7 kg18.57 mm16.00"
2560x1600
189 PPI
IPS
6.
83.9%
Lenovo Legion 9 16IRX9, RTX 4090
Intel Core i9-14900HX ⎘
NVIDIA GeForce RTX 4090 Laptop GPU ⎘
64 GB Memory, 2048 GB SSD
Amazon: $4,299.00
List Price: 4899 Euro
2.5 kg22.7 mm16.00"
3200x2000
236 PPI
MiniLED
7.
Lenovo Legion Pro 7 16IRX9H, RTX 4090
Intel Core i9-14900HX ⎘
NVIDIA GeForce RTX 4090 Laptop GPU ⎘
32 GB Memory
Amazon: $2,848.12
List Price: 3600€
2.6 kg25.9 mm16.00"
2560x1600
189 PPI
IPS
8.
85.5%
SCHENKER XMG Neo 16 (Early 24)
Intel Core i9-14900HX ⎘
NVIDIA GeForce RTX 4090 Laptop GPU ⎘
32 GB Memory, 1024 GB SSD
Amazon:
1. $145.00
16.0" WQXGA 2560(RGB)×1600 ...
2. $155.00
Replacement Screen 16.0" for...
3. $143.00
16.0" for Schenker XMG Neo 1...
List Price: 3800 Euro
2.5 kg26.6 mm16.00"
2560x1600
189 PPI
IPS

想象一下,你手头有一大笔现金,想花这笔钱买一台游戏笔记本电脑。但不是普通的笔记本电脑,而是钱能买到的最好的笔记本电脑,而且要尽可能少地妥协!
那么,你就来对地方了;因为我们今天要处理的是 16 英寸游戏笔记本电脑中的精品,你现在几乎可以从所有制造商那里买到。我们谈论的不仅仅是纯粹的规格,而是每一台笔记本电脑都配备了各种功能、别致的小配件、绚丽的显示屏(至少在大多数情况下是这样),以及几乎所有你能要求的东西,如果你正在考虑花上 3000 美元以获得最佳的移动游戏体验的话。

在过去的几个月里,我们每天都会对这些产品进行至少几周的试用,虽然我们很可能不会告诉你哪一款是最好的,因为这始终是一个非常主观和个人的决定,但我们会让你知道我们喜欢什么,不喜欢什么,从而给你一些你应该注意的提示。

案例 - 外表很重要,还是真的很重要?

在了解旗舰级游戏机的内部构造之前,我们先来看看它们的外观。如果你花了那么多钱,你不仅要购买性能,还要投资时尚。

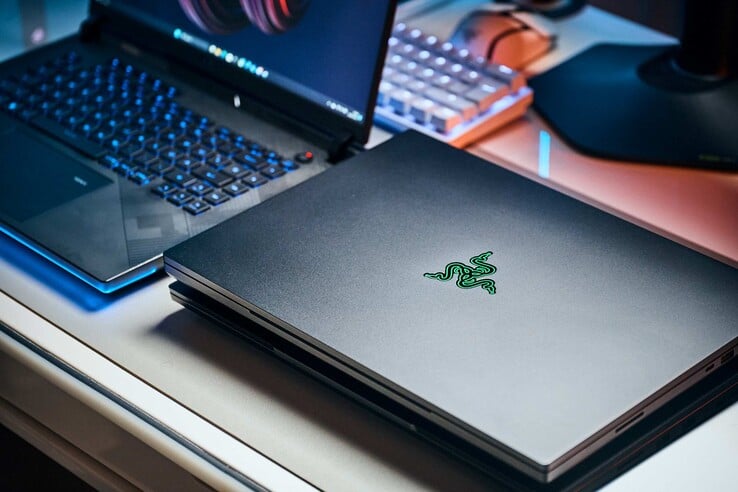
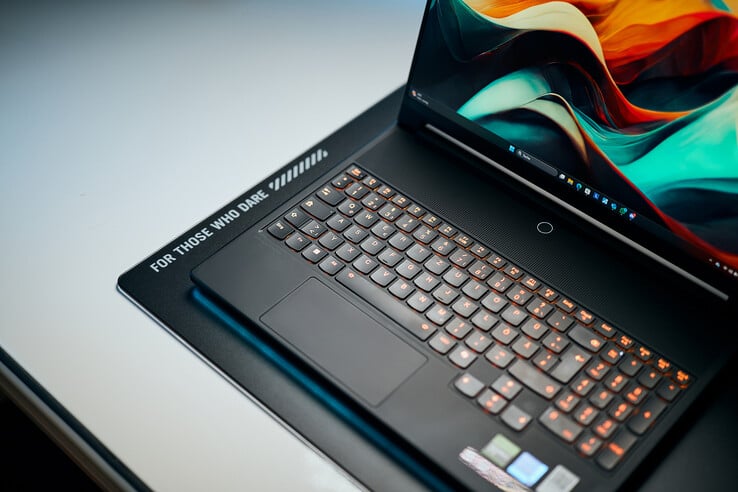
首先,我们要为 Razer 和Legion 9 点赞。Razer 不仅是拥有如此强劲性能的最小巧的 16 英寸笔记本电脑之一,而且可以说是最时尚的笔记本电脑,具有超级简洁和微妙的美感--如果你能忽略它那华而不实的绿色徽标的话。军团的设计也相当低调,尽管方式略有不同,但如果你愿意,也可以通过机箱周围的大量 RGB 灯光将它点亮,就像一棵圣诞树。在我们看来,它因其独特的碳纤维外观而赢得了额外的时尚加分,在投入如此巨资的情况下,您可能会欣赏到它的整体特殊外观。

在制造质量方面,Razer Blade 16 几乎没有任何可抱怨的地方。
Legion 9 无论是外观还是整体制造质量都非常出色。

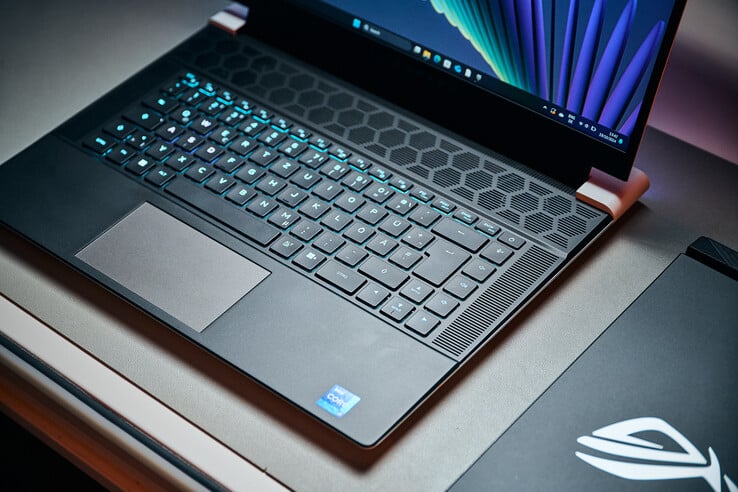
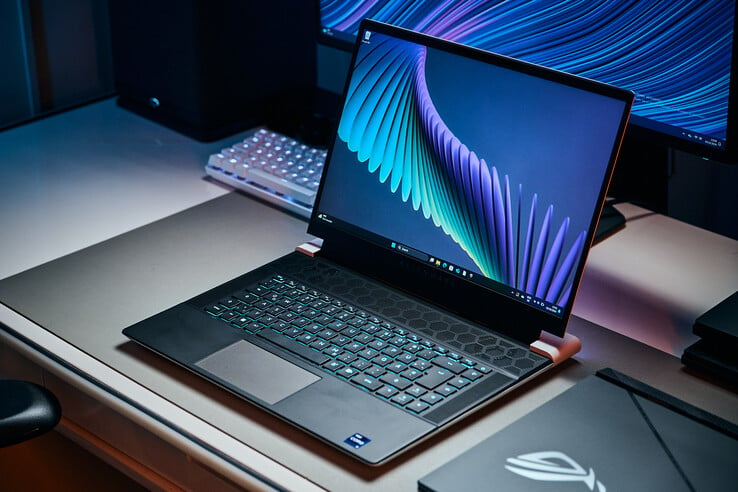
Alienware X16(亚马逊有售)走的也是类似的路子,不过它的机箱设计可能更加两极分化。就我们个人而言,我们很喜欢它,但对于某些人来说,它可能太过夸张,这也是可以理解的。虽然它是目前配备全功率高端图形处理器的最轻薄笔记本之一,但也是最大的笔记本之一,这一点在选购时一定要牢记。

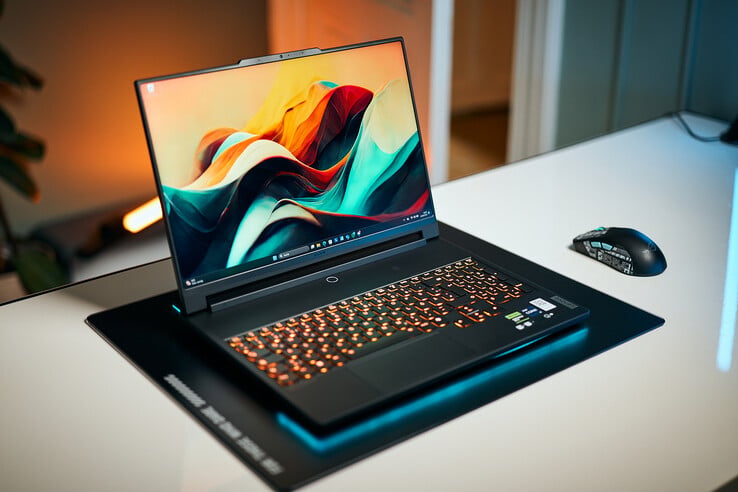
如果你喜欢低调,那么 XMG Neo 16 就是披着羊皮的狼。与其他几款产品相比,XMG Neo 16 看起来有些沉闷,但它设计简洁,采用优质材料,周围还有一些 RGB 部件,如果你想让全世界都知道你是一个真正的游戏玩家的话。Legion Pro 7 沿袭了相同的方向,但增加了一些视觉线索,暗示了它的预期用途。

Alienware X16 的设计可以说是众说纷纭。
Legion 的岩石美学忠于其本质。
Legion 的岩石美学忠于其本质。

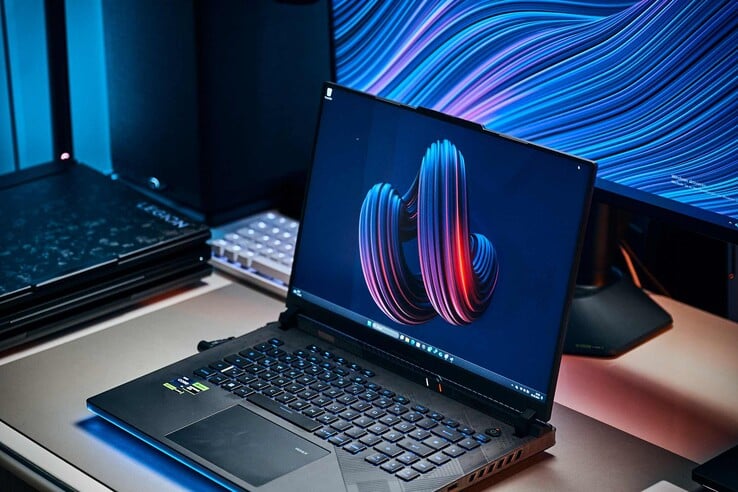
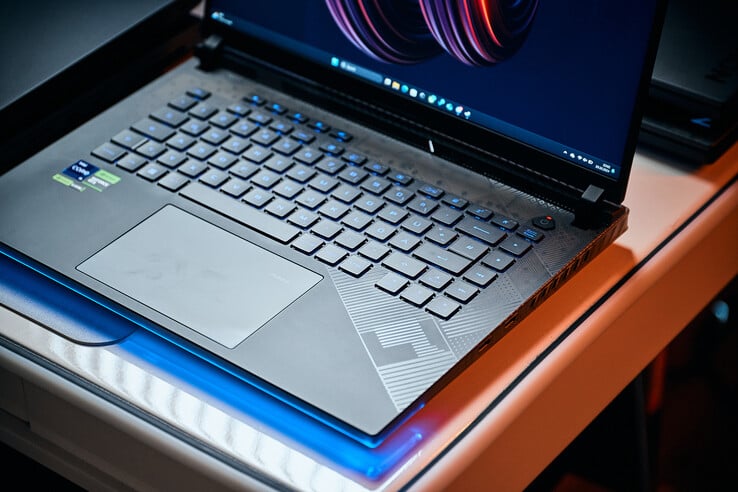
而 ROG Scar 则恰恰相反,它的设计让人联想到 "游戏笔记本电脑",但遗憾的是,在我们看来,这种设计并不讨喜。它只是有点过于夸张了,不过这归结于个人喜好。在材料选择和整体质感方面,它也是最弱的一款,采用塑料机身,尽管很坚固。

如果要给它们排个名次,Alienware X16 将紧随其后,Pro 7、Neo 16、Blade 16 和Legion 基本上共享第一名。
这并不意味着 X16 或 Pro 7 的做工很差,只是在我们看来,其他三款笔记本的做工更上一层楼。

ROG Strix Scar 16 毫不掩饰其游戏气息。

尺寸比较

363.5 mm 262.1 mm 21.95 mm 2.7 kg354 mm 264 mm 30.4 mm 2.7 kg364.74 mm 289.81 mm 18.57 mm 2.7 kg356.7 mm 253 mm 26.6 mm 2.5 kg357.7 mm 277.7 mm 22.7 mm 2.5 kg355 mm 244 mm 22 mm 2.5 kg297 mm 210 mm 1 mm 5.7 g

连接性--越多越好!

关于端口,我们应该没有太多可抱怨的,但正如生活中的大多数事情一样,细节决定成败。虽然我们非常喜欢Legion Pro 7 的整体选择和位置,但它的三个 USB-A 端口都是速度较慢的 3.2 Gen 1 端口,如果你经常使用高速存储设备,这可能会让你感到有点失望。

更高端的Legion 9 将一个 USB-A 端口换成了相同标准的 USB-C,并增加了一个全尺寸 SD 读卡器,尽管传输速率非常慢。不过,它将局域网连接提升到了 2.5 GbE,背面的两个 USB-C 端口都是完整的 Thunderbolt 4 端口。

XMG 的选择和布局与 Pro 7 相同,但也增加了一个 SD 读卡器,但传输速度也很一般。在这方面,Blade 的表现要好得多,它拥有最快的读卡器。虽然没有网络插孔,但所有三个 USB-A 端口都是速度更快的 3.2 Gen 2 端口,还有一个相同标准的 USB-C 端口和一个额外的 Thunderbolt 4 端口。

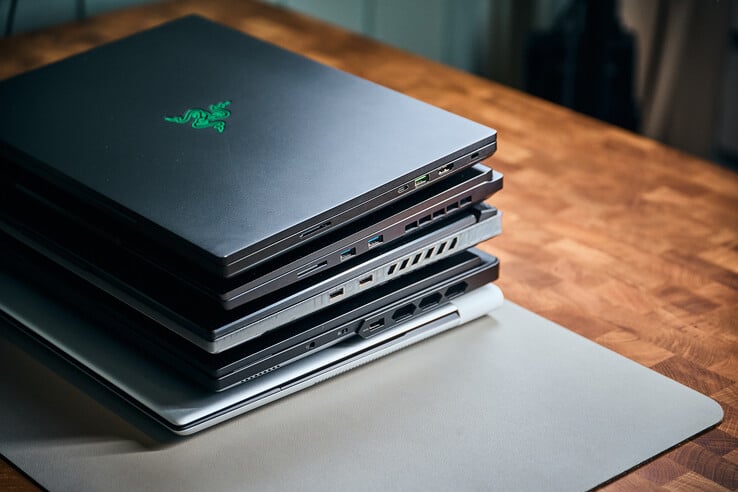
从上至下:Razer Blade 16(电源输入、2 x USB-A、雷电 4、音频插孔)、XMG Neo 16(USB-A、USB-C、音频插孔)、ROG Scar 16(电源、2.5 GbE、USB-C、雷电 4、音频插孔)、Legion Pro 7(USB-A、雷电 4)
XMG Neo 16(Oasis 连接器、Thunderbolt 4、HDMI 2.1、2.5 GbE、电源输入)、Legion Pro 7(1 GbE、USB-C、HDMI 2.1、2 x USB-A、电源输入)、Alienware X16(读卡器、1 个 Thunderbolt 4、1 x USB-C、HDMI 2.1、2 x USB-A、Mini-DP、电源输入)
Razer Blade 16(读卡器、USB-C、USB-A、HDMI 2.1)、XMG Neo 16(读卡器、2 x USB-A)、ROG Scar 16(2 x USB-A)、Legion Pro 7(音频插孔、摄像头锁定开关、USB-A)
联想Legion 9 - 右:相机锁定开关、USB-C 3.2 Gen.1、USB-A 3.2 Gen.1
联想Legion 9 - 左:音频插孔、读卡器
联想Legion 9 - 后部:2.5 Gbps RJ-45、USB-A 3.2 Gen.1、2x Thunderbolt 4 w/ DisplayPort 1.4 + Power Delivery 140 W、HDMI 2.1、Power-in

另一方面,"疤痕 "几乎沿用了 "刀锋 "的选择,但在其中一个 USB-A 端口上增加了 2.5 GbE 连接。它还提供了更均匀的布局,尽管你可能更喜欢 USB-A 和 C 端口各占一边。

Alienware X16 很特别,它的所有端口都在背面,这确实让一些设置看起来非常简洁,但却让一些常用端口变得遥不可及。
但我们没有理由抱怨,它也是唯一一款配备专用迷你显示端口的 16 英寸产品,两个 USB-C 端口都留给了外设。它的 SD 读卡器几乎可以与 Blade 16 相媲美,但遗憾的是,它只能读取较小且实用性较差的 micro SD 卡。

SD Card Reader
average JPG Copy Test (av. of 3 runs)
Razer Blade 16 2024, RTX 4090
Intel Core i9-14900HX
171 (169.48min - 194.55max) MB/s
Alienware x16 R2 P120F
Intel Core Ultra 9 185H (AV PRO microSD 128 GB V60)
168.9 MB/s
Average of class Gaming
  (19 - 202, n=89, last 2 years)
95.5 MB/s
SCHENKER XMG Neo 16 (Early 24)
Intel Core i9-14900HX (AV PRO microSD 128 GB V60)
76 MB/s
Lenovo Legion 9 16IRX9, RTX 4090
Intel Core i9-14900HX
73 (51.3min - 77.05max) MB/s
maximum AS SSD Seq Read Test (1GB)
Alienware x16 R2 P120F
Intel Core Ultra 9 185H (AV PRO microSD 128 GB V60)
258 MB/s
Razer Blade 16 2024, RTX 4090
Intel Core i9-14900HX
181.81 MB/s
Average of class Gaming
  (25.8 - 269, n=90, last 2 years)
119.3 MB/s
Lenovo Legion 9 16IRX9, RTX 4090
Intel Core i9-14900HX
88.2 MB/s
SCHENKER XMG Neo 16 (Early 24)
Intel Core i9-14900HX (AV PRO microSD 128 GB V60)
87 MB/s

维护

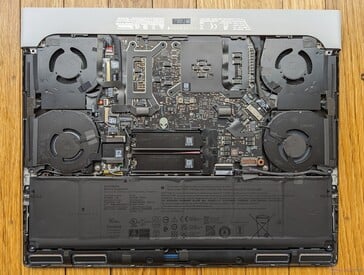
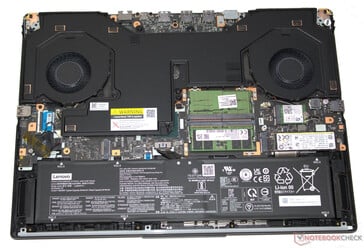
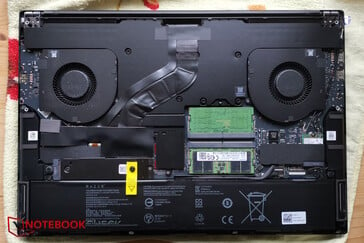
Alienware X16 还提供了最有限的维护、升级或维修选项。虽然在我们今天的对比组中,Alienware X16 的内存速度是最快的,但它也是焊接的,只留下 2 个 NVMe 插槽,至少在某种形式上可以升级。
其余所有选项也都可以使用两个 SO-DIMMS,尽管这在Legion 9 上更多是理论上的,因为翻转的主板需要进行大量额外的拆卸才能允许内存扩展。

罗杰 Strix Scar 16
罗杰 Strix Scar 16
Alienware X16
Alienware X16
XMG Neo 16
XMG Neo 16
联想Legion 9
联想Legion 9
联想Legion Pro 7
联想Legion Pro 7
Razer Blade 16
Razer Blade 16

输入设备--个人选择

虽然客观地说,Blade 16 的行程最少,而且这种 "扁平 "的感觉需要一些时间来适应,但在输入方面,这很可能取决于个人喜好。
另一方面,它的触控板是迄今为止最大的......如果你喜欢的话。

Legion 9 和 Alienware 的键盘牺牲了大量的触控板面积,但主观而言,它们绝对是我们的最爱。扎实的键程和清晰的压力点带来了非常令人满意的键入体验。Legion 在这方面尤为出色,因为键盘区域没有丝毫弯曲,手感非常精确。Neo 16 和Legion Pro 7 的键盘布局简洁,手感扎实,无论是工作还是娱乐,都远远超出了平均水平。

联想Legion 9 将键盘下移,以腾出更多空间散热,但留给大触控板的空间并不多。
Scar 16 拥有简洁的布局、稳固的行程和触感,以及宽敞的触控板,必要时还可显示数字键盘。
X16 的键入体验在我们的选择中名列前茅,它的触控板相当小,但支持 RGB。
在输入方面,XMG Neo 16 的表现非常出色。
触感极佳,行程不多,触控板巨大。
触感极佳,行程不多,触控板巨大。
Legion Pro 7 的输入体验非常出色,外观也非常实用。

Displays - OLEDs, MiniLEDs and plain ol' IPS nt

ROG Strix Scar 16 拥有出色的 Mini LED 显示屏,可同时满足游戏玩家和内容创作者的需求。

在显示屏方面,我们实际上遇到了今天高端竞争者之间最大的差异。
Legion 9 和 Scar 16 都配备了 MiniLED 显示屏。
Scar 的显示屏为内容创作者提供了一些额外的舒适,因为它可以通过可切换的局部调光和预校准色彩配置文件为您提供更多的控制,这对于某些调色工作流程来说非常方便,但遗憾的是Legion 上没有这些功能。

在 HDR 游戏和需要高亮度时,Legion 9 表现出色。
有了更多的色彩预设,Scar 16 可用于更高级的调色工作流程。
它也是唯一一款允许切换本地调光的竞争产品。

Blade 16(亚马逊有售)是我们目前唯一的 OLED 选择,具有与 Scar 相同的分辨率和刷新率。
如果你不关心 HDR,Legion Pro 7 也能提供很多。它的 IPS 面板仍然相当明亮,色域覆盖率高,对比度稳定,出厂校准非常准确。 至于 X16 和 XMG Neo 16,我们认为两者不相上下。虽然 XMG 拥有更高的亮度,但它只能覆盖 sRGB 色域。另一方面,Alienware 提供了更鲜艳的色彩,但对于如此高端的机器来说,其亮度值还勉强可以接受。

与 2023 版本相反,Legion Pro 7 采用了升级版面板,色彩空间覆盖率更高。
Alienware X16 色彩绚丽,但亮度几乎无法接受。
无与伦比的响应时间、令人惊叹的对比度和绚丽的色彩。Blade 16 配备 240 Hz OLED。
Lenovo Legion Pro 7 16IRX9H
BOE CQ NE16QDM-NZB, IPS, 2560x1600, 16", 240 Hz
Asus ROG Strix Scar 16 G634JZR
BOE NE160QDM-NM7, Mini LED, 2560x1600, 16", 240 Hz
Razer Blade 16 2024, RTX 4090
Samsung SDC41AB (ATNA60DL03-0), OLED, 2560x1600, 16", 240 Hz
Alienware x16 R2 P120F
BOE B160QAN, IPS, 2560x1600, 16", 240 Hz
Lenovo Legion 9 16IRX9, RTX 4090
CSOT T3 MNG007ZA2-2, MiniLED, 3200x2000, 16", 165 Hz
SCHENKER XMG Neo 16 (Early 24)
BOE NE160QDM-NZA, IPS, 2560x1600, 16", 240 Hz
Display
Display P3 Coverage
98.5
99.8
99.1
98.3
95.3
70.2
sRGB Coverage
99.9
100
99.9
100
99.9
98
AdobeRGB 1998 Coverage
86.7
90.8
95.6
88.8
86.6
70.6
Response Times
Response Time Grey 50% / Grey 80% *
12.6 ?(6, 6.6)
5 ?(2, 3)
0.24 ?(0.15, 0.09)
3.9 ?(1.7, 2.2)
12.6 ?(6.6, 6)
11.2 ?(5.2, 6)
Response Time Black / White *
5.8 ?(2.1, 3.7)
10.4 ?(3, 7.4)
0.4 ?(0.2, 0.2)
7.8 ?(3.9, 3.7)
10 ?(5.2, 4.8)
5.1 ?(1.6, 3.5)
PWM Frequency
2040 ?(10)
960
5430
Screen
Brightness middle
487
490
418
348.4
631
530
Brightness
460
487
420
340
664
497
Brightness Distribution
88
94
98
90
91
85
Black Level *
0.42
0.4
0.02
0.33
0.03
0.53
Contrast
1160
1225
20900
1056
21033
1000
Colorchecker dE 2000 *
1.12
1.08
1.07
2.68
2.68
3.21
Colorchecker dE 2000 max. *
2.26
2.38
4.04
4.14
6.41
5.8
Colorchecker dE 2000 calibrated *
0.54
0.9
1.07
0.42
2.68
1.44
Greyscale dE 2000 *
1.4
1.1
1.12
3.4
2.71
4.2
Gamma
2.242 98%
2.13 103%
2.29 96%
2.41 91%
2.27 97%
2.226 99%
CCT
6809 95%
6724 97%
6417 101%
6083 107%
6135 106%
6448 101%
Total Average (Program / Settings)

* ... smaller is better

性能 - 令人印象深刻,但有一点除外

处理器

在中央处理器方面,由于我们的大多数竞争对手都押宝在相同的芯片上,因此情况会特别有趣:英特尔的高端旗舰产品 酷睿 i9-14900HX.
在我们的 CPU 评比中,XMG Neo 16 稳坐头把交椅,领先优势相当明显,因为我们谈论的主要是同一款 CPU。Legion Pro 7 与 ROG Scar 16 相差无几,而Legion 9 由于单核性能不佳,甚至落后于 Razer 的 Blade 16。

Legion 的酷睿 i9-14900HX 在 Cinebench 中大显身手。

当然,Alienware 的机会不大,因为它使用的是内核更少、功耗更低的 Meteor Lake CPU。

这在如今更多游戏依赖 GPU 的世界里并不意味着什么,但它仍然值得关注,尤其是如果你想在速度更快的游戏中获得更高的帧数,而这些游戏需要更纯粹的 CPU 处理能力,或者如果你打算将闪亮的新笔记本用于某些需要更快 CPU 的工作流程。

Cinebench R15 Multi Loop

02655307951060132515901855212023852650291531803445371039754240450547705035Tooltip
Lenovo Legion Pro 7 16IRX9H Intel Core i9-14900HX: Ø4558 (4464.78-4691.53)
Asus ROG Strix Scar 16 G634JZR Intel Core i9-14900HX: Ø4439 (4357.3-4809.43)
Razer Blade 16 2024, RTX 4090 Intel Core i9-14900HX: Ø4396 (4349.72-4455.83)
Alienware x16 R2 P120F Intel Core Ultra 9 185H: Ø2753 (2708.56-2857.35)
Lenovo Legion 9 16IRX9, RTX 4090 Intel Core i9-14900HX: Ø4648 (4505.52-4878.64)
SCHENKER XMG Neo 16 (Early 24) Intel Core i9-14900HX: Ø5001 (4861.45-5267.14)
CPU Performance Rating: Percent
Cinebench R23: Multi Core | Single Core
Cinebench R20: CPU (Multi Core) | CPU (Single Core)
Cinebench R15: CPU Multi 64Bit | CPU Single 64Bit
Blender: v2.79 BMW27 CPU
7-Zip 18.03: 7z b 4 | 7z b 4 -mmt1
Geekbench 6.3: Multi-Core | Single-Core
Geekbench 5.5: Multi-Core | Single-Core
HWBOT x265 Benchmark v2.2: 4k Preset
LibreOffice : 20 Documents To PDF
R Benchmark 2.5: Overall mean
CPU Performance Rating
SCHENKER XMG Neo 16 (Early 24)
Intel Core i9-14900HX
88.1 pt
Lenovo Legion Pro 7 16IRX9H
Intel Core i9-14900HX
83 pt
Asus ROG Strix Scar 16 G634JZR
Intel Core i9-14900HX
81.1 pt
Average Intel Core i9-14900HX
 
77.4 pt
Razer Blade 16 2024, RTX 4090
Intel Core i9-14900HX
77.3 pt
Lenovo Legion 9 16IRX9, RTX 4090
Intel Core i9-14900HX
71.1 pt
Average of class Gaming
 
61.8 pt
Alienware x16 R2 P120F
Intel Core Ultra 9 185H
51.9 pt
Cinebench R23 / Multi Core
SCHENKER XMG Neo 16 (Early 24)
Intel Core i9-14900HX
36249 Points
Lenovo Legion Pro 7 16IRX9H
Intel Core i9-14900HX
32631 Points
Lenovo Legion 9 16IRX9, RTX 4090
Intel Core i9-14900HX
31889 Points
Asus ROG Strix Scar 16 G634JZR
Intel Core i9-14900HX
30411 Points
Average Intel Core i9-14900HX
  (17078 - 36249, n=34)
29130 Points
Razer Blade 16 2024, RTX 4090
Intel Core i9-14900HX
28867 Points
Average of class Gaming
  (5668 - 36249, n=194, last 2 years)
21642 Points
Alienware x16 R2 P120F
Intel Core Ultra 9 185H
18338 (17139.2min - 18337.8max) Points
Cinebench R23 / Single Core
SCHENKER XMG Neo 16 (Early 24)
Intel Core i9-14900HX
2209 Points
Lenovo Legion Pro 7 16IRX9H
Intel Core i9-14900HX
2208 Points
Asus ROG Strix Scar 16 G634JZR
Intel Core i9-14900HX
2193 Points
Average Intel Core i9-14900HX
  (1720 - 2245, n=34)
2157 Points
Razer Blade 16 2024, RTX 4090
Intel Core i9-14900HX
2117 Points
Average of class Gaming
  (1088 - 2235, n=192, last 2 years)
1878 Points
Lenovo Legion 9 16IRX9, RTX 4090
Intel Core i9-14900HX
1720 Points
Alienware x16 R2 P120F
Intel Core Ultra 9 185H
1620 Points
Cinebench R20 / CPU (Multi Core)
SCHENKER XMG Neo 16 (Early 24)
Intel Core i9-14900HX
13824 Points
Lenovo Legion Pro 7 16IRX9H
Intel Core i9-14900HX
12419 Points
Lenovo Legion 9 16IRX9, RTX 4090
Intel Core i9-14900HX
11960 Points
Asus ROG Strix Scar 16 G634JZR
Intel Core i9-14900HX
11604 Points
Average Intel Core i9-14900HX
  (6579 - 13832, n=34)
11084 Points
Razer Blade 16 2024, RTX 4090
Intel Core i9-14900HX
10968 Points
Average of class Gaming
  (2179 - 13832, n=192, last 2 years)
8236 Points
Alienware x16 R2 P120F
Intel Core Ultra 9 185H
7081 Points
Cinebench R20 / CPU (Single Core)
SCHENKER XMG Neo 16 (Early 24)
Intel Core i9-14900HX
844 Points
Asus ROG Strix Scar 16 G634JZR
Intel Core i9-14900HX
839 Points
Lenovo Legion Pro 7 16IRX9H
Intel Core i9-14900HX
832 Points
Average Intel Core i9-14900HX
  (657 - 859, n=34)
826 Points
Razer Blade 16 2024, RTX 4090
Intel Core i9-14900HX
810 Points
Average of class Gaming
  (427 - 856, n=192, last 2 years)
722 Points
Lenovo Legion 9 16IRX9, RTX 4090
Intel Core i9-14900HX
657 Points
Alienware x16 R2 P120F
Intel Core Ultra 9 185H
622 Points
Cinebench R15 / CPU Multi 64Bit
SCHENKER XMG Neo 16 (Early 24)
Intel Core i9-14900HX
5267 Points
Lenovo Legion 9 16IRX9, RTX 4090
Intel Core i9-14900HX
4879 (4505.52min - 4878.64max) Points
Asus ROG Strix Scar 16 G634JZR
Intel Core i9-14900HX
4809 (4357.3min - 4809.43max) Points
Lenovo Legion Pro 7 16IRX9H
Intel Core i9-14900HX
4691 Points
Average Intel Core i9-14900HX
  (3263 - 5589, n=35)
4462 Points
Razer Blade 16 2024, RTX 4090
Intel Core i9-14900HX
4456 (4349.72min - 4455.83max) Points
Average of class Gaming
  (905 - 5663, n=199, last 2 years)
3392 Points
Alienware x16 R2 P120F
Intel Core Ultra 9 185H
2857 (2708.56min - 2857.35max) Points
Cinebench R15 / CPU Single 64Bit
Asus ROG Strix Scar 16 G634JZR
Intel Core i9-14900HX
316 Points
Lenovo Legion Pro 7 16IRX9H
Intel Core i9-14900HX
314 Points
Razer Blade 16 2024, RTX 4090
Intel Core i9-14900HX
311 Points
SCHENKER XMG Neo 16 (Early 24)
Intel Core i9-14900HX
310 Points
Average Intel Core i9-14900HX
  (247 - 323, n=34)
306 Points
Average of class Gaming
  (176.6 - 318, n=196, last 2 years)
276 Points
Lenovo Legion 9 16IRX9, RTX 4090
Intel Core i9-14900HX
247 Points
Alienware x16 R2 P120F
Intel Core Ultra 9 185H
238 Points
Blender / v2.79 BMW27 CPU
Alienware x16 R2 P120F
Intel Core Ultra 9 185H
178 Seconds *
Average of class Gaming
  (87 - 555, n=187, last 2 years)
172.1 Seconds *
Average Intel Core i9-14900HX
  (91 - 206, n=34)
119.5 Seconds *
Razer Blade 16 2024, RTX 4090
Intel Core i9-14900HX
113 Seconds *
Asus ROG Strix Scar 16 G634JZR
Intel Core i9-14900HX
110 Seconds *
Lenovo Legion 9 16IRX9, RTX 4090
Intel Core i9-14900HX
106 Seconds *
Lenovo Legion Pro 7 16IRX9H
Intel Core i9-14900HX
104 Seconds *
SCHENKER XMG Neo 16 (Early 24)
Intel Core i9-14900HX
95 Seconds *
7-Zip 18.03 / 7z b 4
SCHENKER XMG Neo 16 (Early 24)
Intel Core i9-14900HX
135229 MIPS
Lenovo Legion 9 16IRX9, RTX 4090
Intel Core i9-14900HX
125676 MIPS
Lenovo Legion Pro 7 16IRX9H
Intel Core i9-14900HX
124444 MIPS
Asus ROG Strix Scar 16 G634JZR
Intel Core i9-14900HX
121465 MIPS
Razer Blade 16 2024, RTX 4090
Intel Core i9-14900HX
115695 MIPS
Average Intel Core i9-14900HX
  (66769 - 136645, n=34)
112494 MIPS
Average of class Gaming
  (23795 - 140932, n=191, last 2 years)
84613 MIPS
Alienware x16 R2 P120F
Intel Core Ultra 9 185H
67227 MIPS
7-Zip 18.03 / 7z b 4 -mmt1
Asus ROG Strix Scar 16 G634JZR
Intel Core i9-14900HX
7442 MIPS
SCHENKER XMG Neo 16 (Early 24)
Intel Core i9-14900HX
7406 MIPS
Lenovo Legion Pro 7 16IRX9H
Intel Core i9-14900HX
7361 MIPS
Razer Blade 16 2024, RTX 4090
Intel Core i9-14900HX
7018 MIPS
Average Intel Core i9-14900HX
  (5452 - 7545, n=34)
7017 MIPS
Average of class Gaming
  (4168 - 7581, n=191, last 2 years)
6280 MIPS
Lenovo Legion 9 16IRX9, RTX 4090
Intel Core i9-14900HX
5452 MIPS
Alienware x16 R2 P120F
Intel Core Ultra 9 185H
4502 MIPS
Geekbench 6.3 / Multi-Core
SCHENKER XMG Neo 16 (Early 24)
Intel Core i9-14900HX
19451 Points
Asus ROG Strix Scar 16 G634JZR
Intel Core i9-14900HX
18590 Points
Lenovo Legion Pro 7 16IRX9H
Intel Core i9-14900HX
18289 Points
Razer Blade 16 2024, RTX 4090
Intel Core i9-14900HX
17559 Points
Lenovo Legion 9 16IRX9, RTX 4090
Intel Core i9-14900HX
17499 Points
Average Intel Core i9-14900HX
  (13158 - 19665, n=34)
17369 Points
Average of class Gaming
  (5340 - 19665, n=110, last 2 years)
14171 Points
Alienware x16 R2 P120F
Intel Core Ultra 9 185H
12825 Points
Geekbench 6.3 / Single-Core
SCHENKER XMG Neo 16 (Early 24)
Intel Core i9-14900HX
3129 Points
Lenovo Legion Pro 7 16IRX9H
Intel Core i9-14900HX
3036 Points
Asus ROG Strix Scar 16 G634JZR
Intel Core i9-14900HX
3025 Points
Average Intel Core i9-14900HX
  (2419 - 3129, n=34)
2973 Points
Razer Blade 16 2024, RTX 4090
Intel Core i9-14900HX
2964 Points
Average of class Gaming
  (1490 - 3129, n=110, last 2 years)
2641 Points
Lenovo Legion 9 16IRX9, RTX 4090
Intel Core i9-14900HX
2419 Points
Alienware x16 R2 P120F
Intel Core Ultra 9 185H
2199 Points
Geekbench 5.5 / Multi-Core
SCHENKER XMG Neo 16 (Early 24)
Intel Core i9-14900HX
23086 Points
Lenovo Legion 9 16IRX9, RTX 4090
Intel Core i9-14900HX
21642 Points
Asus ROG Strix Scar 16 G634JZR
Intel Core i9-14900HX
21335 Points
Lenovo Legion Pro 7 16IRX9H
Intel Core i9-14900HX
20887 Points
Average Intel Core i9-14900HX
  (8618 - 23194, n=34)
19540 Points
Razer Blade 16 2024, RTX 4090
Intel Core i9-14900HX
19372 Points
Average of class Gaming
  (4557 - 23194, n=192, last 2 years)
14892 Points
Alienware x16 R2 P120F
Intel Core Ultra 9 185H
12759 Points
Geekbench 5.5 / Single-Core
Asus ROG Strix Scar 16 G634JZR
Intel Core i9-14900HX
2210 Points
SCHENKER XMG Neo 16 (Early 24)
Intel Core i9-14900HX
2195 Points
Razer Blade 16 2024, RTX 4090
Intel Core i9-14900HX
2131 Points
Lenovo Legion Pro 7 16IRX9H
Intel Core i9-14900HX
2114 Points
Average Intel Core i9-14900HX
  (1669 - 2210, n=34)
2092 Points
Average of class Gaming
  (986 - 2210, n=192, last 2 years)
1882 Points
Lenovo Legion 9 16IRX9, RTX 4090
Intel Core i9-14900HX
1729 Points
Alienware x16 R2 P120F
Intel Core Ultra 9 185H
1700 Points
HWBOT x265 Benchmark v2.2 / 4k Preset
SCHENKER XMG Neo 16 (Early 24)
Intel Core i9-14900HX
35.3 fps
Lenovo Legion Pro 7 16IRX9H
Intel Core i9-14900HX
33.4 fps
Asus ROG Strix Scar 16 G634JZR
Intel Core i9-14900HX
32 fps
Lenovo Legion 9 16IRX9, RTX 4090
Intel Core i9-14900HX
30.7 fps
Razer Blade 16 2024, RTX 4090
Intel Core i9-14900HX
30.1 fps
Average Intel Core i9-14900HX
  (16.8 - 38.9, n=34)
29.7 fps
Average of class Gaming
  (6.72 - 38.9, n=191, last 2 years)
23.3 fps
Alienware x16 R2 P120F
Intel Core Ultra 9 185H
20.7 fps
LibreOffice / 20 Documents To PDF
Lenovo Legion 9 16IRX9, RTX 4090
Intel Core i9-14900HX
53.6 s *
Asus ROG Strix Scar 16 G634JZR
Intel Core i9-14900HX
47.9 s *
Average of class Gaming
  (31.4 - 96.6, n=188, last 2 years)
47.6 s *
Razer Blade 16 2024, RTX 4090
Intel Core i9-14900HX
47.5 s *
Alienware x16 R2 P120F
Intel Core Ultra 9 185H
45.9 s *
Average Intel Core i9-14900HX
  (31.4 - 85.1, n=34)
43.4 s *
Lenovo Legion Pro 7 16IRX9H
Intel Core i9-14900HX
35.5 s *
SCHENKER XMG Neo 16 (Early 24)
Intel Core i9-14900HX
32.9 s *
R Benchmark 2.5 / Overall mean
Alienware x16 R2 P120F
Intel Core Ultra 9 185H
0.503 sec *
Lenovo Legion 9 16IRX9, RTX 4090
Intel Core i9-14900HX
0.4859 sec *
Average of class Gaming
  (0.3609 - 0.759, n=192, last 2 years)
0.4401 sec *
Lenovo Legion Pro 7 16IRX9H
Intel Core i9-14900HX
0.3851 sec *
Average Intel Core i9-14900HX
  (0.3604 - 0.4859, n=34)
0.3845 sec *
Razer Blade 16 2024, RTX 4090
Intel Core i9-14900HX
0.3789 sec *
Asus ROG Strix Scar 16 G634JZR
Intel Core i9-14900HX
0.3699 sec *
SCHENKER XMG Neo 16 (Early 24)
Intel Core i9-14900HX
0.3658 sec *

* ... smaller is better

系统性能

系统性能显示,所有竞争者的性能都比较接近。 40804090Legion Pro 7 和 Strix Scar 16 的 4080 和 4090 版本,我们可以看到英伟达的移动旗舰最终能带来多大的差异。

从主观上看,所有笔记本电脑的速度都足以满足我们几乎所有的需求,我们还尝试用所有笔记本电脑拍摄视频,从性能角度看,所有笔记本电脑都给我们带来了非常愉快的体验。在移动设备中拥有如此强大的计算能力,如果你也想完成工作,那么每台笔记本都是不错的工作站。

PCMark 10 / Score
SCHENKER XMG Neo 16 (Early 24)
NVIDIA GeForce RTX 4090 Laptop GPU, i9-14900HX, Samsung 990 Pro 1 TB
9017 Points
Lenovo Legion Pro 7 16IRX9H
NVIDIA GeForce RTX 4080 Laptop GPU, i9-14900HX, SK Hynix HFS001TEJ9X115N
8923 Points
Asus ROG Strix Scar 16 G634JYR
NVIDIA GeForce RTX 4090 Laptop GPU, i9-14900HX
8795 Points
Average Intel Core i9-14900HX, NVIDIA GeForce RTX 4080 Laptop GPU
  (7703 - 9223, n=6)
8687 Points
Lenovo Legion Pro 7 16IRX9H, RTX 4090
NVIDIA GeForce RTX 4090 Laptop GPU, i9-14900HX
8486 Points
Razer Blade 16 2024, RTX 4090
NVIDIA GeForce RTX 4090 Laptop GPU, i9-14900HX, Samsung PM9A1 MZVL22T0HBLB
8401 Points
Lenovo Legion 9 16IRX9, RTX 4090
NVIDIA GeForce RTX 4090 Laptop GPU, i9-14900HX, Micron 3400 2TB MTFDKBA2T0TFH
8239 Points
Average of class Gaming
  (5776 - 9852, n=169, last 2 years)
7771 Points
Asus ROG Strix Scar 16 G634JZR
NVIDIA GeForce RTX 4080 Laptop GPU, i9-14900HX, SK hynix PC801 HFS002TEJ9X101N
7703 Points
Alienware x16 R2 P120F
NVIDIA GeForce RTX 4080 Laptop GPU, Ultra 9 185H, WDC PC SN810 1TB
7251 Points
PCMark 10 / Essentials
Lenovo Legion Pro 7 16IRX9H
NVIDIA GeForce RTX 4080 Laptop GPU, i9-14900HX, SK Hynix HFS001TEJ9X115N
11706 Points
Asus ROG Strix Scar 16 G634JZR
NVIDIA GeForce RTX 4080 Laptop GPU, i9-14900HX, SK hynix PC801 HFS002TEJ9X101N
11617 Points
Average Intel Core i9-14900HX, NVIDIA GeForce RTX 4080 Laptop GPU
  (11255 - 11825, n=6)
11523 Points
Asus ROG Strix Scar 16 G634JYR
NVIDIA GeForce RTX 4090 Laptop GPU, i9-14900HX
11126 Points
SCHENKER XMG Neo 16 (Early 24)
NVIDIA GeForce RTX 4090 Laptop GPU, i9-14900HX, Samsung 990 Pro 1 TB
11065 Points
Lenovo Legion 9 16IRX9, RTX 4090
NVIDIA GeForce RTX 4090 Laptop GPU, i9-14900HX, Micron 3400 2TB MTFDKBA2T0TFH
11007 Points
Razer Blade 16 2024, RTX 4090
NVIDIA GeForce RTX 4090 Laptop GPU, i9-14900HX, Samsung PM9A1 MZVL22T0HBLB
10915 Points
Lenovo Legion Pro 7 16IRX9H, RTX 4090
NVIDIA GeForce RTX 4090 Laptop GPU, i9-14900HX
10911 Points
Average of class Gaming
  (9057 - 12334, n=168, last 2 years)
10833 Points
Alienware x16 R2 P120F
NVIDIA GeForce RTX 4080 Laptop GPU, Ultra 9 185H, WDC PC SN810 1TB
10036 Points
PCMark 10 / Productivity
SCHENKER XMG Neo 16 (Early 24)
NVIDIA GeForce RTX 4090 Laptop GPU, i9-14900HX, Samsung 990 Pro 1 TB
11681 Points
Lenovo Legion Pro 7 16IRX9H
NVIDIA GeForce RTX 4080 Laptop GPU, i9-14900HX, SK Hynix HFS001TEJ9X115N
11384 Points
Razer Blade 16 2024, RTX 4090
NVIDIA GeForce RTX 4090 Laptop GPU, i9-14900HX, Samsung PM9A1 MZVL22T0HBLB
11150 Points
Asus ROG Strix Scar 16 G634JYR
NVIDIA GeForce RTX 4090 Laptop GPU, i9-14900HX
10635 Points
Average Intel Core i9-14900HX, NVIDIA GeForce RTX 4080 Laptop GPU
  (6662 - 11410, n=6)
10243 Points
Lenovo Legion 9 16IRX9, RTX 4090
NVIDIA GeForce RTX 4090 Laptop GPU, i9-14900HX, Micron 3400 2TB MTFDKBA2T0TFH
10202 Points
Lenovo Legion Pro 7 16IRX9H, RTX 4090
NVIDIA GeForce RTX 4090 Laptop GPU, i9-14900HX
10066 Points
Average of class Gaming
  (6662 - 14612, n=168, last 2 years)
9878 Points
Alienware x16 R2 P120F
NVIDIA GeForce RTX 4080 Laptop GPU, Ultra 9 185H, WDC PC SN810 1TB
7934 Points
Asus ROG Strix Scar 16 G634JZR
NVIDIA GeForce RTX 4080 Laptop GPU, i9-14900HX, SK hynix PC801 HFS002TEJ9X101N
6662 Points
PCMark 10 / Digital Content Creation
Asus ROG Strix Scar 16 G634JZR
NVIDIA GeForce RTX 4080 Laptop GPU, i9-14900HX, SK hynix PC801 HFS002TEJ9X101N
16027 Points
Asus ROG Strix Scar 16 G634JYR
NVIDIA GeForce RTX 4090 Laptop GPU, i9-14900HX
15604 Points
SCHENKER XMG Neo 16 (Early 24)
NVIDIA GeForce RTX 4090 Laptop GPU, i9-14900HX, Samsung 990 Pro 1 TB
15394 Points
Average Intel Core i9-14900HX, NVIDIA GeForce RTX 4080 Laptop GPU
  (14211 - 16246, n=6)
15275 Points
Lenovo Legion Pro 7 16IRX9H, RTX 4090
NVIDIA GeForce RTX 4090 Laptop GPU, i9-14900HX
15098 Points
Lenovo Legion Pro 7 16IRX9H
NVIDIA GeForce RTX 4080 Laptop GPU, i9-14900HX, SK Hynix HFS001TEJ9X115N
14466 Points
Lenovo Legion 9 16IRX9, RTX 4090
NVIDIA GeForce RTX 4090 Laptop GPU, i9-14900HX, Micron 3400 2TB MTFDKBA2T0TFH
13516 Points
Razer Blade 16 2024, RTX 4090
NVIDIA GeForce RTX 4090 Laptop GPU, i9-14900HX, Samsung PM9A1 MZVL22T0HBLB
13219 Points
Alienware x16 R2 P120F
NVIDIA GeForce RTX 4080 Laptop GPU, Ultra 9 185H, WDC PC SN810 1TB
12994 Points
Average of class Gaming
  (6703 - 18475, n=168, last 2 years)
12018 Points
Drive Performance Rating - Percent
Lenovo Legion Pro 7 16IRX9H
SK Hynix HFS001TEJ9X115N
93.7 pt
SCHENKER XMG Neo 16 (Early 24)
Samsung 990 Pro 1 TB
83.6 pt
Alienware x16 R2 P120F
WDC PC SN810 1TB
71.6 pt
Average SK Hynix HFS001TEJ9X115N
 
69.8 pt
Asus ROG Strix Scar 16 G634JZR
SK hynix PC801 HFS002TEJ9X101N
69 pt
Razer Blade 16 2024, RTX 4090
Samsung PM9A1 MZVL22T0HBLB
68.9 pt
Lenovo Legion 9 16IRX9, RTX 4090
Micron 3400 2TB MTFDKBA2T0TFH
63.8 pt
Average of class Gaming
 
62.9 pt
DiskSpd
seq read
Lenovo Legion Pro 7 16IRX9H
SK Hynix HFS001TEJ9X115N
5965 (5911.87min - 5964.72max) MB/s
Alienware x16 R2 P120F
WDC PC SN810 1TB
4224 (3741.6min - 4224.02max) MB/s
Average SK Hynix HFS001TEJ9X115N
  (2757 - 5965, n=10)
3856 MB/s
Razer Blade 16 2024, RTX 4090
Samsung PM9A1 MZVL22T0HBLB
3795 (3693.04min - 3794.8max) MB/s
Average of class Gaming
  (1319 - 7045, n=169, last 2 years)
3500 MB/s
Lenovo Legion 9 16IRX9, RTX 4090
Micron 3400 2TB MTFDKBA2T0TFH
3347 (3203.49min - 3347.47max) MB/s
SCHENKER XMG Neo 16 (Early 24)
Samsung 990 Pro 1 TB
3015 (2943.98min - 3014.55max) MB/s
Asus ROG Strix Scar 16 G634JZR
SK hynix PC801 HFS002TEJ9X101N
2775 (2749.58min - 2774.95max) MB/s
seq write
Lenovo Legion Pro 7 16IRX9H
SK Hynix HFS001TEJ9X115N
5231 (5185.42min - 5231.14max) MB/s
Alienware x16 R2 P120F
WDC PC SN810 1TB
4899 (4625.25min - 4898.53max) MB/s
SCHENKER XMG Neo 16 (Early 24)
Samsung 990 Pro 1 TB
4826 (4760.33min - 4825.54max) MB/s
Average SK Hynix HFS001TEJ9X115N
  (3235 - 7185, n=10)
4366 MB/s
Asus ROG Strix Scar 16 G634JZR
SK hynix PC801 HFS002TEJ9X101N
4177 (3972.19min - 4177.49max) MB/s
Average of class Gaming
  (535 - 9307, n=169, last 2 years)
3819 MB/s
Razer Blade 16 2024, RTX 4090
Samsung PM9A1 MZVL22T0HBLB
3794 (3745.51min - 3793.5max) MB/s
Lenovo Legion 9 16IRX9, RTX 4090
Micron 3400 2TB MTFDKBA2T0TFH
3750 (3377.21min - 3749.92max) MB/s
seq q8 t1 read
SCHENKER XMG Neo 16 (Early 24)
Samsung 990 Pro 1 TB
7140 (5903.9min - 7139.54max) MB/s
Lenovo Legion Pro 7 16IRX9H
SK Hynix HFS001TEJ9X115N
7137 (6760.91min - 7136.8max) MB/s
Alienware x16 R2 P120F
WDC PC SN810 1TB
6823 (5715.47min - 6822.87max) MB/s
Average SK Hynix HFS001TEJ9X115N
  (5974 - 7154, n=10)
6812 MB/s
Asus ROG Strix Scar 16 G634JZR
SK hynix PC801 HFS002TEJ9X101N
6807 (5521.87min - 6807.36max) MB/s
Razer Blade 16 2024, RTX 4090
Samsung PM9A1 MZVL22T0HBLB
6673 (5801.28min - 6672.72max) MB/s
Lenovo Legion 9 16IRX9, RTX 4090
Micron 3400 2TB MTFDKBA2T0TFH
6523 (5649.96min - 6522.56max) MB/s
Average of class Gaming
  (2594 - 16089, n=169, last 2 years)
6365 MB/s
seq q8 t1 write
SCHENKER XMG Neo 16 (Early 24)
Samsung 990 Pro 1 TB
6860 (6824.33min - 6859.91max) MB/s
Average SK Hynix HFS001TEJ9X115N
  (5873 - 9243, n=10)
6480 MB/s
Lenovo Legion Pro 7 16IRX9H
SK Hynix HFS001TEJ9X115N
6129 (6108.53min - 6128.72max) MB/s
Asus ROG Strix Scar 16 G634JZR
SK hynix PC801 HFS002TEJ9X101N
6008 (5990.93min - 6007.71max) MB/s
Alienware x16 R2 P120F
WDC PC SN810 1TB
5208 (5161.3min - 5208.07max) MB/s
Lenovo Legion 9 16IRX9, RTX 4090
Micron 3400 2TB MTFDKBA2T0TFH
5092 (4641.78min - 5091.77max) MB/s
Razer Blade 16 2024, RTX 4090
Samsung PM9A1 MZVL22T0HBLB
4936 (4909.47min - 4936.28max) MB/s
Average of class Gaming
  (539 - 14571, n=169, last 2 years)
4855 MB/s
4k q1 t1 read
Lenovo Legion Pro 7 16IRX9H
SK Hynix HFS001TEJ9X115N
85.7 (84.41min - 85.71max) MB/s
Alienware x16 R2 P120F
WDC PC SN810 1TB
79.3 (64.25min - 79.25max) MB/s
Asus ROG Strix Scar 16 G634JZR
SK hynix PC801 HFS002TEJ9X101N
72.2 (66.43min - 72.17max) MB/s
Razer Blade 16 2024, RTX 4090
Samsung PM9A1 MZVL22T0HBLB
71.4 (66.19min - 71.35max) MB/s
Average SK Hynix HFS001TEJ9X115N
  (58.8 - 85.7, n=10)
70.7 MB/s
Average of class Gaming
  (30.6 - 95.9, n=169, last 2 years)
65.9 MB/s
SCHENKER XMG Neo 16 (Early 24)
Samsung 990 Pro 1 TB
60.5 (49.54min - 60.46max) MB/s
Lenovo Legion 9 16IRX9, RTX 4090
Micron 3400 2TB MTFDKBA2T0TFH
59.1 (58.3min - 59.06max) MB/s
4k q1 t1 write
Lenovo Legion Pro 7 16IRX9H
SK Hynix HFS001TEJ9X115N
320 (319.13min - 319.87max) MB/s
Alienware x16 R2 P120F
WDC PC SN810 1TB
244 (238.59min - 244.13max) MB/s
Average of class Gaming
  (66.6 - 397, n=169, last 2 years)
222 MB/s
Lenovo Legion 9 16IRX9, RTX 4090
Micron 3400 2TB MTFDKBA2T0TFH
209 (203.44min - 208.84max) MB/s
Average SK Hynix HFS001TEJ9X115N
  (135.6 - 334, n=10)
206 MB/s
Razer Blade 16 2024, RTX 4090
Samsung PM9A1 MZVL22T0HBLB
205 (202.97min - 204.75max) MB/s
Asus ROG Strix Scar 16 G634JZR
SK hynix PC801 HFS002TEJ9X101N
174.8 (171.24min - 174.76max) MB/s
SCHENKER XMG Neo 16 (Early 24)
Samsung 990 Pro 1 TB
174.4 (160.08min - 174.38max) MB/s
4k q32 t16 read
Lenovo Legion Pro 7 16IRX9H
SK Hynix HFS001TEJ9X115N
5815 (5754.45min - 5815.45max) MB/s
SCHENKER XMG Neo 16 (Early 24)
Samsung 990 Pro 1 TB
4920 (4883.21min - 4920.02max) MB/s
Alienware x16 R2 P120F
WDC PC SN810 1TB
4245 (4210.56min - 4245.12max) MB/s
Razer Blade 16 2024, RTX 4090
Samsung PM9A1 MZVL22T0HBLB
3726 (3704.12min - 3725.6max) MB/s
Lenovo Legion 9 16IRX9, RTX 4090
Micron 3400 2TB MTFDKBA2T0TFH
2997 (2834.64min - 2996.72max) MB/s
Average of class Gaming
  (417 - 6172, n=169, last 2 years)
2553 MB/s
Average SK Hynix HFS001TEJ9X115N
  (805 - 5870, n=10)
2493 MB/s
Asus ROG Strix Scar 16 G634JZR
SK hynix PC801 HFS002TEJ9X101N
1075 (1073.42min - 1075.48max) MB/s
4k q32 t16 write
SCHENKER XMG Neo 16 (Early 24)
Samsung 990 Pro 1 TB
4522 (4451.05min - 4521.93max) MB/s
Lenovo Legion Pro 7 16IRX9H
SK Hynix HFS001TEJ9X115N
3736 (3702.54min - 3735.59max) MB/s
Razer Blade 16 2024, RTX 4090
Samsung PM9A1 MZVL22T0HBLB
3548 (3533.85min - 3548.33max) MB/s
Alienware x16 R2 P120F
WDC PC SN810 1TB
2907 (2737.8min - 2907.05max) MB/s
Lenovo Legion 9 16IRX9, RTX 4090
Micron 3400 2TB MTFDKBA2T0TFH
2673 (2401.6min - 2673.33max) MB/s
Average of class Gaming
  (162.3 - 4869, n=169, last 2 years)
2101 MB/s
Average SK Hynix HFS001TEJ9X115N
  (346 - 4437, n=10)
1614 MB/s
Asus ROG Strix Scar 16 G634JZR
SK hynix PC801 HFS002TEJ9X101N
714 (704.85min - 714.01max) MB/s
AS SSD
Score Total
Lenovo Legion Pro 7 16IRX9H
SK Hynix HFS001TEJ9X115N
10142 Points
SCHENKER XMG Neo 16 (Early 24)
Samsung 990 Pro 1 TB
9365 Points
Alienware x16 R2 P120F
WDC PC SN810 1TB
8139 Points
Asus ROG Strix Scar 16 G634JZR
SK hynix PC801 HFS002TEJ9X101N
7962 Points
Average SK Hynix HFS001TEJ9X115N
  (4226 - 10769, n=10)
7309 Points
Razer Blade 16 2024, RTX 4090
Samsung PM9A1 MZVL22T0HBLB
7040 Points
Lenovo Legion 9 16IRX9, RTX 4090
Micron 3400 2TB MTFDKBA2T0TFH
6847 Points
Average of class Gaming
  (2271 - 13854, n=160, last 2 years)
6742 Points
Score Read
Lenovo Legion Pro 7 16IRX9H
SK Hynix HFS001TEJ9X115N
3713 Points
SCHENKER XMG Neo 16 (Early 24)
Samsung 990 Pro 1 TB
3496 Points
Alienware x16 R2 P120F
WDC PC SN810 1TB
3204 Points
Razer Blade 16 2024, RTX 4090
Samsung PM9A1 MZVL22T0HBLB
2848 Points
Lenovo Legion 9 16IRX9, RTX 4090
Micron 3400 2TB MTFDKBA2T0TFH
2722 Points
Average of class Gaming
  (776 - 4721, n=160, last 2 years)
2445 Points
Average SK Hynix HFS001TEJ9X115N
  (1300 - 3925, n=10)
2265 Points
Asus ROG Strix Scar 16 G634JZR
SK hynix PC801 HFS002TEJ9X101N
2044 Points
Score Write
Asus ROG Strix Scar 16 G634JZR
SK hynix PC801 HFS002TEJ9X101N
4954 Points
Lenovo Legion Pro 7 16IRX9H
SK Hynix HFS001TEJ9X115N
4547 Points
SCHENKER XMG Neo 16 (Early 24)
Samsung 990 Pro 1 TB
4062 Points
Average SK Hynix HFS001TEJ9X115N
  (1662 - 5126, n=10)
3953 Points
Alienware x16 R2 P120F
WDC PC SN810 1TB
3341 Points
Average of class Gaming
  (515 - 7208, n=160, last 2 years)
3113 Points
Razer Blade 16 2024, RTX 4090
Samsung PM9A1 MZVL22T0HBLB
2766 Points
Lenovo Legion 9 16IRX9, RTX 4090
Micron 3400 2TB MTFDKBA2T0TFH
2686 Points
Seq Read
Lenovo Legion Pro 7 16IRX9H
SK Hynix HFS001TEJ9X115N
5899.96 MB/s
SCHENKER XMG Neo 16 (Early 24)
Samsung 990 Pro 1 TB
5684.15 MB/s
Average SK Hynix HFS001TEJ9X115N
  (5178 - 7153, n=10)
5678 MB/s
Alienware x16 R2 P120F
WDC PC SN810 1TB
5642.41 MB/s
Asus ROG Strix Scar 16 G634JZR
SK hynix PC801 HFS002TEJ9X101N
5182.51 MB/s
Average of class Gaming
  (2260 - 12763, n=160, last 2 years)
4976 MB/s
Razer Blade 16 2024, RTX 4090
Samsung PM9A1 MZVL22T0HBLB
4371 MB/s
Lenovo Legion 9 16IRX9, RTX 4090
Micron 3400 2TB MTFDKBA2T0TFH
2272 MB/s
Seq Write
SCHENKER XMG Neo 16 (Early 24)
Samsung 990 Pro 1 TB
5612.29 MB/s
Lenovo Legion Pro 7 16IRX9H
SK Hynix HFS001TEJ9X115N
5567.68 MB/s
Alienware x16 R2 P120F
WDC PC SN810 1TB
4787.7 MB/s
Average SK Hynix HFS001TEJ9X115N
  (2245 - 5986, n=10)
4137 MB/s
Razer Blade 16 2024, RTX 4090
Samsung PM9A1 MZVL22T0HBLB
3791 MB/s
Average of class Gaming
  (495 - 11316, n=160, last 2 years)
3750 MB/s
Asus ROG Strix Scar 16 G634JZR
SK hynix PC801 HFS002TEJ9X101N
3368.17 MB/s
Lenovo Legion 9 16IRX9, RTX 4090
Micron 3400 2TB MTFDKBA2T0TFH
3289 MB/s
4K Read
Lenovo Legion Pro 7 16IRX9H
SK Hynix HFS001TEJ9X115N
83.45 MB/s
Alienware x16 R2 P120F
WDC PC SN810 1TB
70.48 MB/s
Average SK Hynix HFS001TEJ9X115N
  (54.4 - 83.5, n=10)
67.1 MB/s
Average of class Gaming
  (27.8 - 112.1, n=160, last 2 years)
65.1 MB/s
Asus ROG Strix Scar 16 G634JZR
SK hynix PC801 HFS002TEJ9X101N
65.08 MB/s
Razer Blade 16 2024, RTX 4090
Samsung PM9A1 MZVL22T0HBLB
61.1 MB/s
SCHENKER XMG Neo 16 (Early 24)
Samsung 990 Pro 1 TB
59.28 MB/s
Lenovo Legion 9 16IRX9, RTX 4090
Micron 3400 2TB MTFDKBA2T0TFH
55.9 MB/s
4K Write
Lenovo Legion Pro 7 16IRX9H
SK Hynix HFS001TEJ9X115N
292.28 MB/s
Asus ROG Strix Scar 16 G634JZR
SK hynix PC801 HFS002TEJ9X101N
278.27 MB/s
SCHENKER XMG Neo 16 (Early 24)
Samsung 990 Pro 1 TB
248.48 MB/s
Average SK Hynix HFS001TEJ9X115N
  (128.1 - 292, n=10)
218 MB/s
Alienware x16 R2 P120F
WDC PC SN810 1TB
213.62 MB/s
Average of class Gaming
  (108.8 - 512, n=160, last 2 years)
211 MB/s
Lenovo Legion 9 16IRX9, RTX 4090
Micron 3400 2TB MTFDKBA2T0TFH
188.6 MB/s
Razer Blade 16 2024, RTX 4090
Samsung PM9A1 MZVL22T0HBLB
160.6 MB/s
4K-64 Read
Lenovo Legion Pro 7 16IRX9H
SK Hynix HFS001TEJ9X115N
3039.99 MB/s
SCHENKER XMG Neo 16 (Early 24)
Samsung 990 Pro 1 TB
2933.61 MB/s
Alienware x16 R2 P120F
WDC PC SN810 1TB
2569.34 MB/s
Lenovo Legion 9 16IRX9, RTX 4090
Micron 3400 2TB MTFDKBA2T0TFH
2439 MB/s
Razer Blade 16 2024, RTX 4090
Samsung PM9A1 MZVL22T0HBLB
2350 MB/s
Average of class Gaming
  (451 - 3475, n=160, last 2 years)
1876 MB/s
Average SK Hynix HFS001TEJ9X115N
  (695 - 3270, n=10)
1630 MB/s
Asus ROG Strix Scar 16 G634JZR
SK hynix PC801 HFS002TEJ9X101N
1460.82 MB/s
4K-64 Write
Asus ROG Strix Scar 16 G634JZR
SK hynix PC801 HFS002TEJ9X101N
4338.89 MB/s
Lenovo Legion Pro 7 16IRX9H
SK Hynix HFS001TEJ9X115N
3697.94 MB/s
Average SK Hynix HFS001TEJ9X115N
  (935 - 4295, n=10)
3321 MB/s
SCHENKER XMG Neo 16 (Early 24)
Samsung 990 Pro 1 TB
3252.43 MB/s
Alienware x16 R2 P120F
WDC PC SN810 1TB
2648.4 MB/s
Average of class Gaming
  (277 - 5909, n=160, last 2 years)
2529 MB/s
Razer Blade 16 2024, RTX 4090
Samsung PM9A1 MZVL22T0HBLB
2226 MB/s
Lenovo Legion 9 16IRX9, RTX 4090
Micron 3400 2TB MTFDKBA2T0TFH
2168 MB/s
Access Time Read
Alienware x16 R2 P120F
WDC PC SN810 1TB
0.09 ms *
Average of class Gaming
  (0.016 - 0.379, n=159, last 2 years)
0.05489 ms *
Asus ROG Strix Scar 16 G634JZR
SK hynix PC801 HFS002TEJ9X101N
0.038 ms *
Lenovo Legion Pro 7 16IRX9H
SK Hynix HFS001TEJ9X115N
0.034 ms *
Lenovo Legion 9 16IRX9, RTX 4090
Micron 3400 2TB MTFDKBA2T0TFH
0.034 ms *
Average SK Hynix HFS001TEJ9X115N
  (0.016 - 0.055, n=10)
0.0339 ms *
Razer Blade 16 2024, RTX 4090
Samsung PM9A1 MZVL22T0HBLB
0.033 ms *
SCHENKER XMG Neo 16 (Early 24)
Samsung 990 Pro 1 TB
0.024 ms *
Access Time Write
Alienware x16 R2 P120F
WDC PC SN810 1TB
0.055 ms *
Average of class Gaming
  (0.011 - 1.028, n=160, last 2 years)
0.04827 ms *
Average SK Hynix HFS001TEJ9X115N
  (0.017 - 0.089, n=10)
0.0373 ms *
Razer Blade 16 2024, RTX 4090
Samsung PM9A1 MZVL22T0HBLB
0.025 ms *
Lenovo Legion 9 16IRX9, RTX 4090
Micron 3400 2TB MTFDKBA2T0TFH
0.023 ms *
Asus ROG Strix Scar 16 G634JZR
SK hynix PC801 HFS002TEJ9X101N
0.018 ms *
Lenovo Legion Pro 7 16IRX9H
SK Hynix HFS001TEJ9X115N
0.017 ms *
SCHENKER XMG Neo 16 (Early 24)
Samsung 990 Pro 1 TB
0.016 ms *

* ... smaller is better

GPU 性能--RTX 4090 笔记本电脑值得购买吗?

性价比出众的联想Legion Pro 7。

从我们的 GPU 合成结果来看,Legion Pro 7 证明,是否要购买 4090 GPU 值得商榷。 4090配置,因为当今的大多数竞争者也都配备了 4080.Pro 7 和 Scar 16 的差异是可以衡量的,但绝对不是日以继夜。

不过,对于某些工作流程,尤其是视频剪辑或基本上任何需要大量 VRAM 的工作,除了纯粹的速度之外,您仍然应该考虑这些显卡之间的内存配置。

3DMark Performance Rating - Percent
SCHENKER XMG Neo 16 (Early 24)
NVIDIA GeForce RTX 4090 Laptop GPU, Intel Core i9-14900HX
100 pt
Lenovo Legion Pro 7 16IRX9H, RTX 4090
NVIDIA GeForce RTX 4090 Laptop GPU, Intel Core i9-14900HX
93.3 pt
Razer Blade 16 2024, RTX 4090
NVIDIA GeForce RTX 4090 Laptop GPU, Intel Core i9-14900HX
89.7 pt
Lenovo Legion 9 16IRX9, RTX 4090
NVIDIA GeForce RTX 4090 Laptop GPU, Intel Core i9-14900HX
88 pt
Lenovo Legion Pro 7 16IRX9H
NVIDIA GeForce RTX 4080 Laptop GPU, Intel Core i9-14900HX
87.9 pt
Asus ROG Strix Scar 16 G634JYR
NVIDIA GeForce RTX 4090 Laptop GPU, Intel Core i9-14900HX
87.9 pt
Alienware x16 R2 P120F
NVIDIA GeForce RTX 4080 Laptop GPU, Intel Core Ultra 9 185H
83 pt
Asus ROG Strix Scar 16 G634JZR
NVIDIA GeForce RTX 4080 Laptop GPU, Intel Core i9-14900HX
82.7 pt
Average NVIDIA GeForce RTX 4080 Laptop GPU
 
79.5 pt
Average of class Gaming
 
59.5 pt
3DMark
1920x1080 Fire Strike Graphics
SCHENKER XMG Neo 16 (Early 24)
NVIDIA GeForce RTX 4090 Laptop GPU, Intel Core i9-14900HX
51946 Points
Lenovo Legion Pro 7 16IRX9H, RTX 4090
NVIDIA GeForce RTX 4090 Laptop GPU, Intel Core i9-14900HX
47085 Points
Razer Blade 16 2024, RTX 4090
NVIDIA GeForce RTX 4090 Laptop GPU, Intel Core i9-14900HX
46527 Points
Lenovo Legion Pro 7 16IRX9H
NVIDIA GeForce RTX 4080 Laptop GPU, Intel Core i9-14900HX
45220 Points
Lenovo Legion 9 16IRX9, RTX 4090
NVIDIA GeForce RTX 4090 Laptop GPU, Intel Core i9-14900HX
43518 Points
Asus ROG Strix Scar 16 G634JYR
NVIDIA GeForce RTX 4090 Laptop GPU, Intel Core i9-14900HX
42601 Points
Alienware x16 R2 P120F
NVIDIA GeForce RTX 4080 Laptop GPU, Intel Core Ultra 9 185H
42558 Points
Asus ROG Strix Scar 16 G634JZR
NVIDIA GeForce RTX 4080 Laptop GPU, Intel Core i9-14900HX
41431 Points
Average NVIDIA GeForce RTX 4080 Laptop GPU
  (33058 - 45220, n=22)
40862 Points
Average of class Gaming
  (781 - 53059, n=197, last 2 years)
31252 Points
2560x1440 Time Spy Graphics
SCHENKER XMG Neo 16 (Early 24)
NVIDIA GeForce RTX 4090 Laptop GPU, Intel Core i9-14900HX
22134 Points
Lenovo Legion Pro 7 16IRX9H, RTX 4090
NVIDIA GeForce RTX 4090 Laptop GPU, Intel Core i9-14900HX
21251 Points
Asus ROG Strix Scar 16 G634JYR
NVIDIA GeForce RTX 4090 Laptop GPU, Intel Core i9-14900HX
20775 Points
Lenovo Legion 9 16IRX9, RTX 4090
NVIDIA GeForce RTX 4090 Laptop GPU, Intel Core i9-14900HX
20416 Points
Razer Blade 16 2024, RTX 4090
NVIDIA GeForce RTX 4090 Laptop GPU, Intel Core i9-14900HX
19878 Points
Lenovo Legion Pro 7 16IRX9H
NVIDIA GeForce RTX 4080 Laptop GPU, Intel Core i9-14900HX
19663 Points
Asus ROG Strix Scar 16 G634JZR
NVIDIA GeForce RTX 4080 Laptop GPU, Intel Core i9-14900HX
18954 Points
Alienware x16 R2 P120F
NVIDIA GeForce RTX 4080 Laptop GPU, Intel Core Ultra 9 185H
18627 Points
Average NVIDIA GeForce RTX 4080 Laptop GPU
  (13282 - 19663, n=22)
17777 Points
Average of class Gaming
  (224 - 22717, n=192, last 2 years)
13032 Points

游戏性能 - 越来越快

我们的游戏评级--在 1080p 下测试一系列新游戏和老游戏,对 CPU 和 GPU 施加同样的压力--也表明,快速的 CPU 和两个核心部件持续的高功率水平几乎比更强大的 GPU 更重要,Pro 7 再一次证明了这一点。与此同时,XMG Neo 16 在性能上完全超越了竞争对手。
请注意,由于时间有限,我们只能在 Scar 16 和Legion Pro 7 RTX 4090 配置上进行数量有限的测试,这也是我们的游戏评分中缺少它们各自结果的原因。

尽管如此,除了 X16 稍微落后之外,其他竞争者之间的差距并不惊人--但考虑到芯片的整体性能较弱,这也在意料之中。

赛博朋克》是一款对 GPU 要求较高的游戏,更能代表现代游戏的水平,我们的测试结果与一般预期更为接近,尤其是在 1080p 以上时。只要为 GPU 提供足够的功率,即使 Alienware 的 CPU 速度较慢,实际 FPS 也不会大打折扣。

英伟达™(NVIDIA®)高端移动 GPU 之间的差异在这里也更加明显,Neo 16 令人印象深刻地展示了 4090 笔记本电脑在最佳条件下所能达到的性能。

2024 年,你将很难找到比 XMG Neo 16 更快的笔记本电脑。
Performance Rating - Percent (sort by value)
Lenovo Legion Pro 7 16IRX9H
Intel Core i9-14900HX, NVIDIA GeForce RTX 4080 Laptop GPU
88.7 pt
Asus ROG Strix Scar 16 G634JZR
Intel Core i9-14900HX, NVIDIA GeForce RTX 4080 Laptop GPU
91.1 pt
Razer Blade 16 2024, RTX 4090
Intel Core i9-14900HX, NVIDIA GeForce RTX 4090 Laptop GPU
85.7 pt
Alienware x16 R2 P120F
Intel Core Ultra 9 185H, NVIDIA GeForce RTX 4080 Laptop GPU
69.8 pt
Lenovo Legion 9 16IRX9, RTX 4090
Intel Core i9-14900HX, NVIDIA GeForce RTX 4090 Laptop GPU
88.5 pt
SCHENKER XMG Neo 16 (Early 24)
Intel Core i9-14900HX, NVIDIA GeForce RTX 4090 Laptop GPU
99.8 pt
Average of class Gaming
 
66.4 pt
Final Fantasy XV Benchmark - 1920x1080 High Quality (sort by value)
Lenovo Legion Pro 7 16IRX9H
Intel Core i9-14900HX, NVIDIA GeForce RTX 4080 Laptop GPU
173.1 fps
Asus ROG Strix Scar 16 G634JZR
Intel Core i9-14900HX, NVIDIA GeForce RTX 4080 Laptop GPU
178 fps
Razer Blade 16 2024, RTX 4090
Intel Core i9-14900HX, NVIDIA GeForce RTX 4090 Laptop GPU
137.5 fps
Alienware x16 R2 P120F
Intel Core Ultra 9 185H, NVIDIA GeForce RTX 4080 Laptop GPU
139.8 fps
Lenovo Legion 9 16IRX9, RTX 4090
Intel Core i9-14900HX, NVIDIA GeForce RTX 4090 Laptop GPU
165.1 fps
SCHENKER XMG Neo 16 (Early 24)
Intel Core i9-14900HX, NVIDIA GeForce RTX 4090 Laptop GPU
196.9 fps
Average of class Gaming
  (19.2 - 201, n=185, last 2 years)
119 fps
Strange Brigade - 1920x1080 ultra AA:ultra AF:16 (sort by value)
Lenovo Legion Pro 7 16IRX9H
Intel Core i9-14900HX, NVIDIA GeForce RTX 4080 Laptop GPU
339 (69.9min, 250P1) fps
Asus ROG Strix Scar 16 G634JZR
Intel Core i9-14900HX, NVIDIA GeForce RTX 4080 Laptop GPU
337 (16.7min, 246P1) fps
Razer Blade 16 2024, RTX 4090
Intel Core i9-14900HX, NVIDIA GeForce RTX 4090 Laptop GPU
359.8 (30.2min, 253P1) fps
Alienware x16 R2 P120F
Intel Core Ultra 9 185H, NVIDIA GeForce RTX 4080 Laptop GPU
293 (38.3min, 184.1P1) fps
Lenovo Legion 9 16IRX9, RTX 4090
Intel Core i9-14900HX, NVIDIA GeForce RTX 4090 Laptop GPU
369 (5min, 269P1) fps
SCHENKER XMG Neo 16 (Early 24)
Intel Core i9-14900HX, NVIDIA GeForce RTX 4090 Laptop GPU
403 (101.2min, 295P1) fps
Average of class Gaming
  (38.9 - 421, n=183, last 2 years)
227 fps
Dota 2 Reborn - 1920x1080 ultra (3/3) best looking (sort by value)
Lenovo Legion Pro 7 16IRX9H
Intel Core i9-14900HX, NVIDIA GeForce RTX 4080 Laptop GPU
183.5 (155.3min) fps
Asus ROG Strix Scar 16 G634JZR
Intel Core i9-14900HX, NVIDIA GeForce RTX 4080 Laptop GPU
177.4 (149.3min) fps
Razer Blade 16 2024, RTX 4090
Intel Core i9-14900HX, NVIDIA GeForce RTX 4090 Laptop GPU
188.1 (155.2min) fps
Alienware x16 R2 P120F
Intel Core Ultra 9 185H, NVIDIA GeForce RTX 4080 Laptop GPU
133 (114.6min) fps
Lenovo Legion 9 16IRX9, RTX 4090
Intel Core i9-14900HX, NVIDIA GeForce RTX 4090 Laptop GPU
164.5 (136min) fps
SCHENKER XMG Neo 16 (Early 24)
Intel Core i9-14900HX, NVIDIA GeForce RTX 4090 Laptop GPU
194.6 (165.7min) fps
Average of class Gaming
  (30.8 - 220, n=191, last 2 years)
149.4 fps
X-Plane 11.11 - 1920x1080 high (fps_test=3) (sort by value)
Lenovo Legion Pro 7 16IRX9H
Intel Core i9-14900HX, NVIDIA GeForce RTX 4080 Laptop GPU
127.5 fps
Asus ROG Strix Scar 16 G634JZR
Intel Core i9-14900HX, NVIDIA GeForce RTX 4080 Laptop GPU
141.3 fps
Razer Blade 16 2024, RTX 4090
Intel Core i9-14900HX, NVIDIA GeForce RTX 4090 Laptop GPU
146.2 fps
Alienware x16 R2 P120F
Intel Core Ultra 9 185H, NVIDIA GeForce RTX 4080 Laptop GPU
89.3 fps
Lenovo Legion 9 16IRX9, RTX 4090
Intel Core i9-14900HX, NVIDIA GeForce RTX 4090 Laptop GPU
125.6 fps
SCHENKER XMG Neo 16 (Early 24)
Intel Core i9-14900HX, NVIDIA GeForce RTX 4090 Laptop GPU
144.5 fps
Average of class Gaming
  (31.5 - 166.2, n=197, last 2 years)
107.2 fps
Cyberpunk 2077 2.1 Phantom Liberty - 1920x1080 Ultra Preset (FSR off) (sort by value)
Lenovo Legion Pro 7 16IRX9H
Intel Core i9-14900HX, NVIDIA GeForce RTX 4080 Laptop GPU
118.3 (56min) fps
Asus ROG Strix Scar 16 G634JZR
Intel Core i9-14900HX, NVIDIA GeForce RTX 4080 Laptop GPU
123.1 (100.1min) fps
Razer Blade 16 2024, RTX 4090
Intel Core i9-14900HX, NVIDIA GeForce RTX 4090 Laptop GPU
95.35 (70.51min) fps
Alienware x16 R2 P120F
Intel Core Ultra 9 185H, NVIDIA GeForce RTX 4080 Laptop GPU
99.7 (13.5min) fps
Lenovo Legion 9 16IRX9, RTX 4090
Intel Core i9-14900HX, NVIDIA GeForce RTX 4090 Laptop GPU
127 (70.6min) fps
SCHENKER XMG Neo 16 (Early 24)
Intel Core i9-14900HX, NVIDIA GeForce RTX 4090 Laptop GPU
131.5 (62.2min) fps
Average of class Gaming
  (6.76 - 144.7, n=79, last 2 years)
85.9 fps
Cyberpunk 2077 2.1 Phantom Liberty
2560x1440 Ultra Preset (FSR off)
SCHENKER XMG Neo 16 (Early 24)
Intel Core i9-14900HX, NVIDIA GeForce RTX 4090 Laptop GPU
93.8 (53.7min) fps
Lenovo Legion Pro 7 16IRX9H, RTX 4090
Intel Core i9-14900HX, NVIDIA GeForce RTX 4090 Laptop GPU
90.84 (74.08min) fps
Asus ROG Strix Scar 16 G634JYR
Intel Core i9-14900HX, NVIDIA GeForce RTX 4090 Laptop GPU
88.25 (72.71min) fps
Lenovo Legion 9 16IRX9, RTX 4090
Intel Core i9-14900HX, NVIDIA GeForce RTX 4090 Laptop GPU
86 (70.4min) fps
Razer Blade 16 2024, RTX 4090
Intel Core i9-14900HX, NVIDIA GeForce RTX 4090 Laptop GPU
83.39 (67.14min) fps
Lenovo Legion Pro 7 16IRX9H
Intel Core i9-14900HX, NVIDIA GeForce RTX 4080 Laptop GPU
79.1 (39.3min) fps
Asus ROG Strix Scar 16 G634JZR
Intel Core i9-14900HX, NVIDIA GeForce RTX 4080 Laptop GPU
77.6 (64min) fps
Average NVIDIA GeForce RTX 4080 Laptop GPU
  (56.2 - 86.3, n=15)
75.8 fps
Alienware x16 R2 P120F
Intel Core Ultra 9 185H, NVIDIA GeForce RTX 4080 Laptop GPU
75.4 (25.4min) fps
Average of class Gaming
  (24.8 - 110, n=69, last 2 years)
64.9 fps
1920x1080 Ultra Preset (FSR off)
SCHENKER XMG Neo 16 (Early 24)
Intel Core i9-14900HX, NVIDIA GeForce RTX 4090 Laptop GPU
131.5 (62.2min) fps
Lenovo Legion 9 16IRX9, RTX 4090
Intel Core i9-14900HX, NVIDIA GeForce RTX 4090 Laptop GPU
127 (70.6min) fps
Lenovo Legion Pro 7 16IRX9H, RTX 4090
Intel Core i9-14900HX, NVIDIA GeForce RTX 4090 Laptop GPU
125.08 (90.63min) fps
Asus ROG Strix Scar 16 G634JZR
Intel Core i9-14900HX, NVIDIA GeForce RTX 4080 Laptop GPU
123.1 (100.1min) fps
Asus ROG Strix Scar 16 G634JYR
Intel Core i9-14900HX, NVIDIA GeForce RTX 4090 Laptop GPU
119.36 (88.27min) fps
Lenovo Legion Pro 7 16IRX9H
Intel Core i9-14900HX, NVIDIA GeForce RTX 4080 Laptop GPU
118.3 (56min) fps
Average NVIDIA GeForce RTX 4080 Laptop GPU
  (83.9 - 127.1, n=12)
111.5 fps
Alienware x16 R2 P120F
Intel Core Ultra 9 185H, NVIDIA GeForce RTX 4080 Laptop GPU
99.7 (13.5min) fps
Razer Blade 16 2024, RTX 4090
Intel Core i9-14900HX, NVIDIA GeForce RTX 4090 Laptop GPU
95.35 (70.51min) fps
Average of class Gaming
  (6.76 - 144.7, n=79, last 2 years)
85.9 fps

排放量

系统噪音

根据我们的测量结果,Blade 16 应该是最安静的机器,但这并不能说明全部问题。
虽然从纸面上看,它的噪音可能要小得多,但风扇却发出一种高亢的酒声,我们发现这种声音比 Legions 或 Alienware 等机器发出的 "响亮 "但低沉的声音更让人心烦意乱。

Lenovo Legion Pro 7 16IRX9H
NVIDIA GeForce RTX 4080 Laptop GPU, i9-14900HX, SK Hynix HFS001TEJ9X115N
Asus ROG Strix Scar 16 G634JZR
NVIDIA GeForce RTX 4080 Laptop GPU, i9-14900HX, SK hynix PC801 HFS002TEJ9X101N
Razer Blade 16 2024, RTX 4090
NVIDIA GeForce RTX 4090 Laptop GPU, i9-14900HX, Samsung PM9A1 MZVL22T0HBLB
Alienware x16 R2 P120F
NVIDIA GeForce RTX 4080 Laptop GPU, Ultra 9 185H, WDC PC SN810 1TB
Lenovo Legion 9 16IRX9, RTX 4090
NVIDIA GeForce RTX 4090 Laptop GPU, i9-14900HX, Micron 3400 2TB MTFDKBA2T0TFH
SCHENKER XMG Neo 16 (Early 24)
NVIDIA GeForce RTX 4090 Laptop GPU, i9-14900HX, Samsung 990 Pro 1 TB
Noise
off / environment *
24
21.07
23
23.4
23
26
Idle Minimum *
25
29.75
23
23.8
23
28
Idle Average *
30
29.75
23
28.5
23
29
Idle Maximum *
45
29.75
27.66
28.5
23
31
Load Average *
50
54.85
43.76
28.8
39
51
Witcher 3 ultra *
54
57.8
46.81
49.5
55.32
54
Load Maximum *
56
58
50.37
54.2
55.56
56

* ... smaller is better

温度

负载下的温度在我们的竞争者的预期范围内......
......尽管 Alienware 的 CPU 冷却速度是最慢的,但温度还是很高。

在负载情况下,Razer Blade 16 的最高上侧温度为 45°C,最高下侧温度为 49°C,是最凉爽的笔记本电脑之一,是重视较低工作温度的消费者的理想选择。紧随其后的是联想Legion Pro 7 和联想Legion 9,它们的最高温度都在 46°C 左右,但底部温度略高,分别为 49°C 和 56°C。Alienware X16 的最高温度为 51°C,最低温度为 50.8°C,性能与之相当。

申克 XMG Neo 16 在静态时的散热效率非常突出。在该模式下,它是空闲温度最低的机型之一,底部温度仅为 27°C,上部温度为 38°C。另一方面,华硕 ROG Strix Scar 16 在负载状态下的温度可达 52.2°C,比其他笔记本电脑的运行温度略高。综合来看,这些笔记本电脑的散热性能各不相同,其中申克 XMG Neo 16 的怠速散热管理最为出色,而 Razer Blade 16 则在负载条件下表现异常出色。

Lenovo Legion Pro 7 16IRX9H
Intel Core i9-14900HX, NVIDIA GeForce RTX 4080 Laptop GPU
Asus ROG Strix Scar 16 G634JZR
Intel Core i9-14900HX, NVIDIA GeForce RTX 4080 Laptop GPU
Razer Blade 16 2024, RTX 4090
Intel Core i9-14900HX, NVIDIA GeForce RTX 4090 Laptop GPU
Alienware x16 R2 P120F
Intel Core Ultra 9 185H, NVIDIA GeForce RTX 4080 Laptop GPU
Lenovo Legion 9 16IRX9, RTX 4090
Intel Core i9-14900HX, NVIDIA GeForce RTX 4090 Laptop GPU
SCHENKER XMG Neo 16 (Early 24)
Intel Core i9-14900HX, NVIDIA GeForce RTX 4090 Laptop GPU
Heat
Maximum Upper Side *
46
47.8
45
51
56
47
Maximum Bottom *
49
52.2
45
50.8
53
56
Idle Upper Side *
38
32.4
29
36.6
38
27
Idle Bottom *
37
33
30
35.2
39
27

* ... smaller is better

电池寿命

考虑到我们正在处理的性能问题,并考虑到我们只有在连接电源时才能获得这种性能,我们面前的这些笔记本电脑都无法获得全天的电池续航时间也就不足为奇了。尽管如此,Scar 的表现令人钦佩,而 Alienware 却令人失望,考虑到它应该拥有最高效的 CPU,这就更令人吃惊了。

Lenovo Legion Pro 7 16IRX9H
i9-14900HX, NVIDIA GeForce RTX 4080 Laptop GPU, 99.9 Wh
Asus ROG Strix Scar 16 G634JZR
i9-14900HX, NVIDIA GeForce RTX 4080 Laptop GPU, 90 Wh
Razer Blade 16 2024, RTX 4090
i9-14900HX, NVIDIA GeForce RTX 4090 Laptop GPU, 95.2 Wh
Alienware x16 R2 P120F
Ultra 9 185H, NVIDIA GeForce RTX 4080 Laptop GPU, 90 Wh
Lenovo Legion 9 16IRX9, RTX 4090
i9-14900HX, NVIDIA GeForce RTX 4090 Laptop GPU, 99.99 Wh
SCHENKER XMG Neo 16 (Early 24)
i9-14900HX, NVIDIA GeForce RTX 4090 Laptop GPU, 99.8 Wh
Average of class Gaming
 
Battery Runtime
WiFi v1.3
373
434
329
193
290
350
H.264
451
456
294
418
Witcher 3 ultra
57
Load
51
79
129
122
Reader / Idle
600

结论

正如我们在开头所说的那样,我们不可能将我们的竞争者之一命名为最佳高端游戏笔记本电脑。每款产品都有其独特的优缺点,你可以欣赏,也可以接受。
也就是说,Alienware X16 是最不均衡的笔记本电脑,但它也是最实惠的,尤其是在打折的时候。Legion Pro 7 则非常均衡,而且也不需要贷款。
其余的选择无疑都是各自公司的光环产品,它们具有出色的显示效果、令人惊叹的性能以及与价格相匹配的 "额外 "优势。

16 英寸游戏笔记本电脑中的佼佼者。
16 英寸游戏笔记本电脑中的佼佼者。

Transparency

The selection of devices to be reviewed is made by our editorial team. The test sample was provided to the author as a loan by the manufacturer or retailer for the purpose of this review. The lender had no influence on this review, nor did the manufacturer receive a copy of this review before publication. There was no obligation to publish this review. We never accept compensation or payment in return for our reviews. As an independent media company, Notebookcheck is not subjected to the authority of manufacturers, retailers or publishers.

This is how Notebookcheck is testing

Every year, Notebookcheck independently reviews hundreds of laptops and smartphones using standardized procedures to ensure that all results are comparable. We have continuously developed our test methods for around 20 years and set industry standards in the process. In our test labs, high-quality measuring equipment is utilized by experienced technicians and editors. These tests involve a multi-stage validation process. Our complex rating system is based on hundreds of well-founded measurements and benchmarks, which maintains objectivity. Further information on our test methods can be found here.

Please share our article, every link counts!
> Notebookcheck中文版(NBC中国) > 评测 > 巨人之战2024 年 16 英寸游戏笔记本电脑终极对决
Sambit Saha, Alexander Wätzel, 2024-11- 9 (Update: 2024-11- 9)