

比Android 更便宜?Apple iPad Air 11 (2025) 配备 M3 电源,售价低于 600 美元评测
性价比基准?
Apple iPad Air 2025 采用 11 英寸屏幕,得益于Apple M3,性能令人印象深刻。而它的起价还不到 600 美元。与昂贵的Android 旗舰产品相比,我们是否更推荐它?请阅读我们的评测,一探究竟。Florian Schmitt, 👁 Florian Schmitt (translated by DeepL / Ninh Duy) Published 🇺🇸 🇩🇪 ...
Apple iPad Air 11 (2025) Gen 7 评论
Apple第七代 iPad Air 11 再次成为一款高端平板电脑,很可能代表了该公司的中端产品。即便如此,它仍拥有目前任何Android 平板电脑都无法匹敌的强大处理器。此外,它所包含的高质量应用程序以及对数据保护和可持续发展的关注也使这款平板电脑极具吸引力。
Apple Intelligence 是一项重大创新,其他 iPad 也有这项功能,但我们是第一次在欧洲对它进行测试。大部分功能都能快速、正确地运行,这部分归功于集成了久经考验、功能丰富的 ChatGPT。不过,Apple 在一些人工智能功能方面仍需努力,例如从照片中剪切出不需要的人,而在这方面,谷歌有时已经证明走在了前面。
如果你想用Apple iPad Air 11(2025)从事专业工作,那么你应该记住,这是一款搭载 iPadOS 的设备。即使 18 版终于有了内置计算器,你在 MacOS 上熟悉和喜爱的应用程序也会缺失,或者根本不如Apple 的桌面系统实用。在完全依赖 iPadOS 之前,最好先试用一下。
与前代机型相比,除了键盘底座更好、处理器性能略高之外,并没有太多明显的改进。由于少了一个核心,它的图形处理器在某些情况下甚至会略微降低功率。
Apple iPad Air 11 (2025) 的入门级价格在Apple 标准下相当低,而且性能极高,因此如果你能接受其 10.86 英寸的小巧屏幕,那么它实际上是一款不错的产品。不过,如果你想要 OLED 屏幕或更大的存储空间,那么Android 还是更便宜。
Pros
Cons
价格和供应情况
iPad Air 11 2025 可在许多零售商处购买。
例如,你目前可以从亚马逊以 549 美元的价格在线购买。
Table of Contents
规格
保护套 - iPad 防水吗?
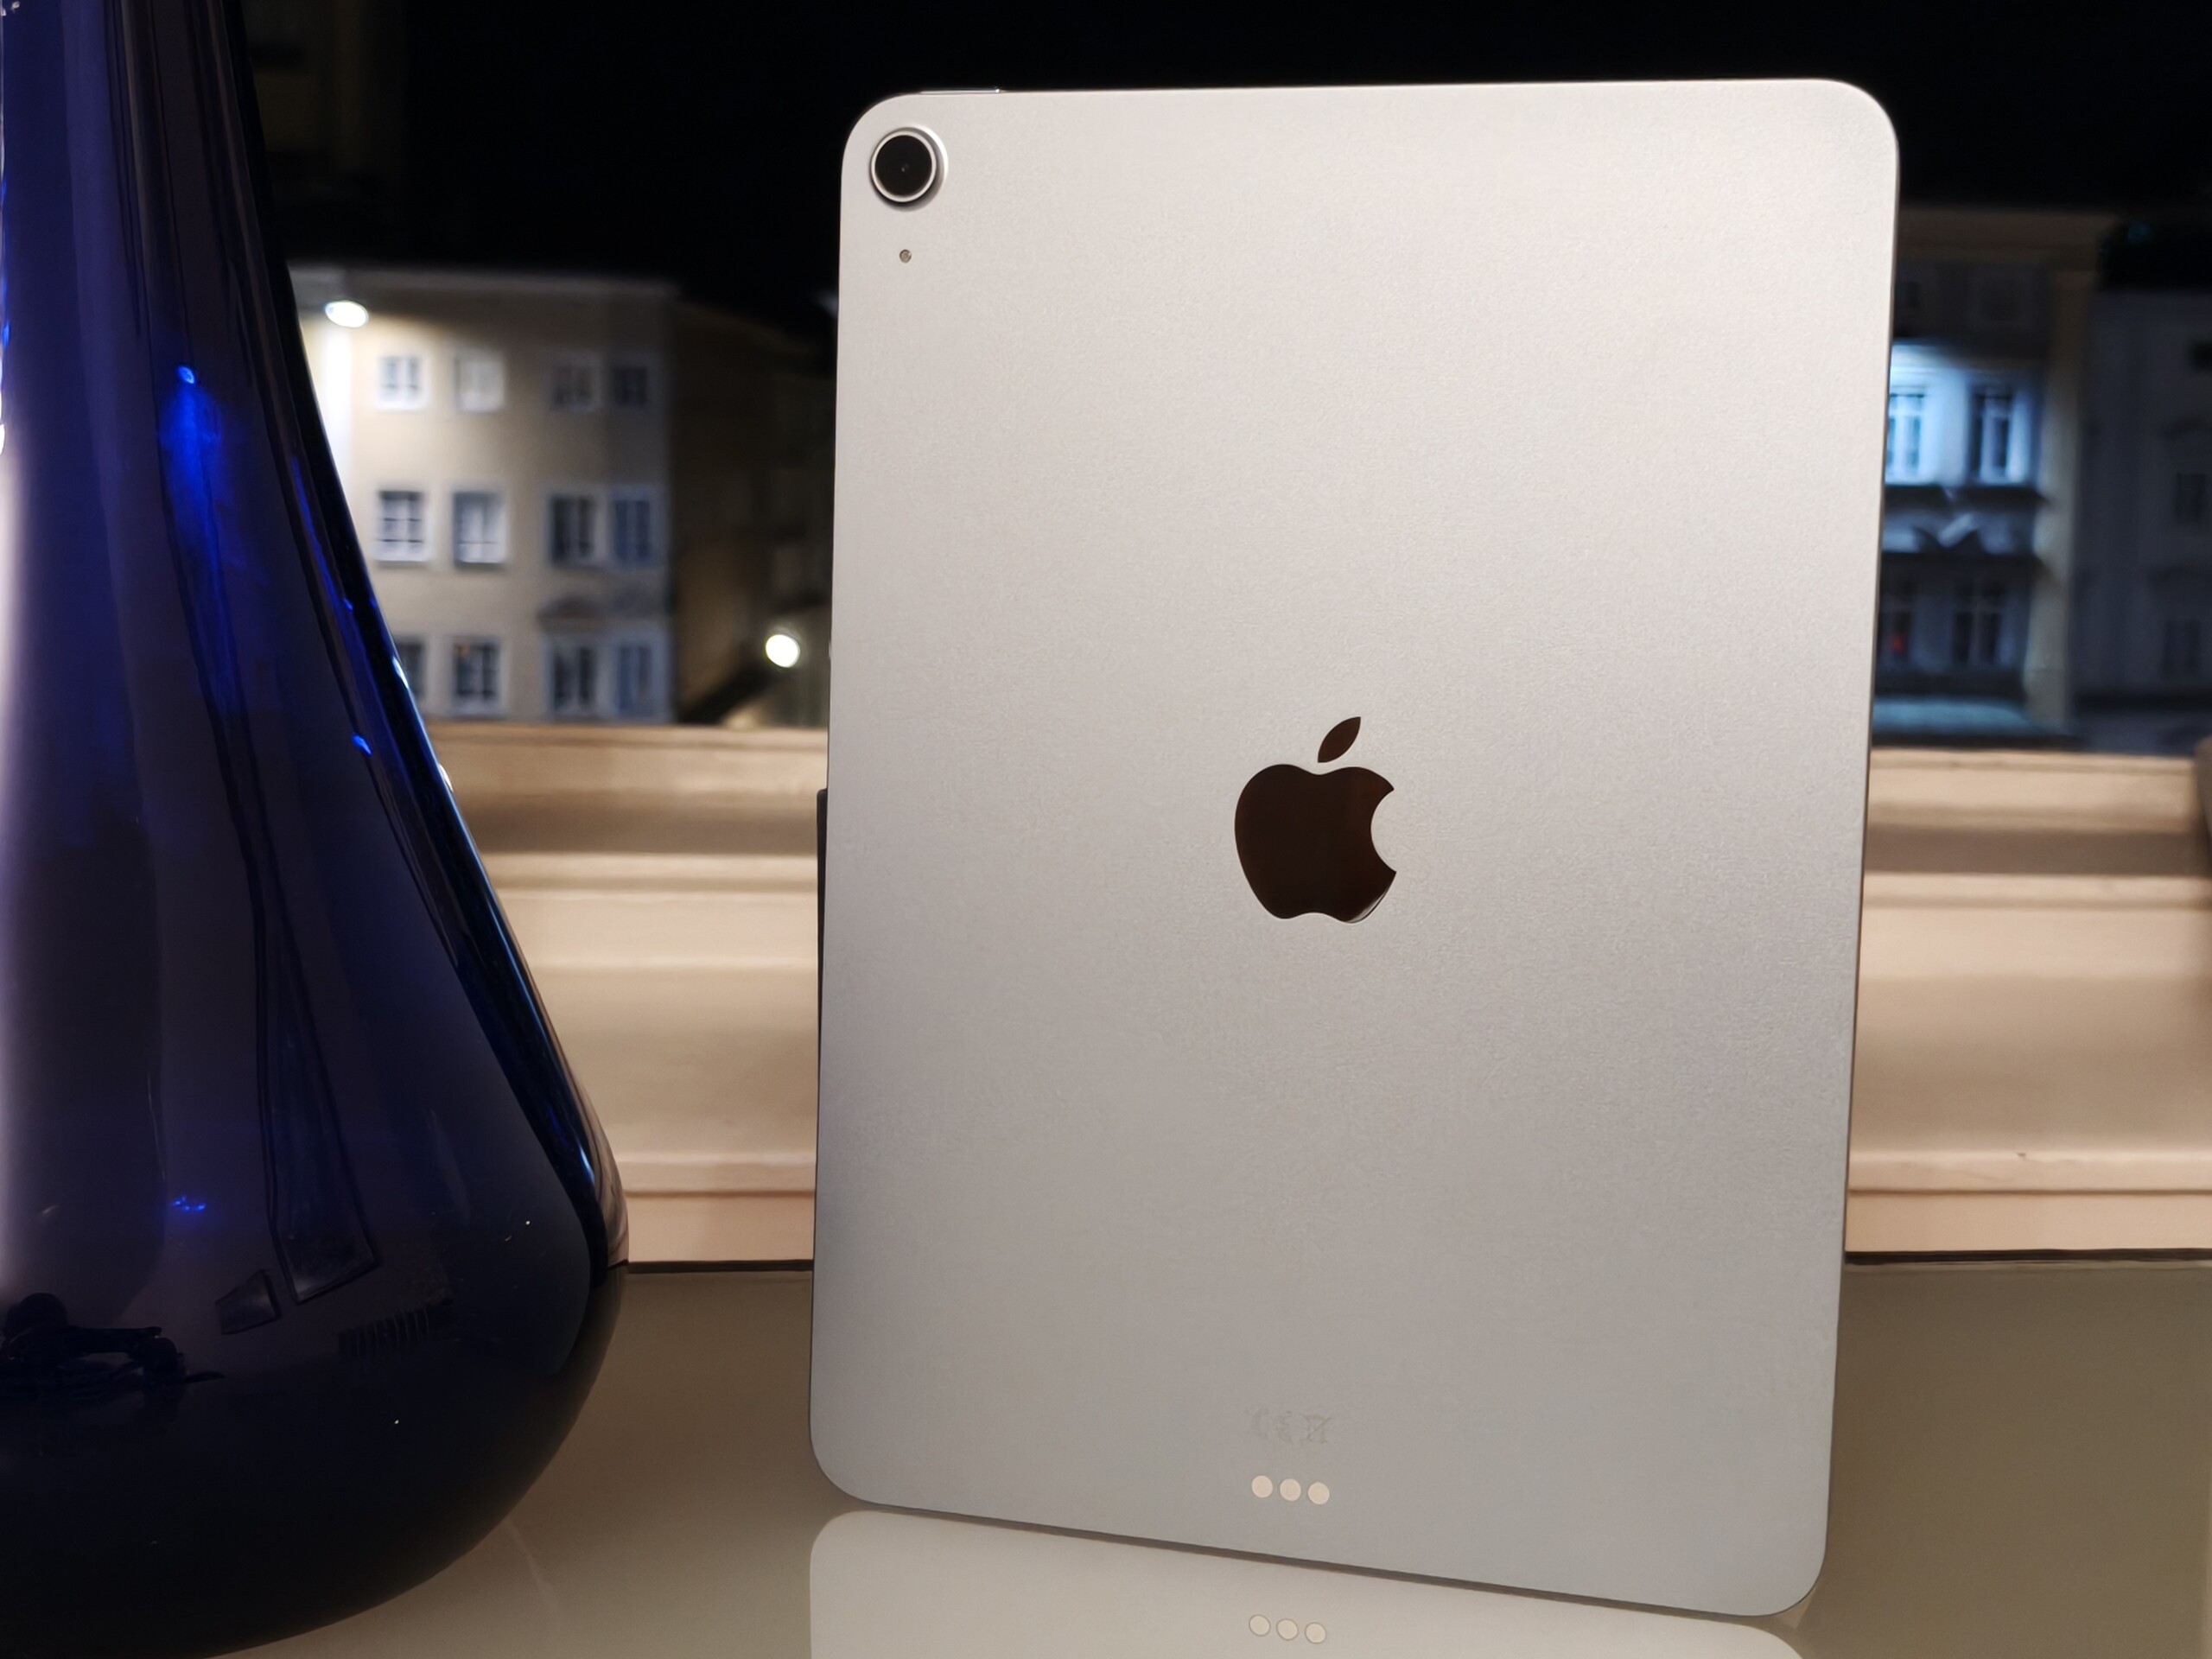
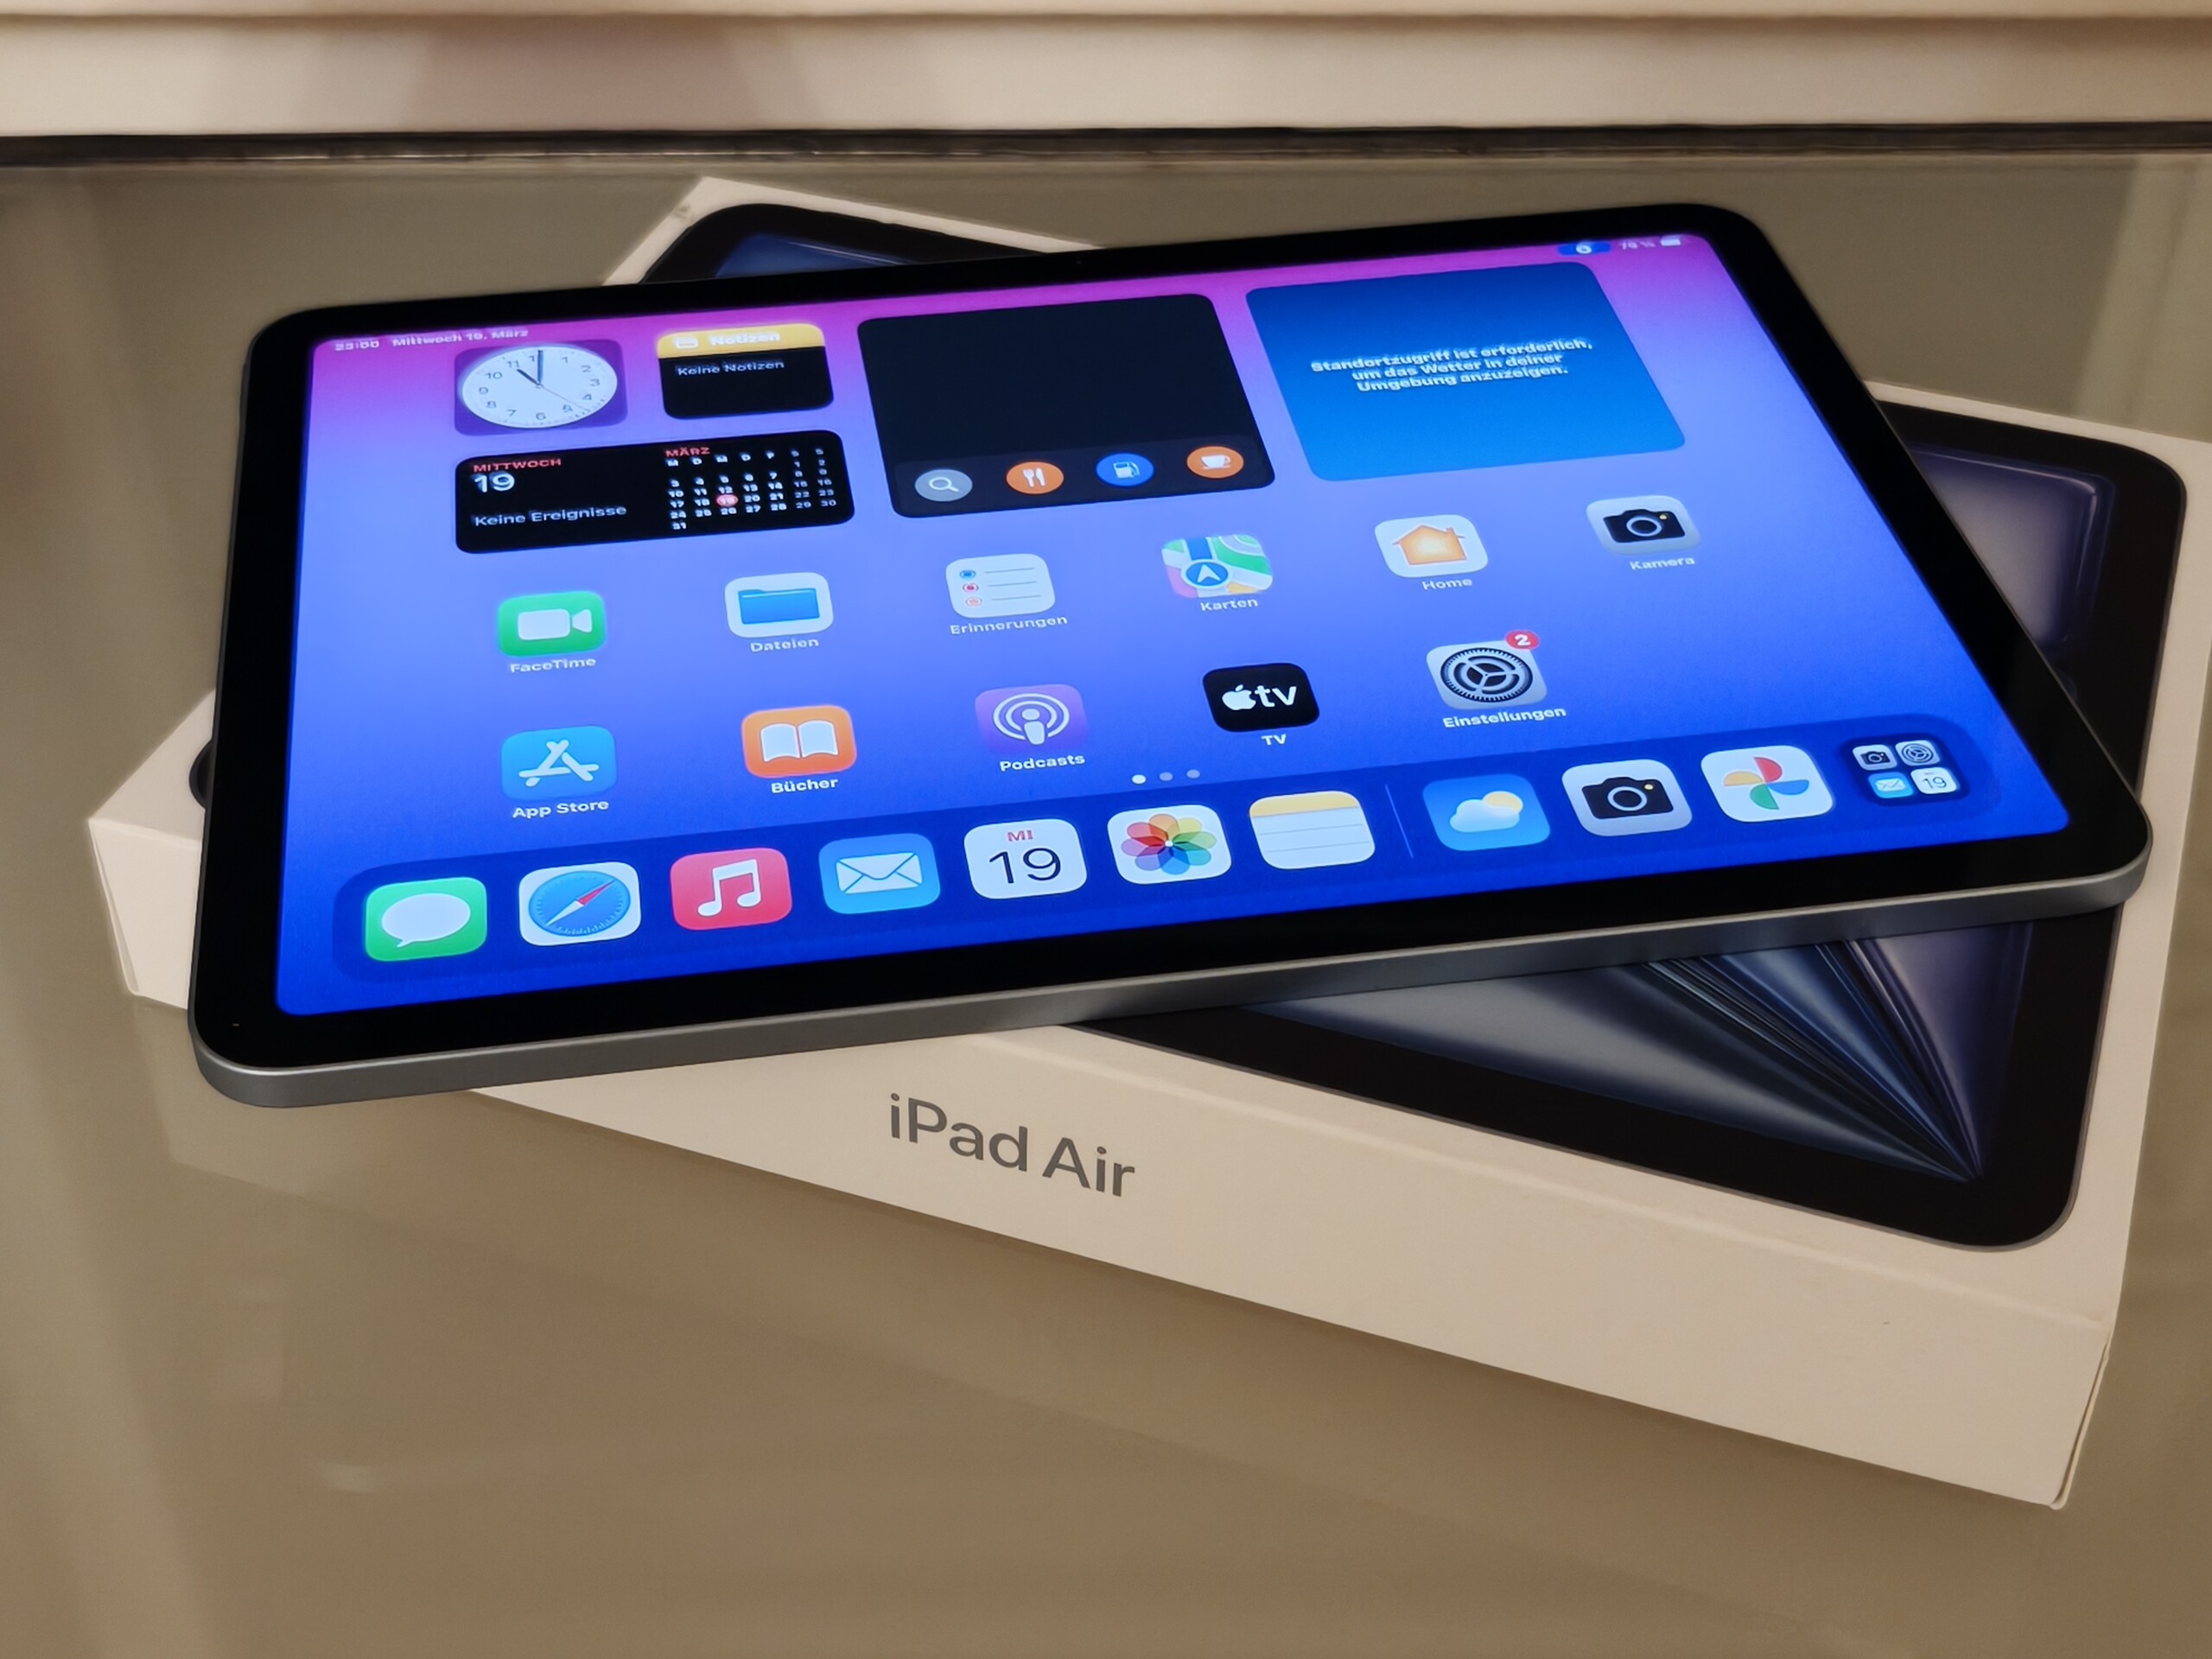
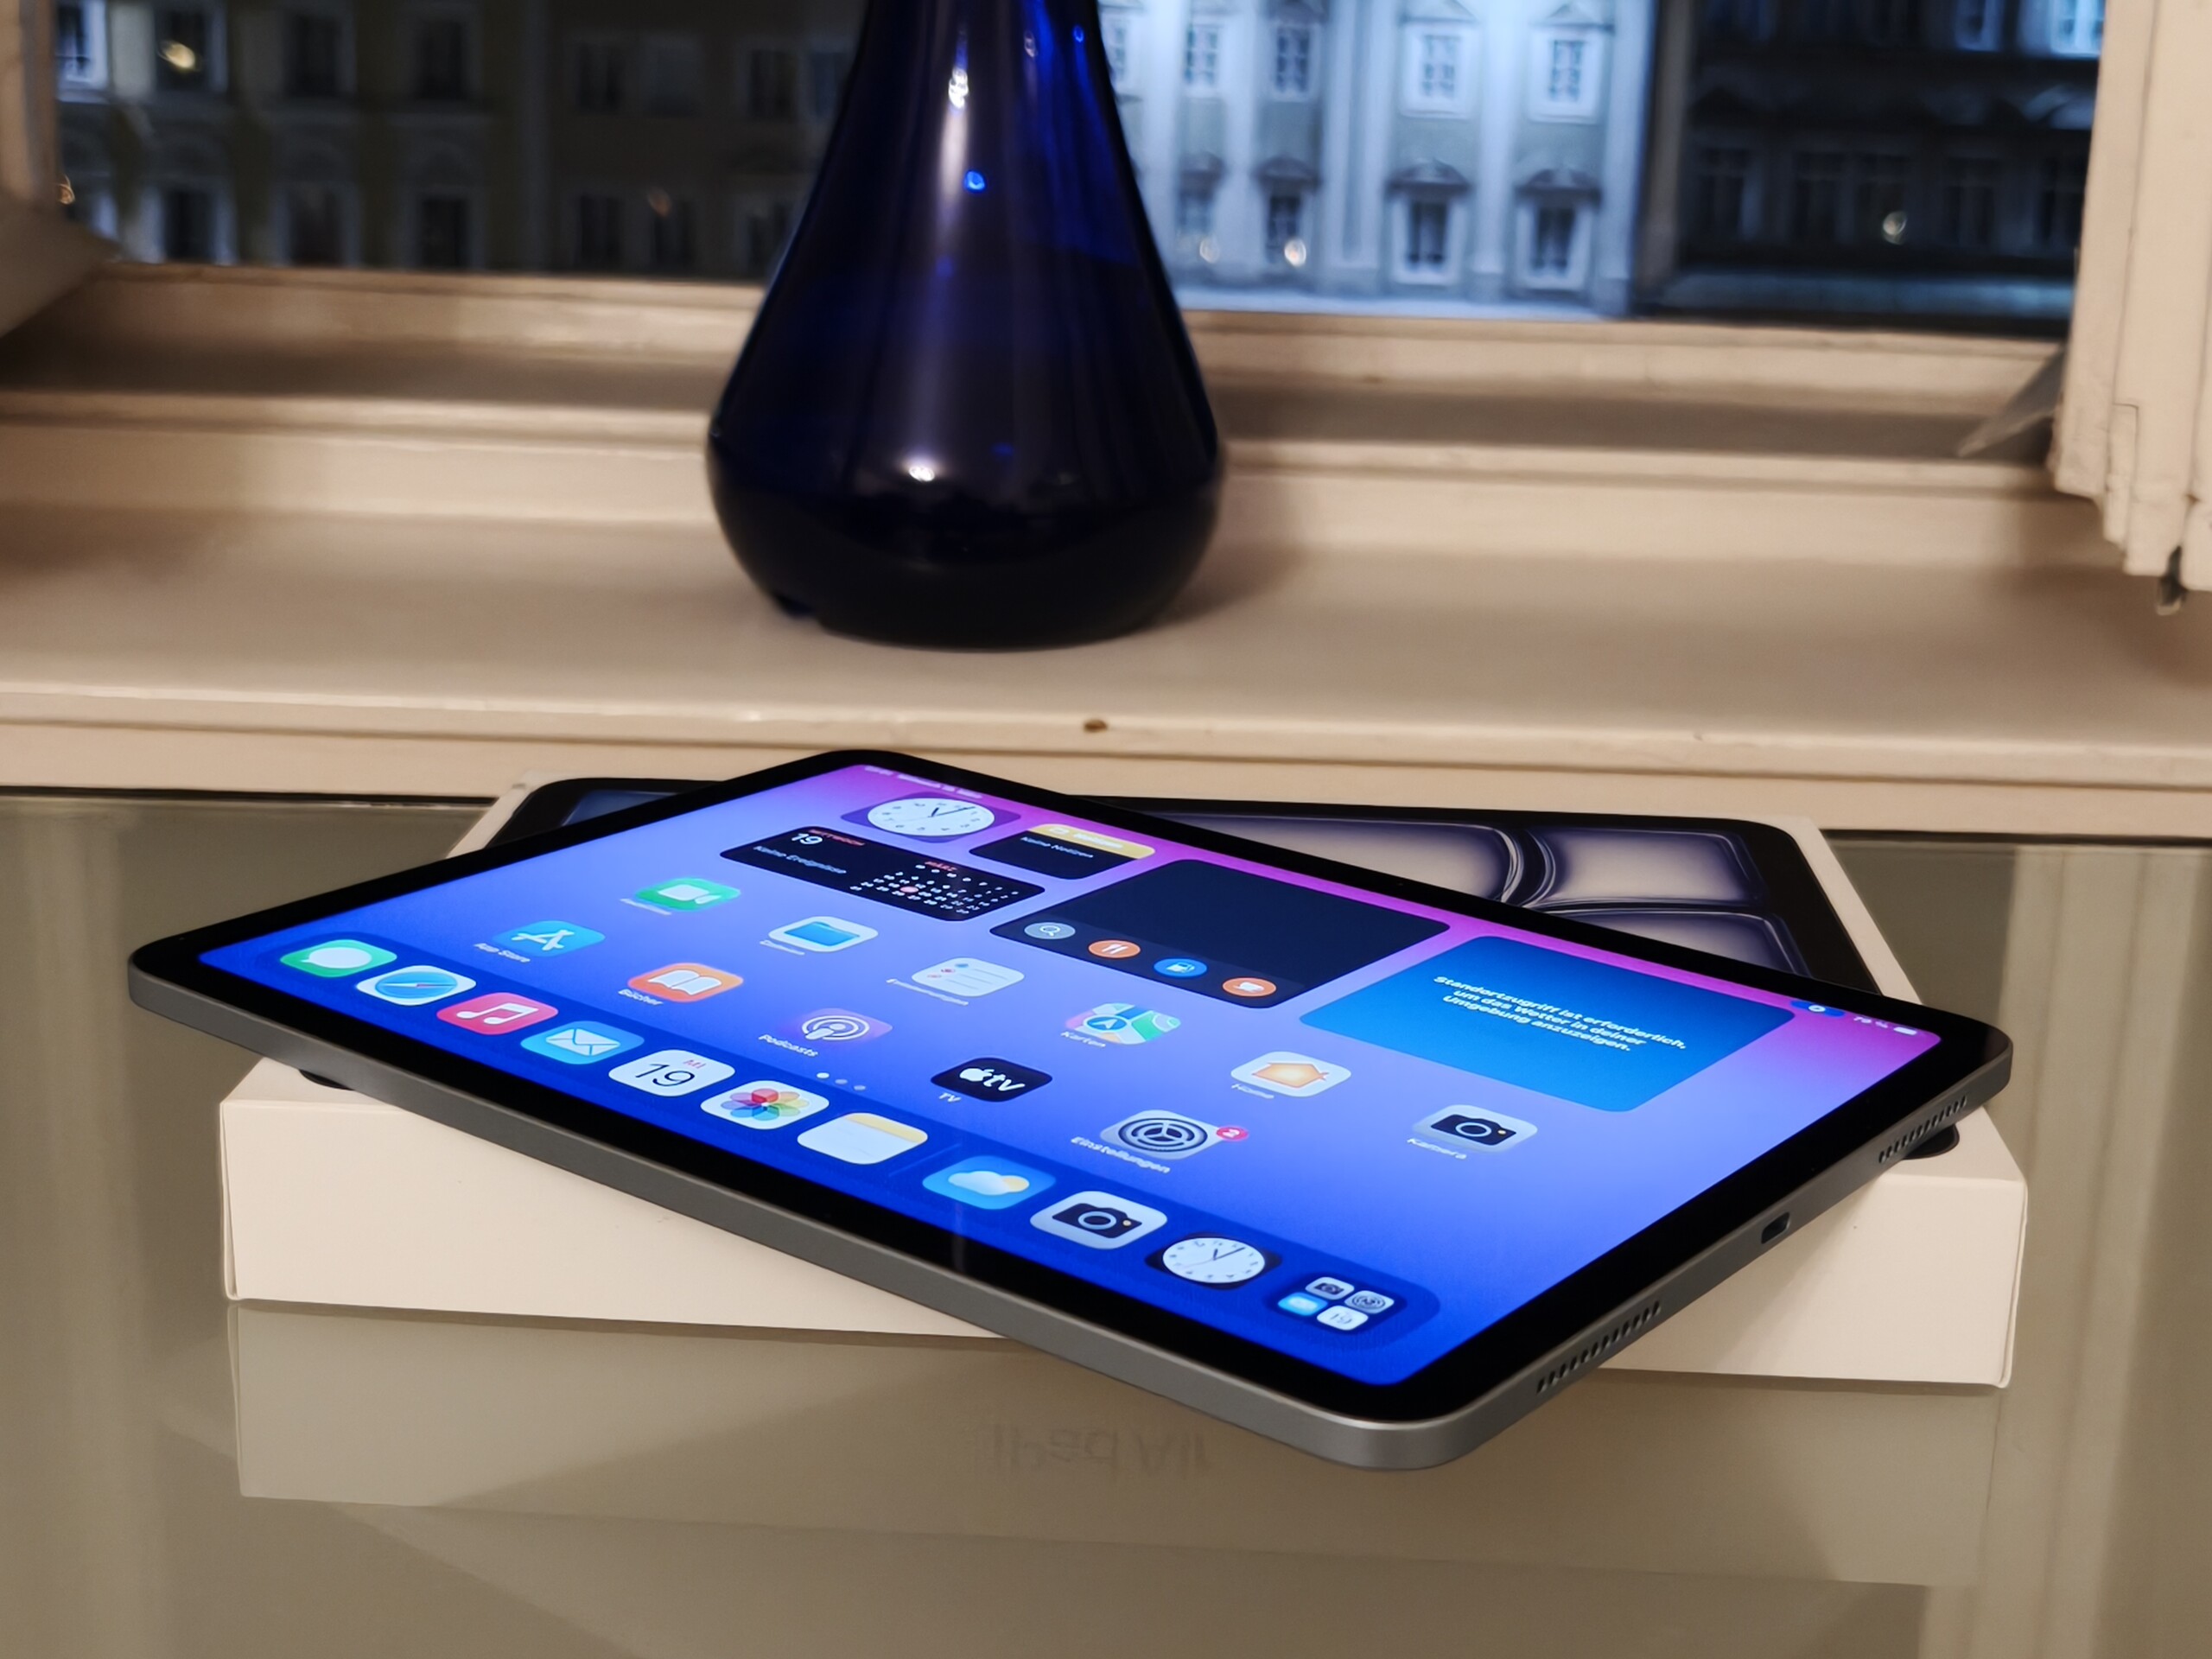
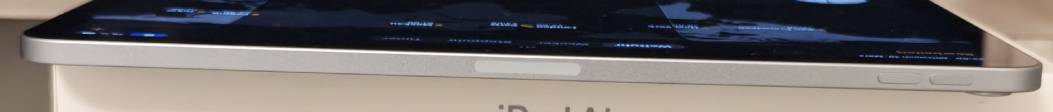
关于Apple 的制造质量和制造商选用的材料,我们几乎没有什么可说的了:11 英寸 iPad Air 2025 也采用了铝合金一体成型机身,手感极佳。
平板电脑的握持感很好,460 克的重量即使长时间使用也不会感觉太重。屏幕周围的边框不太宽,使正面看起来很现代,但也能有效防止你意外启动触摸屏。即便如此,iPad Apple iPad Air 13 (2025)在这方面显得更加时尚,因为它的边缘同样宽,但屏幕面积更大。
可选颜色包括柔和的粉色系,因此这款平板电脑能很好地融入任何环境。对该设备来说,溅上几滴水通常不成问题,但与所有 iPad 一样,iPad Air 11 (2025) 一般不具备防水或防尘保护功能。

连接性 - iPad Air 11 的存储空间有多大?
11 英寸机型的价格比 iPad Air 13(2025 年).与前代机型相比,价格没有变化:
- 8GB RAM、128GB ROM:599 美元(WiFi)/749 美元(WiFi + 移动电话)
- 8 GB RAM,256 GB ROM:699 美元(WiFi)/849 美元(WiFi + 蜂窝网络连接)
- 8 GB RAM,512 GB ROM:899 美元(WiFi)/1049 美元(WiFi + 蜂窝电话)
- 8 GB RAM,1 TB ROM:1,099 美元(WiFi)/1,249 美元(WiFi + Cellular)
正如你所看到的,iPad 的大容量存储设备的更新费用仍然高得不成比例。
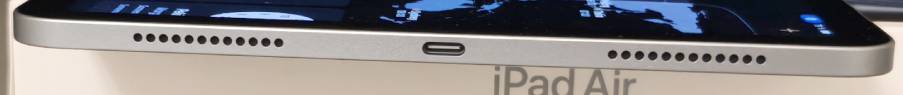
Apple iPad 配备了快速 USB 端口,数据传输速率高达 10 GBit/s。它还能以 60Hz 的帧频输出分辨率高达 6,016 x 3,384 像素的屏幕信号。
提供 NFC 功能,但仍只能将Apple Pay 用作移动支付服务。


软件 - 首次试用Apple Intelligence
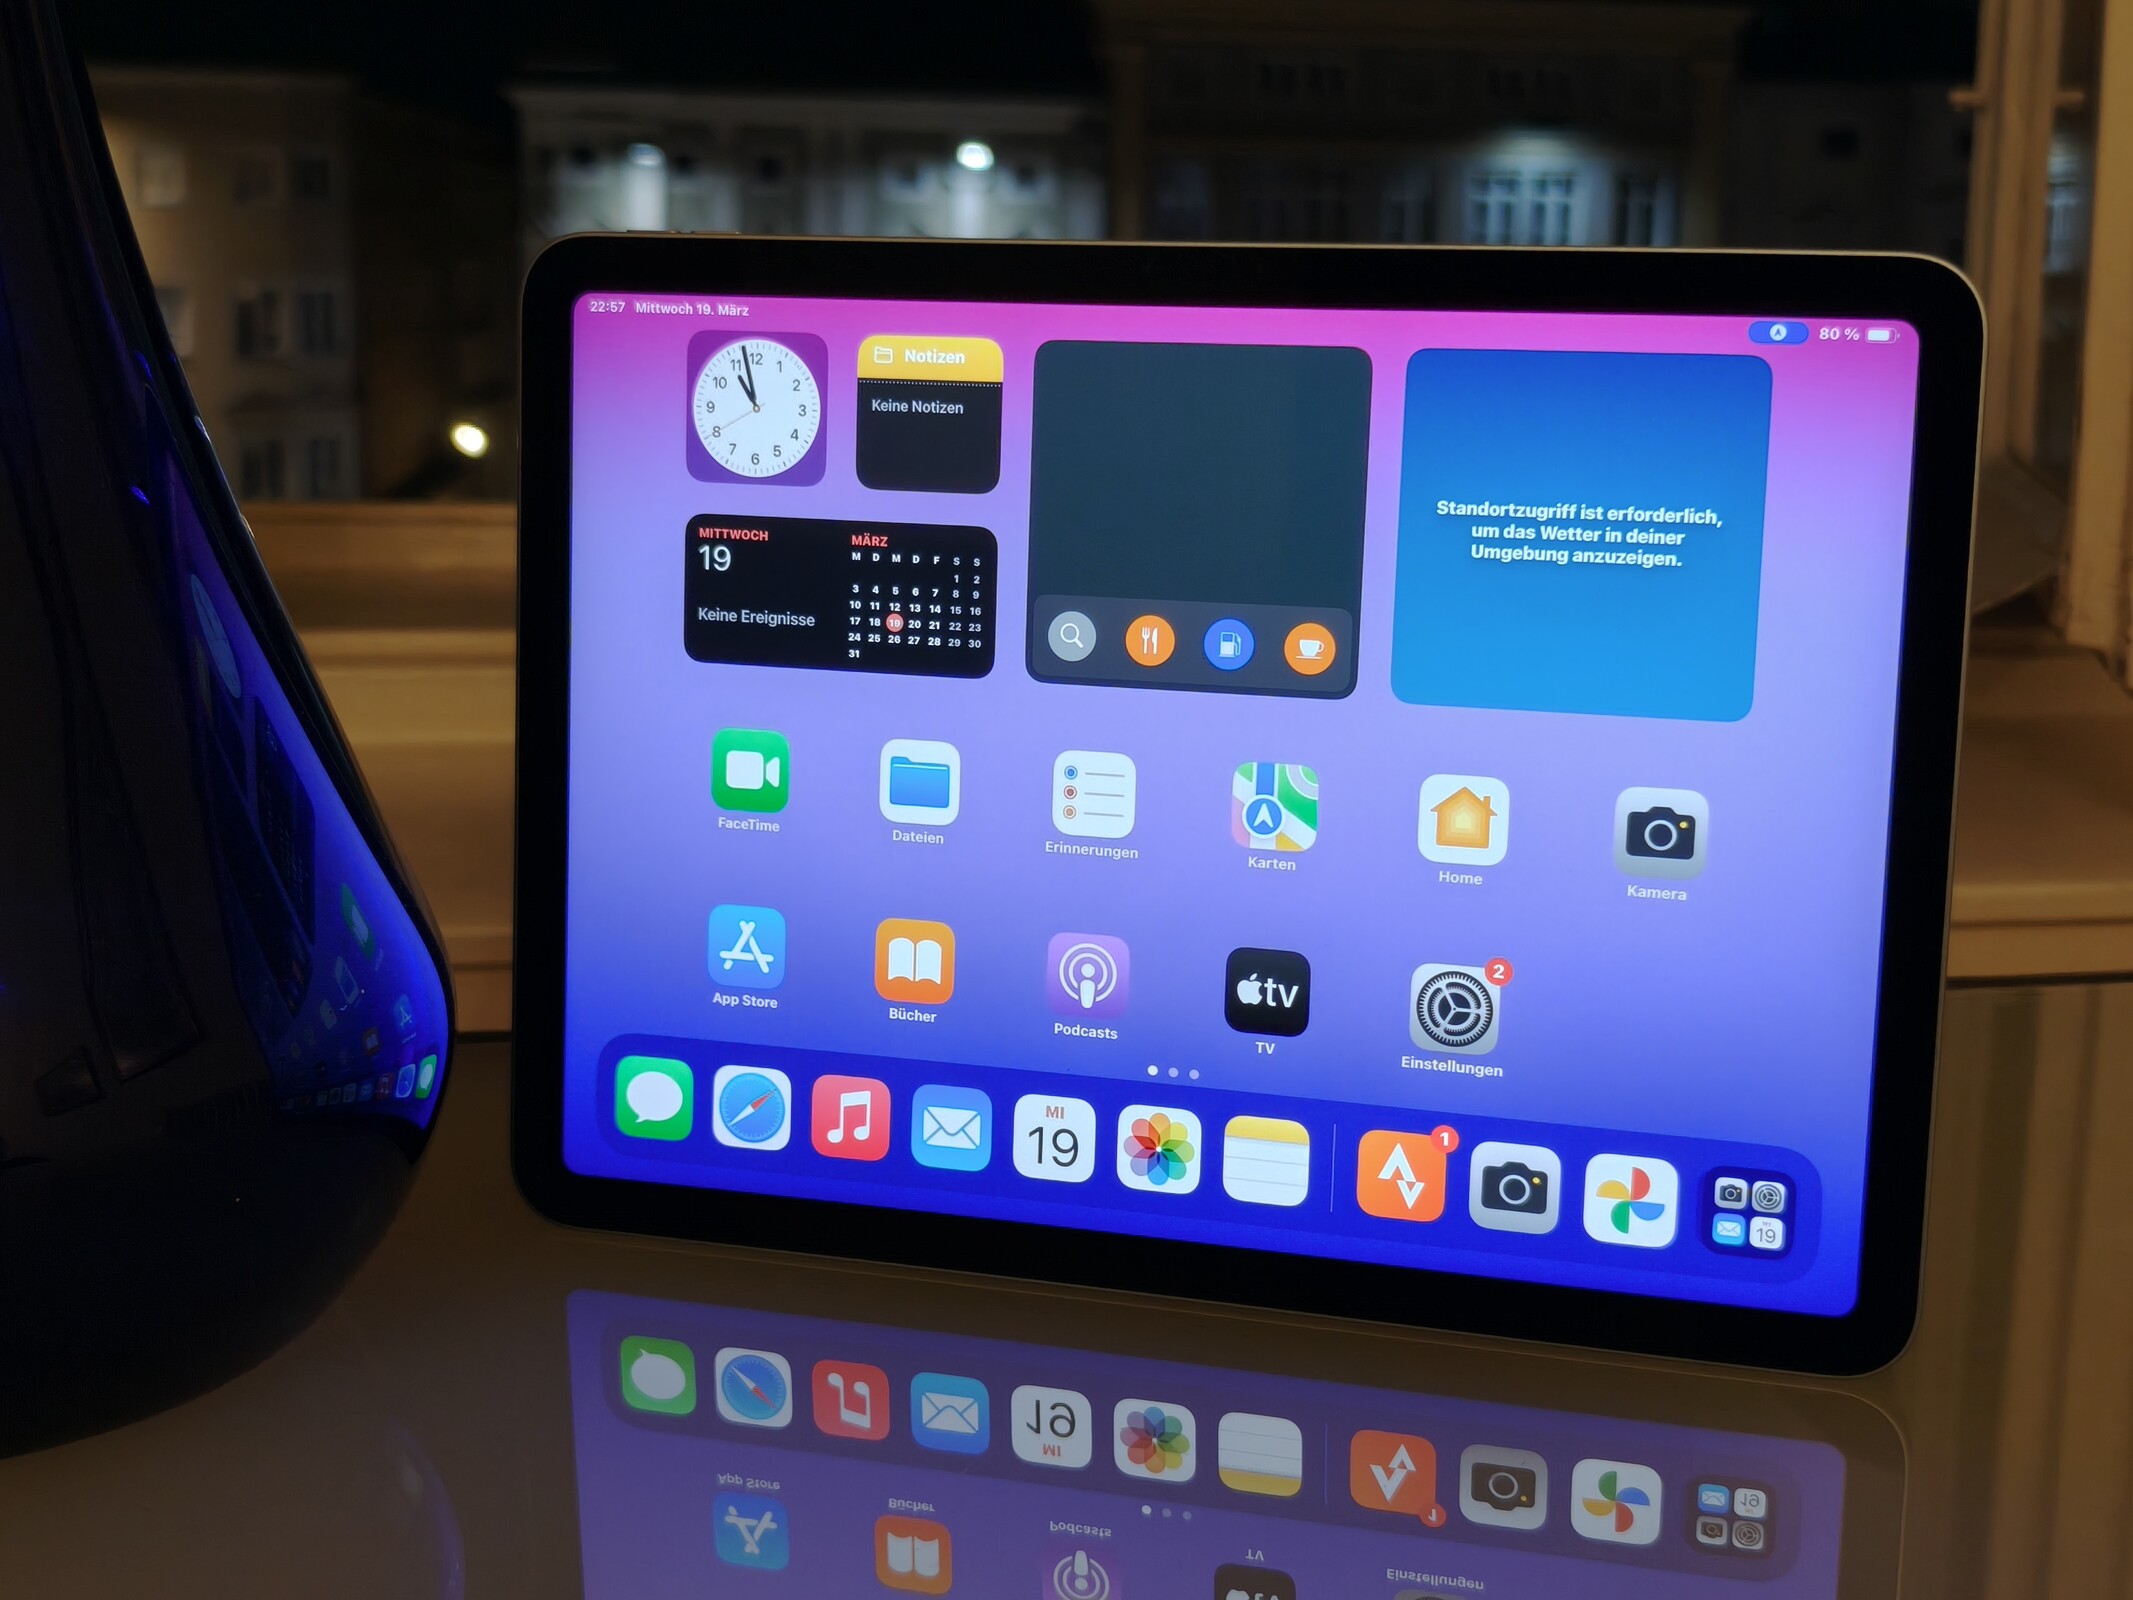
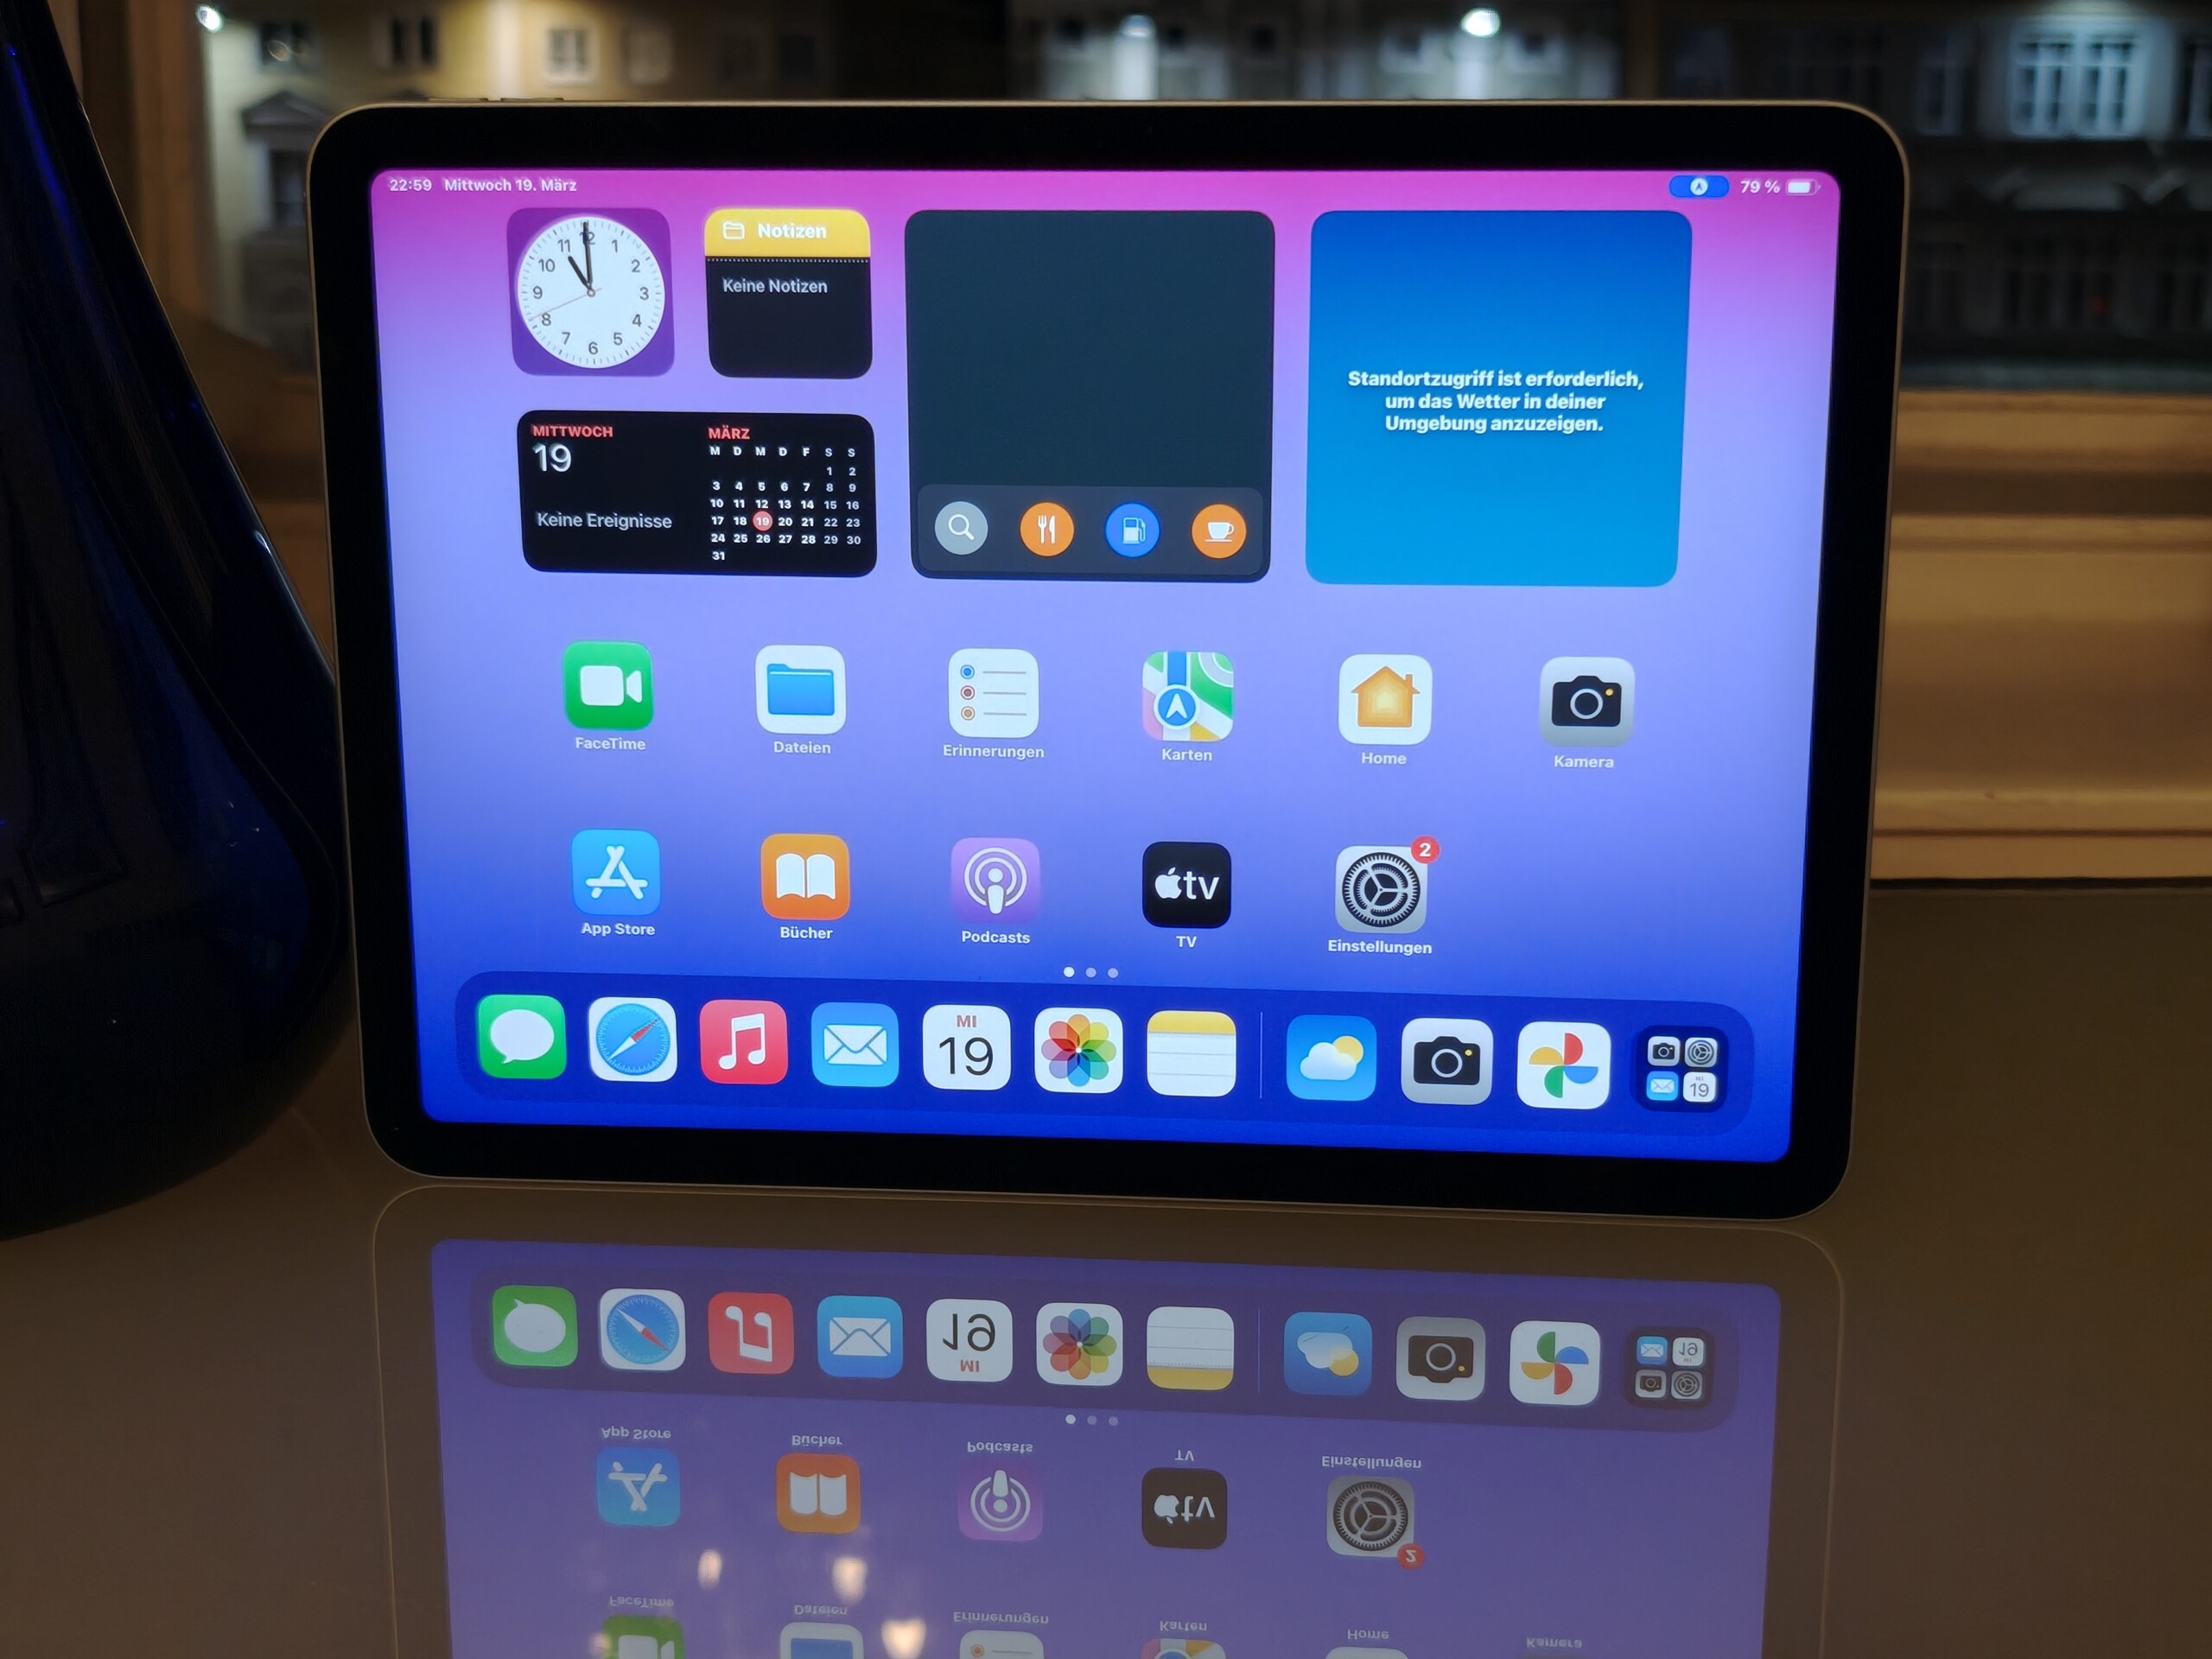
在我们的测试过程中,这款平板电脑更新到了 iPadOS 18.4,尤其是带来了一项期待已久的创新:在欧洲激活了Apple 智能功能。现在,你可以直接在 iPad Air 11 上校对或重写文本,生成图像,从人脸创建表情符号,然后将它们插入到信息中,最重要的是,Siri 经过了修改,现在感觉更像一个真正的现代人工智能助手。
Apple iPad Air 11 非常重视数据保护,并强调它的许多人工智能流程都是在设备上进行的,当某些内容被传输到服务器并在那里进行处理时,应该进行端到端加密。这也是一个好的方面:目前很多功能都是免费提供的,只有集成的 ChatGPT(也可以关闭)限制了不付费订阅的日常使用。
Apple 官方并未说明 iPad Air 的新软件版本将在多长时间内推出。不过,iPadOS 18 仍支持 6 年机龄的设备,因此我们可以认为支持时间会很长。
可持续性
Apple 在可持续发展方面做出了巨大贡献。例如,产品在使用寿命内的二氧化碳排放量都有精确的规定,以帮助您比较不同的产品:在这种情况下,最小存储配置的二氧化碳排放量为 76 千克。有关该产品的 综合环境报告https://www.apple.com/environment/pdf/products/ipad/iPad_Air_11_and_13_inch_M3_PER_MAR2025.pdf有关该产品的全面环境报告也可在Apple 网站上查阅。
生产商在平板电脑的外壳上只使用可回收利用的铝材,而且许多其他矿物质现在也可回收利用。
此外,Apple 还拥有自己的网站,可以自行维修,也可以订购备件。不过,iPad 还无法做到这一点。
通信和全球导航卫星系统 - iPad Air 11 配备 WiFi 6E
WiFi 6E 再次成为Apple 配备 11 英寸屏幕的 iPad Air 所支持的最快 WiFi 网络标准。它提供对 6 GHz 频段的访问。
在使用华硕 ROG Rapture AXE11000 参考路由器进行的测试中,我们的测试设备下载速度高达 1,554 MBit/s,上传速度超过 1,100 MBit/s。因此,它可以充分利用大多数互联网线路。在我们的测试过程中,传输速率出现了轻微的下降,而且还反复出现。但总的来说,它的数据传输速率相当稳定。
我们测试的是纯 WLAN 机型,但也有支持 5G 的平板电脑。但在这种情况下,它只支持 eSIM 卡;iPad Air 没有实体 SIM 卡插槽。我们的测试设备无法通过卫星定位,只能通过已知的 Wi-Fi 网络确定大致位置。精确定位,包括用于导航的精确定位,是 5G 机型的专利。
| Networking | |
| iperf3 transmit AXE11000 | |
| Huawei MatePad 12 X | |
| Xiaomi Pad 7 Pro | |
| Average Wi-Fi 6E (227 - 1810, n=57) | |
| Average of class Tablet (10.5 - 1463, n=84, last 2 years) | |
| iperf3 receive AXE11000 | |
| Average Wi-Fi 6E (442 - 1787, n=57) | |
| Xiaomi Pad 7 Pro | |
| Huawei MatePad 12 X | |
| Average of class Tablet (20.1 - 1705, n=84, last 2 years) | |
| iperf3 transmit AXE11000 6GHz | |
| Average Wi-Fi 6E (229 - 1845, n=61) | |
| Average of class Tablet (578 - 1888, n=19, last 2 years) | |
| Apple iPad Air 11 2025 | |
| OnePlus Pad 2 | |
| Apple iPad Air 11 2024 | |
| iperf3 receive AXE11000 6GHz | |
| OnePlus Pad 2 | |
| Apple iPad Air 11 2025 | |
| Average of class Tablet (960 - 1842, n=19, last 2 years) | |
| Average Wi-Fi 6E (598 - 1844, n=61) | |
| Apple iPad Air 11 2024 | |
摄像头 - 出色的平板电脑摄像头
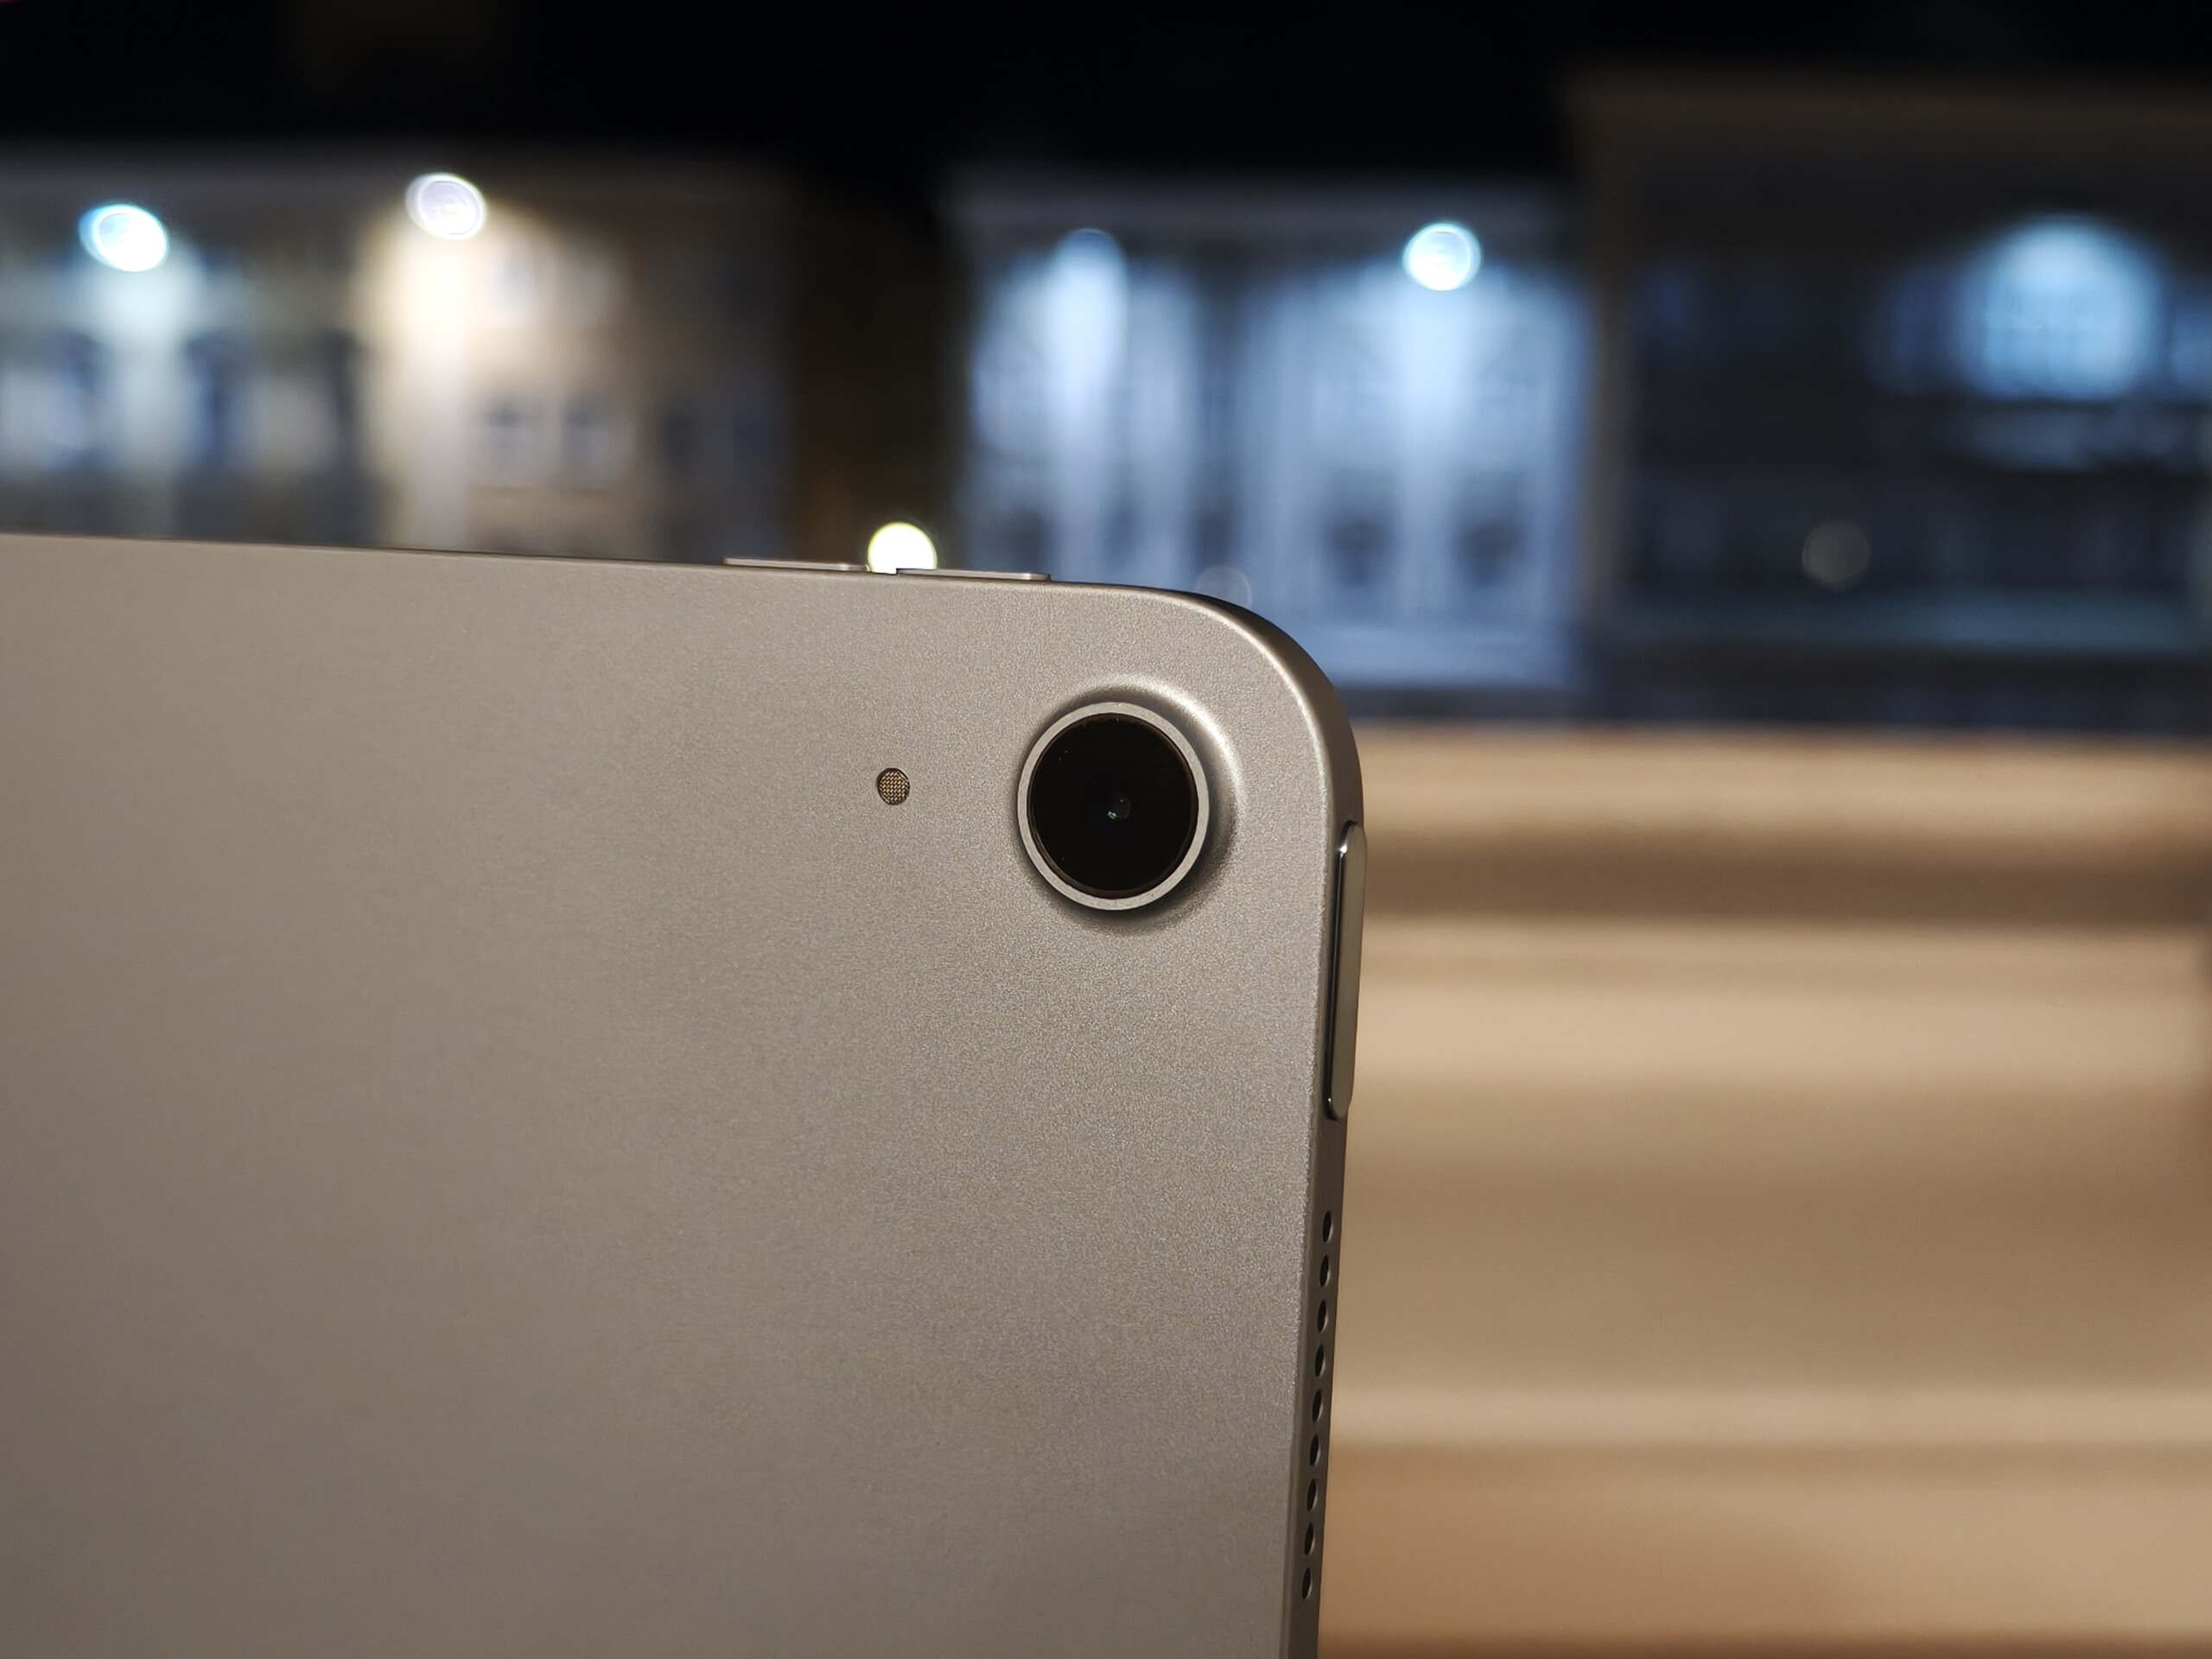
iPad Air 11(2025)的摄像头功能保持不变:前后均配备 1200 万像素摄像头。
乍一看,与上一代产品相比几乎没有什么明显的区别:对焦物体看起来很自然,但人工虚化效果略有误差。在细节方面,该摄像头无法与顶级智能手机相媲美,因为后者的细节和清晰度更高。即便如此,iPad 的图像质量对于平板电脑来说仍然非常出色。
在弱光环境下,它的弱点会变得更加明显:暗区的亮度不够,在我们的测试实验室中,当照度为 1 lux 时,细节已无法辨认。
您可以每秒 60 帧的速度录制 4K 视频。快速而不突兀的自动对焦以及视频的清晰度都令人印象深刻。
前置摄像头的自拍效果不错,只有仔细观察才会发现其清晰度一般。
Image Comparison
Choose a scene and navigate within the first image. One click changes the position on touchscreens. One click on the zoomed-in image opens the original in a new window. The first image shows the scaled photograph of the test device.
Main camera plantMain camera surroundingsMain camera low light


配件和保修 - 改进的 iPad 配件
iPad Air 11 仅随附一条 USB 数据线,不含其他配件。如果你需要充电器,需要单独购买。
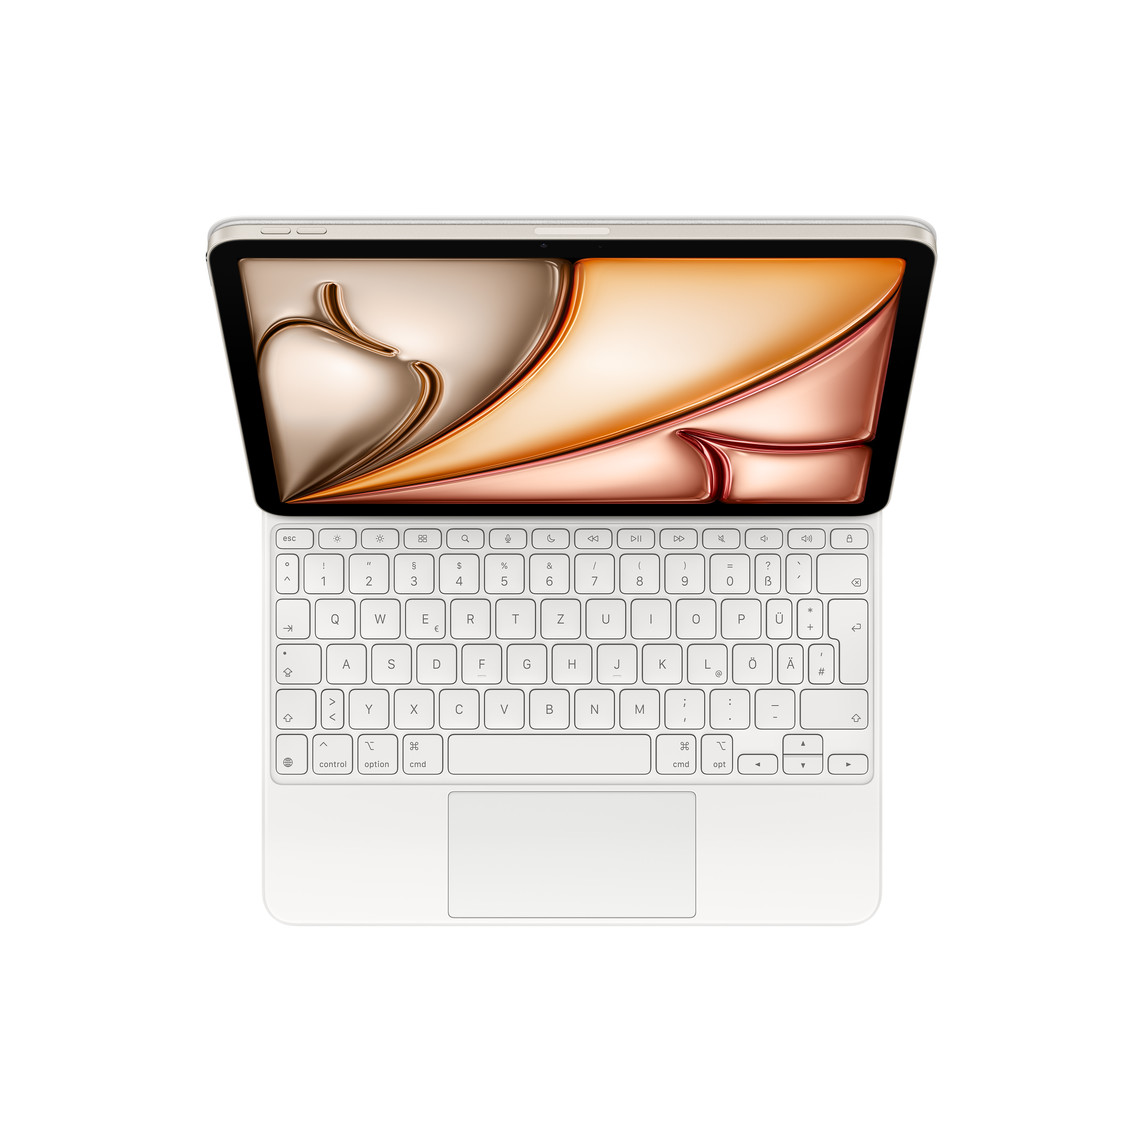
改进版 Magic Keyboard 的售价为 269 美元,可通过磁力吸附在 iPad Air 11 上,并自带 USB-C 端口。它有 14 个新功能键,用于控制媒体和显示屏亮度。
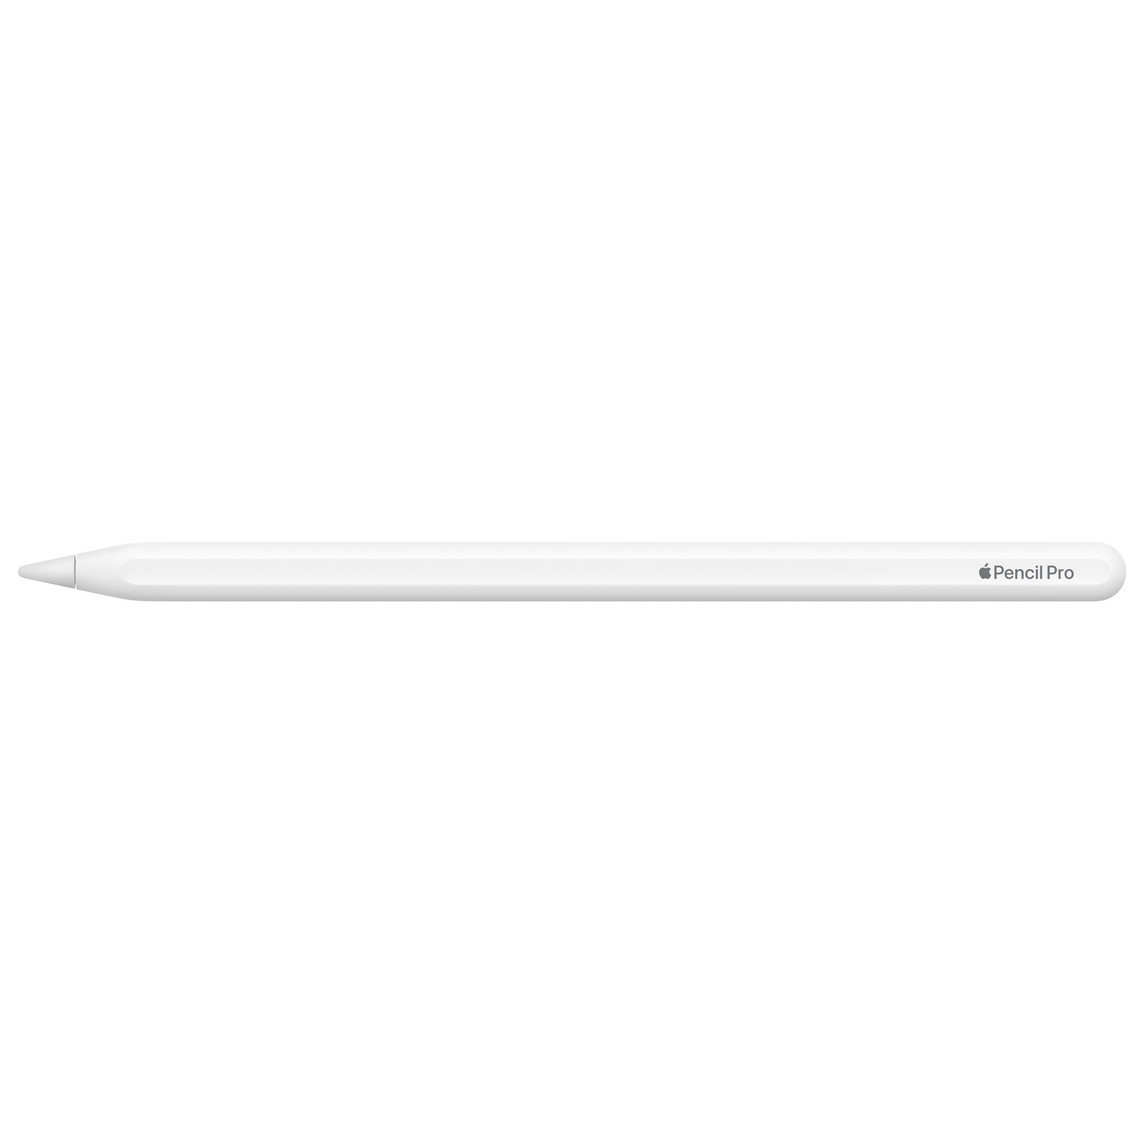
用户可以继续使用Apple Pencil 或Apple Pencil Pro,两者都可以通过磁力吸附到设备上。
Apple 平板电脑的保修期为一年。要获得更全面的保护,可以购买 AppleCare+,每月 3.99 美元或每年 39.99 美元,直至取消。该套餐涵盖无限次数的意外损坏,每次索赔有小额免赔额。
输入设备和操作 - 仍配备 60 赫兹显示屏
iPad Air 11(2025)配备了精确的触摸屏,边边角角都反应灵敏。不过,Apple ,再次采用了 60 Hz 显示屏,这意味着其他刷新率更高的平板电脑在输入时有时会显得更流畅。
iPad Air 的待机键上集成了可靠的指纹传感器,而不是 Face ID。
显示屏 - 只有约 500 尼特
iPad Air 11(2025 英寸)与其 13 英寸的同类产品有明显区别 13 英寸机型11 英寸机型的分辨率略低,仅为 2,360 x 1,640 像素,但由于屏幕较小,像素密度与 13 英寸机型一样达到 265 PPI,因此显示效果非常清晰。
两款机型均采用最高刷新率为 60 Hz 的 IPS 屏幕,但 iPad Air 11 的屏幕纵横比为 3:2,与 iPad Air 13 相比,更适合文档显示,现代电影的宽边显示也更少。 iPad Air 13的 4:3 面板相比,它更适合于文档,在现代电影中显示的宽边也更少。
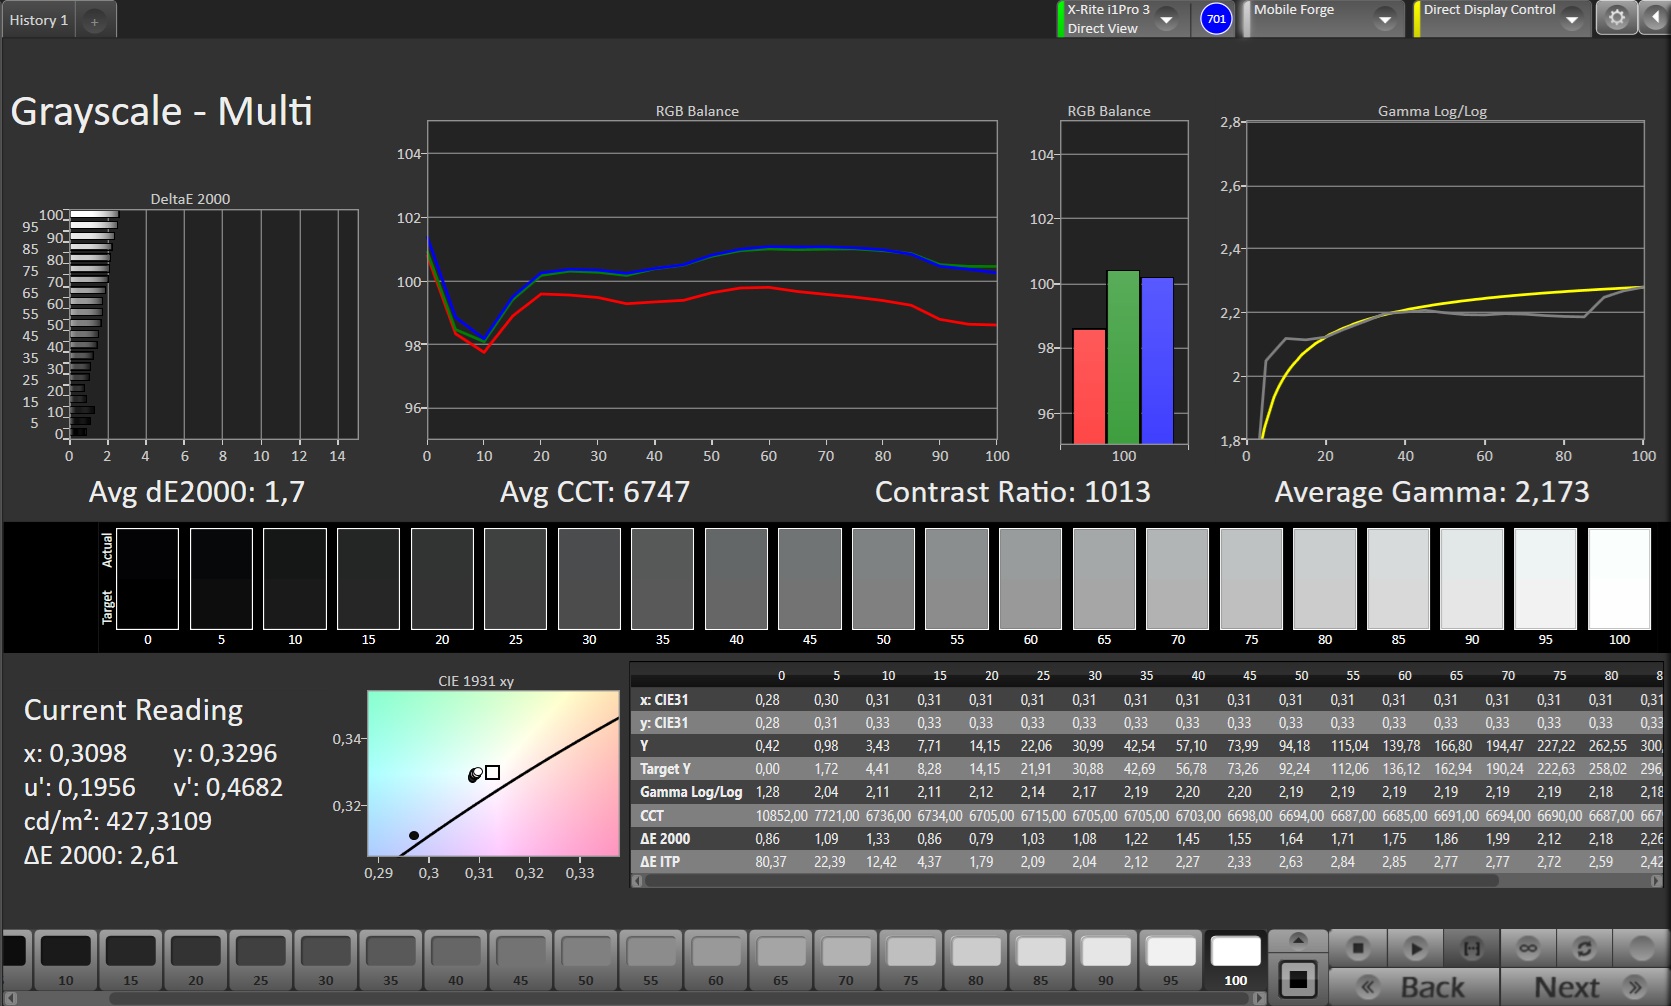
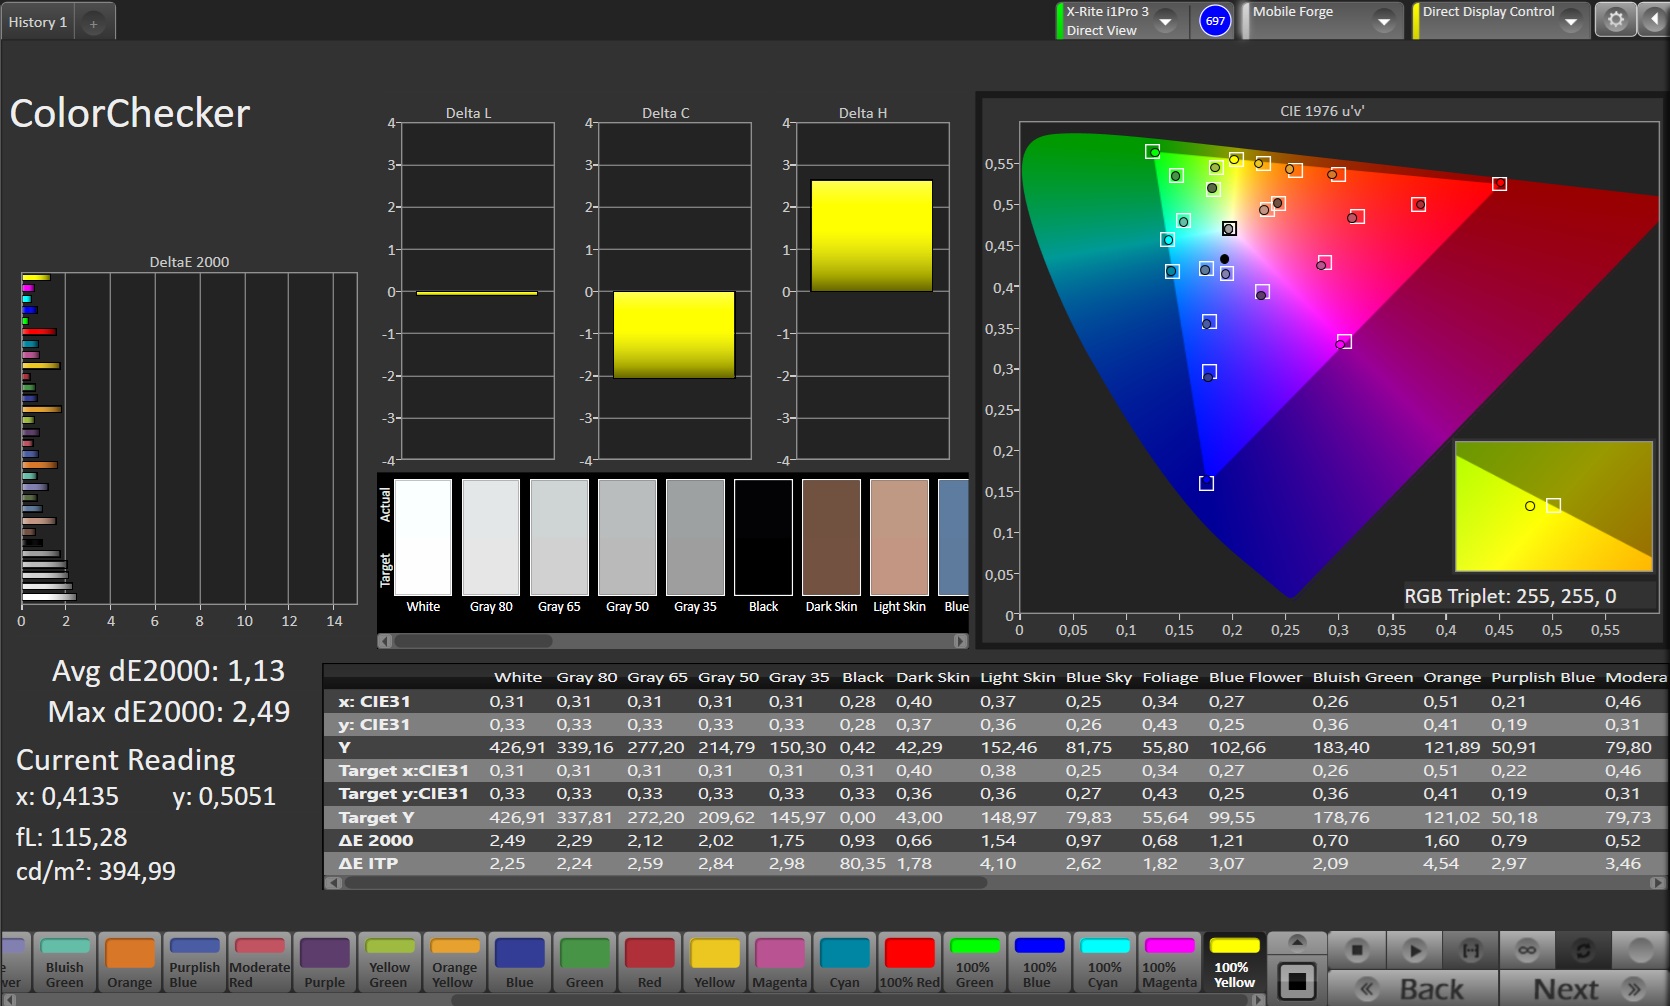
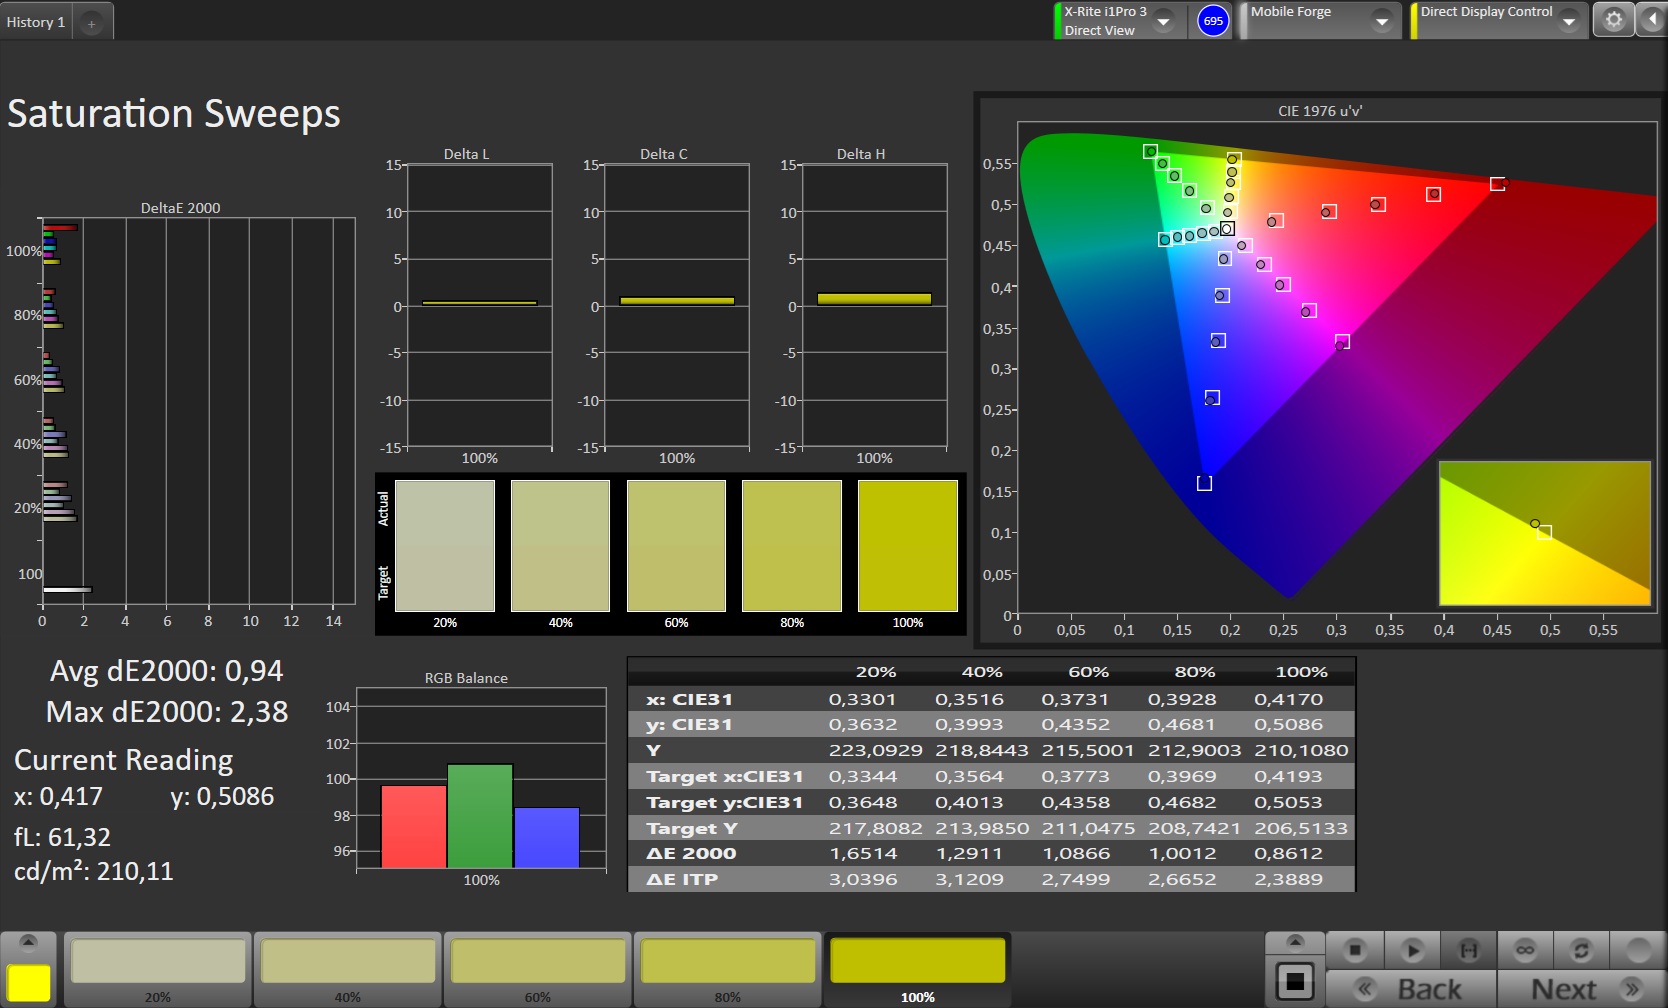
该显示屏不使用 PWM,但与 13 英寸机型相比,在亮度方面你不得不接受一些妥协:平均而言,我们注意到最大亮度低于 500 cd/m²,因此这款平板电脑主要适合在光线不太明亮的室内使用。
虽然支持 HDR 协议,但由于亮度相对较低,显示效果并不理想。
| |||||||||||||||||||||||||
Brightness Distribution: 93 %
Center on Battery: 508 cd/m²
Contrast: 1016:1 (Black: 0.5 cd/m²)
ΔE Color 1.13 | 0.5-29.43 Ø4.87
ΔE Greyscale 1.7 | 0.5-98 Ø5.1
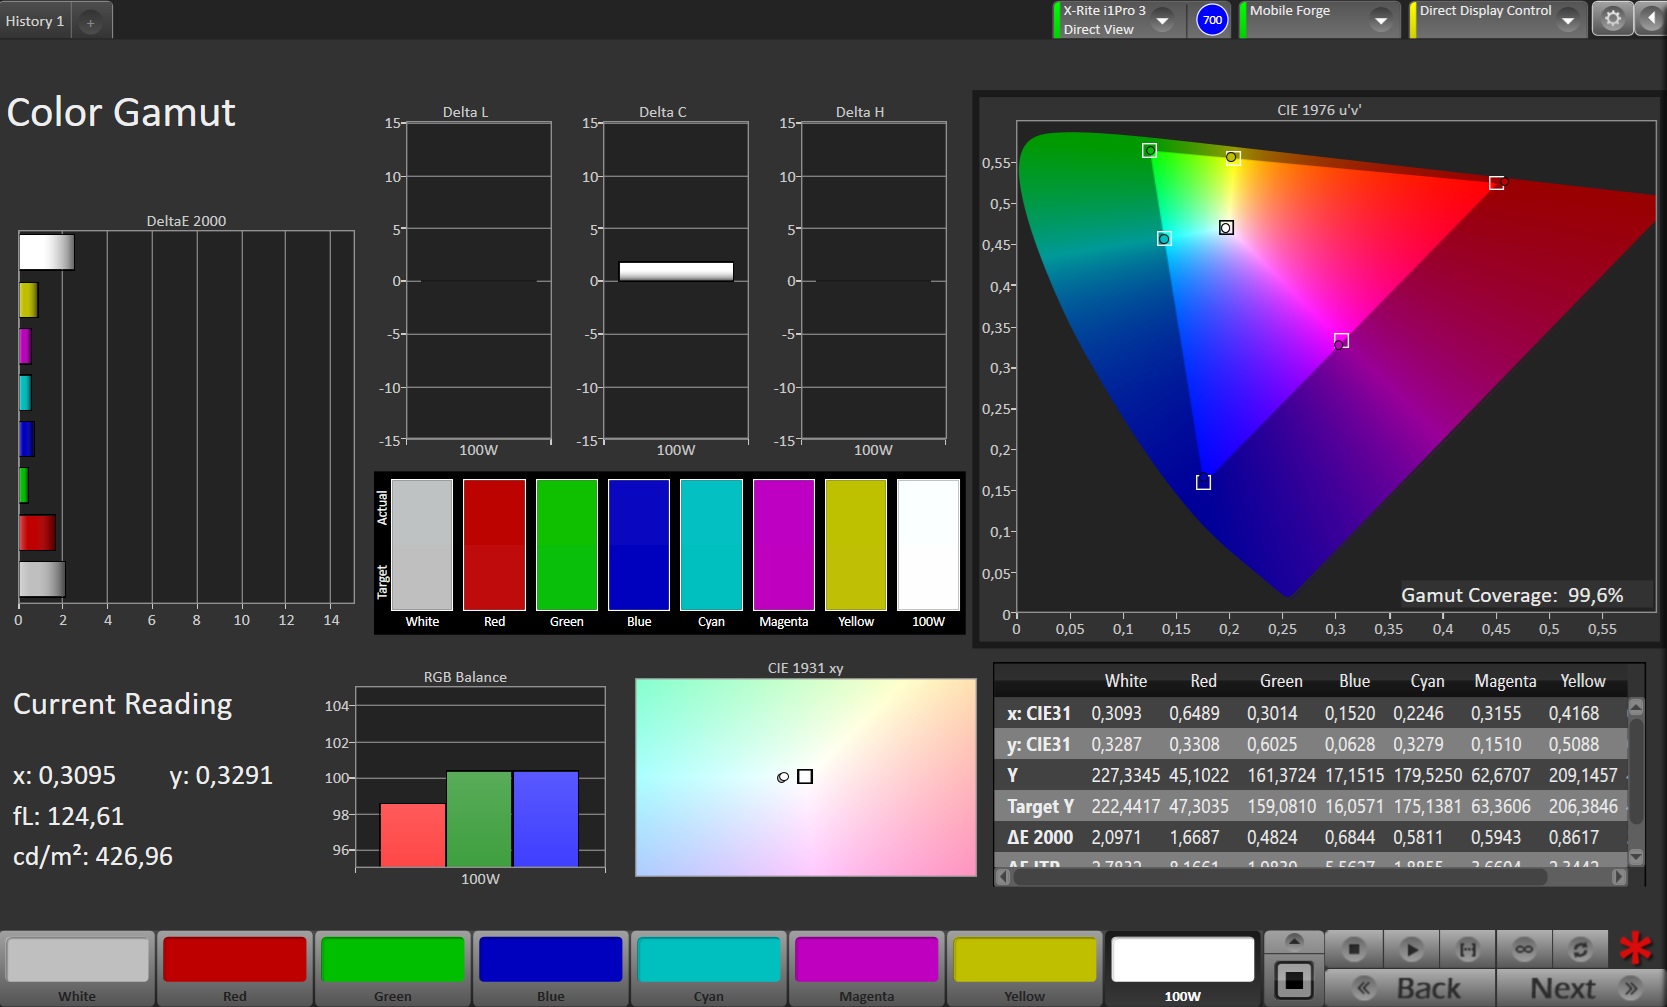
99.6% sRGB (Calman 2D)
Gamma: 2.173
| Apple iPad Air 11 2025 IPS, 2360x1640, 10.9" | Apple iPad Air 11 2024 IPS, 2360x1640, 10.9" | Xiaomi Pad 7 Pro IPS, 3200x2136, 11.2" | OnePlus Pad 2 IPS, 3000x2120, 12.1" | Huawei MatePad 12 X IPS, 2800x1840, 12" | |
|---|---|---|---|---|---|
| Screen | -7% | -7% | 1% | -80% | |
| Brightness middle | 508 | 506 0% | 776 53% | 833 64% | 1032 103% |
| Brightness | 497 | 474 -5% | 750 51% | 771 55% | 991 99% |
| Brightness Distribution | 93 | 87 -6% | 91 -2% | 84 -10% | 87 -6% |
| Black Level * | 0.5 | 0.4 20% | 0.58 -16% | 0.45 10% | 0.92 -84% |
| Contrast | 1016 | 1265 25% | 1338 32% | 1851 82% | 1122 10% |
| Colorchecker dE 2000 * | 1.13 | 1.48 -31% | 1.6 -42% | 1.79 -58% | 3.8 -236% |
| Colorchecker dE 2000 max. * | 2.49 | 3.12 -25% | 4.5 -81% | 4.01 -61% | 8.6 -245% |
| Greyscale dE 2000 * | 1.7 | 2.3 -35% | 2.5 -47% | 3 -76% | 6.5 -282% |
| Gamma | 2.173 101% | 2.204 100% | 2.23 99% | 2.254 98% | 2.18 101% |
| CCT | 6747 96% | 6954 93% | 6892 94% | 6419 101% | 7197 90% |
* ... smaller is better
Screen Flickering / PWM (Pulse-Width Modulation)
| Screen flickering / PWM not detected | 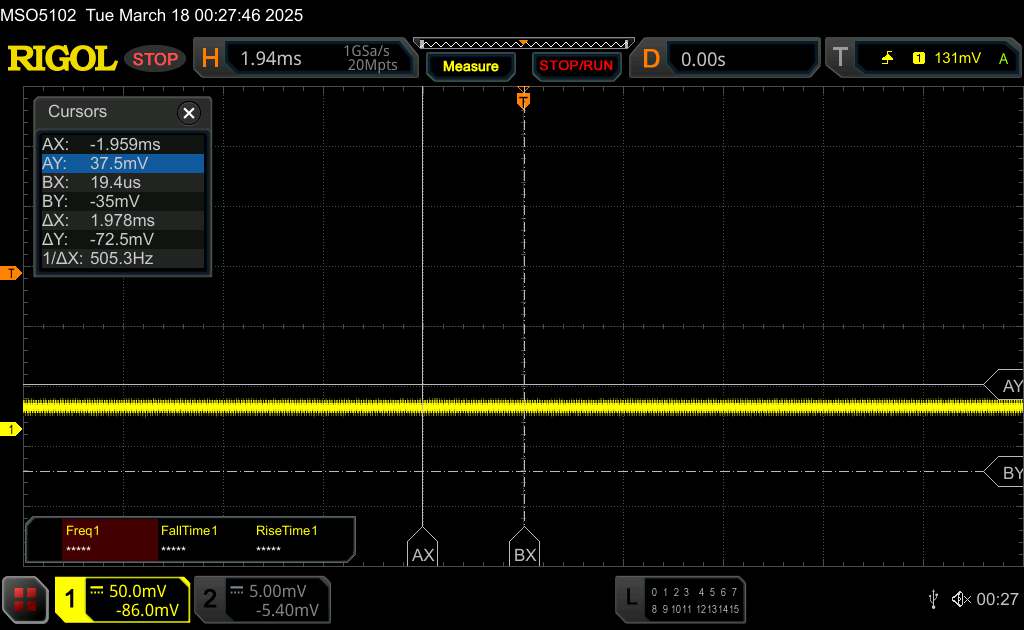 | ||
In comparison: 53 % of all tested devices do not use PWM to dim the display. If PWM was detected, an average of 8516 (minimum: 5 - maximum: 343500) Hz was measured. | |||
它的显示屏色彩显示非常准确,肉眼看不到偏色。
Display Response Times
| ↔ Response Time Black to White | ||
|---|---|---|
| 28.1 ms ... rise ↗ and fall ↘ combined | ↗ 12.8 ms rise | 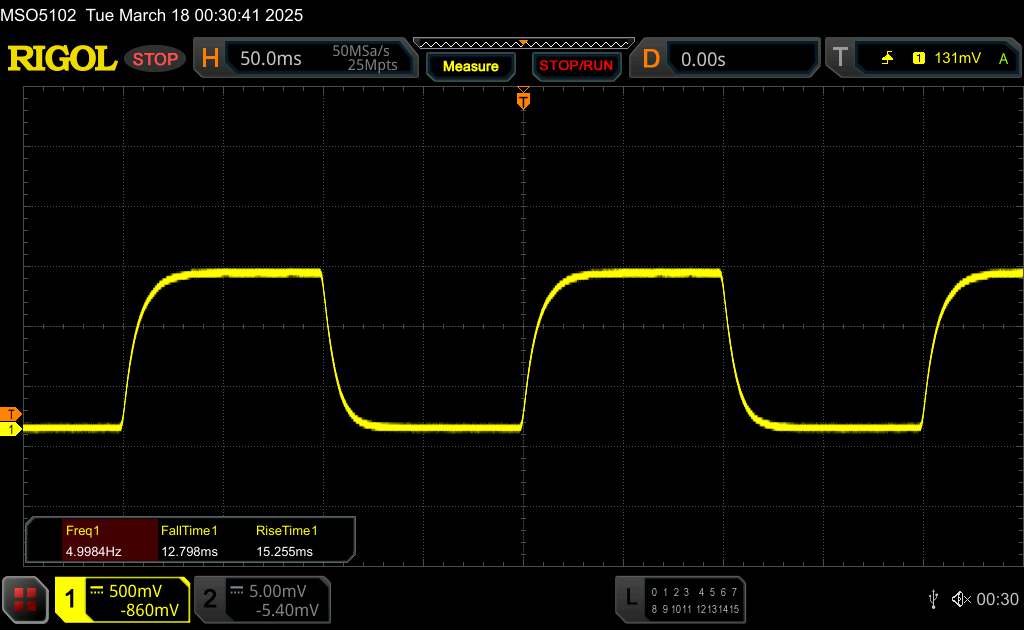 |
| ↘ 15.3 ms fall | ||
| The screen shows relatively slow response rates in our tests and may be too slow for gamers. In comparison, all tested devices range from 0.1 (minimum) to 240 (maximum) ms. » 73 % of all devices are better. This means that the measured response time is worse than the average of all tested devices (20.8 ms). | ||
| ↔ Response Time 50% Grey to 80% Grey | ||
| 38.9 ms ... rise ↗ and fall ↘ combined | ↗ 19.2 ms rise | 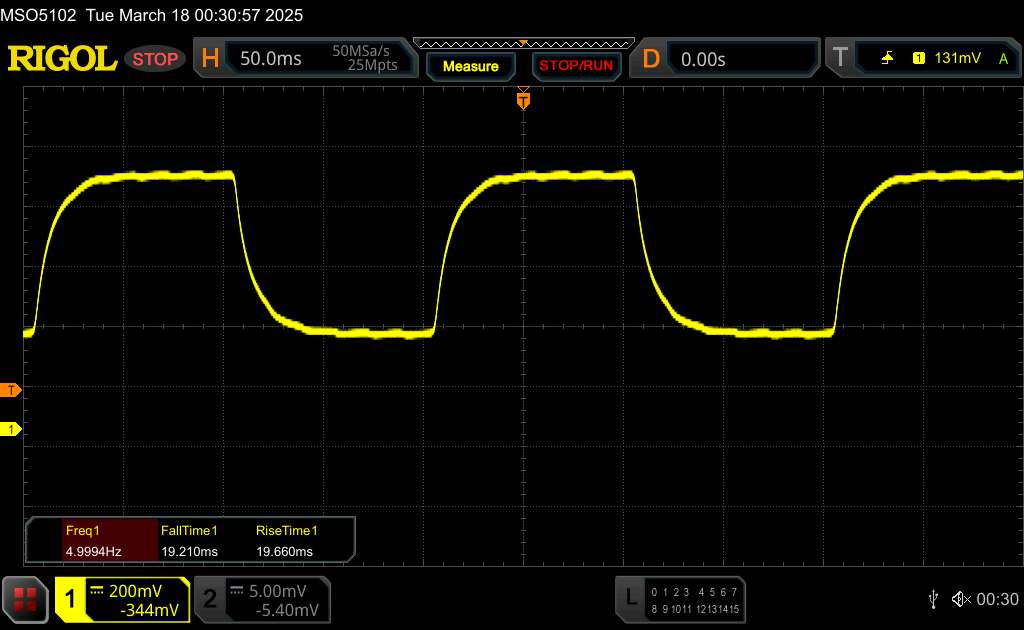 |
| ↘ 19.7 ms fall | ||
| The screen shows slow response rates in our tests and will be unsatisfactory for gamers. In comparison, all tested devices range from 0.165 (minimum) to 636 (maximum) ms. » 56 % of all devices are better. This means that the measured response time is worse than the average of all tested devices (32.5 ms). | ||
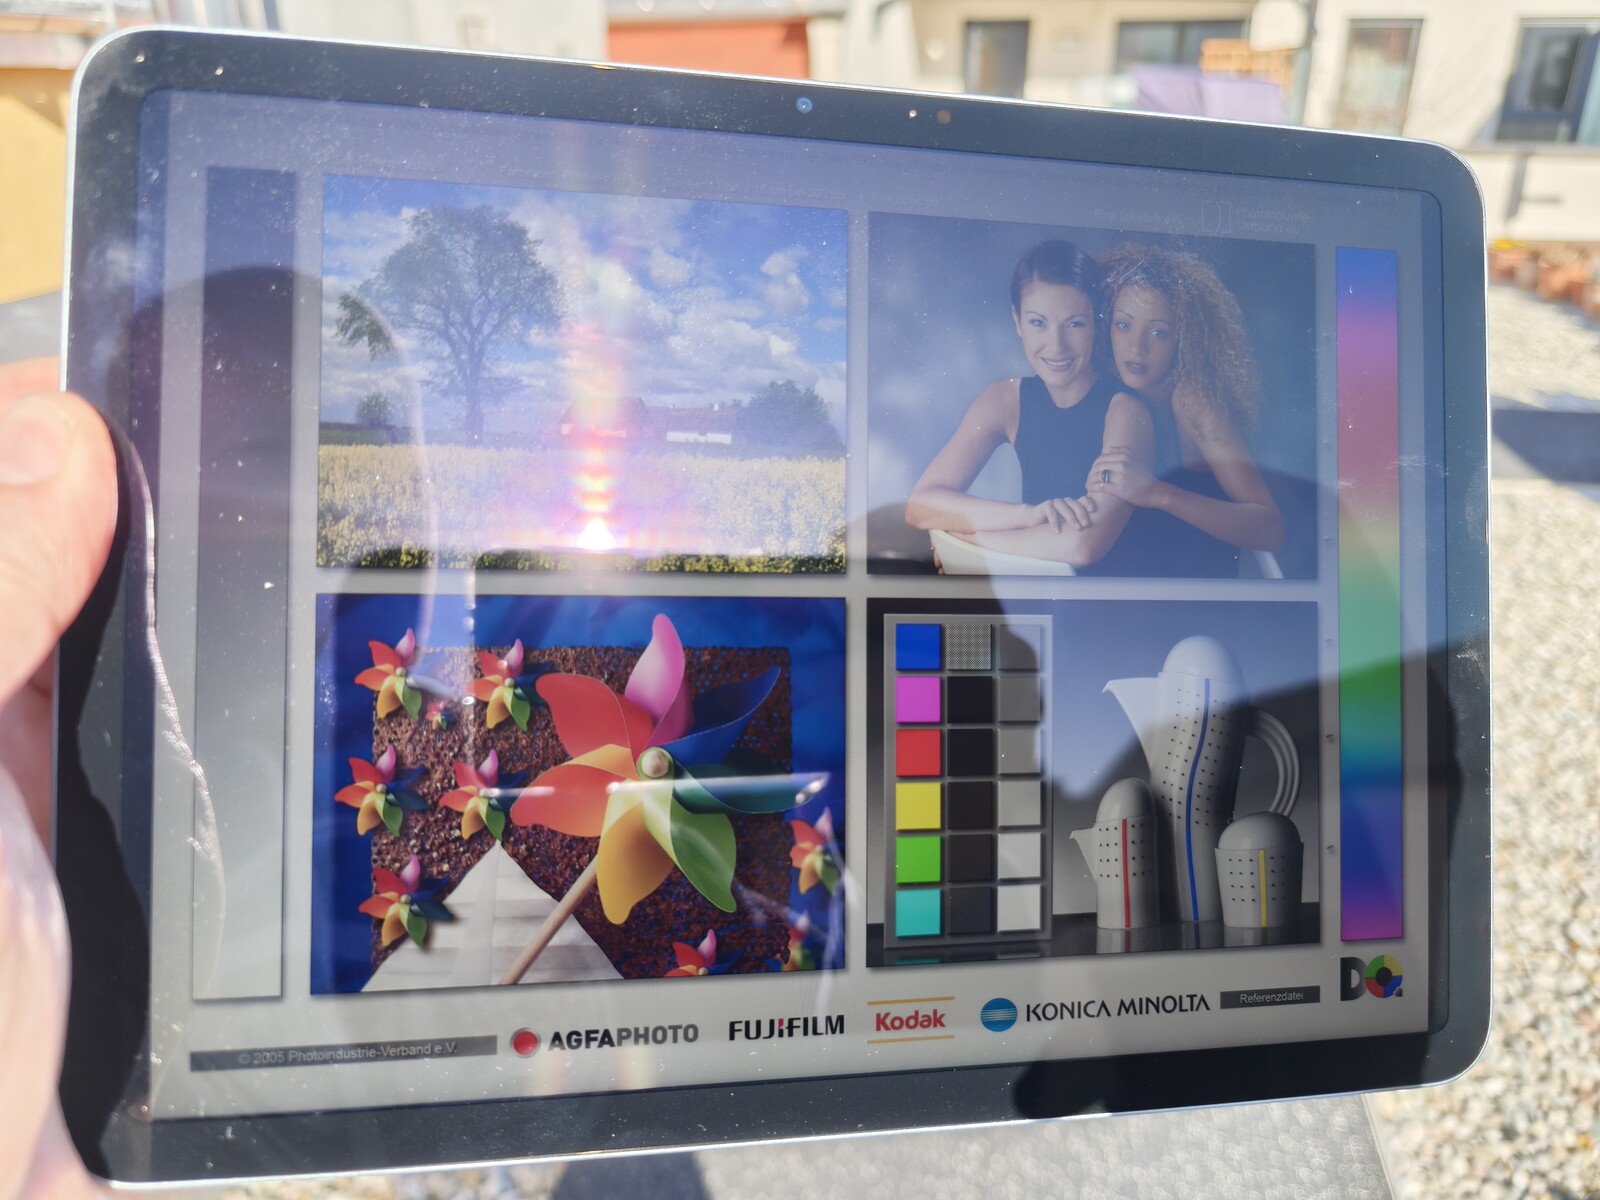
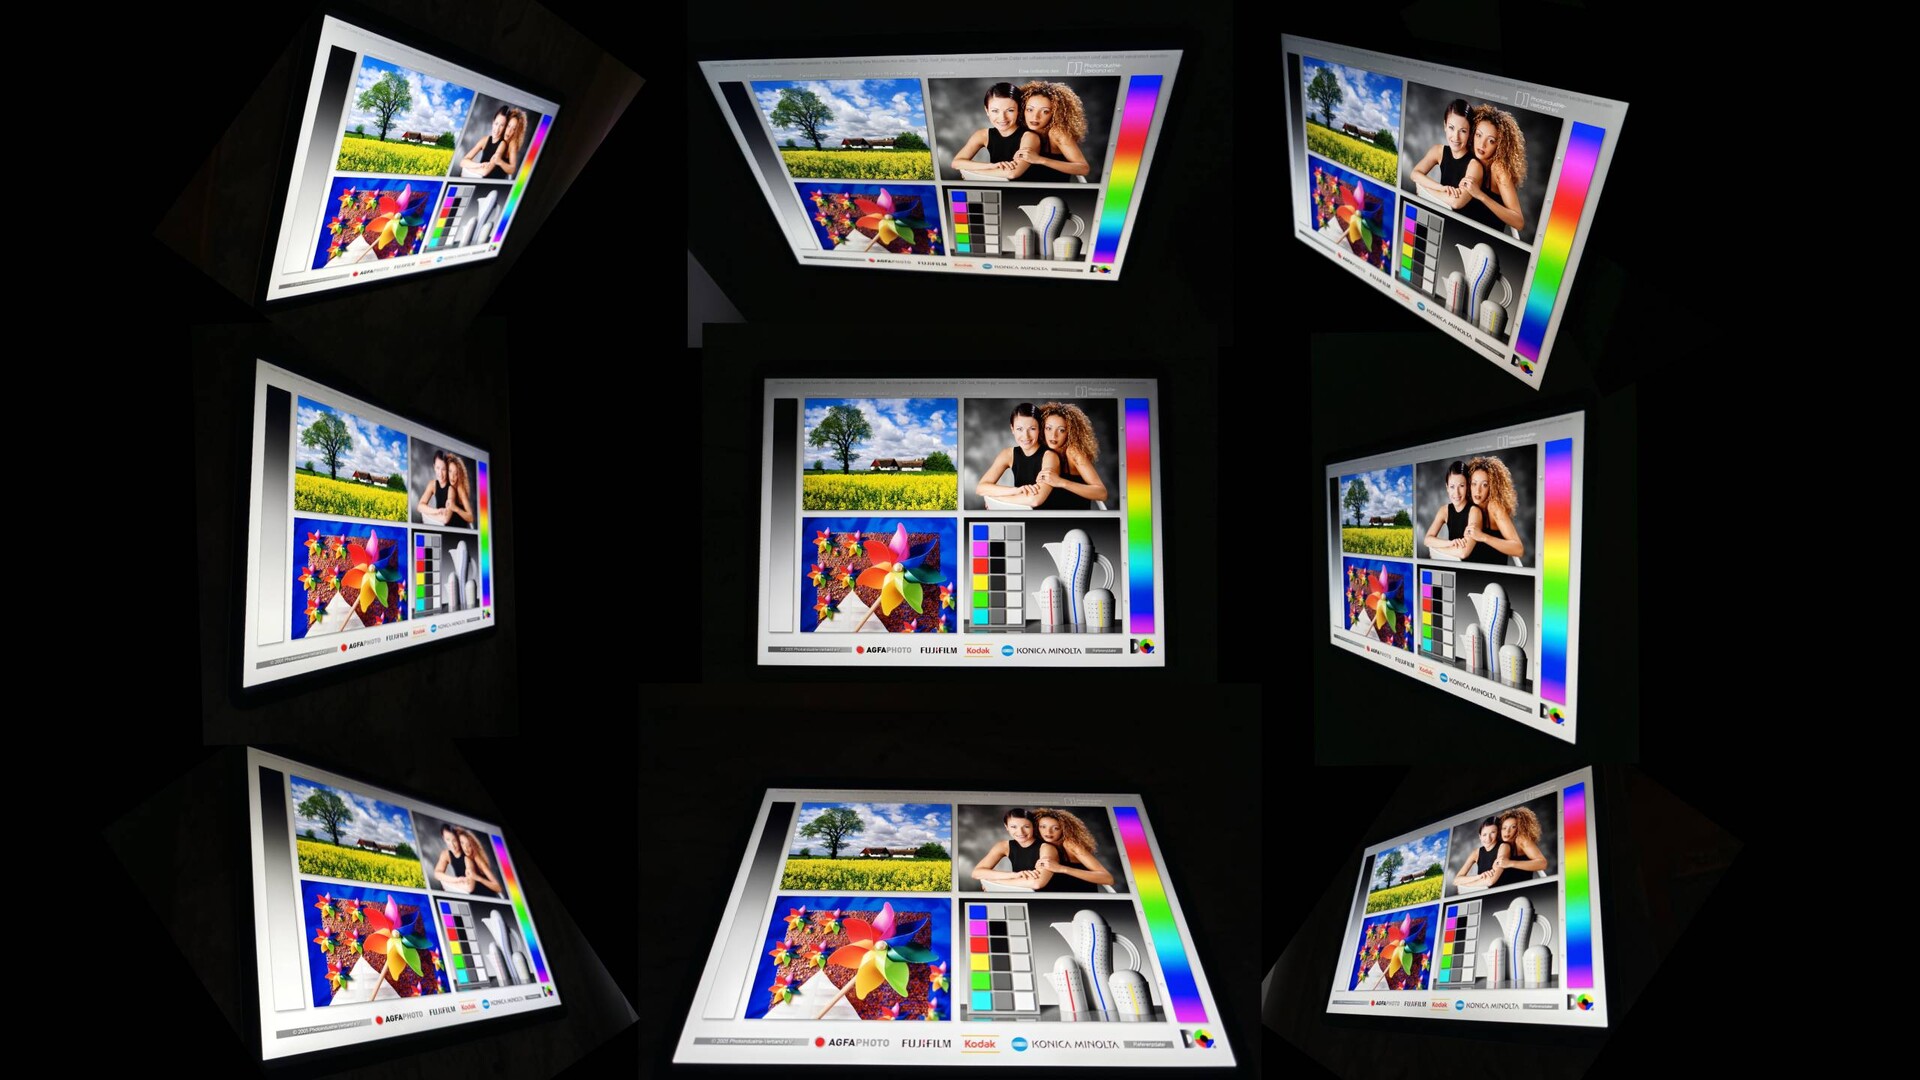
在室外可以看到清晰的反光,但屏幕上的内容仍然清晰可辨。在阴凉处或室内工作会更轻松。
从侧面看,我们对它的视角没有任何负面评价。
性能 - 无需风扇也能提供强劲动力
撠 Apple M3SoC 是第七代 iPad Air 的明显亮点。
得益于它的高性能,iPad Air 11(2025 年)上甚至可以执行要求非常苛刻的任务。Apple ,就很难证明额外收取的费用是合理的。 Apple M4内的 iPad Pro.在我们的测试中,Apple Intelligence 的本地计算也进行得非常快。
与 Apple M2在去年的 iPad Air 11的差距,但在日常使用中几乎看不出来。
| Geekbench AI | |
| Single Precision TensorFlow NNAPI 1.1 | |
| Average of class Tablet (243 - 1243, n=8, last 2 years) | |
| Huawei MatePad 12 X | |
| OnePlus Pad 2 | |
| Half Precision TensorFlow NNAPI 1.1 | |
| Average of class Tablet (227 - 5204, n=8, last 2 years) | |
| Huawei MatePad 12 X | |
| OnePlus Pad 2 | |
| Quantized TensorFlow NNAPI 1.1 | |
| Average of class Tablet (508 - 4998, n=8, last 2 years) | |
| Huawei MatePad 12 X | |
| OnePlus Pad 2 | |
| Single Precision Core ML Neural Engine 1.2 | |
| Average of class Tablet (4066 - 4823, n=4, last 2 years) | |
| Apple iPad Air 11 2025 | |
| Average Apple M3 (4158 - 4164, n=2) | |
| Half Precision Core ML Neural Engine 1.2 | |
| Apple iPad Air 11 2025 | |
| Average of class Tablet (6923 - 36754, n=4, last 2 years) | |
| Average Apple M3 (7042 - 30723, n=2) | |
| Quantized Core ML Neural Engine 1.2 | |
| Apple iPad Air 11 2025 | |
| Average of class Tablet (5648 - 51561, n=4, last 2 years) | |
| Average Apple M3 (5678 - 34342, n=2) | |
Apple 节省了设备 GPU 的成本,只启用了 9 个内核,而 iPad Air 11 则启用了 10 个内核。 iPad Air 11 2024的图形处理器只启用了 9 个核心。在某些基准测试中,这一点非常明显,而且在某些情况下,较新的 iPad 稍微落后。
但实际上,iPad 的 GPU 仍然非常强大,能将绝大多数Android 竞争对手挡在身后。
GFXBench (DX / GLBenchmark) 2.7: T-Rex Onscreen | 1920x1080 T-Rex Offscreen
GFXBench 3.0: on screen Manhattan Onscreen OGL | 1920x1080 1080p Manhattan Offscreen
GFXBench 3.1: on screen Manhattan ES 3.1 Onscreen | 1920x1080 Manhattan ES 3.1 Offscreen
GFXBench: on screen Car Chase Onscreen | 1920x1080 Car Chase Offscreen | on screen Aztec Ruins High Tier Onscreen | 2560x1440 Aztec Ruins High Tier Offscreen | on screen Aztec Ruins Normal Tier Onscreen | 1920x1080 Aztec Ruins Normal Tier Offscreen | 3840x2160 4K Aztec Ruins High Tier Offscreen
| 3DMark / Wild Life Extreme Unlimited | |
| Apple iPad Air 11 2024 | |
| Apple iPad Air 11 2025 | |
| OnePlus Pad 2 | |
| Xiaomi Pad 7 Pro | |
| Huawei MatePad 12 X | |
| 3DMark / Wild Life Extreme | |
| Apple iPad Air 11 2024 | |
| Apple iPad Air 11 2025 | |
| OnePlus Pad 2 | |
| Xiaomi Pad 7 Pro | |
| Huawei MatePad 12 X | |
| 3DMark / Solar Bay Score | |
| OnePlus Pad 2 | |
| Apple iPad Air 11 2024 | |
| Apple iPad Air 11 2025 | |
| Xiaomi Pad 7 Pro | |
| 3DMark / Solar Bay Unlimited Score | |
| Apple iPad Air 11 2025 | |
| OnePlus Pad 2 | |
| Apple iPad Air 11 2024 | |
| Xiaomi Pad 7 Pro | |
| 3DMark / Steel Nomad Light Unlimited Score | |
| Apple iPad Air 11 2025 | |
| OnePlus Pad 2 | |
| Xiaomi Pad 7 Pro | |
| 3DMark / Steel Nomad Light Score | |
| Apple iPad Air 11 2025 | |
| OnePlus Pad 2 | |
| Xiaomi Pad 7 Pro | |
| GFXBench (DX / GLBenchmark) 2.7 / T-Rex Onscreen | |
| Xiaomi Pad 7 Pro | |
| Apple iPad Air 11 2024 | |
| Huawei MatePad 12 X | |
| Apple iPad Air 11 2025 | |
| GFXBench (DX / GLBenchmark) 2.7 / T-Rex Offscreen | |
| Apple iPad Air 11 2024 | |
| Apple iPad Air 11 2025 | |
| Xiaomi Pad 7 Pro | |
| Huawei MatePad 12 X | |
| GFXBench 3.0 / Manhattan Onscreen OGL | |
| Xiaomi Pad 7 Pro | |
| Apple iPad Air 11 2024 | |
| Apple iPad Air 11 2025 | |
| Huawei MatePad 12 X | |
| GFXBench 3.0 / 1080p Manhattan Offscreen | |
| Apple iPad Air 11 2025 | |
| Apple iPad Air 11 2024 | |
| Xiaomi Pad 7 Pro | |
| Huawei MatePad 12 X | |
| GFXBench 3.1 / Manhattan ES 3.1 Onscreen | |
| Apple iPad Air 11 2024 | |
| Apple iPad Air 11 2025 | |
| Xiaomi Pad 7 Pro | |
| Huawei MatePad 12 X | |
| GFXBench 3.1 / Manhattan ES 3.1 Offscreen | |
| Apple iPad Air 11 2024 | |
| Apple iPad Air 11 2025 | |
| Xiaomi Pad 7 Pro | |
| Huawei MatePad 12 X | |
| GFXBench / Car Chase Onscreen | |
| Apple iPad Air 11 2024 | |
| Apple iPad Air 11 2025 | |
| Xiaomi Pad 7 Pro | |
| Huawei MatePad 12 X | |
| GFXBench / Car Chase Offscreen | |
| Apple iPad Air 11 2024 | |
| Apple iPad Air 11 2025 | |
| Xiaomi Pad 7 Pro | |
| Huawei MatePad 12 X | |
| GFXBench / Aztec Ruins High Tier Onscreen | |
| Apple iPad Air 11 2024 | |
| Apple iPad Air 11 2025 | |
| OnePlus Pad 2 | |
| Xiaomi Pad 7 Pro | |
| Huawei MatePad 12 X | |
| GFXBench / Aztec Ruins High Tier Offscreen | |
| OnePlus Pad 2 | |
| Apple iPad Air 11 2024 | |
| Apple iPad Air 11 2025 | |
| Xiaomi Pad 7 Pro | |
| Huawei MatePad 12 X | |
| GFXBench / Aztec Ruins Normal Tier Onscreen | |
| Apple iPad Air 11 2024 | |
| Apple iPad Air 11 2025 | |
| OnePlus Pad 2 | |
| Xiaomi Pad 7 Pro | |
| Huawei MatePad 12 X | |
| GFXBench / Aztec Ruins Normal Tier Offscreen | |
| Apple iPad Air 11 2024 | |
| Apple iPad Air 11 2025 | |
| OnePlus Pad 2 | |
| Xiaomi Pad 7 Pro | |
| Huawei MatePad 12 X | |
| GFXBench / 4K Aztec Ruins High Tier Offscreen | |
| Apple iPad Air 11 2024 | |
| Apple iPad Air 11 2025 | |
| OnePlus Pad 2 | |
| Xiaomi Pad 7 Pro | |
| Huawei MatePad 12 X | |
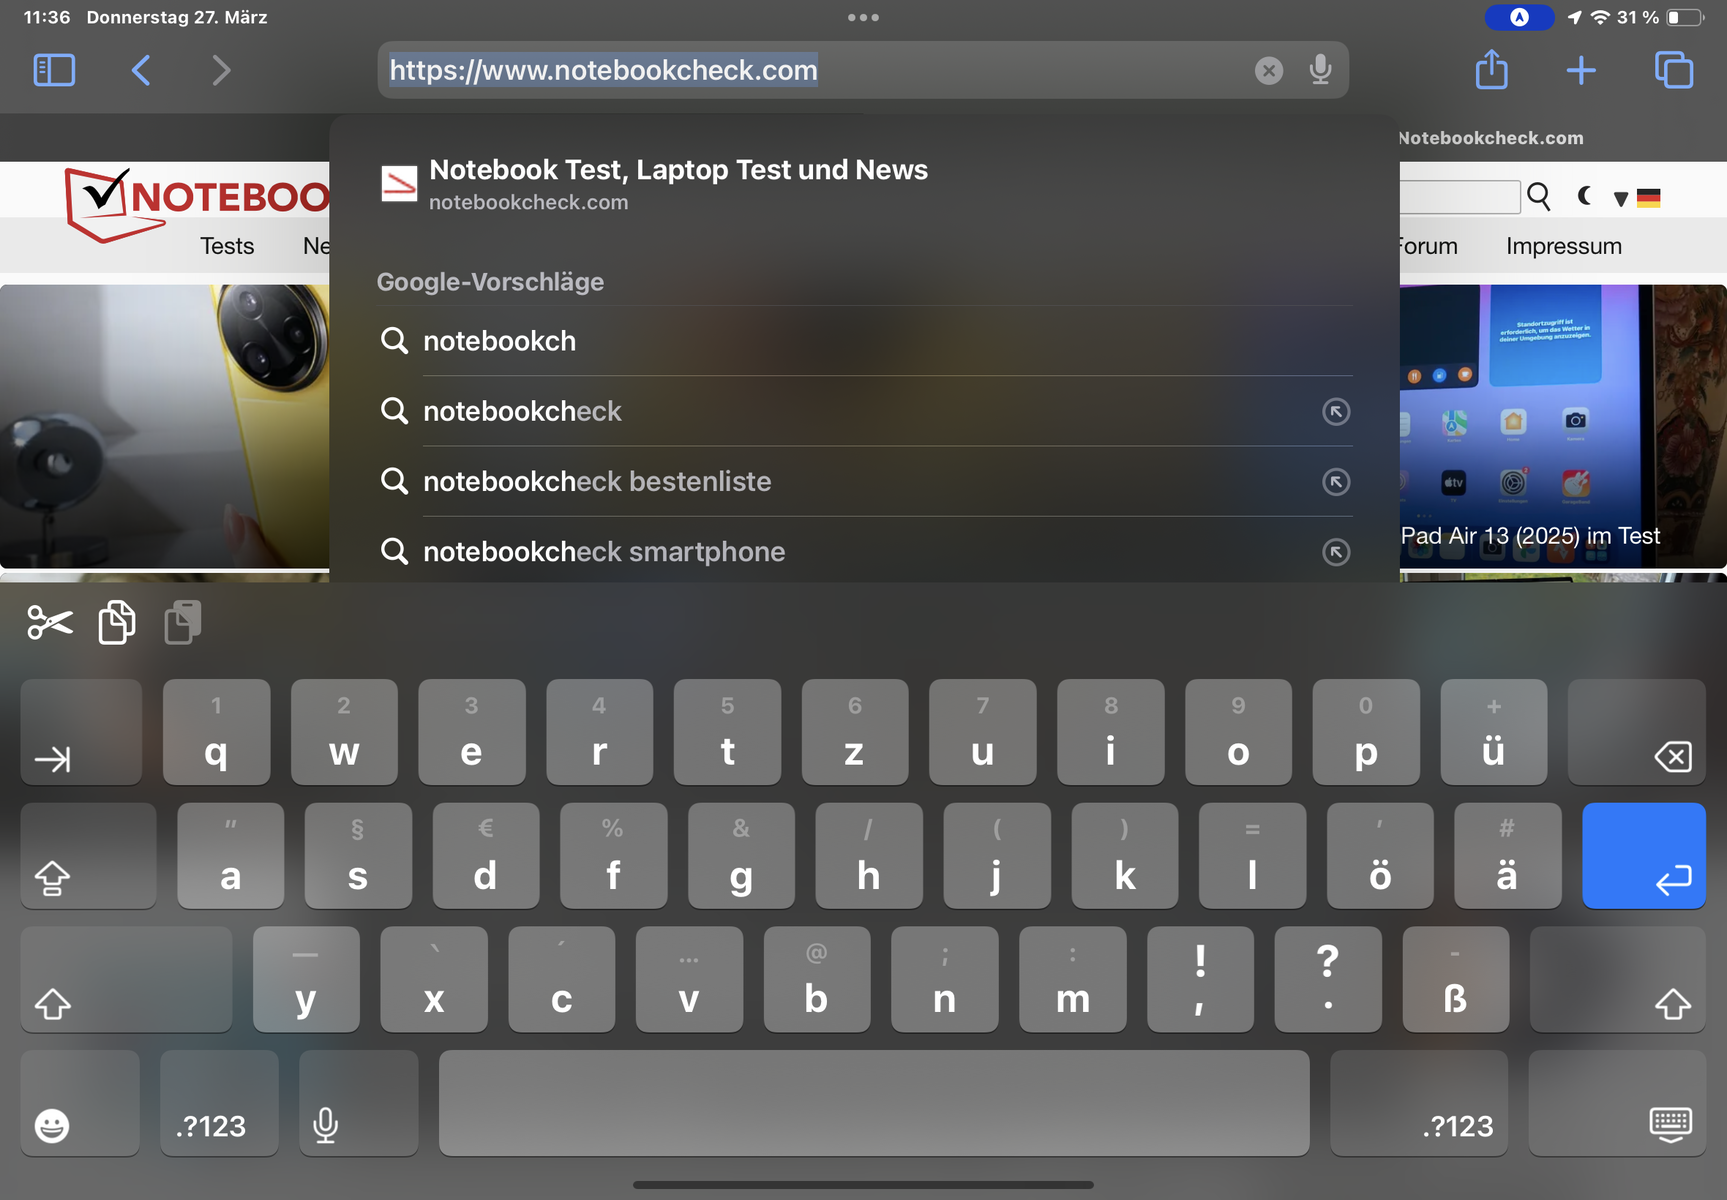
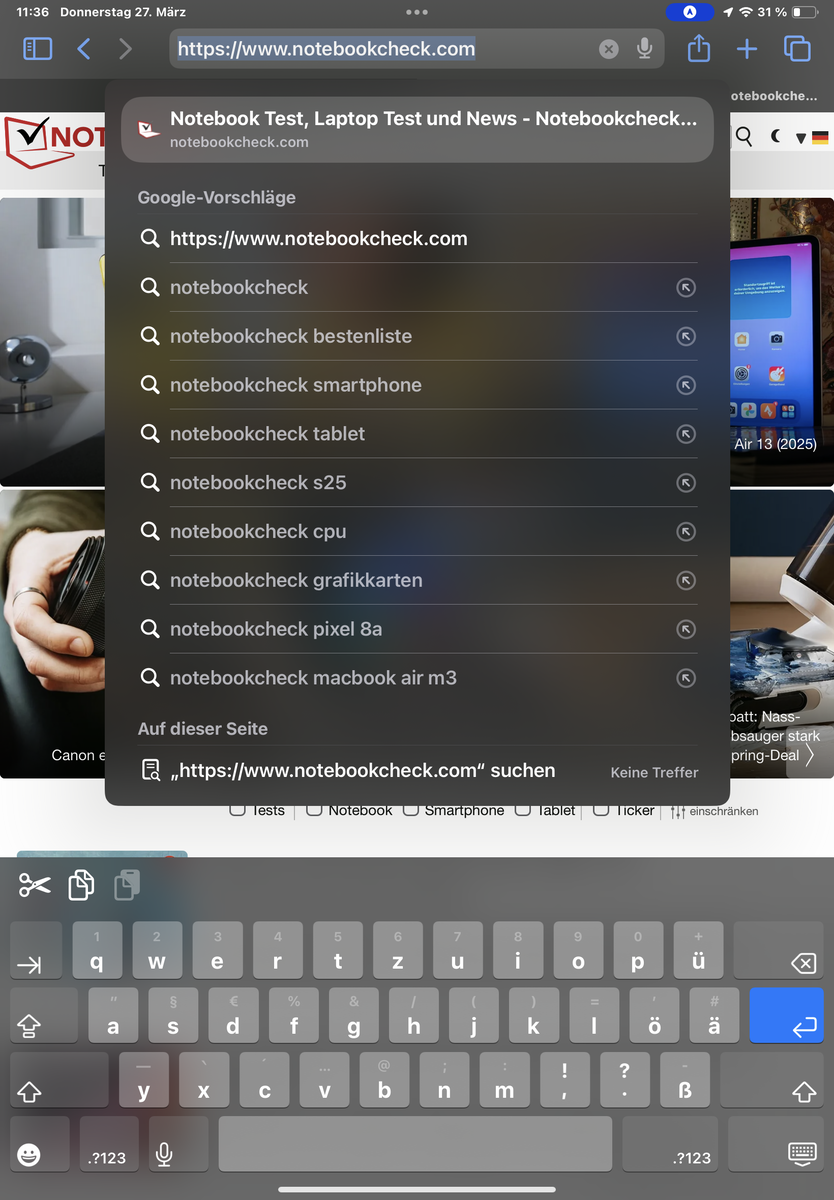
实际上,浏览网页的速度变得更快了,但这在一定程度上要归功于新版 Safari。
总的来说,如果网络连接良好,你在浏览器中不会遇到任何等待时间--即使是大型网站,也能在滚动时立即显示图片。
| Speedometer 2.0 - Result | |
| Average Apple M3 (548 - 674, n=5) | |
| Apple iPad Air 11 2025 (Safari 18) | |
| Apple iPad Air 11 2024 (Safari 17) | |
| Apple iPad Air 11 2024 | |
| Average of class Tablet (2.59 - 572, n=63, last 2 years) | |
| Speedometer 3.0 - Score | |
| Apple iPad Air 11 2025 (Safari 18) | |
| Average Apple M3 (33.9 - 34.4, n=2) | |
| Apple iPad Air 11 2024 (Safari 17) | |
| Average of class Tablet (1.25 - 34.4, n=37, last 2 years) | |
| Xiaomi Pad 7 Pro (Chrome 132) | |
| Huawei MatePad 12 X (Huawei Browswer 15) | |
| Octane V2 - Total Score | |
| Average Apple M3 (92645 - 98093, n=5) | |
| Apple iPad Air 11 2025 (Safari 18) | |
| Apple iPad Air 11 2024 (Safari 17) | |
| Xiaomi Pad 7 Pro (Chrome 132) | |
| OnePlus Pad 2 (Chrome 128) | |
| Huawei MatePad 12 X (Huawei Browswer 15) | |
| Average of class Tablet (763 - 105178, n=90, last 2 years) | |
| Mozilla Kraken 1.1 - Total | |
| Average of class Tablet (319 - 34733, n=76, last 2 years) | |
| Huawei MatePad 12 X (Huawei Browswer 15) | |
| Xiaomi Pad 7 Pro (Chrome 132) | |
| Apple iPad Air 11 2024 (Safari 17) | |
| Average Apple M3 (323 - 373, n=5) | |
| Apple iPad Air 11 2025 (Safari 18) | |
* ... smaller is better
Apple 再次采用了结合 NVMe 存储和内存的内存模块,以提高系统效率。
虽然Apple 移动操作系统支持的存储速度没有直接的基准测试,但我们在测试过程中测得了较短的加载时间和快速的数据传输。
游戏 - 折中的体验
由于平板电脑的显示屏不支持比这更高的帧率,因此游戏帧率最高只能达到 60fps。很多要求较高的游戏都能达到这个帧率,但在非常高的设置下可能会出现短暂的 FPS 下降。PUBG Mobile》在最高设置下只能达到 40fps。
设备的触摸屏和位置传感器工作可靠。显示屏的尺寸比 iPad Air 13 更适合游戏。 iPad Air 13更适合玩游戏,因为触摸屏上的控制按钮更容易触及。不过,使用连接的游戏手柄就更容易了。
我们使用GameBench软件进行测试。


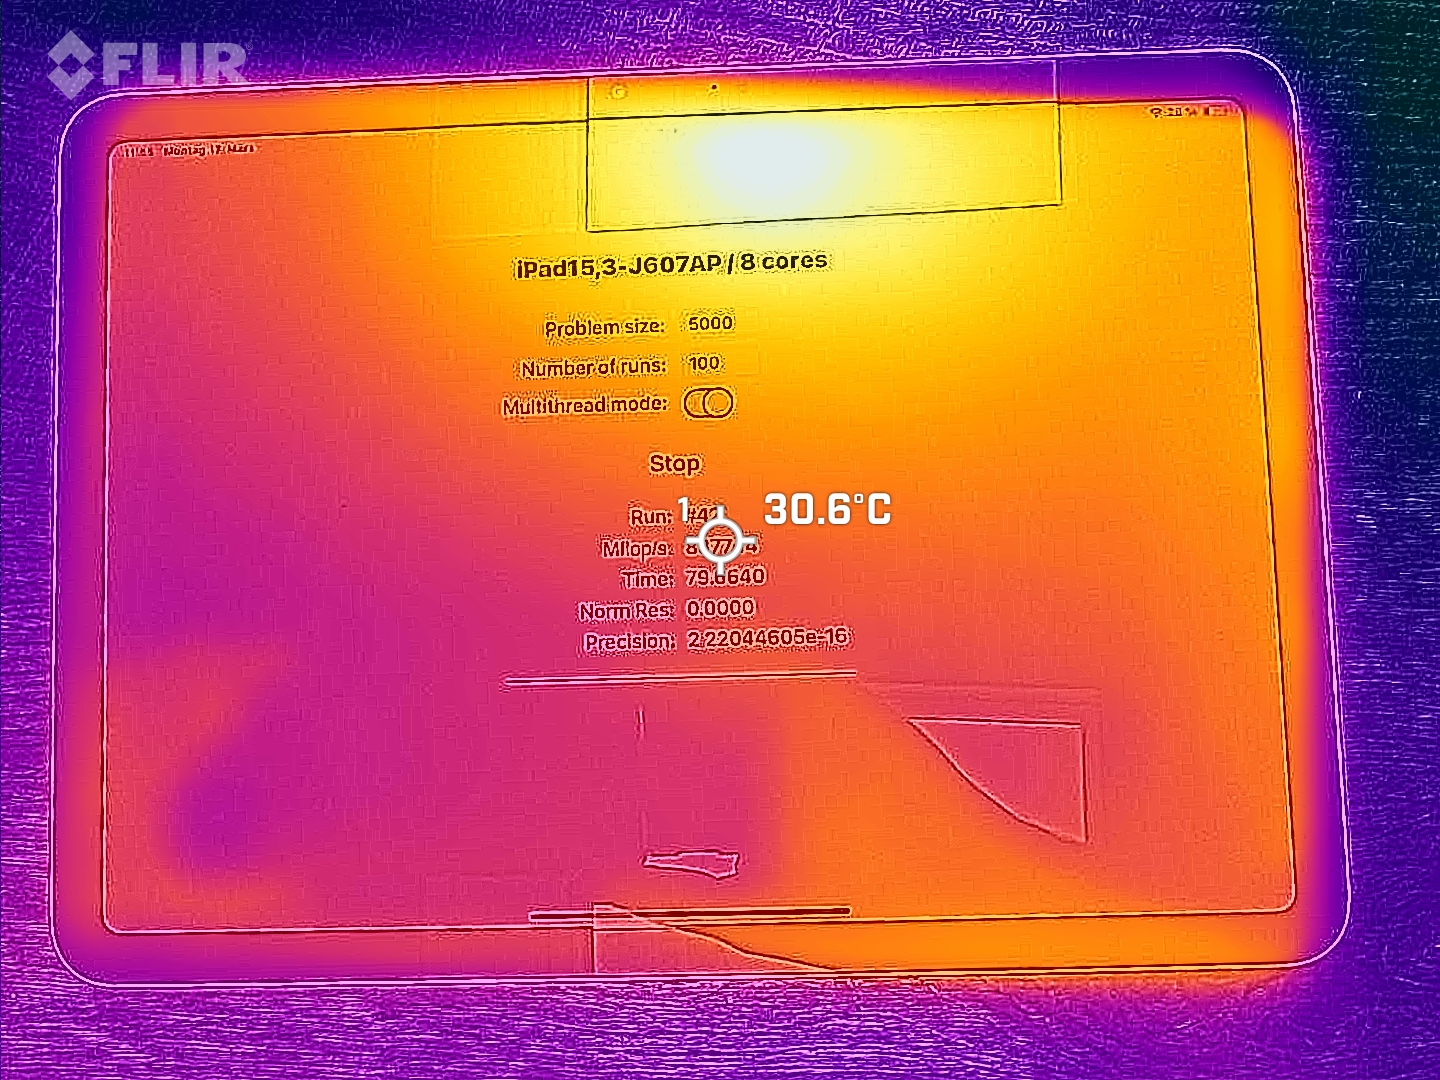
排放 - iPad Air 11 采用节流设计
温度
iPad Air 11(2025 英寸)的发热量略高于它的 "大兄弟",这是有道理的:由于两者都不需要风扇,iPad Air 13 更大的表面积可以更好地散发废热。即使是 11 英寸 iPad Air,长时间使用后也不会过热,考虑到芯片的性能,这一点令人印象深刻。
不过,与 iPad Air 13 相比,SoC 的节流明显增加。 iPad Air 13 (2025):根据 3DMark 压力测试的结果,在长时间高负荷运行的情况下,性能损失可达 24%。
(+) The maximum temperature on the upper side is 35.2 °C / 95 F, compared to the average of 33.7 °C / 93 F, ranging from 20.7 to 53.2 °C for the class Tablet.
(±) The bottom heats up to a maximum of 41.8 °C / 107 F, compared to the average of 33.2 °C / 92 F
(+) In idle usage, the average temperature for the upper side is 22.3 °C / 72 F, compared to the device average of 30 °C / 86 F.
3DMark stress test
| 3DMark | |
| Wild Life Stress Test Stability | |
| Apple iPad Air 11 2024 | |
| Huawei MatePad 12 X | |
| Xiaomi Pad 7 Pro | |
| OnePlus Pad 2 | |
| Wild Life Extreme Stress Test | |
| Huawei MatePad 12 X | |
| Xiaomi Pad 7 Pro | |
| OnePlus Pad 2 | |
| Apple iPad Air 11 2025 | |
| Apple iPad Air 11 2024 | |
| Solar Bay Stress Test Stability | |
| Xiaomi Pad 7 Pro | |
| Apple iPad Air 11 2024 | |
| OnePlus Pad 2 | |
| Apple iPad Air 11 2025 | |
| Steel Nomad Light Stress Test Stability | |
| Xiaomi Pad 7 Pro | |
| OnePlus Pad 2 | |
| Apple iPad Air 11 2025 | |

发言人
较小的 iPad Air 配备了两个扬声器。它们的音量对于中等大小的房间来说是可以接受的,声音温暖而趋于中性,但没有真正的低音。清晰的中低音是一大亮点,即使放在坚硬的表面上也能产生可感知的振动。
USB-C 和蓝牙 5.3 可用于音频输出。不过,对无线音频编解码器的支持仅限于Apple 的 AAC 和 SBC,音质较差。
Apple iPad Air 11 2025 audio analysis
(±) | speaker loudness is average but good (78.4 dB)
Bass 100 - 315 Hz
(±) | reduced bass - on average 10.2% lower than median
(±) | linearity of bass is average (13.3% delta to prev. frequency)
Mids 400 - 2000 Hz
(+) | balanced mids - only 3.5% away from median
(±) | linearity of mids is average (9.3% delta to prev. frequency)
Highs 2 - 16 kHz
(+) | balanced highs - only 4% away from median
(±) | linearity of highs is average (9.3% delta to prev. frequency)
Overall 100 - 16.000 Hz
(+) | overall sound is linear (14.7% difference to median)
Compared to same class
» 27% of all tested devices in this class were better, 4% similar, 69% worse
» The best had a delta of 7%, average was 21%, worst was 129%
Compared to all devices tested
» 17% of all tested devices were better, 4% similar, 79% worse
» The best had a delta of 4%, average was 24%, worst was 134%
Huawei MatePad 12 X audio analysis
(+) | speakers can play relatively loud (87.2 dB)
Bass 100 - 315 Hz
(±) | reduced bass - on average 10.4% lower than median
(±) | linearity of bass is average (7.1% delta to prev. frequency)
Mids 400 - 2000 Hz
(+) | balanced mids - only 2.4% away from median
(+) | mids are linear (4.8% delta to prev. frequency)
Highs 2 - 16 kHz
(+) | balanced highs - only 1.9% away from median
(+) | highs are linear (2.6% delta to prev. frequency)
Overall 100 - 16.000 Hz
(+) | overall sound is linear (8.4% difference to median)
Compared to same class
» 1% of all tested devices in this class were better, 1% similar, 98% worse
» The best had a delta of 7%, average was 21%, worst was 129%
Compared to all devices tested
» 2% of all tested devices were better, 1% similar, 98% worse
» The best had a delta of 4%, average was 24%, worst was 134%
电池续航时间 - 一天勉强够用
耗电量
Apple iPad Air 11 (2025) 与前代产品一样耗电。这意味着在极低或轻负载的情况下,不需要从电池或电源插座中消耗太多电能,但在高负载的情况下则需要明显增加电能:我们测得的最大功率为 16.8 瓦,与前代产品完全相同。
Apple iPad 的最大充电功率仍为 20 瓦,完全充电时间为 2:15 小时。
| Off / Standby | |
| Idle | |
| Load |
|
Key:
min: | |
| Apple iPad Air 11 2025 mAh | Apple iPad Air 11 2024 mAh | Xiaomi Pad 7 Pro 8850 mAh | Huawei MatePad 12 X 10100 mAh | Average Apple M3 | Average of class Tablet | |
|---|---|---|---|---|---|---|
| Power Consumption | -7% | 40% | -97% | -112% | 2% | |
| Idle Minimum * | 1.6 | 1.5 6% | 0.75 53% | 4.66 -191% | 2 ? -25% | 1.724 ? -8% |
| Idle Average * | 2.8 | 3.6 -29% | 1.5 46% | 9.06 -224% | 8.6 ? -207% | 3.75 ? -34% |
| Idle Maximum * | 4.7 | 4.6 2% | 1.56 67% | 9.17 -95% | 9.16 ? -95% | 4.24 ? 10% |
| Load Average * | 11.4 | 12.8 -12% | 7.92 31% | 11.9 -4% | 26 ? -128% | 9.15 ? 20% |
| Load Maximum * | 16.8 | 16.8 -0% | 16.5 2% | 11.97 29% | 34.6 ? -106% | 12.9 ? 23% |
* ... smaller is better
Power consumption: Geekbench (150 cd/m²)
Power consumption: GFXbench (150 cd/m²)
运行时间
在我们的运行时间测试中,Apple iPad Air 11 2025 的续航时间比其前代产品长了几分钟,但在日常使用中你几乎不会注意到这一点。Android 平板电脑的续航时间有时明显更长。
在我们的 Wi-Fi 测试中,Apple Air 11 2025 的续航时间为 11:43 小时,刚好够在办公室或沙发上使用一天,但剩余时间不多。单次充电可看电影或连续剧的时间不到 13 小时,足够长途飞行使用。
| Apple iPad Air 11 2025 mAh | Apple iPad Air 11 2024 mAh | Xiaomi Pad 7 Pro 8850 mAh | OnePlus Pad 2 9510 mAh | Huawei MatePad 12 X 10100 mAh | |
|---|---|---|---|---|---|
| Battery Runtime | -3% | 50% | 23% | 45% | |
| Reader / Idle | 1534 | 1508 -2% | |||
| H.264 | 773 | 768 -1% | |||
| WiFi v1.3 | 703 | 683 -3% | 1054 50% | 866 23% | 1017 45% |
| Load | 224 | 211 -6% |
Notebookcheck 总评分
 评测")
如果你想以最低的价格获得最高的性能,Apple iPad Air 11 2025 是Apple 的最佳选择。
不过,如果你能以更低的价格买到前代产品,那么你也可以选择该机型,而无需做出任何重大牺牲。
Apple iPad Air 11 2025
- 04/07/2025 v8
Florian Schmitt
 Total Sustainability Score:
 Possible alternatives compared
Image | Model / Review | Price | Weight | Drive | Display |
|---|---|---|---|---|---|
1. 87.4%  | Apple iPad Air 11 2025 Apple M3 ⎘ Apple M3 9-Core GPU ⎘ 8 GB Memory, 128 GB NVMe | Amazon: $569.00 List Price: 699€ | 460 g | 128 GB NVMe | 10.86" 2360x1640 265 PPI IPS |
2. 90% v7 (old)  | Apple iPad Air 11 2024 Apple M2 ⎘ Apple M2 10-Core GPU ⎘ 8 GB Memory, 128 GB NVMe | Amazon: $799.00 List Price: 699€ | 462 g | 128 GB NVMe | 10.86" 2360x1640 265 PPI IPS |
3. 86.5%  | Xiaomi Pad 7 Pro Qualcomm Snapdragon 8s Gen 3 ⎘ Qualcomm Adreno 735 ⎘ 12 GB Memory, 256 GB | Amazon: 1. $519.99 Xiaomi Pad 7 Ai WiFi Version... 2. $299.00 Xiaomi Redmi Pad Pro WiFi Ve... 3. $9.95 Gylint Case for Xiaomi Pad 7... List Price: 450€ | 500 g | 256 GB UFS 4.0 Flash | 11.20" 3200x2136 344 PPI IPS |
4. 86.1%  | OnePlus Pad 2 Qualcomm Snapdragon 8 Gen 3 ⎘ Qualcomm Adreno 750 ⎘ 12 GB Memory, 256 GB | Amazon: $549.99 List Price: 549€ | 584 g | 256 GB UFS 3.1 Flash | 12.10" 3000x2120 304 PPI IPS |
5. 83%  | Huawei MatePad 12 X HiSilicon Kirin 9000W ⎘ HiSilicon Maleoon 910 ⎘ 12 GB Memory, 256 GB | Amazon: 1. $34.90 Case for Huawei Matepad 12 X... 2. $10.96 Kepuch 2 Pack Tempered Glass... 3. $23.23 Tablet Cover Suitable for Hu... List Price: 649€ | 555 g | 256 GB UFS 3.1 Flash | 12.00" 2800x1840 279 PPI IPS |
Transparency
The selection of devices to be reviewed is made by our editorial team. The test sample was provided to the author as a loan by the manufacturer or retailer for the purpose of this review. The lender had no influence on this review, nor did the manufacturer receive a copy of this review before publication. There was no obligation to publish this review. We never accept compensation or payment in return for our reviews. As an independent media company, Notebookcheck is not subjected to the authority of manufacturers, retailers or publishers.
This is how Notebookcheck is testing
Every year, Notebookcheck independently reviews hundreds of laptops and smartphones using standardized procedures to ensure that all results are comparable. We have continuously developed our test methods for around 20 years and set industry standards in the process. In our test labs, high-quality measuring equipment is utilized by experienced technicians and editors. These tests involve a multi-stage validation process. Our complex rating system is based on hundreds of well-founded measurements and benchmarks, which maintains objectivity. Further information on our test methods can be found here.

