

微星Claw 8 AI+评测--得益于英特尔Lunar Lake技术的最佳游戏掌上电脑?
巨大进步。
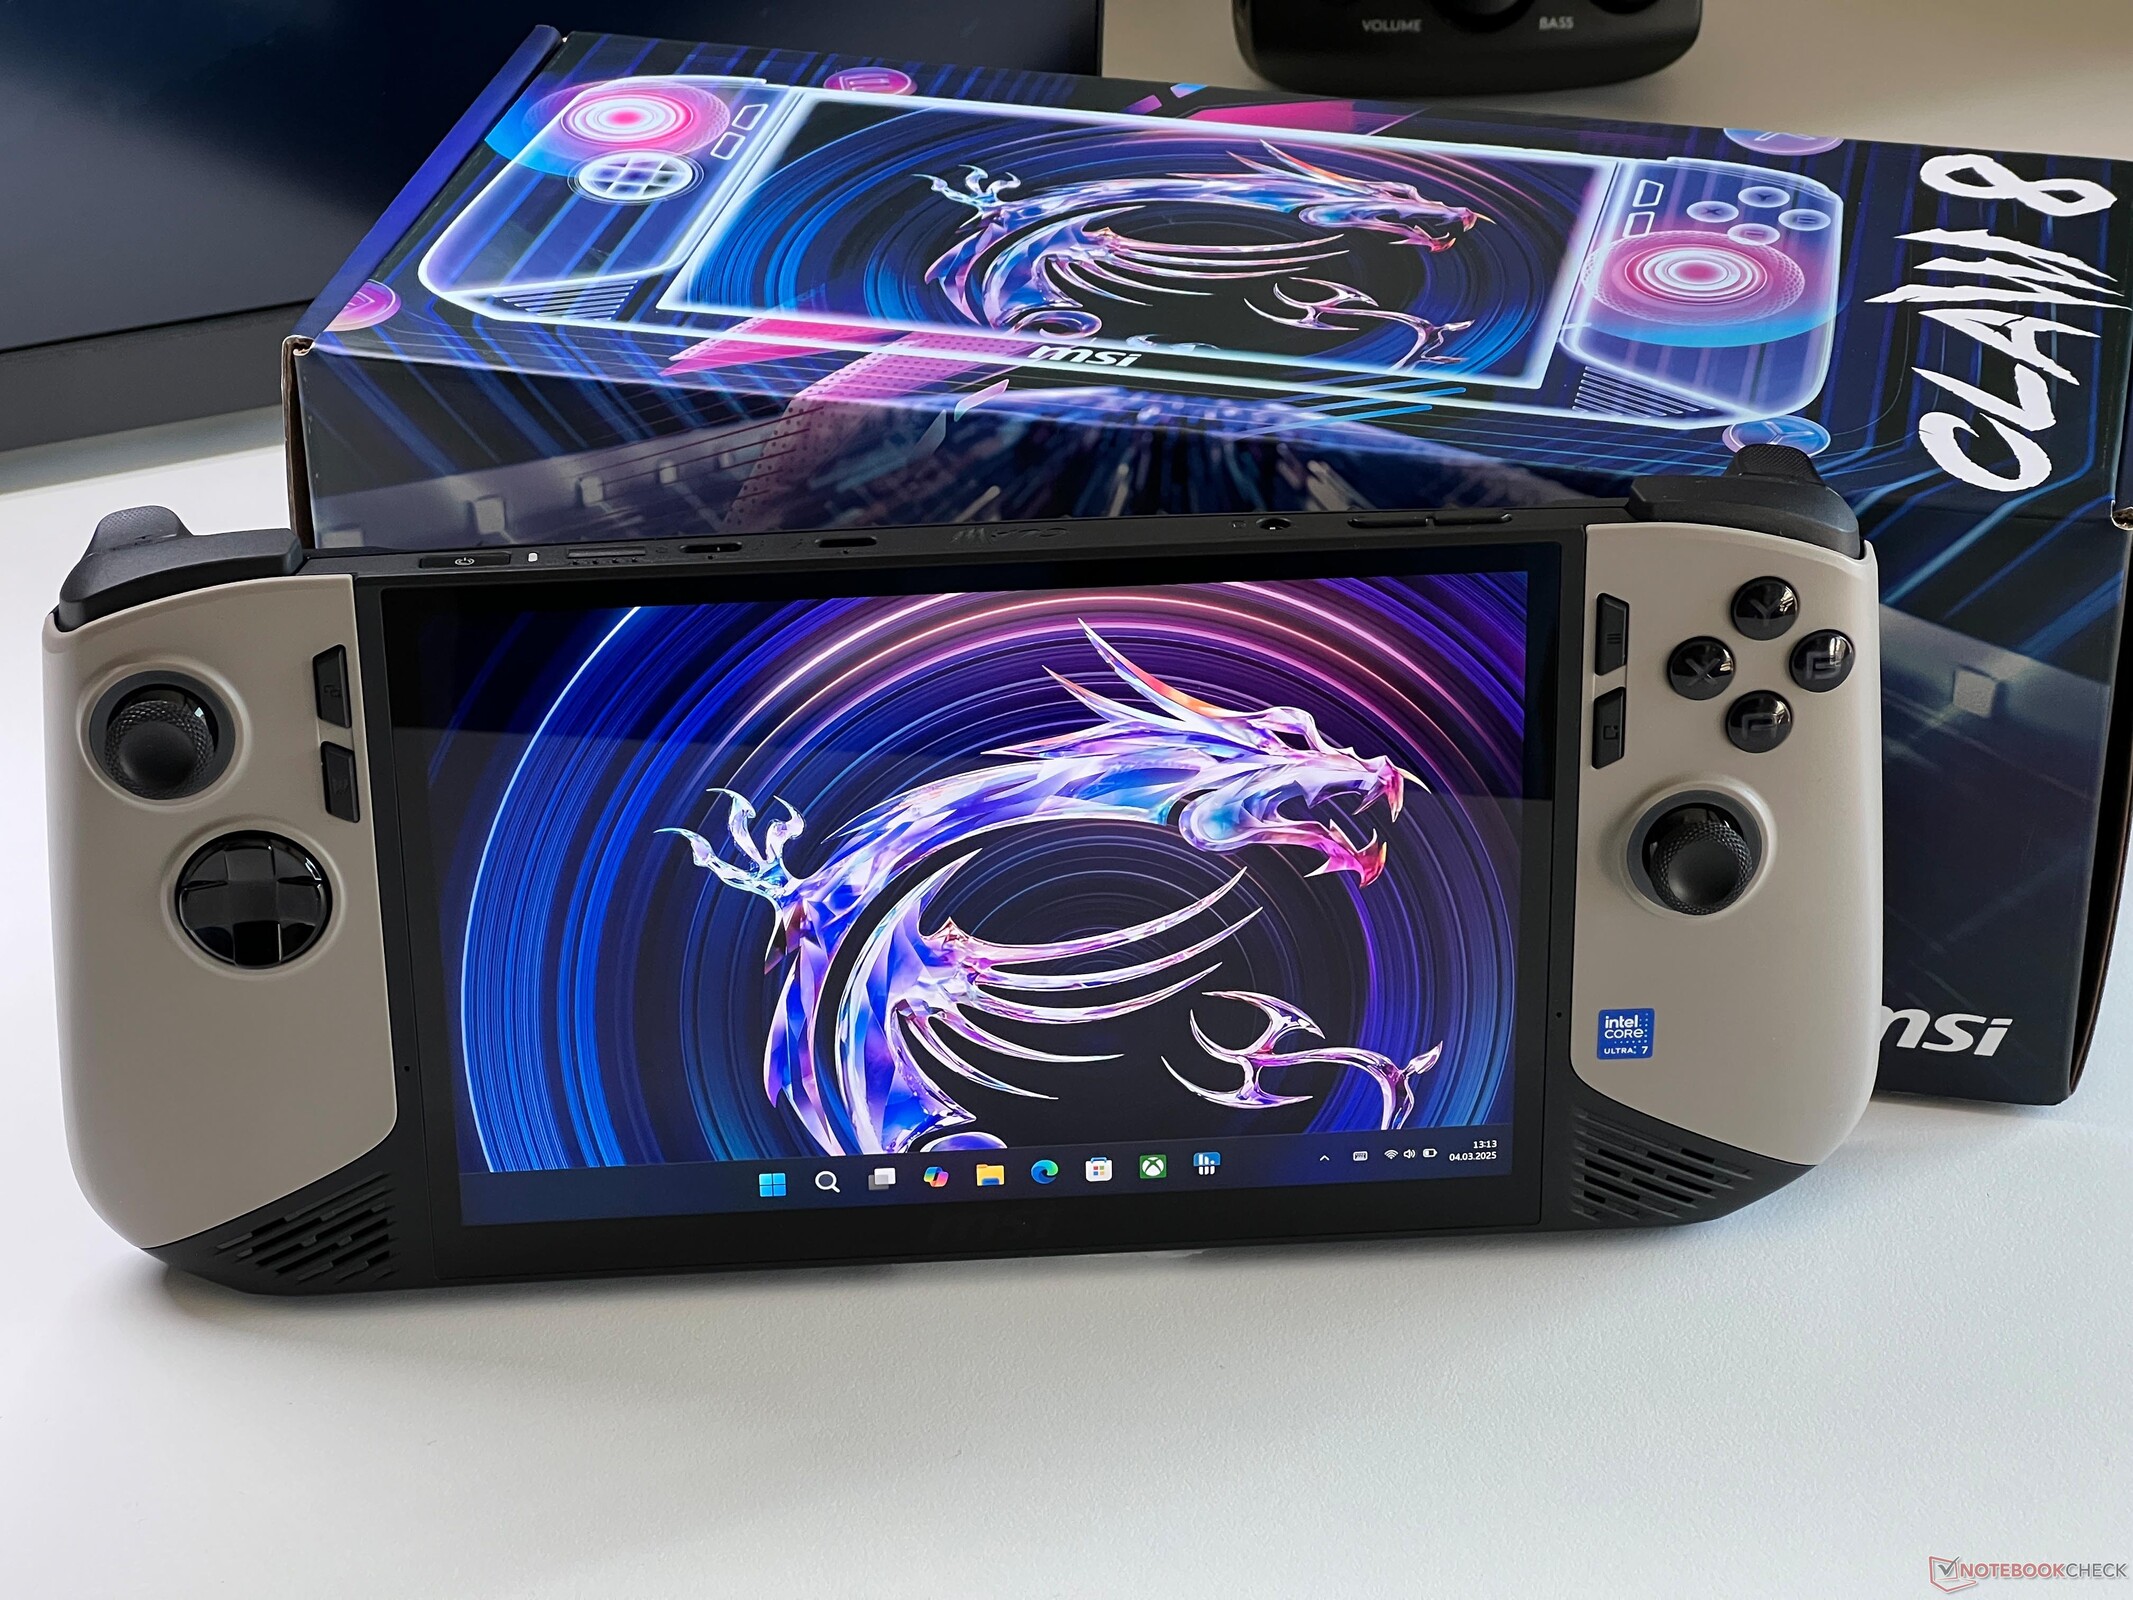
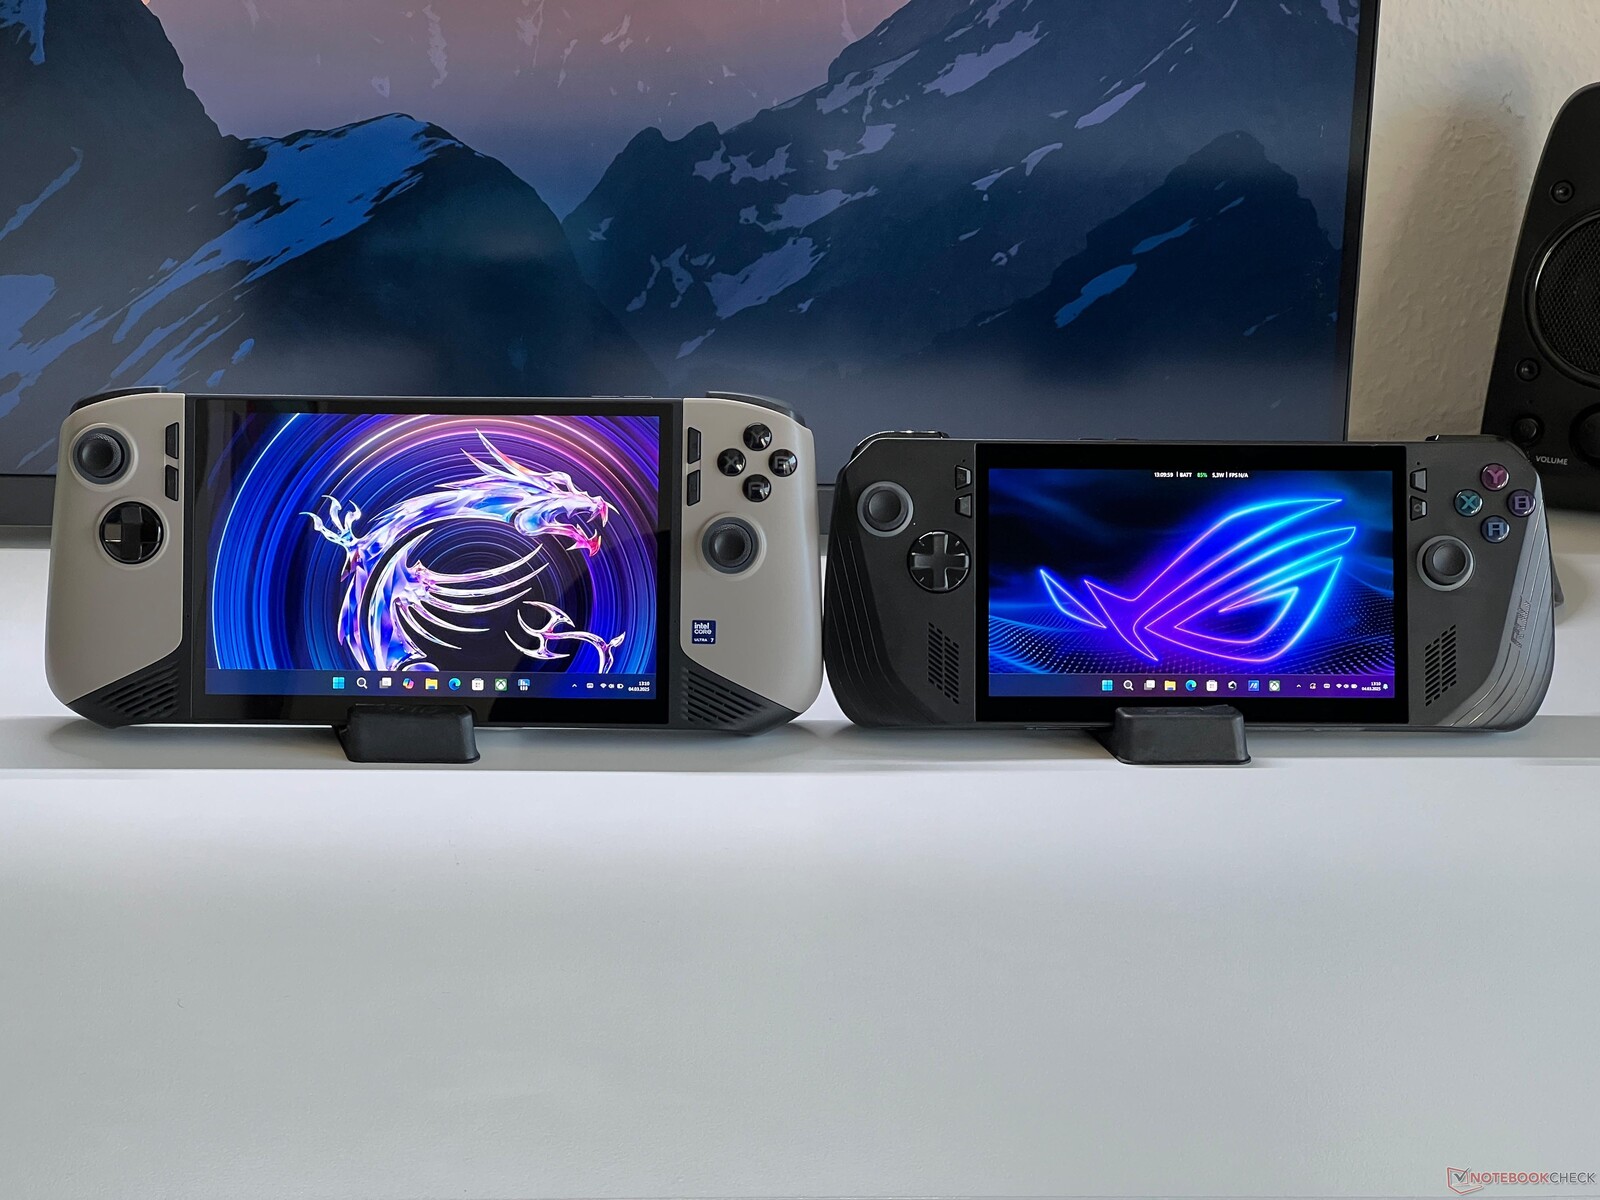
微星新推出的 Claw 8 AI+ 是该厂商首款游戏掌机的重大改进。此外,它还配备了英特尔更高效的 Lunar Lake 处理器、刷新率达 120Hz 的更大 8 英寸显示屏和 VRR,以及 80 瓦时的大电池。Andreas Osthoff, 👁 Andreas Osthoff (translated by DeepL / Ninh Duy) Published 🇺🇸 🇩🇪 ...
结论 - MSI Claw 8 AI+ 是最好的游戏掌上电脑之一,但也非常昂贵
微星对其第二代游戏掌上电脑进行了大规模改进,但在原版表现如此糟糕的情况下,这是很有必要的。其低效的流星湖处理器尤其是个问题。不过,由于采用了新的 Claw 8 AI+ 的 Lunar Lake 芯片,这款机型的表现要好得多。这意味着更好的游戏性能(与 ROG Ally X相比)、更低的能耗和更长的运行时间。它的风扇也变得更安静了,但微星真的应该看看它们在持续负载下的波动速度。
在连接性方面,该设备的第二个 USB-C 端口非常受欢迎,其更大的 IPS 屏幕也令人印象深刻,刷新率高达 120 赫兹,并具有 VRR 功能,但其响应时间略逊于前代机型。 前代机型。
微星软件整体运行良好,但有时会有些卡顿,而且其功能范围赶不上华硕的同类产品。这款掌上电脑的能耗曲线也有点尴尬,因为它的人工智能引擎只能提供降低的性能。考虑到它的性能和功能,899.99 美元的价格在我们看来是合理的,但当然也不是什么便宜货。
Pros
Cons
可能的替代品比较
Image | Model / Review | Price | Weight | Height | Display |
|---|---|---|---|---|---|
1. 84.7%  | MSI Claw 8 AI+ Intel Core Ultra 7 258V ⎘ Intel Arc Graphics 140V ⎘ 32 GB Memory, 512 GB SSD | Amazon: 1. $1,349.00 MSI Claw A1M Gaming Laptop (... 2. $629.99 MSI Claw PC Gaming Handheld:... 3. $9.98 GXLYFG 3 Pack Tempered Glass... List Price: 999€ | 793 g | 30 mm | 8.00" 1920x1200 283 PPI IPS |
2. 84.6%  | Asus ROG Ally X AMD Ryzen Z1 Extreme ⎘ AMD Radeon 780M ⎘ 24 GB Memory, 1024 GB SSD | Amazon: $479.22 List Price: 899€ | 685 g | 36.9 mm | 7.00" 1920x1080 315 PPI IPS |
3. 68.3%  | Lenovo Legion Go S AMD Ryzen Z2 Go ⎘ AMD Radeon 680M ⎘ 16 GB Memory, 512 GB SSD | Amazon: 1. $8.99 Fhyeugfy for Lenovo Legion G... 2. $64.99 Legion Go USB-C Hub Dock for... 3. $22.99 Hard Case Compatible with MS... List Price: 700€ | 738 g | 22.6 mm | 8.00" 1920x1200 283 PPI IPS-Grade |
4. 88.9% v7 (old)  | Valve Steam Deck 1 TB OLED AMD Steam Deck OLED APU ⎘ AMD Radeon Steam Deck 8CU ⎘ 16 GB Memory, 1024 GB SSD | Amazon: $524.06 List Price: 679€ | 640 g | 49 mm | 7.40" 1280x800 204 PPI OLED |
5. 80.2%  | GPD Pocket 4 AMD Ryzen AI 9 HX 370 ⎘ AMD Radeon 890M ⎘ 32 GB Memory | Amazon: List Price: 1400 USD | 777 g | 22.2 mm | 8.80" 2560x1600 343 PPI IPS |
6. 77.4%  | MSI Claw Intel Core Ultra 7 155H ⎘ Intel Arc 8-Core iGPU ⎘ 16 GB Memory, 1024 GB SSD | Amazon: $530.21 List Price: 849€ | 672 g | 33 mm | 7.00" 1920x1080 315 PPI IPS |
7. 84.9% v7 (old)  | ONEXPLAYER 2 Pro AR18 AMD Ryzen 7 7840U ⎘ AMD Radeon 780M ⎘ 32 GB Memory | Amazon: List Price: 1017 USD | 876 g | 43 mm | 8.40" 2560x1600 IPS |
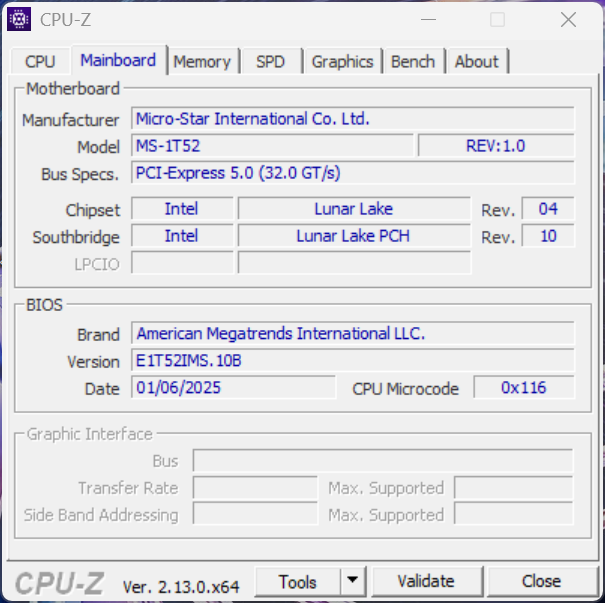
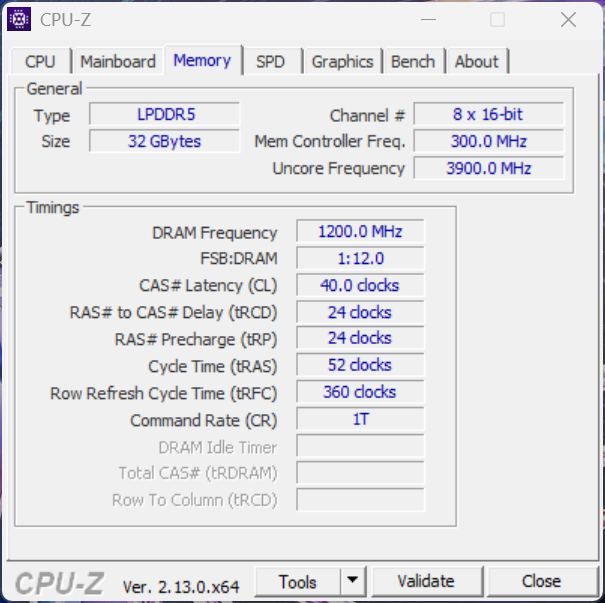
微星的 Claw 8 AI+ 是该厂商的第二代游戏掌机,性能大幅提升,但仍使用英特尔处理器。我们的测试设备是售价 899.99 美元的微星 Claw 8 AI+ AV2M-015 版本,配备了 英特尔酷睿 7 258V(Lunar Lake)、32 GB 内存、1 TB 固态硬盘以及刷新率为 120 Hz 和 VRR 的全新 8 英寸 IPS 显示屏。
规格
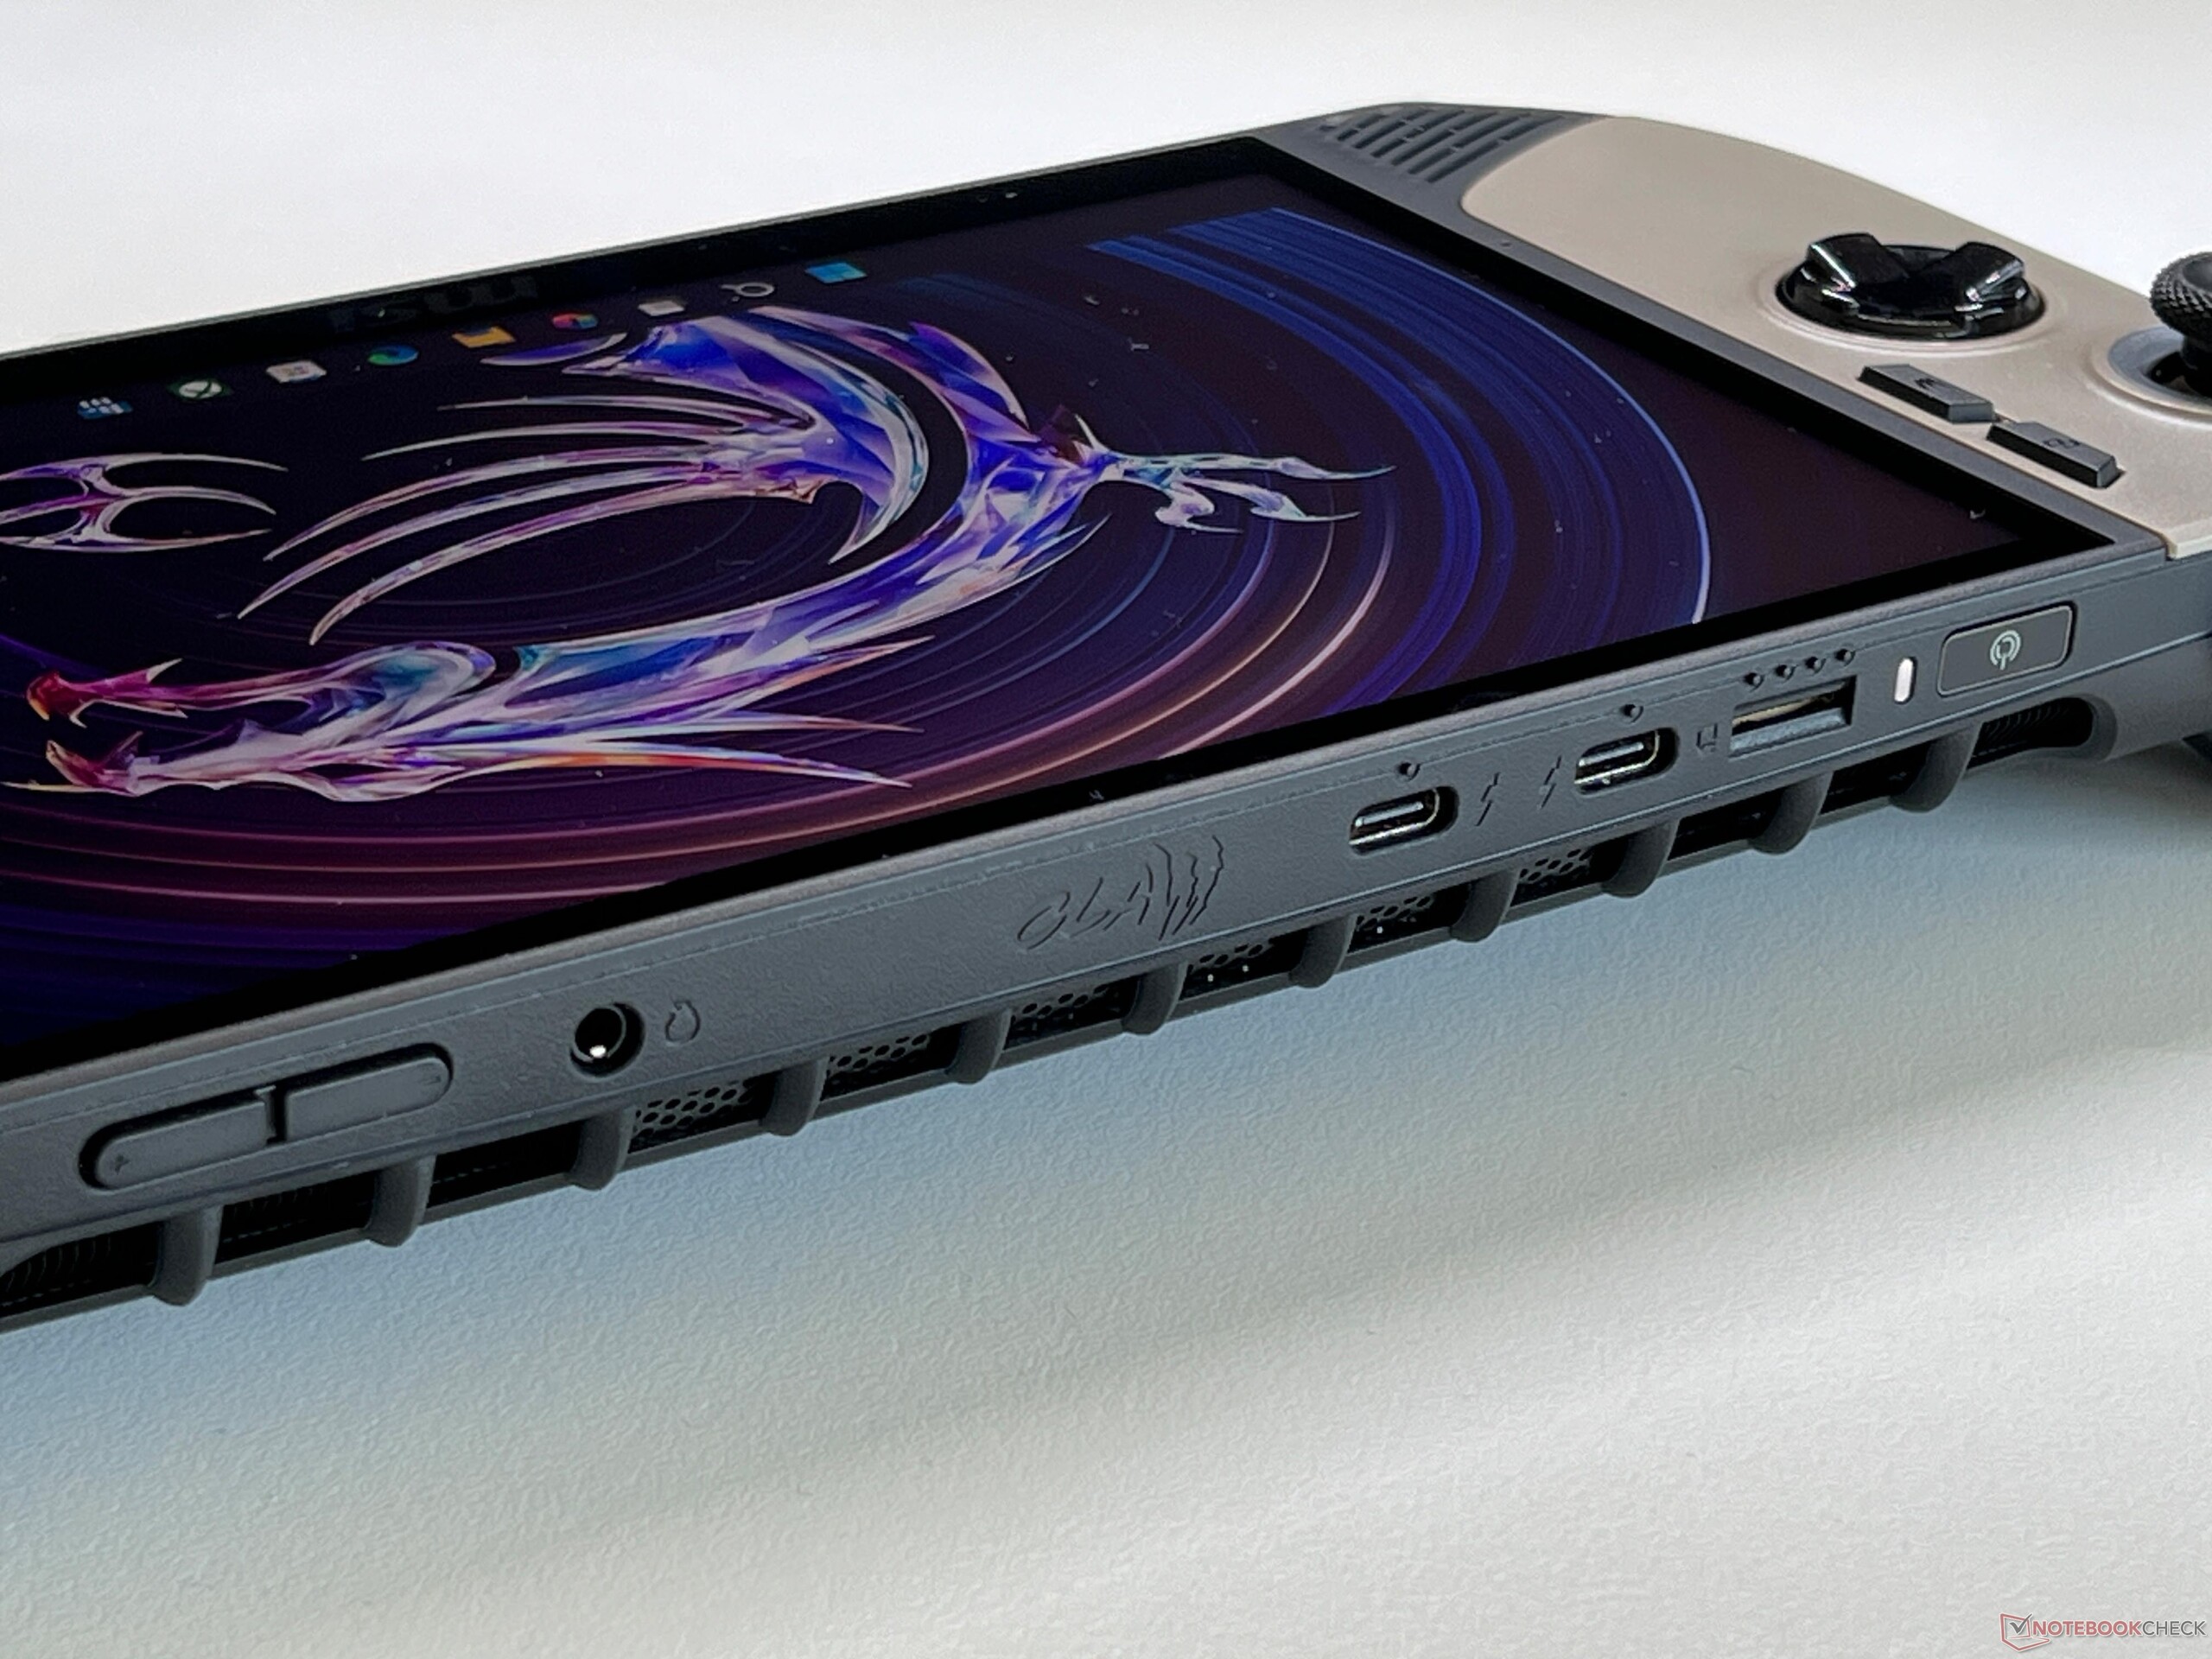
外壳和连接
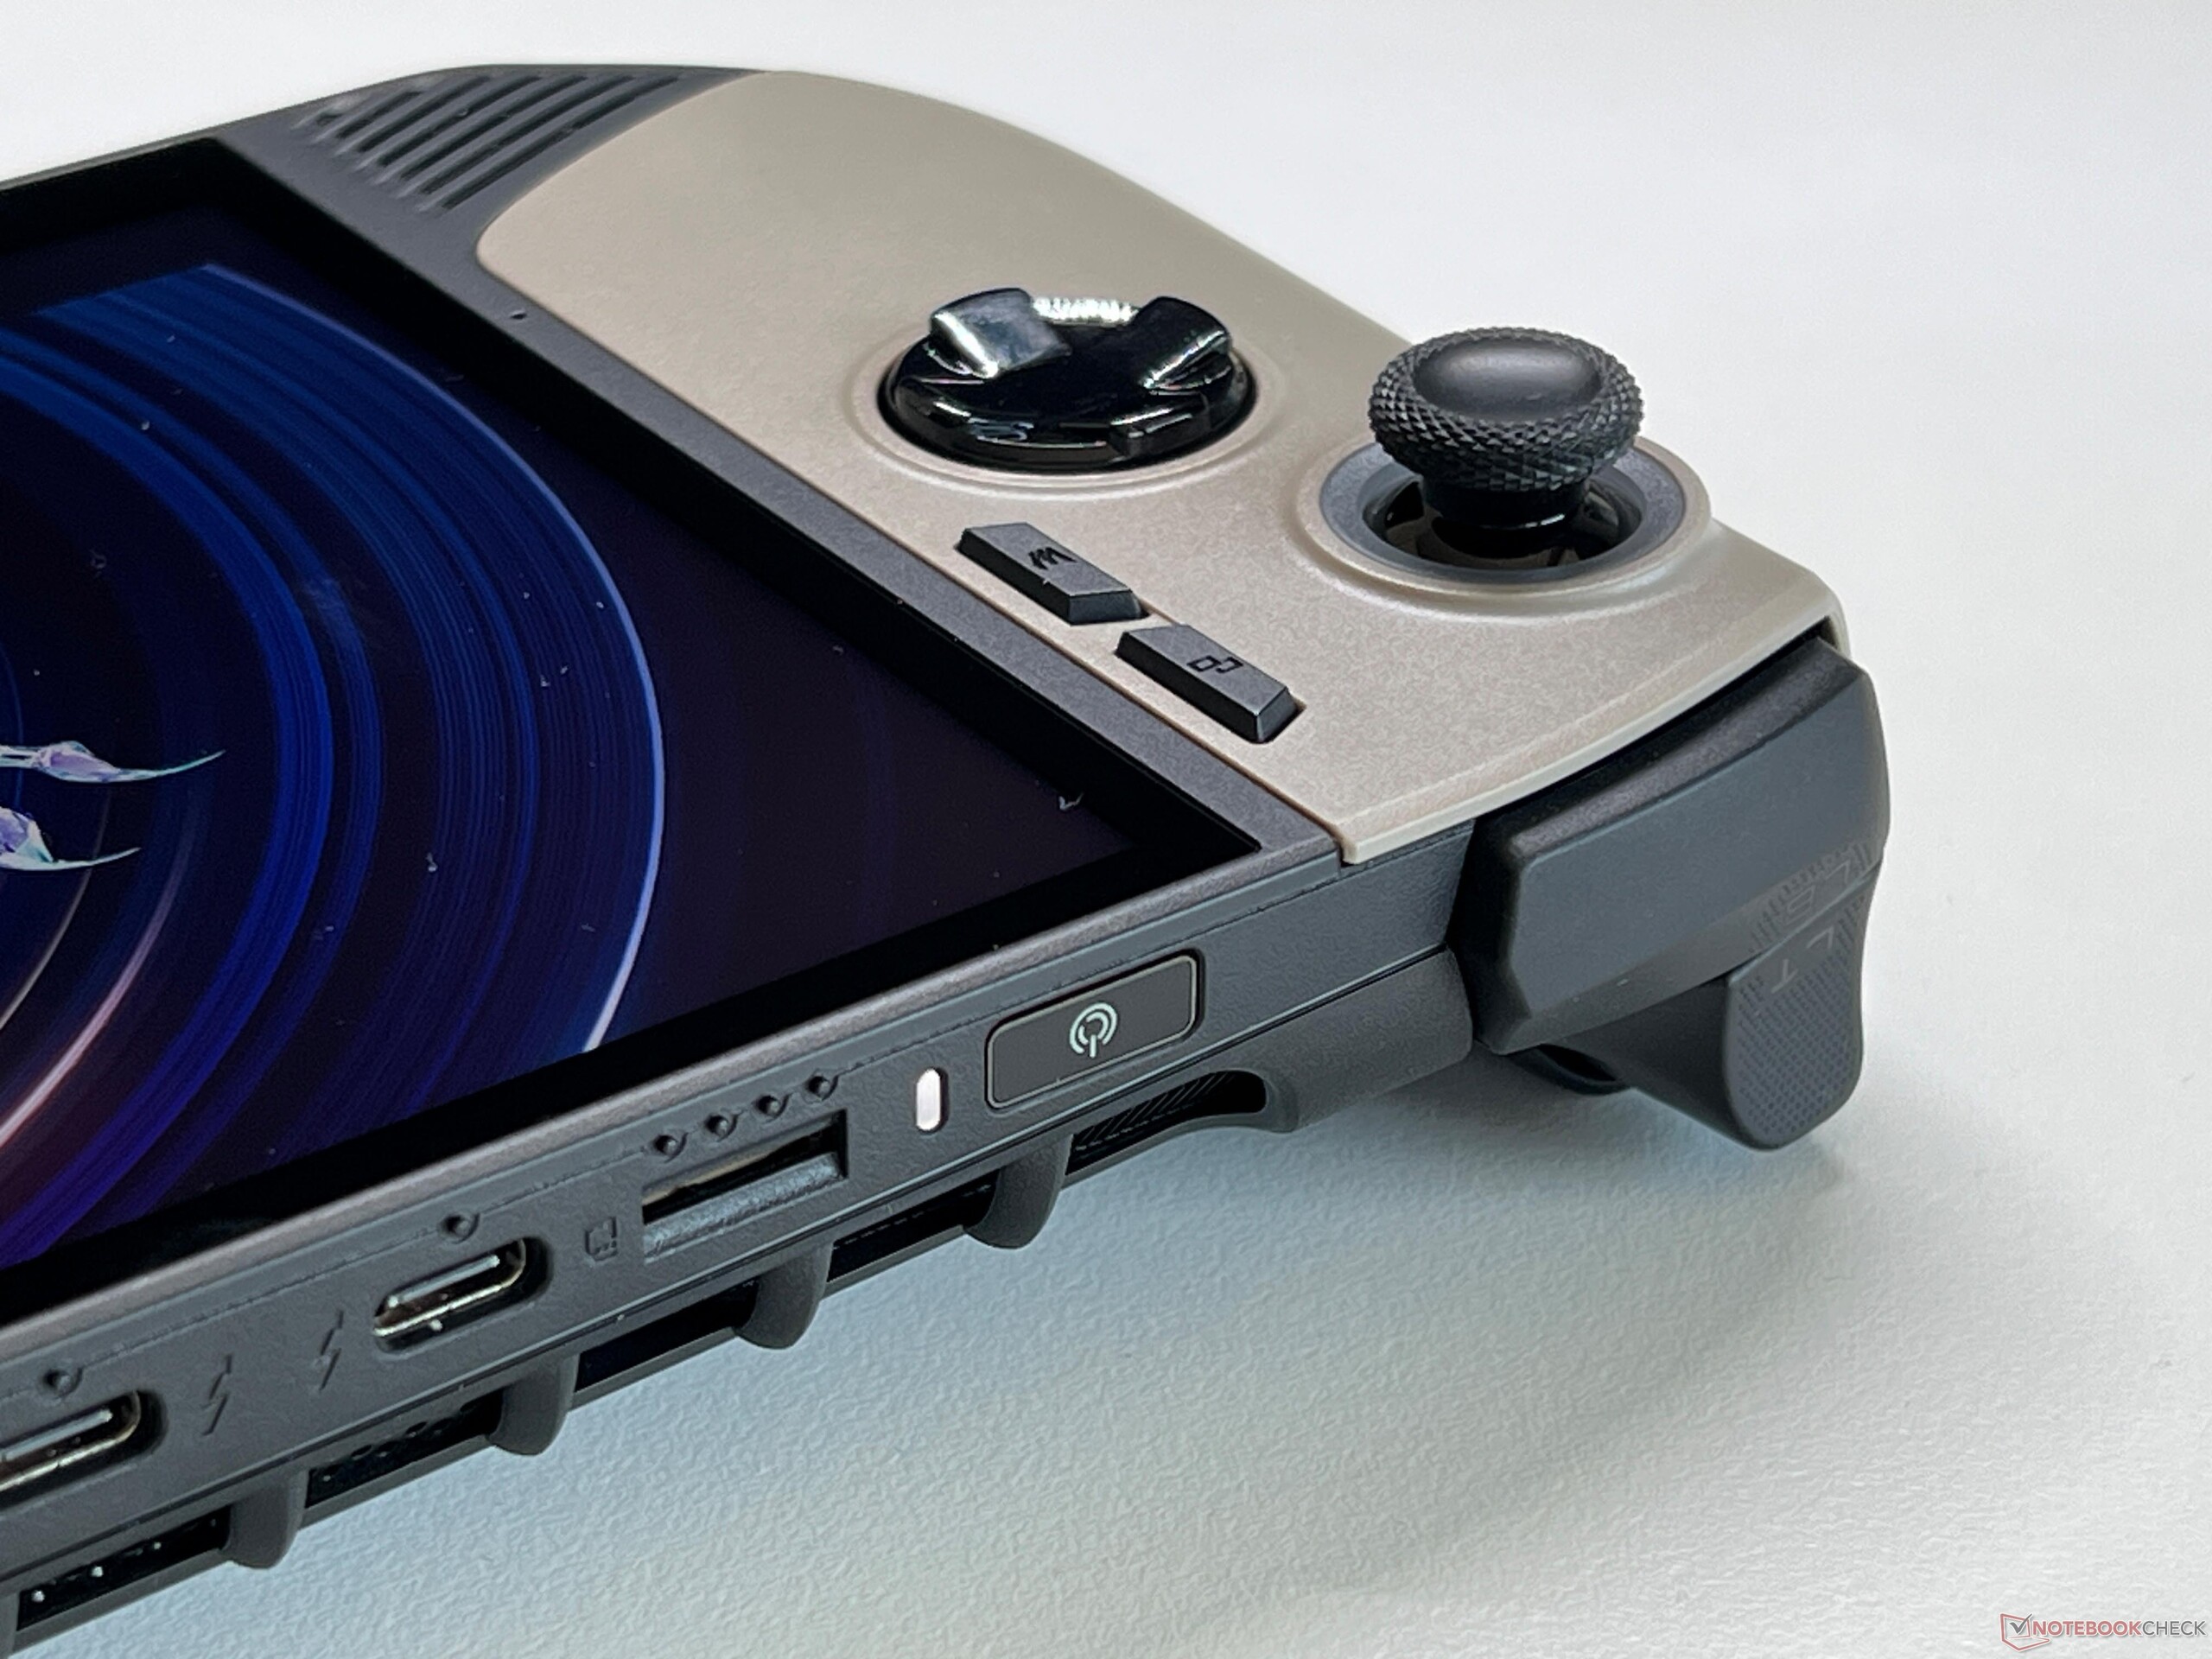
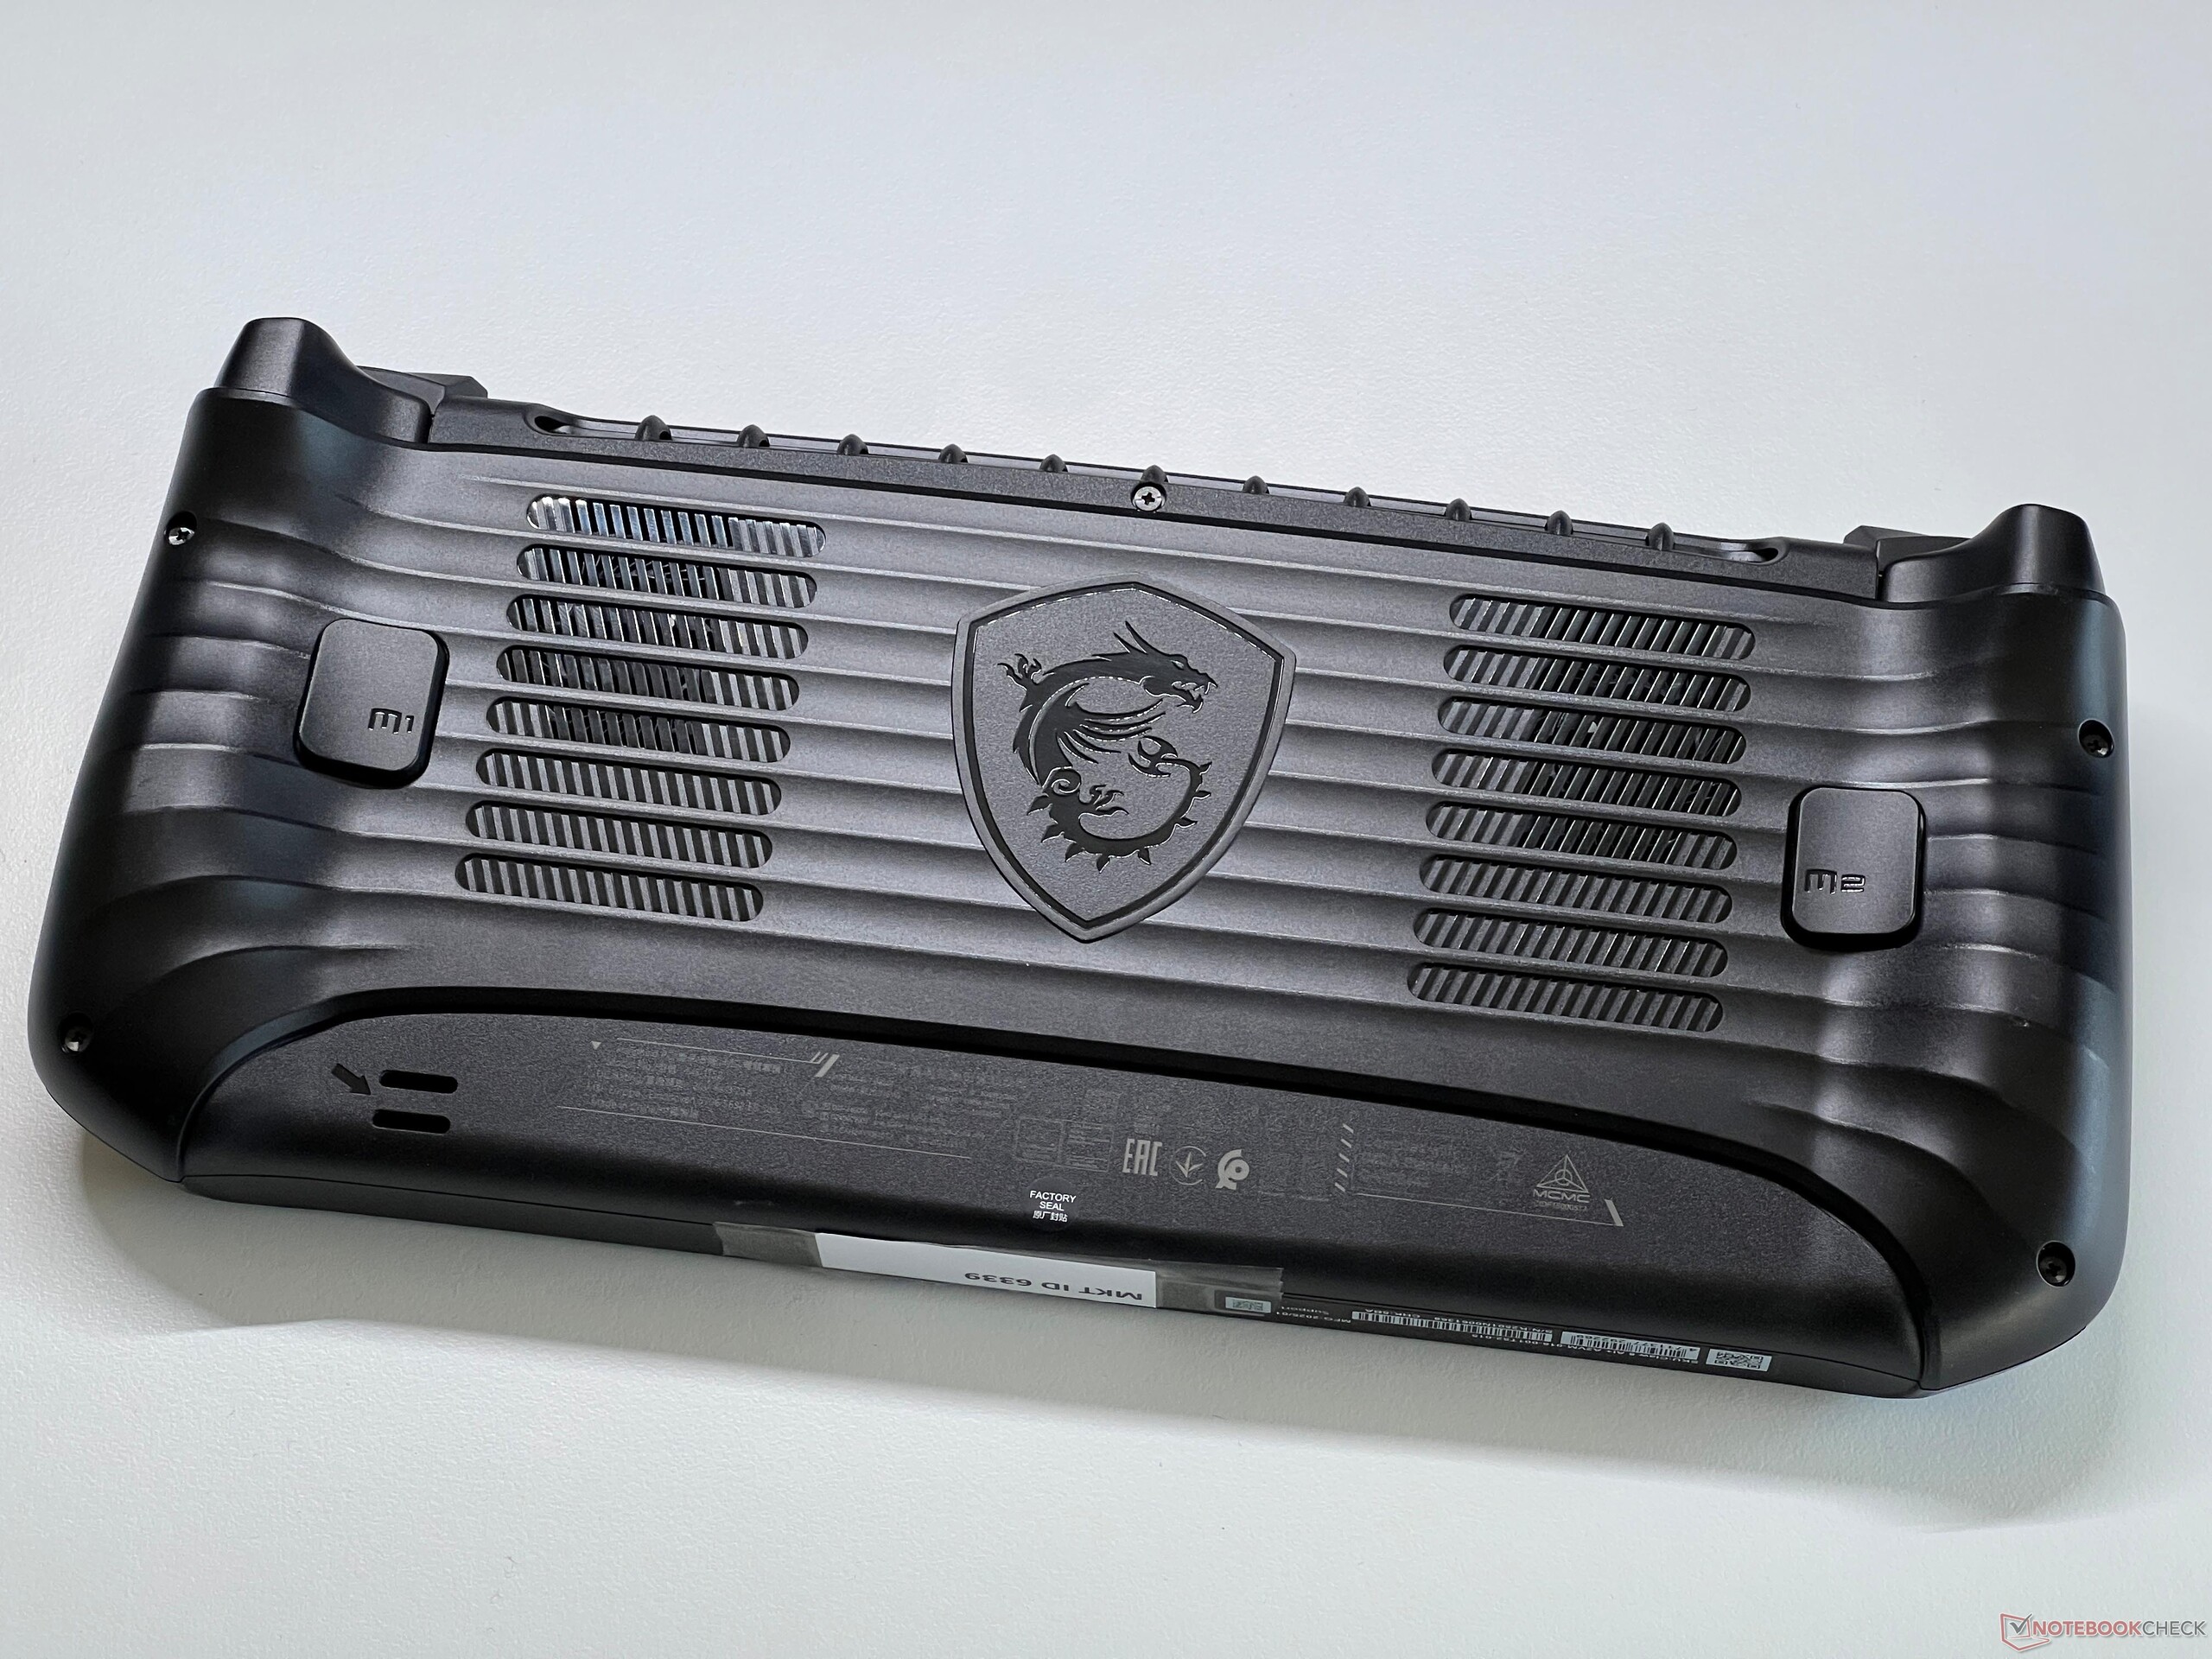
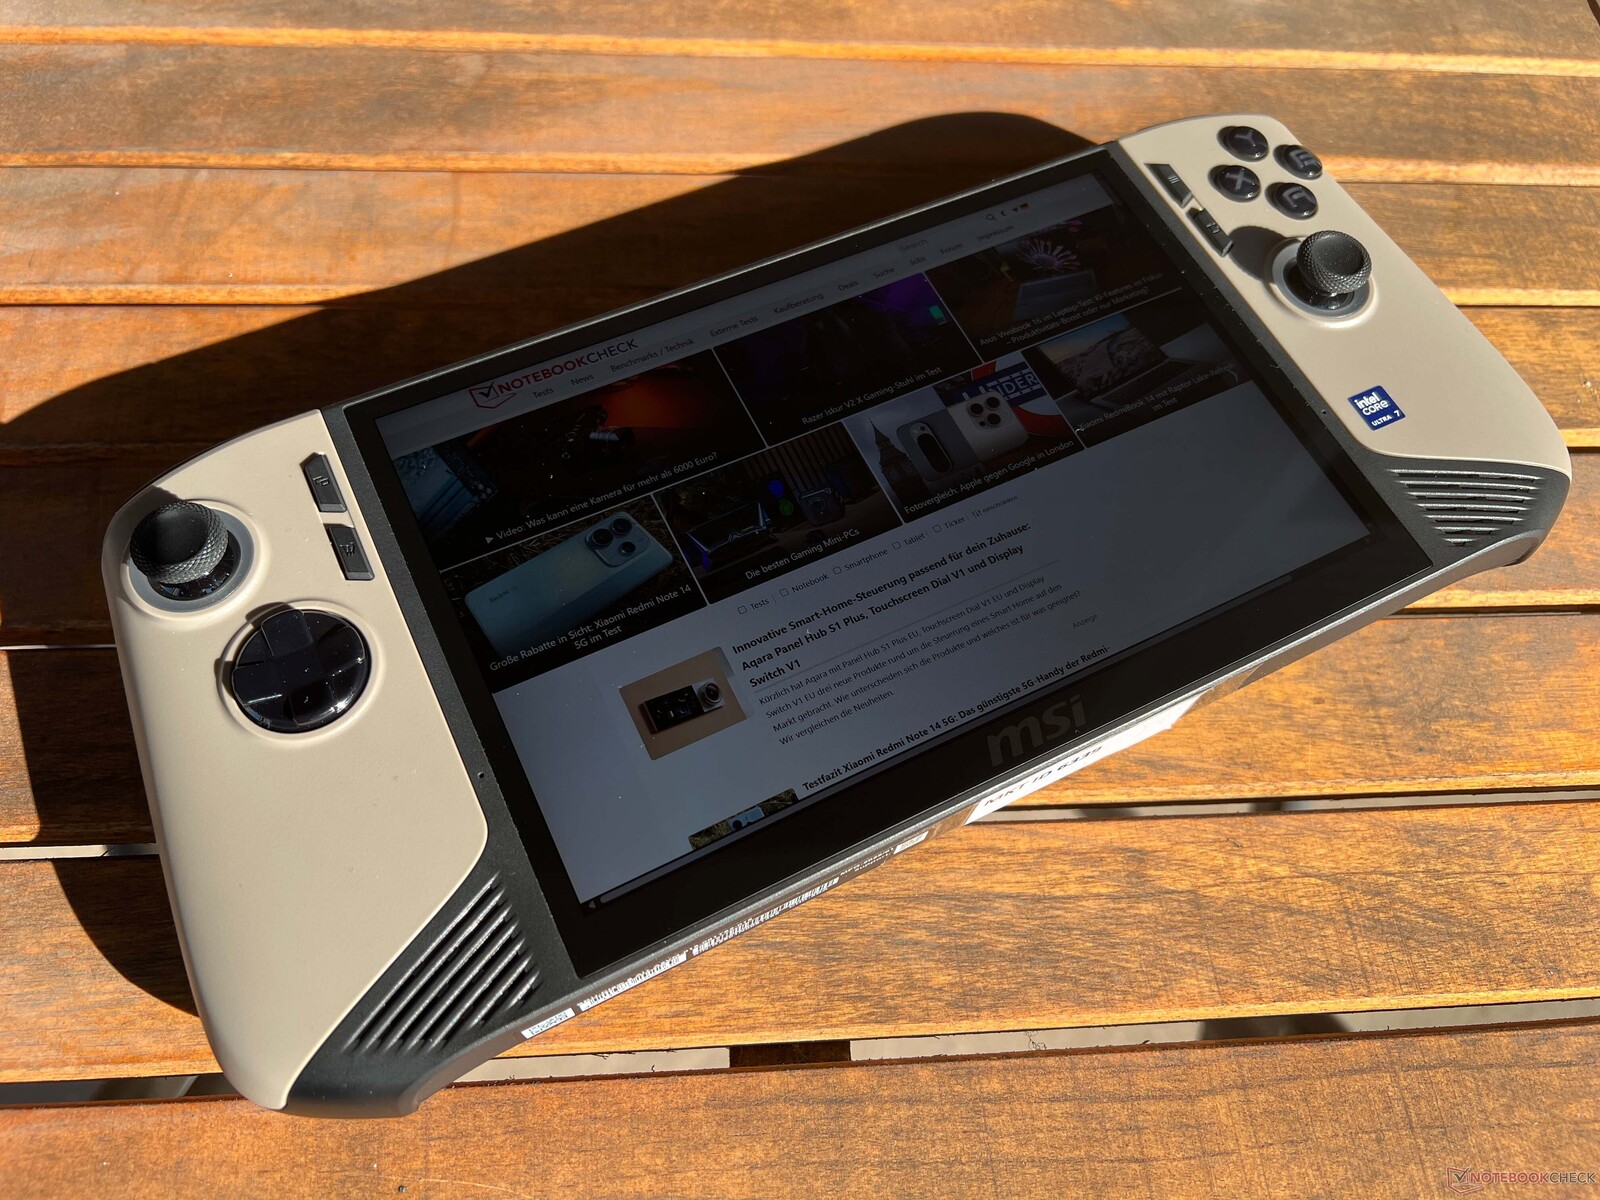
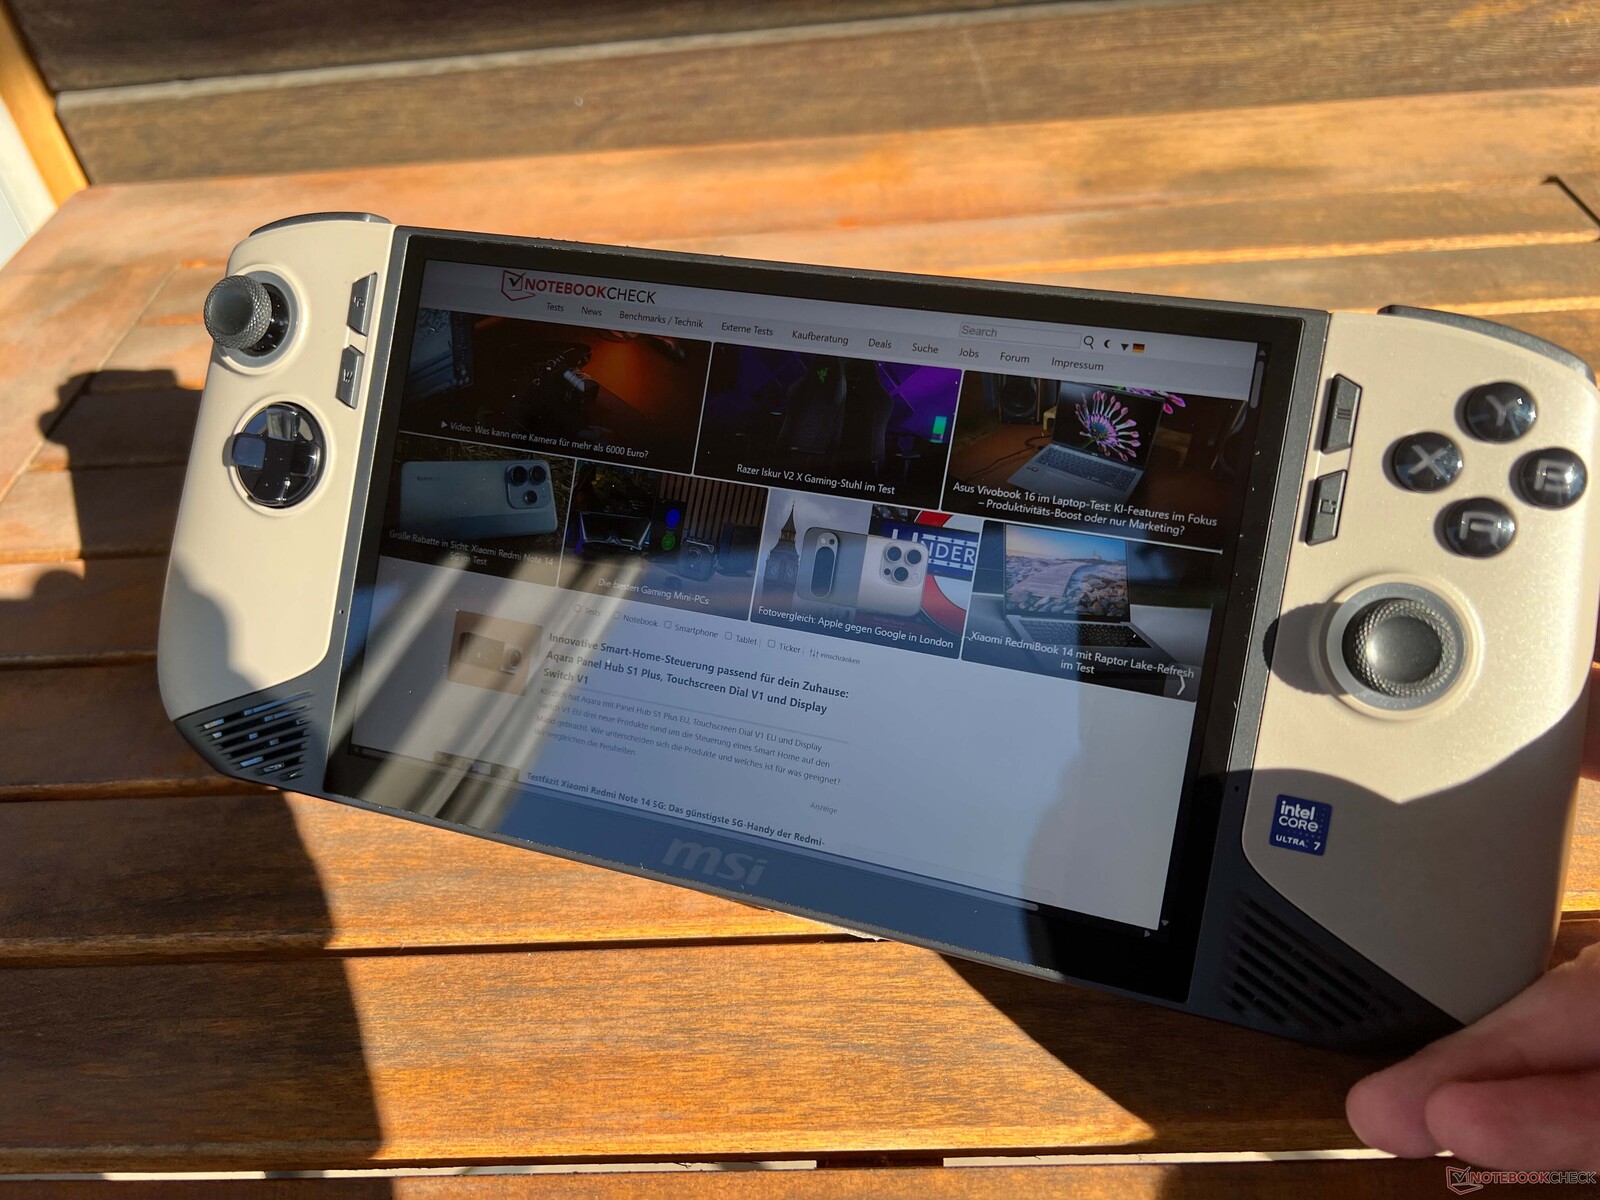
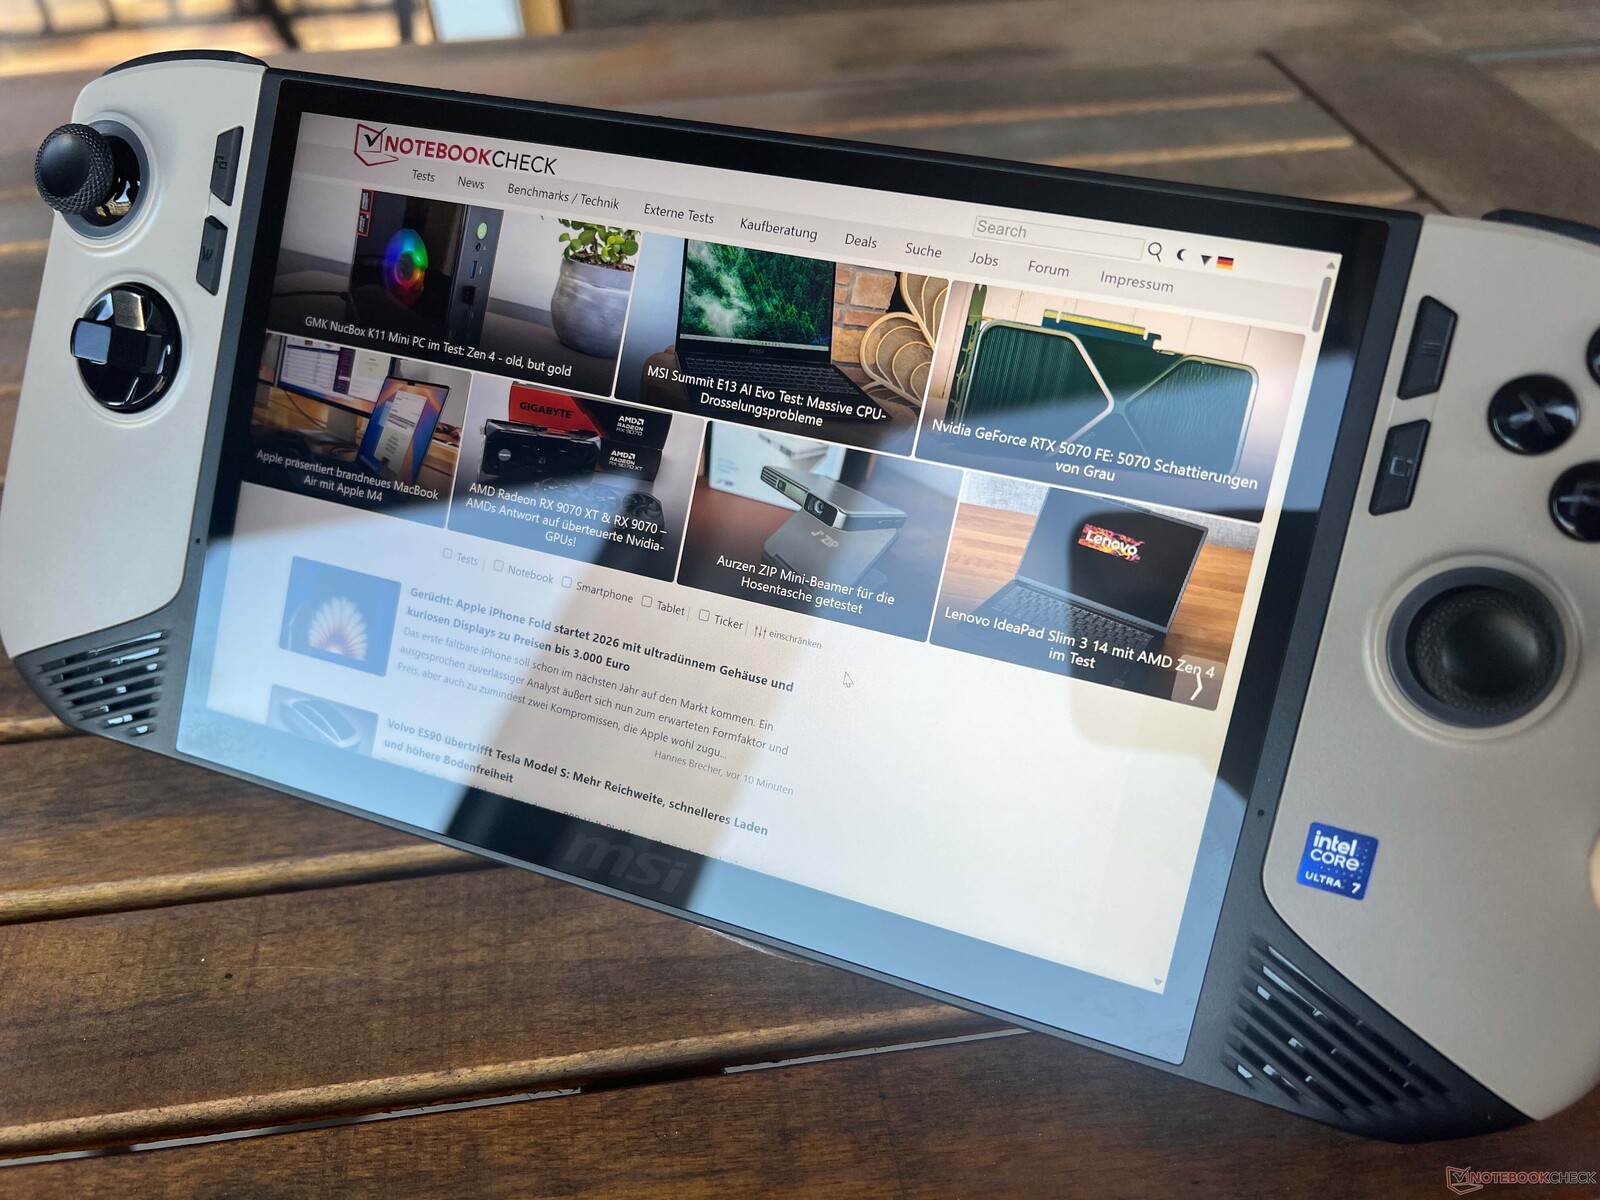
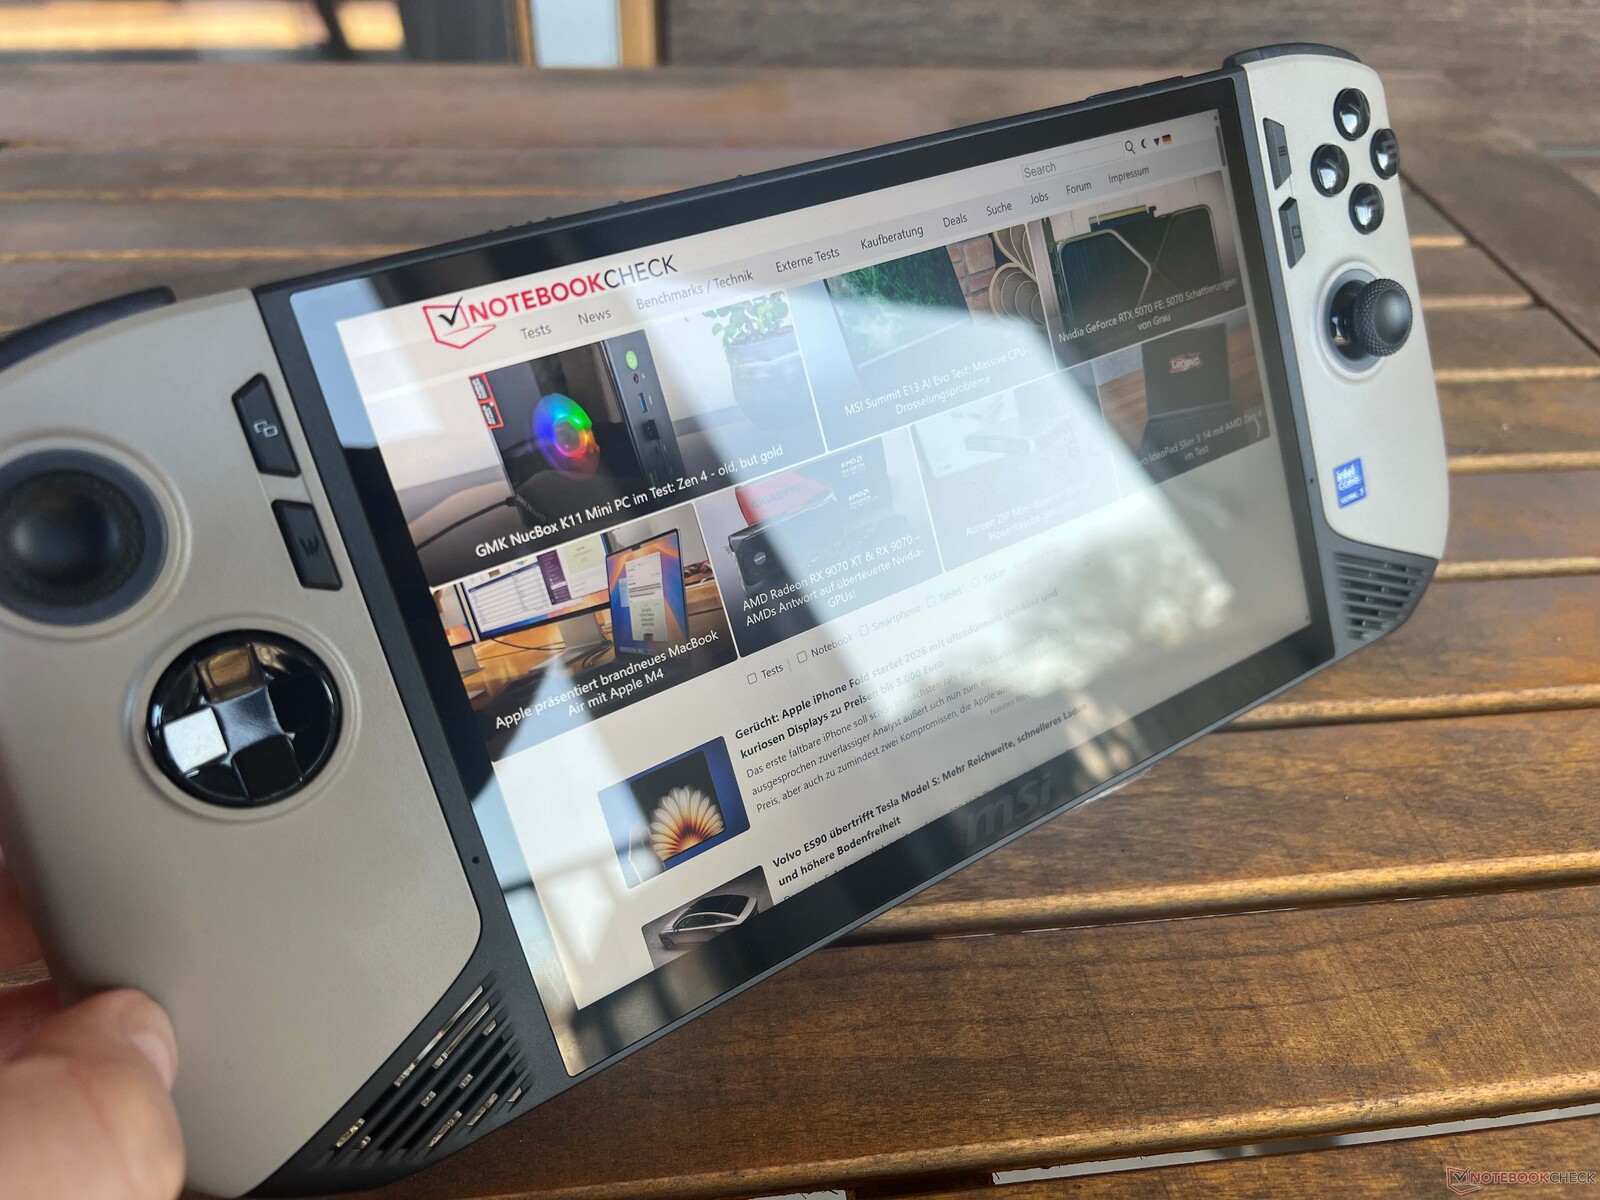
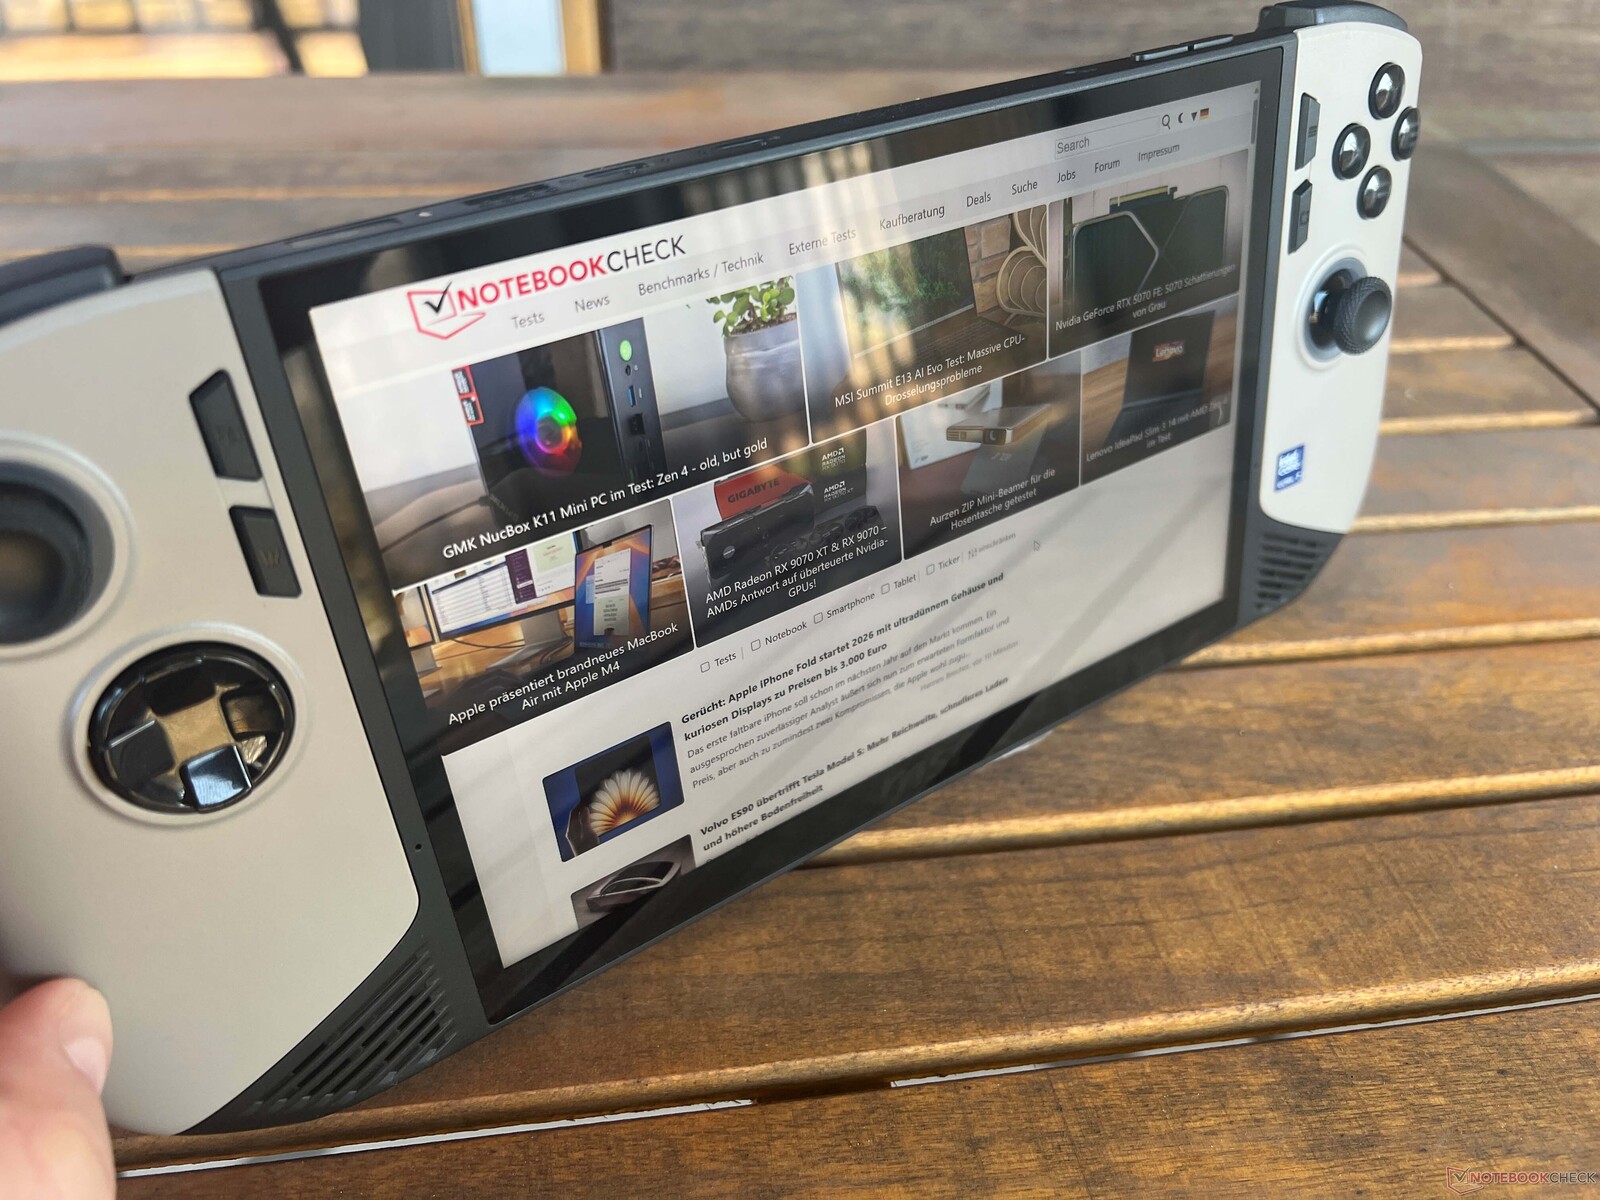
微星对这款掌上电脑的设计进行了重大改动,除了外壳更大之外,手柄也变成了沙色,看起来非常漂亮。这让该设备看起来更有质感,也使其有别于一般只有黑色的竞争对手。这两款手柄再次采用了 LED 光环。尽管 Claw 8 的外壳较大,但手感很好,我们可以长时间使用而没有任何问题。它的稳定性和制造质量都非常好,我们没有注意到吱吱作响的声音。
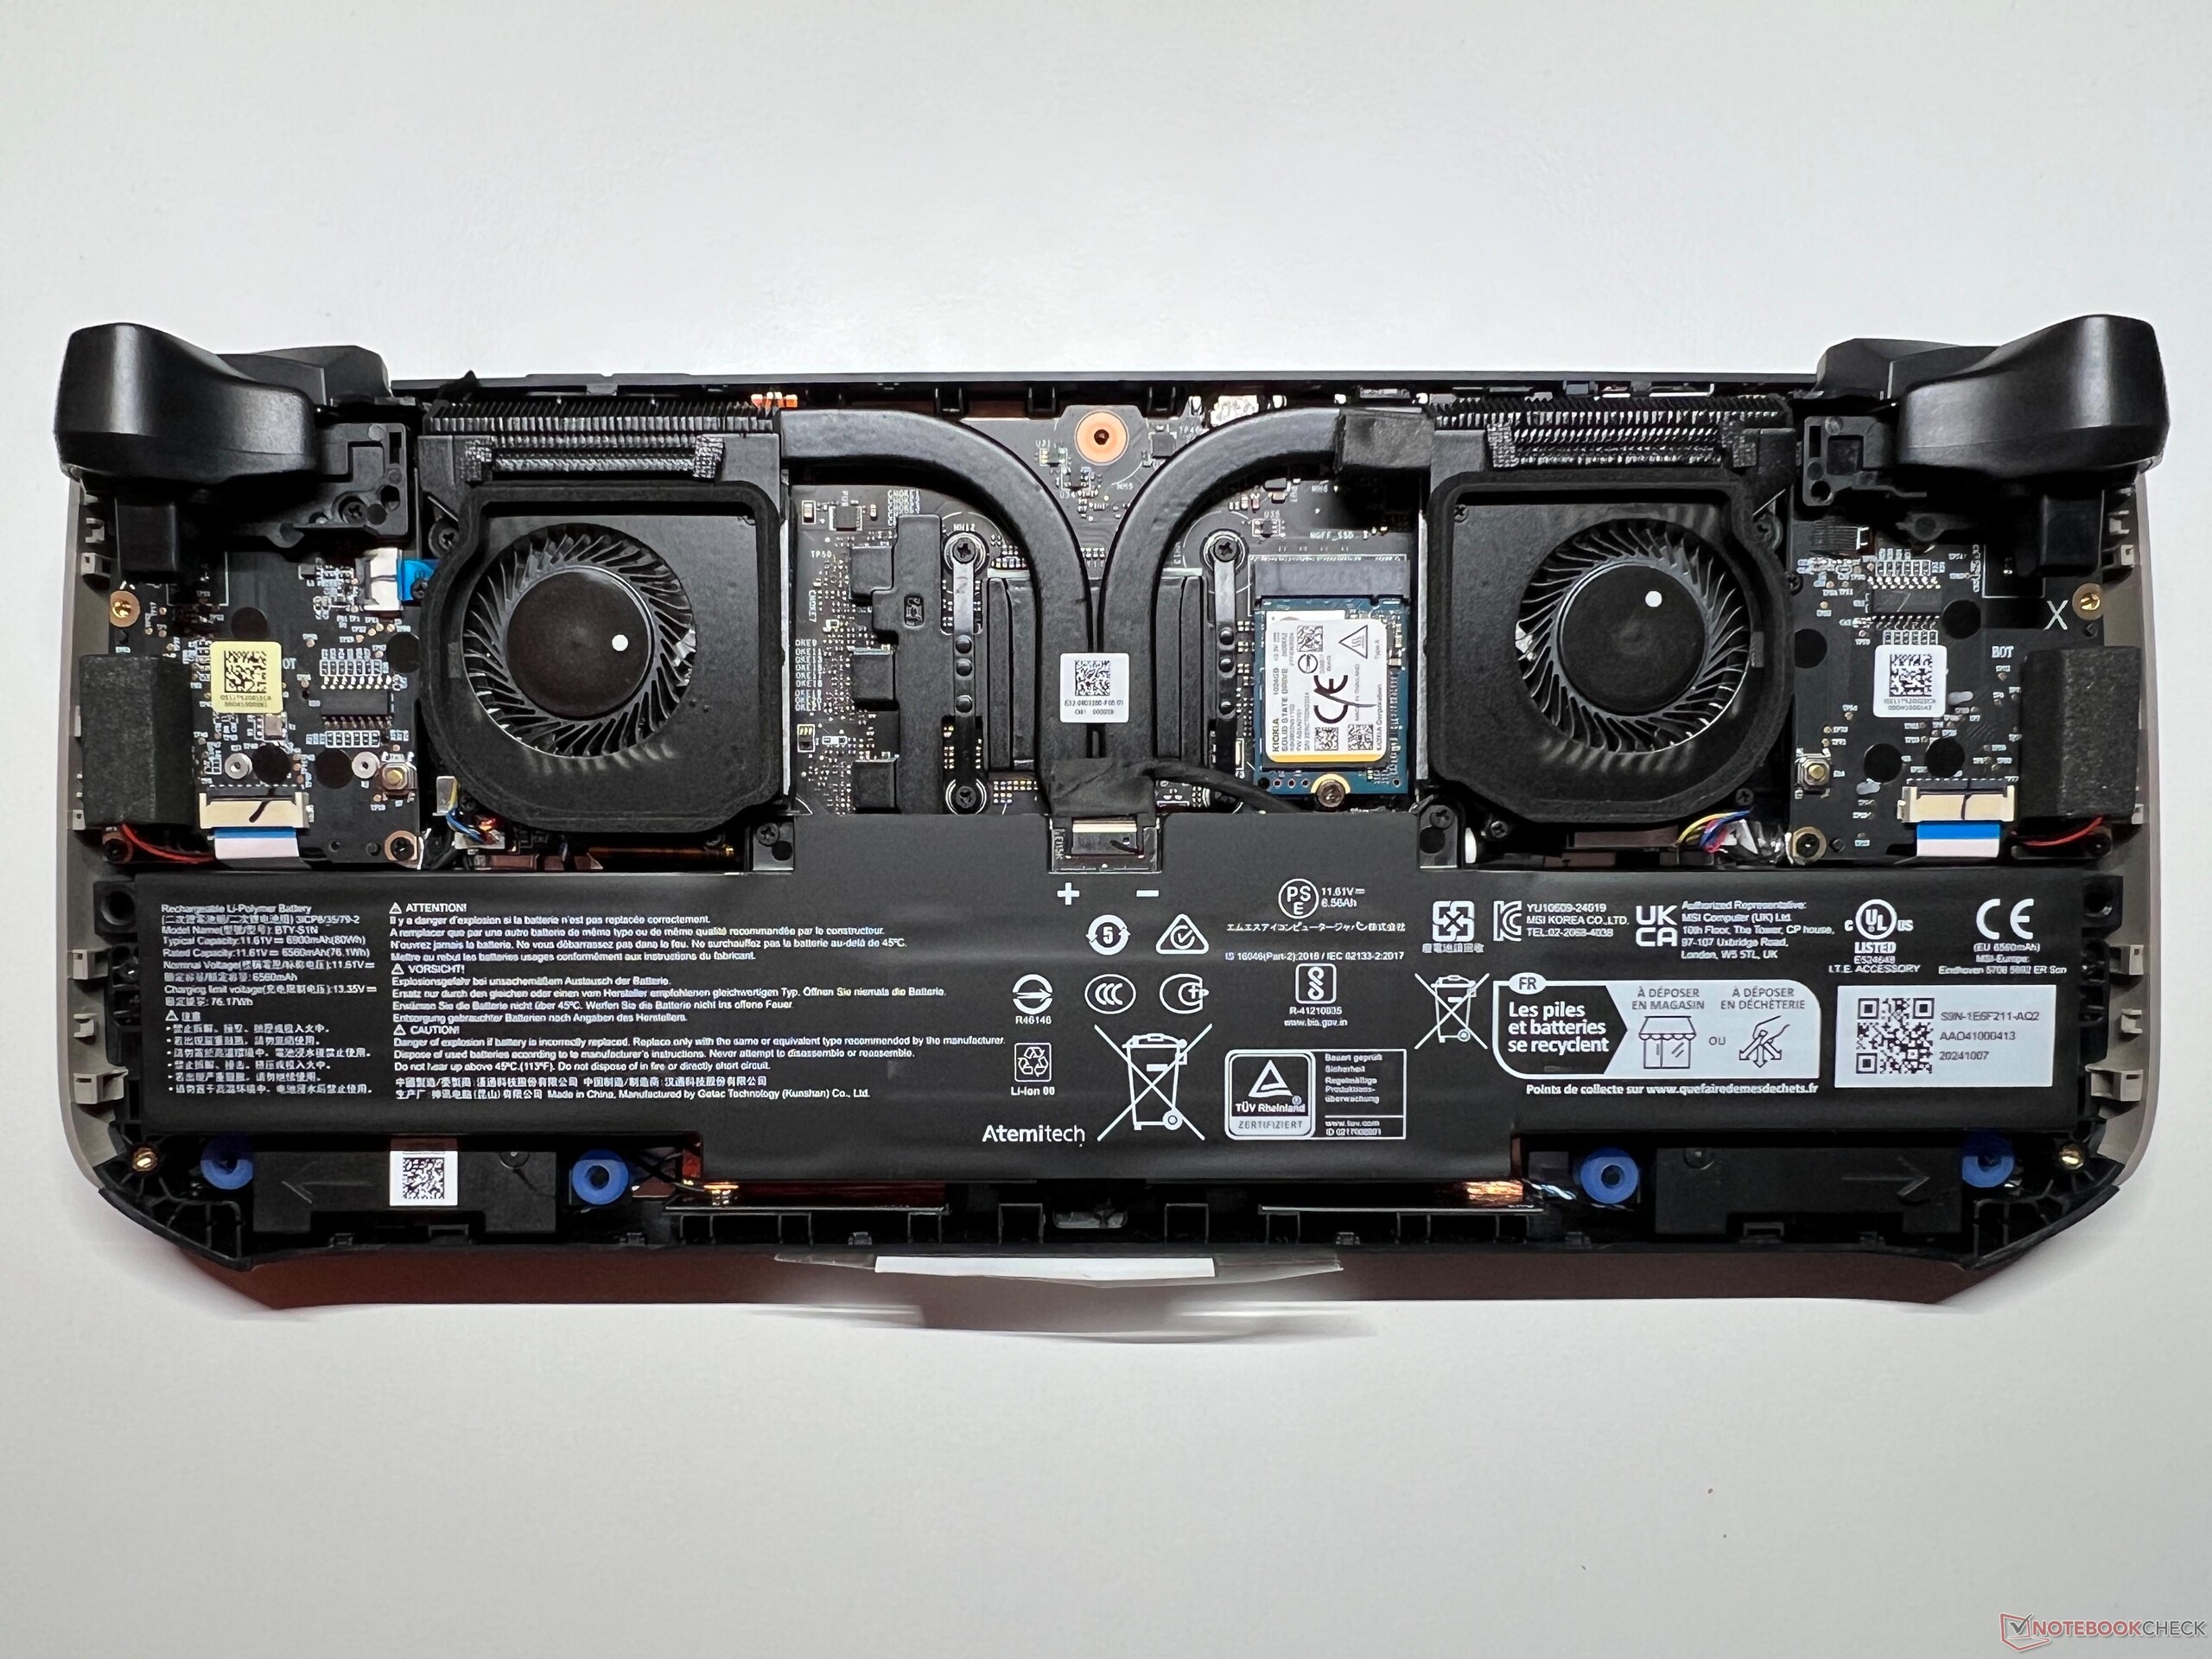
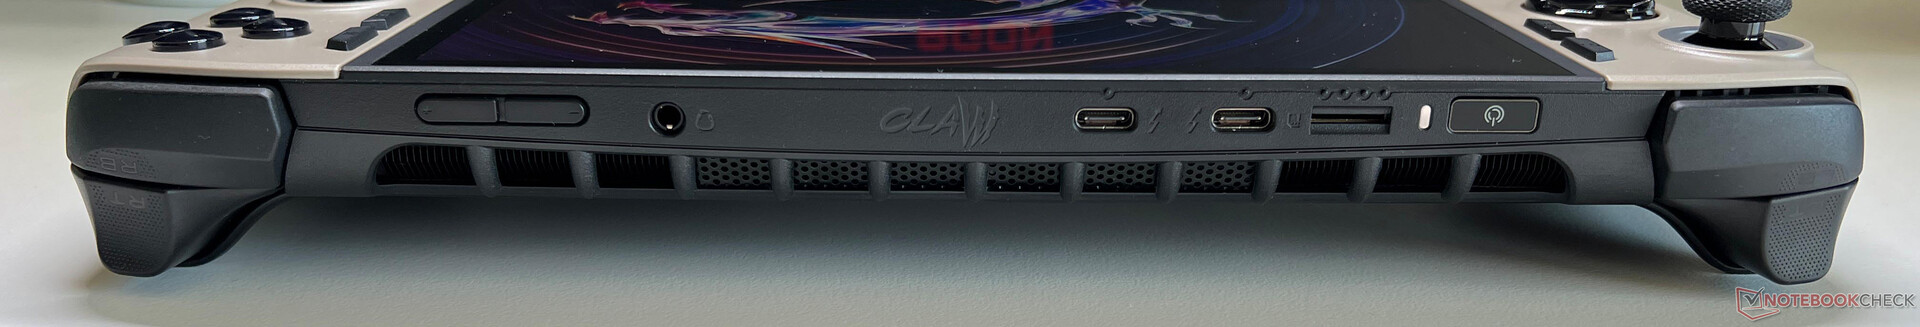
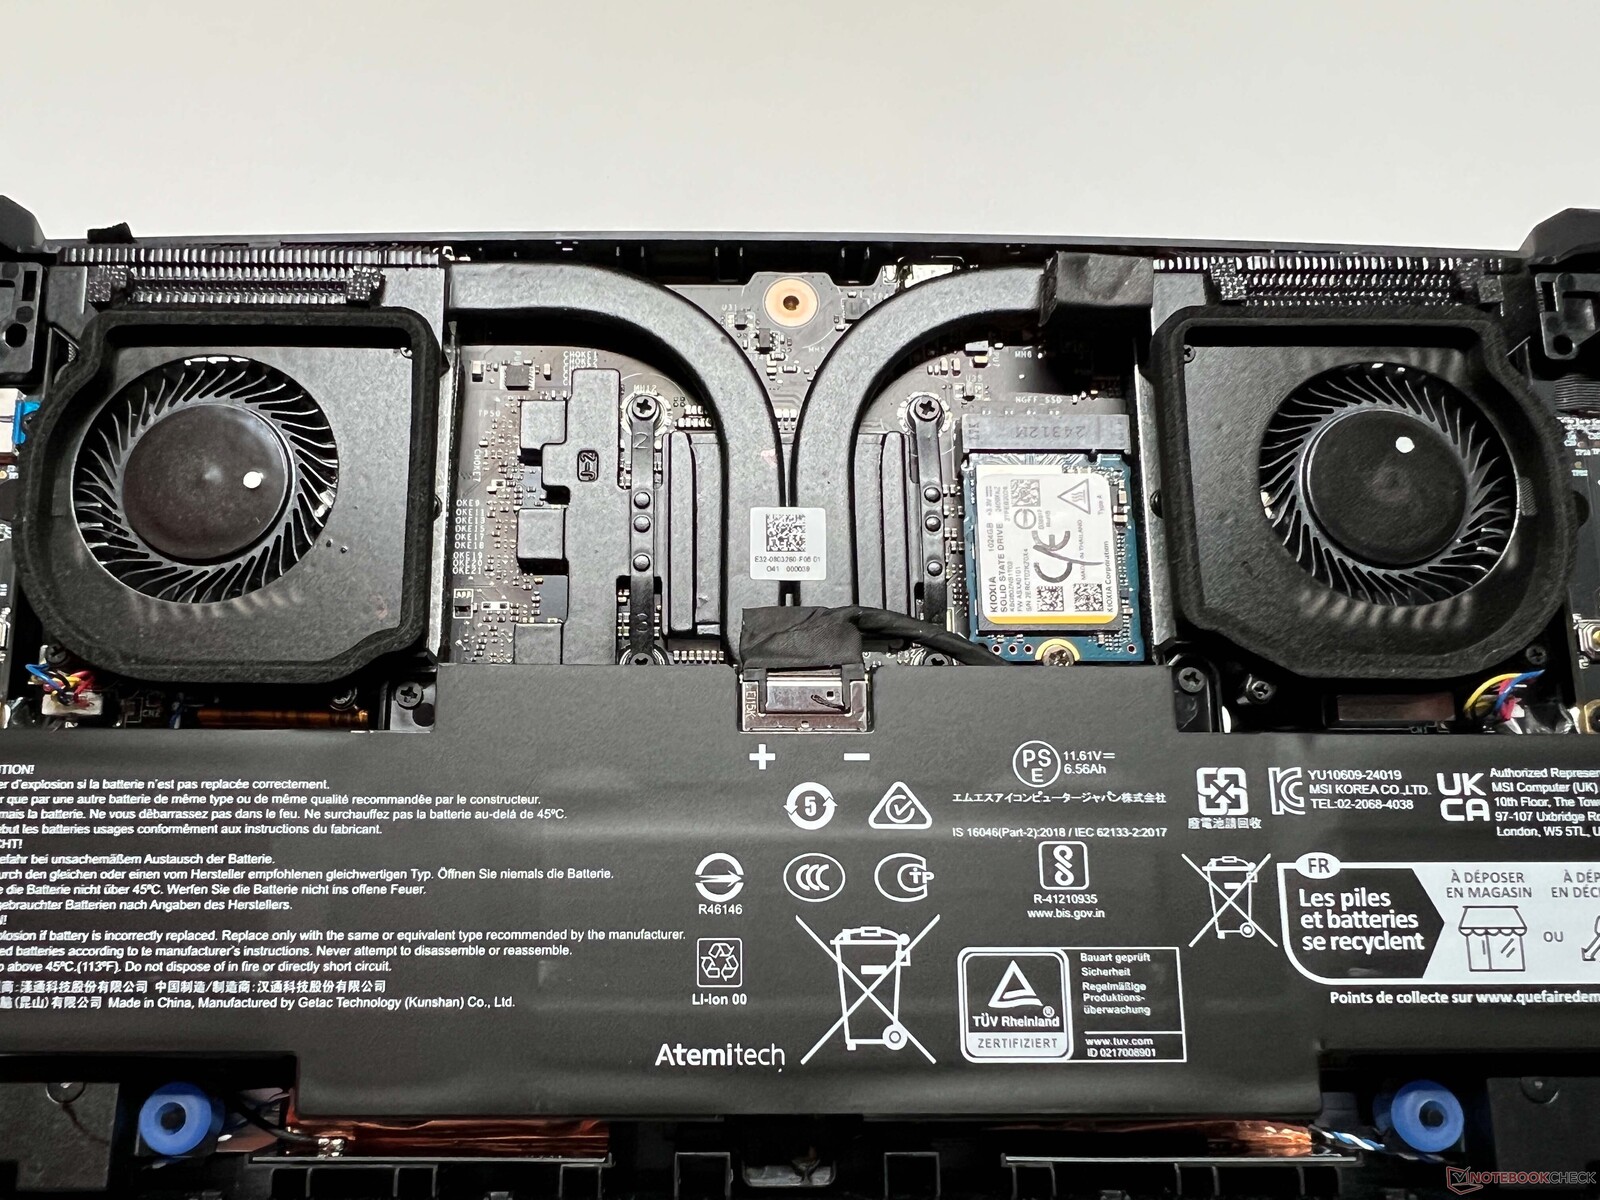
机箱背面可以轻松拆卸,必要时可以更换 M.2-2230 固态硬盘和电池。现在还有第二个 Thunderbolt 4 端口可用,设备的快速 microSD 读卡器和 Wi-Fi 7 模块依然存在。它是一款 Copilot+ 设备,但没有安装网络摄像头。它的部分包装可以改装成支架。


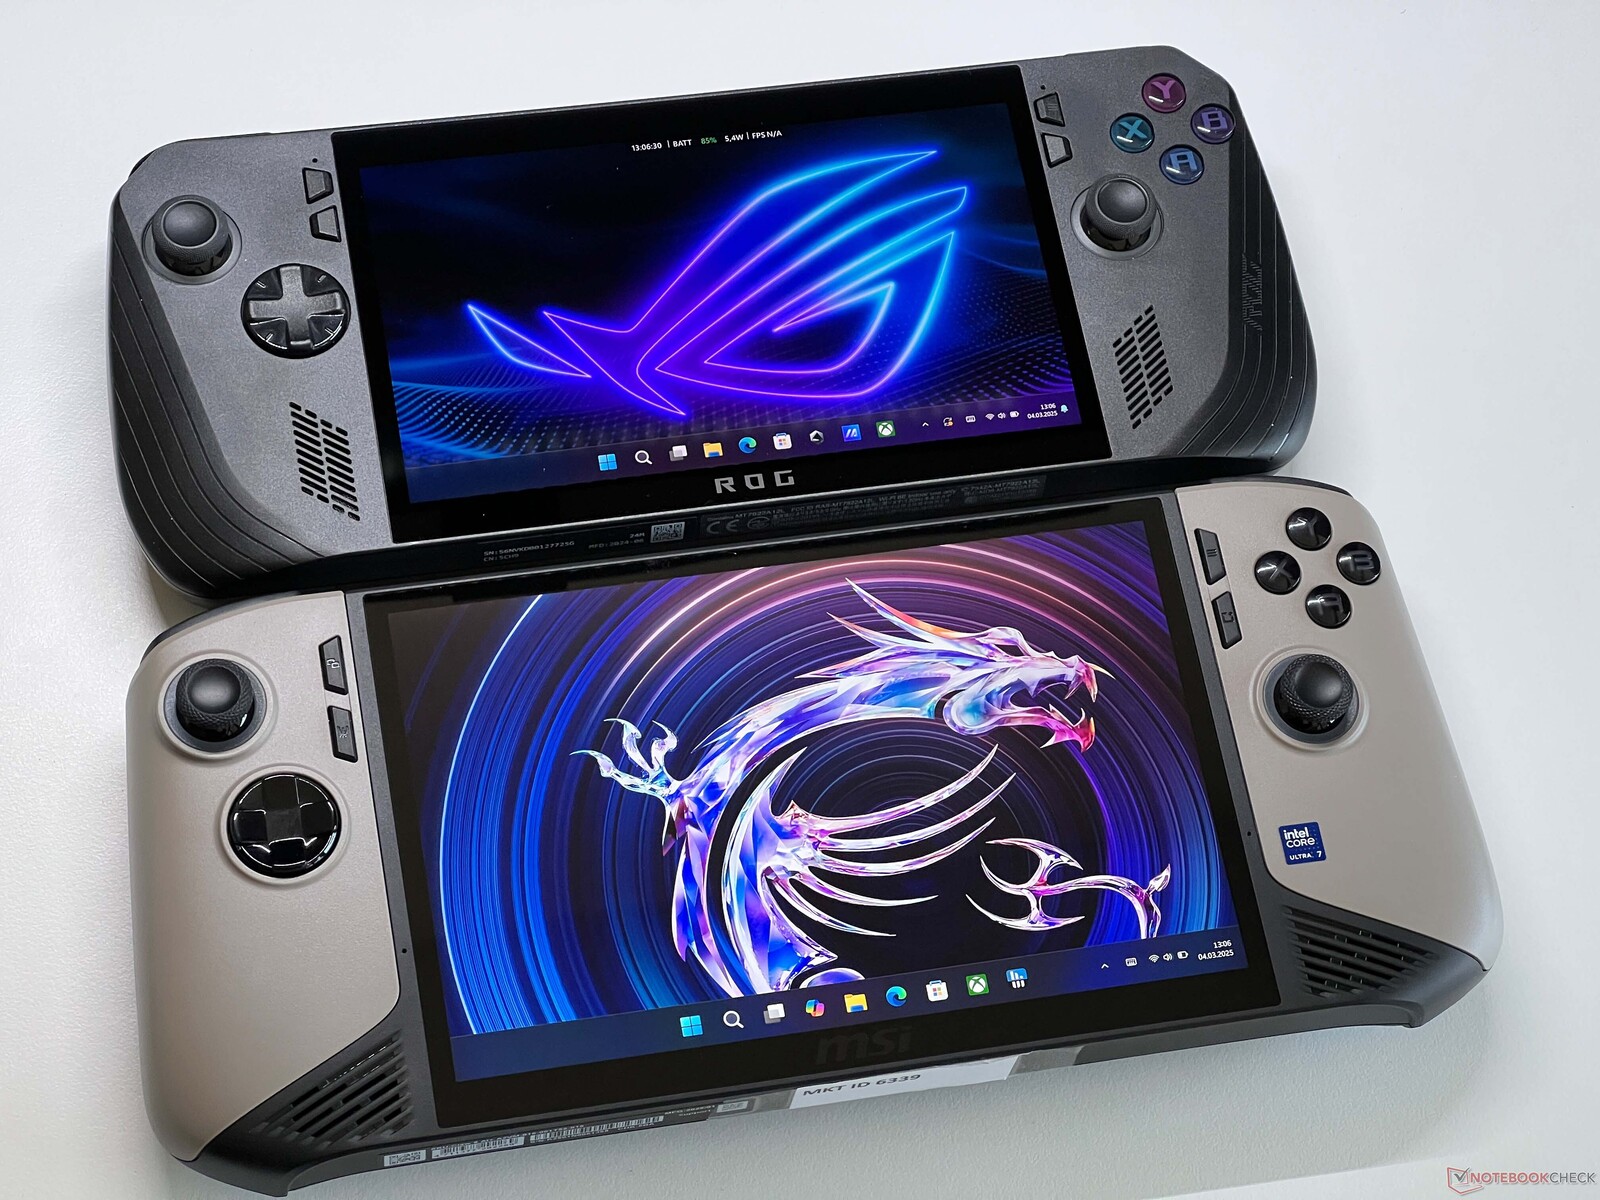
与 ROG Ally X,你会立即发现其 8 英寸显示屏所带来的不同,当然,这款手持设备的整体尺寸也明显更大。此外,Claw 8 的重量比 ROG Ally X 重约 100 克。
| SD Card Reader | |
| average JPG Copy Test (av. of 3 runs) | |
| MSI Claw 8 AI+ (Angelbird AV Pro V60) | |
| ONEXPLAYER 2 Pro AR18 (Angelbird AV PRO microSD) | |
| MSI Claw (Angelbird AV Pro V60) | |
| Average of class Handheld / UMPC (20.9 - 201, n=14, last 2 years) | |
| Asus ROG Ally X (Angelbird AV Pro v60) | |
| Lenovo Legion Go S | |
| Valve Steam Deck 1 TB OLED | |
| GPD Pocket 4 (AV Pro SD microSD 128 GB V60) | |
| maximum AS SSD Seq Read Test (1GB) | |
| Asus ROG Ally X (Angelbird AV Pro v60) | |
| ONEXPLAYER 2 Pro AR18 (Angelbird AV PRO microSD) | |
| MSI Claw 8 AI+ (Angelbird AV Pro V60) | |
| MSI Claw (Angelbird AV Pro V60) | |
| Average of class Handheld / UMPC (74.7 - 260, n=13, last 2 years) | |
| Lenovo Legion Go S | |
| GPD Pocket 4 (AV Pro SD microSD 128 GB V60) | |
| Networking | |
| MSI Claw 8 AI+ | |
| iperf3 transmit AXE11000 | |
| iperf3 receive AXE11000 | |
| Lenovo Legion Go S | |
| iperf3 transmit AXE11000 | |
| iperf3 receive AXE11000 | |
| iperf3 transmit AXE11000 6GHz | |
| iperf3 receive AXE11000 6GHz | |
| GPD Pocket 4 | |
| iperf3 transmit AXE11000 | |
| iperf3 receive AXE11000 | |
| iperf3 transmit AXE11000 6GHz | |
| iperf3 receive AXE11000 6GHz | |
| Asus ROG Ally X | |
| iperf3 transmit AXE11000 | |
| iperf3 receive AXE11000 | |
| MSI Claw | |
| iperf3 transmit AXE11000 | |
| iperf3 receive AXE11000 | |
| Valve Steam Deck 1 TB OLED | |
| iperf3 transmit AXE11000 | |
| iperf3 receive AXE11000 | |
| iperf3 transmit AXE11000 6GHz | |
| iperf3 receive AXE11000 6GHz | |
| ONEXPLAYER 2 Pro AR18 | |
| iperf3 transmit AXE11000 | |
| iperf3 receive AXE11000 | |
| iperf3 transmit AXE11000 6GHz | |
| iperf3 receive AXE11000 6GHz | |
可持续性
微星没有提供任何有关该设备可持续性、使用可回收材料或环保证书的信息。该产品的包装主要由纸板制成,可以回收利用。
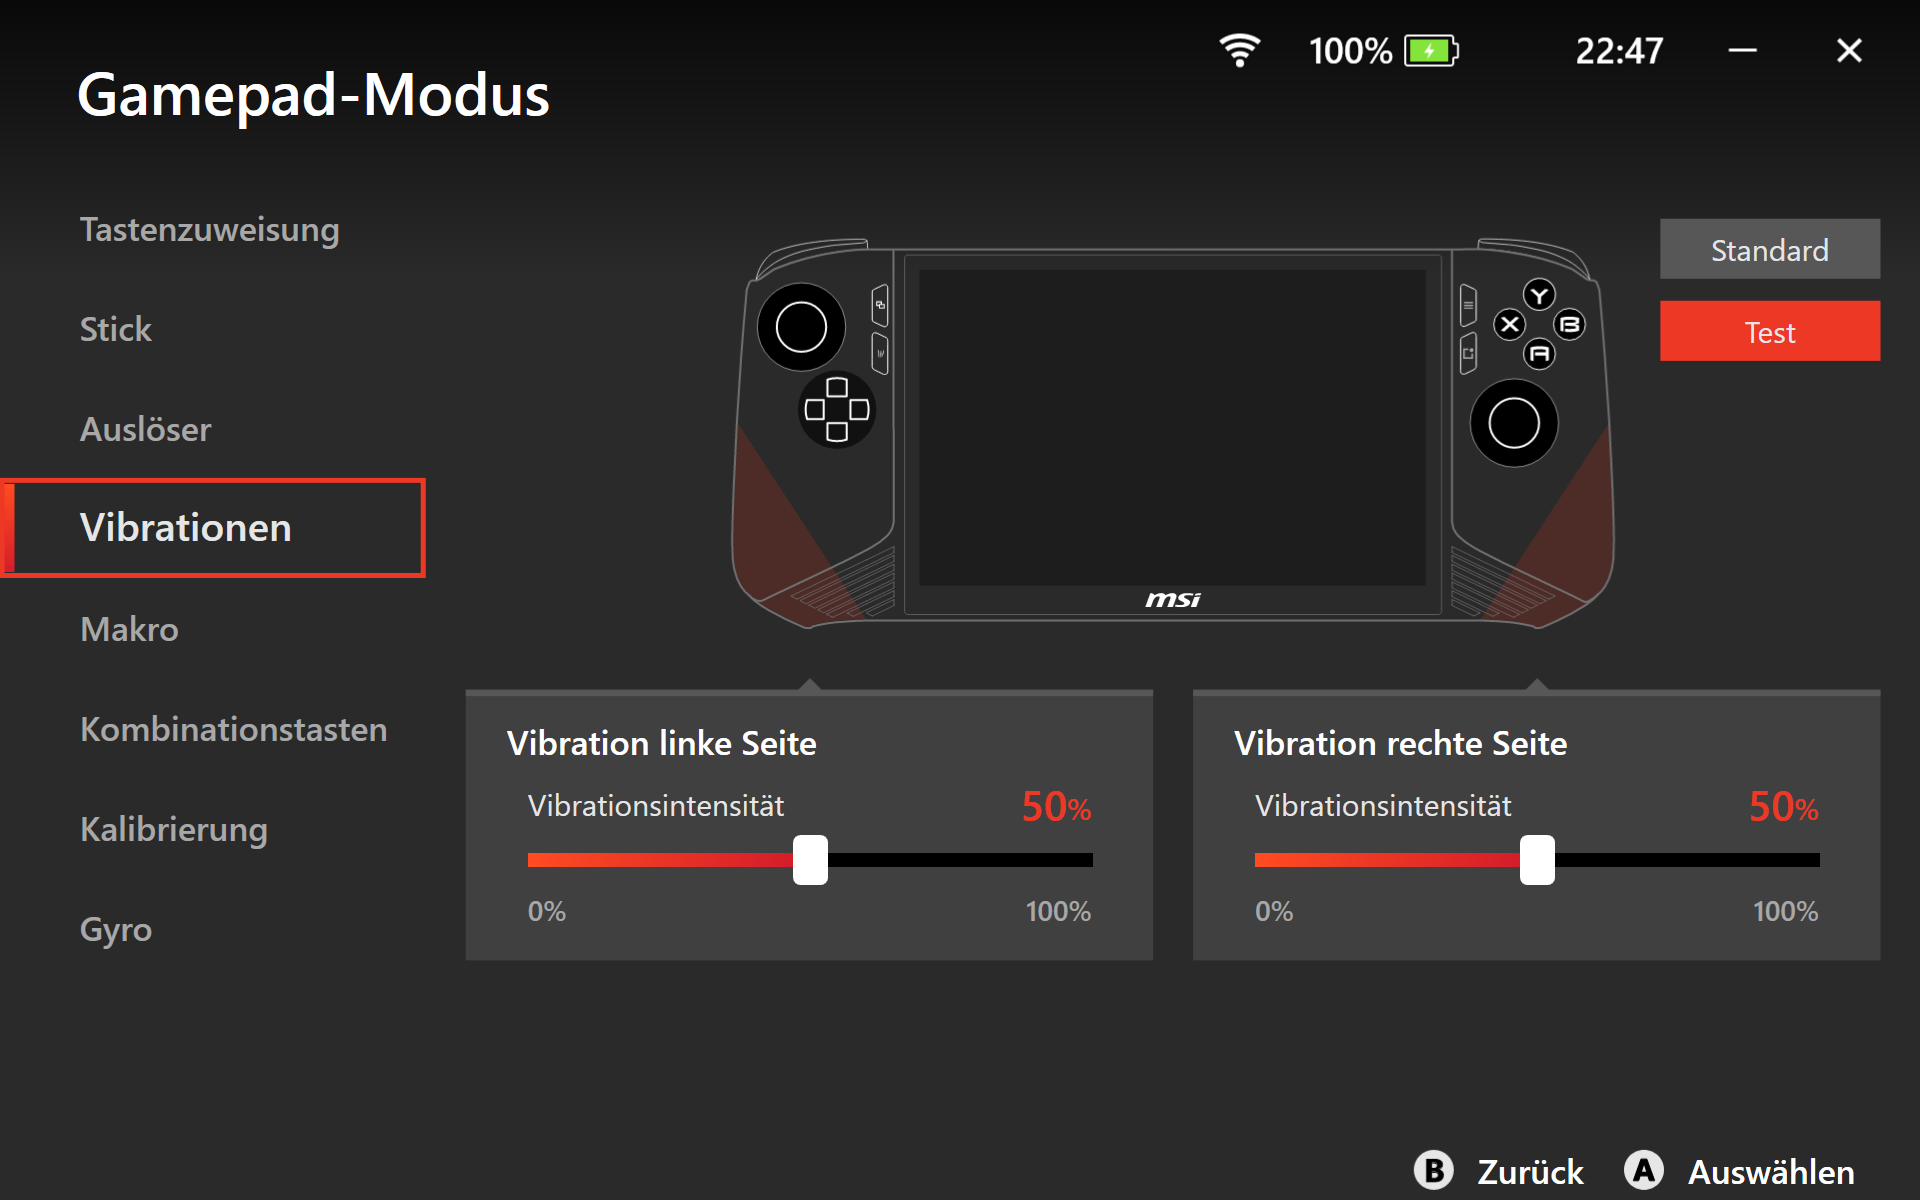
软件 - MSI Center M
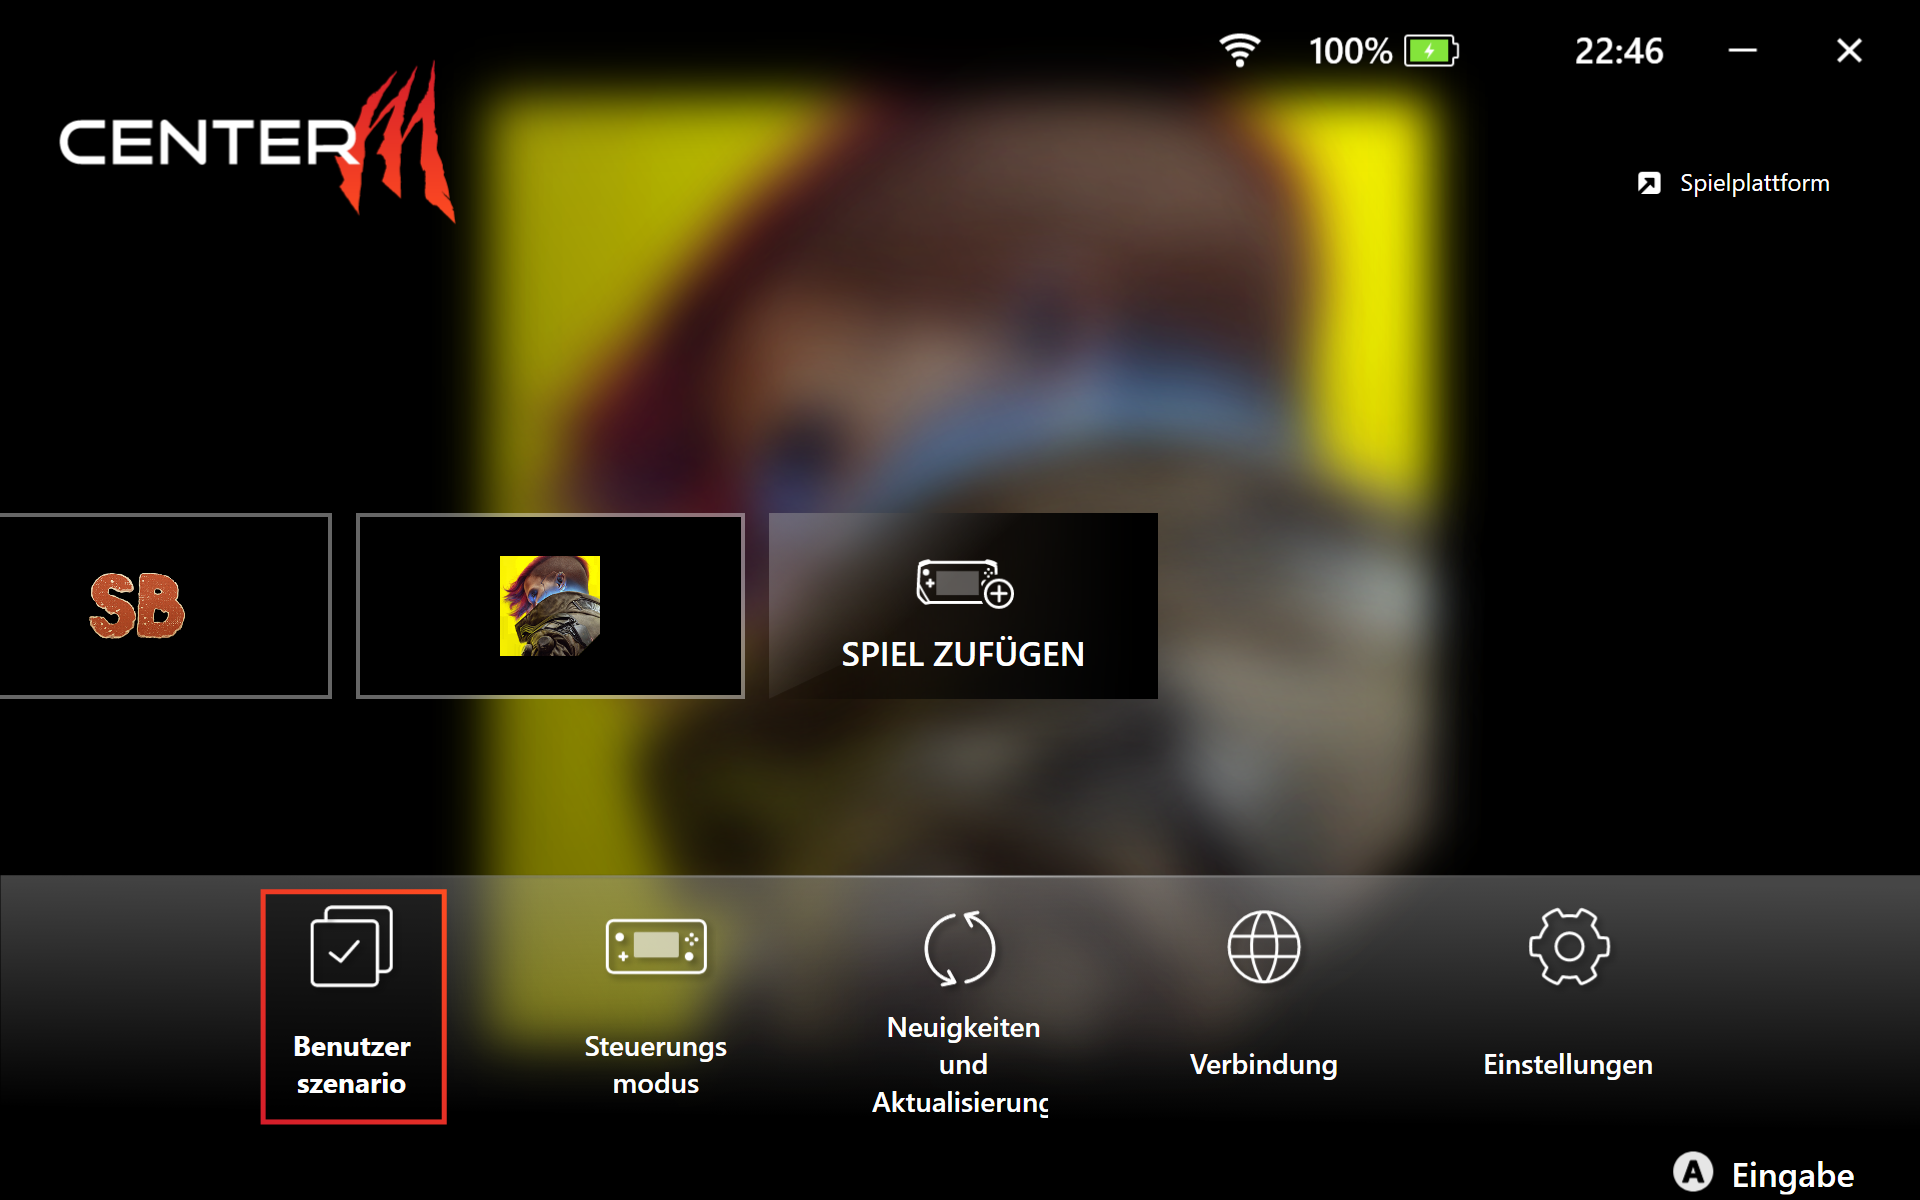
在小型触摸屏上使用过 Windows 的人都知道,操作起来有多别扭。因此,制造商提供的软件对用户体验就显得尤为重要。就 Claw 8 而言,与上一代产品一样,它使用的软件是 MSI Center M,启动时会自动打开。这里会显示已安装的游戏,并可访问所有设置。此外,还有一个可定制的快速菜单,可用于随时调整重要设置(如亮度、性能模式、性能监控等)。与旧版本一样,该软件总体上运行良好,但其整体功能范围明显小于 ArmoryCrate SE 软件。 华硕 ROG Ally X上的 ArmoryCrate SE 软件相比,其整体功能范围明显较小,而且偶尔会有点卡顿。
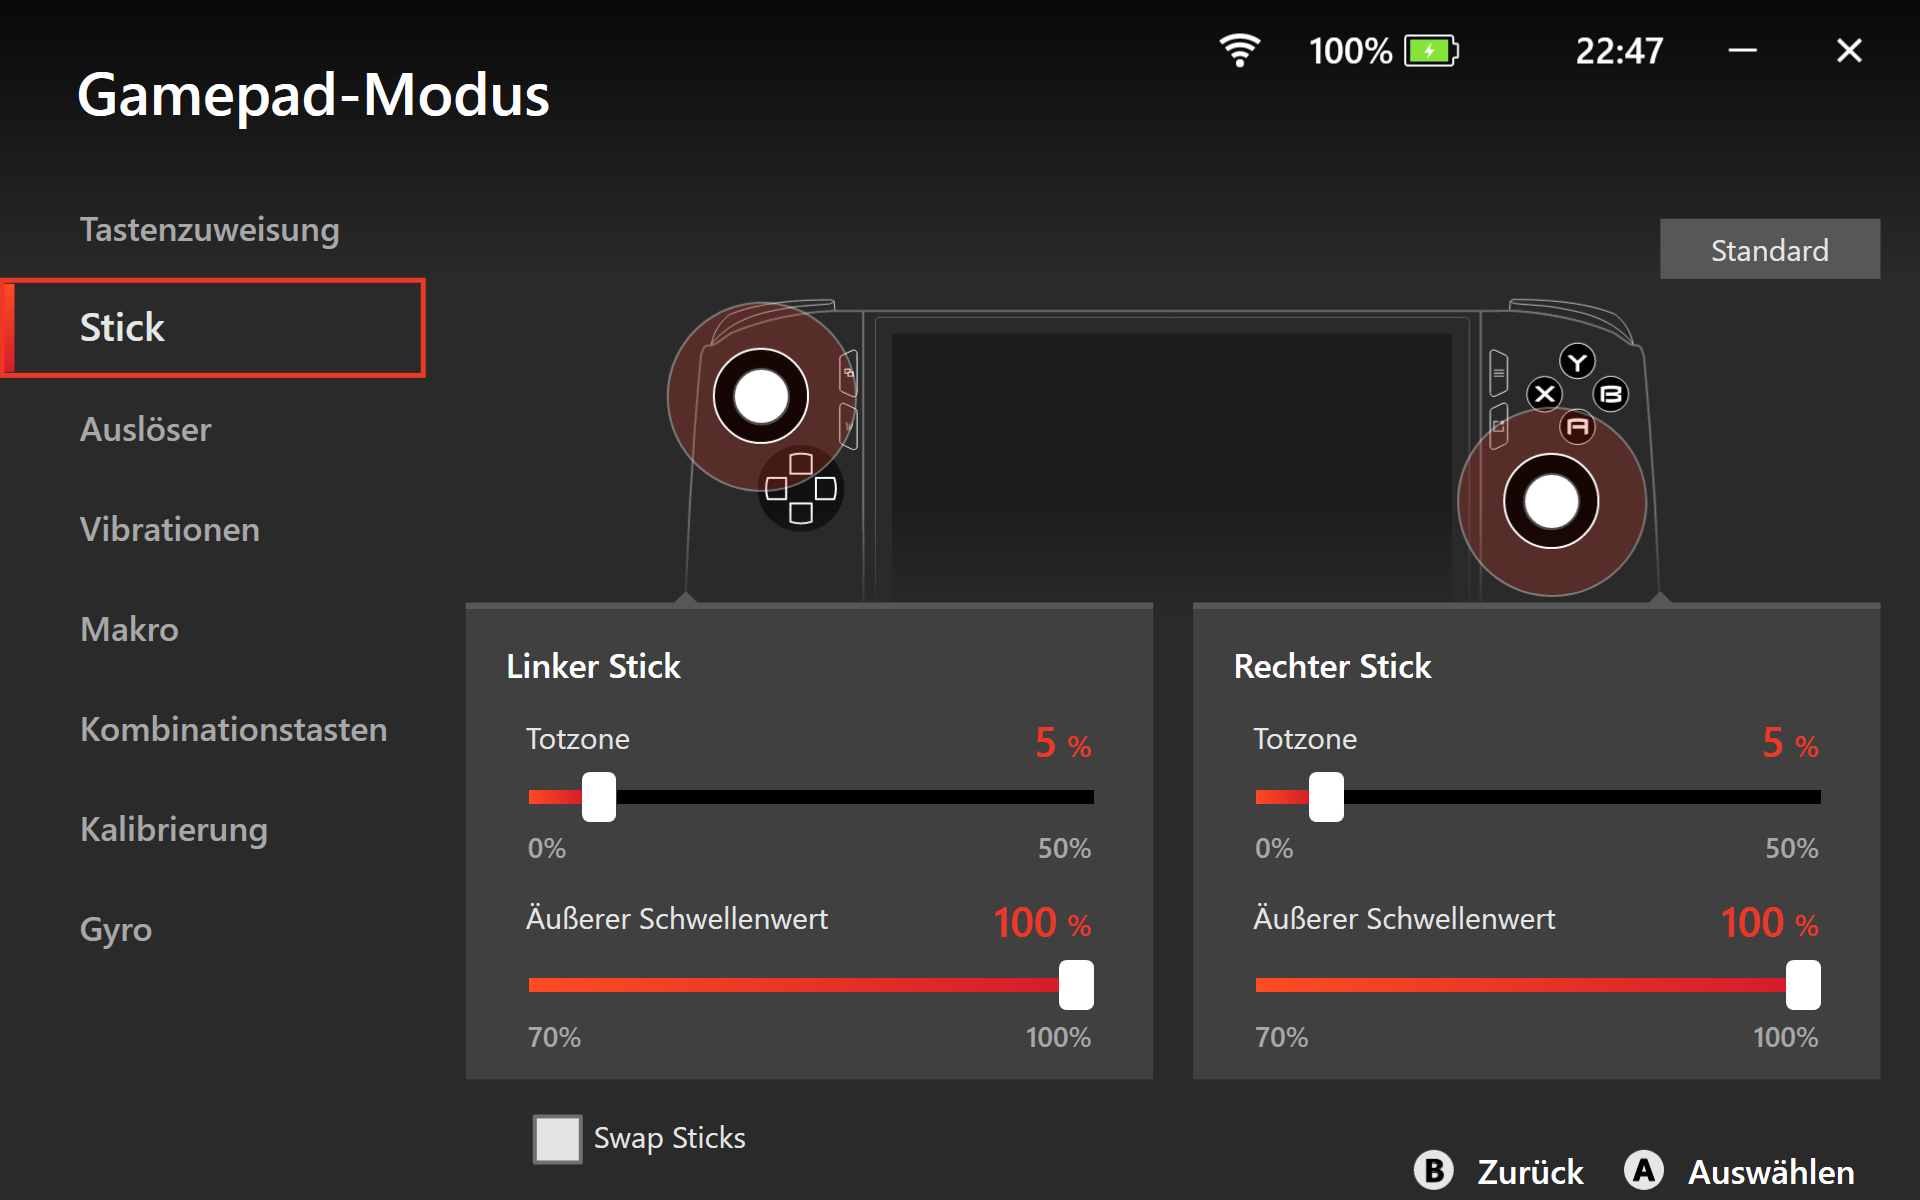
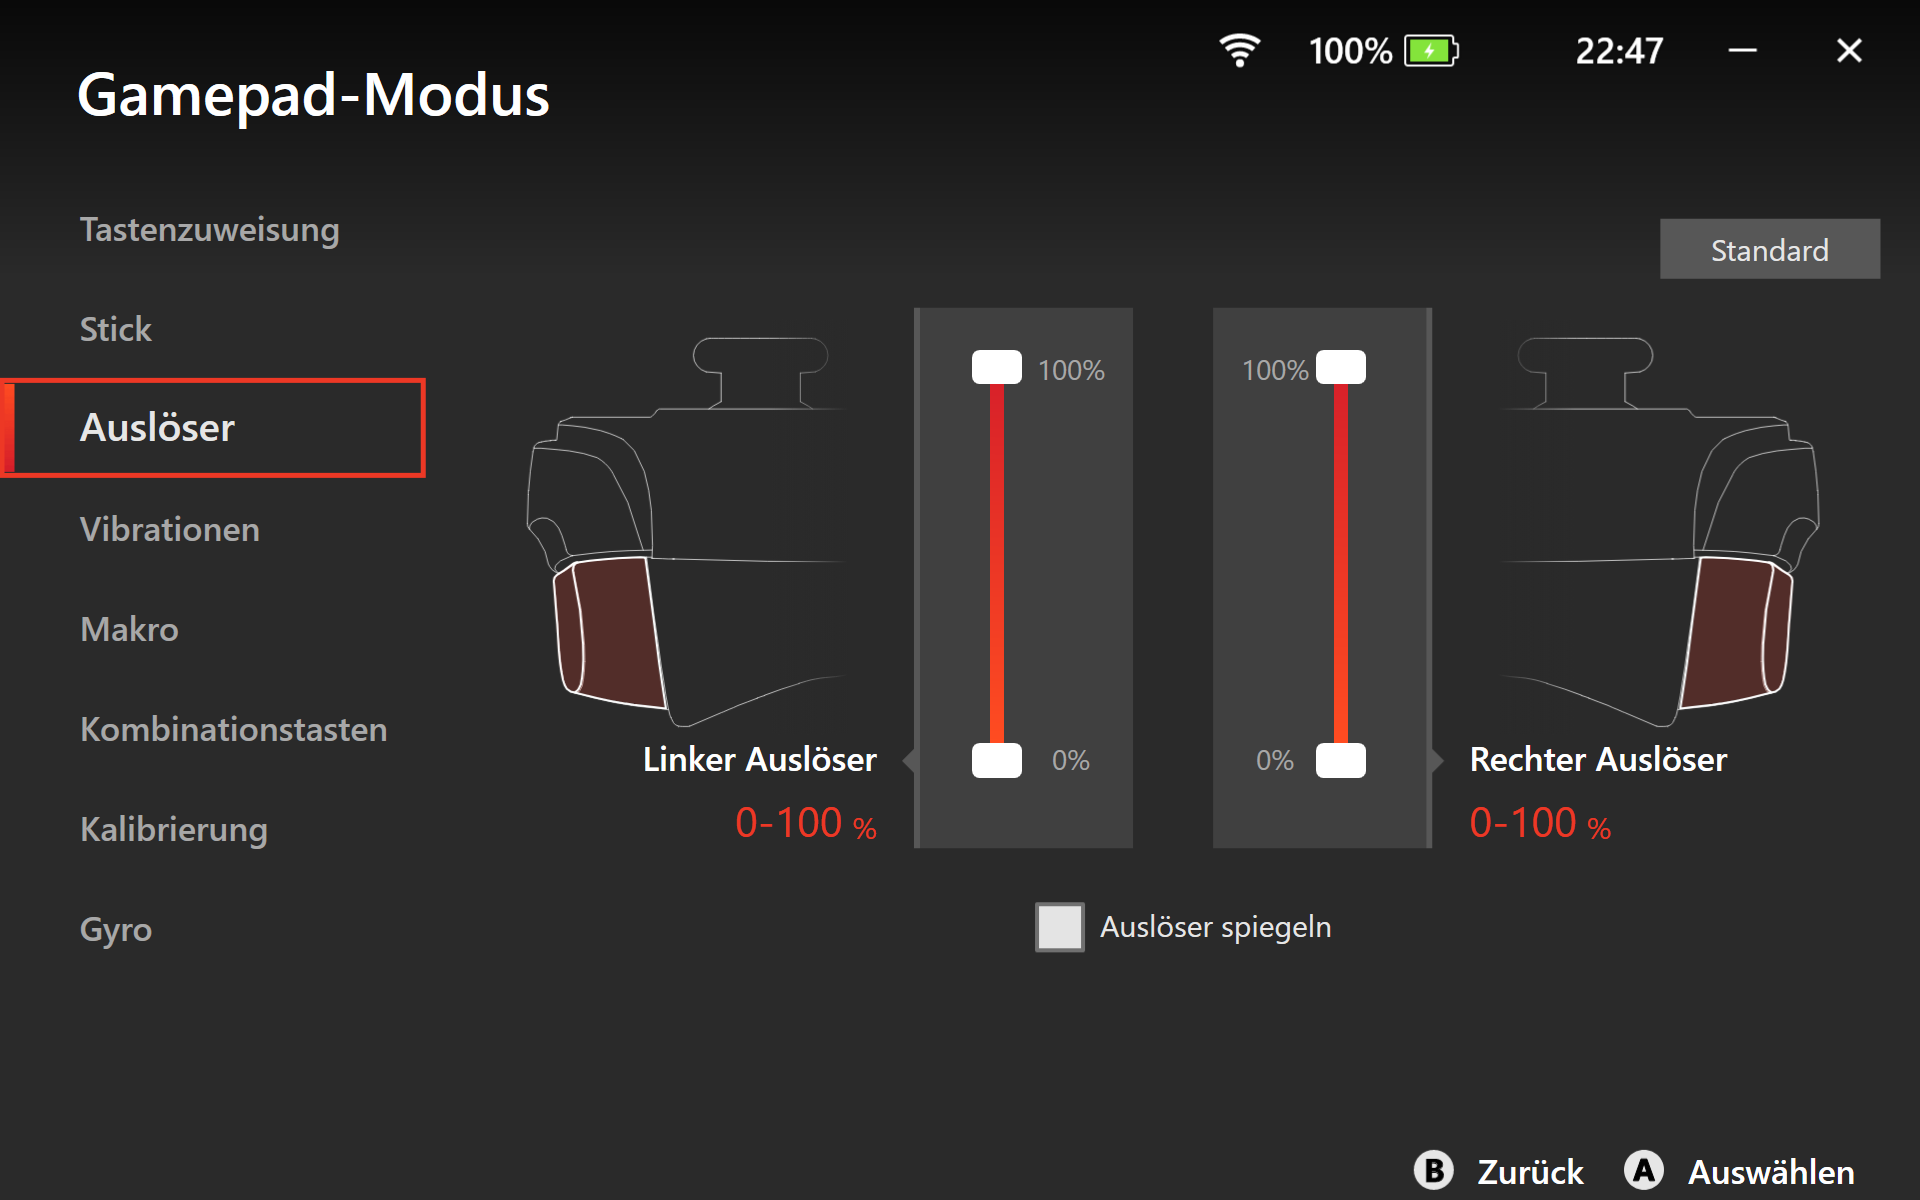
输入设备 - 霍尔效应触发器和摇杆
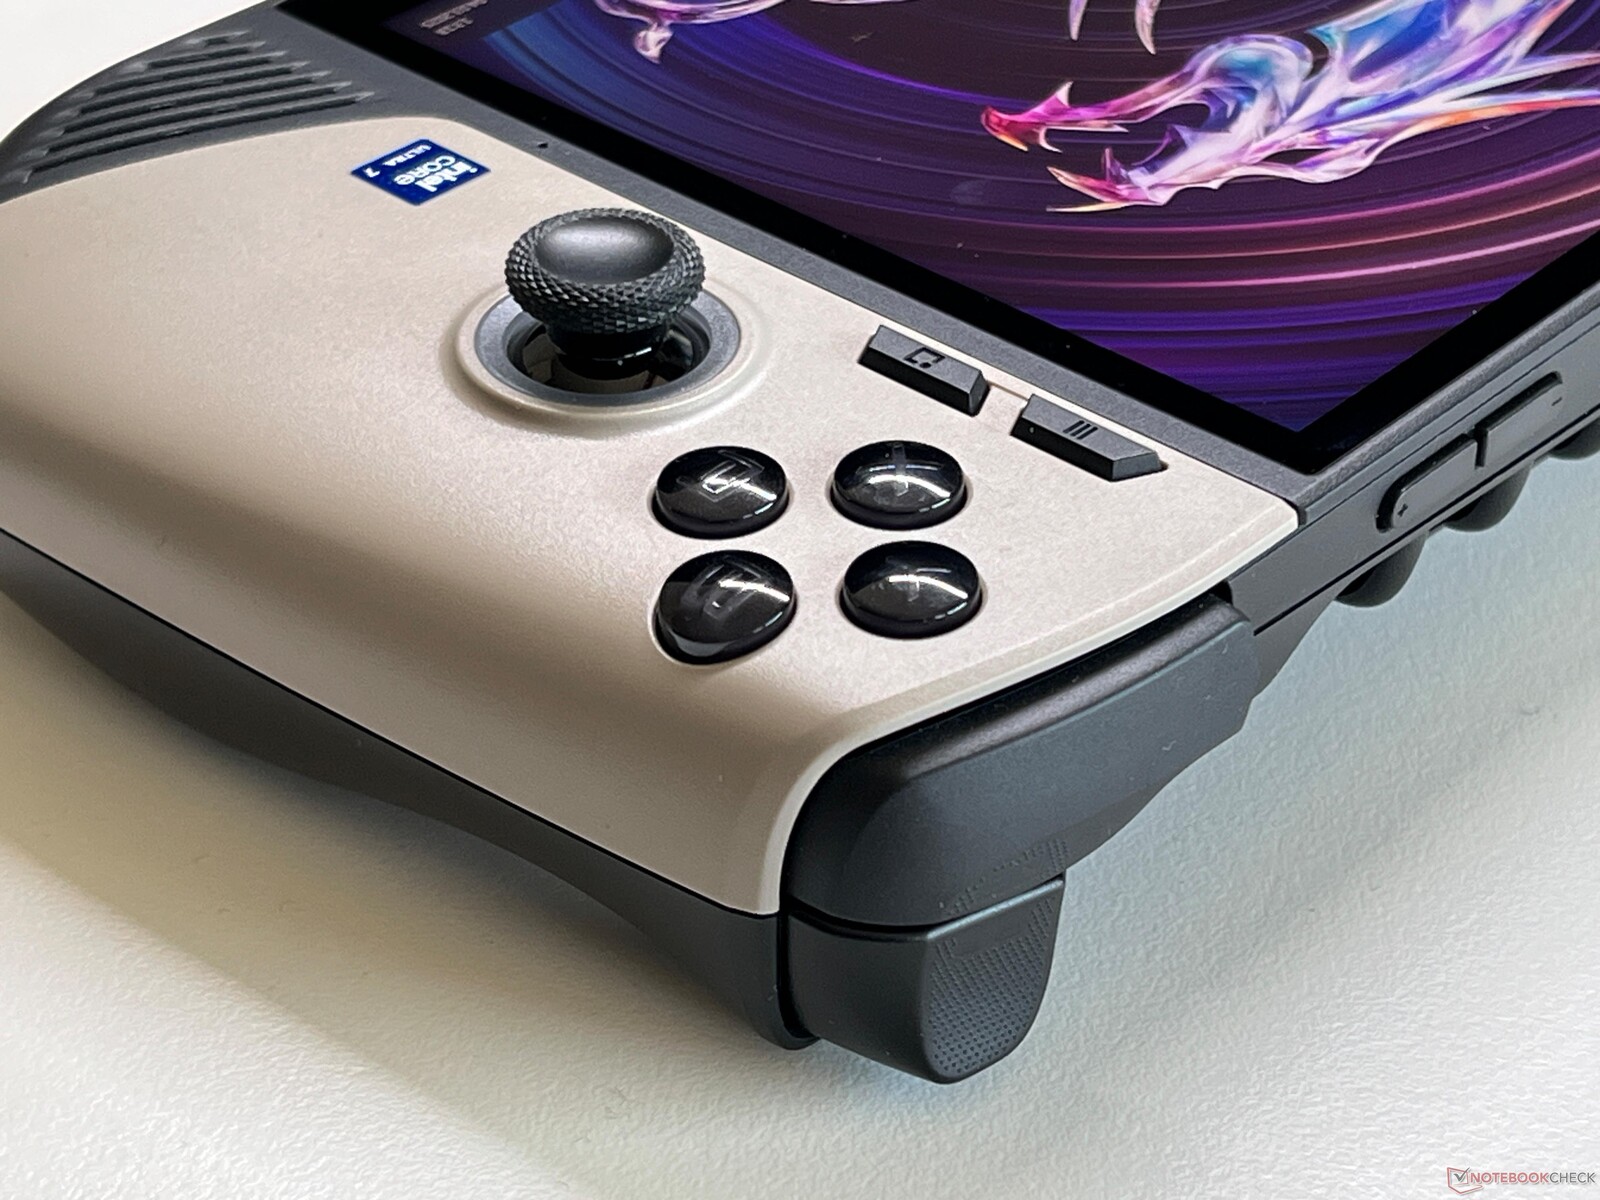
微星继续为 Claw 8 使用霍尔效应触发器和摇杆,实际效果非常好。特别是触发器的阻力比 Ally X的阻力更大一些,这在玩游戏时感觉更好一些。D-pad 精准且安静,而右侧的常规按键并不显眼。摇杆和触发器的配置选项也可通过微星软件进行设置。当然,手持设备的电容式触摸屏也可用于输入。
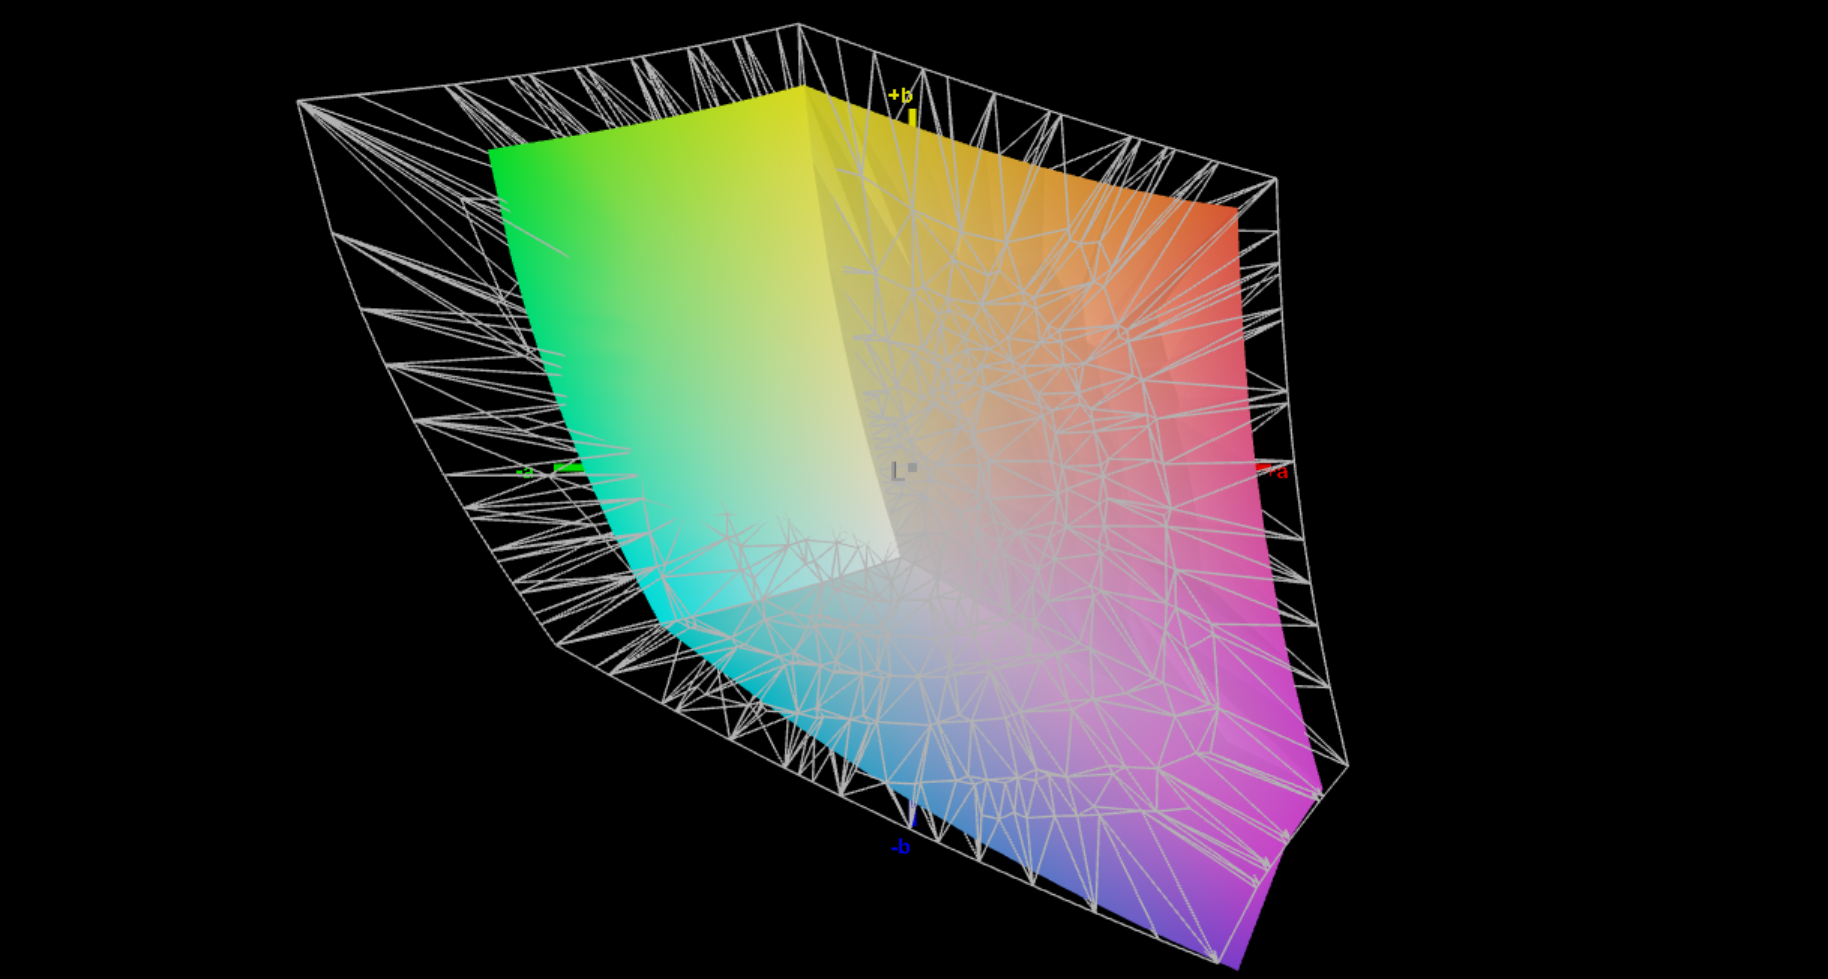
显示屏 - 8 英寸 IPS,120 赫兹刷新率和 VRR
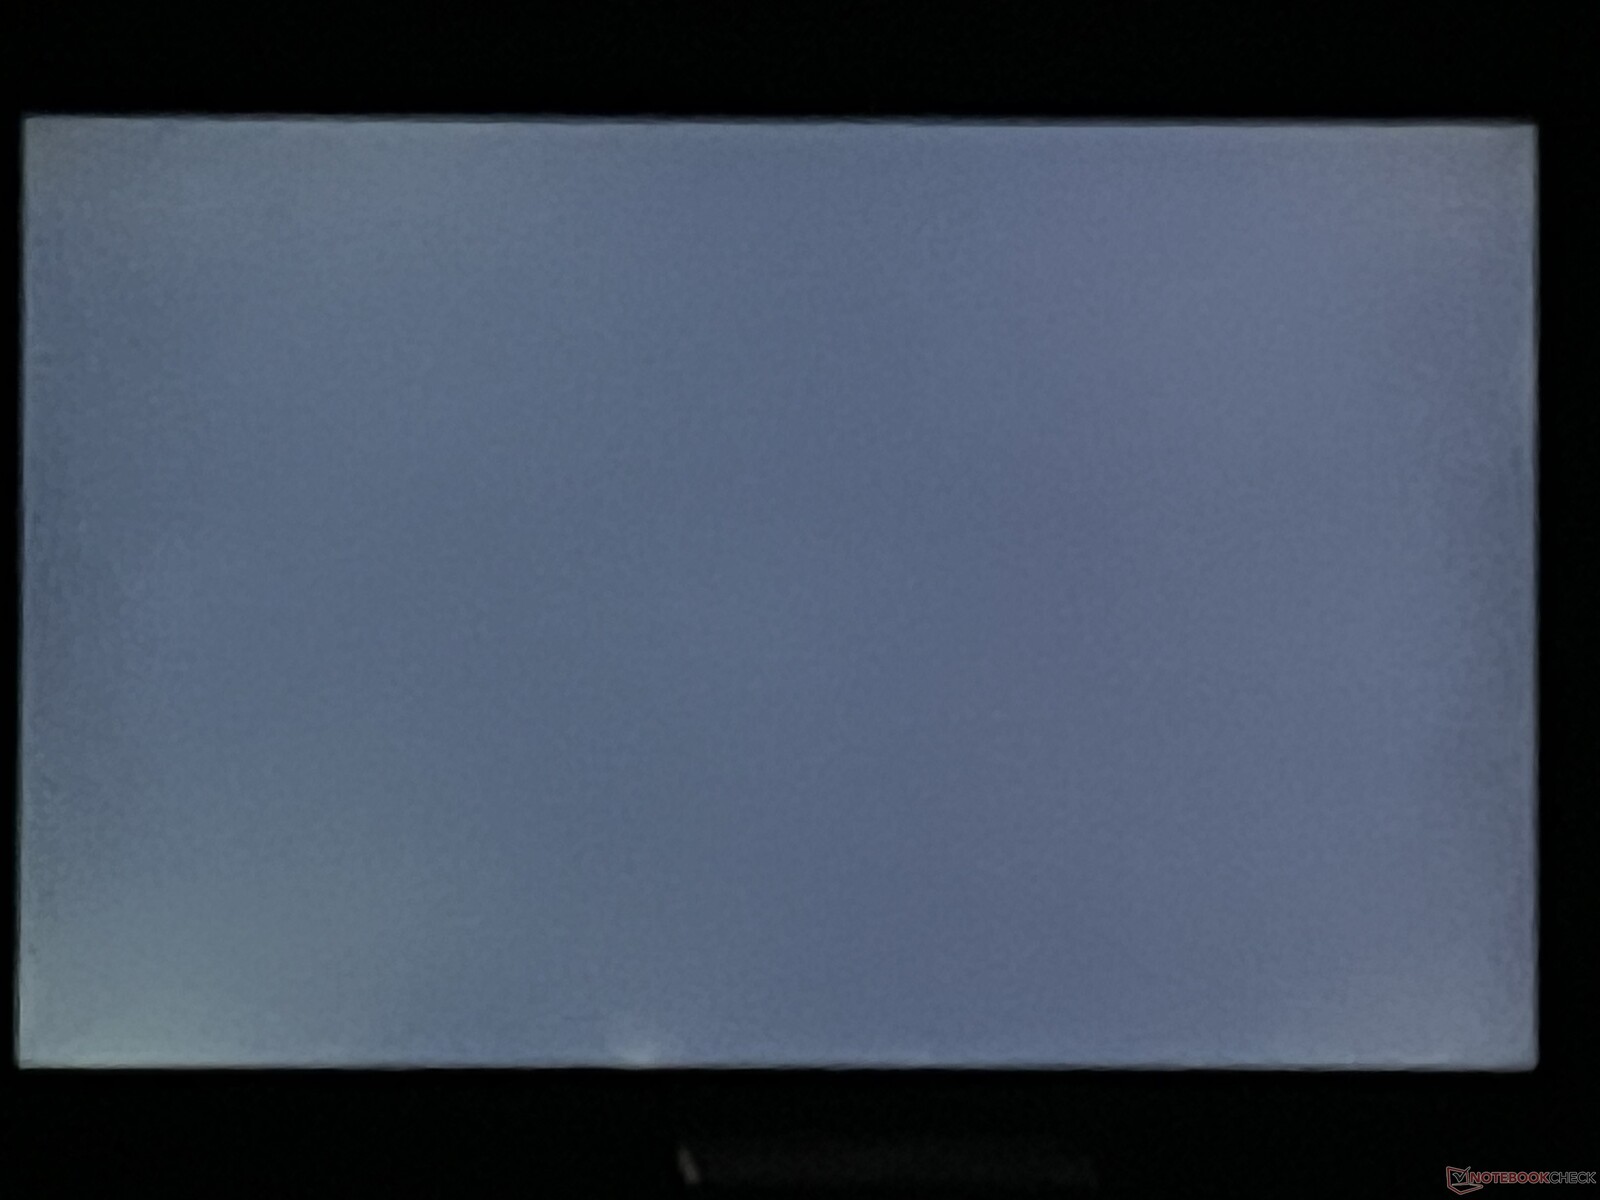
微星将手持设备的屏幕尺寸从 7 英寸(16:9)增至 8 英寸(16:10,1,920 x 1,080 像素)。不过,它的基本功能,包括 120Hz 刷新率和 VRR 支持都没有变化。此外,尽管其黑度和对比度自然无法与 OLED 面板相比,但其画质非常出色。虽然没有使用 PWM 闪烁,但其响应时间略微变慢。
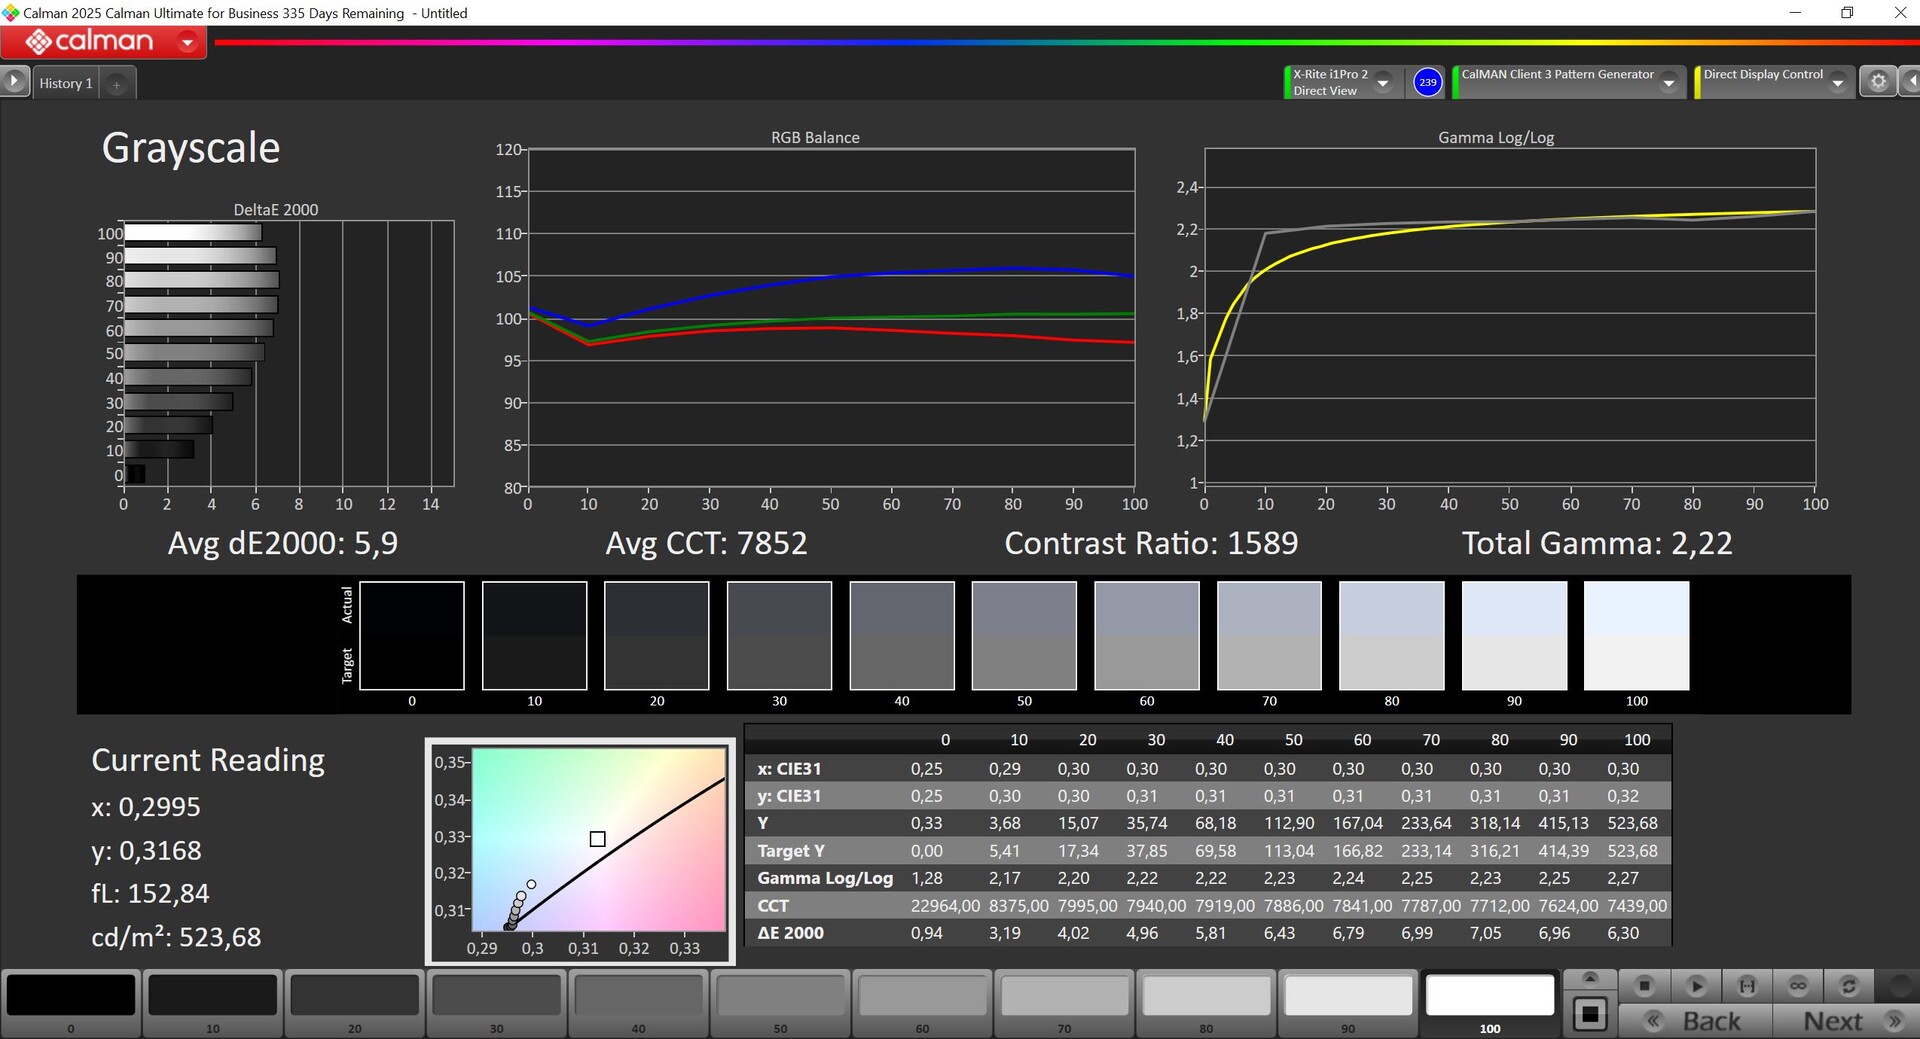
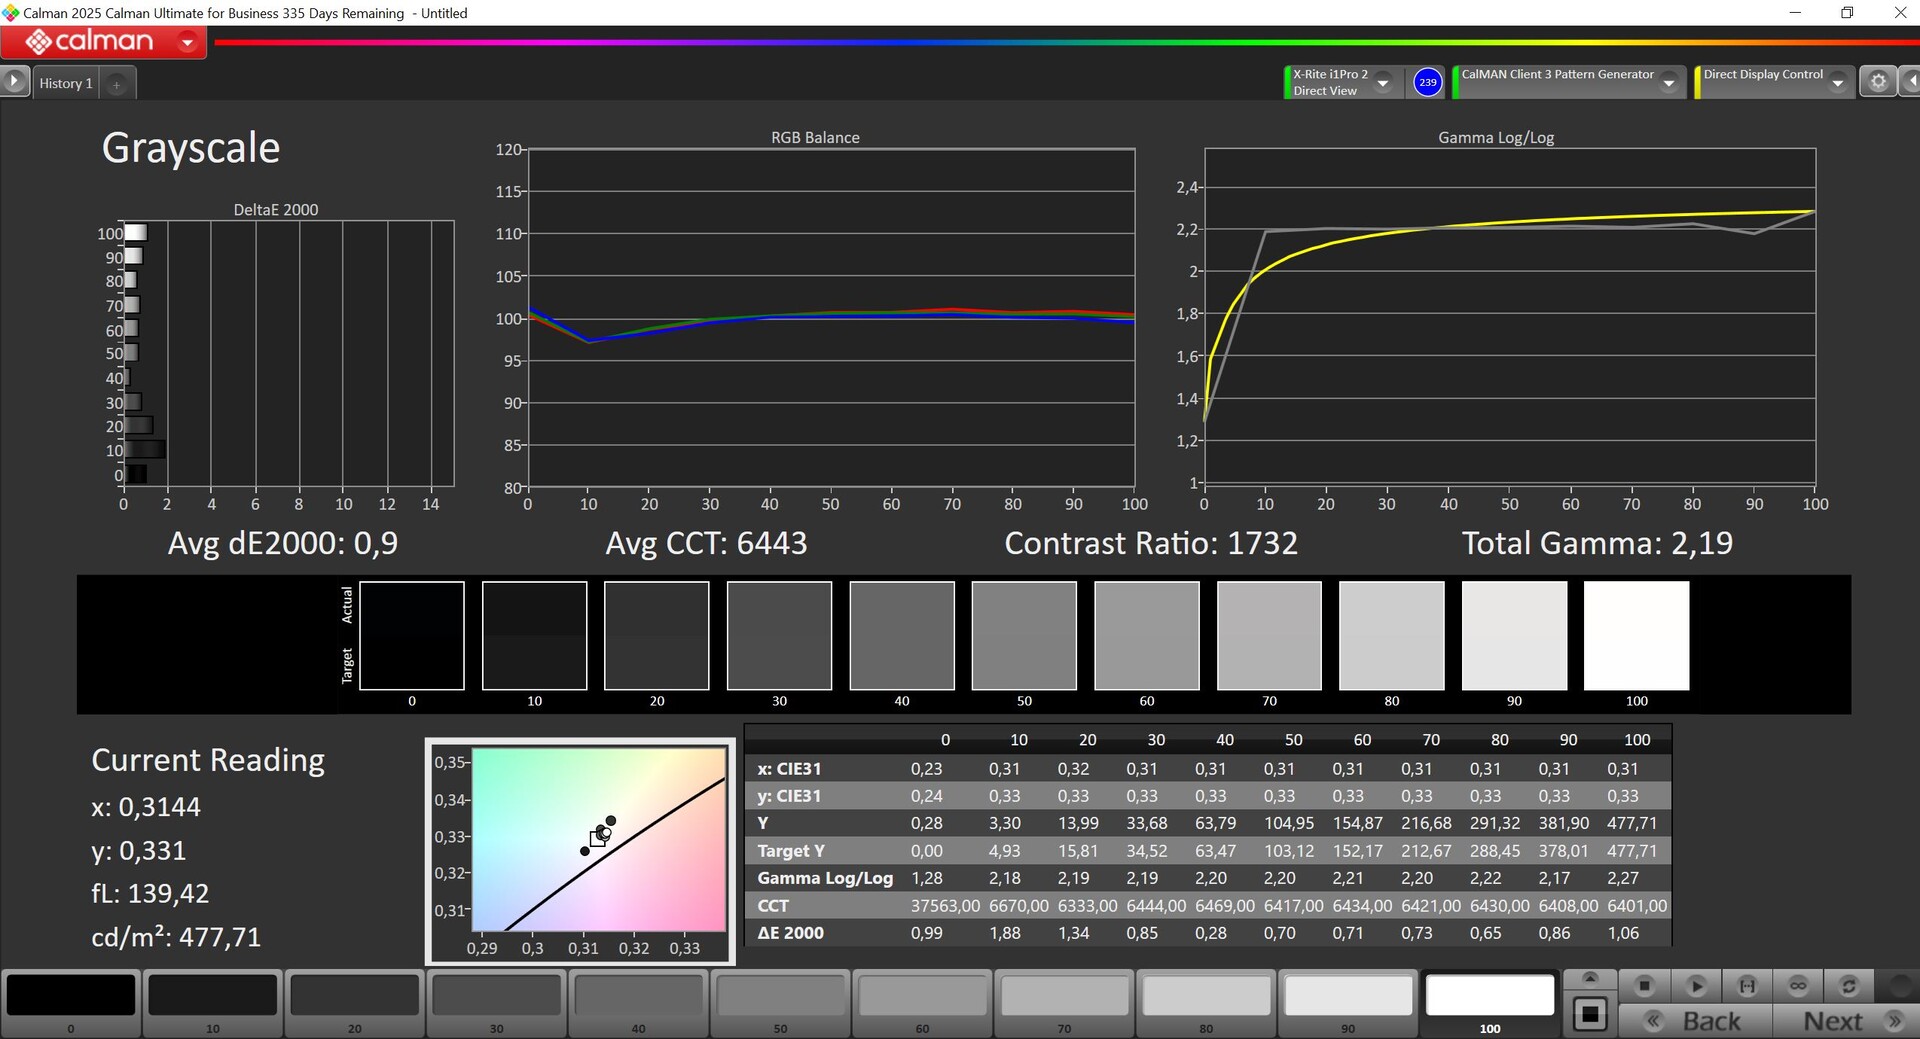
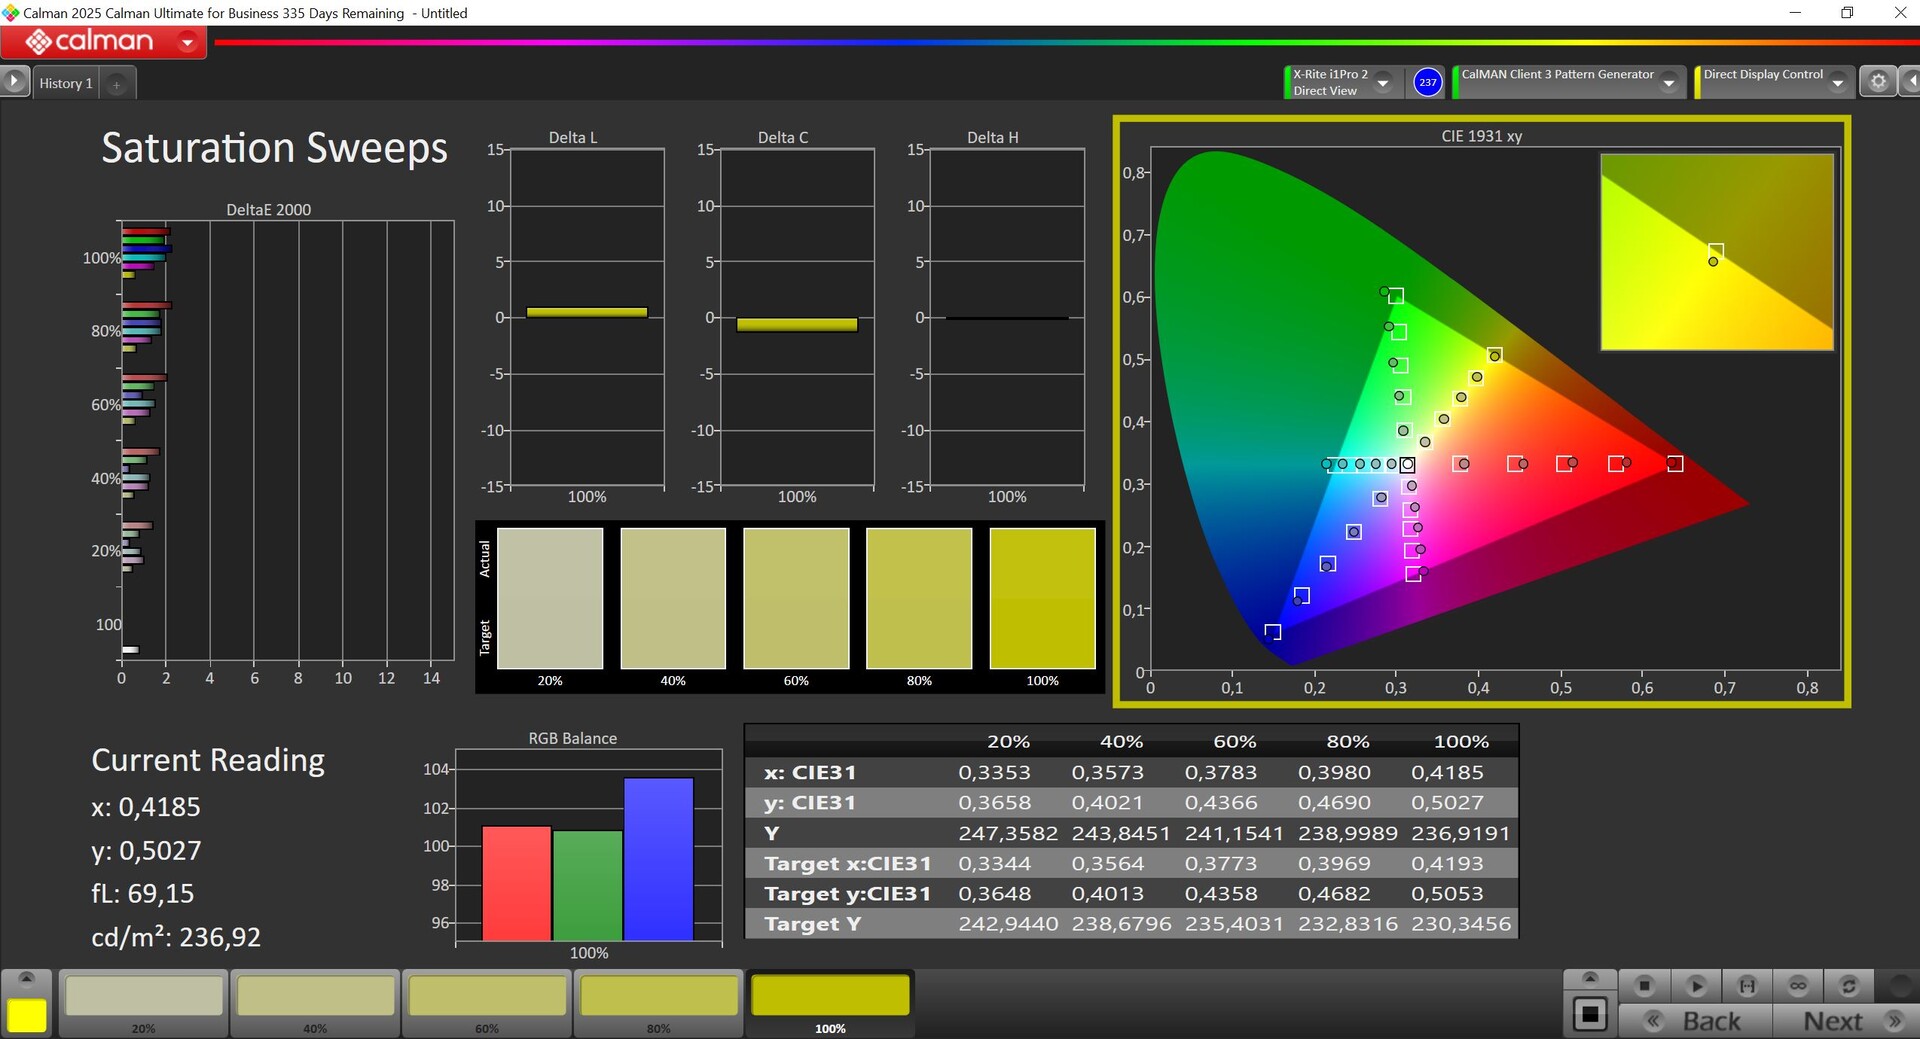
通过使用专业的 CalMAN 软件进行分析,我们测得的平均亮度为 524 cd/m²,对比度超过 1,500:1 。不过,这样的亮度是以过冷的色温为代价的,我们注意到画面偏蓝--总的来说,它的出厂校准不是特别好。我们通过自己的校准大大改善了这一问题(我们的配置文件可在右侧免费下载),但这也使其最大亮度降低了约 50 cd/m²。该显示器完全覆盖了 sRGB 色彩空间。
| |||||||||||||||||||||||||
Brightness Distribution: 93 %
Center on Battery: 524 cd/m²
Contrast: 1588:1 (Black: 0.33 cd/m²)
ΔE Color 3.5 | 0.5-29.43 Ø4.86, calibrated: 1.3
ΔE Greyscale 5.9 | 0.5-98 Ø5.1
72.9% AdobeRGB 1998 (Argyll 2.2.0 3D)
98.5% sRGB (Argyll 2.2.0 3D)
71.1% Display P3 (Argyll 2.2.0 3D)
Gamma: 2.22
| MSI Claw 8 AI+ PN8007QB1-2, IPS, 1920x1200, 8", 120 Hz | Lenovo Legion Go S LEN91C1, IPS-Grade, 1920x1200, 8", 120 Hz | GPD Pocket 4 YHB03P24, IPS, 2560x1600, 8.8", 144 Hz | Asus ROG Ally X TL070FVXS01-0, IPS, 1920x1080, 7", 120 Hz | MSI Claw TL070FVXS02-0, IPS, 1920x1080, 7", 120 Hz | Valve Steam Deck 1 TB OLED ANX7530 U, OLED, 1280x800, 7.4", 90 Hz | ONEXPLAYER 2 Pro AR18 FLQ8423-24L0, IPS, 2560x1600, 8.4", 60 Hz | |
|---|---|---|---|---|---|---|---|
| Display | -2% | 18% | -6% | -5% | 25% | 14% | |
| Display P3 Coverage | 71.1 | 69.71 -2% | 92.7 30% | 66.2 -7% | 67 -6% | 99.6 40% | 91.9 29% |
| sRGB Coverage | 98.5 | 99.02 1% | 99.6 1% | 93.4 -5% | 94.4 -4% | 100 2% | 99.3 1% |
| AdobeRGB 1998 Coverage | 72.9 | 70.34 -4% | 90 23% | 68.5 -6% | 69.4 -5% | 96.1 32% | 81.6 12% |
| Response Times | -36% | -17% | 61% | 59% | 51% | -31% | |
| Response Time Grey 50% / Grey 80% * | 23.7 ? | 30.8 ? -30% | 27.9 ? -18% | 9.7 ? 59% | 9.2 ? 61% | 9 ? 62% | 25.5 ? -8% |
| Response Time Black / White * | 14.9 ? | 21.2 ? -42% | 17.2 ? -15% | 5.7 ? 62% | 6.6 ? 56% | 9 ? 40% | 22.73 ? -53% |
| PWM Frequency | 360 ? | ||||||
| Screen | -42% | -9% | -1% | 4% | 143% | -4% | |
| Brightness middle | 524 | 538.8 3% | 511.2 -2% | 484 -8% | 477 -9% | 485 -7% | 318 -39% |
| Brightness | 514 | 509 -1% | 524 2% | 456 -11% | 461 -10% | 482 -6% | 287 -44% |
| Brightness Distribution | 93 | 93 0% | 84 -10% | 88 -5% | 88 -5% | 98 5% | 48 -48% |
| Black Level * | 0.33 | 0.46 -39% | 0.4 -21% | 0.35 -6% | 0.32 3% | 0.03 91% | 0.1118 66% |
| Contrast | 1588 | 1171 -26% | 1278 -20% | 1383 -13% | 1491 -6% | 16167 918% | 2844 79% |
| Colorchecker dE 2000 * | 3.5 | 7.2 -106% | 4.54 -30% | 2.9 17% | 2.6 26% | 2 43% | 4.81 -37% |
| Colorchecker dE 2000 max. * | 7.3 | 12.5 -71% | 8.96 -23% | 7.1 3% | 5.8 21% | 5 32% | 6.93 5% |
| Colorchecker dE 2000 calibrated * | 1.3 | 2.3 -77% | 0.95 27% | 1.4 -8% | 1.5 -15% | 1.53 -18% | |
| Greyscale dE 2000 * | 5.9 | 9.5 -61% | 6.4 -8% | 4.5 24% | 3.9 34% | 2 66% | 6.12 -4% |
| Gamma | 2.22 99% | 2.44 90% | 2.26 97% | 2.24 98% | 2.17 101% | 2 110% | 2.003 110% |
| CCT | 7852 83% | 9485 69% | 8125 80% | 7534 86% | 7250 90% | 6336 103% | 7707 84% |
| Total Average (Program / Settings) | -27% /
-33% | -3% /
-5% | 18% /
7% | 19% /
10% | 73% /
101% | -7% /
-4% |
* ... smaller is better


Display Response Times
| ↔ Response Time Black to White | ||
|---|---|---|
| 14.9 ms ... rise ↗ and fall ↘ combined | ↗ 7.8 ms rise | 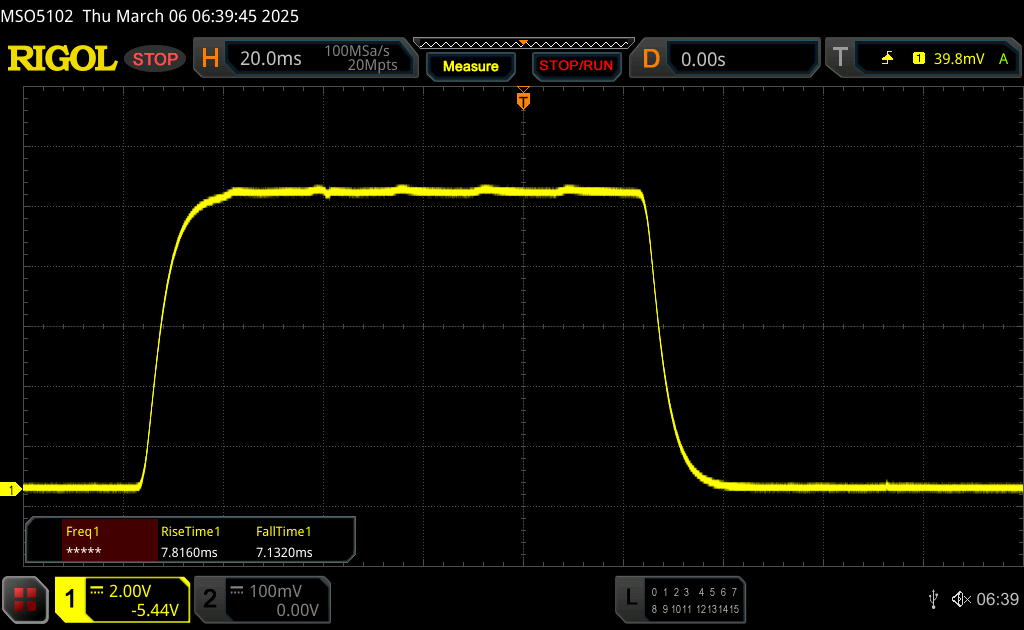 |
| ↘ 7.1 ms fall | ||
| The screen shows good response rates in our tests, but may be too slow for competitive gamers. In comparison, all tested devices range from 0.1 (minimum) to 240 (maximum) ms. » 33 % of all devices are better. This means that the measured response time is better than the average of all tested devices (20.7 ms). | ||
| ↔ Response Time 50% Grey to 80% Grey | ||
| 23.7 ms ... rise ↗ and fall ↘ combined | ↗ 11 ms rise | 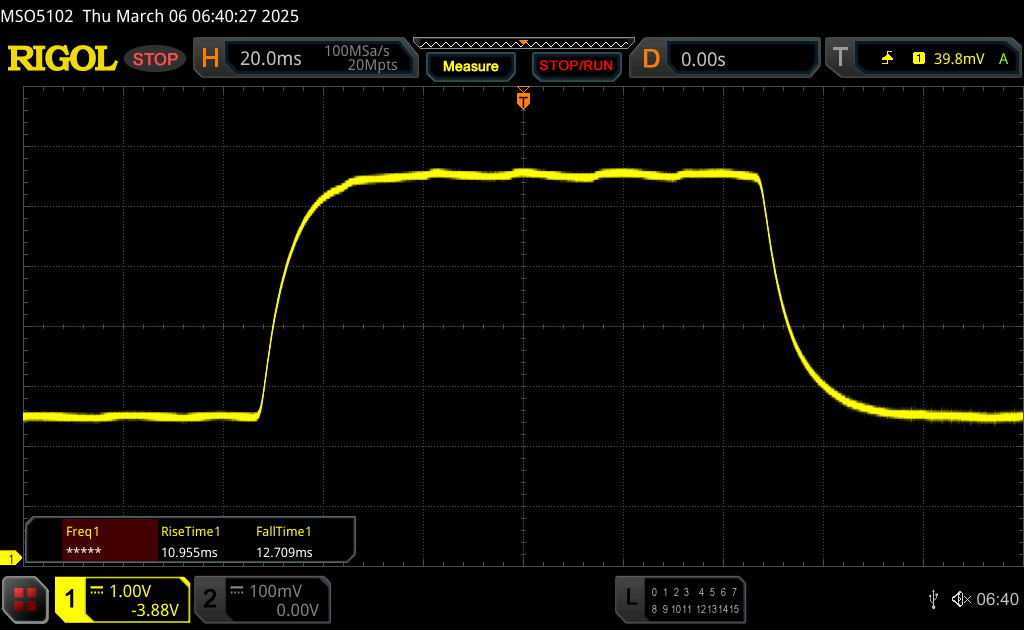 |
| ↘ 12.7 ms fall | ||
| The screen shows good response rates in our tests, but may be too slow for competitive gamers. In comparison, all tested devices range from 0.165 (minimum) to 636 (maximum) ms. » 32 % of all devices are better. This means that the measured response time is better than the average of all tested devices (32.4 ms). | ||
Screen Flickering / PWM (Pulse-Width Modulation)
| Screen flickering / PWM not detected | 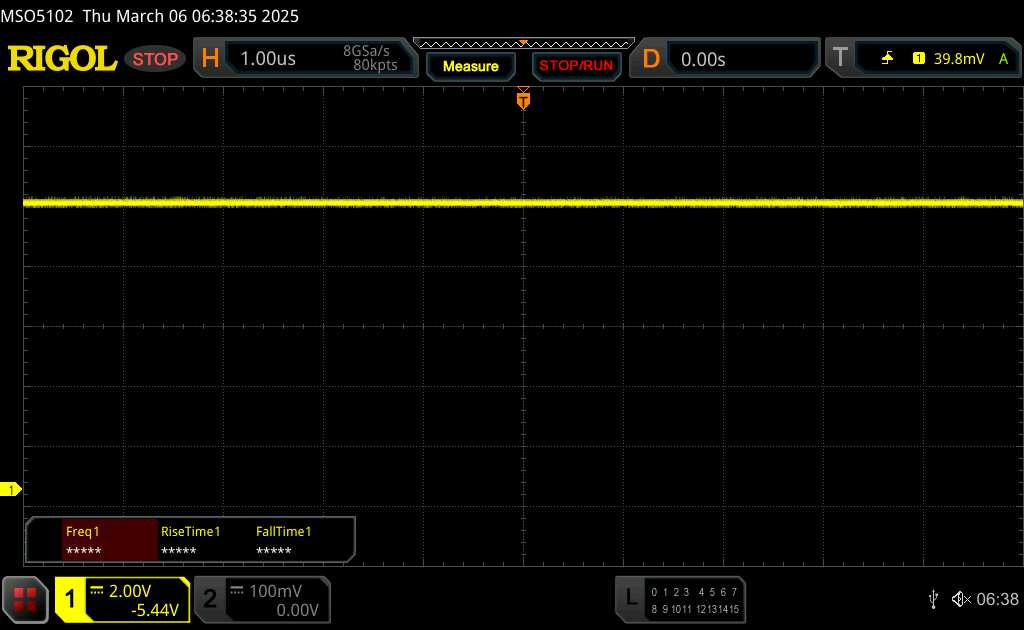 | ||
In comparison: 53 % of all tested devices do not use PWM to dim the display. If PWM was detected, an average of 8471 (minimum: 5 - maximum: 343500) Hz was measured. | |||
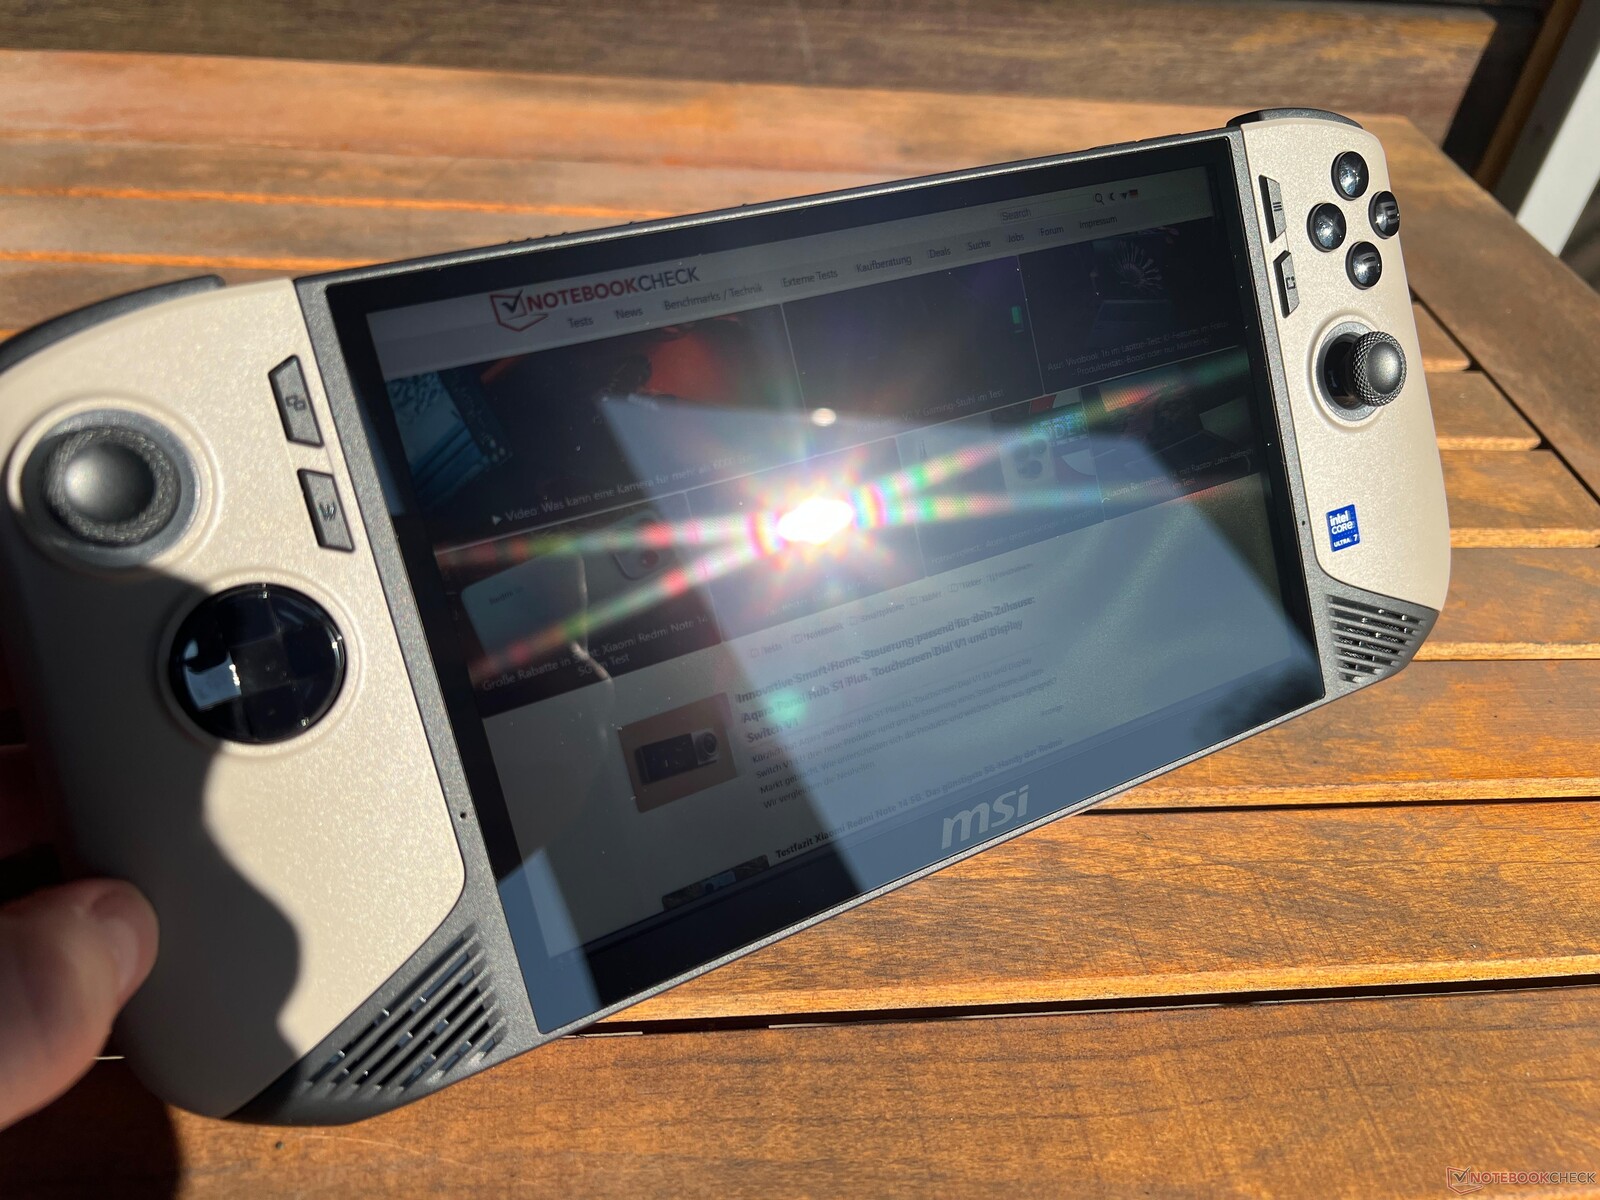
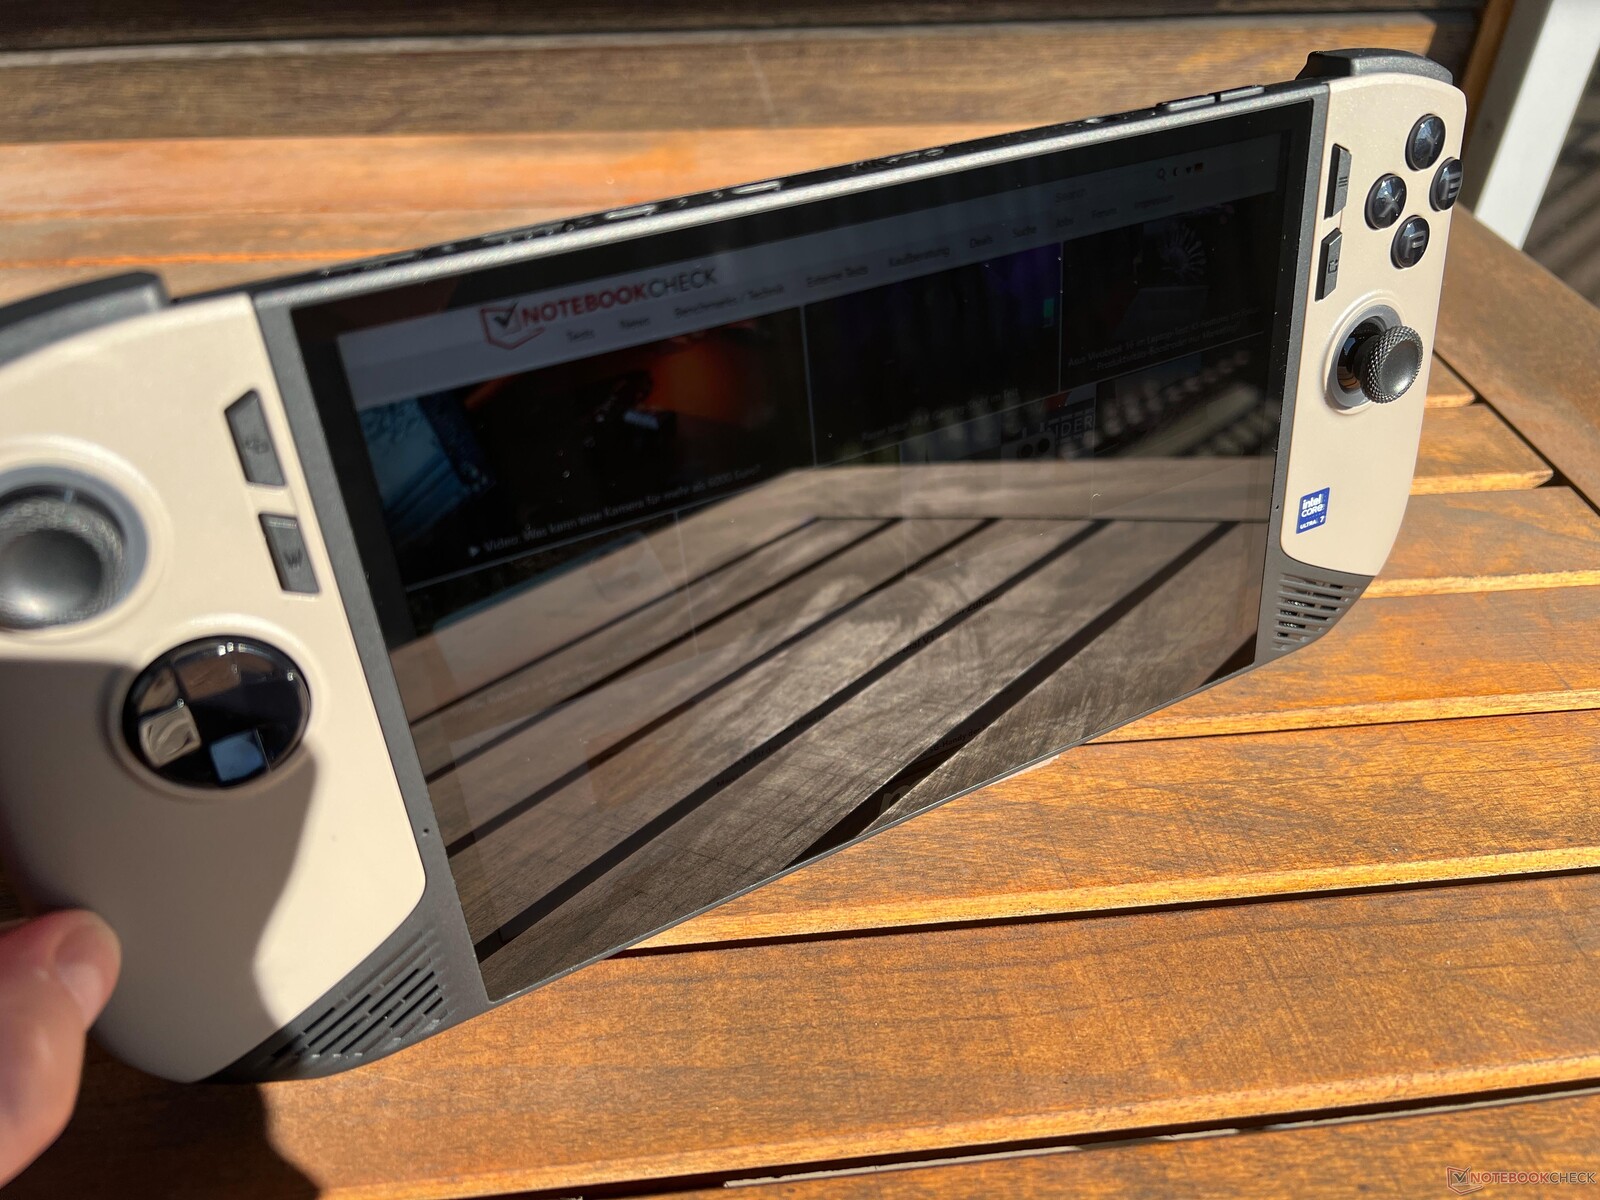

在烈日下,由于触摸屏反光,这款手持设备显得有些吃力,但这并不奇怪。其视角稳定性也没有问题。

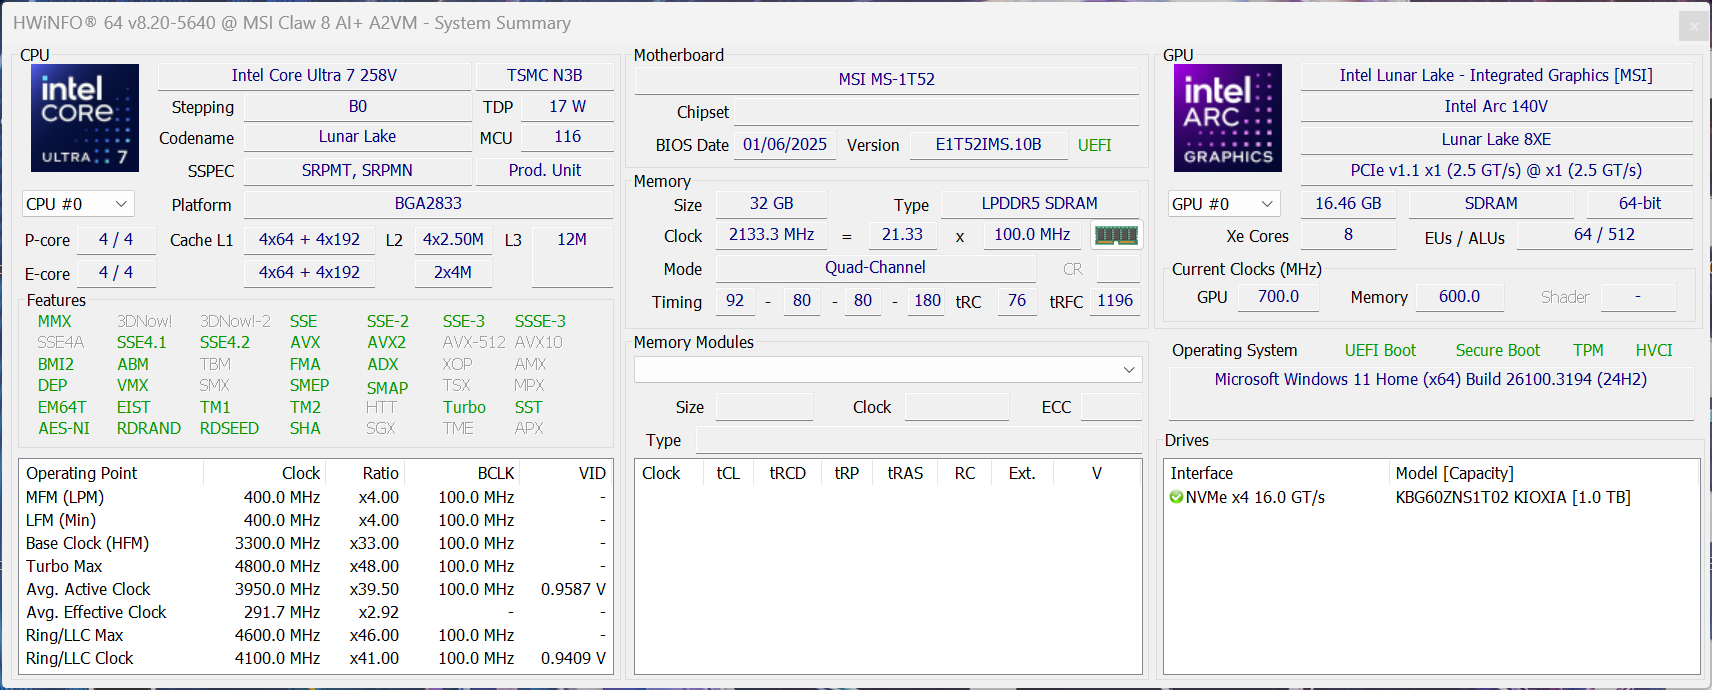
性能 - 配备 32GB 内存的 Lunar Lake 处理器
测试条件
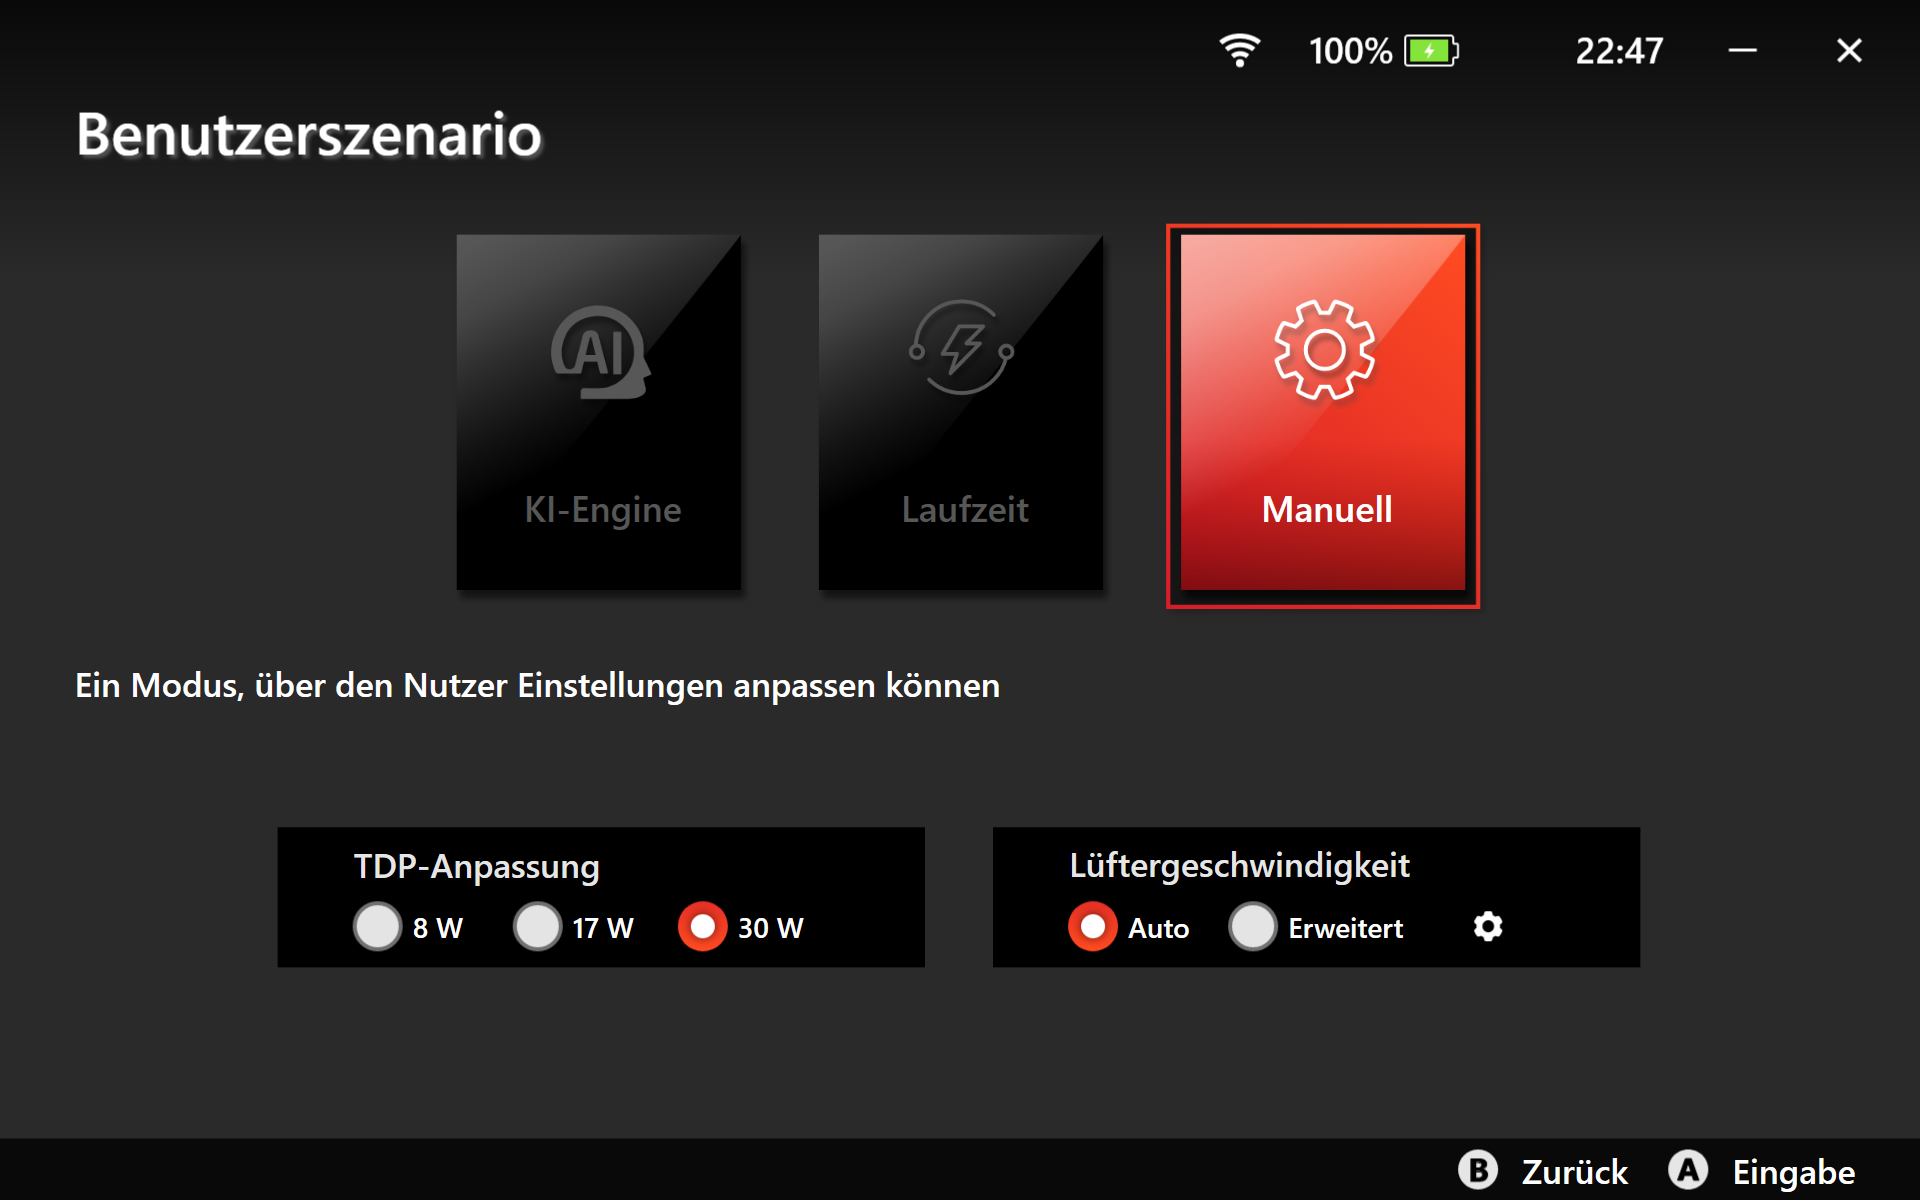
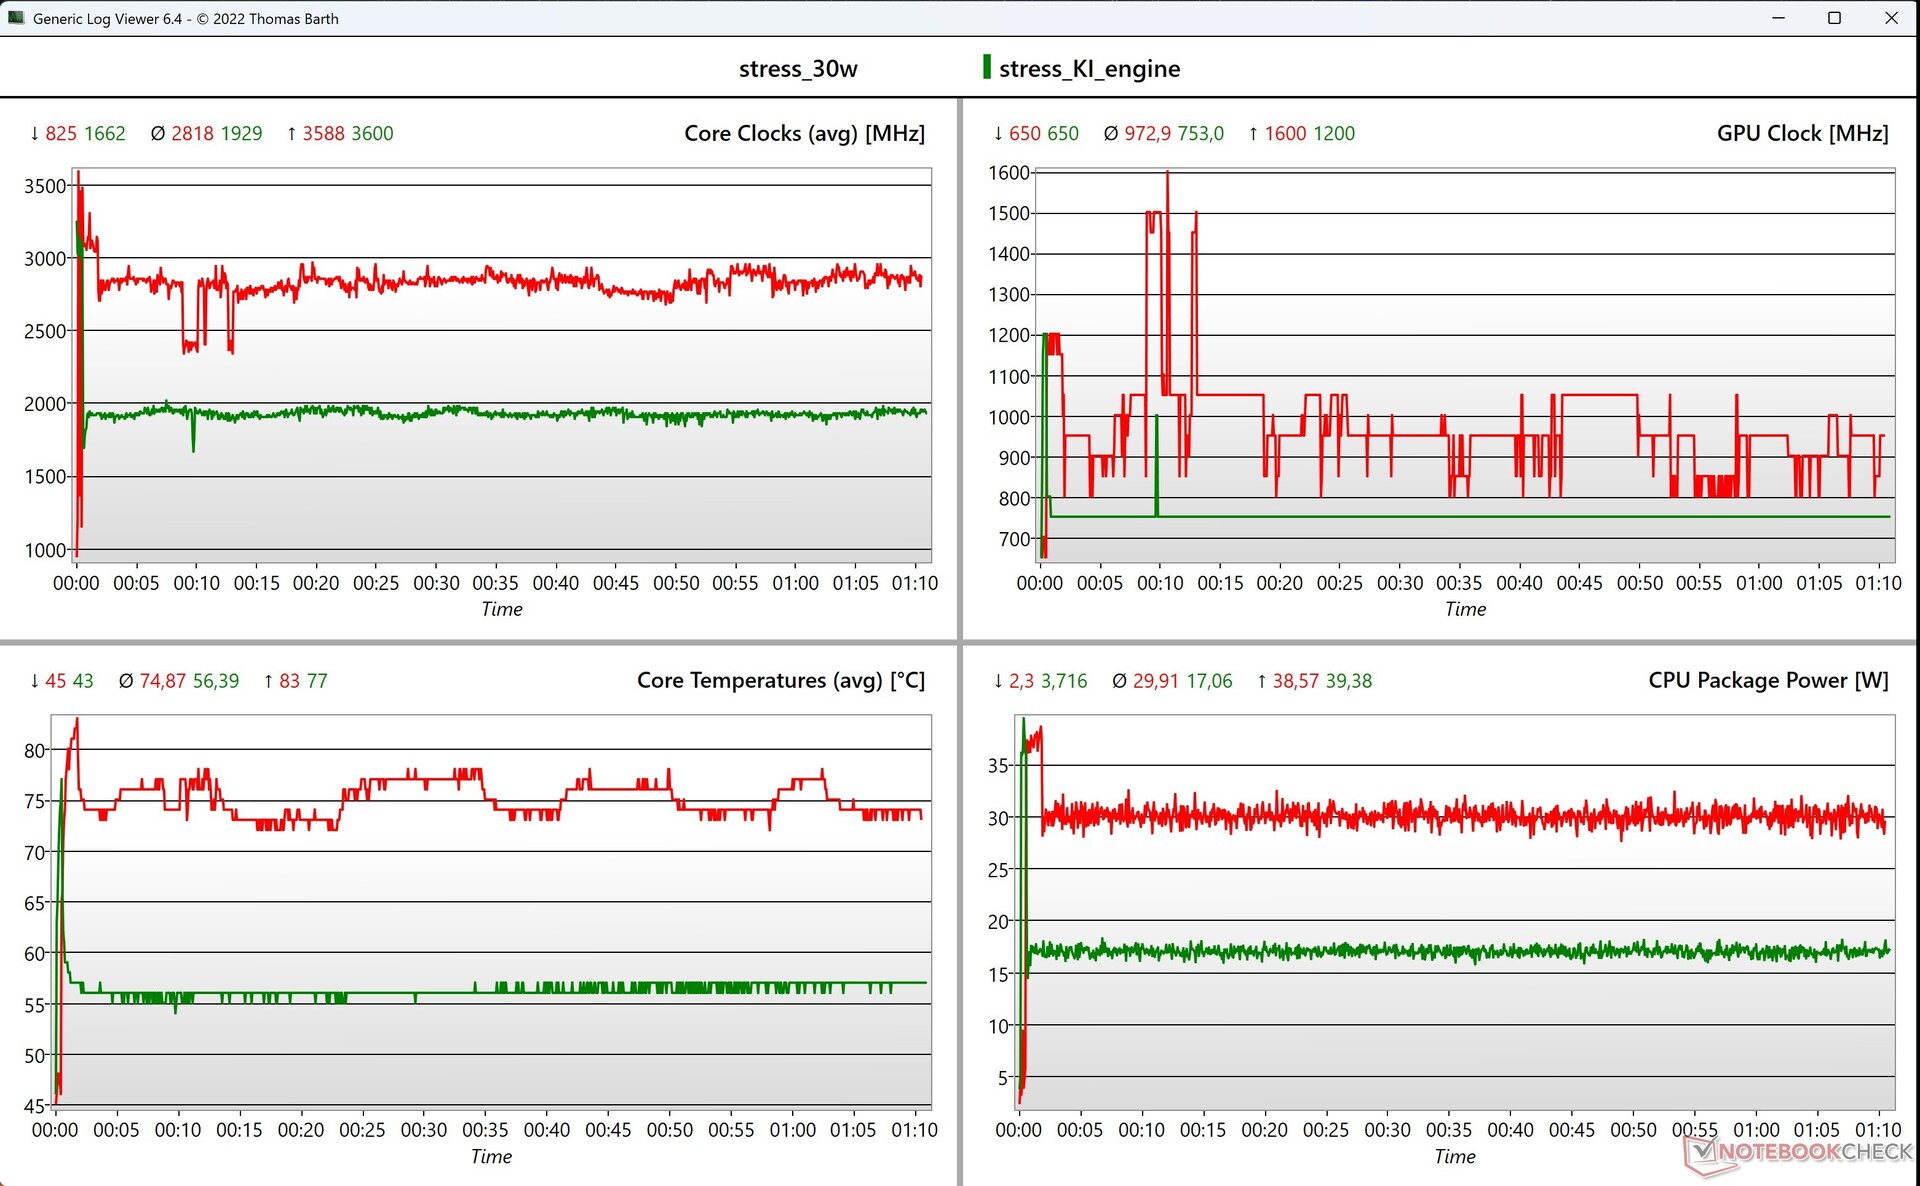
Claw 8 具有三种不同的能量曲线(续航、AI 引擎、手动),默认情况下选择的是AI 引擎。根据使用情况,设备会自动选择最佳的功率参数,但在我们的测试中,它只是保持在 17 瓦。要想获得尽可能高的游戏性能,你必须使用手动模式,然后可以在 8、17 和 30 瓦的 TDP 限制之间进行选择(但只能在 M Center 应用程序中进行选择,而不是快速菜单)。我们在手动模式和 30 瓦功率下进行了以下基准测试和测量。
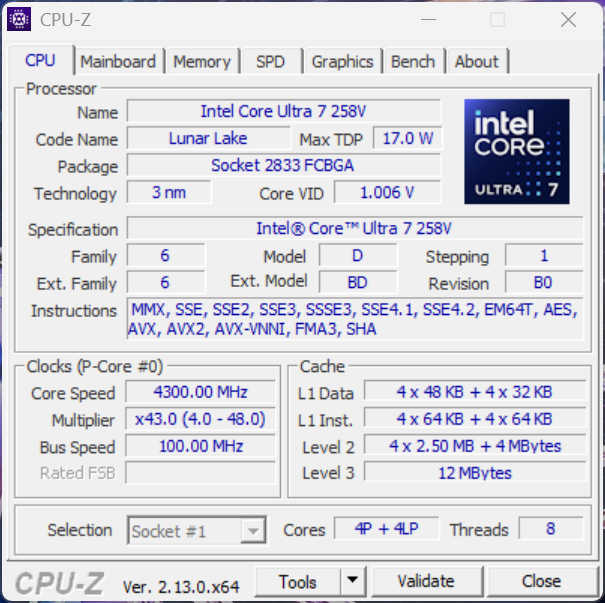
处理器 - Core Ultra 7 258V
酷睿 Ultra 7 258V 酷睿至尊 7 258V来自英特尔的 Lunar Lake 系列,拥有 8 个核心,在微星魔爪中的最大功耗为 37/30 瓦。由于核心数量较少,Lunar Lake 芯片的多核性能要弱于老式的 Meteor Lake 芯片和 AMD CPU,但其单核性能比以前更好。即使把 Claw 8 AI+ 当作一台普通电脑使用,其性能也完全可以胜任大多数日常任务。在持续负载的情况下,性能损失微乎其微,我们也没有注意到电池工作性能进一步下降。
Cinebench R15 Multi continuous test
Cinebench R23: Multi Core | Single Core
Cinebench R20: CPU (Multi Core) | CPU (Single Core)
Cinebench R15: CPU Multi 64Bit | CPU Single 64Bit
Blender: v2.79 BMW27 CPU
7-Zip 18.03: 7z b 4 | 7z b 4 -mmt1
Geekbench 6.4: Multi-Core | Single-Core
Geekbench 5.5: Multi-Core | Single-Core
HWBOT x265 Benchmark v2.2: 4k Preset
LibreOffice : 20 Documents To PDF
R Benchmark 2.5: Overall mean
| CPU Performance Rating | |
| GPD Pocket 4 | |
| Asus ROG Ally X | |
| MSI Claw | |
| ONEXPLAYER 2 Pro AR18 | |
| MSI Claw 8 AI+ | |
| Average Intel Core Ultra 7 258V | |
| Average of class Handheld / UMPC | |
| Valve Steam Deck 1 TB OLED -6! | |
| Lenovo Legion Go S | |
| Cinebench R23 / Multi Core | |
| GPD Pocket 4 | |
| Asus ROG Ally X | |
| MSI Claw | |
| ONEXPLAYER 2 Pro AR18 | |
| Average of class Handheld / UMPC (3984 - 16841, n=17, last 2 years) | |
| MSI Claw 8 AI+ | |
| Average Intel Core Ultra 7 258V (9114 - 11097, n=14) | |
| Lenovo Legion Go S | |
| Valve Steam Deck 1 TB OLED | |
| Cinebench R23 / Single Core | |
| GPD Pocket 4 | |
| Average Intel Core Ultra 7 258V (1664 - 1947, n=14) | |
| MSI Claw 8 AI+ | |
| MSI Claw | |
| Asus ROG Ally X | |
| ONEXPLAYER 2 Pro AR18 | |
| Average of class Handheld / UMPC (1088 - 2006, n=16, last 2 years) | |
| Lenovo Legion Go S | |
| Cinebench R20 / CPU (Multi Core) | |
| GPD Pocket 4 | |
| Asus ROG Ally X | |
| ONEXPLAYER 2 Pro AR18 | |
| MSI Claw | |
| Average of class Handheld / UMPC (1521 - 6577, n=15, last 2 years) | |
| MSI Claw 8 AI+ | |
| Average Intel Core Ultra 7 258V (3530 - 4314, n=14) | |
| Lenovo Legion Go S | |
| Valve Steam Deck 1 TB OLED | |
| Cinebench R20 / CPU (Single Core) | |
| GPD Pocket 4 | |
| MSI Claw 8 AI+ | |
| Average Intel Core Ultra 7 258V (643 - 749, n=14) | |
| MSI Claw | |
| ONEXPLAYER 2 Pro AR18 | |
| Asus ROG Ally X | |
| Average of class Handheld / UMPC (357 - 787, n=15, last 2 years) | |
| Lenovo Legion Go S | |
| Valve Steam Deck 1 TB OLED | |
| Cinebench R15 / CPU Multi 64Bit | |
| GPD Pocket 4 | |
| Asus ROG Ally X | |
| ONEXPLAYER 2 Pro AR18 | |
| MSI Claw | |
| Average of class Handheld / UMPC (689 - 2533, n=15, last 2 years) | |
| Average Intel Core Ultra 7 258V (1504 - 1656, n=14) | |
| MSI Claw 8 AI+ | |
| Lenovo Legion Go S | |
| Valve Steam Deck 1 TB OLED | |
| Cinebench R15 / CPU Single 64Bit | |
| GPD Pocket 4 | |
| MSI Claw 8 AI+ | |
| Average Intel Core Ultra 7 258V (258 - 298, n=14) | |
| ONEXPLAYER 2 Pro AR18 | |
| Asus ROG Ally X | |
| MSI Claw | |
| Average of class Handheld / UMPC (155.1 - 304, n=14, last 2 years) | |
| Lenovo Legion Go S | |
| Blender / v2.79 BMW27 CPU | |
| Lenovo Legion Go S | |
| Average Intel Core Ultra 7 258V (315 - 414, n=14) | |
| MSI Claw 8 AI+ | |
| Average of class Handheld / UMPC (189 - 588, n=13, last 2 years) | |
| MSI Claw | |
| ONEXPLAYER 2 Pro AR18 | |
| Asus ROG Ally X | |
| GPD Pocket 4 | |
| 7-Zip 18.03 / 7z b 4 | |
| GPD Pocket 4 | |
| Asus ROG Ally X | |
| ONEXPLAYER 2 Pro AR18 | |
| MSI Claw | |
| Average of class Handheld / UMPC (19684 - 66618, n=14, last 2 years) | |
| MSI Claw 8 AI+ | |
| Average Intel Core Ultra 7 258V (32198 - 36724, n=14) | |
| Lenovo Legion Go S | |
| Valve Steam Deck 1 TB OLED | |
| 7-Zip 18.03 / 7z b 4 -mmt1 | |
| GPD Pocket 4 | |
| Asus ROG Ally X | |
| Average Intel Core Ultra 7 258V (5265 - 5869, n=14) | |
| ONEXPLAYER 2 Pro AR18 | |
| MSI Claw 8 AI+ | |
| MSI Claw | |
| Average of class Handheld / UMPC (3653 - 6143, n=14, last 2 years) | |
| Lenovo Legion Go S | |
| Valve Steam Deck 1 TB OLED | |
| Geekbench 6.4 / Multi-Core | |
| GPD Pocket 4 | |
| Asus ROG Ally X | |
| Average Intel Core Ultra 7 258V (9311 - 11334, n=14) | |
| MSI Claw 8 AI+ | |
| MSI Claw | |
| Average of class Handheld / UMPC (4587 - 13426, n=16, last 2 years) | |
| ONEXPLAYER 2 Pro AR18 | |
| Lenovo Legion Go S | |
| Valve Steam Deck 1 TB OLED | |
| Geekbench 6.4 / Single-Core | |
| GPD Pocket 4 | |
| Average Intel Core Ultra 7 258V (2593 - 2795, n=14) | |
| MSI Claw 8 AI+ | |
| Asus ROG Ally X | |
| MSI Claw | |
| Average of class Handheld / UMPC (1348 - 2904, n=16, last 2 years) | |
| ONEXPLAYER 2 Pro AR18 | |
| Lenovo Legion Go S | |
| Valve Steam Deck 1 TB OLED | |
| Geekbench 5.5 / Multi-Core | |
| GPD Pocket 4 | |
| Asus ROG Ally X | |
| MSI Claw | |
| Average Intel Core Ultra 7 258V (7717 - 9864, n=14) | |
| MSI Claw 8 AI+ | |
| Average of class Handheld / UMPC (3932 - 11975, n=16, last 2 years) | |
| ONEXPLAYER 2 Pro AR18 | |
| Valve Steam Deck 1 TB OLED | |
| Lenovo Legion Go S | |
| Geekbench 5.5 / Single-Core | |
| GPD Pocket 4 | |
| Average Intel Core Ultra 7 258V (1891 - 2046, n=14) | |
| MSI Claw 8 AI+ | |
| Asus ROG Ally X | |
| MSI Claw | |
| Average of class Handheld / UMPC (875 - 2134, n=16, last 2 years) | |
| ONEXPLAYER 2 Pro AR18 | |
| Valve Steam Deck 1 TB OLED | |
| Lenovo Legion Go S | |
| HWBOT x265 Benchmark v2.2 / 4k Preset | |
| GPD Pocket 4 | |
| Asus ROG Ally X | |
| ONEXPLAYER 2 Pro AR18 | |
| Average of class Handheld / UMPC (7.07 - 20.8, n=14, last 2 years) | |
| MSI Claw | |
| MSI Claw 8 AI+ | |
| Average Intel Core Ultra 7 258V (10.5 - 14.2, n=14) | |
| Lenovo Legion Go S | |
| LibreOffice / 20 Documents To PDF | |
| Lenovo Legion Go S | |
| ONEXPLAYER 2 Pro AR18 | |
| Average of class Handheld / UMPC (41.1 - 92.8, n=14, last 2 years) | |
| Asus ROG Ally X | |
| GPD Pocket 4 | |
| Average Intel Core Ultra 7 258V (41.1 - 59.3, n=14) | |
| MSI Claw | |
| MSI Claw 8 AI+ | |
| R Benchmark 2.5 / Overall mean | |
| Lenovo Legion Go S | |
| Average of class Handheld / UMPC (0.4167 - 0.756, n=15, last 2 years) | |
| ONEXPLAYER 2 Pro AR18 | |
| MSI Claw | |
| Asus ROG Ally X | |
| Average Intel Core Ultra 7 258V (0.4457 - 0.4852, n=14) | |
| MSI Claw 8 AI+ | |
| GPD Pocket 4 | |
* ... smaller is better
AIDA64: FP32 Ray-Trace | FPU Julia | CPU SHA3 | CPU Queen | FPU SinJulia | FPU Mandel | CPU AES | CPU ZLib | FP64 Ray-Trace | CPU PhotoWorxx
| Performance Rating | |
| GPD Pocket 4 | |
| Asus ROG Ally X | |
| ONEXPLAYER 2 Pro AR18 | |
| Average of class Handheld / UMPC | |
| MSI Claw | |
| MSI Claw 8 AI+ | |
| Average Intel Core Ultra 7 258V | |
| Lenovo Legion Go S | |
| AIDA64 / FP32 Ray-Trace | |
| GPD Pocket 4 | |
| Asus ROG Ally X | |
| ONEXPLAYER 2 Pro AR18 | |
| Average of class Handheld / UMPC (6990 - 26450, n=15, last 2 years) | |
| MSI Claw 8 AI+ | |
| Average Intel Core Ultra 7 258V (9215 - 12781, n=14) | |
| MSI Claw | |
| Lenovo Legion Go S | |
| AIDA64 / FPU Julia | |
| Asus ROG Ally X | |
| GPD Pocket 4 | |
| ONEXPLAYER 2 Pro AR18 | |
| Average of class Handheld / UMPC (42932 - 109745, n=15, last 2 years) | |
| MSI Claw 8 AI+ | |
| Average Intel Core Ultra 7 258V (48758 - 63401, n=14) | |
| MSI Claw | |
| Lenovo Legion Go S | |
| AIDA64 / CPU SHA3 | |
| GPD Pocket 4 | |
| Asus ROG Ally X | |
| ONEXPLAYER 2 Pro AR18 | |
| Average of class Handheld / UMPC (1403 - 4847, n=15, last 2 years) | |
| MSI Claw | |
| MSI Claw 8 AI+ | |
| Average Intel Core Ultra 7 258V (2271 - 2817, n=14) | |
| Lenovo Legion Go S | |
| AIDA64 / CPU Queen | |
| Asus ROG Ally X | |
| ONEXPLAYER 2 Pro AR18 | |
| Average of class Handheld / UMPC (41744 - 114294, n=15, last 2 years) | |
| GPD Pocket 4 | |
| MSI Claw | |
| MSI Claw 8 AI+ | |
| Average Intel Core Ultra 7 258V (49510 - 49818, n=14) | |
| Lenovo Legion Go S | |
| AIDA64 / FPU SinJulia | |
| GPD Pocket 4 | |
| Asus ROG Ally X | |
| ONEXPLAYER 2 Pro AR18 | |
| Average of class Handheld / UMPC (4425 - 16980, n=15, last 2 years) | |
| MSI Claw | |
| Lenovo Legion Go S | |
| MSI Claw 8 AI+ | |
| Average Intel Core Ultra 7 258V (4103 - 4440, n=14) | |
| AIDA64 / FPU Mandel | |
| Asus ROG Ally X | |
| GPD Pocket 4 | |
| ONEXPLAYER 2 Pro AR18 | |
| Average of class Handheld / UMPC (23380 - 58482, n=15, last 2 years) | |
| MSI Claw 8 AI+ | |
| Average Intel Core Ultra 7 258V (25361 - 33565, n=14) | |
| MSI Claw | |
| Lenovo Legion Go S | |
| AIDA64 / CPU AES | |
| ONEXPLAYER 2 Pro AR18 | |
| Average of class Handheld / UMPC (21547 - 166333, n=15, last 2 years) | |
| Asus ROG Ally X | |
| GPD Pocket 4 | |
| MSI Claw | |
| Average Intel Core Ultra 7 258V (37728 - 40753, n=14) | |
| MSI Claw 8 AI+ | |
| Lenovo Legion Go S | |
| AIDA64 / CPU ZLib | |
| GPD Pocket 4 | |
| Asus ROG Ally X | |
| ONEXPLAYER 2 Pro AR18 | |
| Average of class Handheld / UMPC (356 - 1112, n=15, last 2 years) | |
| MSI Claw | |
| MSI Claw 8 AI+ | |
| Average Intel Core Ultra 7 258V (499 - 632, n=14) | |
| Lenovo Legion Go S | |
| AIDA64 / FP64 Ray-Trace | |
| GPD Pocket 4 | |
| Asus ROG Ally X | |
| ONEXPLAYER 2 Pro AR18 | |
| Average of class Handheld / UMPC (3766 - 14181, n=15, last 2 years) | |
| MSI Claw 8 AI+ | |
| Average Intel Core Ultra 7 258V (4891 - 6930, n=14) | |
| MSI Claw | |
| Lenovo Legion Go S | |
| AIDA64 / CPU PhotoWorxx | |
| MSI Claw 8 AI+ | |
| Average Intel Core Ultra 7 258V (51323 - 54971, n=14) | |
| MSI Claw | |
| GPD Pocket 4 | |
| Asus ROG Ally X | |
| Average of class Handheld / UMPC (19472 - 54726, n=15, last 2 years) | |
| ONEXPLAYER 2 Pro AR18 | |
| Lenovo Legion Go S | |
系统性能
由于采用了现代化的组件,Claw 8 AI+ 的响应速度非常快,我们在测试过程中没有遇到任何稳定性问题。
CrossMark: Overall | Productivity | Creativity | Responsiveness
WebXPRT 3: Overall
WebXPRT 4: Overall
Mozilla Kraken 1.1: Total
| PCMark 10 / Score | |
| GPD Pocket 4 | |
| MSI Claw 8 AI+ | |
| Asus ROG Ally X | |
| Average Intel Core Ultra 7 258V, Intel Arc Graphics 140V (6265 - 7314, n=14) | |
| MSI Claw | |
| Average of class Handheld / UMPC (5219 - 7471, n=15, last 2 years) | |
| ONEXPLAYER 2 Pro AR18 | |
| Lenovo Legion Go S | |
| PCMark 10 / Essentials | |
| GPD Pocket 4 | |
| MSI Claw 8 AI+ | |
| Asus ROG Ally X | |
| Average Intel Core Ultra 7 258V, Intel Arc Graphics 140V (9295 - 11467, n=14) | |
| Average of class Handheld / UMPC (8427 - 11262, n=15, last 2 years) | |
| MSI Claw | |
| ONEXPLAYER 2 Pro AR18 | |
| Lenovo Legion Go S | |
| PCMark 10 / Productivity | |
| GPD Pocket 4 | |
| Asus ROG Ally X | |
| MSI Claw 8 AI+ | |
| Average Intel Core Ultra 7 258V, Intel Arc Graphics 140V (7357 - 9619, n=14) | |
| Average of class Handheld / UMPC (7213 - 10031, n=15, last 2 years) | |
| MSI Claw | |
| ONEXPLAYER 2 Pro AR18 | |
| Lenovo Legion Go S | |
| PCMark 10 / Digital Content Creation | |
| MSI Claw 8 AI+ | |
| GPD Pocket 4 | |
| Average Intel Core Ultra 7 258V, Intel Arc Graphics 140V (9333 - 10048, n=14) | |
| Asus ROG Ally X | |
| MSI Claw | |
| Average of class Handheld / UMPC (6350 - 10026, n=15, last 2 years) | |
| ONEXPLAYER 2 Pro AR18 | |
| Lenovo Legion Go S | |
| CrossMark / Overall | |
| GPD Pocket 4 | |
| MSI Claw 8 AI+ | |
| Average Intel Core Ultra 7 258V, Intel Arc Graphics 140V (1590 - 1742, n=13) | |
| MSI Claw | |
| Asus ROG Ally X | |
| Average of class Handheld / UMPC (840 - 1847, n=13, last 2 years) | |
| ONEXPLAYER 2 Pro AR18 | |
| Lenovo Legion Go S | |
| Valve Steam Deck 1 TB OLED | |
| CrossMark / Productivity | |
| GPD Pocket 4 | |
| MSI Claw 8 AI+ | |
| MSI Claw | |
| Asus ROG Ally X | |
| Average Intel Core Ultra 7 258V, Intel Arc Graphics 140V (1558 - 1684, n=13) | |
| Average of class Handheld / UMPC (874 - 1719, n=13, last 2 years) | |
| ONEXPLAYER 2 Pro AR18 | |
| Lenovo Legion Go S | |
| Valve Steam Deck 1 TB OLED | |
| CrossMark / Creativity | |
| GPD Pocket 4 | |
| MSI Claw 8 AI+ | |
| Average Intel Core Ultra 7 258V, Intel Arc Graphics 140V (1727 - 1977, n=13) | |
| Asus ROG Ally X | |
| MSI Claw | |
| Average of class Handheld / UMPC (808 - 2077, n=13, last 2 years) | |
| ONEXPLAYER 2 Pro AR18 | |
| Lenovo Legion Go S | |
| Valve Steam Deck 1 TB OLED | |
| CrossMark / Responsiveness | |
| GPD Pocket 4 | |
| MSI Claw | |
| MSI Claw 8 AI+ | |
| Asus ROG Ally X | |
| ONEXPLAYER 2 Pro AR18 | |
| Average Intel Core Ultra 7 258V, Intel Arc Graphics 140V (1251 - 1411, n=13) | |
| Average of class Handheld / UMPC (759 - 1610, n=13, last 2 years) | |
| Valve Steam Deck 1 TB OLED | |
| Lenovo Legion Go S | |
| WebXPRT 3 / Overall | |
| GPD Pocket 4 | |
| MSI Claw 8 AI+ | |
| Asus ROG Ally X | |
| Average Intel Core Ultra 7 258V, Intel Arc Graphics 140V (219 - 314, n=12) | |
| MSI Claw | |
| Average of class Handheld / UMPC (188.4 - 323, n=15, last 2 years) | |
| ONEXPLAYER 2 Pro AR18 | |
| Lenovo Legion Go S | |
| WebXPRT 4 / Overall | |
| MSI Claw 8 AI+ | |
| Average Intel Core Ultra 7 258V, Intel Arc Graphics 140V (199.5 - 291, n=14) | |
| GPD Pocket 4 | |
| MSI Claw | |
| Asus ROG Ally X | |
| Average of class Handheld / UMPC (107 - 291, n=12, last 2 years) | |
| Lenovo Legion Go S | |
| Valve Steam Deck 1 TB OLED | |
| Mozilla Kraken 1.1 / Total | |
| Lenovo Legion Go S | |
| Average of class Handheld / UMPC (428 - 895, n=15, last 2 years) | |
| Asus ROG Ally X | |
| MSI Claw | |
| ONEXPLAYER 2 Pro AR18 | |
| Average Intel Core Ultra 7 258V, Intel Arc Graphics 140V (468 - 559, n=14) | |
| MSI Claw 8 AI+ | |
| GPD Pocket 4 | |
* ... smaller is better
| PCMark 10 Score | 7314 points | |
Help | ||
| AIDA64 / Memory Copy | |
| Average Intel Core Ultra 7 258V (107682 - 114336, n=14) | |
| MSI Claw 8 AI+ | |
| GPD Pocket 4 | |
| MSI Claw | |
| Asus ROG Ally X | |
| Average of class Handheld / UMPC (32617 - 107929, n=16, last 2 years) | |
| Lenovo Legion Go S | |
| ONEXPLAYER 2 Pro AR18 | |
| Valve Steam Deck 1 TB OLED | |
| AIDA64 / Memory Read | |
| GPD Pocket 4 | |
| MSI Claw 8 AI+ | |
| Average Intel Core Ultra 7 258V (82846 - 89417, n=14) | |
| MSI Claw | |
| Average of class Handheld / UMPC (25380 - 100208, n=15, last 2 years) | |
| Asus ROG Ally X | |
| Lenovo Legion Go S | |
| ONEXPLAYER 2 Pro AR18 | |
| Valve Steam Deck 1 TB OLED | |
| AIDA64 / Memory Write | |
| MSI Claw 8 AI+ | |
| Average Intel Core Ultra 7 258V (109734 - 117935, n=14) | |
| Asus ROG Ally X | |
| GPD Pocket 4 | |
| Average of class Handheld / UMPC (25596 - 117883, n=17, last 2 years) | |
| MSI Claw | |
| ONEXPLAYER 2 Pro AR18 | |
| Lenovo Legion Go S | |
| Valve Steam Deck 1 TB OLED | |
| AIDA64 / Memory Latency | |
| MSI Claw | |
| ONEXPLAYER 2 Pro AR18 | |
| Lenovo Legion Go S | |
| Average of class Handheld / UMPC (99.8 - 147.6, n=16, last 2 years) | |
| Asus ROG Ally X | |
| Valve Steam Deck 1 TB OLED | |
| GPD Pocket 4 | |
| MSI Claw 8 AI+ | |
| Average Intel Core Ultra 7 258V (95 - 101.1, n=14) | |
* ... smaller is better
DPC 延迟
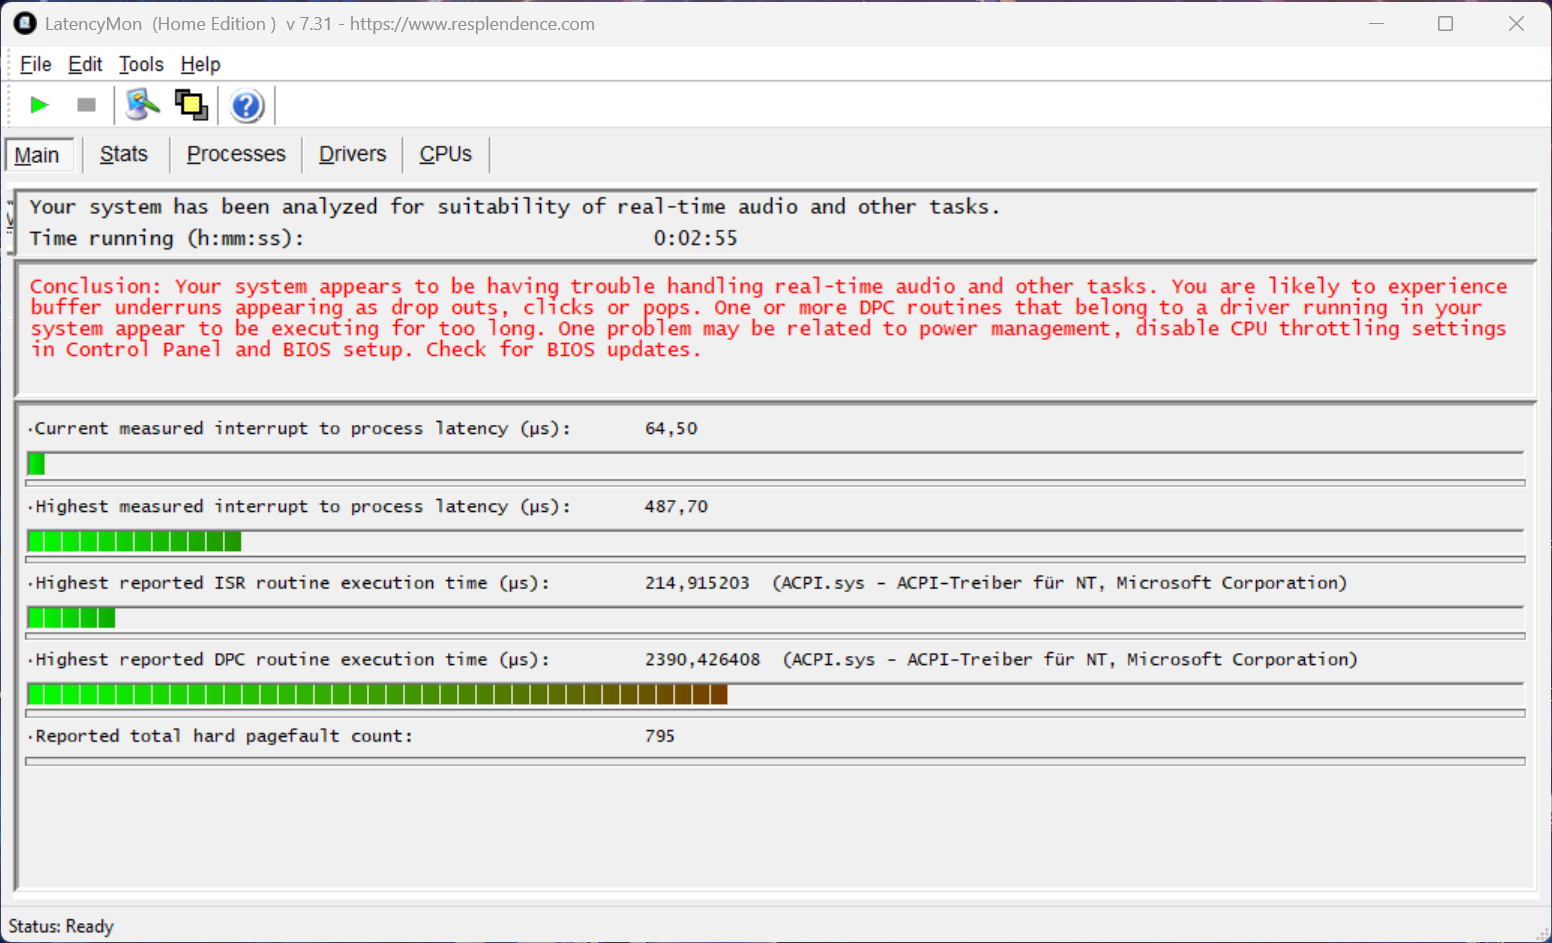
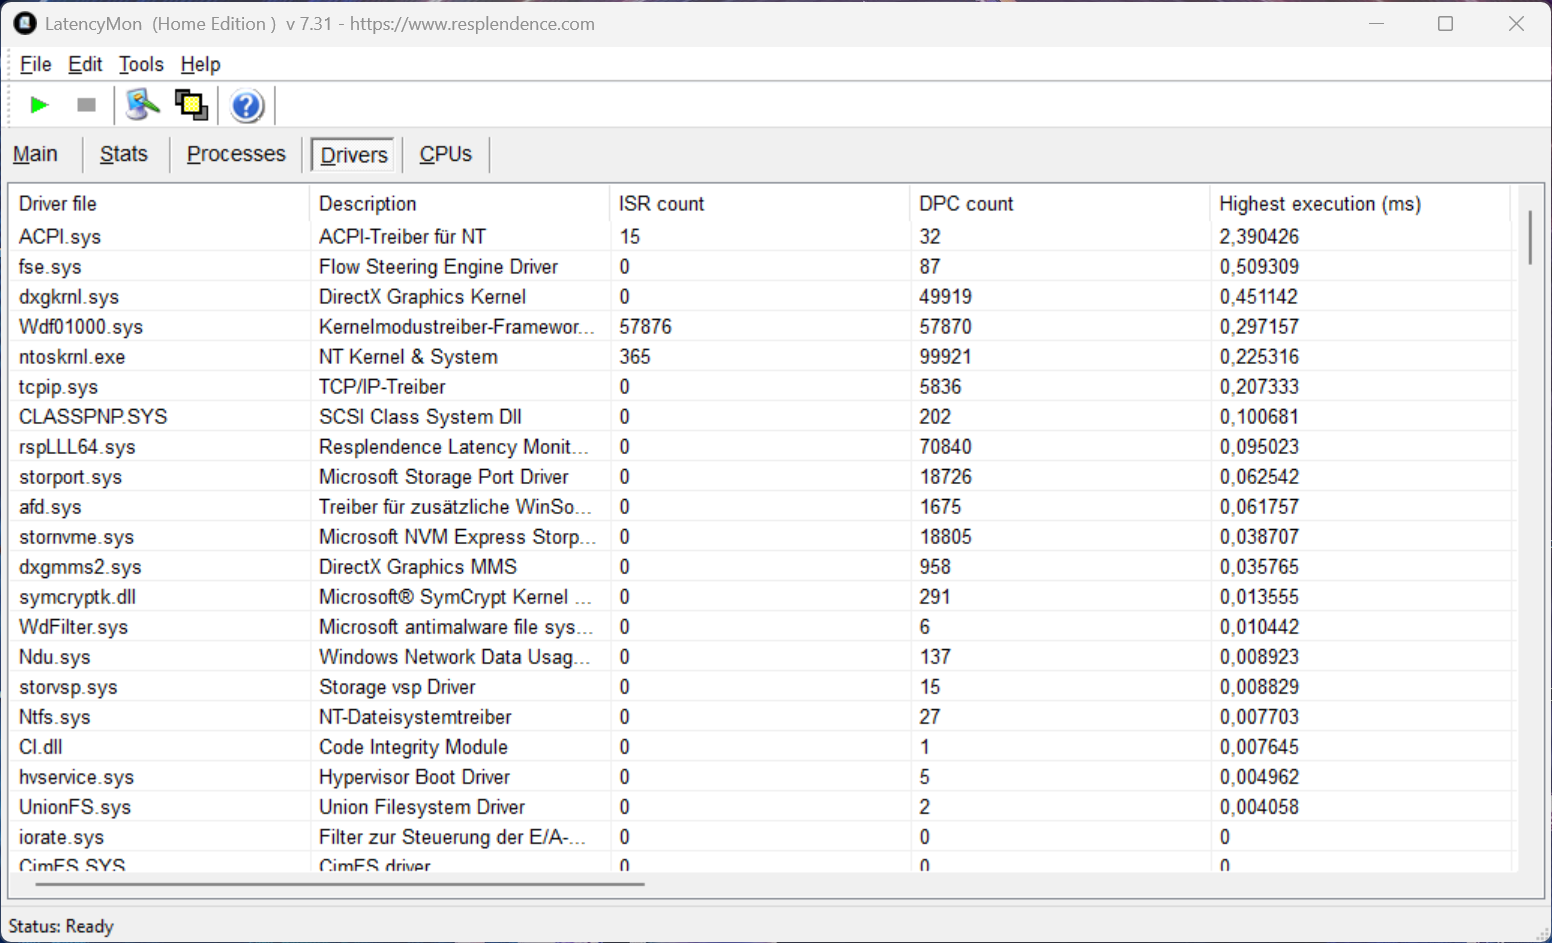
在延迟测试中,使用当前 BIOS 版本的测试设备没有显示出任何限制。有一个驱动程序确实有点故障,但重要的中断到进程延迟值非常低。
| DPC Latencies / LatencyMon - interrupt to process latency (max), Web, Youtube, Prime95 | |
| MSI Claw | |
| Asus ROG Ally X | |
| Lenovo Legion Go S | |
| ONEXPLAYER 2 Pro AR18 | |
| MSI Claw 8 AI+ | |
| GPD Pocket 4 | |
* ... smaller is better
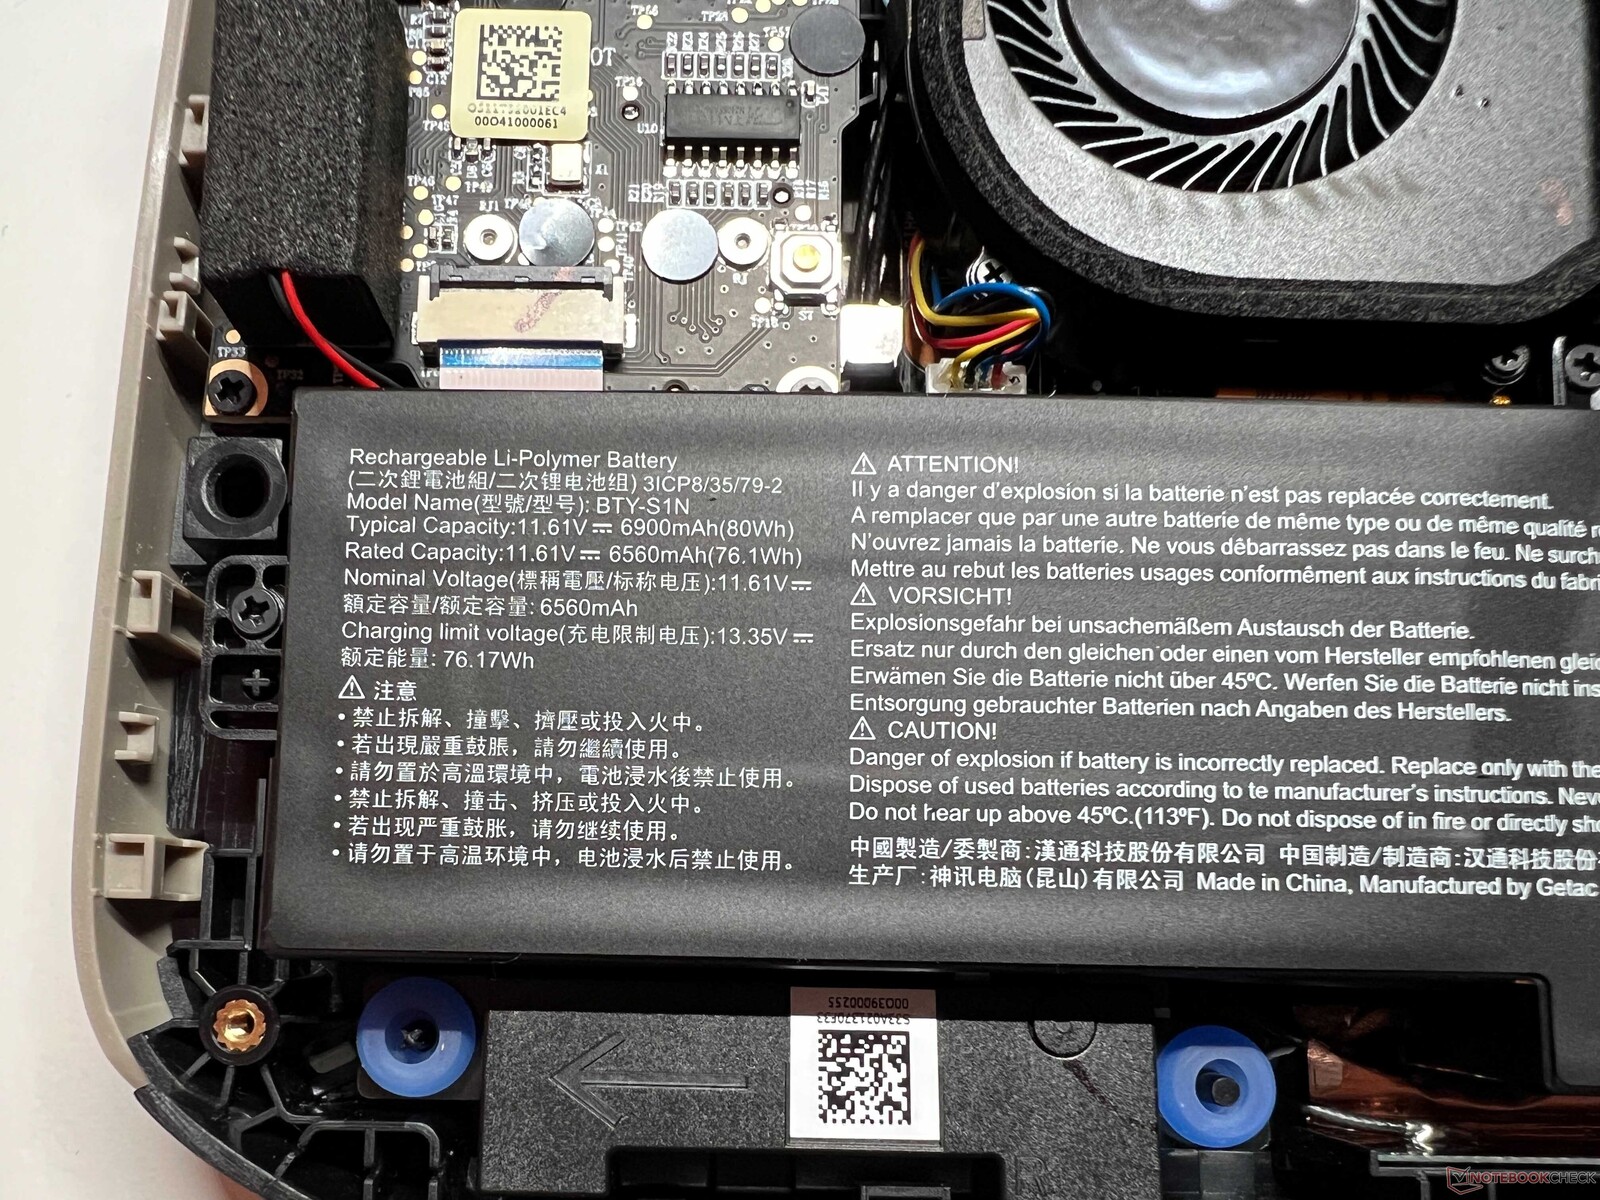
存储设备
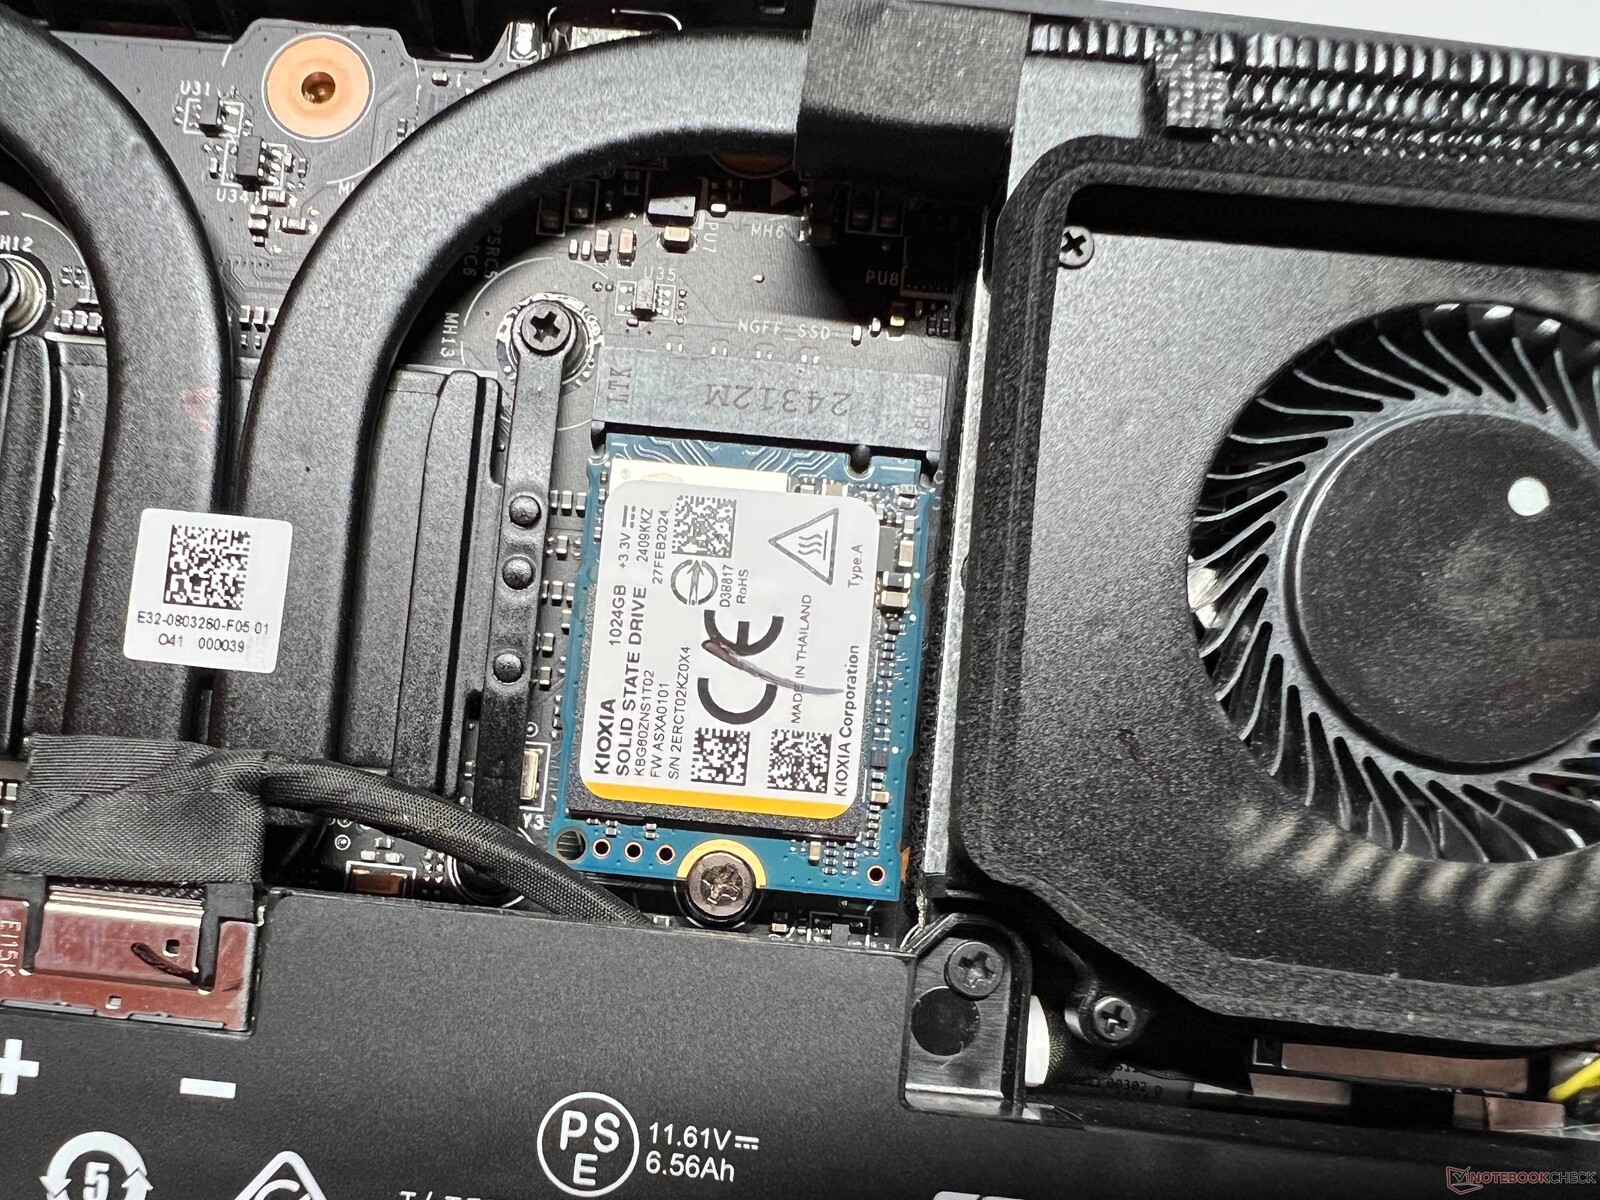
微星安装了一块来自 Kioxia 的紧凑型 1TB M.2-2230 SSD(首次启动后可用容量为 869 GB),可以顺利更换。在我们的测试中,PCIe 4.0 SSD 的传输速率非常好,而且完全保持稳定。

| Drive Performance Rating - Percent | |
| ONEXPLAYER 2 Pro AR18 -11! | |
| GPD Pocket 4 | |
| MSI Claw 8 AI+ | |
| Average of class Handheld / UMPC | |
| Average Kioxia BG6 KBG60ZNS1T02 | |
| Lenovo Legion Go S | |
| Asus ROG Ally X | |
| MSI Claw | |
| Valve Steam Deck 1 TB OLED -11! | |
* ... smaller is better
Reading continuous performance: DiskSpd Read Loop, Queue Depth 8
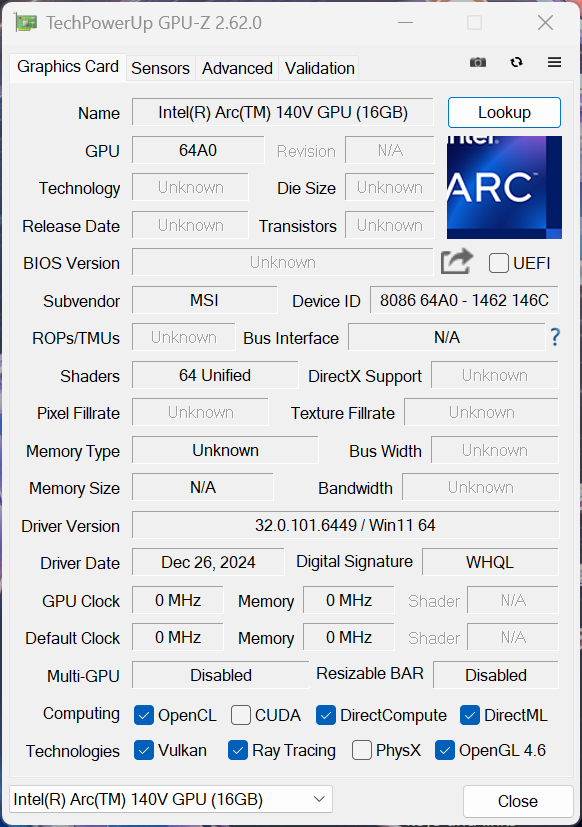
图形卡
英特尔 英特尔 Arc Graphics 140VClaw 8 的图形性能非常出色,在合成基准测试中名列我们对比组的前茅。不过,游戏性能当然更为重要,Lunar Lake 处理器在这方面的表现也非常出色。在我们的标准测试中,Claw 8 的表现仅次于价格更高的 GDP Pocket,但旧的 爪被超越了 25%,而 ROG Ally X领先约 10%。在我们的测试中,《GTA V》在启动时不断崩溃,因此我们无法在此提供任何结果。除此之外,没有任何问题。无论是在长时间游戏还是在电池供电的情况下,它的游戏性能都完全稳定。
| 3DMark Performance Rating - Percent | |
| MSI Claw 8 AI+ | |
| Average Intel Arc Graphics 140V | |
| Asus ROG Ally X | |
| GPD Pocket 4 | |
| MSI Claw | |
| Average of class Handheld / UMPC | |
| ONEXPLAYER 2 Pro AR18 | |
| Lenovo Legion Go S -1! | |
| 3DMark 11 Performance | 11827 points | |
| 3DMark Fire Strike Score | 9075 points | |
| 3DMark Time Spy Score | 4448 points | |
| 3DMark Steel Nomad Score | 812 points | |
| 3DMark Steel Nomad Light Score | 3289 points | |
| 3DMark Steel Nomad Light Unlimited Score | 3267 points | |
Help | ||
| Blender / v3.3 Classroom CPU | |
| Lenovo Legion Go S | |
| Average Intel Arc Graphics 140V (509 - 700, n=21) | |
| MSI Claw 8 AI+ | |
| Average of class Handheld / UMPC (290 - 980, n=15, last 2 years) | |
| MSI Claw | |
| ONEXPLAYER 2 Pro AR18 | |
| Asus ROG Ally X | |
| GPD Pocket 4 | |
| Blender / v3.3 Classroom HIP/AMD | |
| Lenovo Legion Go S | |
| Average of class Handheld / UMPC (n=1last 2 years) | |
* ... smaller is better
| Performance Rating - Percent | |
| GPD Pocket 4 | |
| MSI Claw 8 AI+ | |
| Asus ROG Ally X | |
| Average of class Handheld / UMPC | |
| MSI Claw | |
| ONEXPLAYER 2 Pro AR18 -2! | |
| Lenovo Legion Go S | |
| Valve Steam Deck 1 TB OLED -4! | |
| Cyberpunk 2077 2.2 Phantom Liberty - 1920x1080 Ultra Preset (FSR off) | |
| MSI Claw 8 AI+ | |
| GPD Pocket 4 | |
| Asus ROG Ally X | |
| Average of class Handheld / UMPC (11.5 - 28.5, n=13, last 2 years) | |
| MSI Claw | |
| Lenovo Legion Go S | |
| Baldur's Gate 3 - 1920x1080 Ultra Preset | |
| GPD Pocket 4 | |
| MSI Claw 8 AI+ | |
| Asus ROG Ally X | |
| Average of class Handheld / UMPC (13.5 - 29.1, n=14, last 2 years) | |
| MSI Claw | |
| Lenovo Legion Go S | |
| Final Fantasy XV Benchmark - 1920x1080 High Quality | |
| MSI Claw 8 AI+ | |
| GPD Pocket 4 | |
| Asus ROG Ally X | |
| ONEXPLAYER 2 Pro AR18 | |
| Average of class Handheld / UMPC (18.4 - 34.4, n=18, last 2 years) | |
| MSI Claw | |
| Lenovo Legion Go S | |
| Valve Steam Deck 1 TB OLED | |
| Strange Brigade - 1920x1080 ultra AA:ultra AF:16 | |
| MSI Claw 8 AI+ | |
| GPD Pocket 4 | |
| Asus ROG Ally X | |
| ONEXPLAYER 2 Pro AR18 | |
| MSI Claw | |
| Average of class Handheld / UMPC (30 - 56.1, n=18, last 2 years) | |
| Lenovo Legion Go S | |
| Valve Steam Deck 1 TB OLED | |
| Dota 2 Reborn - 1920x1080 ultra (3/3) best looking | |
| GPD Pocket 4 | |
| MSI Claw 8 AI+ | |
| Asus ROG Ally X | |
| Average of class Handheld / UMPC (30.8 - 85, n=18, last 2 years) | |
| MSI Claw | |
| ONEXPLAYER 2 Pro AR18 | |
| Lenovo Legion Go S | |
| X-Plane 11.11 - 1920x1080 high (fps_test=3) | |
| GPD Pocket 4 | |
| MSI Claw | |
| Asus ROG Ally X | |
| Average of class Handheld / UMPC (24.5 - 50.5, n=18, last 2 years) | |
| MSI Claw 8 AI+ | |
| ONEXPLAYER 2 Pro AR18 | |
| Lenovo Legion Go S | |
Cyberpunk 2077 ultra FPS diagram
| low | med. | high | ultra | |
|---|---|---|---|---|
| GTA V (2015) | 0 game wont start | |||
| Dota 2 Reborn (2015) | 100.7 | 94 | 84.1 | 82.2 |
| Final Fantasy XV Benchmark (2018) | 87.6 | 87.6 | 34.4 | |
| X-Plane 11.11 (2018) | 43.3 | 36.5 | 32.2 | |
| Strange Brigade (2018) | 227 | 81.7 | 67.9 | 56.1 |
| Baldur's Gate 3 (2023) | 40.4 | 33.5 | 29.2 | 28.7 |
| Cyberpunk 2077 2.2 Phantom Liberty (2023) | 46.8 | 37.4 | 31.4 | 28.5 |
| F1 24 (2024) | 85.7 | 76.2 | 59.5 | 20.1 |
| Assassin's Creed Shadows (2025) | 18 |
排放与能源
噪音排放
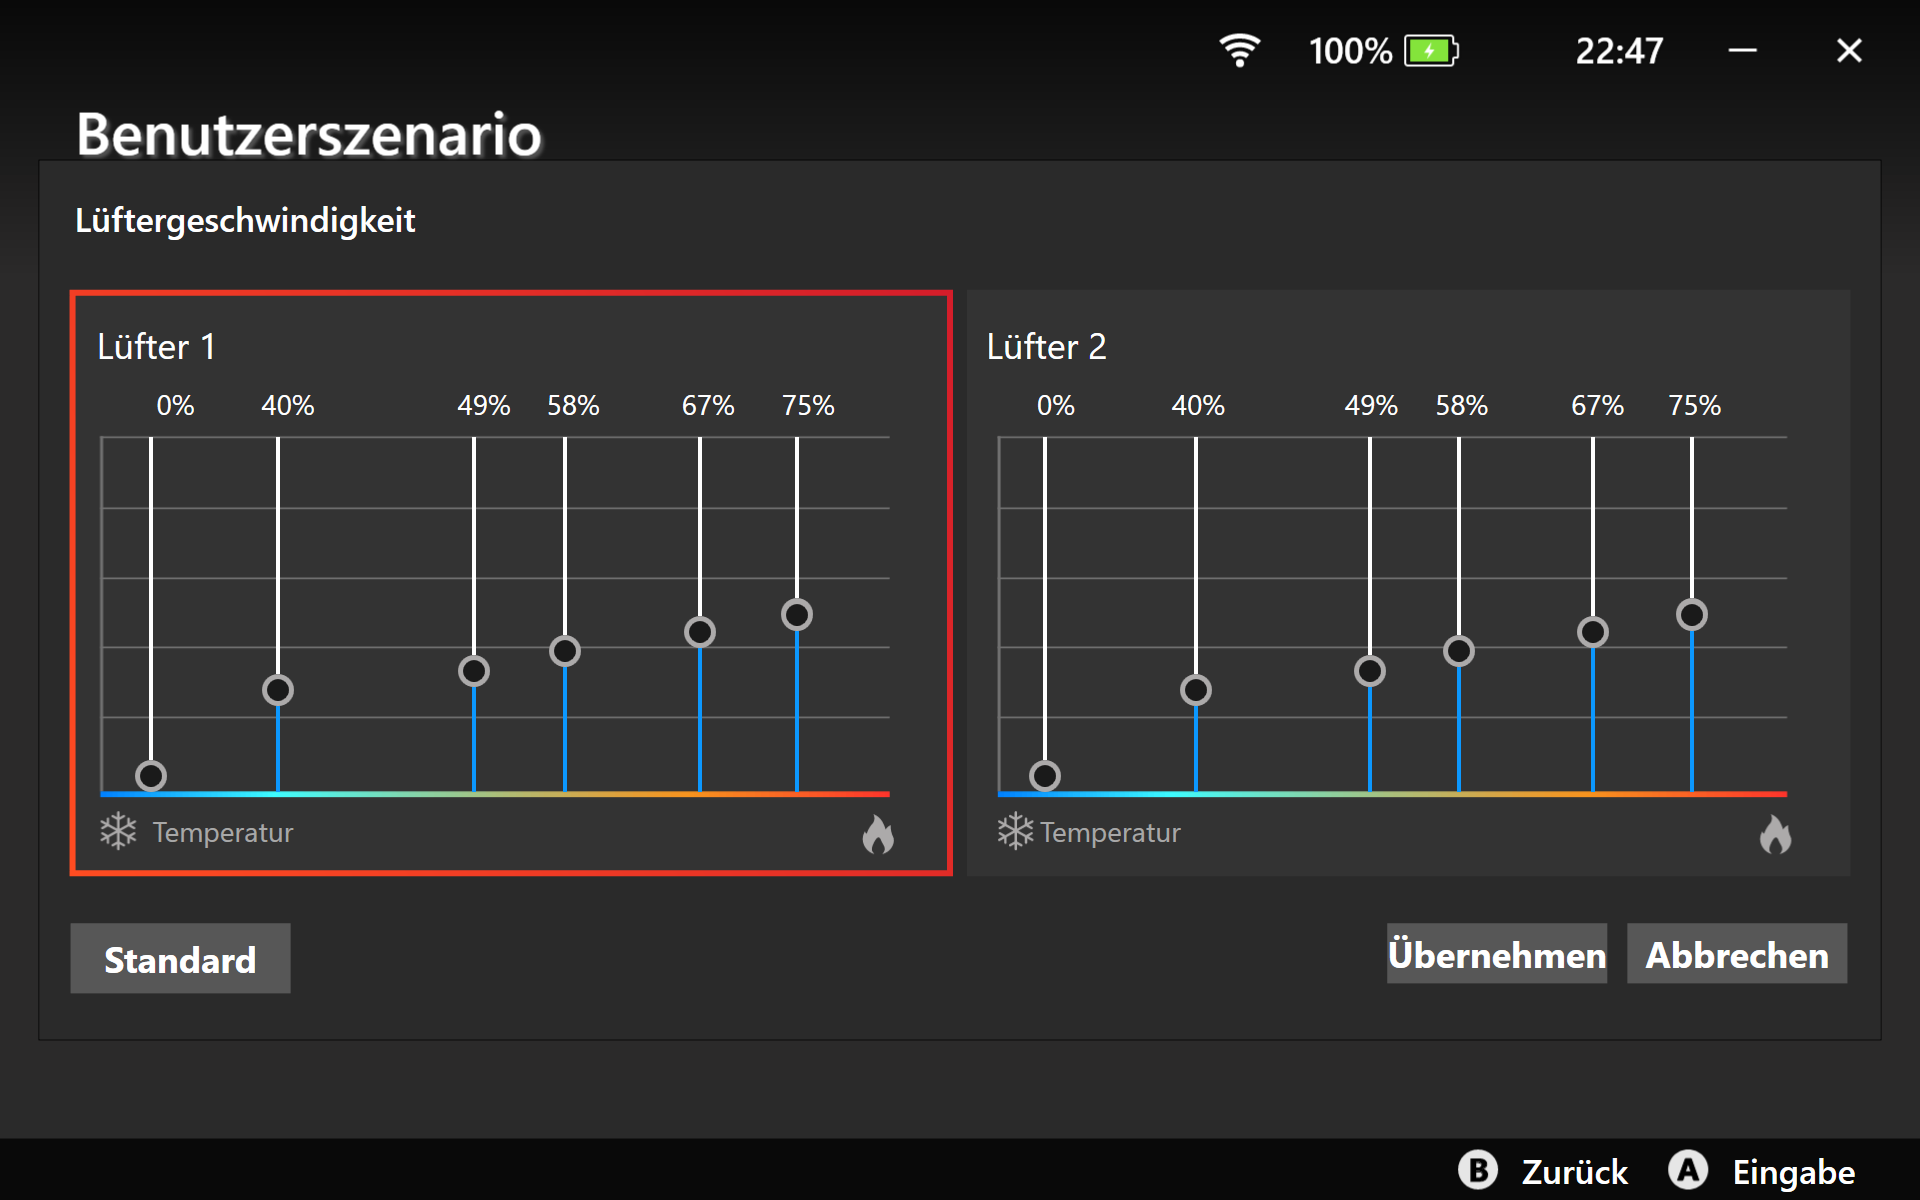
手持设备的两个风扇启动相当快,尤其是在功率最大的模式下,但在游戏过程中,风扇的波动行为更令人担忧。在 30 瓦的手动模式下,该设备的噪音在 37.3-41.4 dB(A) 之间变化,尽管其 TDP 绝对不变。我们在AI模式(37/17 瓦)下也观察到了这种情况,但噪音范围在 33.4-37.3 dB(A)之间。测试期间,测试设备没有发出其他电子噪音。
Noise Level
| Idle |
| 24.7 / 24.7 / 28.9 dB(A) |
| Load |
| 37.3 / 41.4 dB(A) |
 | ||
30 dB silent 40 dB(A) audible 50 dB(A) loud |
||
min: | ||
| MSI Claw 8 AI+ Arc 140V, Core Ultra 7 258V, Kioxia BG6 KBG60ZNS1T02 | Lenovo Legion Go S Radeon 680M, Z2 Go, SK hynix PVC10 HFS512GEM4X182N | GPD Pocket 4 Radeon 890M, Ryzen AI 9 HX 370 | Asus ROG Ally X Radeon 780M, Z1 Extreme, WD PC SN560 SDDPNQE-1T00 | MSI Claw Arc 8-Core, Ultra 7 155H, Kioxia BG5 KBG50ZNS1T02 | Valve Steam Deck 1 TB OLED Radeon Radeon Steam Deck 8CU, Steam Deck OLED APU, Phison ESMP001TKB5C3 | ONEXPLAYER 2 Pro AR18 Radeon 780M, R7 7840U | |
|---|---|---|---|---|---|---|---|
| Noise | -5% | -7% | -3% | -9% | 5% | 1% | |
| off / environment * | 24.7 | 25.6 -4% | 22.8 8% | 24.7 -0% | 25.7 -4% | 24.7 -0% | 24.4 1% |
| Idle Minimum * | 24.7 | 25.6 -4% | 25.8 -4% | 24.7 -0% | 25.7 -4% | 25 -1% | 24.4 1% |
| Idle Average * | 24.7 | 25.6 -4% | 25.8 -4% | 24.7 -0% | 31.7 -28% | 25 -1% | 24.4 1% |
| Idle Maximum * | 28.9 | 28.37 2% | 31 -7% | 28.5 1% | 31.7 -10% | 25 13% | 30.6 -6% |
| Load Average * | 37.3 | 47 -26% | 42.6 -14% | 36.6 2% | 31.3 16% | 36 3% | |
| Cyberpunk 2077 ultra * | 41.4 | 43.1 -4% | 43.3 -5% | 42.6 -3% | 45.5 -10% | ||
| Load Maximum * | 41.4 | 48.5 -17% | 45.1 -9% | 42.6 -3% | 45.5 -10% | 40.8 1% | 39.3 5% |
* ... smaller is better
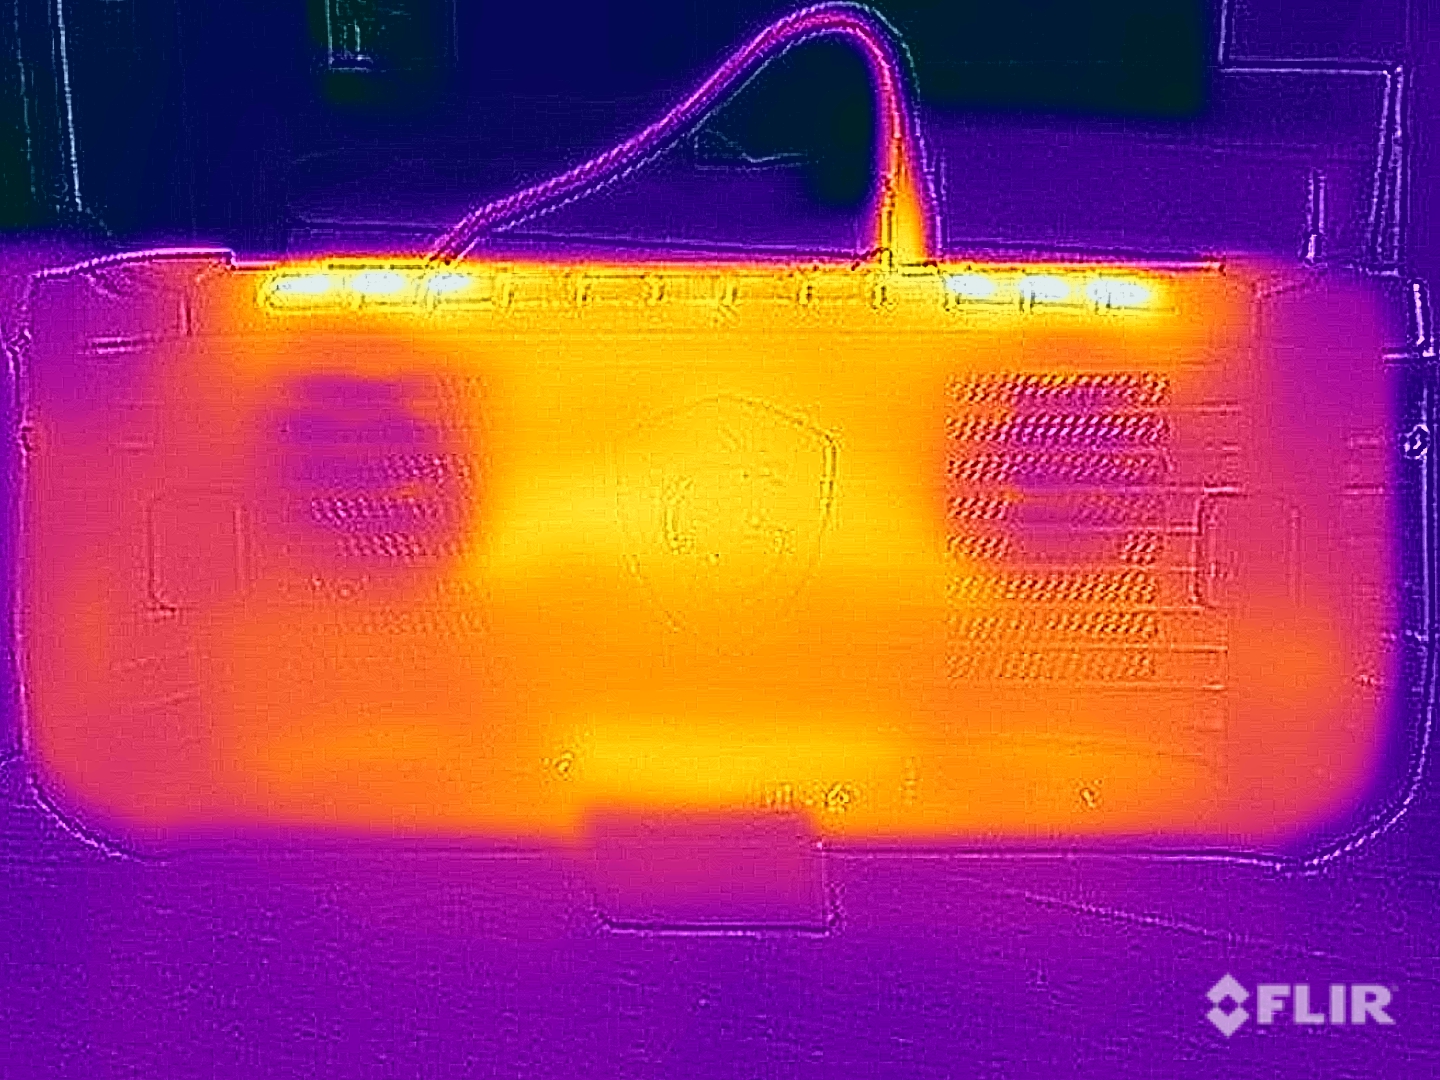
温度
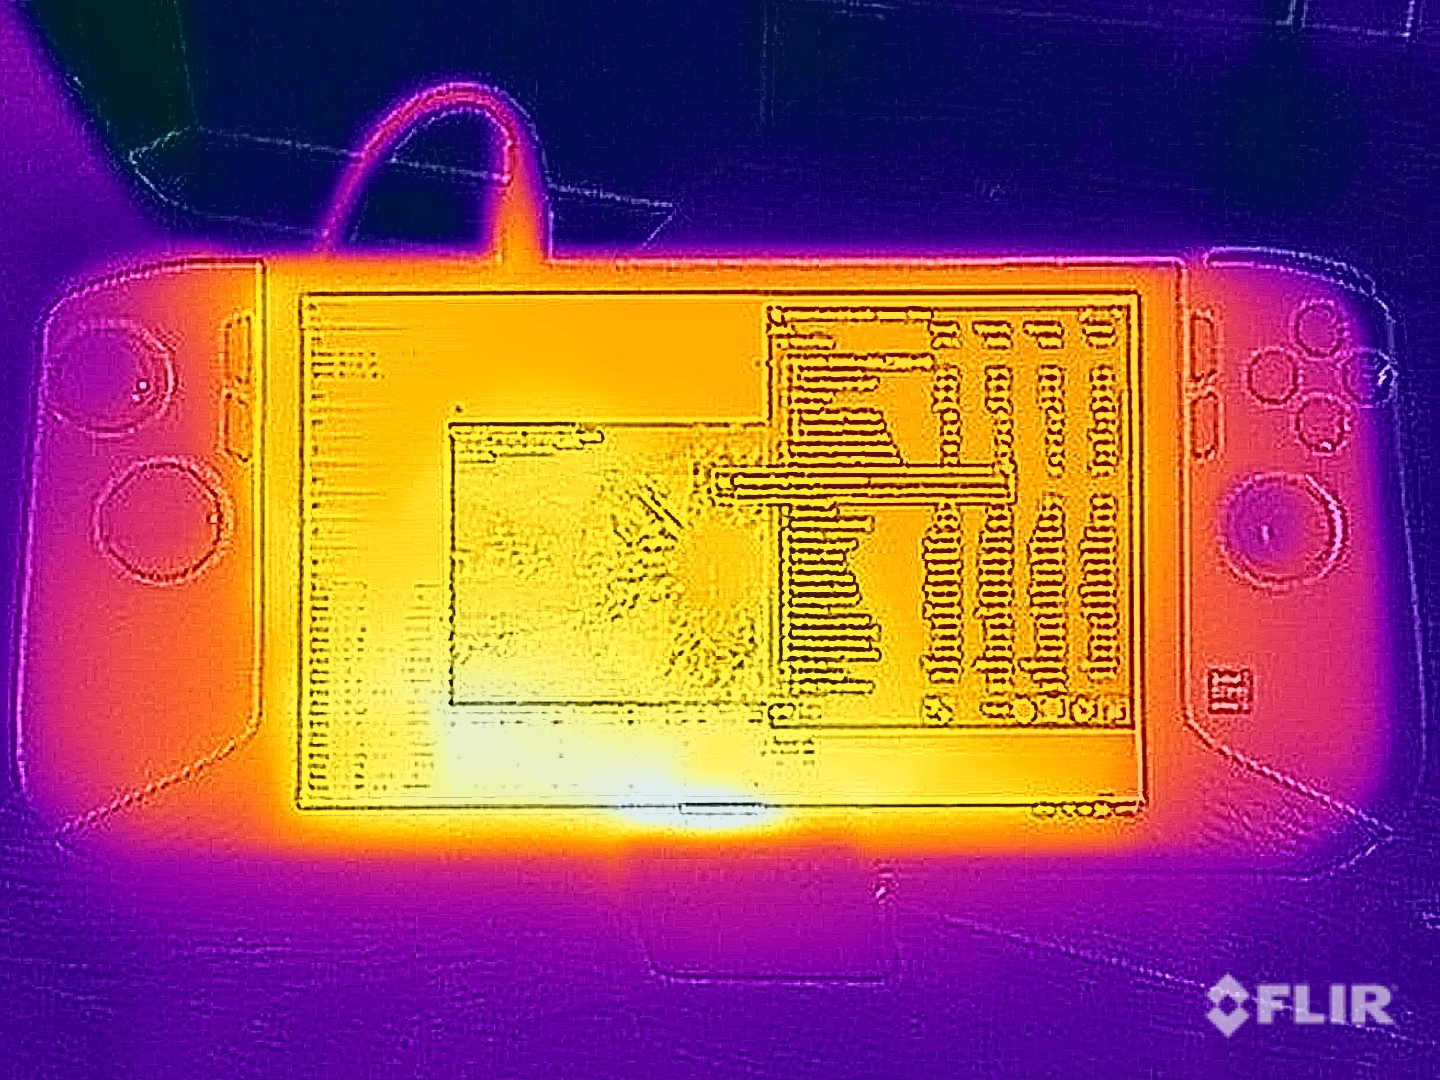
其表面温度总体很低,尤其是手持设备的手柄几乎不会发热。热空气从设备顶部排出。在压力测试期间,各 TDP 值保持不变。
(+) The maximum temperature on the upper side is 36.6 °C / 98 F, compared to the average of 38.4 °C / 101 F, ranging from 26.6 to 55 °C for the class Handheld / UMPC.
(+) The bottom heats up to a maximum of 34.8 °C / 95 F, compared to the average of 38 °C / 100 F
(+) In idle usage, the average temperature for the upper side is 26.6 °C / 80 F, compared to the device average of 31.6 °C / 89 F.
(±) 3: The average temperature for the upper side is 34.8 °C / 95 F, compared to the average of 31.6 °C / 89 F for the class Handheld / UMPC.
(+) The palmrests and touchpad are reaching skin temperature as a maximum (35.3 °C / 95.5 F) and are therefore not hot.
(-) The average temperature of the palmrest area of similar devices was 30.5 °C / 86.9 F (-4.8 °C / -8.6 F).
| MSI Claw 8 AI+ Intel Core Ultra 7 258V, Intel Arc Graphics 140V | Lenovo Legion Go S AMD Ryzen Z2 Go, AMD Radeon 680M | GPD Pocket 4 AMD Ryzen AI 9 HX 370, AMD Radeon 890M | Asus ROG Ally X AMD Ryzen Z1 Extreme, AMD Radeon 780M | MSI Claw Intel Core Ultra 7 155H, Intel Arc 8-Core iGPU | |
|---|---|---|---|---|---|
| Heat | -9% | 1% | -8% | -14% | |
| Maximum Upper Side * | 36.6 | 40 -9% | 33.8 8% | 42.7 -17% | 41.8 -14% |
| Maximum Bottom * | 34.8 | 35.5 -2% | 35.2 -1% | 39.7 -14% | 35.9 -3% |
| Idle Upper Side * | 27.5 | 32.5 -18% | 26.6 3% | 28 -2% | 31.6 -15% |
| Idle Bottom * | 27.2 | 29.2 -7% | 28.6 -5% | 27.2 -0% | 33.6 -24% |
* ... smaller is better
发言人
该设备的两个立体声扬声器非常出色,与旧款微星爪机相比再次得到了改进。
MSI Claw 8 AI+ audio analysis
(+) | speakers can play relatively loud (85 dB)
Bass 100 - 315 Hz
(±) | reduced bass - on average 14.5% lower than median
(±) | linearity of bass is average (8.8% delta to prev. frequency)
Mids 400 - 2000 Hz
(+) | balanced mids - only 2.1% away from median
(+) | mids are linear (2.1% delta to prev. frequency)
Highs 2 - 16 kHz
(+) | balanced highs - only 2.4% away from median
(+) | highs are linear (4.2% delta to prev. frequency)
Overall 100 - 16.000 Hz
(+) | overall sound is linear (11.9% difference to median)
Compared to same class
» 0% of all tested devices in this class were better, 6% similar, 94% worse
» The best had a delta of 12%, average was 18%, worst was 23%
Compared to all devices tested
» 8% of all tested devices were better, 2% similar, 90% worse
» The best had a delta of 4%, average was 24%, worst was 134%
Lenovo Legion Go S audio analysis
(±) | speaker loudness is average but good (80.4 dB)
Bass 100 - 315 Hz
(-) | nearly no bass - on average 18% lower than median
(±) | linearity of bass is average (7.4% delta to prev. frequency)
Mids 400 - 2000 Hz
(±) | higher mids - on average 7.5% higher than median
(±) | linearity of mids is average (9% delta to prev. frequency)
Highs 2 - 16 kHz
(+) | balanced highs - only 3.9% away from median
(±) | linearity of highs is average (10% delta to prev. frequency)
Overall 100 - 16.000 Hz
(±) | linearity of overall sound is average (20% difference to median)
Compared to same class
» 61% of all tested devices in this class were better, 17% similar, 22% worse
» The best had a delta of 12%, average was 18%, worst was 23%
Compared to all devices tested
» 49% of all tested devices were better, 8% similar, 43% worse
» The best had a delta of 4%, average was 24%, worst was 134%
GPD Pocket 4 audio analysis
(+) | speakers can play relatively loud (91.9 dB)
Bass 100 - 315 Hz
(-) | nearly no bass - on average 21.5% lower than median
(+) | bass is linear (5.2% delta to prev. frequency)
Mids 400 - 2000 Hz
(+) | balanced mids - only 4.9% away from median
(+) | mids are linear (4.8% delta to prev. frequency)
Highs 2 - 16 kHz
(±) | higher highs - on average 6.1% higher than median
(±) | linearity of highs is average (8.1% delta to prev. frequency)
Overall 100 - 16.000 Hz
(±) | linearity of overall sound is average (17.6% difference to median)
Compared to same class
» 33% of all tested devices in this class were better, 22% similar, 44% worse
» The best had a delta of 12%, average was 18%, worst was 23%
Compared to all devices tested
» 32% of all tested devices were better, 8% similar, 60% worse
» The best had a delta of 4%, average was 24%, worst was 134%
Asus ROG Ally X audio analysis
(+) | speakers can play relatively loud (88.2 dB)
Bass 100 - 315 Hz
(-) | nearly no bass - on average 26% lower than median
(±) | linearity of bass is average (7.7% delta to prev. frequency)
Mids 400 - 2000 Hz
(+) | balanced mids - only 3.9% away from median
(+) | mids are linear (3.6% delta to prev. frequency)
Highs 2 - 16 kHz
(+) | balanced highs - only 1.1% away from median
(+) | highs are linear (1.8% delta to prev. frequency)
Overall 100 - 16.000 Hz
(+) | overall sound is linear (14.7% difference to median)
Compared to same class
» 11% of all tested devices in this class were better, 17% similar, 72% worse
» The best had a delta of 12%, average was 18%, worst was 23%
Compared to all devices tested
» 17% of all tested devices were better, 4% similar, 79% worse
» The best had a delta of 4%, average was 24%, worst was 134%
MSI Claw audio analysis
(+) | speakers can play relatively loud (87.2 dB)
Bass 100 - 315 Hz
(-) | nearly no bass - on average 17.2% lower than median
(±) | linearity of bass is average (9.2% delta to prev. frequency)
Mids 400 - 2000 Hz
(+) | balanced mids - only 4.3% away from median
(+) | mids are linear (4.3% delta to prev. frequency)
Highs 2 - 16 kHz
(+) | balanced highs - only 3.7% away from median
(+) | highs are linear (4.5% delta to prev. frequency)
Overall 100 - 16.000 Hz
(+) | overall sound is linear (14.9% difference to median)
Compared to same class
» 17% of all tested devices in this class were better, 11% similar, 72% worse
» The best had a delta of 12%, average was 18%, worst was 23%
Compared to all devices tested
» 18% of all tested devices were better, 4% similar, 78% worse
» The best had a delta of 4%, average was 24%, worst was 134%
Valve Steam Deck 1 TB OLED audio analysis
(+) | speakers can play relatively loud (82.7 dB)
Bass 100 - 315 Hz
(-) | nearly no bass - on average 22% lower than median
(±) | linearity of bass is average (14.7% delta to prev. frequency)
Mids 400 - 2000 Hz
(+) | balanced mids - only 1% away from median
(+) | mids are linear (2.1% delta to prev. frequency)
Highs 2 - 16 kHz
(+) | balanced highs - only 1.9% away from median
(+) | highs are linear (6.1% delta to prev. frequency)
Overall 100 - 16.000 Hz
(+) | overall sound is linear (12.9% difference to median)
Compared to same class
» 6% of all tested devices in this class were better, 6% similar, 89% worse
» The best had a delta of 12%, average was 18%, worst was 23%
Compared to all devices tested
» 11% of all tested devices were better, 3% similar, 87% worse
» The best had a delta of 4%, average was 24%, worst was 134%
ONEXPLAYER 2 Pro AR18 audio analysis
(+) | speakers can play relatively loud (85.8 dB)
Bass 100 - 315 Hz
(±) | reduced bass - on average 13.7% lower than median
(±) | linearity of bass is average (8.7% delta to prev. frequency)
Mids 400 - 2000 Hz
(±) | higher mids - on average 7.1% higher than median
(+) | mids are linear (4.9% delta to prev. frequency)
Highs 2 - 16 kHz
(+) | balanced highs - only 4.6% away from median
(+) | highs are linear (6.6% delta to prev. frequency)
Overall 100 - 16.000 Hz
(+) | overall sound is linear (14.4% difference to median)
Compared to same class
» 11% of all tested devices in this class were better, 11% similar, 78% worse
» The best had a delta of 12%, average was 18%, worst was 23%
Compared to all devices tested
» 16% of all tested devices were better, 4% similar, 80% worse
» The best had a delta of 4%, average was 24%, worst was 134%
耗电量
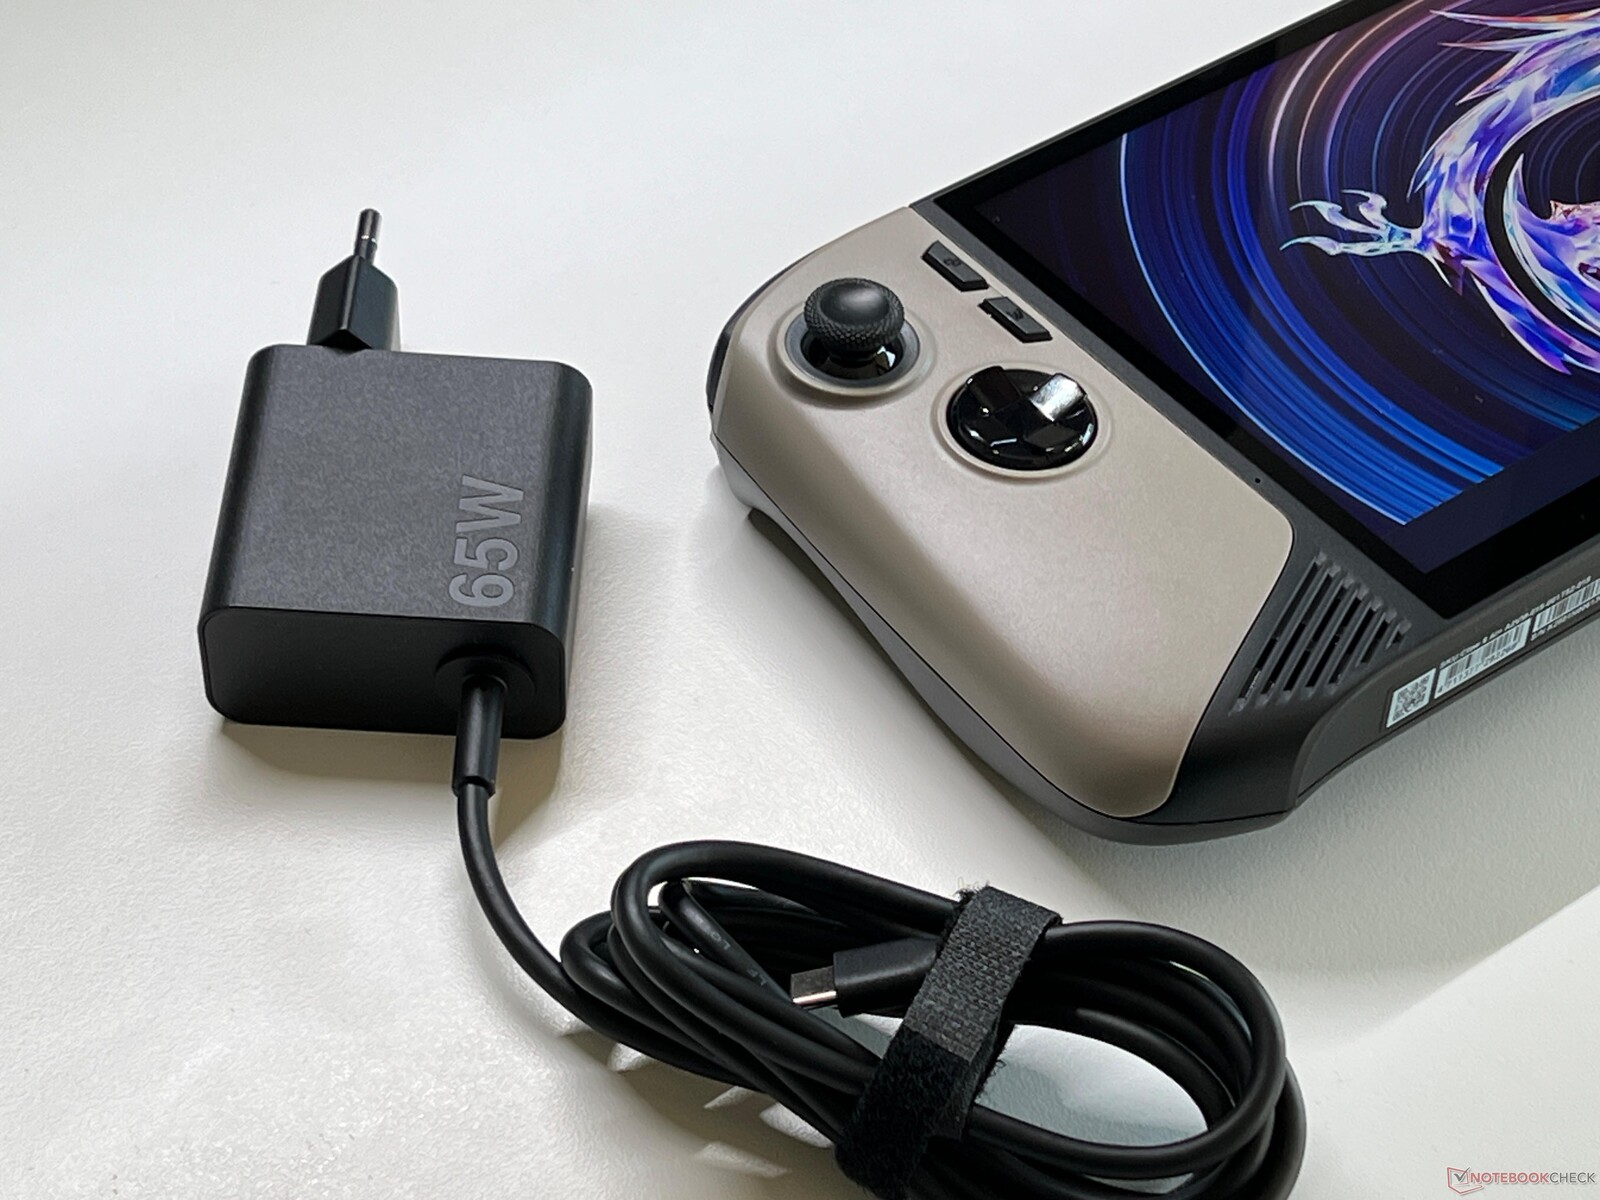
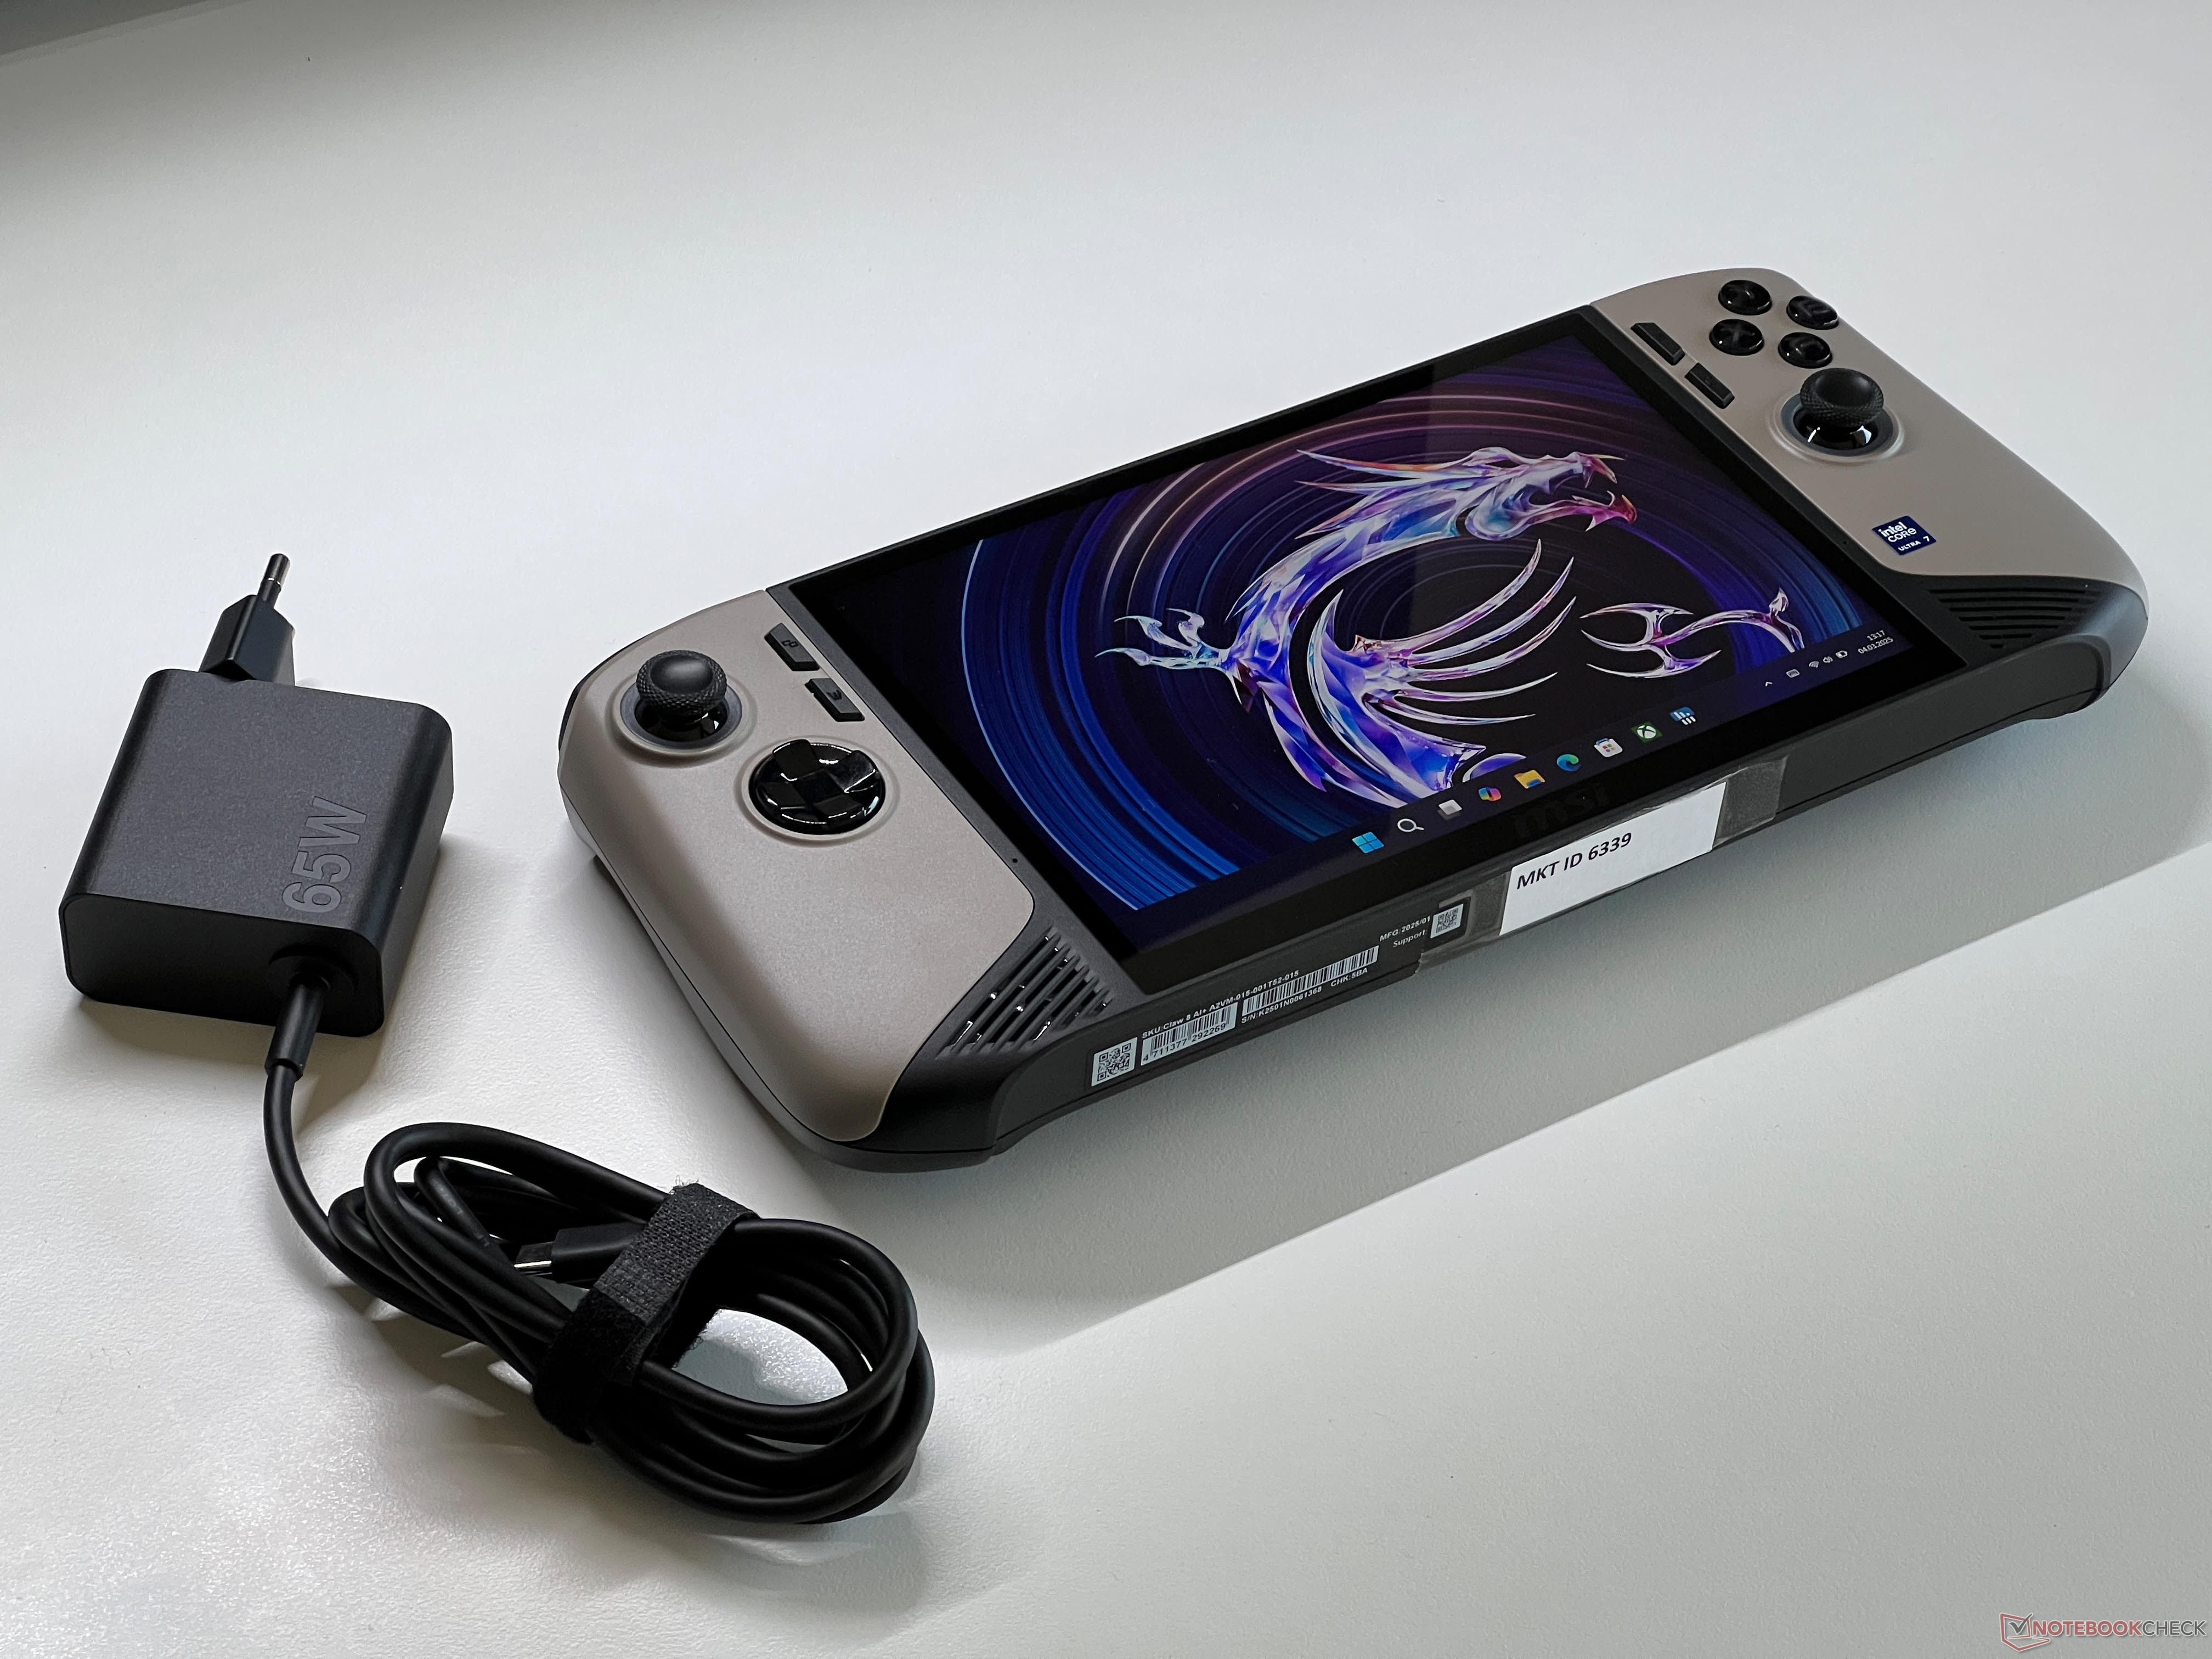
尽管 Claw 8 的显示屏更大,但它在空闲时比前一代产品和其他竞争对手更加节俭。我们在压力测试中测得的最大耗电量为 59 瓦,约一分钟后耗电量降至 50 瓦。游戏时,我们测得的功耗约为 46 瓦。因此,随附的 65 瓦插入式电源(重 192 克)大小适中。
| Off / Standby | |
| Idle | |
| Load |
|
Key:
min: | |
| MSI Claw 8 AI+ Core Ultra 7 258V, Arc 140V, Kioxia BG6 KBG60ZNS1T02, IPS, 1920x1200, 8" | Lenovo Legion Go S Z2 Go, Radeon 680M, SK hynix PVC10 HFS512GEM4X182N, IPS-Grade, 1920x1200, 8" | GPD Pocket 4 Ryzen AI 9 HX 370, Radeon 890M, , IPS, 2560x1600, 8.8" | Asus ROG Ally X Z1 Extreme, Radeon 780M, WD PC SN560 SDDPNQE-1T00, IPS, 1920x1080, 7" | MSI Claw Ultra 7 155H, Arc 8-Core, Kioxia BG5 KBG50ZNS1T02, IPS, 1920x1080, 7" | Valve Steam Deck 1 TB OLED Steam Deck OLED APU, Radeon Radeon Steam Deck 8CU, Phison ESMP001TKB5C3, OLED, 1280x800, 7.4" | ONEXPLAYER 2 Pro AR18 R7 7840U, Radeon 780M, , IPS, 2560x1600, 8.4" | |
|---|---|---|---|---|---|---|---|
| Power Consumption | -41% | -28% | -19% | -60% | -1% | -42% | |
| Idle Minimum * | 3.2 | 5.3 -66% | 6 -88% | 4.3 -34% | 7.8 -144% | 4.5 -41% | 6.66 -108% |
| Idle Average * | 6.3 | 9.4 -49% | 8.8 -40% | 6.7 -6% | 11.5 -83% | 7.21 -14% | 7.11 -13% |
| Idle Maximum * | 6.6 | 15.5 -135% | 9.2 -39% | 7.5 -14% | 11.8 -79% | 9.66 -46% | 11.7 -77% |
| Load Average * | 40.6 | 53.1 -31% | 48.2 -19% | 53.1 -31% | 22.86 44% | 46.708 -15% | |
| Cyberpunk 2077 ultra * | 47 | 47.6 -1% | 50.1 -7% | 61.3 -30% | 54.4 -16% | ||
| Cyberpunk 2077 ultra external monitor * | 46.7 | 45.4 3% | 45.7 2% | 53.9 -15% | |||
| Load Maximum * | 59.3 | 57.8 3% | 56.4 5% | 66.8 -13% | 64.6 -9% | 27.8 53% | 56.7 4% |
| Witcher 3 ultra * | 53.1 |
* ... smaller is better
Power consumption Cyberpunk / stress test
Power consumption with external monitor
运行时间
微星将手持设备的电池容量提高到了 80 Wh,再加上其较低的消耗值,因此运行时间非常出色。游戏时,这在很大程度上取决于所选的能耗模式:在我们的测试中,在最快模式下,《赛博朋克》运行了 01:45 小时(约 25fps),而在人工智能引擎模式下,仅运行了不到 3.5 小时(约 19fps)。
在 150 cd/m²(测试设备最大亮度的 29%)条件下进行的普通 WLAN 测试中,我们测得的运行时间接近 24 小时,即使在全亮度条件下,运行时间也超过了 16.5 小时(均为 60 Hz),这都是非常长的运行时间。
| MSI Claw 8 AI+ Core Ultra 7 258V, Arc 140V, 80 Wh | Lenovo Legion Go S Z2 Go, Radeon 680M, 55.5 Wh | GPD Pocket 4 Ryzen AI 9 HX 370, Radeon 890M, 45 Wh | Asus ROG Ally X Z1 Extreme, Radeon 780M, 80 Wh | MSI Claw Ultra 7 155H, Arc 8-Core, 53 Wh | Valve Steam Deck 1 TB OLED Steam Deck OLED APU, Radeon Radeon Steam Deck 8CU, 50 Wh | ONEXPLAYER 2 Pro AR18 R7 7840U, Radeon 780M, 65 Wh | Average of class Handheld / UMPC | |
|---|---|---|---|---|---|---|---|---|
| Battery Runtime | -33% | -74% | -8% | -48% | -60% | -54% | -59% | |
| WiFi v1.3 | 1413 | 518 -63% | 373 -74% | 949 -33% | 466 -67% | 559 -60% | 648 -54% | 575 ? -59% |
| Cyberpunk 2077 ultra 150cd | 105 | 102 -3% | 124 18% | 76 -28% | ||||
| Gaming | 252 | 129.2 ? | ||||||
| Witcher 3 ultra | 72 | 86.5 ? |
Notebookcheck 总评分
MSI Claw 8 AI+
- 03/06/2025 v8
Andreas Osthoff
 Total Sustainability Score:
 Transparency
The selection of devices to be reviewed is made by our editorial team. The test sample was provided to the author as a loan by the manufacturer or retailer for the purpose of this review. The lender had no influence on this review, nor did the manufacturer receive a copy of this review before publication. There was no obligation to publish this review. We never accept compensation or payment in return for our reviews. As an independent media company, Notebookcheck is not subjected to the authority of manufacturers, retailers or publishers.
This is how Notebookcheck is testing
Every year, Notebookcheck independently reviews hundreds of laptops and smartphones using standardized procedures to ensure that all results are comparable. We have continuously developed our test methods for around 20 years and set industry standards in the process. In our test labs, high-quality measuring equipment is utilized by experienced technicians and editors. These tests involve a multi-stage validation process. Our complex rating system is based on hundreds of well-founded measurements and benchmarks, which maintains objectivity. Further information on our test methods can be found here.

