微星Claw评测--搭载英特尔酷睿Ultra处理器的游戏掌上电脑令人失望
游戏掌上电脑目前风头正劲,各大厂商都想加入这一行列。微星也不例外,尽管它推出新款 Claw 的时间较晚,但与大多数采用 AMD 处理器的竞争对手相比,微星选择了英特尔酷睿 Ultra 处理器。它还配备了 7 英寸 IPS 显示屏、霍尔效应操纵杆和触发器。
微星目前有两种型号可供选择:Claw A1M-036 配备了 Core Ultra 5 135H、16 GB 内存和 512 GB 固态硬盘,而 Claw A1M-059 则配备了更强大的 Core Ultra 7 155H16 GB 内存和 1 TB 固态硬盘,售价 899 美元。
潜在的竞争对手比较
Rating | Date | Model | Weight | Height | Size | Resolution | Price |
|---|---|---|---|---|---|---|---|
| 77.4 % | 06 / 2024 | MSI Claw Ultra 7 155H, Arc 8-Core | 672 g | 33 mm | 7.00" | 1920x1080 | |
| 88.9 % v7 (old) | 02 / 2024 | Valve Steam Deck 1 TB OLED Steam Deck OLED APU, Radeon Radeon Steam Deck 8CU | 640 g | 49 mm | 7.40" | 1280x800 | |
| 66.3 % | 01 / 2024 | Lenovo Legion Go Z1 Extreme, Radeon 780M | 845 g | 41 mm | 8.80" | 2560x1600 | |
| 87.5 % v7 (old) | 05 / 2023 | Asus ROG Ally Z1 Extreme Z1 Extreme, Radeon 780M | 611 g | 21.22 mm | 7.00" | 1920x1080 | |
| 84.9 % v7 (old) | 01 / 2024 | ONEXPLAYER 2 Pro AR18 R7 7840U, Radeon 780M | 876 g | 43 mm | 8.40" | 2560x1600 | |
| 85.2 % v7 (old) | 01 / 2024 | Ayaneo Kun R7 7840U, Radeon 780M | 942 g | 22 mm | 8.40" | 2560x1600 |
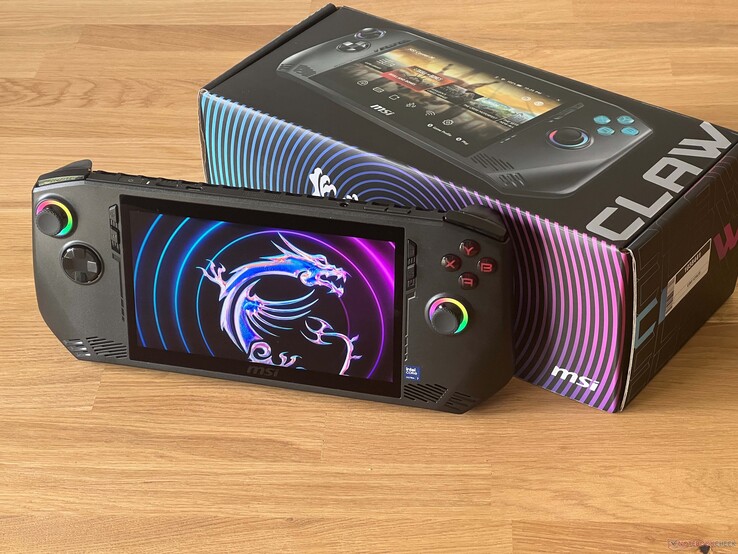
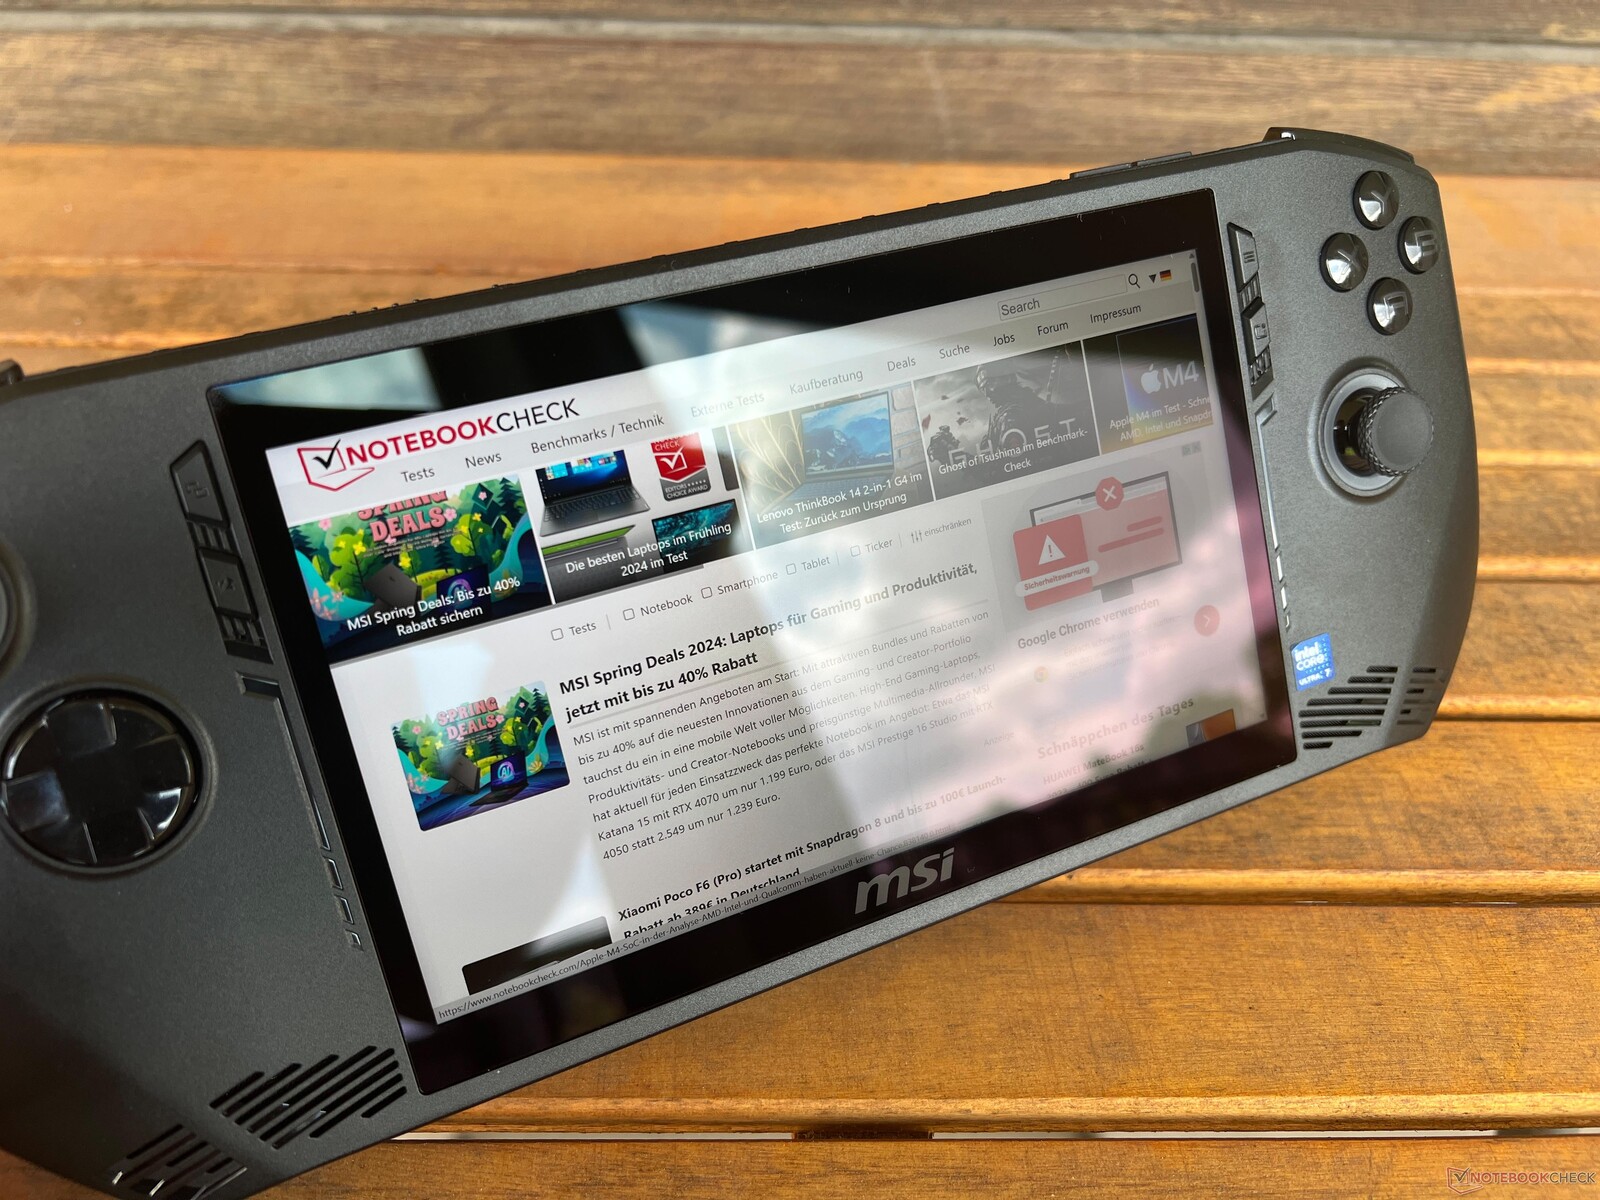
外壳 - 带有发光操纵杆和按钮的爪子
微星魔爪是一款典型的游戏掌上电脑,就像 华硕的 ROG Ally相比 联想Legion Go相比,它没有可拆卸控制器。微星 Claw 采用黑色塑料外壳,表面光滑,只有背面有许多风扇网罩。总体来说,它的做工不错,但也会发出一些嘎吱嘎吱的声音。另一方面,指纹痕迹也不是大问题。操纵杆周围的两个环以及右侧的按键还可以发光。宽大的黑色边框有点恼人(尤其是屏幕顶部和底部),不过由于使用了额外的外壳材料,给人的印象还是不错的。

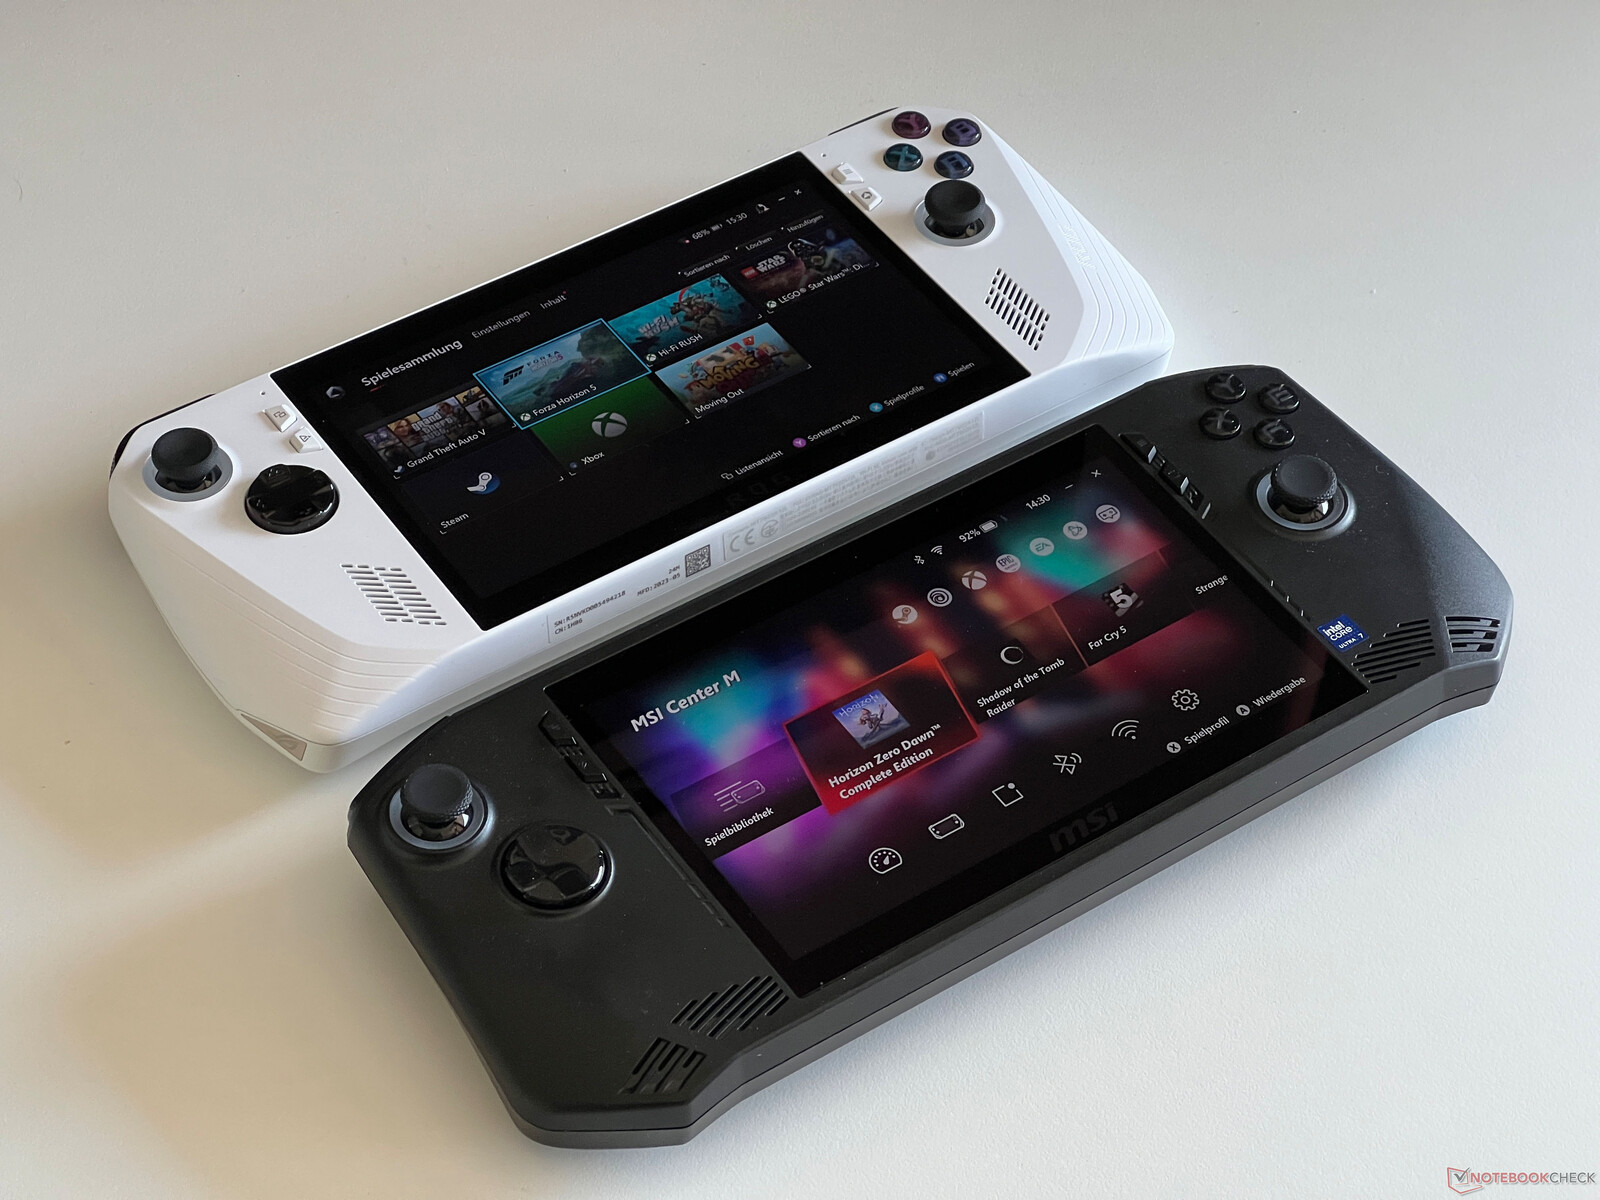
例如,ROG Ally 的边框一样宽,但反过来,它的机箱在显示屏上方和下方要窄一些。总而言之,MSI Claw 的尺寸更大一些,手柄的形状也不同。因此,它的人体工学设计更好,尤其是大手更容易握住设备,因此比 ROG Ally 稍微舒适一些。
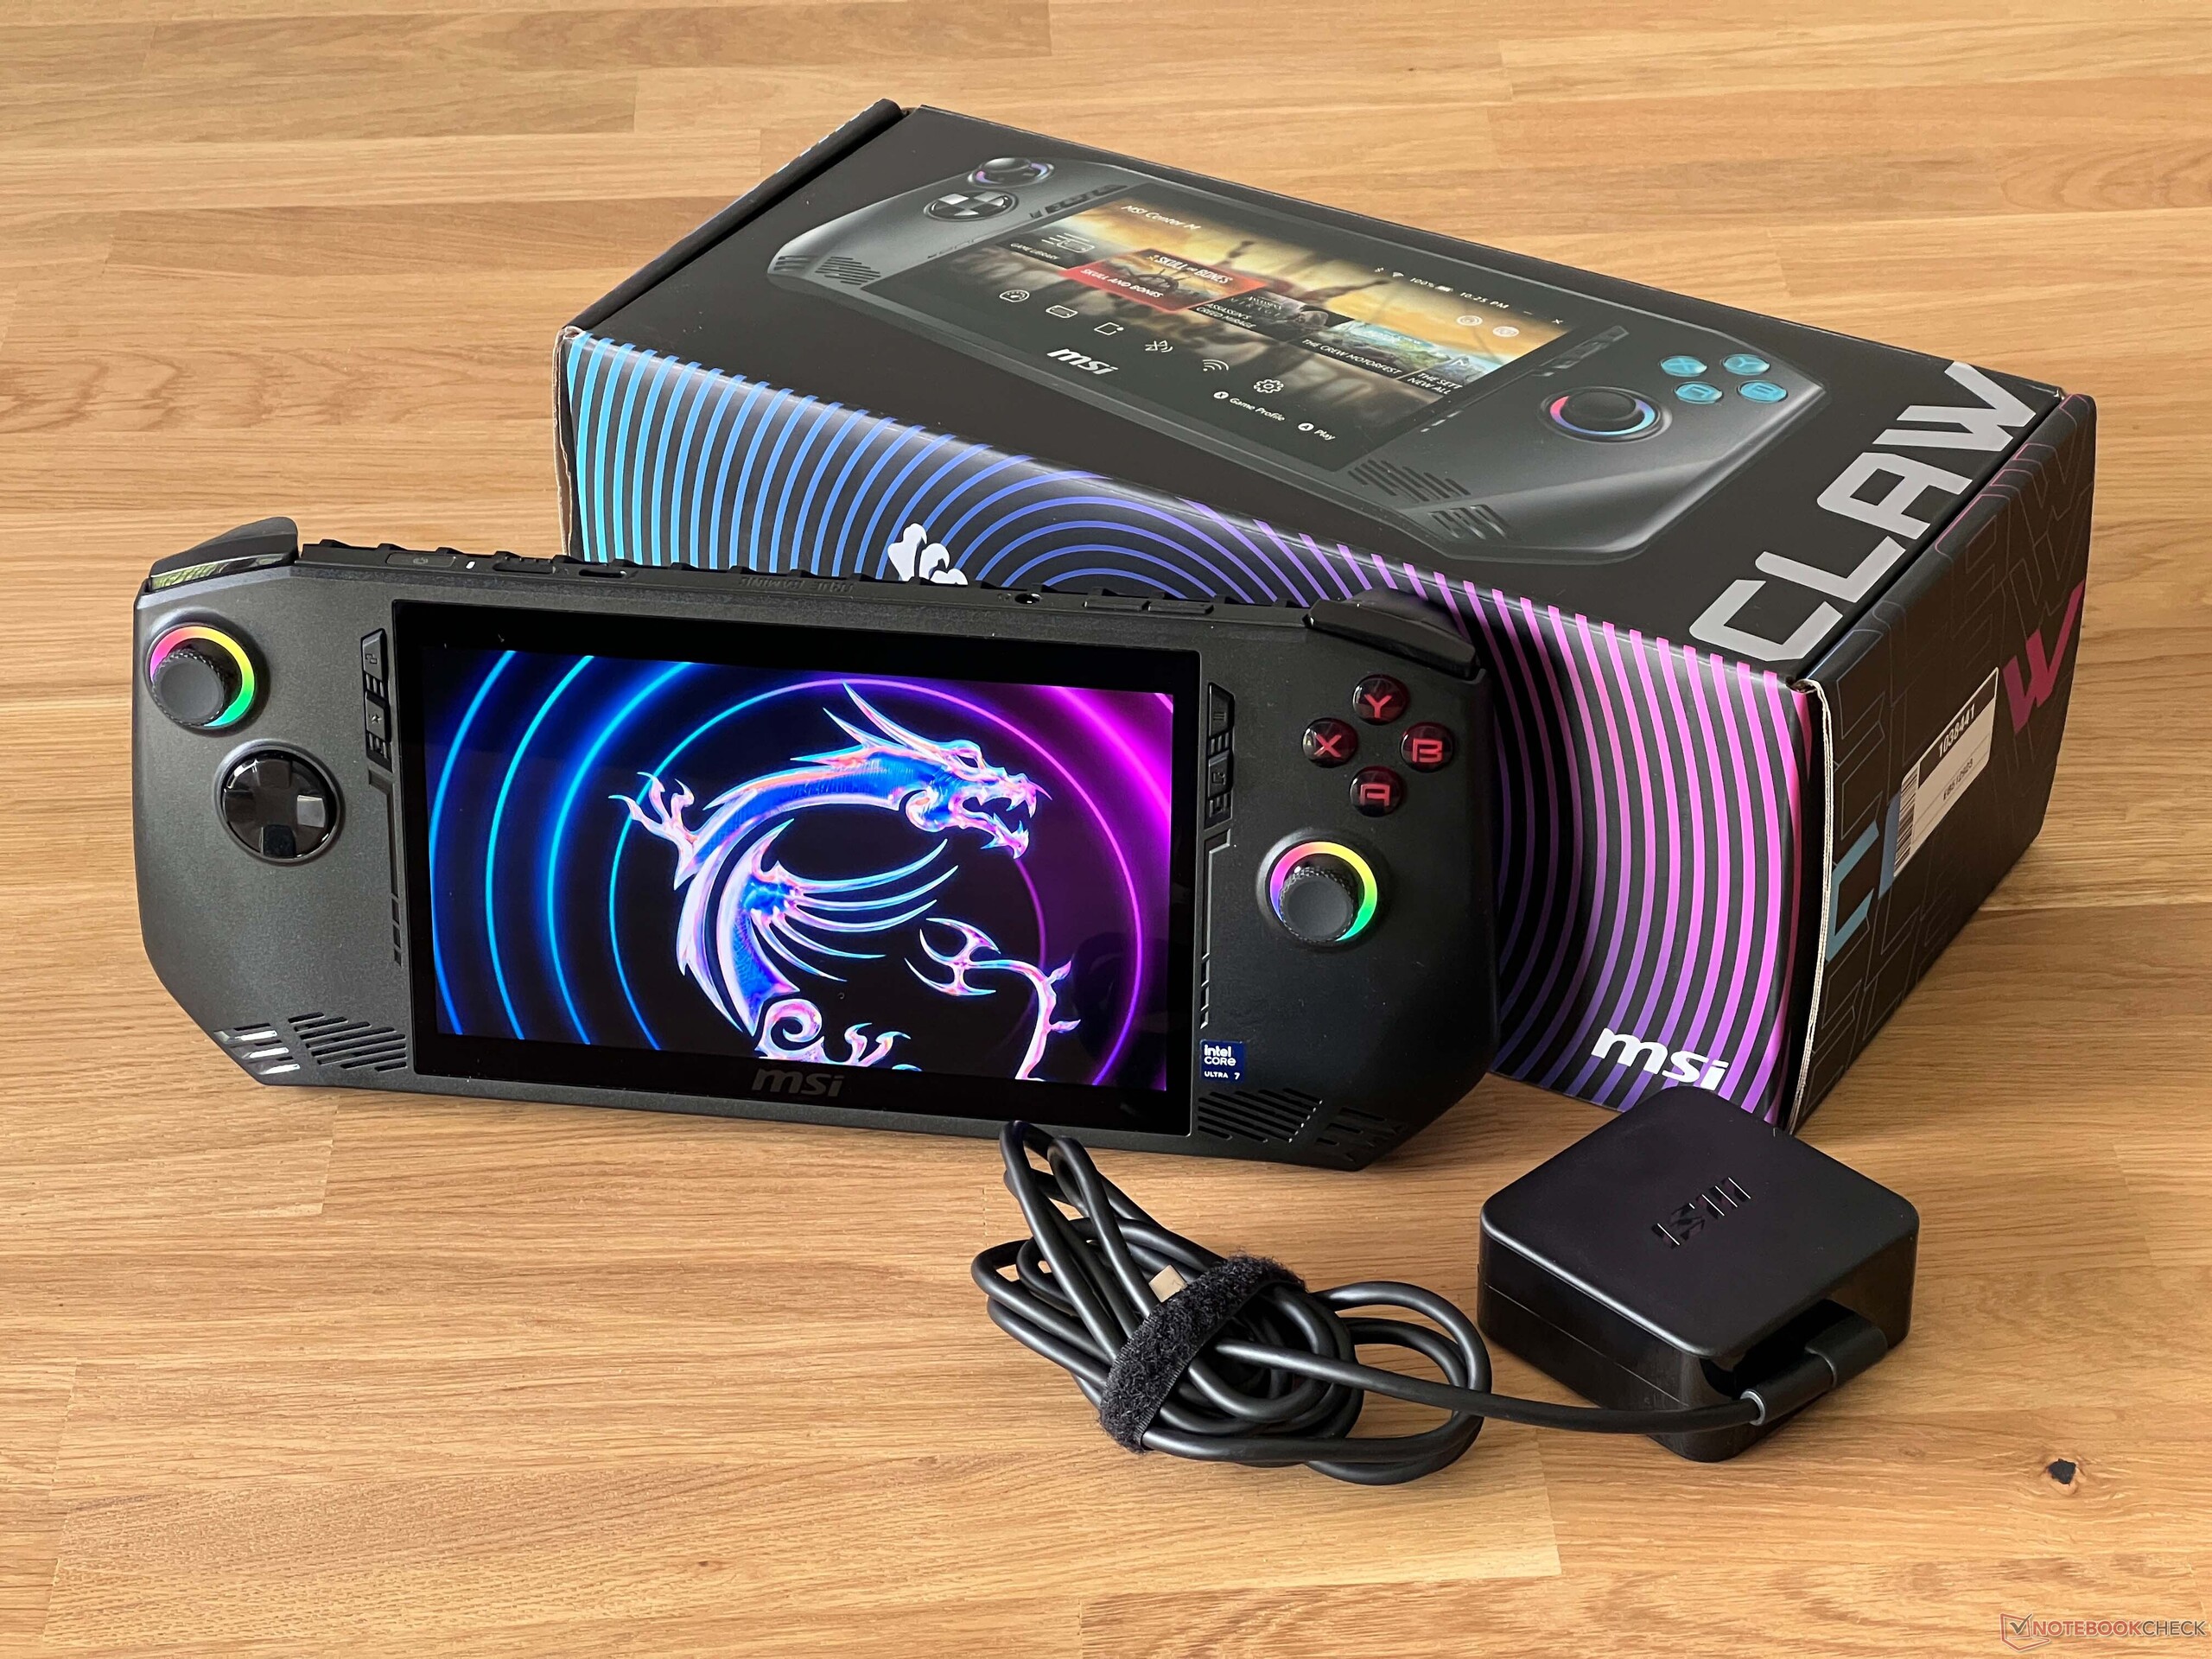
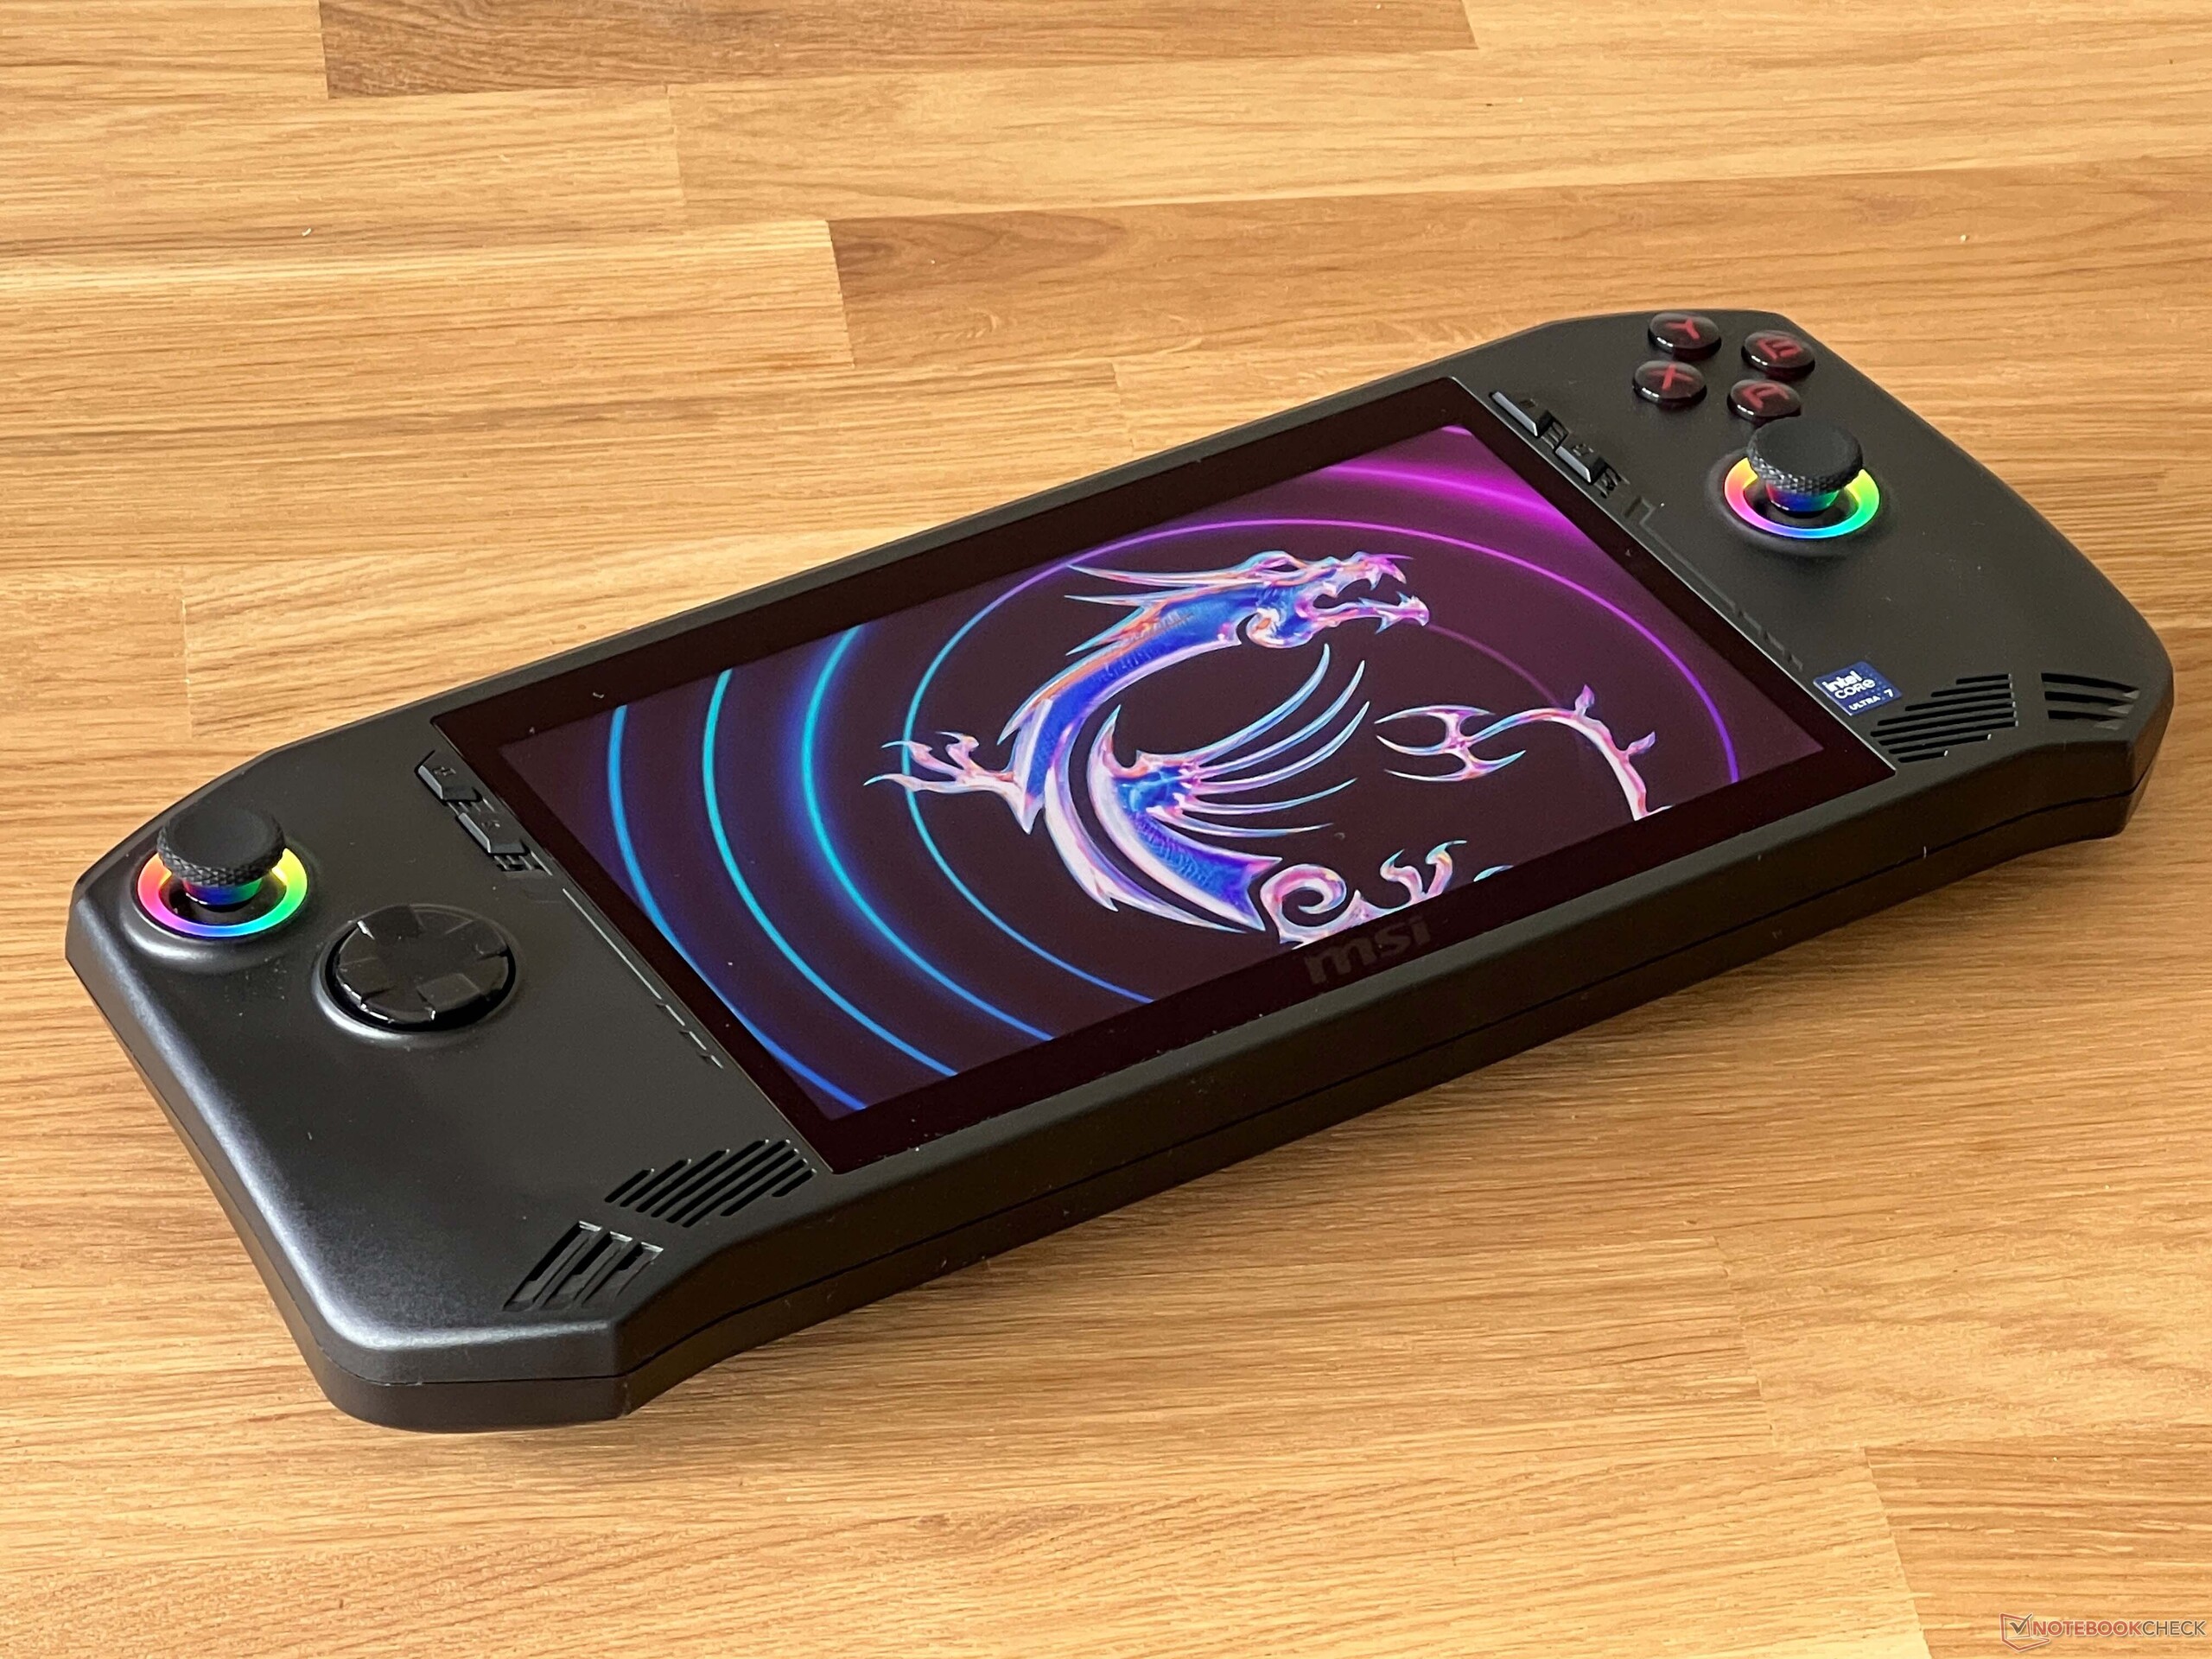

微星魔爪的重量为 672 克,是同类产品中较为轻巧的掌上电脑之一,即使长时间使用,重量也不会有任何问题。包括手柄在内,其外壳厚度约为 3.4 厘米。附带的 65 瓦电源重 341 克。
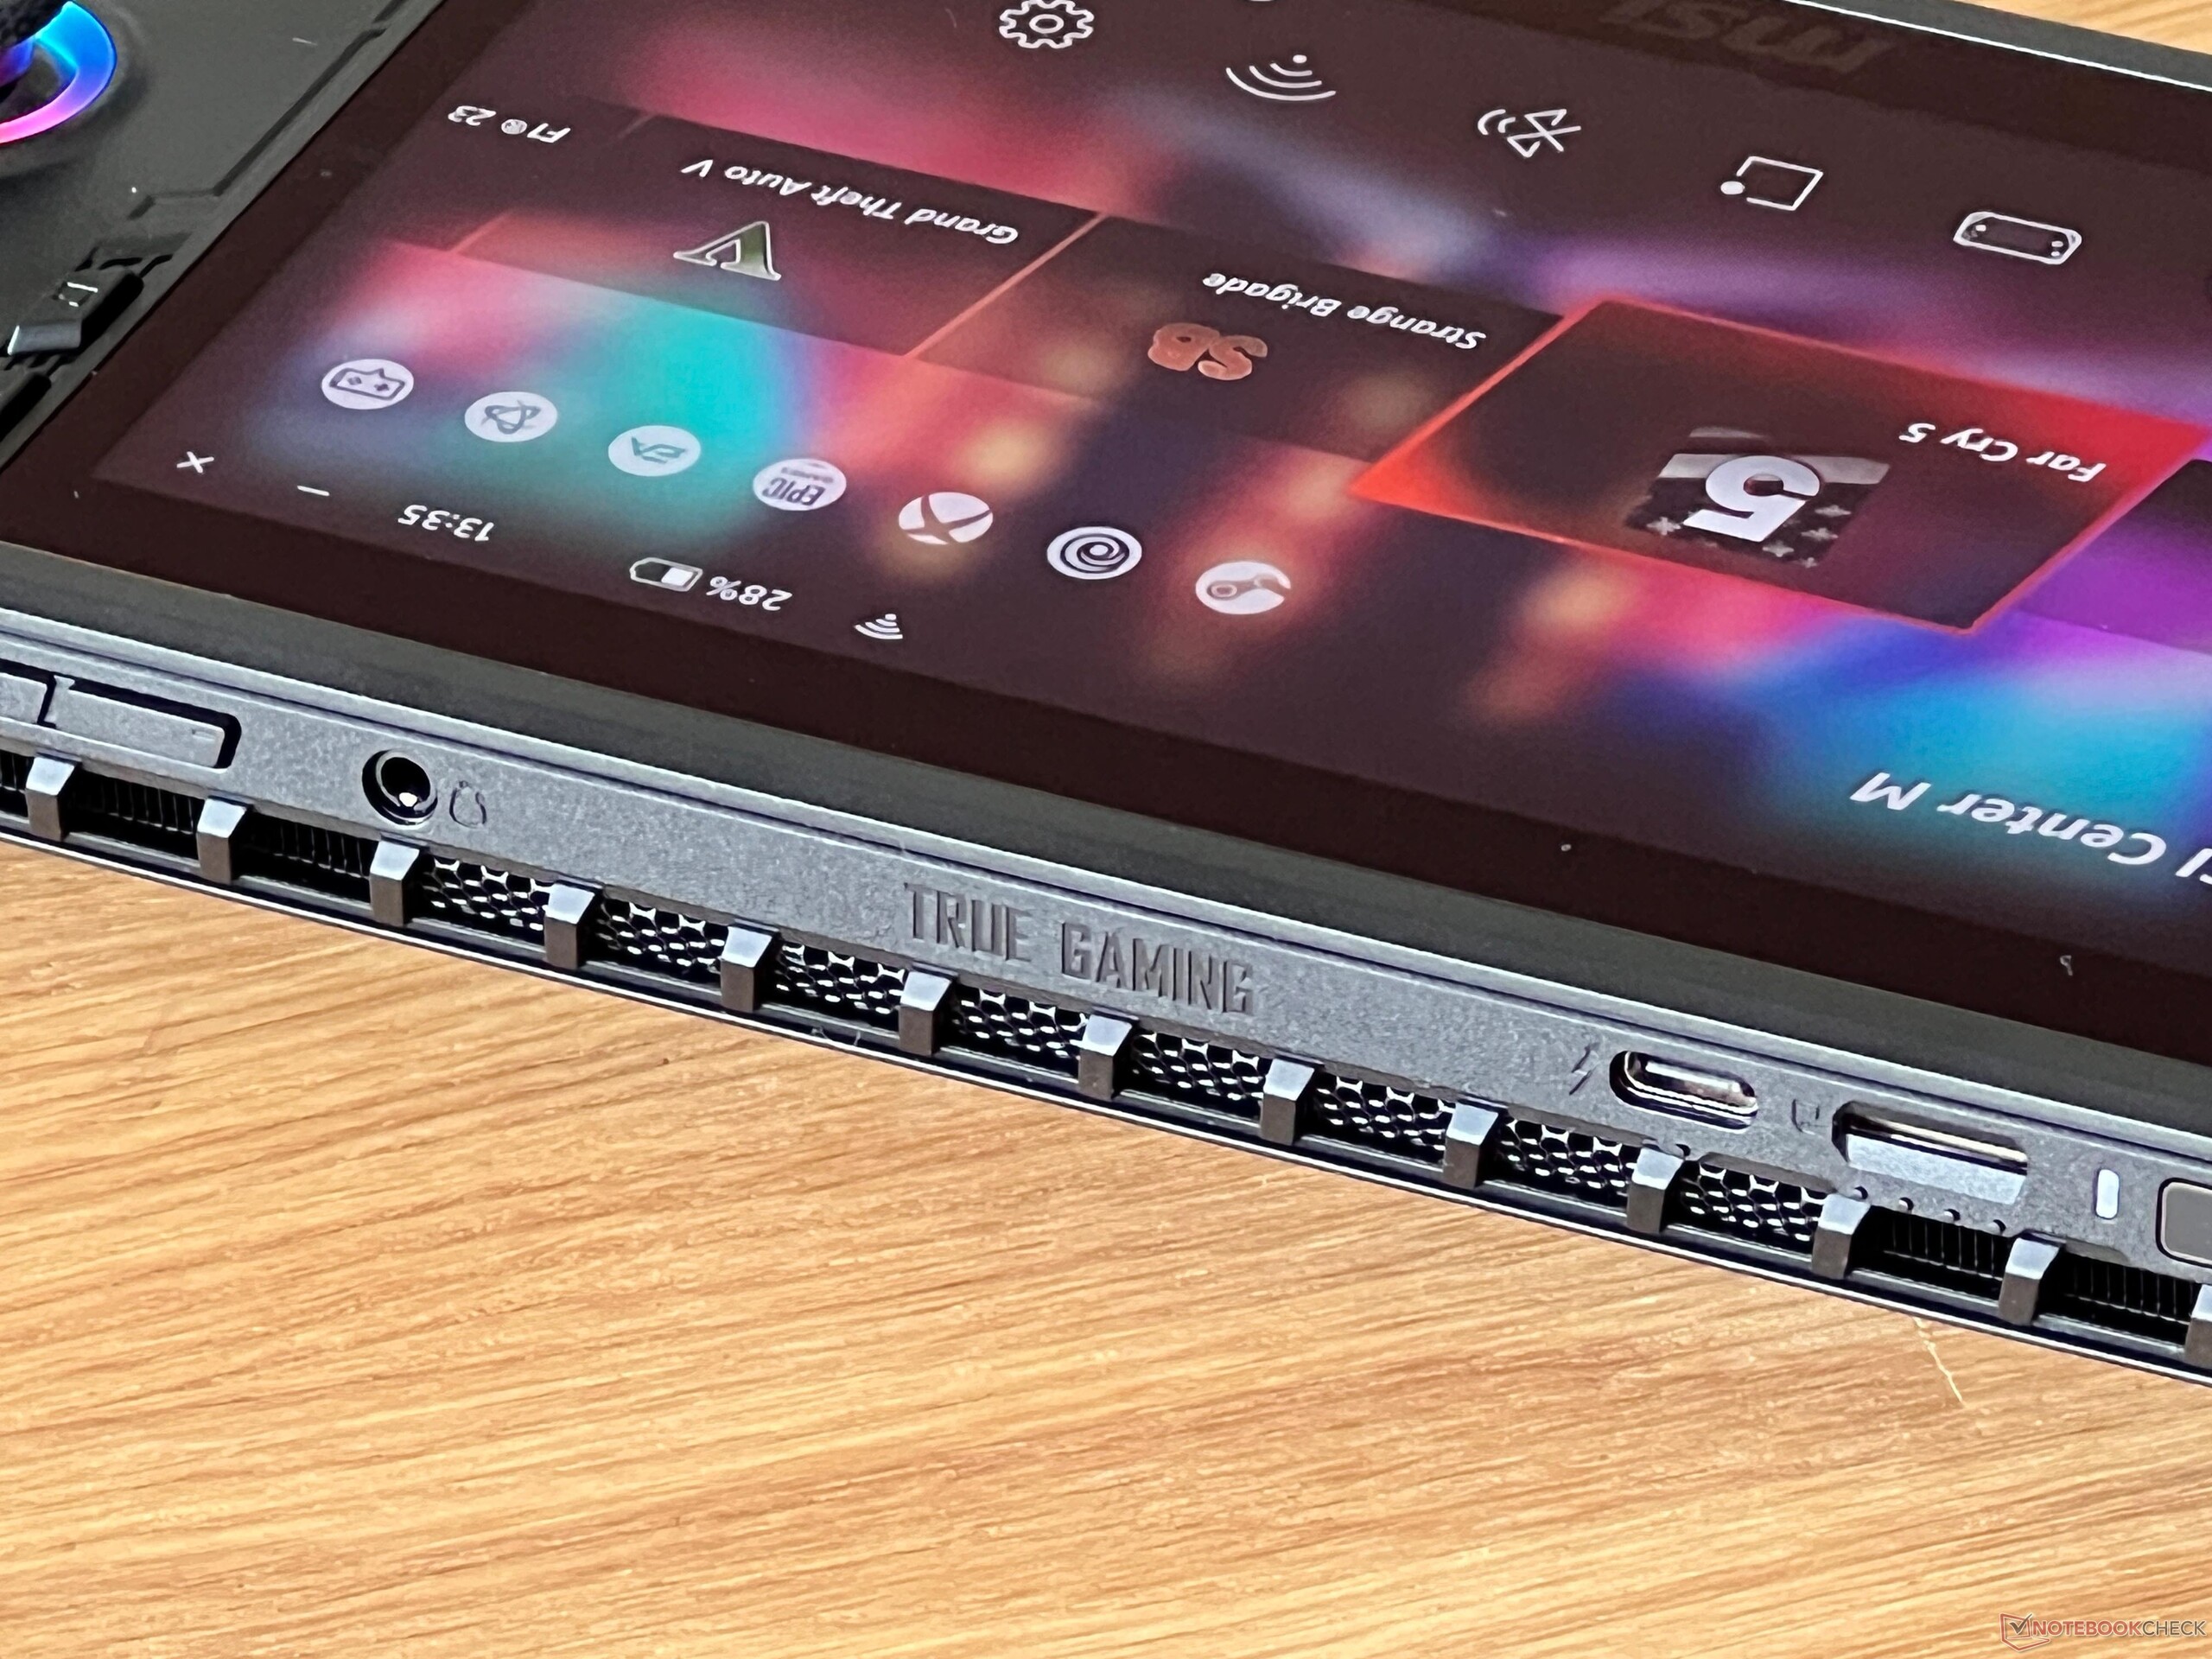
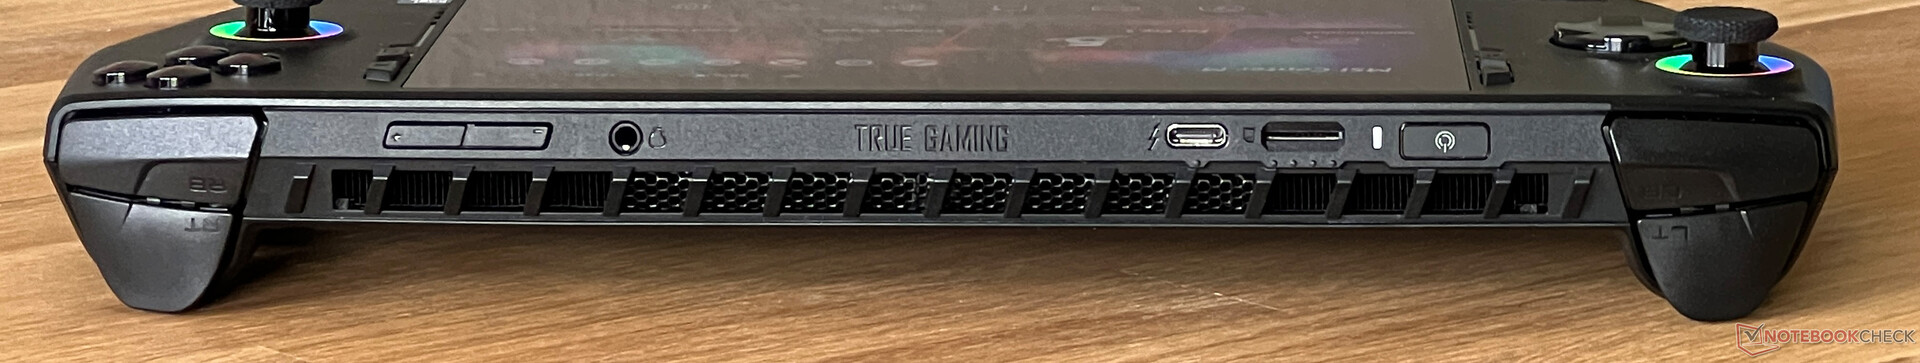
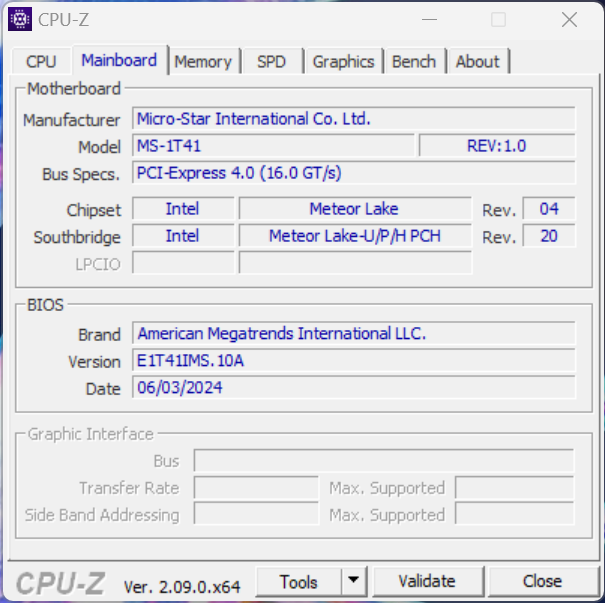
连接性 - 雷电 4
微星在设备顶部安装了一个 USB-C 端口,它也支持 Thunderbolt 4。我们希望看到第二个 USB 接口,以便快速连接外部固态硬盘或 U 盘等。当设备连接到主电源或与外接显示器一起供电时,这一点尤为重要。我们在进行部分测试时,将游戏机连接到了外接显示器上,只要屏幕支持通过 USB-C 供电,就能很好地工作。它没有网络摄像头,但电源按钮也可用作指纹扫描仪。
SD 读卡器
您可以通过在顶部的插槽中插入 microSD 卡来扩展设备的存储空间。在我们使用参考卡(Angelbird AV Pro V60)进行的测试中,读卡器的传输速率超过了 200 MB/s,即使在从卡中复制图像文件时,我们测得的传输速率仍在 120 MB/s 左右。
| SD Card Reader | |
| average JPG Copy Test (av. of 3 runs) | |
| ONEXPLAYER 2 Pro AR18 (Angelbird AV PRO microSD) | |
| Lenovo Legion Go | |
| Ayaneo Kun | |
| Asus ROG Ally Z1 Extreme (Angelbird AV Pro V60) | |
| Average of class Handheld / UMPC (20.9 - 201, n=12, last 2 years) | |
| MSI Claw (Angelbird AV Pro V60) | |
| Valve Steam Deck 1 TB OLED | |
| maximum AS SSD Seq Read Test (1GB) | |
| Asus ROG Ally Z1 Extreme (Angelbird AV Pro V60) | |
| ONEXPLAYER 2 Pro AR18 (Angelbird AV PRO microSD) | |
| MSI Claw (Angelbird AV Pro V60) | |
| Ayaneo Kun | |
| Average of class Handheld / UMPC (74.7 - 261, n=12, last 2 years) | |
| Lenovo Legion Go | |
交流
微星为 Claw 手持设备配备了 Killer BE1750x BE200NGW,这是一款现代的 Wi-Fi 7 模块,意味着该设备已为最新的 WLAN 网络做好了准备。我们在测试中还没有使用相应的 Wi-Fi 7 路由器,但在使用华硕的参考路由器时,它的性能仍然非常出色和稳定,尽管还无法与大型笔记本电脑相比。在日常使用中,我们注意到其信号质量没有任何问题,即使下载大型游戏也不费时间。
| Networking | |
| MSI Claw | |
| iperf3 transmit AXE11000 | |
| iperf3 receive AXE11000 | |
| Valve Steam Deck 1 TB OLED | |
| iperf3 transmit AXE11000 | |
| iperf3 receive AXE11000 | |
| iperf3 transmit AXE11000 6GHz | |
| iperf3 receive AXE11000 6GHz | |
| Lenovo Legion Go | |
| iperf3 transmit AXE11000 | |
| iperf3 receive AXE11000 | |
| iperf3 transmit AXE11000 6GHz | |
| iperf3 receive AXE11000 6GHz | |
| Asus ROG Ally Z1 Extreme | |
| iperf3 transmit AXE11000 | |
| iperf3 receive AXE11000 | |
| ONEXPLAYER 2 Pro AR18 | |
| iperf3 transmit AXE11000 | |
| iperf3 receive AXE11000 | |
| iperf3 transmit AXE11000 6GHz | |
| iperf3 receive AXE11000 6GHz | |
| Ayaneo Kun | |
| iperf3 transmit AXE11000 | |
| iperf3 receive AXE11000 | |
| iperf3 transmit AXE11000 6GHz | |
| iperf3 receive AXE11000 6GHz | |
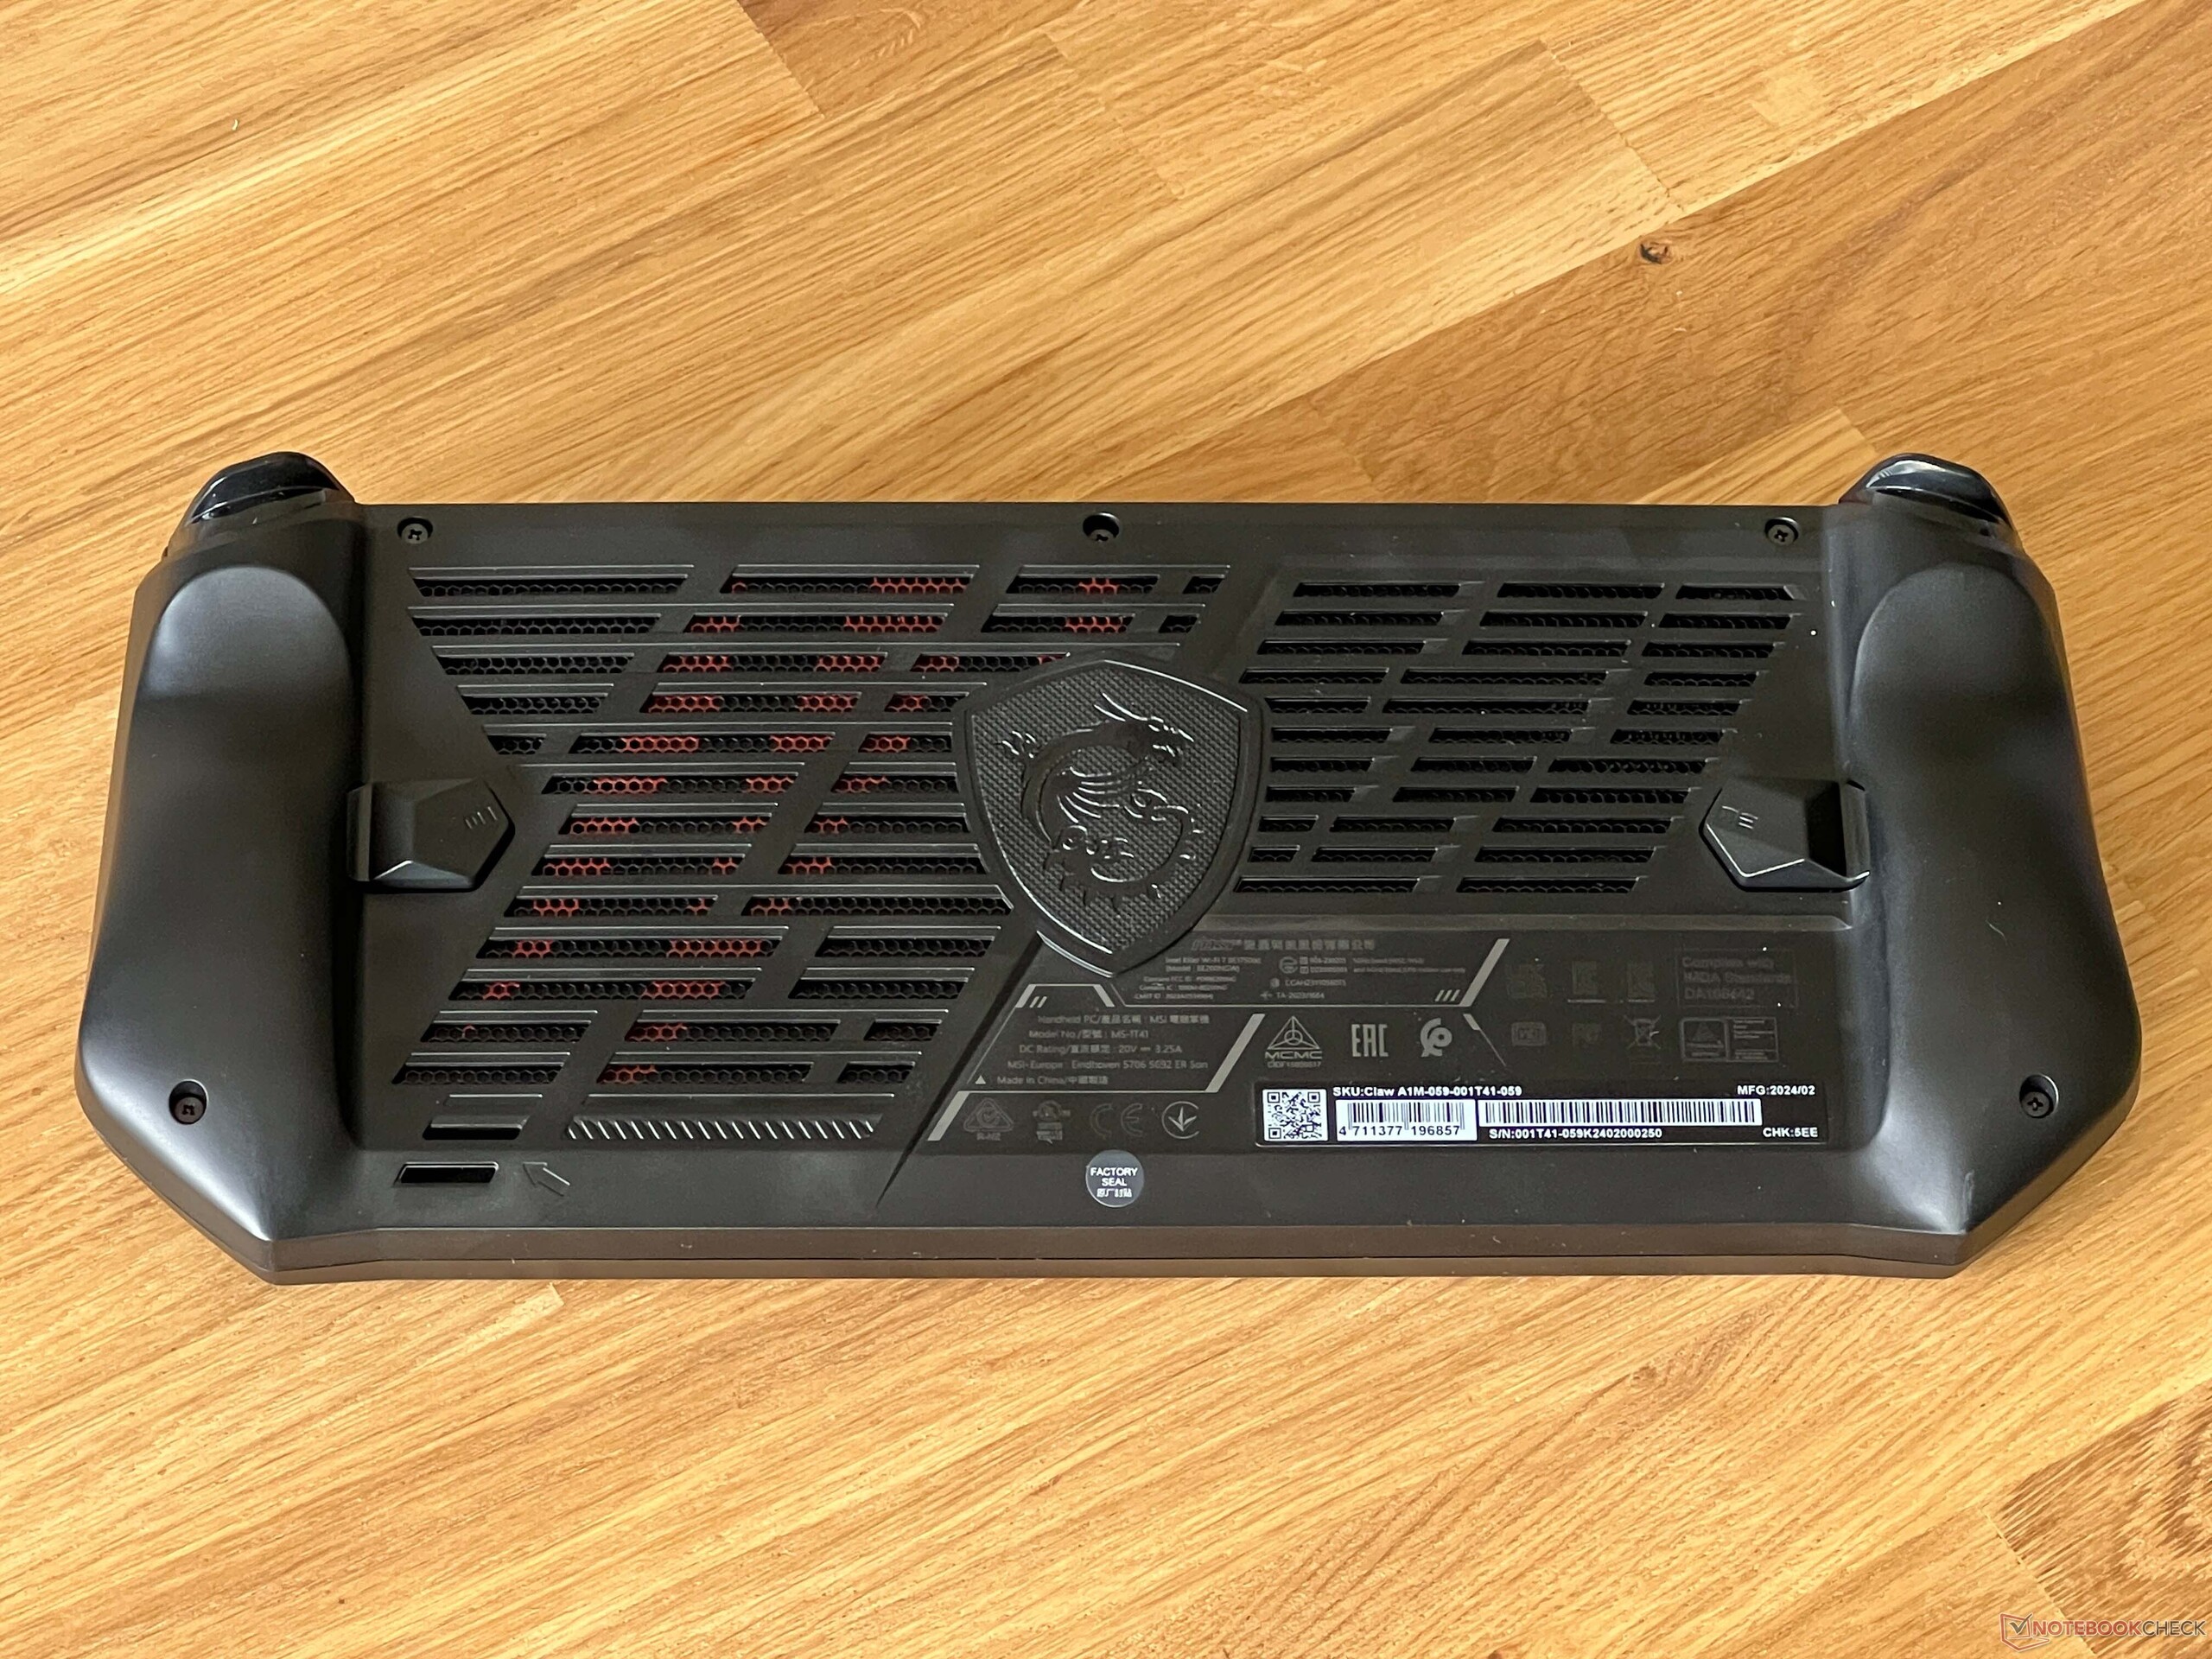
维护
背面由六颗十字螺丝固定。按照微星设备的惯例,有一颗螺丝被贴纸覆盖,上面标有 "工厂密封 "字样。正确使用并不会使手持设备的保修失效,但由于我们的测试设备是存储设备,我们不想损坏封条。为了更换小型 M.2 2230 固态硬盘,电池和整个散热装置都必须拆卸下来,因此在重新组装时必须重新涂上散热膏。
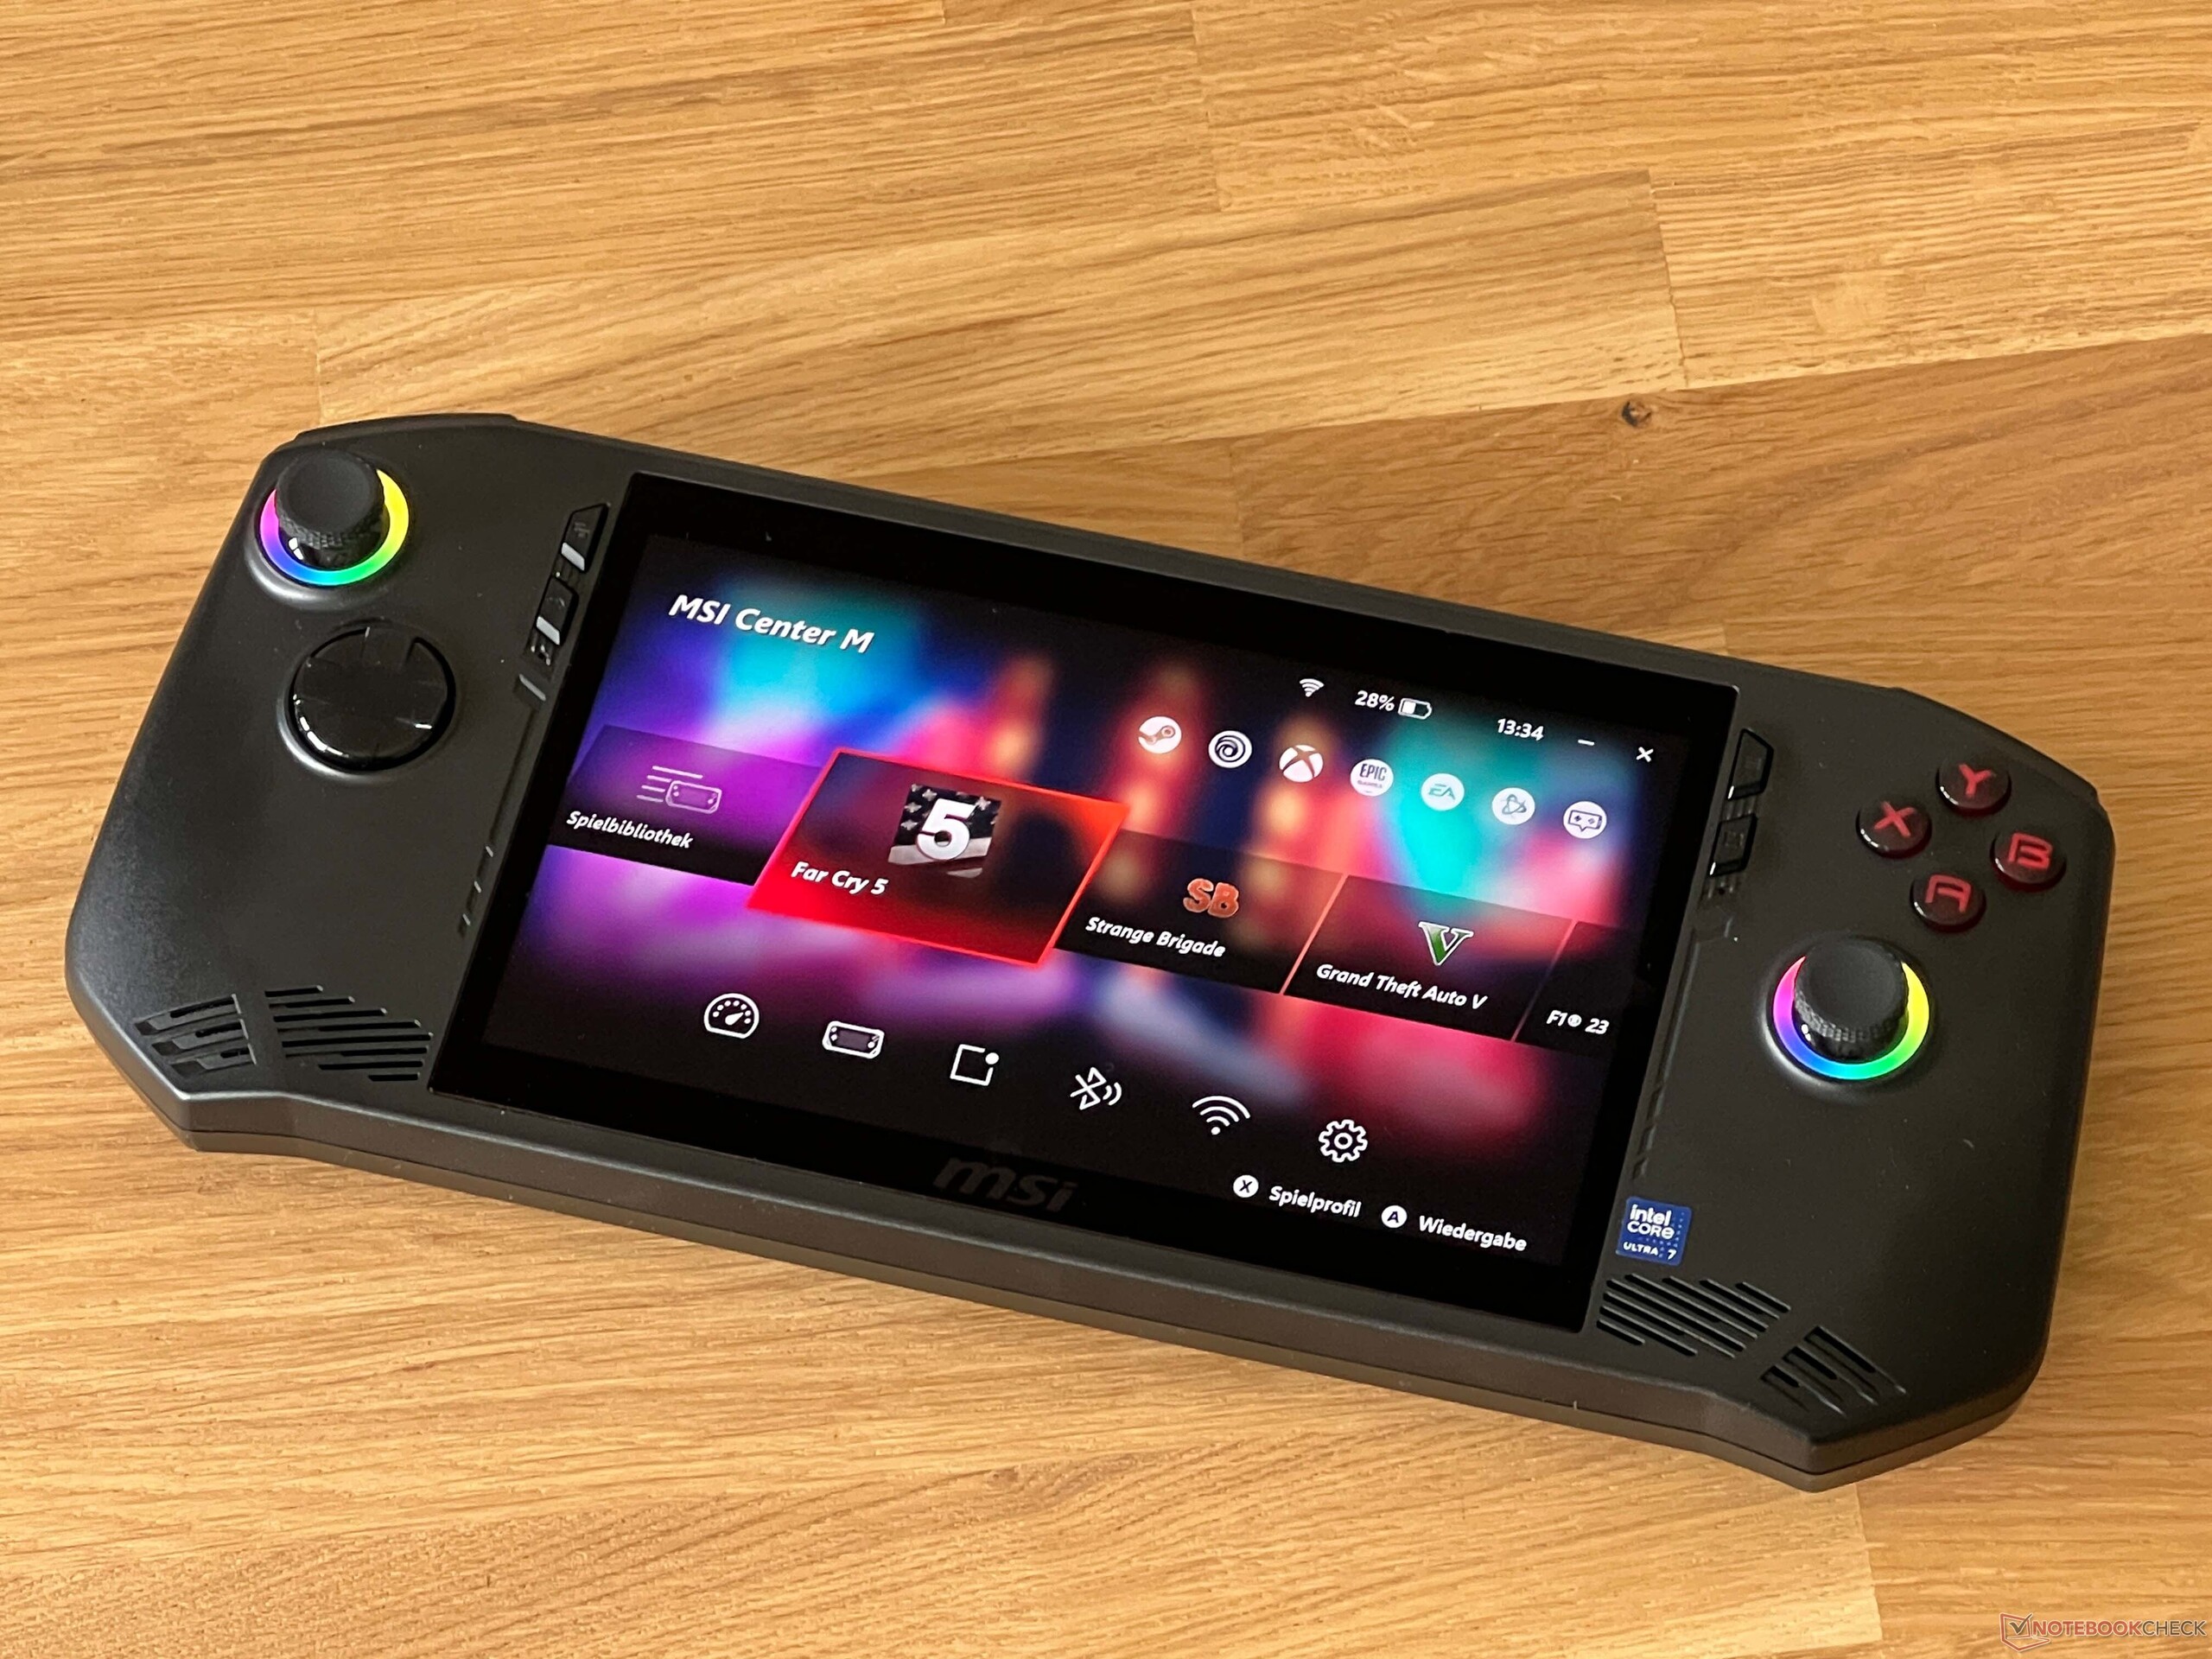
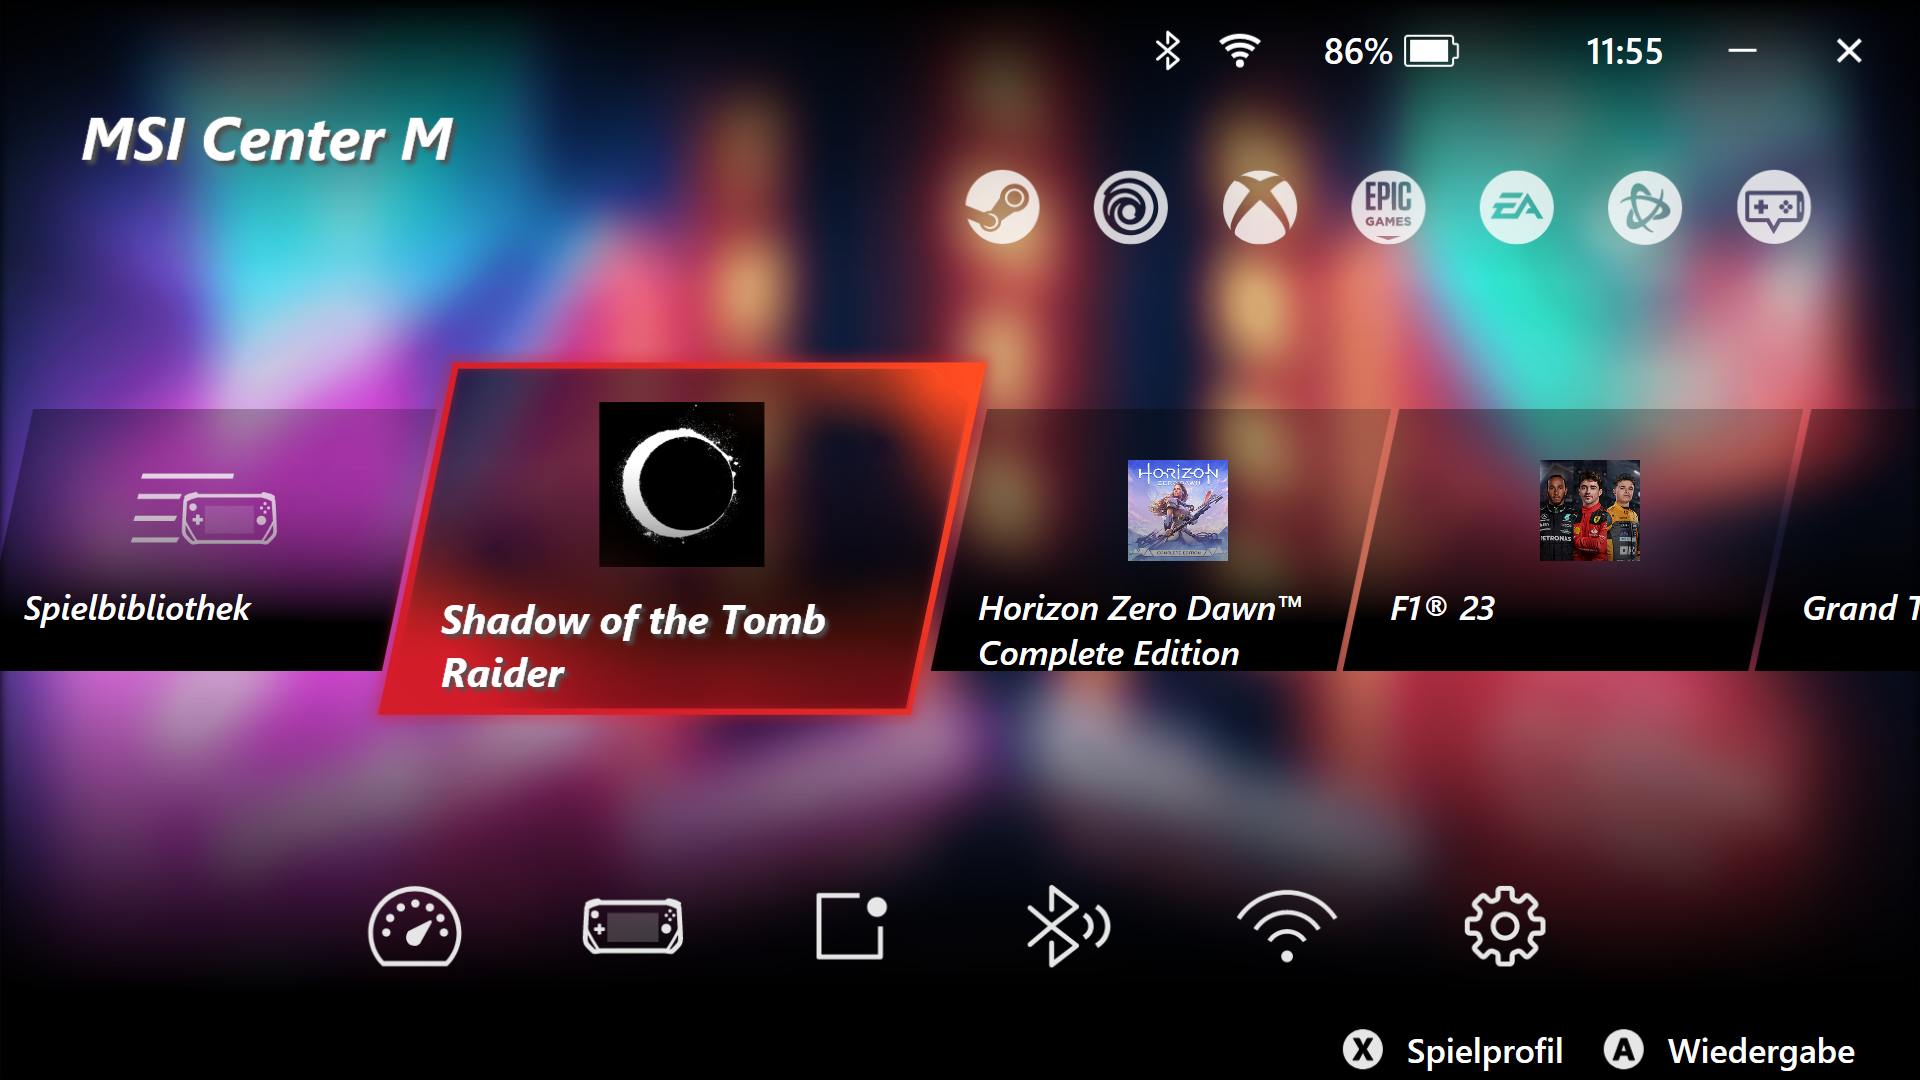
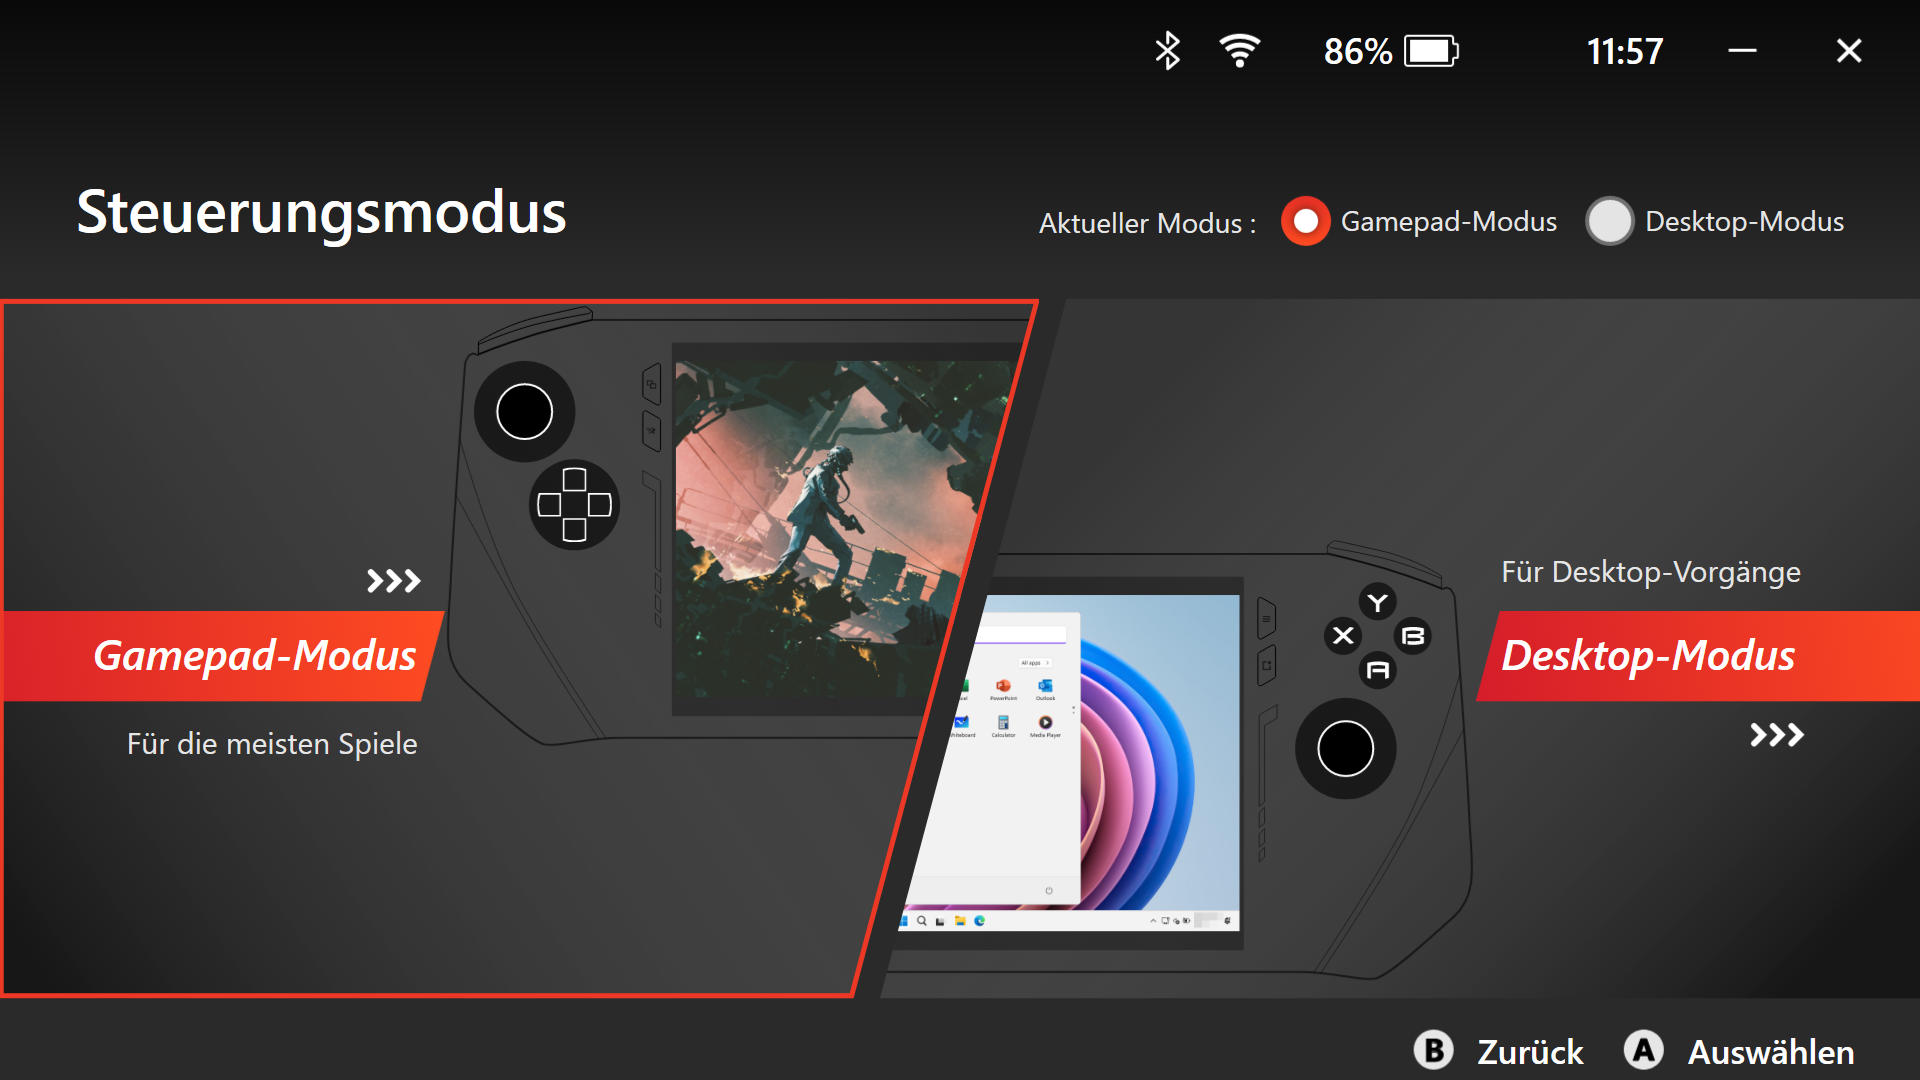
输入设备和操作
它的主要输入方法是设备的电容式以及 "游戏手柄 "控制,如两个操纵杆、D-pad 和附加按钮。触摸屏本身可以完美运行,但仅使用触摸屏(尤其是小触摸屏)使用 Windows 仍然非常累人,而且初始设置也不是很有趣。理想情况下,您应该有一台显示器为设备供电,并可直接连接鼠标和键盘。完成 Windows 设置后,一切都将围绕制造商的软件展开--本例中就是微星的 Center M。此外,所有重要的游戏服务,如 Steam、UPlay、XBox、Epic、EA 和 Battlenet 都已集成,因此安装游戏非常方便。还有一个快速菜单,可随时显示,用于快速更改最重要的设置(能耗曲线、亮度、Wi-Fi 连接)。该菜单还具有很强的自定义功能,总体而言,Center-M 软件运行完美,似乎开发得非常出色。只有它的实时监控(三种不同模式)与左上角相连,而且 FPS 显示在我们测试的任何游戏中都不起作用。
微星采用霍尔效应模拟摇杆和触发器,因此不会出现摇杆漂移的问题。与 ROG Ally 相比,这些按键的总声音略大,触发器返回原位时发出的响声可能有点恼人。不过,我们在玩游戏时没有发现任何功能问题。
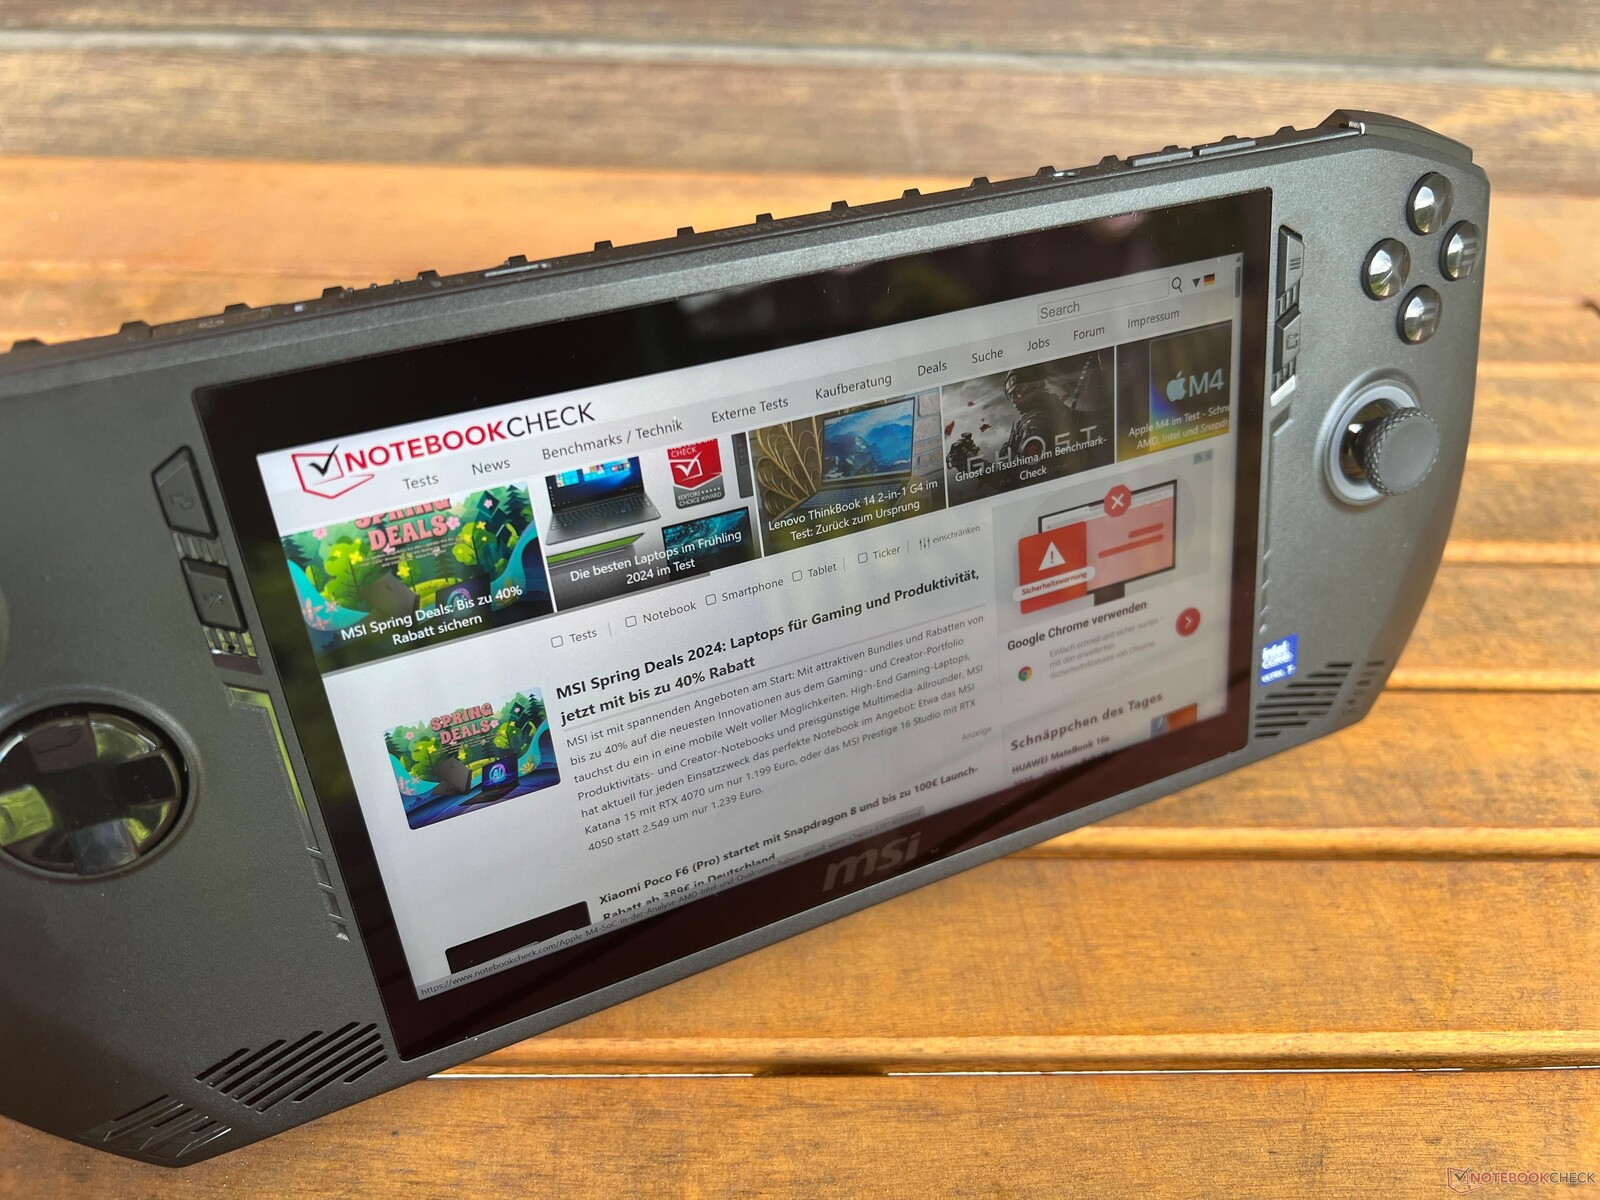
显示屏 - 7 英寸 IPS,刷新率为 120 赫兹


7 英寸 16:9 IPS 屏幕的分辨率为 1,920 x 1,080 像素。其刷新率为 120 Hz,但与 ROG Ally 不同,Claw 不支持可变刷新率。总的来说,这块屏幕给人的印象不错,不过明亮的表面容易出现轻微的颗粒感。它的响应时间又快又好,我们只注意到全亮度下有轻微的背光出血现象,而且没有 PWM 闪烁。
我们测得的最大亮度为 483 cd/m²,平均亮度为 461 cd/m²。其黑度为 0.32 cd/m²,最大对比度接近 1,500:1,表现非常出色。
| |||||||||||||||||||||||||
Brightness Distribution: 88 %
Contrast: 1491:1 (Black: 0.32 cd/m²)
ΔE ColorChecker Calman: 2.6 | ∀{0.5-29.43 Ø4.75}
calibrated: 1.5
ΔE Greyscale Calman: 3.9 | ∀{0.09-98 Ø5}
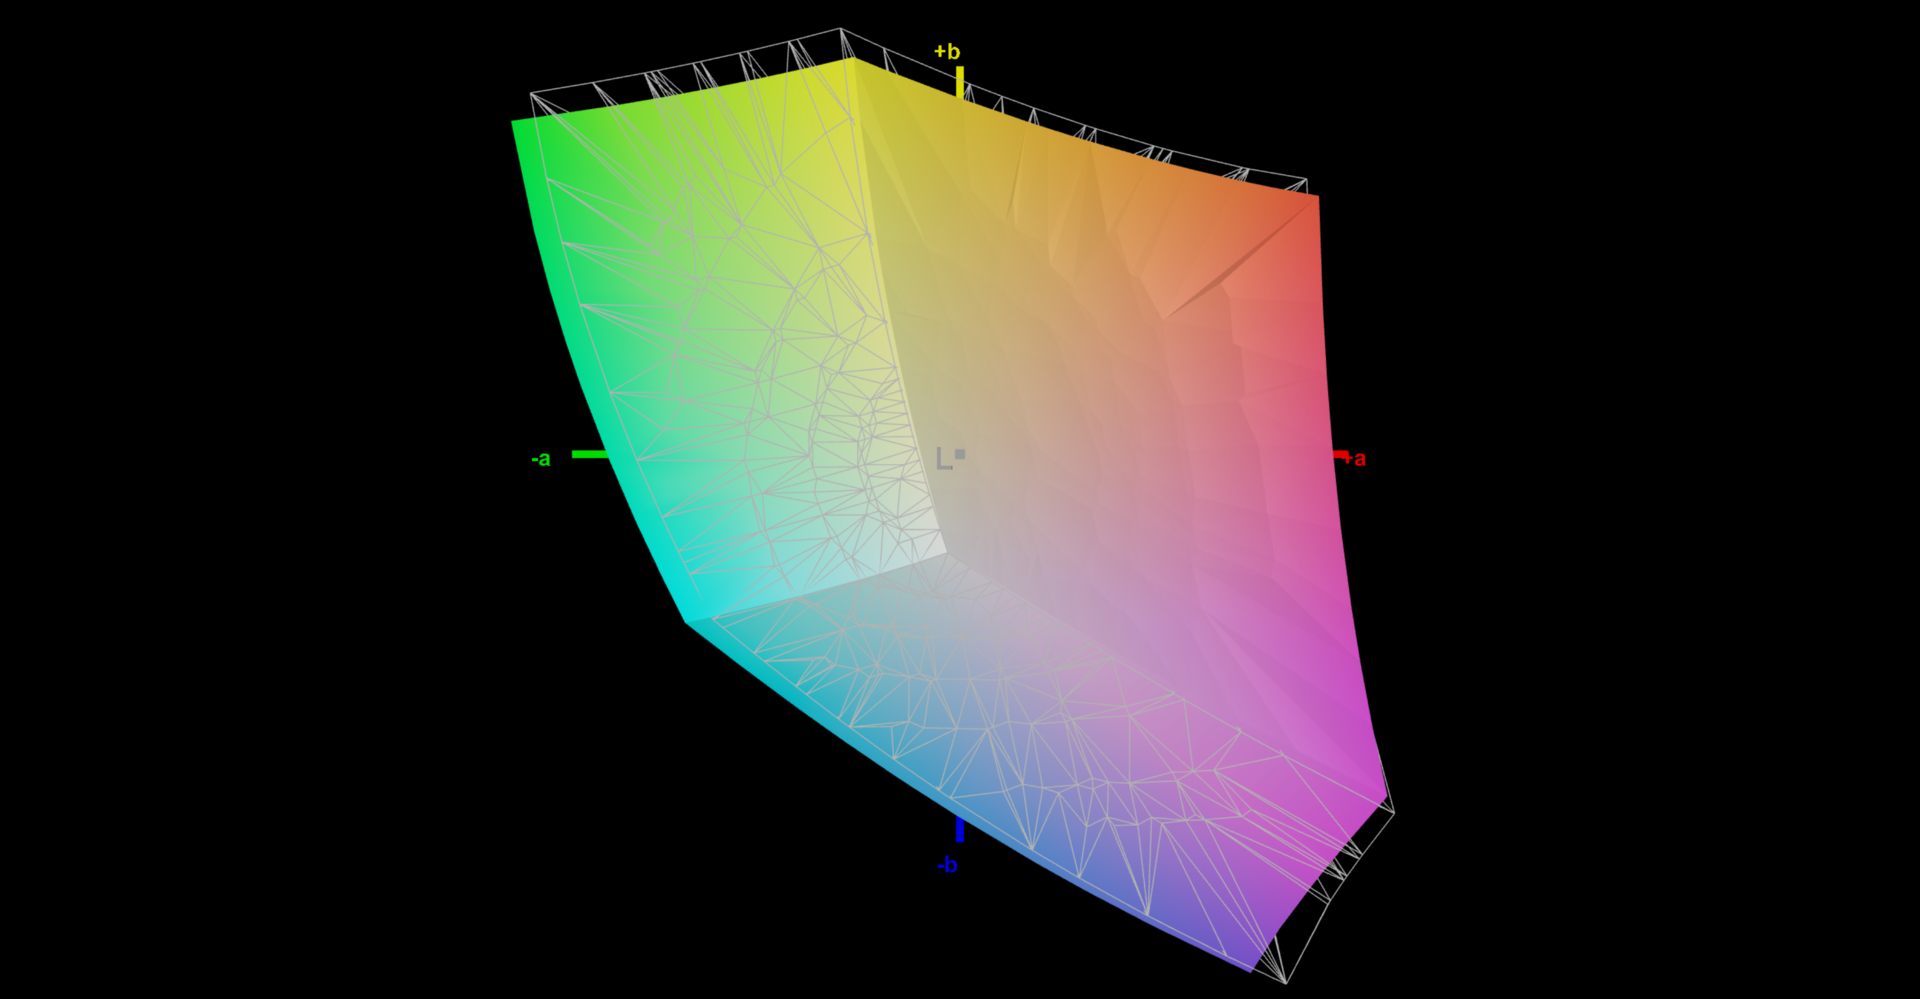
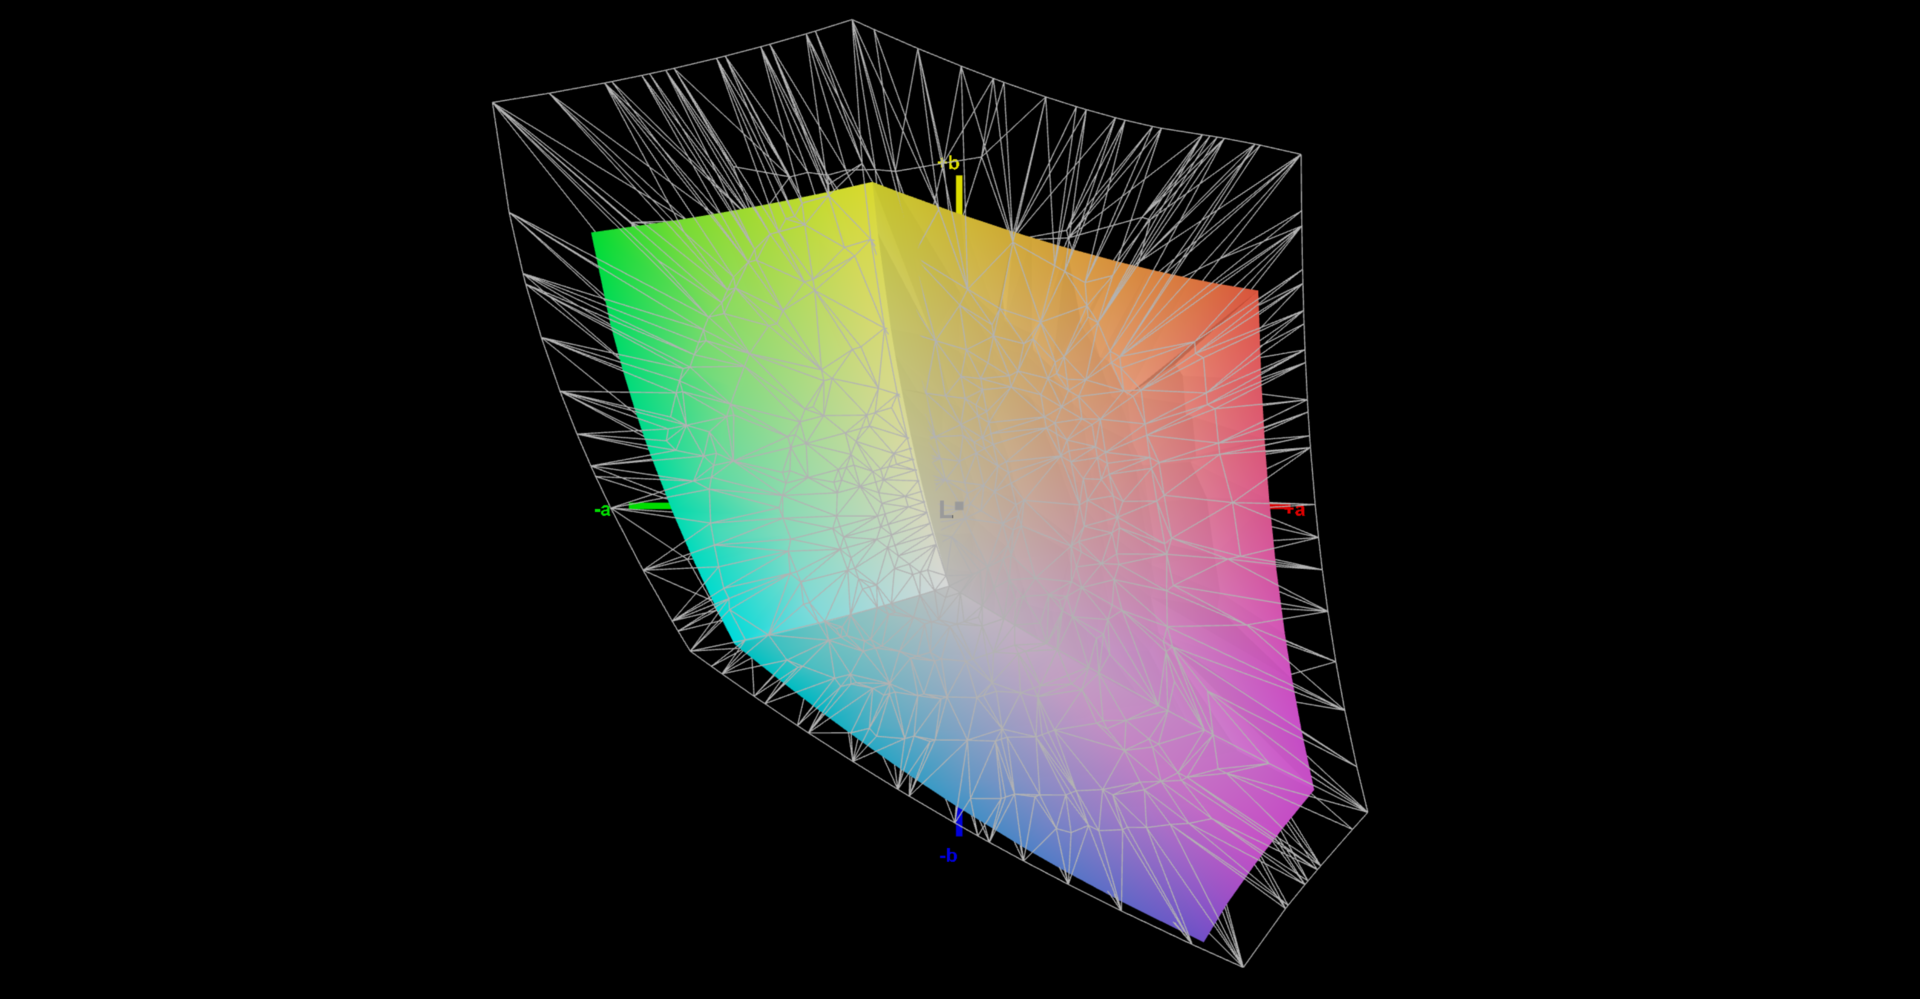
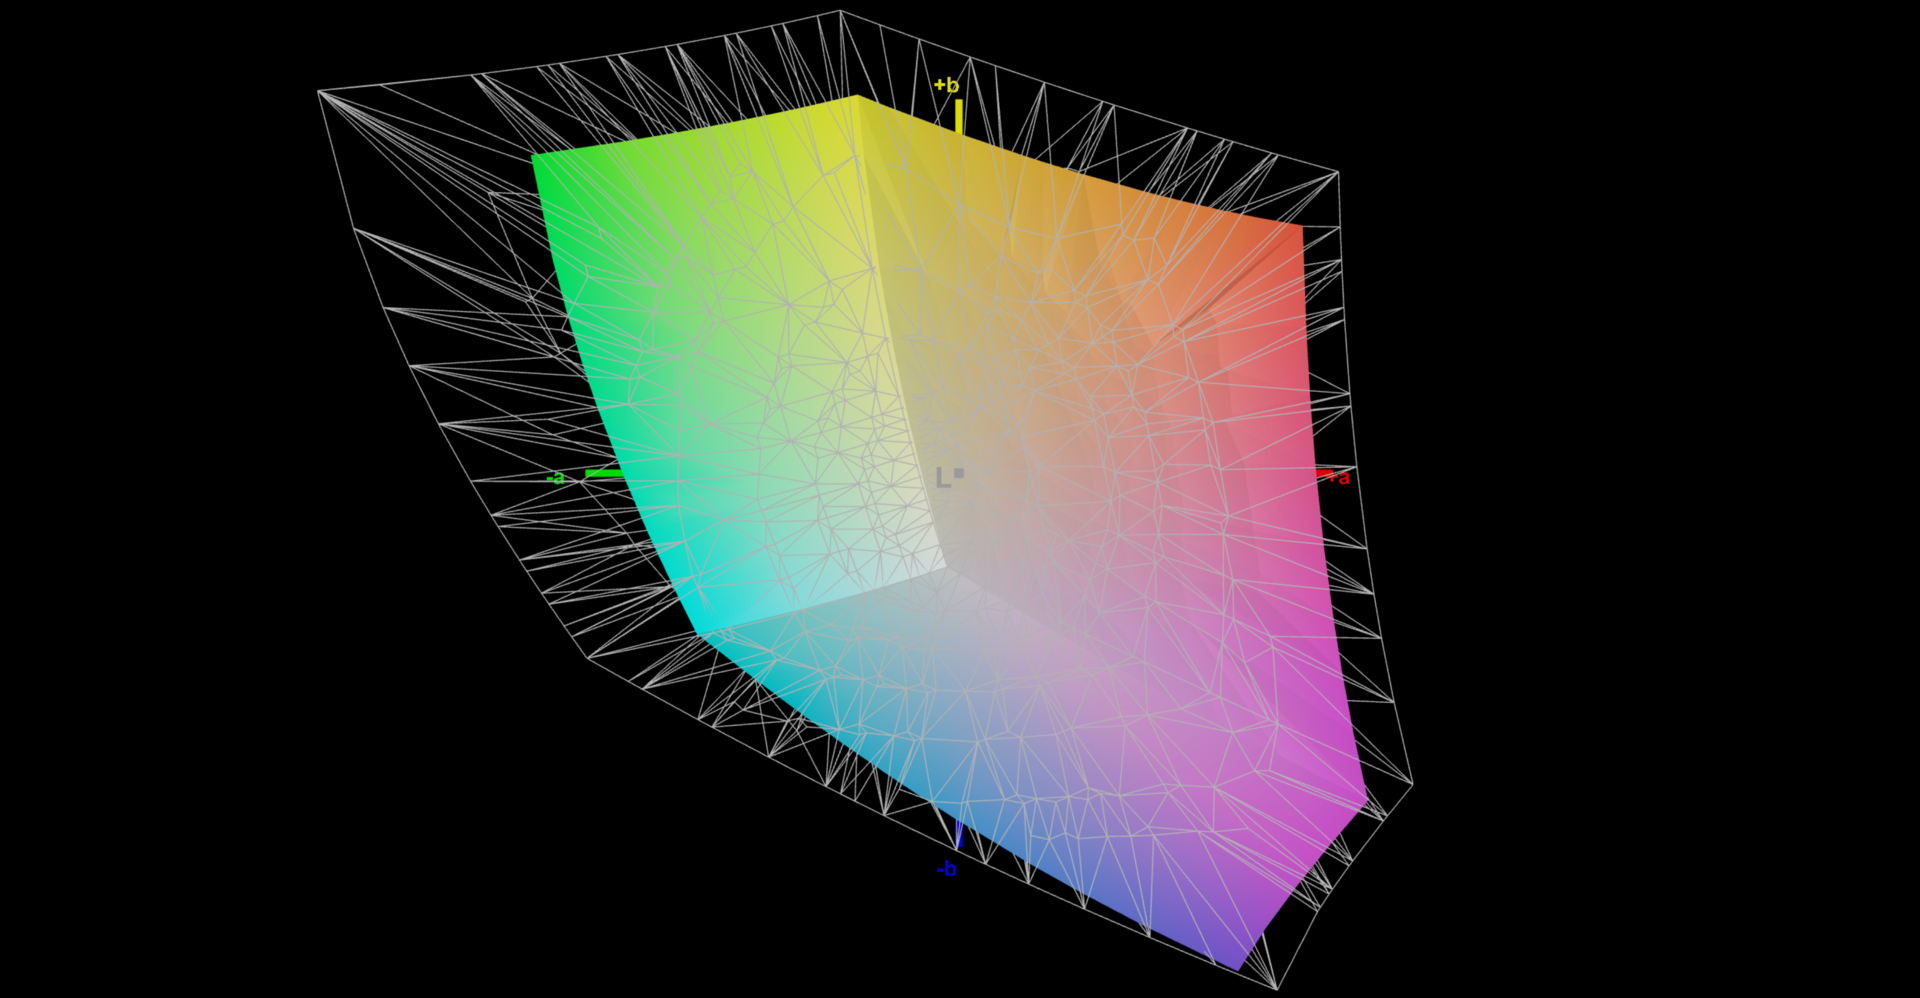
69.4% AdobeRGB 1998 (Argyll 3D)
94.4% sRGB (Argyll 3D)
67% Display P3 (Argyll 3D)
Gamma: 2.17
CCT: 7250 K
| MSI Claw TL070FVXS02-0, IPS, 1920x1080, 7" | Valve Steam Deck 1 TB OLED ANX7530 U, OLED, 1280x800, 7.4" | Lenovo Legion Go Legion Go Display, IPS, 2560x1600, 8.8" | Asus ROG Ally Z1 Extreme TL070FVSX01-0, IPS, 1920x1080, 7" | ONEXPLAYER 2 Pro AR18 FLQ8423-24L0, IPS, 2560x1600, 8.4" | Ayaneo Kun Ayaneo 2K, IPS, 2560x1600, 8.4" | |
|---|---|---|---|---|---|---|
| Display | 31% | 24% | -2% | 20% | 25% | |
| Display P3 Coverage (%) | 67 | 99.6 49% | 92.1 37% | 65.6 -2% | 91.9 37% | 93.52 40% |
| sRGB Coverage (%) | 94.4 | 100 6% | 99.56 5% | 92.1 -2% | 99.3 5% | 99.4 5% |
| AdobeRGB 1998 Coverage (%) | 69.4 | 96.1 38% | 90.09 30% | 67.9 -2% | 81.6 18% | 91.2 31% |
| Response Times | -17% | -122% | -3% | -211% | -154% | |
| Response Time Grey 50% / Grey 80% * (ms) | 9.2 ? | 9 ? 2% | 20.8 ? -126% | 10.5 ? -14% | 25.5 ? -177% | 24.2 ? -163% |
| Response Time Black / White * (ms) | 6.6 ? | 9 ? -36% | 14.4 ? -118% | 6 ? 9% | 22.73 ? -244% | 16.2 ? -145% |
| PWM Frequency (Hz) | 360 ? | 700 | 20000 | |||
| Screen | 147% | -37% | -17% | -14% | -20% | |
| Brightness middle (cd/m²) | 477 | 485 2% | 411 -14% | 513 8% | 318 -33% | 680 43% |
| Brightness (cd/m²) | 461 | 482 5% | 413 -10% | 474 3% | 287 -38% | 678 47% |
| Brightness Distribution (%) | 88 | 98 11% | 80 -9% | 84 -5% | 48 -45% | 91 3% |
| Black Level * (cd/m²) | 0.32 | 0.03 91% | 0.42 -31% | 0.38 -19% | 0.1118 65% | 0.5 -56% |
| Contrast (:1) | 1491 | 16167 984% | 979 -34% | 1350 -9% | 2844 91% | 1360 -9% |
| Colorchecker dE 2000 * | 2.6 | 2 23% | 5.94 -128% | 3.7 -42% | 4.81 -85% | 4 -54% |
| Colorchecker dE 2000 max. * | 5.8 | 5 14% | 10.56 -82% | 8.3 -43% | 6.93 -19% | 9 -55% |
| Colorchecker dE 2000 calibrated * | 1.5 | 2.95 -97% | 1.53 -2% | 1 33% | ||
| Greyscale dE 2000 * | 3.9 | 2 49% | 0.92 76% | 5.1 -31% | 6.12 -57% | 9 -131% |
| Gamma | 2.17 101% | 2 110% | 1.93 114% | 2.14 103% | 2.003 110% | 2 110% |
| CCT | 7250 90% | 6336 103% | 8064 81% | 7732 84% | 7707 84% | 7188 90% |
| Total Average (Program / Settings) | 54% /
95% | -45% /
-36% | -7% /
-11% | -68% /
-35% | -50% /
-29% |
* ... smaller is better
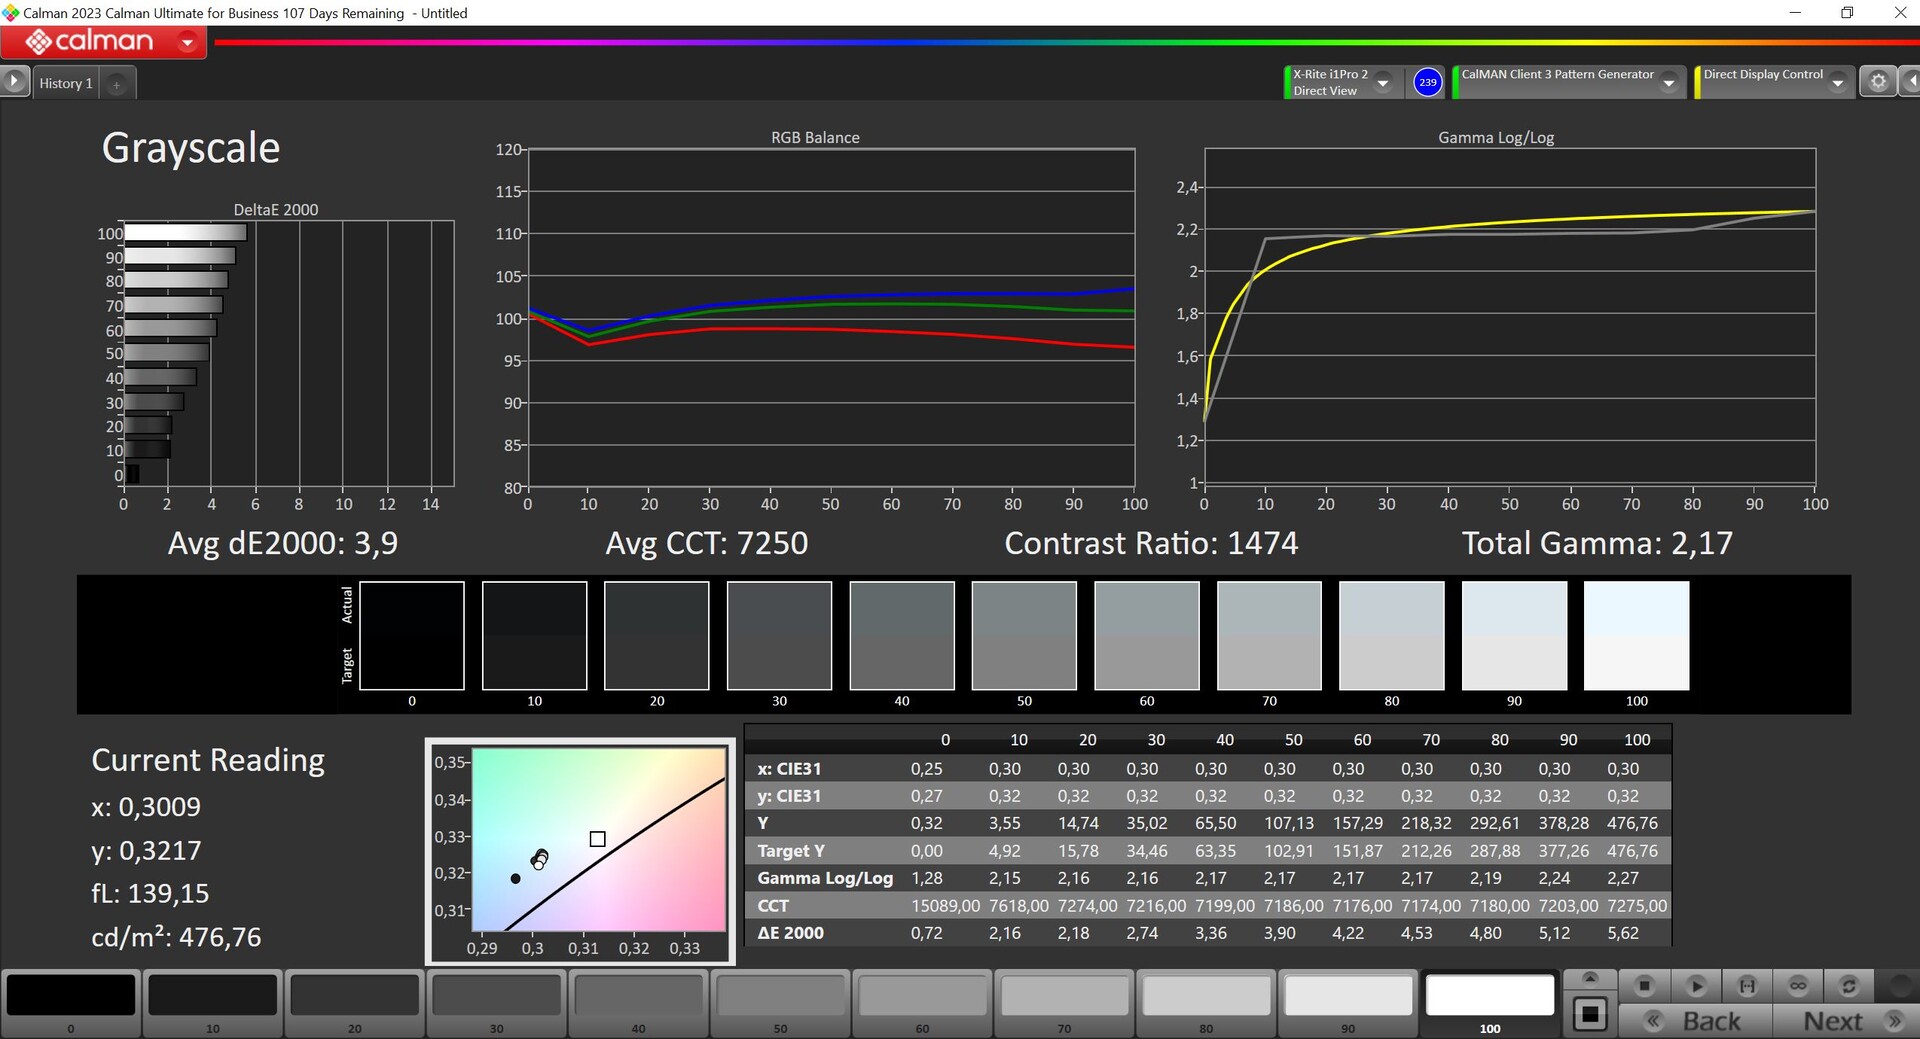
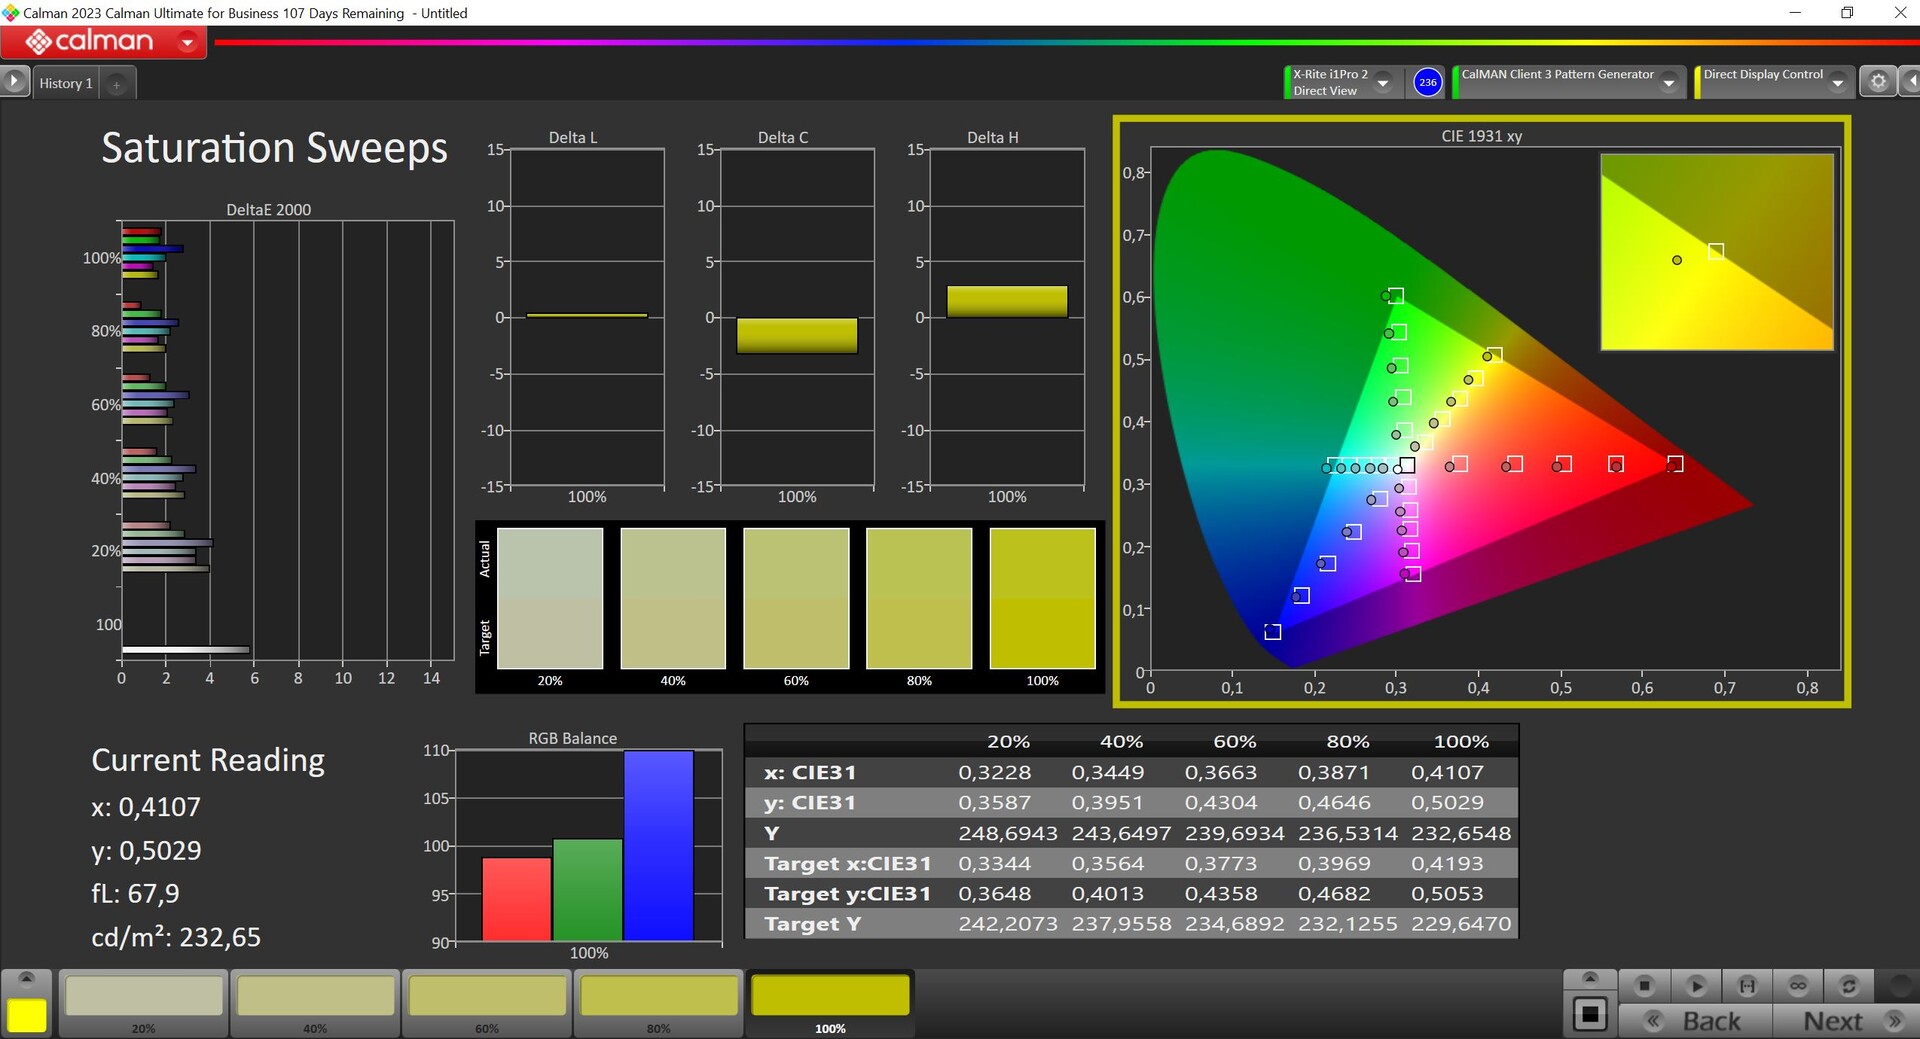
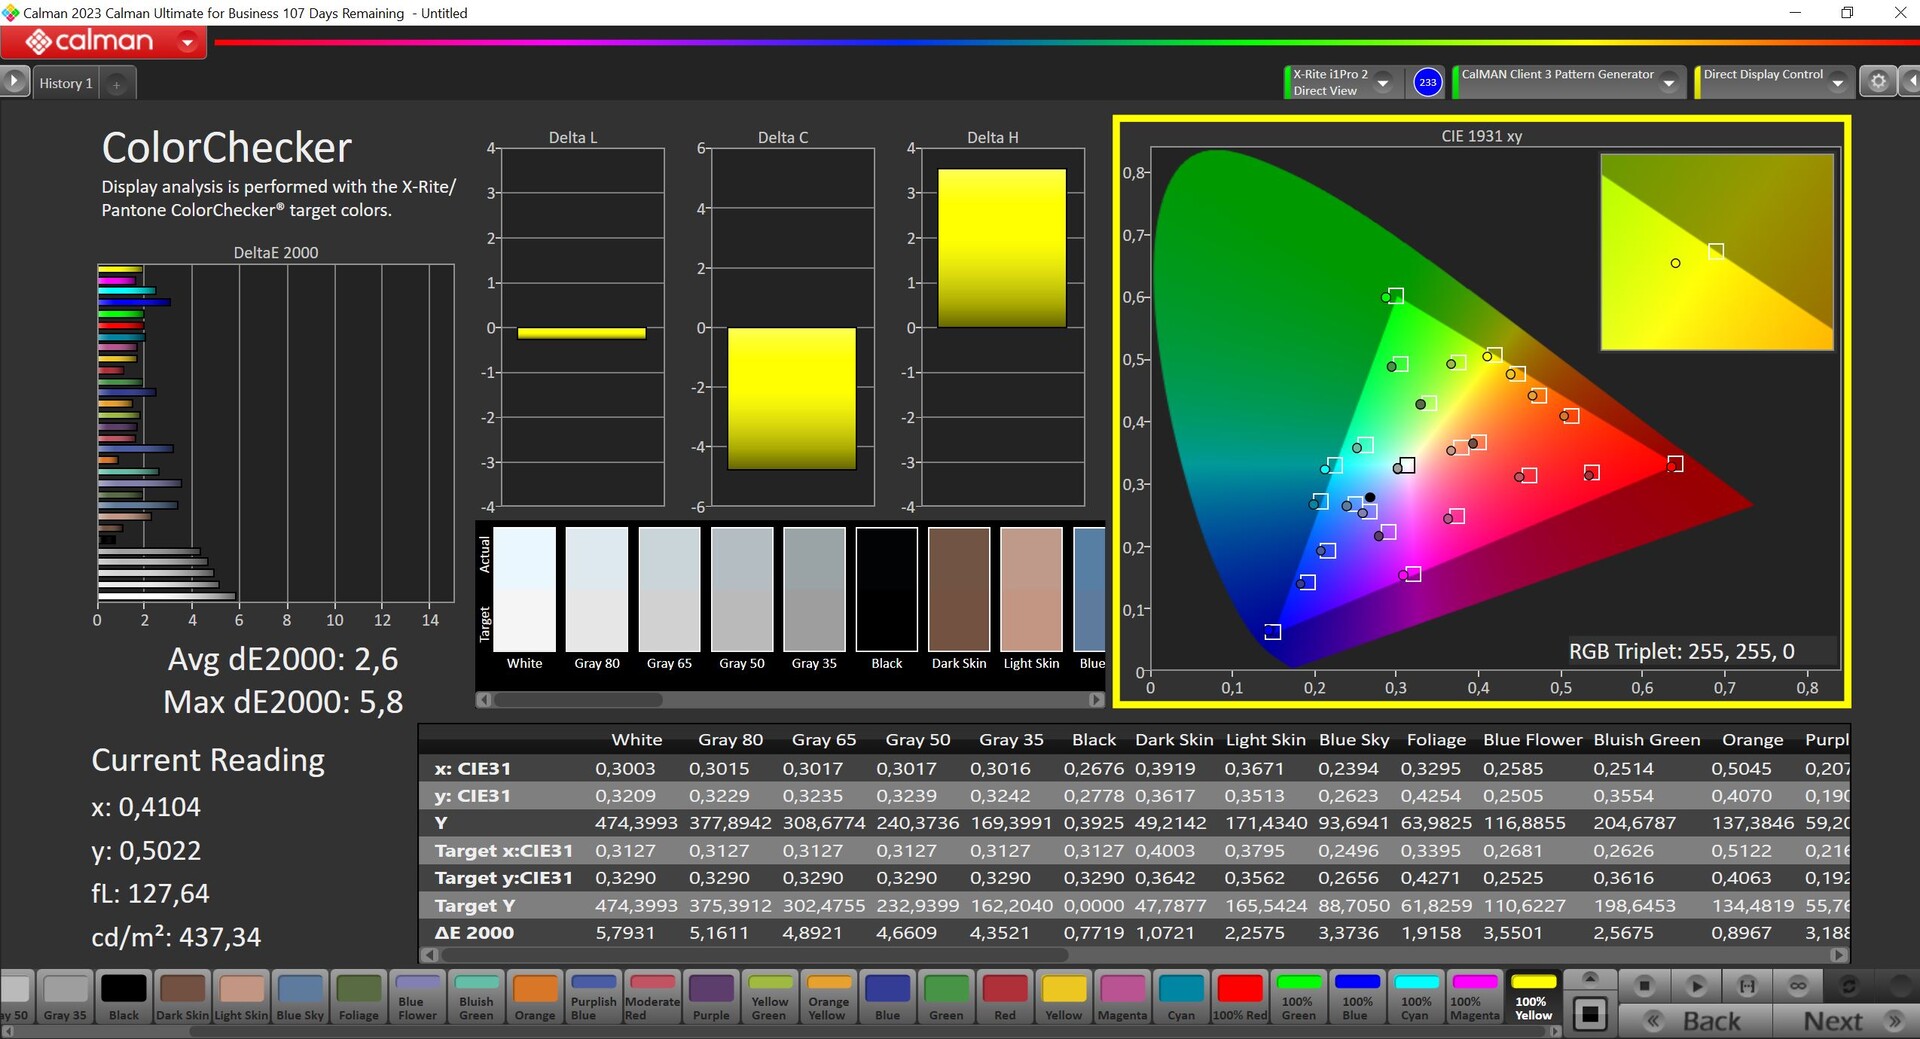
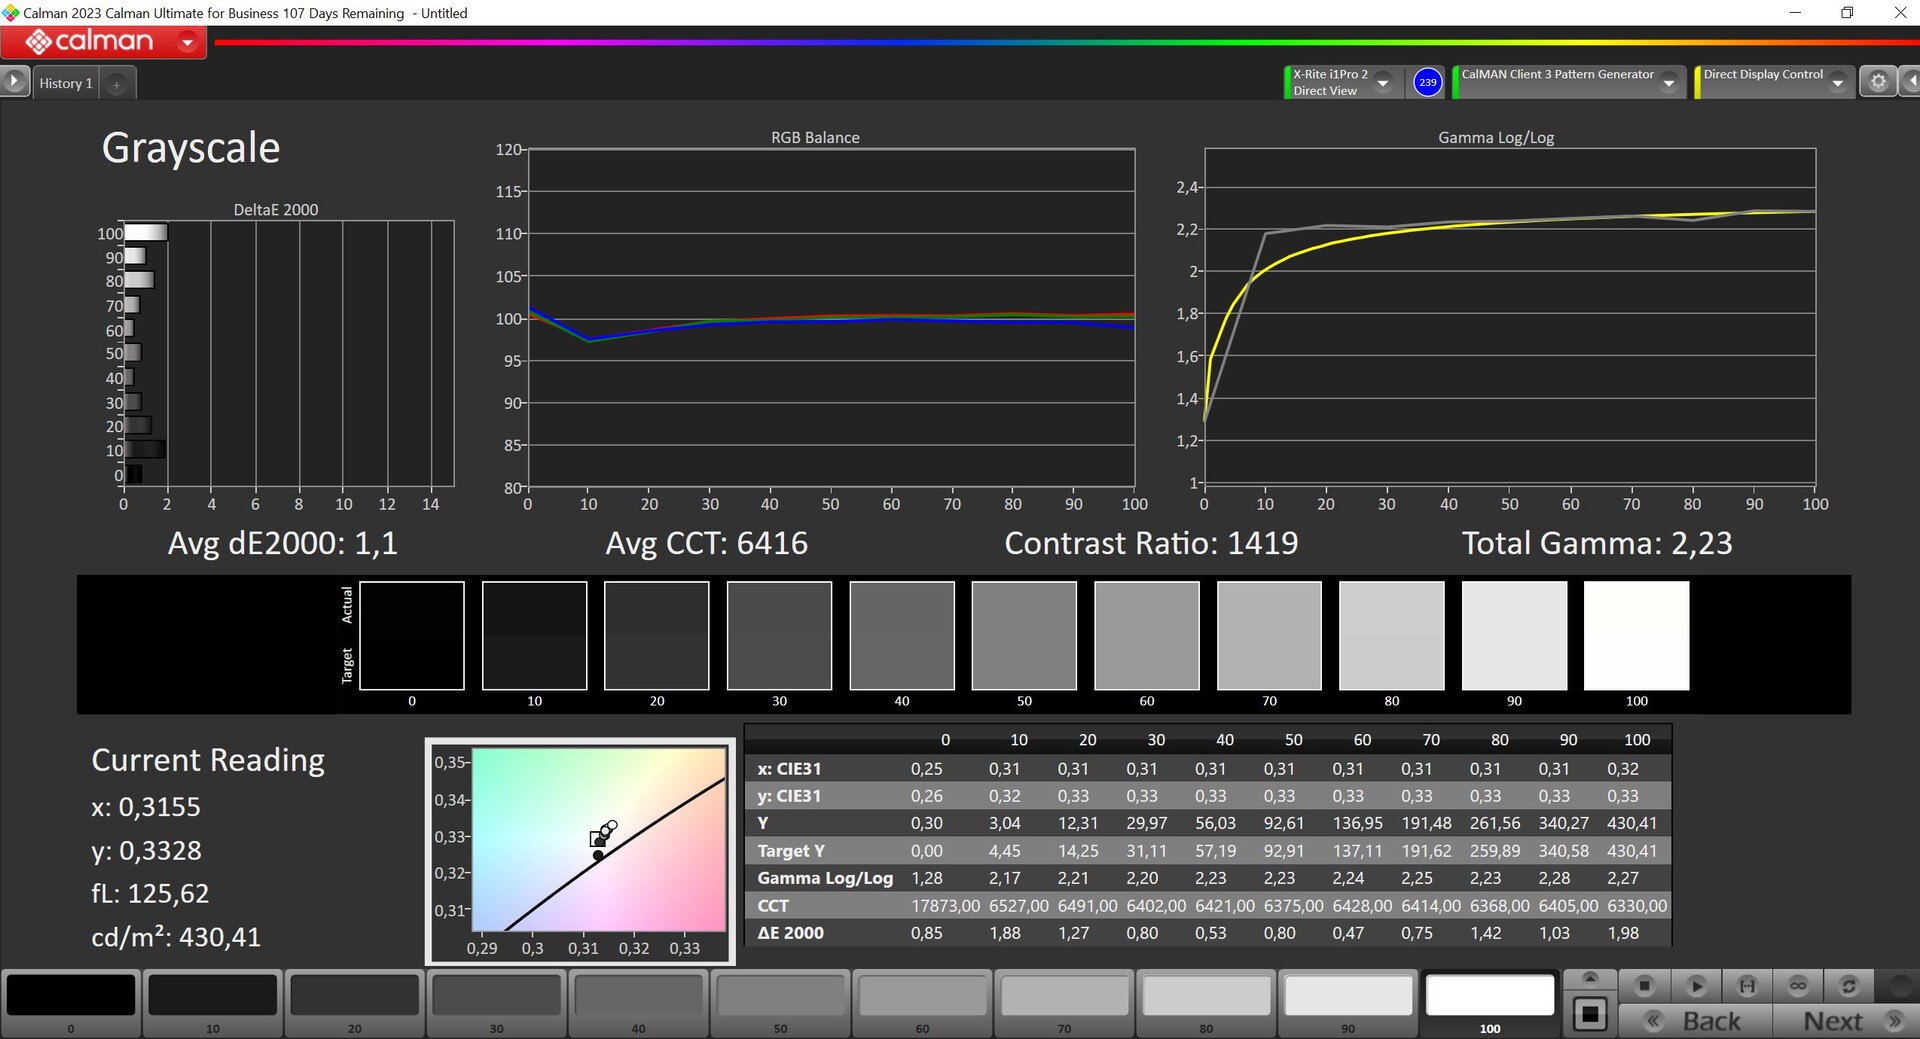

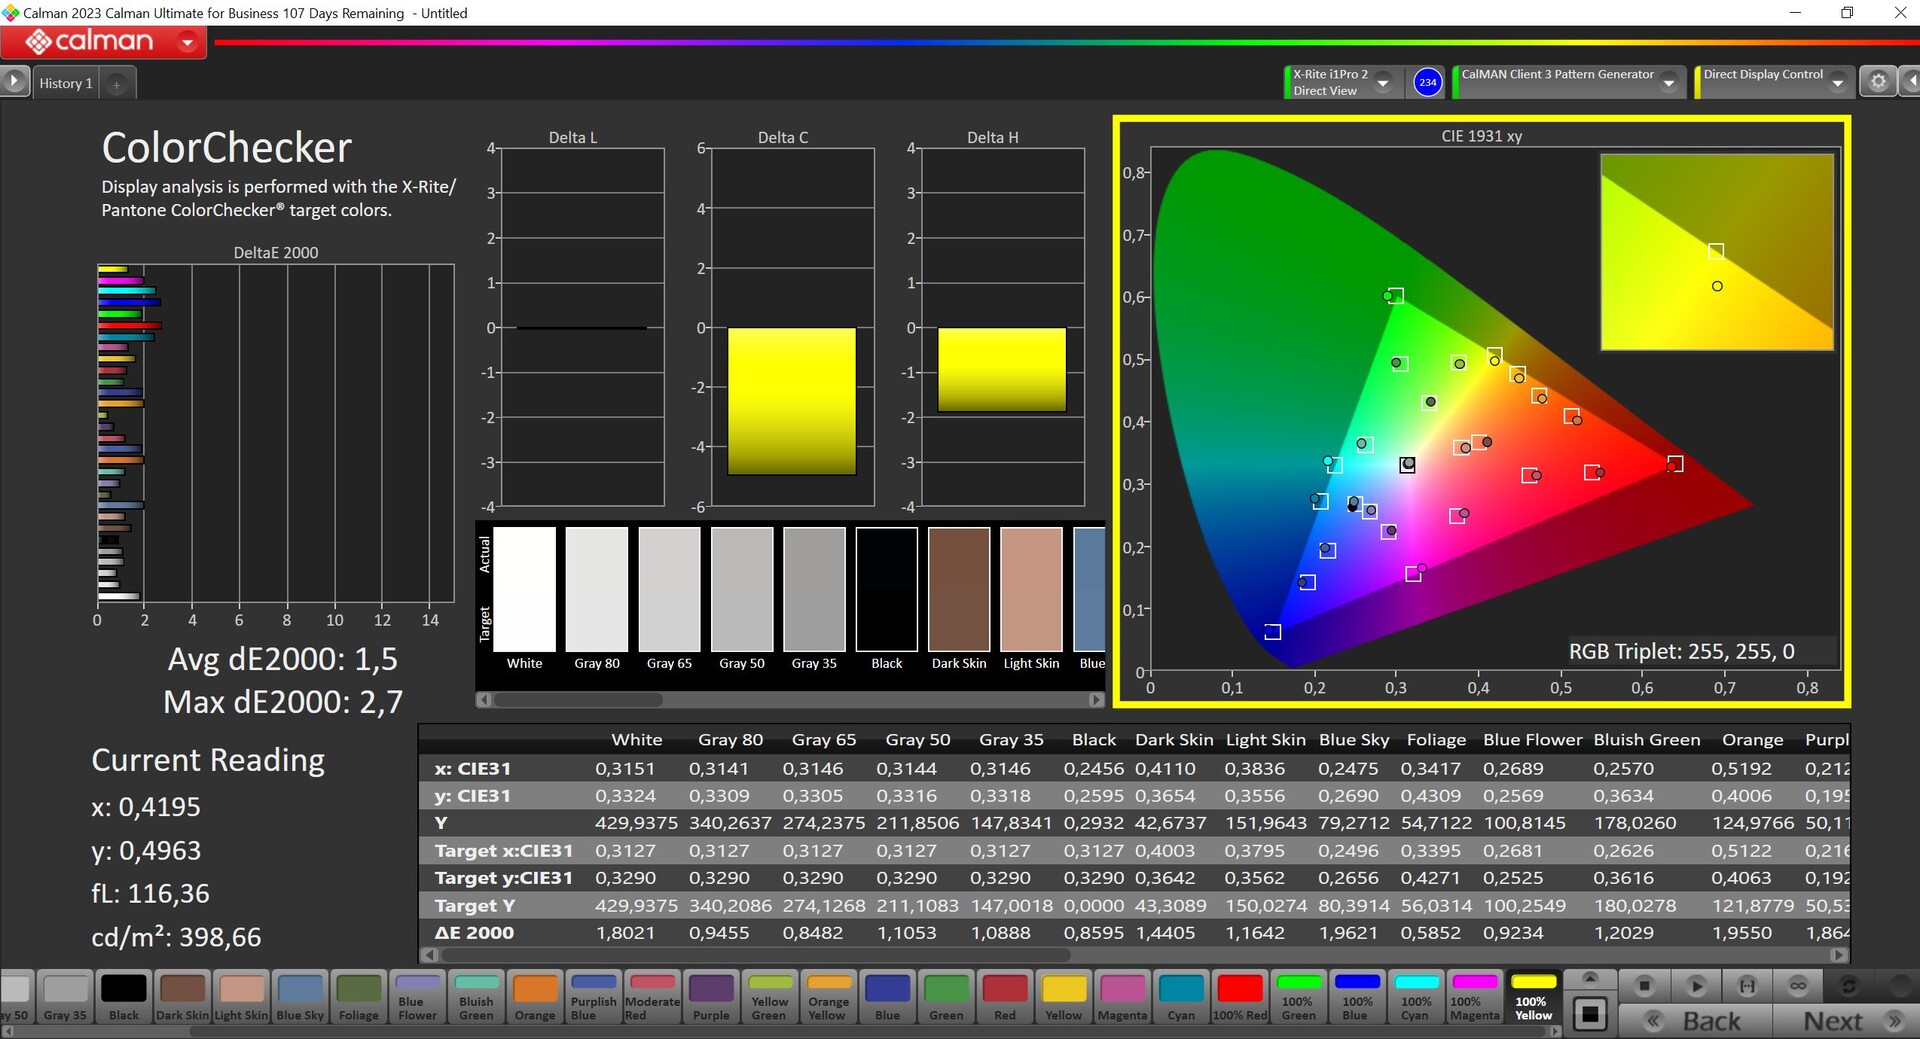
微星没有提供任何色彩配置文件,在我们使用专业的 CalMAN 软件(X-Rite i1 Pro 2)进行分析时,面板显示出轻微的偏蓝,色温过低。另一方面,其色彩偏差还算正常。微星利用这些设置实现了更高的亮度。通过校准(配置文件可在上面免费下载),我们特别改善了灰阶,使偏色成为过去,但其最大亮度却低了近 50 cd/m²。sRGB 色彩空间的覆盖率为 95%,理论上你甚至可以在设备上编辑图像,但这显然不是游戏掌上电脑的实际使用场景。
Display Response Times
| ↔ Response Time Black to White | ||
|---|---|---|
| 6.6 ms ... rise ↗ and fall ↘ combined | ↗ 3.1 ms rise | 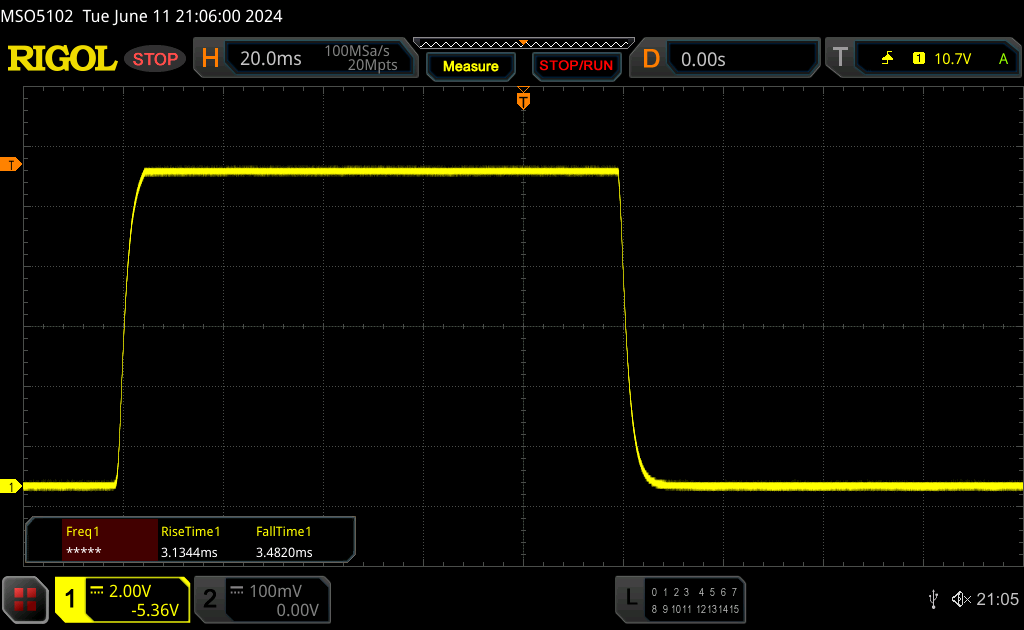 |
| ↘ 3.5 ms fall | ||
| The screen shows very fast response rates in our tests and should be very well suited for fast-paced gaming. In comparison, all tested devices range from 0.1 (minimum) to 240 (maximum) ms. » 20 % of all devices are better. This means that the measured response time is better than the average of all tested devices (20.1 ms). | ||
| ↔ Response Time 50% Grey to 80% Grey | ||
| 9.2 ms ... rise ↗ and fall ↘ combined | ↗ 4.6 ms rise | 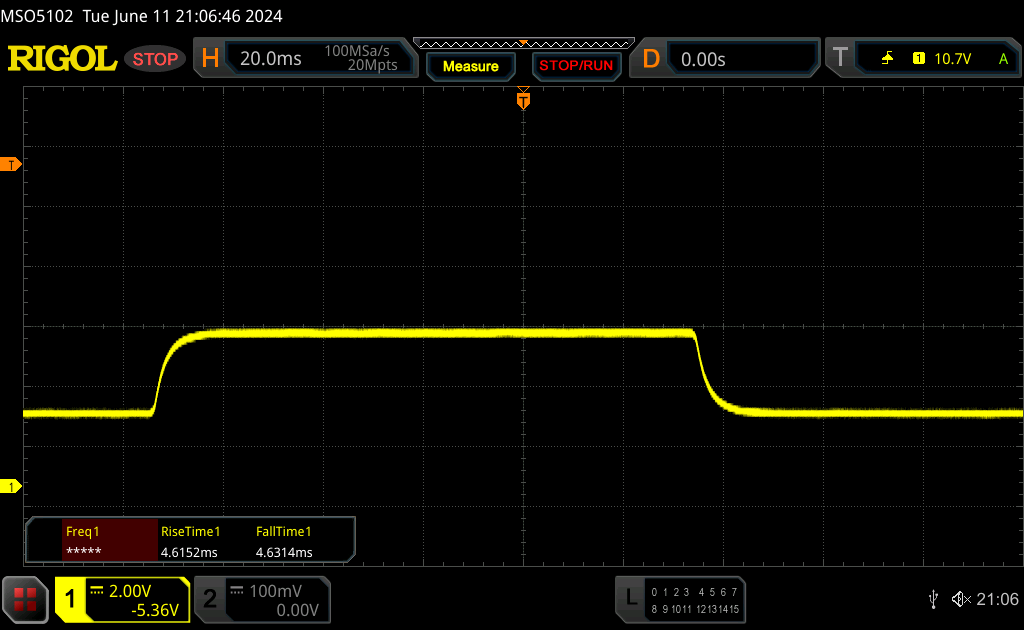 |
| ↘ 4.6 ms fall | ||
| The screen shows fast response rates in our tests and should be suited for gaming. In comparison, all tested devices range from 0.165 (minimum) to 636 (maximum) ms. » 22 % of all devices are better. This means that the measured response time is better than the average of all tested devices (31.4 ms). | ||
Screen Flickering / PWM (Pulse-Width Modulation)
| Screen flickering / PWM not detected |  | ||
In comparison: 53 % of all tested devices do not use PWM to dim the display. If PWM was detected, an average of 7986 (minimum: 5 - maximum: 343500) Hz was measured. | |||
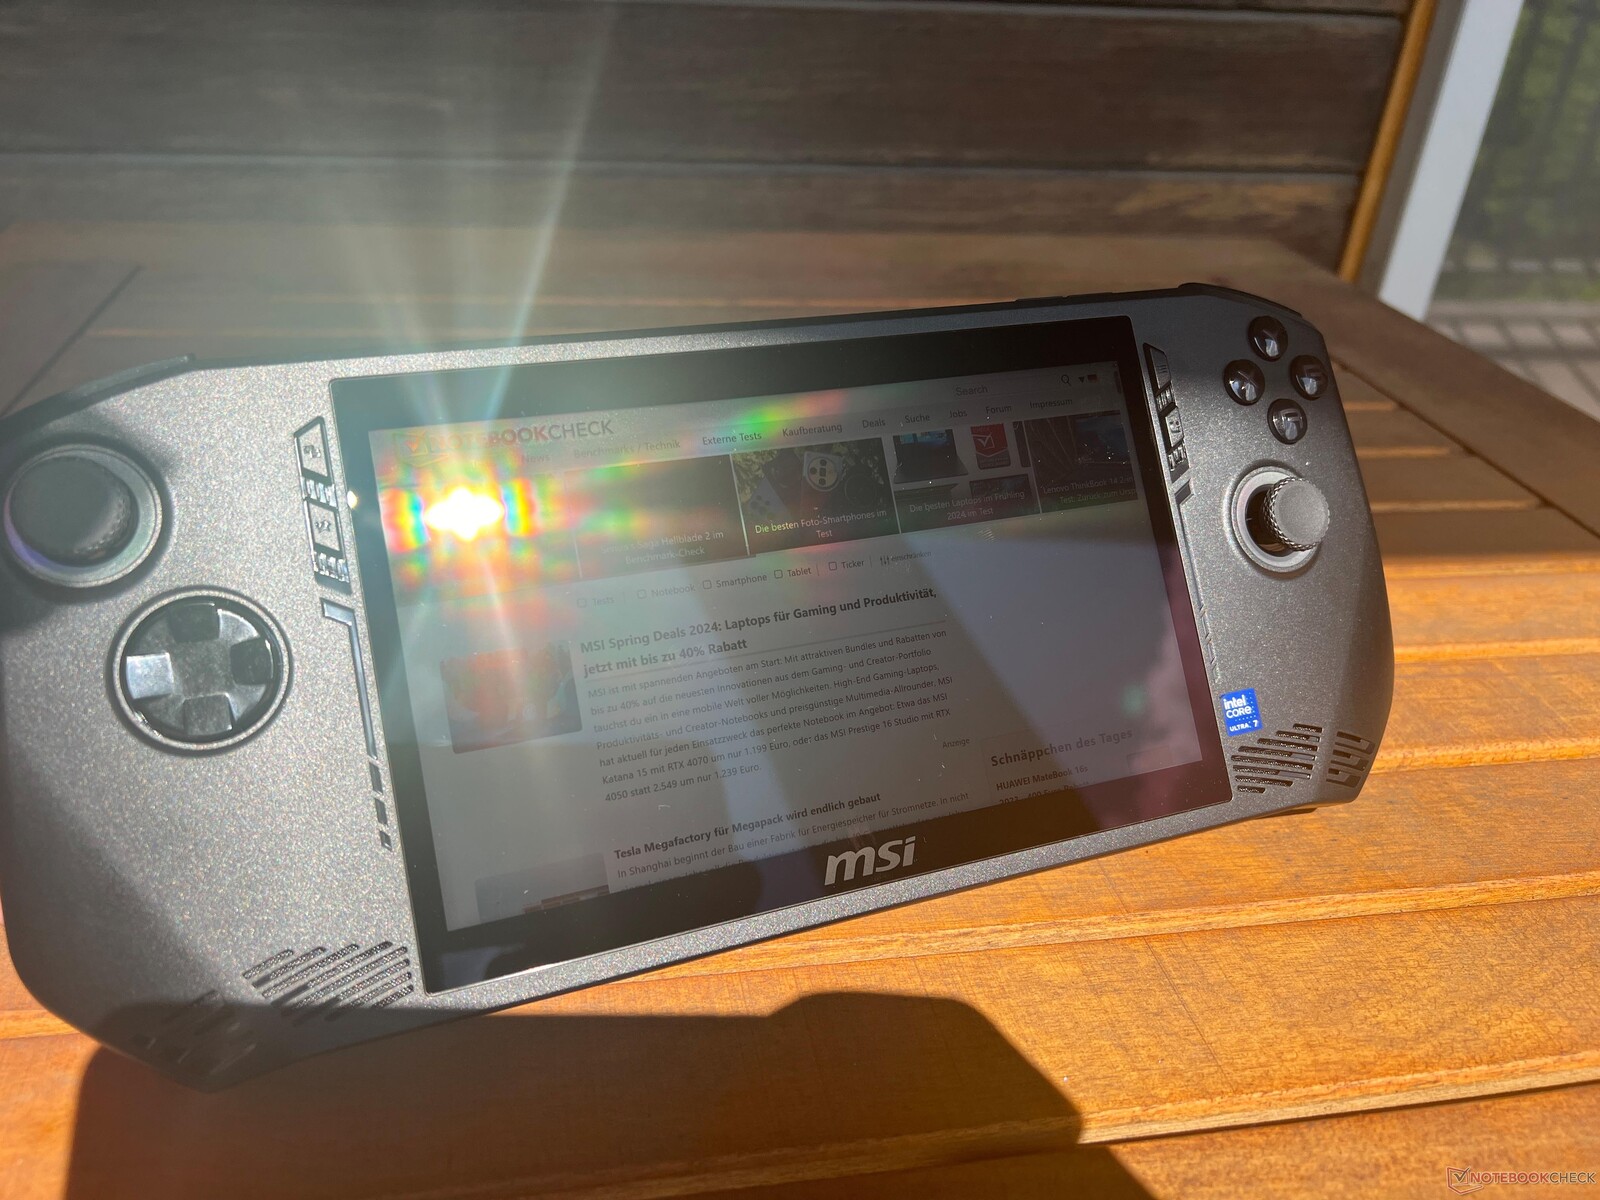
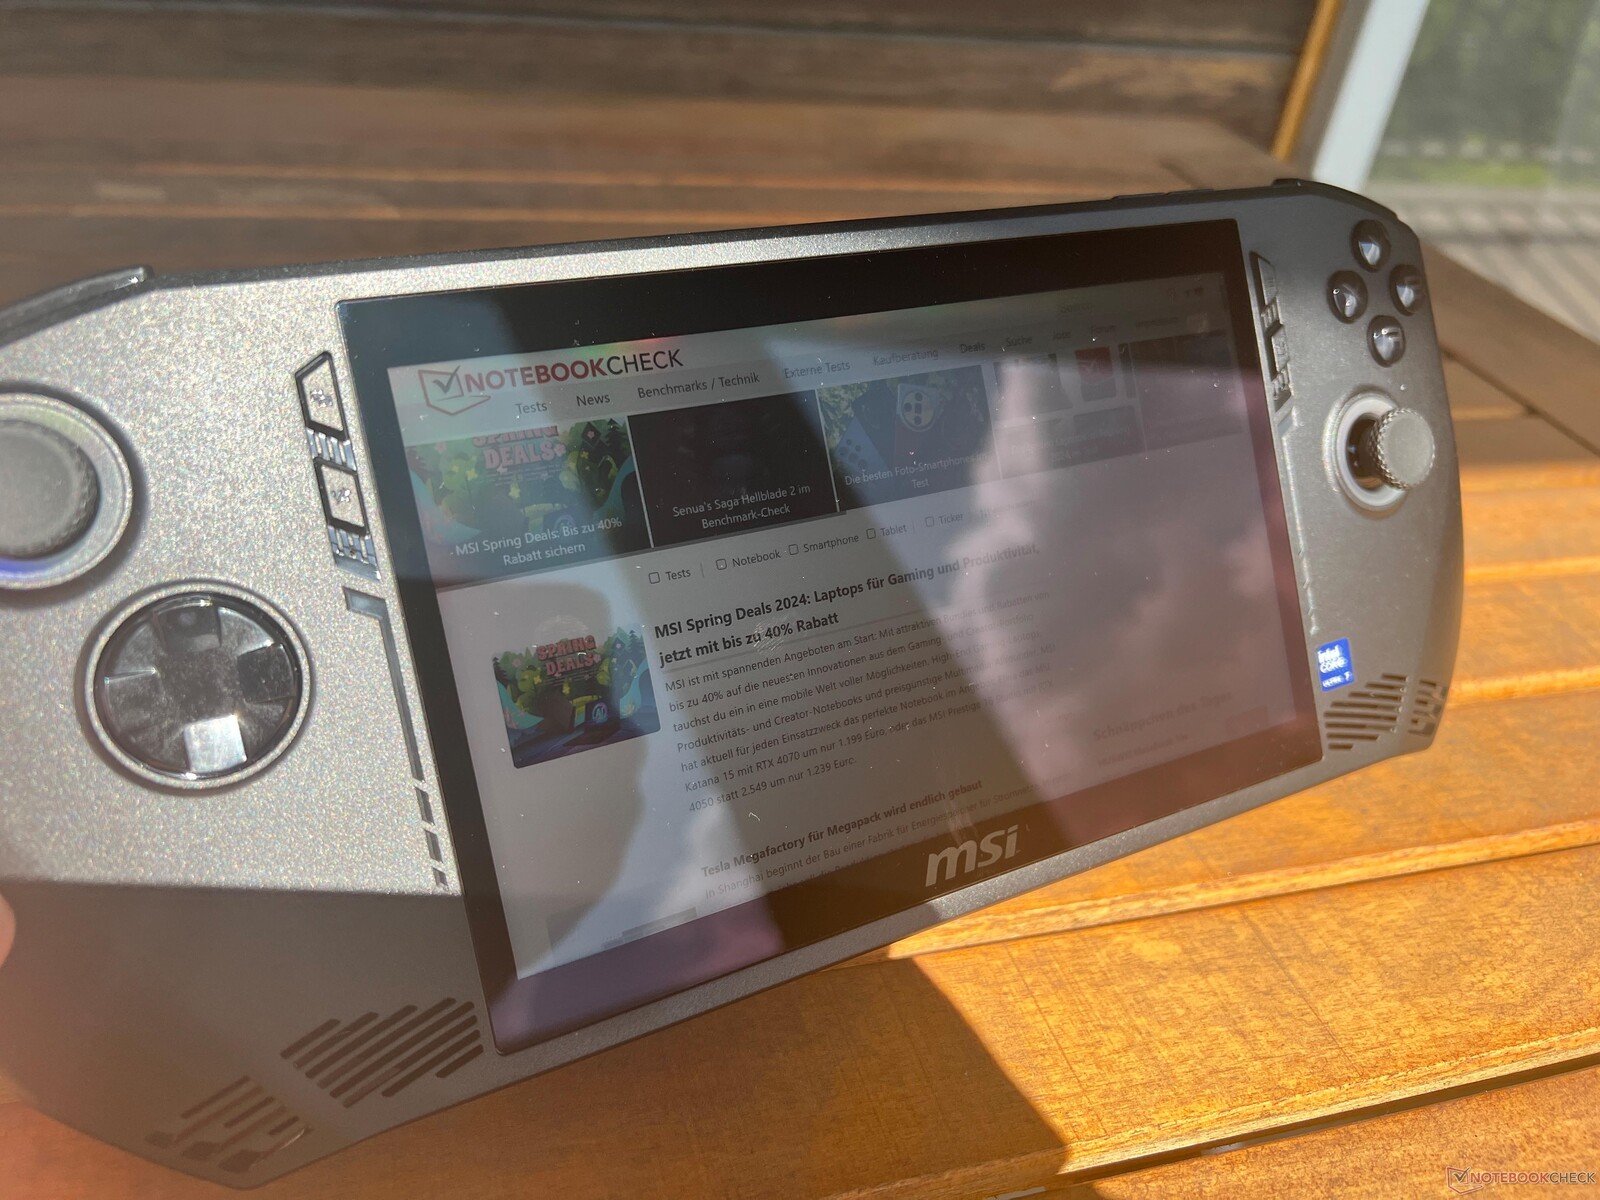
当然,闪亮的触摸屏上出现反光是意料之中的事,在非常明亮的日子里,使用该设备会变得有点困难。不过,在大多数情况下,你应该能找到一个合适的位置。视角方面也没有问题。

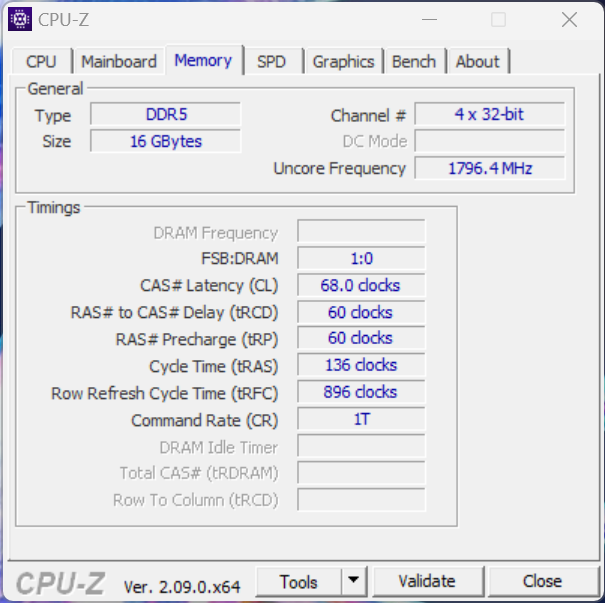
性能 - 英特尔酷睿 Ultra 处理器和 16GB 内存
如前所述,微星Claw游戏掌机可配备酷睿至尊7 155H或较弱的酷睿至尊5 135H,后者的iGPU也稍弱。两款机型均配备 16 GB 内存,且没有手动分配 VRAM 的选项。
测试条件
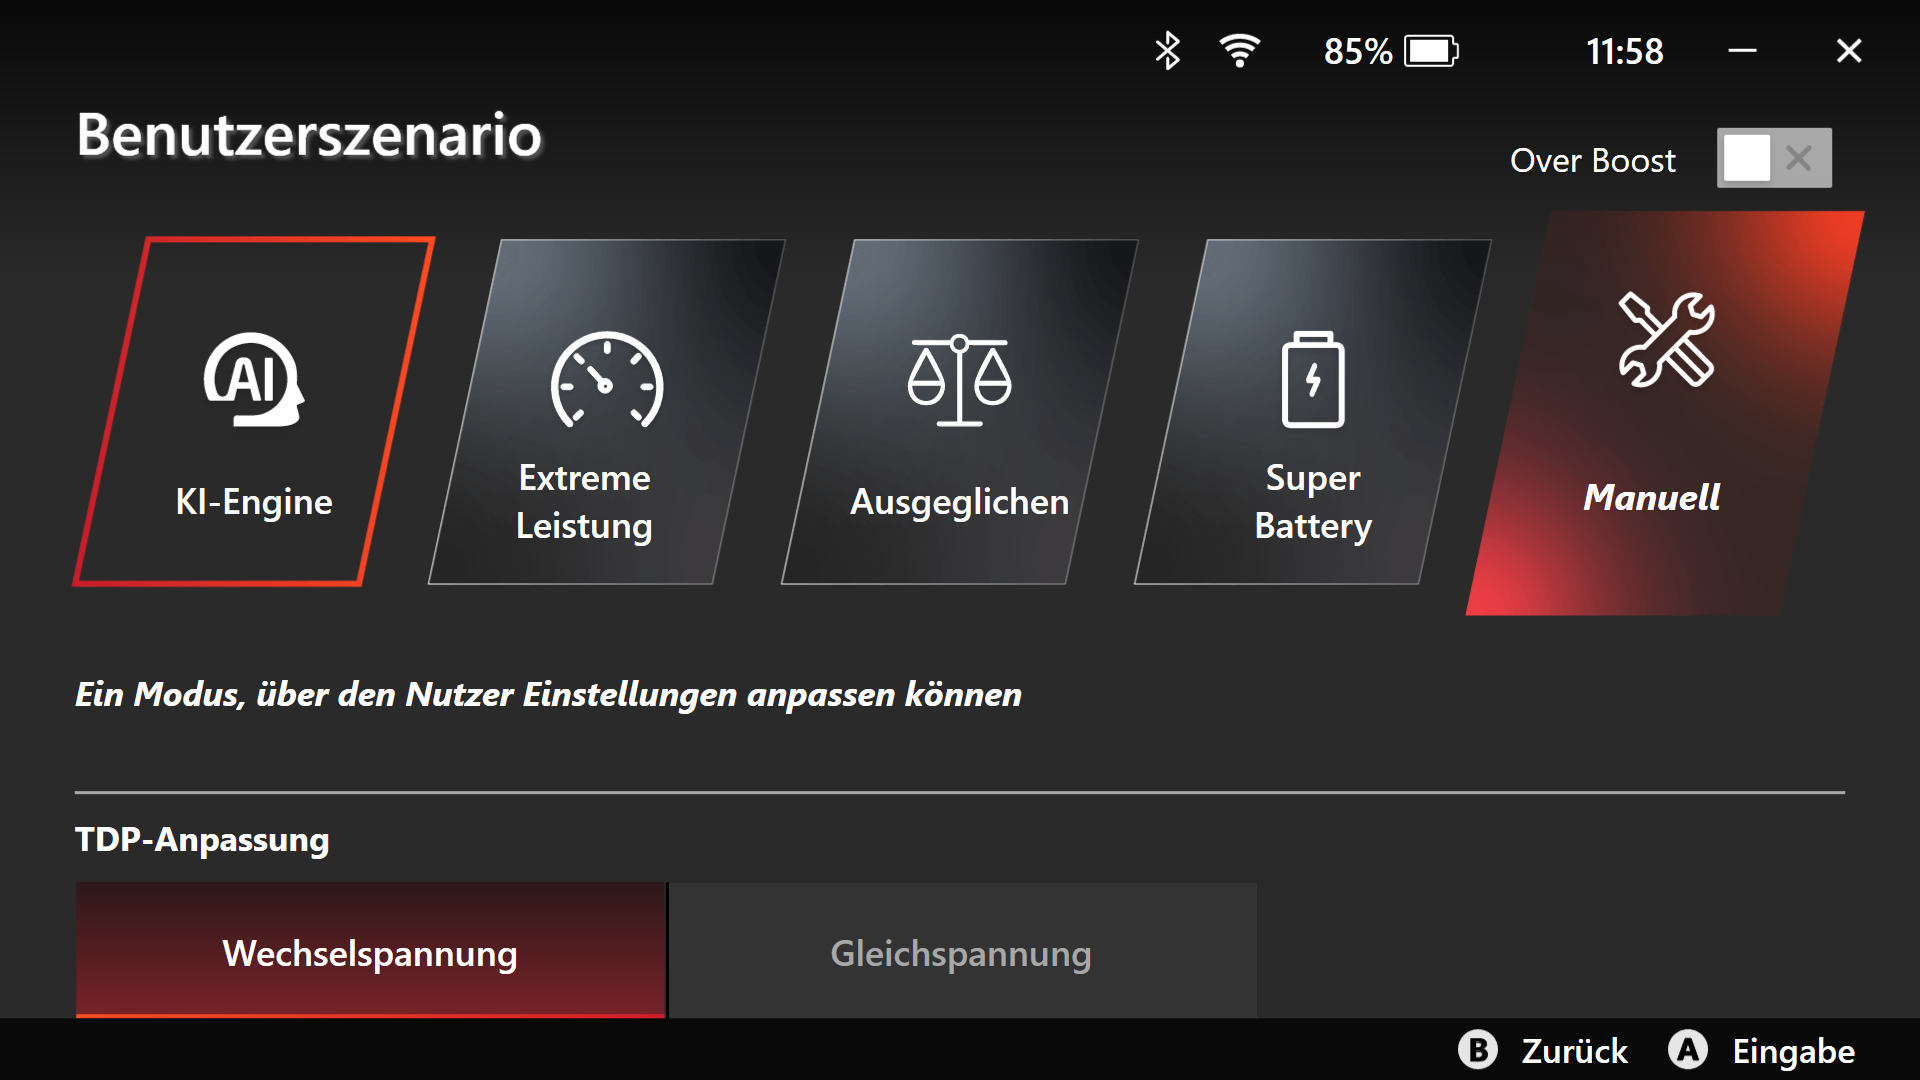
微星提供了多种能源配置文件,其中AI Engine模式默认处于激活状态。它会根据负载情况自动选择最佳设置,我们在以下基准测试中也使用了该模式。我们在下表列出了各种配置文件的 TDP 和性能值。
| 能源概况 | TDP 主电源 | TDP 电池 | CB R23 multi | Time Spy 显卡 | 赛博朋克 2077 1080p 低 | 最大风扇噪音排放 |
|---|---|---|---|---|---|---|
| 超级电池 | 20 瓦 | 20 瓦 | 7,270 点 | 2,581 点 | 23.3fps | 36.6 dB(A) |
| 平衡 | 35 瓦 | 30 瓦 | 12,523 点 | 3,517 点 | 31fps | 45.5 dB(A) |
| AI | 45 -> 43 瓦 | 35 瓦 | 14,463 点 | 3,491 点 | 31fps | 45.5 dB(A) |
| 极限性能 | 45 -> 43 瓦 | 35 瓦 | 14,550 分 | 4,461 分 | 31fps | 48.5 dB(A) |
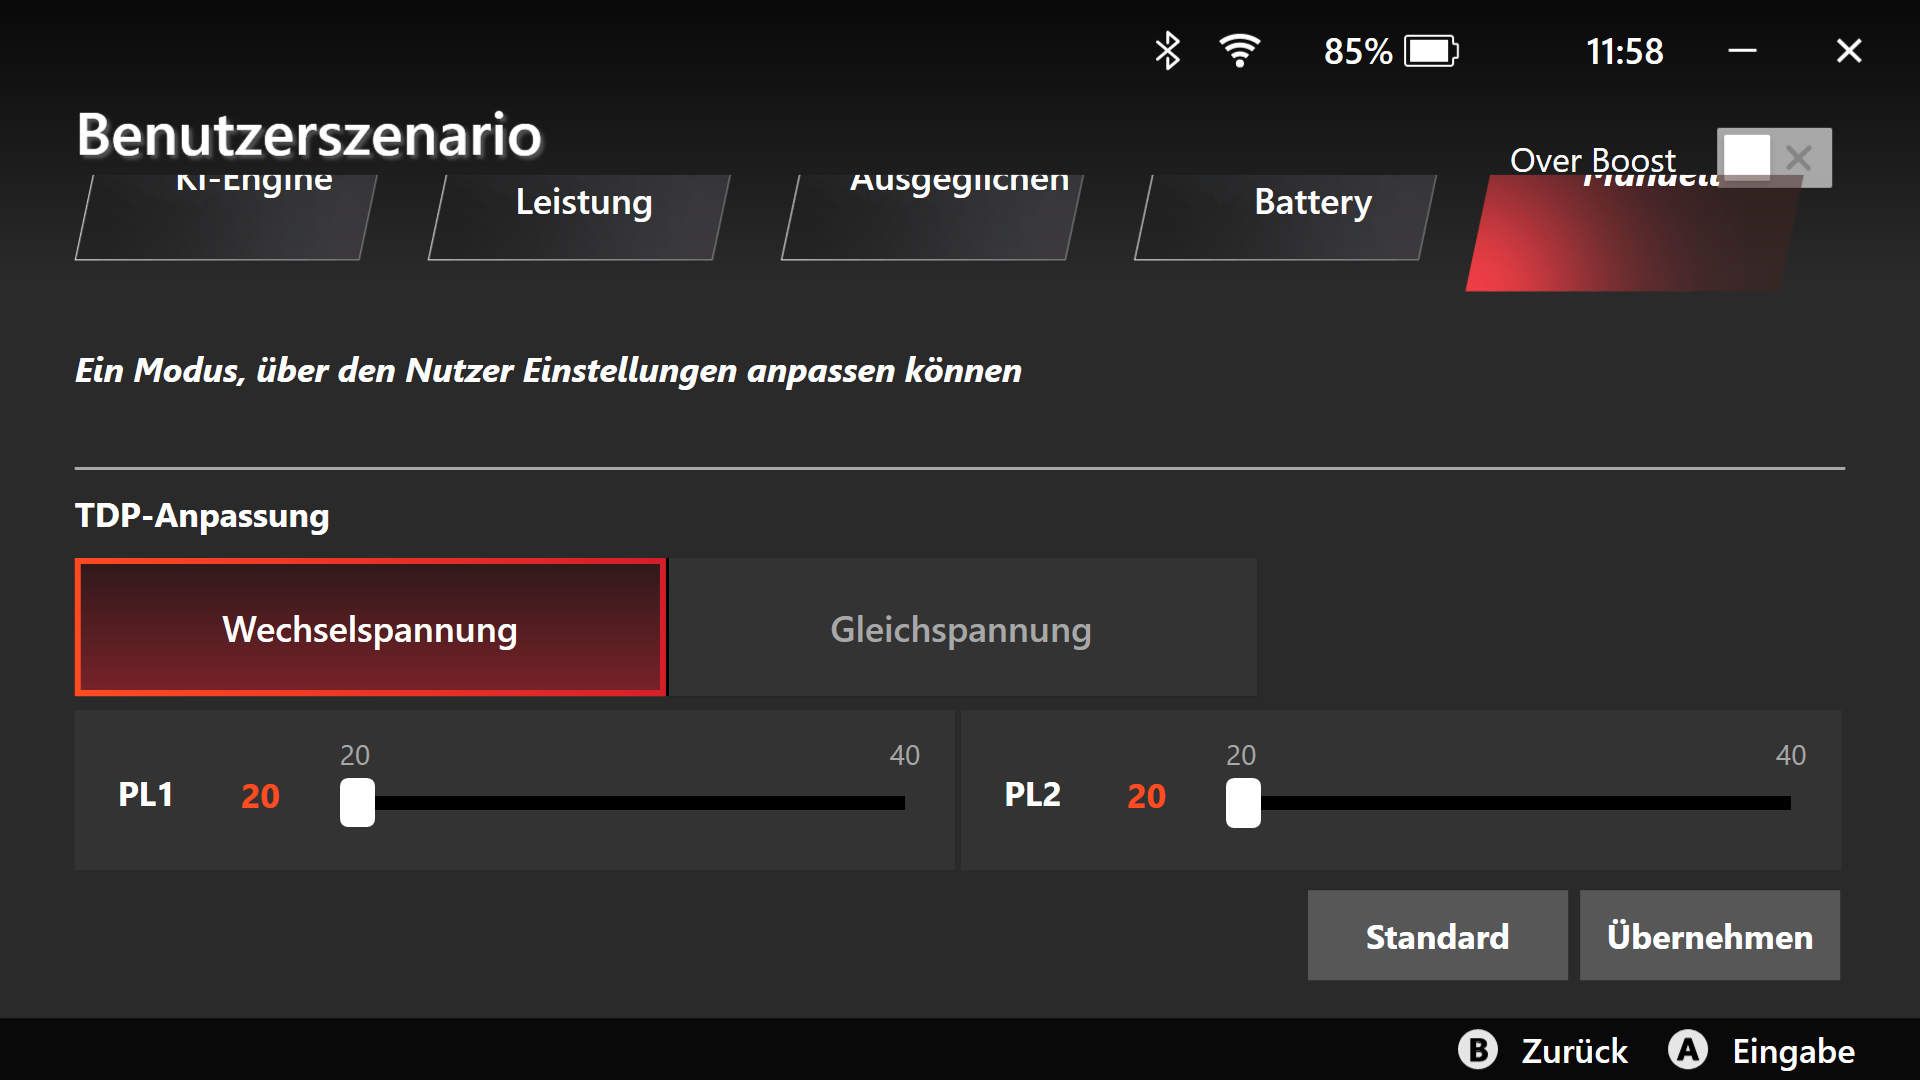
还有一种手动模式,可以调整 TDP 值,但只能在 20-35 瓦的范围内调整,因此也在现有配置文件的范围内。其他手持设备在这方面提供了更大的灵活性。
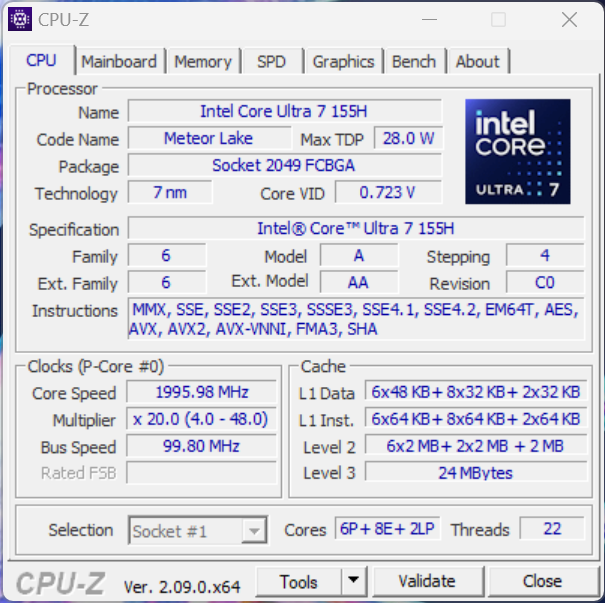
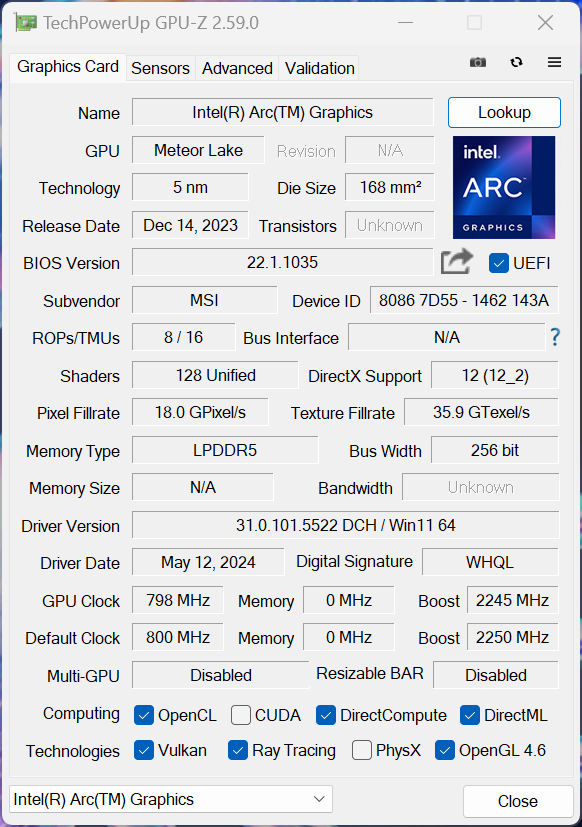
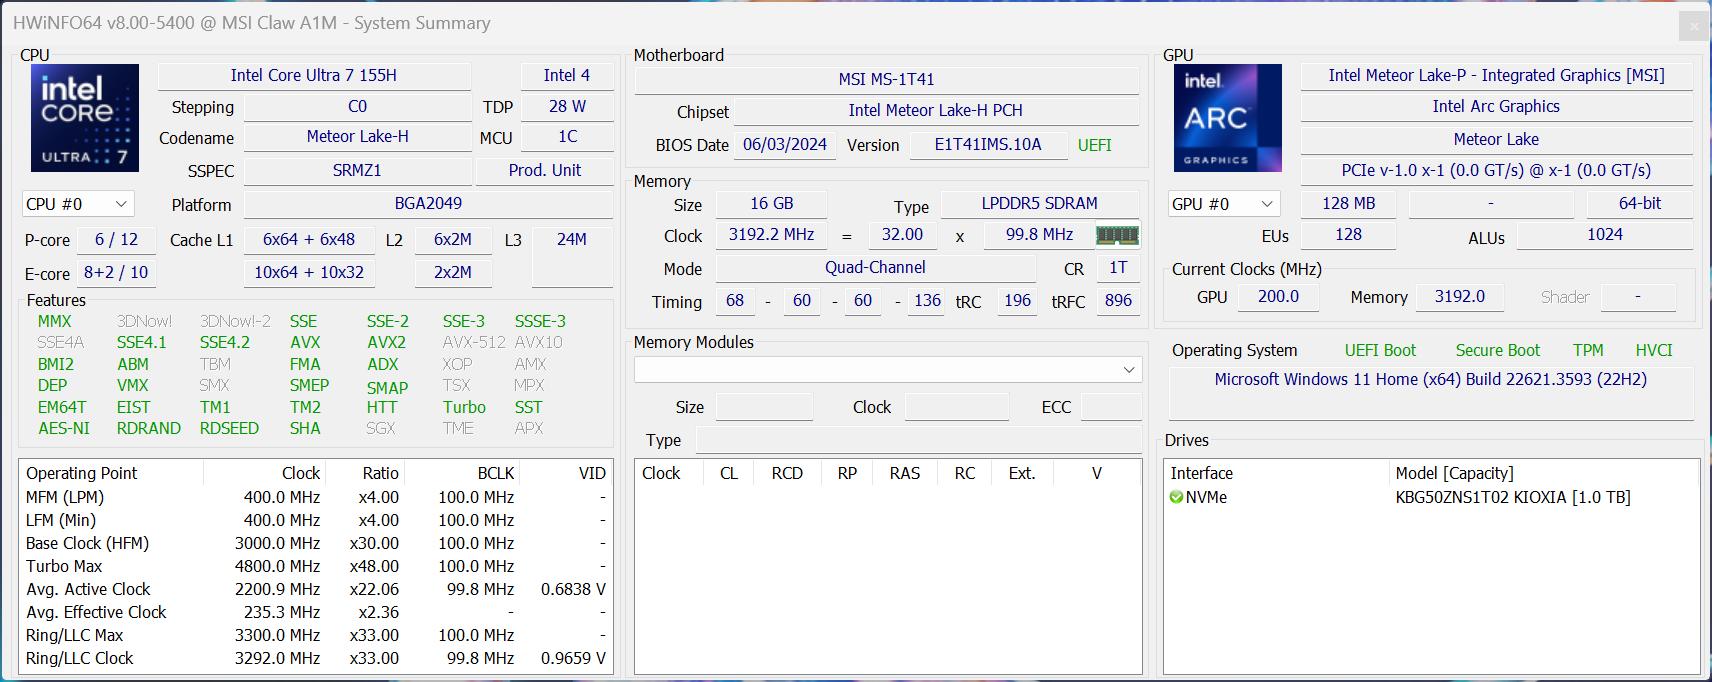
处理器 - Core Ultra 7 155H
酷睿至尊 7 155H 酷睿至强 7 155H英特尔新一代流星湖处理器目前被广泛应用于笔记本电脑。虽然英特尔处理器需要比其他 AMD 手持设备更多的电量才能提供与之相当的性能,但这对于手持设备来说当然并不理想。此外,它的散热装置还有很多工作要做,但我们会在稍后的排放部分详细讨论。在电池运行期间,允许处理器消耗的最大功率为 35 瓦,这就是为什么在这种情况下多核性能会降低约 14%。更多 CPU 基准测试可在我们的 技术部分.
Cinebench R15 Multi continuous test
Cinebench R23: Multi Core | Single Core
Cinebench R20: CPU (Multi Core) | CPU (Single Core)
Cinebench R15: CPU Multi 64Bit | CPU Single 64Bit
Blender: v2.79 BMW27 CPU
7-Zip 18.03: 7z b 4 | 7z b 4 -mmt1
Geekbench 6.5: Multi-Core | Single-Core
Geekbench 5.5: Multi-Core | Single-Core
HWBOT x265 Benchmark v2.2: 4k Preset
LibreOffice : 20 Documents To PDF
R Benchmark 2.5: Overall mean
| CPU Performance rating | |
| Asus ROG Ally Z1 Extreme | |
| Average Intel Core Ultra 7 155H | |
| Lenovo Legion Go -2! | |
| MSI Claw | |
| Ayaneo Kun | |
| ONEXPLAYER 2 Pro AR18 | |
| Average of class Handheld / UMPC | |
| Valve Steam Deck 1 TB OLED -6! | |
| Cinebench R23 / Multi Core | |
| Ayaneo Kun | |
| Average Intel Core Ultra 7 155H (9769 - 19007, n=52) | |
| Asus ROG Ally Z1 Extreme | |
| MSI Claw | |
| ONEXPLAYER 2 Pro AR18 | |
| Lenovo Legion Go | |
| Average of class Handheld / UMPC (4953 - 16841, n=16, last 2 years) | |
| Valve Steam Deck 1 TB OLED | |
| Cinebench R23 / Single Core | |
| Asus ROG Ally Z1 Extreme | |
| MSI Claw | |
| Lenovo Legion Go | |
| ONEXPLAYER 2 Pro AR18 | |
| Average Intel Core Ultra 7 155H (1496 - 1815, n=52) | |
| Average of class Handheld / UMPC (1071 - 2006, n=16, last 2 years) | |
| Ayaneo Kun | |
| Cinebench R20 / CPU (Multi Core) | |
| Ayaneo Kun | |
| Asus ROG Ally Z1 Extreme | |
| Average Intel Core Ultra 7 155H (3798 - 7409, n=50) | |
| ONEXPLAYER 2 Pro AR18 | |
| Lenovo Legion Go | |
| MSI Claw | |
| Average of class Handheld / UMPC (1904 - 6577, n=14, last 2 years) | |
| Valve Steam Deck 1 TB OLED | |
| Cinebench R20 / CPU (Single Core) | |
| Asus ROG Ally Z1 Extreme | |
| MSI Claw | |
| ONEXPLAYER 2 Pro AR18 | |
| Lenovo Legion Go | |
| Average Intel Core Ultra 7 155H (601 - 696, n=50) | |
| Average of class Handheld / UMPC (390 - 787, n=14, last 2 years) | |
| Ayaneo Kun | |
| Valve Steam Deck 1 TB OLED | |
| Cinebench R15 / CPU Multi 64Bit | |
| Average Intel Core Ultra 7 155H (1932 - 2880, n=56) | |
| Ayaneo Kun | |
| Asus ROG Ally Z1 Extreme | |
| ONEXPLAYER 2 Pro AR18 | |
| Lenovo Legion Go | |
| MSI Claw | |
| Average of class Handheld / UMPC (855 - 2533, n=14, last 2 years) | |
| Valve Steam Deck 1 TB OLED | |
| Cinebench R15 / CPU Single 64Bit | |
| Asus ROG Ally Z1 Extreme | |
| Lenovo Legion Go | |
| ONEXPLAYER 2 Pro AR18 | |
| MSI Claw | |
| Average Intel Core Ultra 7 155H (99.6 - 268, n=52) | |
| Ayaneo Kun | |
| Average of class Handheld / UMPC (155.1 - 304, n=14, last 2 years) | |
| Blender / v2.79 BMW27 CPU | |
| Average of class Handheld / UMPC (189 - 588, n=14, last 2 years) | |
| MSI Claw | |
| ONEXPLAYER 2 Pro AR18 | |
| Average Intel Core Ultra 7 155H (175 - 381, n=47) | |
| Asus ROG Ally Z1 Extreme | |
| Ayaneo Kun | |
| 7-Zip 18.03 / 7z b 4 | |
| Asus ROG Ally Z1 Extreme | |
| Ayaneo Kun | |
| Average Intel Core Ultra 7 155H (41739 - 70254, n=50) | |
| Lenovo Legion Go | |
| ONEXPLAYER 2 Pro AR18 | |
| MSI Claw | |
| Average of class Handheld / UMPC (23417 - 66618, n=13, last 2 years) | |
| Valve Steam Deck 1 TB OLED | |
| 7-Zip 18.03 / 7z b 4 -mmt1 | |
| Asus ROG Ally Z1 Extreme | |
| ONEXPLAYER 2 Pro AR18 | |
| Ayaneo Kun | |
| Average Intel Core Ultra 7 155H (4594 - 5621, n=50) | |
| MSI Claw | |
| Average of class Handheld / UMPC (3675 - 6143, n=14, last 2 years) | |
| Valve Steam Deck 1 TB OLED | |
| Geekbench 6.5 / Multi-Core | |
| Average Intel Core Ultra 7 155H (7732 - 13656, n=55) | |
| Asus ROG Ally Z1 Extreme | |
| Lenovo Legion Go | |
| Lenovo Legion Go | |
| MSI Claw | |
| Average of class Handheld / UMPC (3950 - 13426, n=15, last 2 years) | |
| Ayaneo Kun | |
| ONEXPLAYER 2 Pro AR18 | |
| Valve Steam Deck 1 TB OLED | |
| Geekbench 6.5 / Single-Core | |
| Lenovo Legion Go | |
| Lenovo Legion Go | |
| Asus ROG Ally Z1 Extreme | |
| MSI Claw | |
| Average Intel Core Ultra 7 155H (1901 - 2473, n=52) | |
| Average of class Handheld / UMPC (1333 - 2904, n=15, last 2 years) | |
| ONEXPLAYER 2 Pro AR18 | |
| Ayaneo Kun | |
| Valve Steam Deck 1 TB OLED | |
| Geekbench 5.5 / Multi-Core | |
| Average Intel Core Ultra 7 155H (10017 - 13556, n=52) | |
| Asus ROG Ally Z1 Extreme | |
| MSI Claw | |
| Lenovo Legion Go | |
| Lenovo Legion Go | |
| Average of class Handheld / UMPC (3932 - 11975, n=15, last 2 years) | |
| Ayaneo Kun | |
| ONEXPLAYER 2 Pro AR18 | |
| Valve Steam Deck 1 TB OLED | |
| Geekbench 5.5 / Single-Core | |
| Asus ROG Ally Z1 Extreme | |
| Lenovo Legion Go | |
| Lenovo Legion Go | |
| MSI Claw | |
| Average Intel Core Ultra 7 155H (1462 - 1824, n=52) | |
| Average of class Handheld / UMPC (875 - 2134, n=15, last 2 years) | |
| ONEXPLAYER 2 Pro AR18 | |
| Valve Steam Deck 1 TB OLED | |
| Ayaneo Kun | |
| HWBOT x265 Benchmark v2.2 / 4k Preset | |
| Ayaneo Kun | |
| Asus ROG Ally Z1 Extreme | |
| Average Intel Core Ultra 7 155H (9.93 - 21.2, n=50) | |
| Lenovo Legion Go | |
| ONEXPLAYER 2 Pro AR18 | |
| MSI Claw | |
| Average of class Handheld / UMPC (6.21 - 20.8, n=14, last 2 years) | |
| LibreOffice / 20 Documents To PDF | |
| Average of class Handheld / UMPC (41.1 - 92.8, n=14, last 2 years) | |
| ONEXPLAYER 2 Pro AR18 | |
| Ayaneo Kun | |
| Lenovo Legion Go | |
| Average Intel Core Ultra 7 155H (37.5 - 79.2, n=49) | |
| MSI Claw | |
| Asus ROG Ally Z1 Extreme | |
| R Benchmark 2.5 / Overall mean | |
| Average of class Handheld / UMPC (0.4167 - 0.756, n=14, last 2 years) | |
| Ayaneo Kun | |
| Ayaneo Kun | |
| Average Intel Core Ultra 7 155H (0.4457 - 0.53, n=49) | |
| ONEXPLAYER 2 Pro AR18 | |
| MSI Claw | |
| Lenovo Legion Go | |
| Asus ROG Ally Z1 Extreme | |
* ... smaller is better
AIDA64: FP32 Ray-Trace | FPU Julia | CPU SHA3 | CPU Queen | FPU SinJulia | FPU Mandel | CPU AES | CPU ZLib | FP64 Ray-Trace | CPU PhotoWorxx
| Performance rating | |
| Ayaneo Kun | |
| Asus ROG Ally Z1 Extreme | |
| ONEXPLAYER 2 Pro AR18 | |
| Lenovo Legion Go | |
| Average of class Handheld / UMPC | |
| Average Intel Core Ultra 7 155H | |
| MSI Claw | |
| AIDA64 / FP32 Ray-Trace | |
| Ayaneo Kun | |
| Ayaneo Kun | |
| Asus ROG Ally Z1 Extreme | |
| ONEXPLAYER 2 Pro AR18 | |
| ONEXPLAYER 2 Pro AR18 | |
| Lenovo Legion Go | |
| Average of class Handheld / UMPC (6544 - 26450, n=14, last 2 years) | |
| Average Intel Core Ultra 7 155H (6670 - 18470, n=50) | |
| MSI Claw | |
| AIDA64 / FPU Julia | |
| Ayaneo Kun | |
| Ayaneo Kun | |
| Asus ROG Ally Z1 Extreme | |
| ONEXPLAYER 2 Pro AR18 | |
| ONEXPLAYER 2 Pro AR18 | |
| Lenovo Legion Go | |
| Average of class Handheld / UMPC (36464 - 103637, n=14, last 2 years) | |
| Average Intel Core Ultra 7 155H (40905 - 93181, n=50) | |
| MSI Claw | |
| AIDA64 / CPU SHA3 | |
| Ayaneo Kun | |
| Ayaneo Kun | |
| Asus ROG Ally Z1 Extreme | |
| ONEXPLAYER 2 Pro AR18 | |
| ONEXPLAYER 2 Pro AR18 | |
| Lenovo Legion Go | |
| Average Intel Core Ultra 7 155H (1940 - 4436, n=50) | |
| Average of class Handheld / UMPC (1157 - 4484, n=14, last 2 years) | |
| MSI Claw | |
| AIDA64 / CPU Queen | |
| Ayaneo Kun | |
| Ayaneo Kun | |
| Asus ROG Ally Z1 Extreme | |
| ONEXPLAYER 2 Pro AR18 | |
| Lenovo Legion Go | |
| Average Intel Core Ultra 7 155H (64698 - 94181, n=50) | |
| Average of class Handheld / UMPC (41744 - 107867, n=14, last 2 years) | |
| MSI Claw | |
| AIDA64 / FPU SinJulia | |
| Ayaneo Kun | |
| Ayaneo Kun | |
| Asus ROG Ally Z1 Extreme | |
| ONEXPLAYER 2 Pro AR18 | |
| ONEXPLAYER 2 Pro AR18 | |
| Lenovo Legion Go | |
| Average of class Handheld / UMPC (4425 - 16980, n=14, last 2 years) | |
| Average Intel Core Ultra 7 155H (5639 - 10647, n=50) | |
| MSI Claw | |
| AIDA64 / FPU Mandel | |
| Ayaneo Kun | |
| Ayaneo Kun | |
| Asus ROG Ally Z1 Extreme | |
| ONEXPLAYER 2 Pro AR18 | |
| ONEXPLAYER 2 Pro AR18 | |
| Lenovo Legion Go | |
| Average of class Handheld / UMPC (19153 - 55457, n=14, last 2 years) | |
| Average Intel Core Ultra 7 155H (18236 - 47685, n=50) | |
| MSI Claw | |
| AIDA64 / CPU AES | |
| Ayaneo Kun | |
| Ayaneo Kun | |
| ONEXPLAYER 2 Pro AR18 | |
| ONEXPLAYER 2 Pro AR18 | |
| Average Intel Core Ultra 7 155H (45713 - 152179, n=50) | |
| Asus ROG Ally Z1 Extreme | |
| Average of class Handheld / UMPC (18552 - 119040, n=13, last 2 years) | |
| MSI Claw | |
| Lenovo Legion Go | |
| AIDA64 / CPU ZLib | |
| Ayaneo Kun | |
| Ayaneo Kun | |
| Asus ROG Ally Z1 Extreme | |
| Average Intel Core Ultra 7 155H (557 - 1250, n=50) | |
| ONEXPLAYER 2 Pro AR18 | |
| ONEXPLAYER 2 Pro AR18 | |
| MSI Claw | |
| Average of class Handheld / UMPC (356 - 1112, n=14, last 2 years) | |
| Lenovo Legion Go | |
| AIDA64 / FP64 Ray-Trace | |
| Ayaneo Kun | |
| Ayaneo Kun | |
| Asus ROG Ally Z1 Extreme | |
| ONEXPLAYER 2 Pro AR18 | |
| ONEXPLAYER 2 Pro AR18 | |
| Lenovo Legion Go | |
| Average of class Handheld / UMPC (3585 - 14181, n=14, last 2 years) | |
| Average Intel Core Ultra 7 155H (3569 - 9802, n=50) | |
| MSI Claw | |
| AIDA64 / CPU PhotoWorxx | |
| MSI Claw | |
| Average Intel Core Ultra 7 155H (32719 - 54223, n=50) | |
| Average of class Handheld / UMPC (19472 - 54726, n=14, last 2 years) | |
| Asus ROG Ally Z1 Extreme | |
| Lenovo Legion Go | |
| Ayaneo Kun | |
| Ayaneo Kun | |
| ONEXPLAYER 2 Pro AR18 | |
| ONEXPLAYER 2 Pro AR18 | |
系统性能
除了 Windows 的触控操作仍然比较笨拙之外,微星 Claw 是一款配备现代组件的快速设备。在测试过程中,我们也没有遇到死机或其他限制问题。此外,在合成测试中也没有遇到瓶颈。
CrossMark: Overall | Productivity | Creativity | Responsiveness
WebXPRT 3: Overall
WebXPRT 4: Overall
Mozilla Kraken 1.1: Total
| PCMark 10 / Score | |
| Asus ROG Ally Z1 Extreme | |
| Average Intel Core Ultra 7 155H, Intel Arc 8-Core iGPU (4809 - 7529, n=34) | |
| Average of class Handheld / UMPC (3592 - 8082, n=14, last 2 years) | |
| MSI Claw | |
| Lenovo Legion Go | |
| Ayaneo Kun | |
| ONEXPLAYER 2 Pro AR18 | |
| PCMark 10 / Essentials | |
| Average Intel Core Ultra 7 155H, Intel Arc 8-Core iGPU (7605 - 11289, n=34) | |
| Asus ROG Ally Z1 Extreme | |
| Lenovo Legion Go | |
| Average of class Handheld / UMPC (7542 - 11262, n=14, last 2 years) | |
| MSI Claw | |
| Ayaneo Kun | |
| ONEXPLAYER 2 Pro AR18 | |
| PCMark 10 / Productivity | |
| Asus ROG Ally Z1 Extreme | |
| Average of class Handheld / UMPC (5015 - 14802, n=14, last 2 years) | |
| Lenovo Legion Go | |
| Average Intel Core Ultra 7 155H, Intel Arc 8-Core iGPU (6042 - 10591, n=34) | |
| MSI Claw | |
| Ayaneo Kun | |
| ONEXPLAYER 2 Pro AR18 | |
| PCMark 10 / Digital Content Creation | |
| MSI Claw | |
| Ayaneo Kun | |
| Average Intel Core Ultra 7 155H, Intel Arc 8-Core iGPU (4985 - 10709, n=34) | |
| Asus ROG Ally Z1 Extreme | |
| Average of class Handheld / UMPC (3326 - 10026, n=14, last 2 years) | |
| ONEXPLAYER 2 Pro AR18 | |
| Lenovo Legion Go | |
| CrossMark / Overall | |
| Asus ROG Ally Z1 Extreme | |
| MSI Claw | |
| Average Intel Core Ultra 7 155H, Intel Arc 8-Core iGPU (1366 - 1903, n=34) | |
| Average of class Handheld / UMPC (865 - 1847, n=13, last 2 years) | |
| Ayaneo Kun | |
| ONEXPLAYER 2 Pro AR18 | |
| Valve Steam Deck 1 TB OLED | |
| CrossMark / Productivity | |
| Asus ROG Ally Z1 Extreme | |
| MSI Claw | |
| Average Intel Core Ultra 7 155H, Intel Arc 8-Core iGPU (1291 - 1798, n=33) | |
| Average of class Handheld / UMPC (878 - 1719, n=13, last 2 years) | |
| Ayaneo Kun | |
| ONEXPLAYER 2 Pro AR18 | |
| Valve Steam Deck 1 TB OLED | |
| CrossMark / Creativity | |
| Asus ROG Ally Z1 Extreme | |
| Average Intel Core Ultra 7 155H, Intel Arc 8-Core iGPU (1519 - 1929, n=33) | |
| MSI Claw | |
| Average of class Handheld / UMPC (891 - 2077, n=13, last 2 years) | |
| ONEXPLAYER 2 Pro AR18 | |
| Ayaneo Kun | |
| Valve Steam Deck 1 TB OLED | |
| CrossMark / Responsiveness | |
| MSI Claw | |
| Ayaneo Kun | |
| Asus ROG Ally Z1 Extreme | |
| Average Intel Core Ultra 7 155H, Intel Arc 8-Core iGPU (939 - 1802, n=33) | |
| Average of class Handheld / UMPC (759 - 1610, n=13, last 2 years) | |
| ONEXPLAYER 2 Pro AR18 | |
| Valve Steam Deck 1 TB OLED | |
| WebXPRT 3 / Overall | |
| Asus ROG Ally Z1 Extreme | |
| Lenovo Legion Go | |
| Average Intel Core Ultra 7 155H, Intel Arc 8-Core iGPU (252 - 299, n=34) | |
| MSI Claw | |
| Average of class Handheld / UMPC (170.3 - 325, n=15, last 2 years) | |
| ONEXPLAYER 2 Pro AR18 | |
| Ayaneo Kun | |
| Ayaneo Kun | |
| WebXPRT 4 / Overall | |
| Asus ROG Ally Z1 Extreme | |
| MSI Claw | |
| Average Intel Core Ultra 7 155H, Intel Arc 8-Core iGPU (166.4 - 309, n=29) | |
| Average of class Handheld / UMPC (134.4 - 291, n=14, last 2 years) | |
| Ayaneo Kun | |
| Valve Steam Deck 1 TB OLED | |
| Mozilla Kraken 1.1 / Total | |
| Ayaneo Kun | |
| Ayaneo Kun | |
| Average of class Handheld / UMPC (428 - 931, n=14, last 2 years) | |
| Lenovo Legion Go | |
| Average Intel Core Ultra 7 155H, Intel Arc 8-Core iGPU (517 - 614, n=35) | |
| MSI Claw | |
| ONEXPLAYER 2 Pro AR18 | |
* ... smaller is better
| PCMark 10 Score | 6504 points | |
Help | ||
| AIDA64 / Memory Copy | |
| Asus ROG Ally Z1 Extreme | |
| Average Intel Core Ultra 7 155H (62397 - 96791, n=50) | |
| MSI Claw | |
| Average of class Handheld / UMPC (33517 - 107929, n=14, last 2 years) | |
| Lenovo Legion Go | |
| Ayaneo Kun | |
| Ayaneo Kun | |
| ONEXPLAYER 2 Pro AR18 | |
| ONEXPLAYER 2 Pro AR18 | |
| Valve Steam Deck 1 TB OLED | |
| AIDA64 / Memory Read | |
| MSI Claw | |
| Average Intel Core Ultra 7 155H (60544 - 90647, n=50) | |
| Average of class Handheld / UMPC (25476 - 103022, n=14, last 2 years) | |
| Lenovo Legion Go | |
| Asus ROG Ally Z1 Extreme | |
| Ayaneo Kun | |
| ONEXPLAYER 2 Pro AR18 | |
| ONEXPLAYER 2 Pro AR18 | |
| Valve Steam Deck 1 TB OLED | |
| AIDA64 / Memory Write | |
| Lenovo Legion Go | |
| Asus ROG Ally Z1 Extreme | |
| Average of class Handheld / UMPC (25595 - 117883, n=14, last 2 years) | |
| MSI Claw | |
| Average Intel Core Ultra 7 155H (58692 - 93451, n=50) | |
| Ayaneo Kun | |
| Ayaneo Kun | |
| Ayaneo Kun | |
| ONEXPLAYER 2 Pro AR18 | |
| ONEXPLAYER 2 Pro AR18 | |
| Valve Steam Deck 1 TB OLED | |
| AIDA64 / Memory Latency | |
| Average Intel Core Ultra 7 155H (116.2 - 233, n=50) | |
| MSI Claw | |
| Ayaneo Kun | |
| Ayaneo Kun | |
| ONEXPLAYER 2 Pro AR18 | |
| ONEXPLAYER 2 Pro AR18 | |
| Lenovo Legion Go | |
| Average of class Handheld / UMPC (99.8 - 147.6, n=14, last 2 years) | |
| Asus ROG Ally Z1 Extreme | |
| Valve Steam Deck 1 TB OLED | |
* ... smaller is better
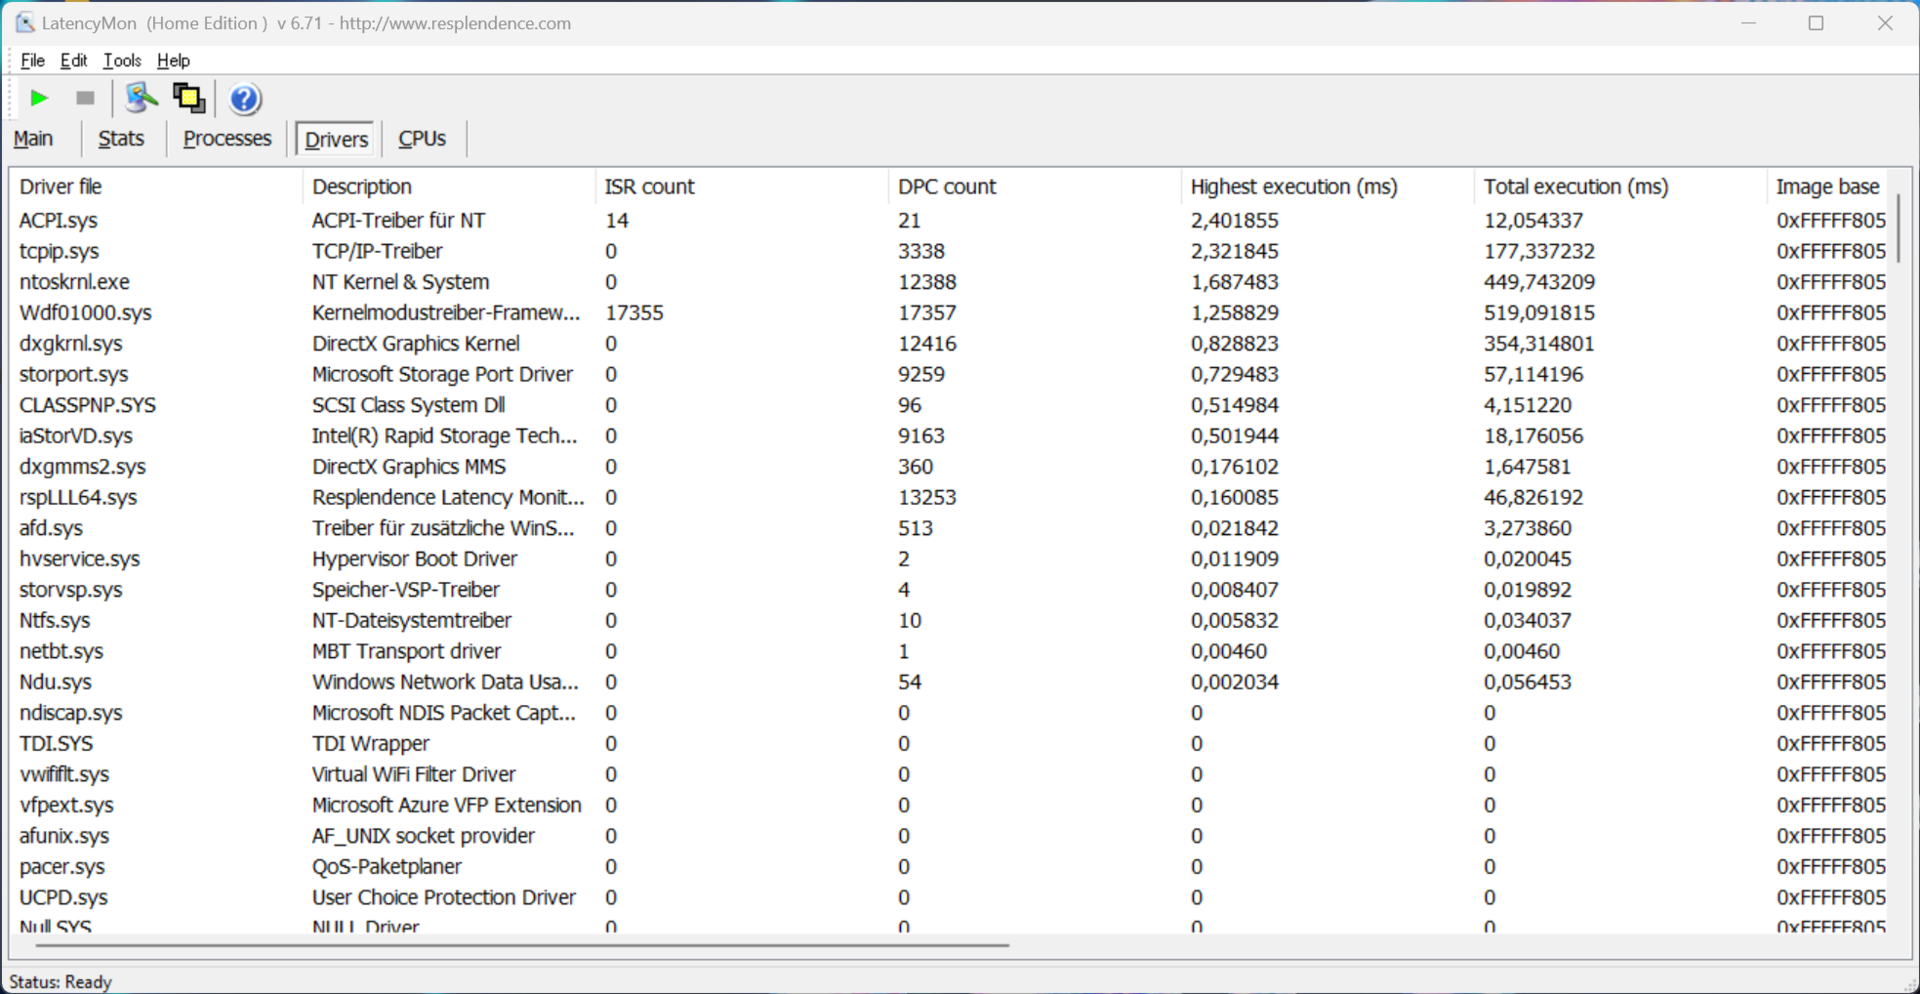
DPC 延迟
在我们的标准化延迟测试(网上冲浪、4K YouTube 播放、CPU 负载)中,使用当前 BIOS 版本的测试设备在使用实时音频应用程序时显示出一些限制。
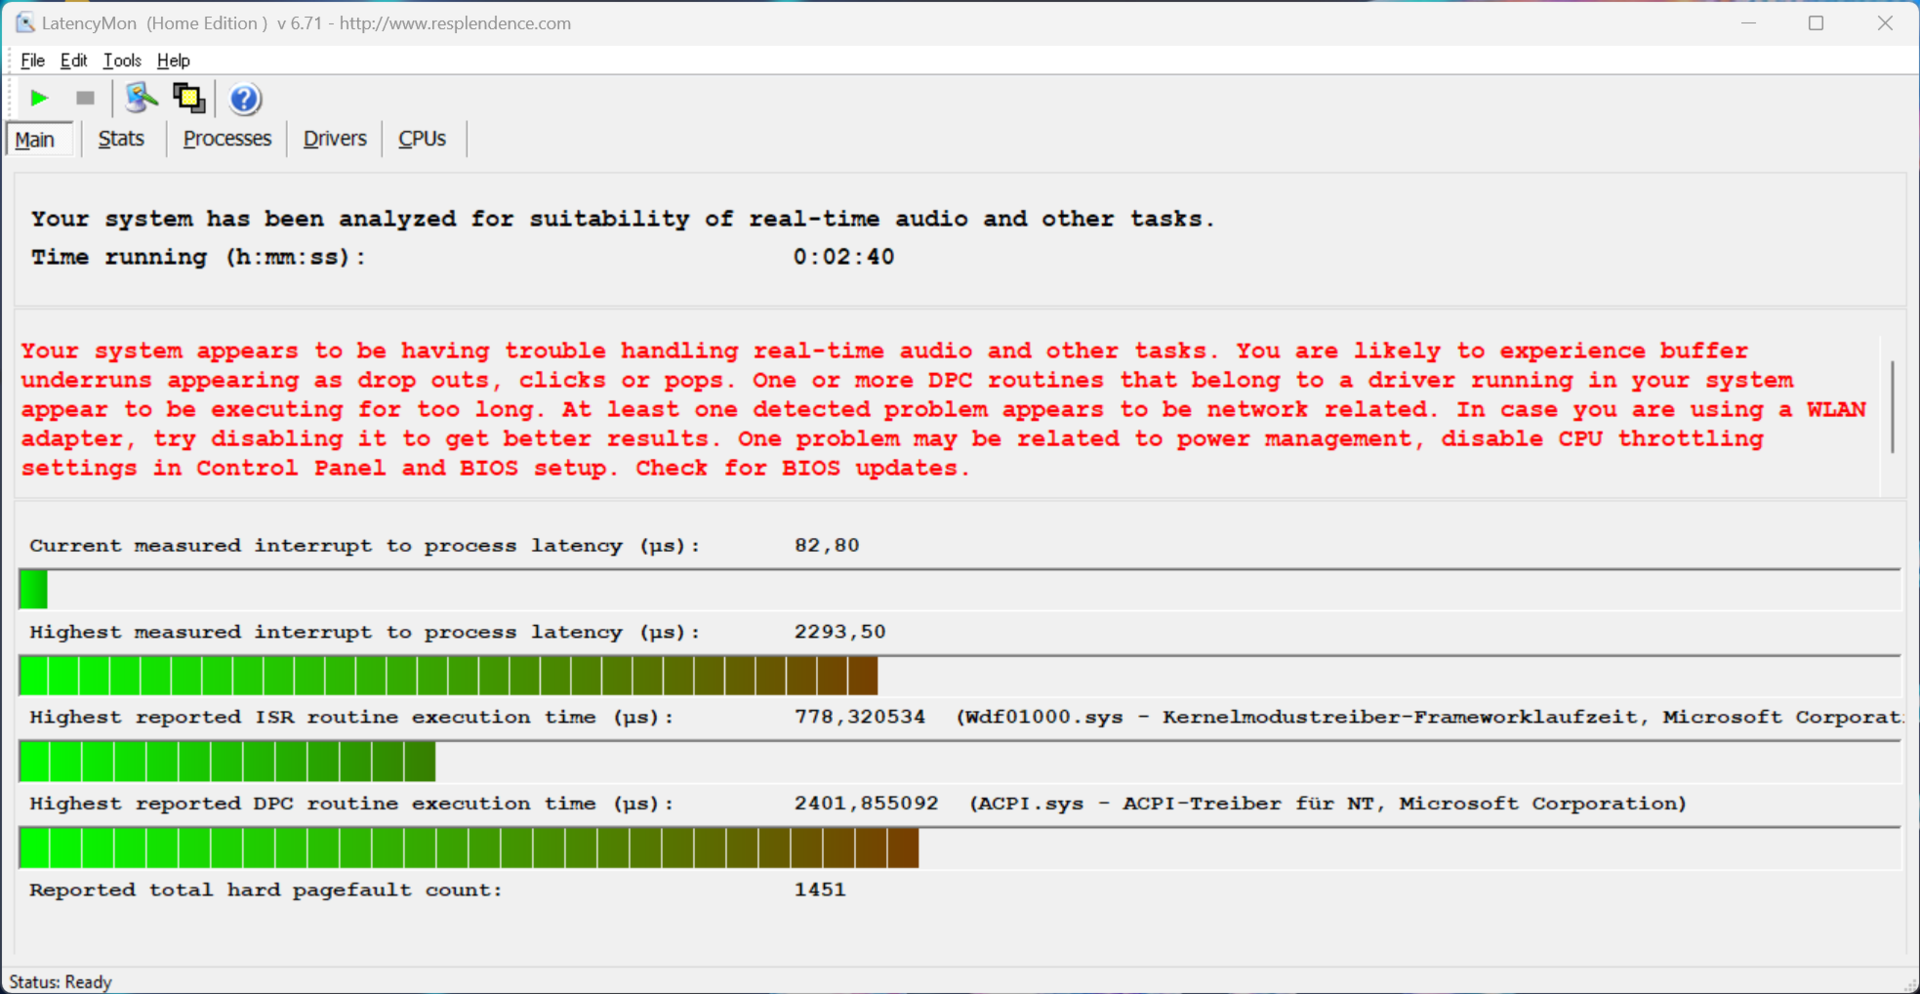
| DPC Latencies / LatencyMon - interrupt to process latency (max), Web, Youtube, Prime95 | |
| MSI Claw | |
| Asus ROG Ally Z1 Extreme | |
| ONEXPLAYER 2 Pro AR18 | |
| Ayaneo Kun | |
* ... smaller is better
存储设备
Claw 配备了一块紧凑型 M.2 2230 固态硬盘(我们使用的是 Kioxia 的 BG5 固态硬盘),存储容量为 1 TB,用户在首次启动设备后可自由使用 871 GB。虽然它是 PCIe 4.0 固态硬盘,但其最大传输速率最多只有 3.5 GB/s,我们的基准测试结果也大多显示在 3 GB/s 左右。不过,对于游戏掌上电脑来说,这已经完全足够了,即使在长时间负载的情况下,我们也没有发现性能下降。更多固态硬盘基准测试 这里。

| Drive Performance rating - Percent | |
| ONEXPLAYER 2 Pro AR18 -11! | |
| Ayaneo Kun | |
| Lenovo Legion Go | |
| Average of class Handheld / UMPC | |
| MSI Claw | |
| Average Kioxia BG5 KBG50ZNS1T02 | |
| Valve Steam Deck 1 TB OLED -11! | |
| Asus ROG Ally Z1 Extreme | |
* ... smaller is better
Reading continuous performance: DiskSpd Read Loop, Queue Depth 8
图形卡
我们的测试设备配备了 英特尔酷睿至尊 7 155H配备了快速 Arc Graphics iGPU配备 8 个 Xe 内核,最高时钟频率可达 2.25 GHz。在合成 3DMark 测试中,英特尔的性能比旧版的 Iris Xe Graphics G7和 AMD 的 Radeon 780M也险胜。iGPU 可以很好地胜任播放高分辨率视频等日常任务。
该设备的图形性能在电池使用和连续负载情况下均保持稳定。更多 GPU 基准测试 这里。
| 3DMark 11 Performance | 12271 points | |
| 3DMark Fire Strike Score | 7988 points | |
| 3DMark Time Spy Score | 3829 points | |
Help | ||
* ... smaller is better
游戏性能
| Performance rating - Percent | |
| Lenovo Legion Go | |
| Average of class Handheld / UMPC | |
| Asus ROG Ally Z1 Extreme | |
| Ayaneo Kun | |
| ONEXPLAYER 2 Pro AR18 | |
| MSI Claw -1! | |
| Valve Steam Deck 1 TB OLED -3! | |
| The Witcher 3 - 1920x1080 Ultra Graphics & Postprocessing (HBAO+) | |
| Ayaneo Kun | |
| ONEXPLAYER 2 Pro AR18 | |
| Lenovo Legion Go | |
| Asus ROG Ally Z1 Extreme | |
| MSI Claw | |
| Average of class Handheld / UMPC (17.5 - 31.1, n=7, last 2 years) | |
| GTA V - 1920x1080 Highest AA:4xMSAA + FX AF:16x | |
| Ayaneo Kun | |
| Ayaneo Kun | |
| Average of class Handheld / UMPC (14 - 32.8, n=13, last 2 years) | |
| Asus ROG Ally Z1 Extreme | |
| ONEXPLAYER 2 Pro AR18 | |
| Lenovo Legion Go | |
| Valve Steam Deck 1 TB OLED | |
| Final Fantasy XV Benchmark - 1920x1080 High Quality | |
| Ayaneo Kun | |
| ONEXPLAYER 2 Pro AR18 | |
| Average of class Handheld / UMPC (17.9 - 34.8, n=20, last 2 years) | |
| Asus ROG Ally Z1 Extreme | |
| Lenovo Legion Go | |
| MSI Claw | |
| Valve Steam Deck 1 TB OLED | |
| Strange Brigade - 1920x1080 ultra AA:ultra AF:16 | |
| Ayaneo Kun | |
| ONEXPLAYER 2 Pro AR18 | |
| Average of class Handheld / UMPC (32.8 - 58.8, n=21, last 2 years) | |
| Asus ROG Ally Z1 Extreme | |
| MSI Claw | |
| Lenovo Legion Go | |
| Valve Steam Deck 1 TB OLED | |
| Dota 2 Reborn - 1920x1080 ultra (3/3) best looking | |
| Lenovo Legion Go | |
| Asus ROG Ally Z1 Extreme | |
| Average of class Handheld / UMPC (30.8 - 85, n=20, last 2 years) | |
| MSI Claw | |
| ONEXPLAYER 2 Pro AR18 | |
| Ayaneo Kun | |
| Ayaneo Kun | |
| X-Plane 11.11 - 1920x1080 high (fps_test=3) | |
| MSI Claw | |
| Average of class Handheld / UMPC (22.7 - 50.5, n=20, last 2 years) | |
| Lenovo Legion Go | |
| Asus ROG Ally Z1 Extreme | |
| ONEXPLAYER 2 Pro AR18 | |
| Ayaneo Kun | |
| Ayaneo Kun | |
| Baldur's Gate 3 | |
| 1920x1080 Medium Preset AA:T | |
| Ayaneo Kun | |
| Asus ROG Ally Z1 Extreme | |
| Average of class Handheld / UMPC (15.7 - 39.8, n=20, last 2 years) | |
| Average Intel Arc 8-Core iGPU (16.3 - 31.1, n=27) | |
| MSI Claw | |
| 1920x1080 High Preset AA:T | |
| Ayaneo Kun | |
| Asus ROG Ally Z1 Extreme | |
| Average of class Handheld / UMPC (13.8 - 33.2, n=19, last 2 years) | |
| Average Intel Arc 8-Core iGPU (15.4 - 27.7, n=26) | |
| MSI Claw | |
Witcher 3 FPS diagram
我们的《 赛博朋克 2077 》循环测试表明,微星手持设备的游戏性能在长时间负载下保持不变。此外,我们还使用各种能耗曲线测试了其游戏性能,并在下表中总结了我们的发现。高效模式 "超级电池 "非常适合较老或要求不高的游戏,否则其性能就会不足。
| 游戏(1080p) | 超级电池 | 均衡 | AI | 极致性能 |
|---|---|---|---|---|
| Witcher 3 (超) | 20.7fps | 25.8fps | 25.6fps | 25.6fps |
| 远征 5》(超) | 28fps | 32fps | 34fps | 33fps |
| 古墓丽影:暗影》(超) | 23fps | 27fps | 27fps | 26fps |
| GTA V》(高) | 34.2fps | 40.8fps | 39.6fps | 39.6fps |
| 赛博朋克 2077》(低) | 23.3fps | 31fps | 30.9fps | 31.1fps |
| 博德斯之门 3》(低) | 28.7fps | 33.1fps | 31.7fps | 33.3fps |
| low | med. | high | ultra | |
|---|---|---|---|---|
| GTA V (2015) | 158.1 | 147.9 | 39.6 | |
| The Witcher 3 (2015) | 135 | 51 | 25.6 | |
| Dota 2 Reborn (2015) | 98.6 | 84.1 | 67.4 | 63.6 |
| Final Fantasy XV Benchmark (2018) | 58.5 | 35.9 | 25.4 | |
| X-Plane 11.11 (2018) | 51.6 | 45.1 | 38.9 | |
| Far Cry 5 (2018) | 67 | 40 | 37 | 34 |
| Strange Brigade (2018) | 163 | 71 | 59 | 46 |
| Shadow of the Tomb Raider (2018) | 69 | 33 | 31 | 27 |
| F1 23 (2023) | 64.4 | 59.4 | 41.2 | |
| Baldur's Gate 3 (2023) | 31.7 | 24.8 | 20.7 | 20.3 |
| Cyberpunk 2077 (2023) | 30.9 | 25.3 | 21.9 | 19.8 |
| Horizon Forbidden West (2024) | 52 | 34 | 29 | 25 |
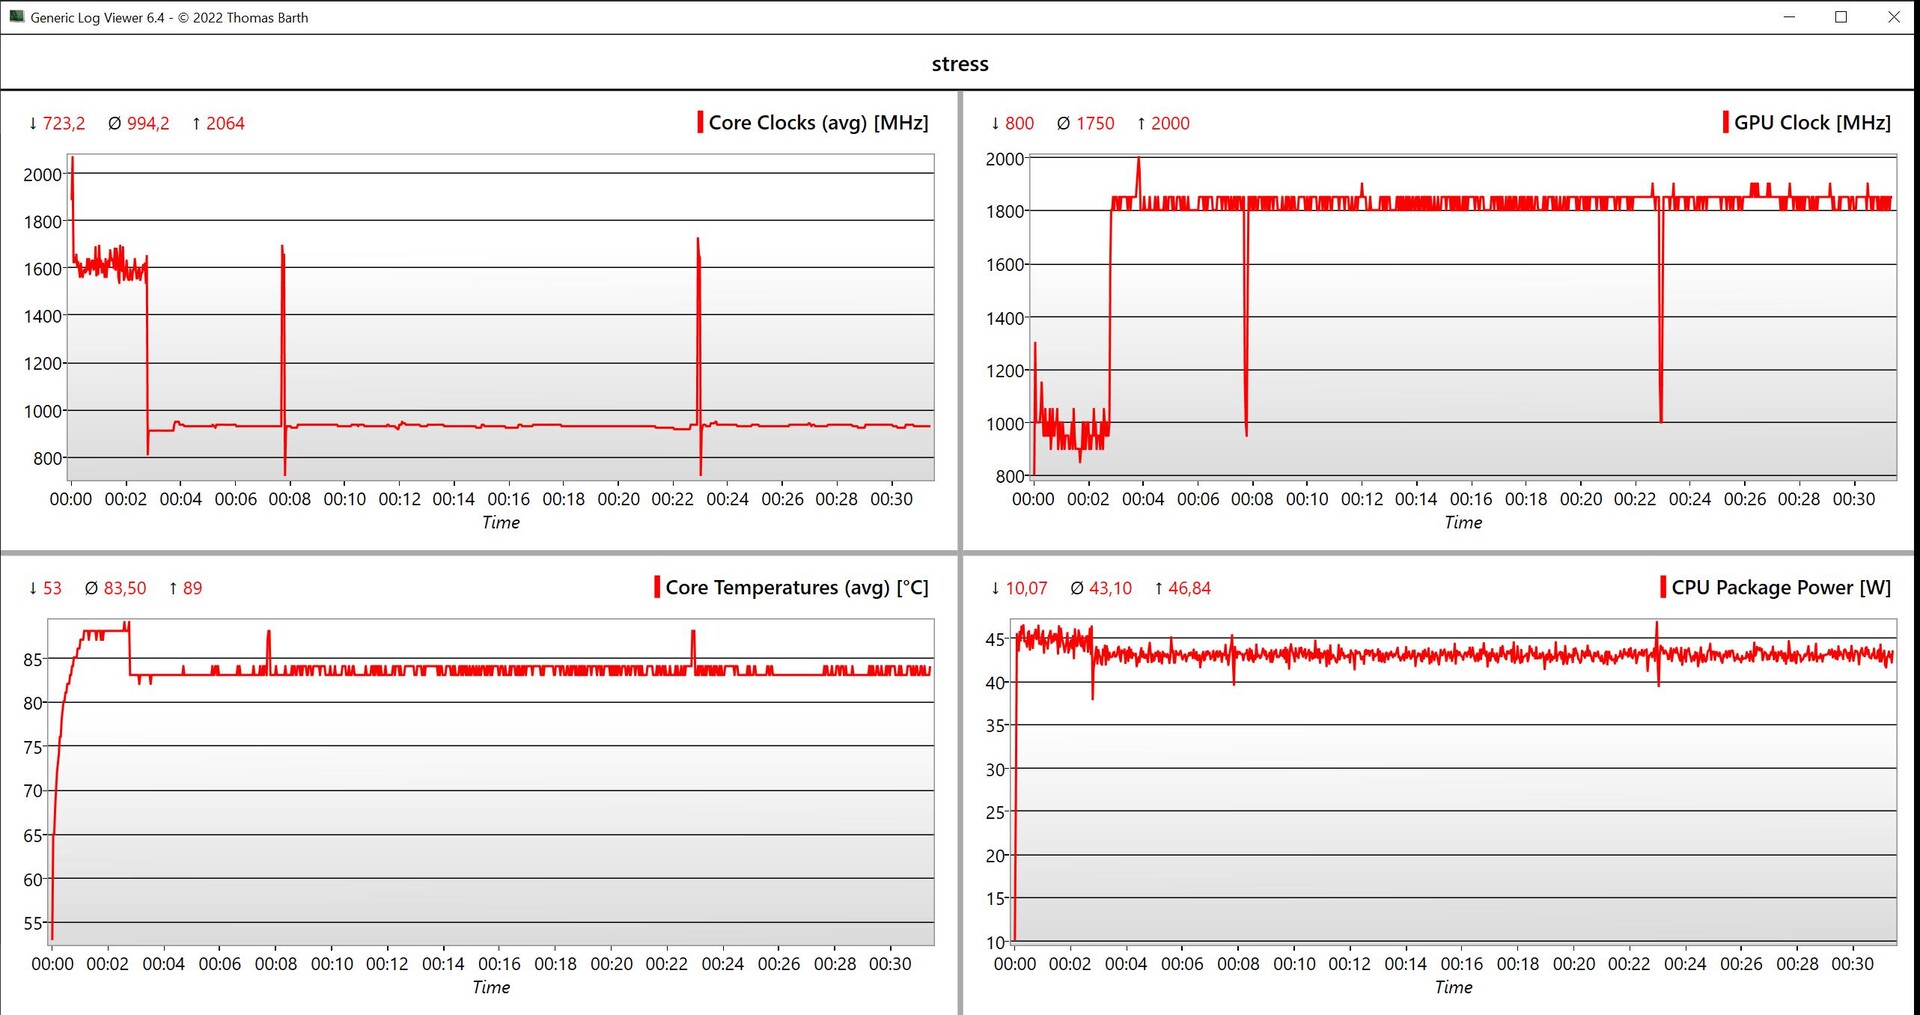
排放物 - 烦人的风扇
噪音排放
由两个风扇组成的散热装置设法维持了英特尔处理器的高功率极限,但其结果是游戏手持设备的风扇几乎一直在运转--即使在使用最高效模式时也是如此。真正停用风扇的情况比较少见,正常情况下,即使手持设备处于空转状态,也会发出嘶嘶声。在负载情况下,情况会变得更糟,微星魔爪也会成为噪音最大的设备之一。我们在游戏时测得的噪音为 45-48 dB(A),而在使用最高效的超级电池模式(20 瓦 TDP)时仍略低于 37 dB(A)。
| 能量曲线 | 赛博朋克 2077 自由魅影 | 压力测试 | 最大电池工作状态 |
|---|---|---|---|
| 超级电池 | 36.6 dB(A) | 36.6 dB(A) | 36.6 dB(A) |
| 平衡 | 45.5 dB(A) | 45.5 dB(A) | 45.5 dB(A) |
| AI | 45.5 dB(A) | 45.5 dB(A) | 45.5 dB(A) |
| 极端性能 | 48.5 dB(A) | 48.5 dB(A) | 46.3 dB(A) |
Noise level
| Idle |
| 25.7 / 31.7 / 31.7 dB(A) |
| Load |
| 36.6 / 45.5 dB(A) |
 | ||
30 dB silent 40 dB(A) audible 50 dB(A) loud |
||
min: | ||
| MSI Claw Arc 8-Core, Ultra 7 155H, Kioxia BG5 KBG50ZNS1T02 | Valve Steam Deck 1 TB OLED Radeon Radeon Steam Deck 8CU, Steam Deck OLED APU, Phison ESMP001TKB5C3 | Lenovo Legion Go Radeon 780M, Z1 Extreme, WD PC SN740 512GB SDDPMQD-512G-1101 | Asus ROG Ally Z1 Extreme Radeon 780M, Z1 Extreme, Micron 2400 MTFDKBK512QFM | ONEXPLAYER 2 Pro AR18 Radeon 780M, R7 7840U | Ayaneo Kun Radeon 780M, R7 7840U, Phison M.2 2280 E18 4000GB | |
|---|---|---|---|---|---|---|
| Noise | 12% | 15% | 11% | 9% | 1% | |
| off / environment * (dB) | 25.7 | 24.7 4% | 23 11% | 23.3 9% | 24.4 5% | |
| Idle Minimum * (dB) | 25.7 | 25 3% | 23 11% | 23.3 9% | 24.4 5% | 25.31 2% |
| Idle Average * (dB) | 31.7 | 25 21% | 23 27% | 23.3 26% | 24.4 23% | 25.31 20% |
| Idle Maximum * (dB) | 31.7 | 25 21% | 25 21% | 27.3 14% | 30.6 3% | 34.5 -9% |
| Load Average * (dB) | 36.6 | 31.3 14% | 37 -1% | 39.2 -7% | 36 2% | 34.9 5% |
| Cyberpunk 2077 ultra * (dB) | 45.5 | |||||
| Load Maximum * (dB) | 45.5 | 40.8 10% | 37 19% | 39.2 14% | 39.3 14% | 50.78 -12% |
| Witcher 3 ultra * (dB) | 46 | 39.2 |
* ... smaller is better
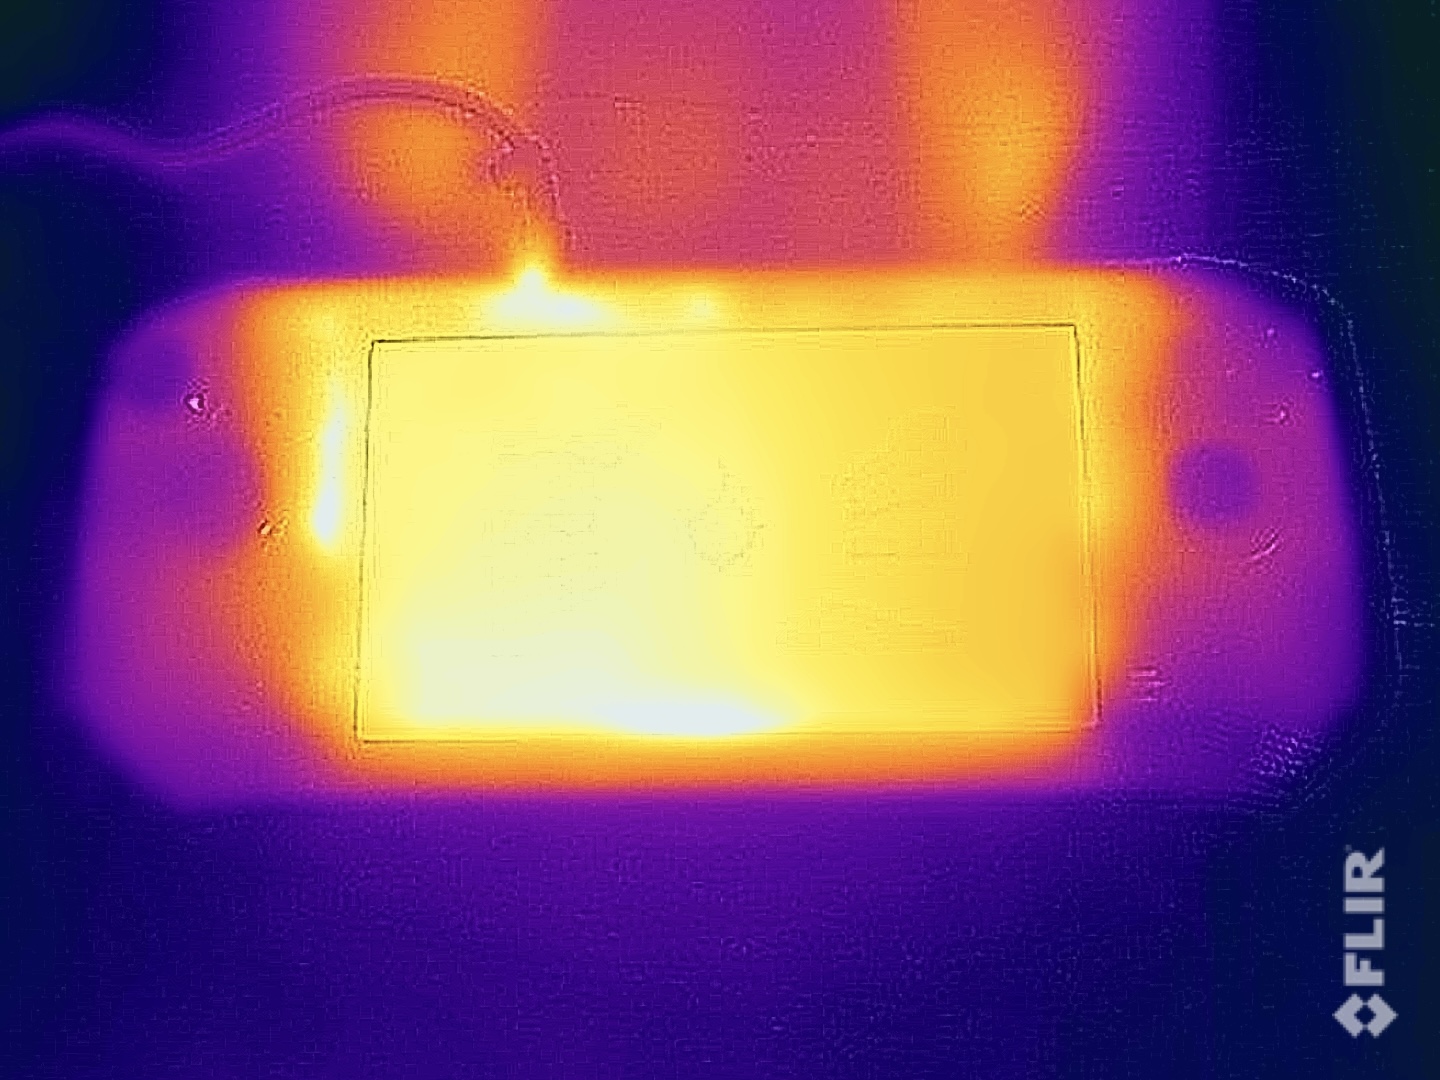
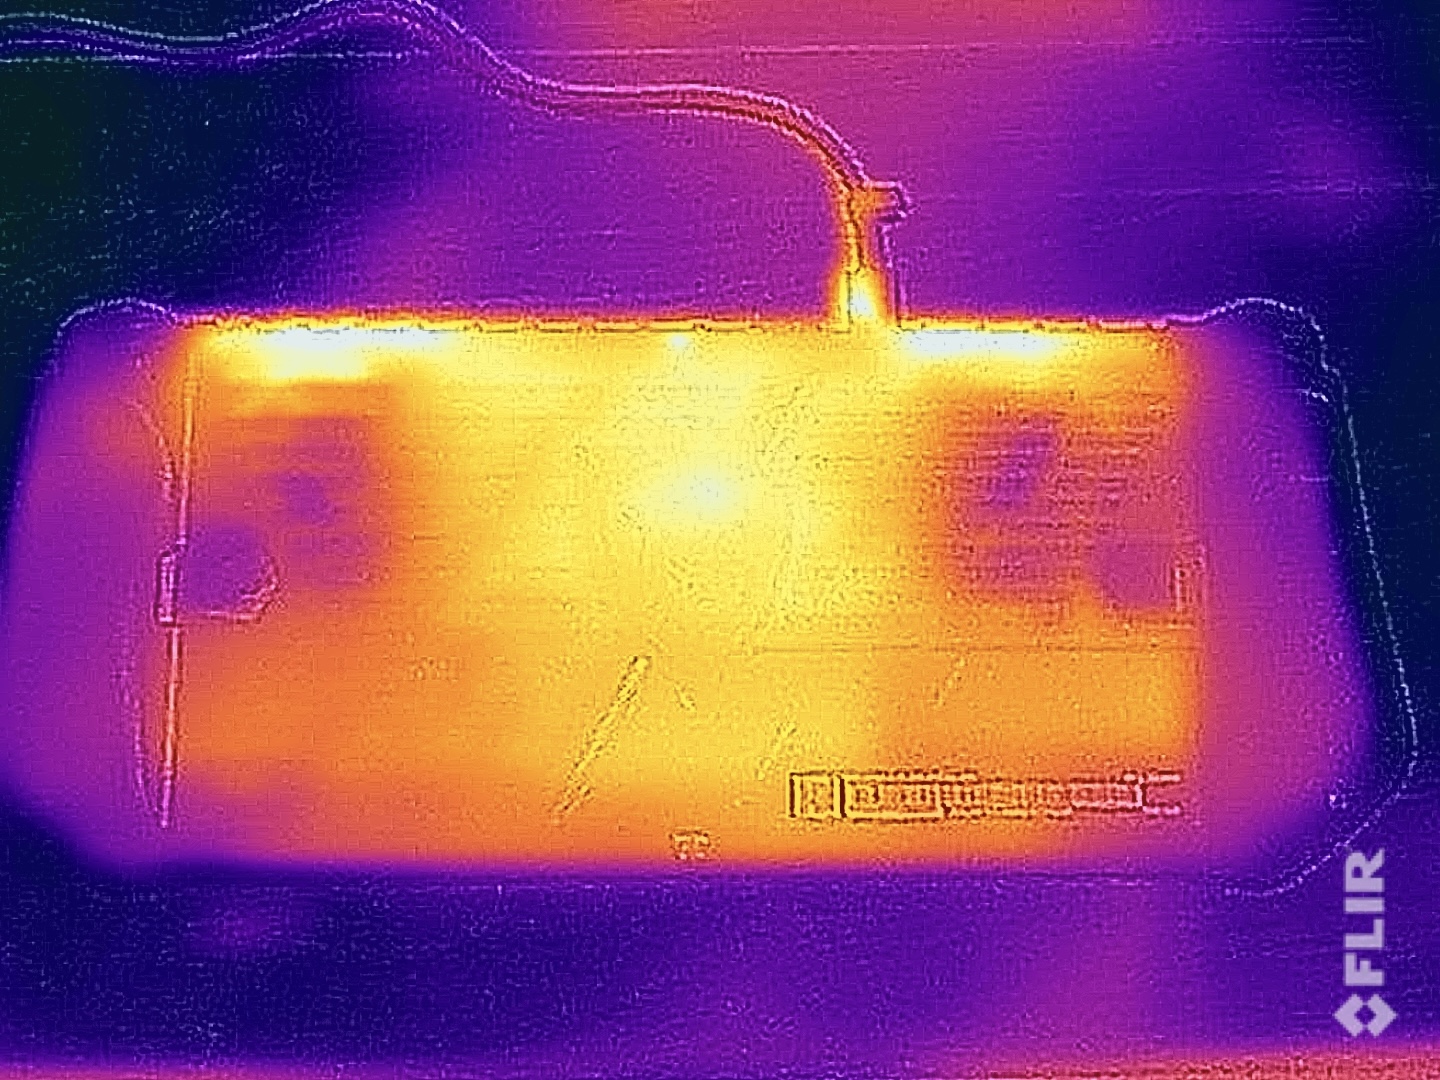
温度
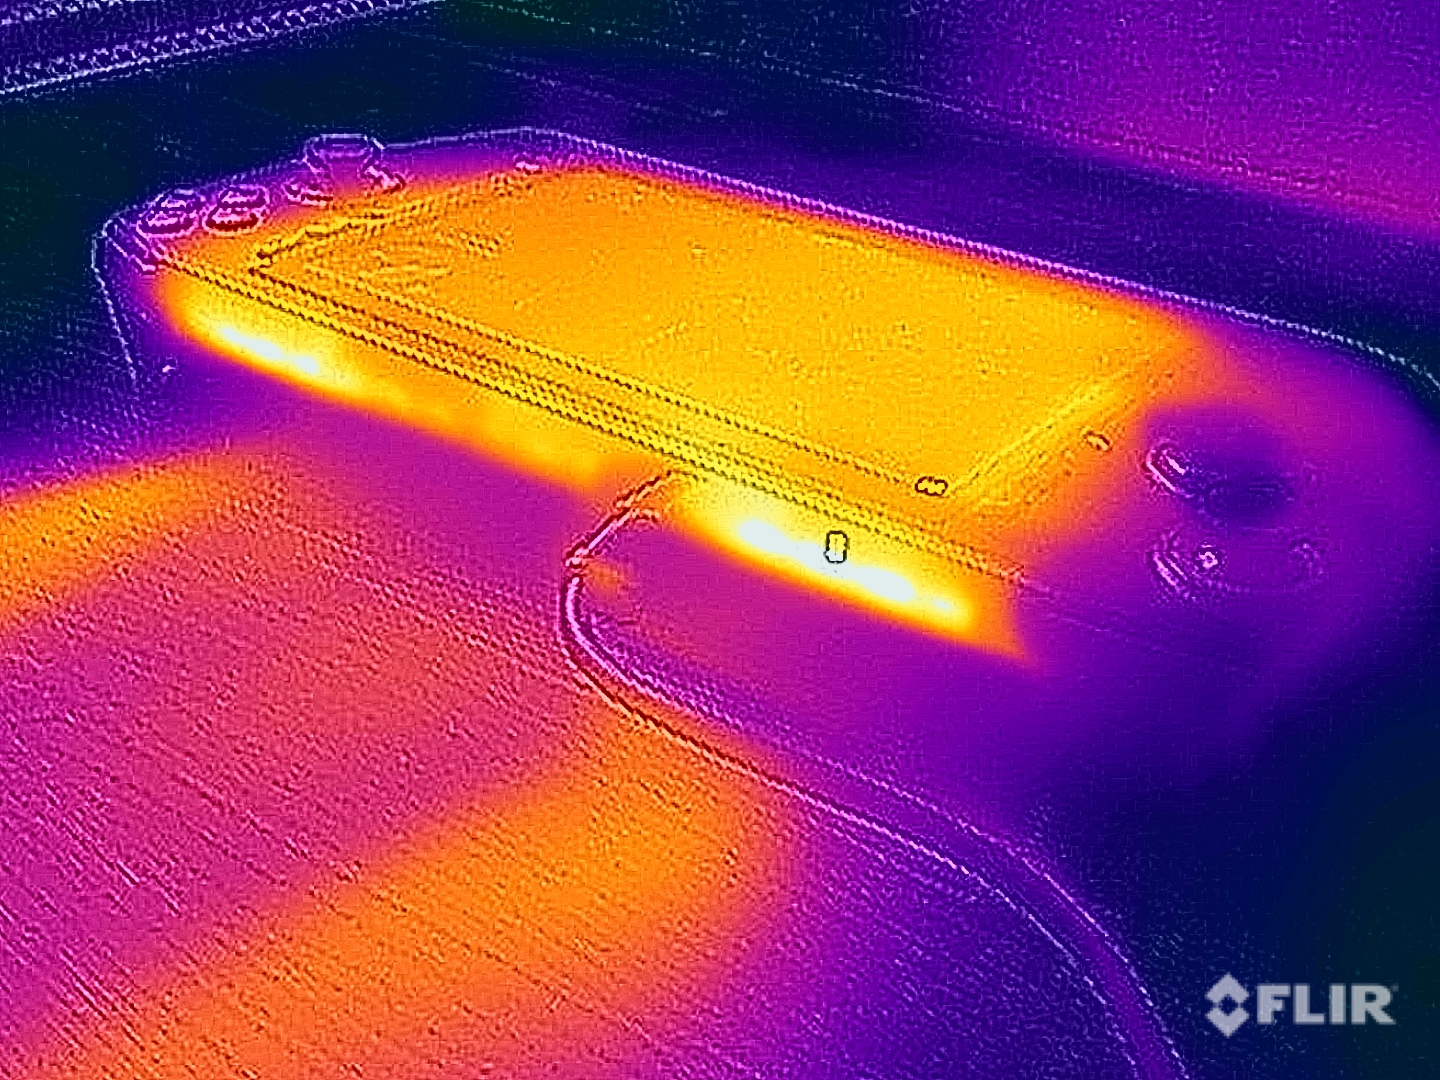
Claw 中部区域的发热量很大,但这并不重要,因为手柄始终保持凉爽,而且我们在玩游戏时没有发现任何限制。风扇出风口位于顶部,因此不碍事。在压力测试中,处理器的运行功率曾一度达到 45 瓦,然后稳定在 43 瓦。
(±) The maximum temperature on the upper side is 41.8 °C / 107 F, compared to the average of 38 °C / 100 F, ranging from 26.6 to 55 °C for the class Handheld / UMPC.
(+) The bottom heats up to a maximum of 35.9 °C / 97 F, compared to the average of 37.1 °C / 99 F
(+) In idle usage, the average temperature for the upper side is 30.9 °C / 88 F, compared to the device average of 32.8 °C / 91 F.
(-) 3: The average temperature for the upper side is 39.9 °C / 104 F, compared to the average of 32.8 °C / 91 F for the class Handheld / UMPC.
(-) The palmrests and touchpad can get very hot to the touch with a maximum of 41.8 °C / 107.2 F.
(-) The average temperature of the palmrest area of similar devices was 32.2 °C / 90 F (-9.6 °C / -17.2 F).
发言人
MSI Claw audio analysis
(+) | speakers can play relatively loud (87.2 dB)
Bass 100 - 315 Hz
(-) | nearly no bass - on average 17.2% lower than median
(±) | linearity of bass is average (9.2% delta to prev. frequency)
Mids 400 - 2000 Hz
(+) | balanced mids - only 4.3% away from median
(+) | mids are linear (4.3% delta to prev. frequency)
Highs 2 - 16 kHz
(+) | balanced highs - only 3.7% away from median
(+) | highs are linear (4.5% delta to prev. frequency)
Overall 100 - 16.000 Hz
(+) | overall sound is linear (14.9% difference to median)
Compared to same class
» 26% of all tested devices in this class were better, 9% similar, 65% worse
» The best had a delta of 12%, average was 17%, worst was 23%
Compared to all devices tested
» 20% of all tested devices were better, 4% similar, 76% worse
» The best had a delta of 4%, average was 24%, worst was 134%
Asus ROG Ally Z1 Extreme audio analysis
(+) | speakers can play relatively loud (82.1 dB)
Bass 100 - 315 Hz
(-) | nearly no bass - on average 15.5% lower than median
(±) | linearity of bass is average (8.4% delta to prev. frequency)
Mids 400 - 2000 Hz
(+) | balanced mids - only 3.1% away from median
(+) | mids are linear (3% delta to prev. frequency)
Highs 2 - 16 kHz
(+) | balanced highs - only 1.9% away from median
(+) | highs are linear (2.3% delta to prev. frequency)
Overall 100 - 16.000 Hz
(+) | overall sound is linear (13.5% difference to median)
Compared to same class
» 28% of all tested devices in this class were better, 4% similar, 68% worse
» The best had a delta of 5%, average was 17%, worst was 45%
Compared to all devices tested
» 14% of all tested devices were better, 4% similar, 82% worse
» The best had a delta of 4%, average was 24%, worst was 134%
Lenovo Legion Go audio analysis
(±) | speaker loudness is average but good (73.1 dB)
Bass 100 - 315 Hz
(-) | nearly no bass - on average 16.4% lower than median
(±) | linearity of bass is average (8.1% delta to prev. frequency)
Mids 400 - 2000 Hz
(±) | higher mids - on average 5.2% higher than median
(+) | mids are linear (6% delta to prev. frequency)
Highs 2 - 16 kHz
(±) | higher highs - on average 5.7% higher than median
(±) | linearity of highs is average (9.7% delta to prev. frequency)
Overall 100 - 16.000 Hz
(±) | linearity of overall sound is average (22.7% difference to median)
Compared to same class
» 91% of all tested devices in this class were better, 4% similar, 4% worse
» The best had a delta of 12%, average was 17%, worst was 23%
Compared to all devices tested
» 67% of all tested devices were better, 6% similar, 28% worse
» The best had a delta of 4%, average was 24%, worst was 134%
Valve Steam Deck 1 TB OLED audio analysis
(+) | speakers can play relatively loud (82.7 dB)
Bass 100 - 315 Hz
(-) | nearly no bass - on average 22% lower than median
(±) | linearity of bass is average (14.7% delta to prev. frequency)
Mids 400 - 2000 Hz
(+) | balanced mids - only 1% away from median
(+) | mids are linear (2.1% delta to prev. frequency)
Highs 2 - 16 kHz
(+) | balanced highs - only 1.9% away from median
(+) | highs are linear (6.1% delta to prev. frequency)
Overall 100 - 16.000 Hz
(+) | overall sound is linear (12.9% difference to median)
Compared to same class
» 13% of all tested devices in this class were better, 9% similar, 78% worse
» The best had a delta of 12%, average was 17%, worst was 23%
Compared to all devices tested
» 12% of all tested devices were better, 3% similar, 85% worse
» The best had a delta of 4%, average was 24%, worst was 134%
电源管理 - 电池寿命短
耗电量
微星的游戏手持设备并不特别高效。在全亮状态下,测试设备空闲时的耗电量已经达到 12 瓦。在压力测试中,它只在瞬间达到 65 瓦,几秒钟后才平衡在 54 瓦左右。在游戏时,它的功率也达到了 55 瓦左右,因此附带的 65 瓦电源已经足够强劲。
| Off / Standby | |
| Idle | |
| Load |
|
Key:
min: | |
| MSI Claw Ultra 7 155H, Arc 8-Core, Kioxia BG5 KBG50ZNS1T02, IPS, 1920x1080, 7" | Valve Steam Deck 1 TB OLED Steam Deck OLED APU, Radeon Radeon Steam Deck 8CU, Phison ESMP001TKB5C3, OLED, 1280x800, 7.4" | Lenovo Legion Go Z1 Extreme, Radeon 780M, WD PC SN740 512GB SDDPMQD-512G-1101, IPS, 2560x1600, 8.8" | Asus ROG Ally Z1 Extreme Z1 Extreme, Radeon 780M, Micron 2400 MTFDKBK512QFM, IPS, 1920x1080, 7" | ONEXPLAYER 2 Pro AR18 R7 7840U, Radeon 780M, , IPS, 2560x1600, 8.4" | Ayaneo Kun R7 7840U, Radeon 780M, Phison M.2 2280 E18 4000GB, IPS, 2560x1600, 8.4" | Average Intel Arc 8-Core iGPU | Average of class Handheld / UMPC | |
|---|---|---|---|---|---|---|---|---|
| Power Consumption | 42% | -13% | 26% | 16% | -58% | 5% | 18% | |
| Idle Minimum * (Watt) | 7.8 | 4.5 42% | 11.5 -47% | 4.2 46% | 6.66 15% | 14 -79% | 5.36 ? 31% | 6.15 ? 21% |
| Idle Average * (Watt) | 11.5 | 7.21 37% | 12 -4% | 6.1 47% | 7.11 38% | 17.56 -53% | 8.53 ? 26% | 8.59 ? 25% |
| Idle Maximum * (Watt) | 11.8 | 9.66 18% | 17.4 -47% | 6.3 47% | 11.7 1% | 27 -129% | 11.8 ? -0% | 10.3 ? 13% |
| Load Average * (Watt) | 53.1 | 22.86 57% | 45 15% | 56.6 -7% | 46.708 12% | 38.1 28% | 53.7 ? -1% | 44.2 ? 17% |
| Cyberpunk 2077 ultra * (Watt) | 54.4 | |||||||
| Load Maximum * (Watt) | 64.6 | 27.8 57% | 54 16% | 67.2 -4% | 56.7 12% | 101 -56% | 84.4 ? -31% | 57.1 ? 12% |
| Witcher 3 ultra * (Watt) | 42.6 | 64.1 | 53.1 | 83.5 |
* ... smaller is better
Power consumption Witcher 3 / stress test
运行时间
微星在该设备中安装了一块 53 瓦时的电池,因此我们当然要进行正常的电池测试。在 WLAN 测试中,两款产品的表现不相上下,但在视频测试中,Claw 手持设备不得不向电池容量更小的 ROG Ally 认输。另一方面,更重要的是玩游戏时的电池续航时间,在玩 AAA 级游戏时,测试大约进行了 80 分钟就结束了。使用 "超级电池"模式(20 瓦 TDP)可以玩得更久一些,但这样就必须进一步降低分辨率和细节,像《赛博朋克 2077》这样的游戏即使在低细节的 1080p 下也无法流畅运行。另一方面,对于模拟器来说,我们希望能手动进一步降低 TDP,以便让运行时间达到数小时。在设备开启的情况下,充满电需要 106 分钟;大约一小时后,80% 的电量可以恢复。
| MSI Claw Ultra 7 155H, Arc 8-Core, 53 Wh | Valve Steam Deck 1 TB OLED Steam Deck OLED APU, Radeon Radeon Steam Deck 8CU, 50 Wh | Lenovo Legion Go Z1 Extreme, Radeon 780M, 49.2 Wh | Asus ROG Ally Z1 Extreme Z1 Extreme, Radeon 780M, 40 Wh | ONEXPLAYER 2 Pro AR18 R7 7840U, Radeon 780M, 65 Wh | Ayaneo Kun R7 7840U, Radeon 780M, 75 Wh | Average of class Handheld / UMPC | |
|---|---|---|---|---|---|---|---|
| Battery runtime | 19% | -23% | 4% | 38% | -5% | 41% | |
| H.264 (h) | 8.8 | 9.5 8% | 14.2 ? 61% | ||||
| WiFi v1.3 (h) | 7.8 | 9.3 19% | 6 -23% | 7.8 0% | 10.8 38% | 10 28% | 11.4 ? 46% |
| Cyberpunk 2077 ultra 150cd (h) | 1.3 | ||||||
| Load (h) | 1.3 | 0.8 -38% | 1.513 ? 16% | ||||
| Witcher 3 ultra (h) | 1 | 1.2 | 1.7 |
Pros
Cons
结论--微星魔爪因英特尔流星湖处理器而受挫


在我们的全面测试中,MSI Claw 游戏掌上电脑并未给我们留下深刻印象。总体而言,它的概念与一年多前发布的配备 7 英寸显示屏的华硕 ROG Ally 相似。不过,微星没有采用 AMD 芯片,而是采用了英特尔 Meteor Lake 处理器。这带来了一些问题,也说明了为什么其他制造商没有采取同样的路线。尽管功耗较高,但它的游戏性能却比其他 AMD 手持设备稍差,同时,它的散热装置也很吃力。风扇几乎总是处于工作状态,总的来说,Claw 是市场上噪音最大的掌上电脑之一。
另一方面,微星Claw在其他方面,如操纵杆/按钮和游戏软件,给我们留下了良好的印象。它的屏幕整体表现不错,即使我们希望看到可变的刷新率。此外,如果能增加一个 USB 接口就更好了。理论上,它的 M.2 2230 固态硬盘是可以更换的,但要更换的话,就必须拆开整个机箱,装回去时甚至还得重新贴上散热膏。
微星Claw游戏掌机深刻地证明了目前的英特尔CPU并不适合游戏掌机。与 AMD 竞争对手相比,英特尔掌机的游戏性能较弱,而且价格较高,因此不值得推荐。
微星似乎已经发现了这一问题,在发布 Claw 仅三个月后,就发布了它的 继任者它将配备更大的显示屏、更高效的英特尔 Lunar Lake 处理器和更快的 iGPU。不过,这款产品的发布还需要几个月的时间。
由于其超过 800 美元的高价,购买 Claw 手持设备完全没有意义。更大的 Legion Go售价仅为 750 美元(使用较小的固态硬盘),甚至连 ROG Ally的价格也低于 700 美元。此外,它的继任者 ROG Ally X-已经在下个月推出,它将有重大改进(更舒适的外壳、80 瓦时电池、1 TB M.2 2280 固态硬盘、24 GB 内存、2 倍 USB),售价仅不到 1000 美元。最新的 蒸汽甲板 OLED固态硬盘的价格也便宜很多,约为 630 美元。
请注意:我们已经更新了评级系统,第 8 版的结果与第 7 版的结果不具可比性。
价格和供应情况
目前,我们测试的微星Claw配置为512GB固态硬盘,可在亚马逊以649美元的优惠价格购买。
MSI Claw
- 06/19/2024 v8
Andreas Osthoff
Transparency
The selection of devices to be reviewed is made by our editorial team. The test sample was provided to the author as a loan by the manufacturer or retailer for the purpose of this review. The lender had no influence on this review, nor did the manufacturer receive a copy of this review before publication. There was no obligation to publish this review. As an independent media company, Notebookcheck is not subjected to the authority of manufacturers, retailers or publishers.
This is how Notebookcheck is testing
Every year, Notebookcheck independently reviews hundreds of laptops and smartphones using standardized procedures to ensure that all results are comparable. We have continuously developed our test methods for around 20 years and set industry standards in the process. In our test labs, high-quality measuring equipment is utilized by experienced technicians and editors. These tests involve a multi-stage validation process. Our complex rating system is based on hundreds of well-founded measurements and benchmarks, which maintains objectivity. Further information on our test methods can be found here.
Price comparison

