

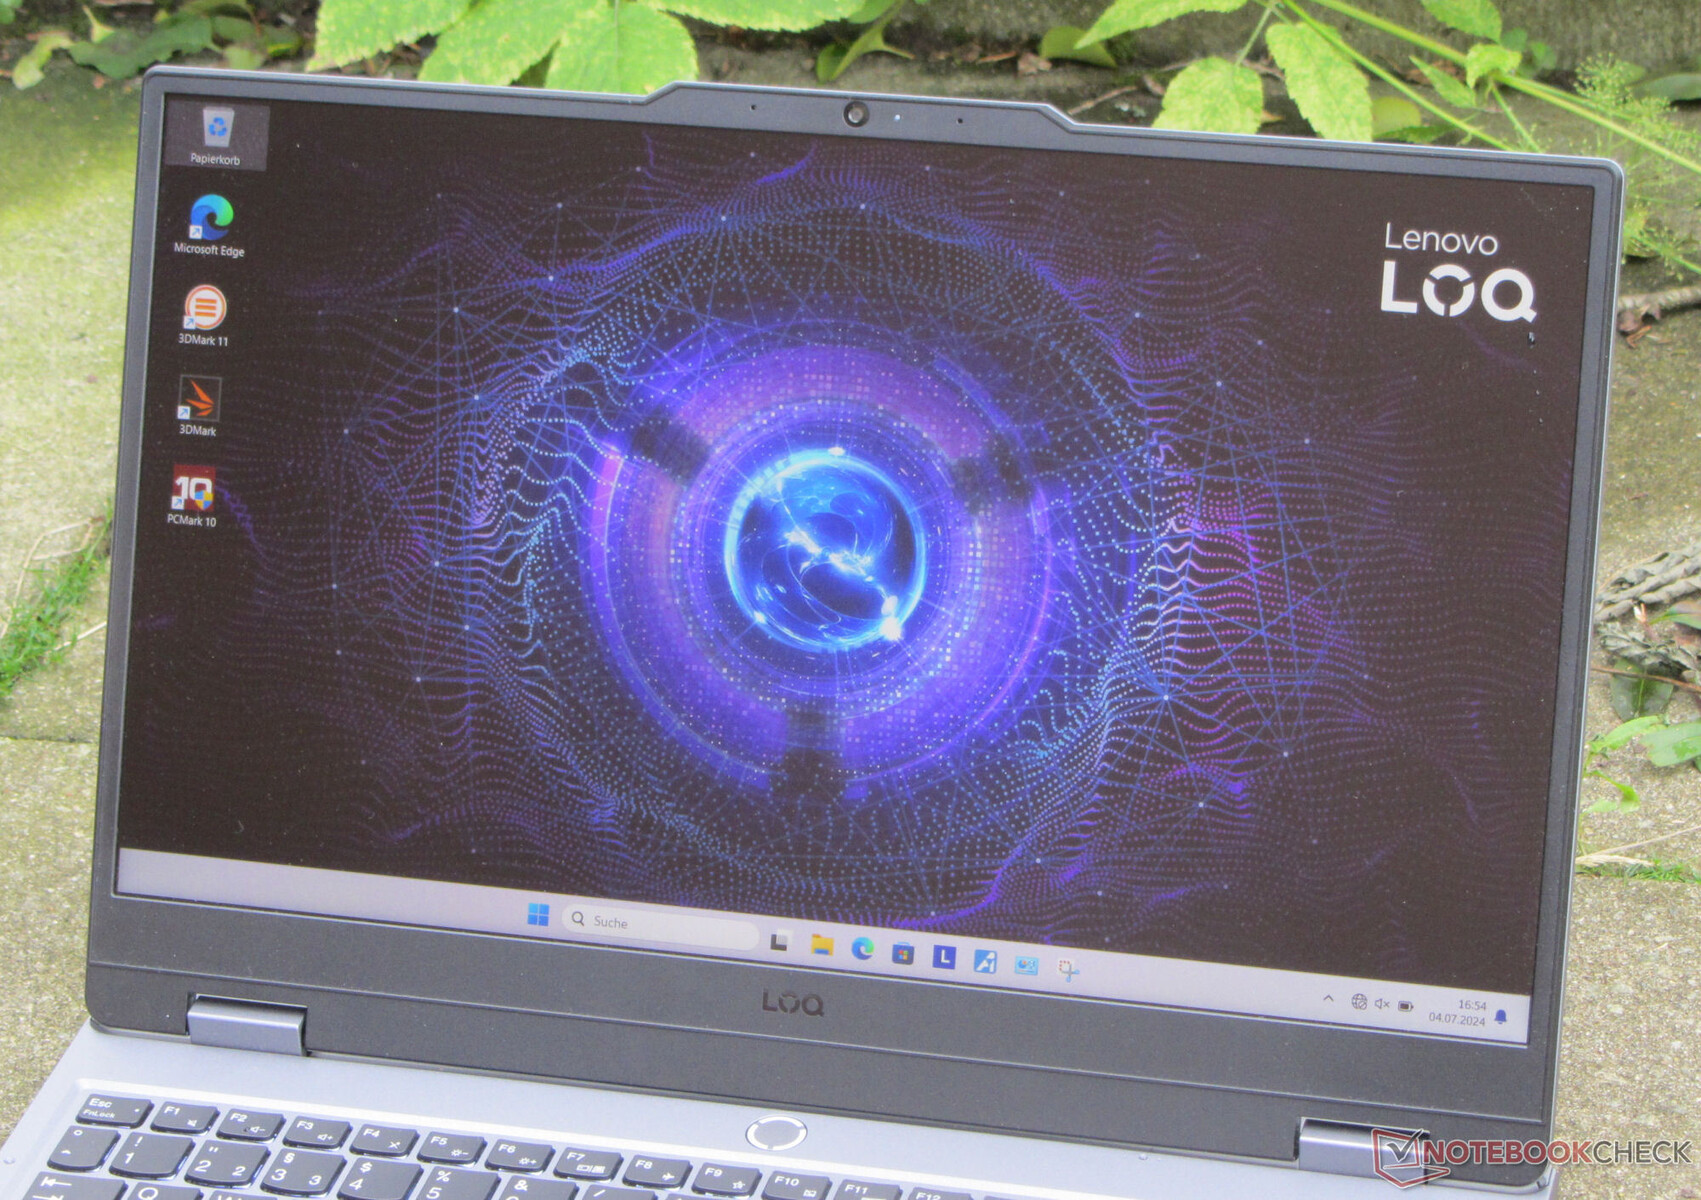
联想LOQ 15评测:配备 RTX 4060 的全高清游戏笔记本电脑,售价约 1,000 美元
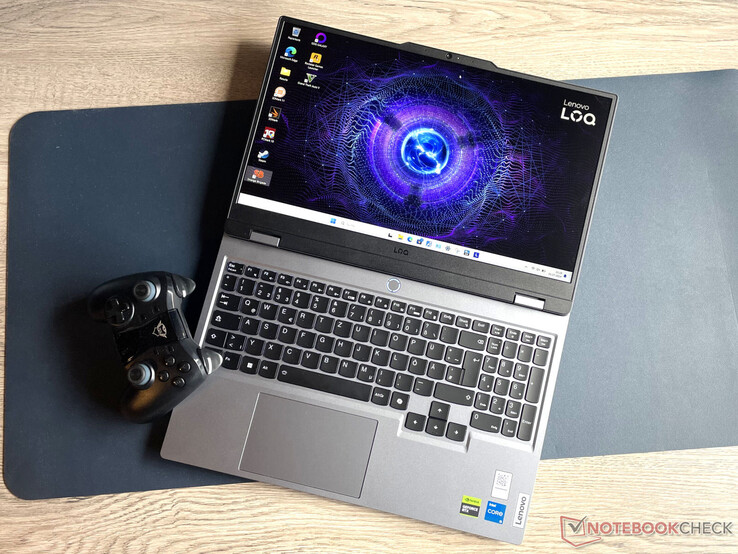
在联想的产品目录中,LOQ 系列包括经济型游戏笔记本电脑。本测试设备也完全符合这一类别:制造商要求的价格为 1000 多美元(不含 Windows)或 1300 美元(含 Windows 11),配置包括酷睿 i5 处理器、GeForce RTX 4060、16 GB 内存和 1 TB SSD。这款笔记本电脑的价格标签让它付出了代价:它采用塑料外壳,电池容量相对较小,没有雷电 4 或 USB 4 接口。竞争对手包括 技嘉 G6X 9KG (2024), 戴尔 G16, XMG Core 15 (M24)或 HP Victus 16 (2024).
联想LOQ 15IRX9的机箱与我们已经测试过的姊妹机型(Ryzen 7/RTX 4050,Core i7/RTX 4050 )并不完全相同。
潜在的竞争对手比较
Rating | Version | Date | Model | Weight | Height | Size | Resolution | Price |
|---|---|---|---|---|---|---|---|---|
| 79 % | v8 | 07 / 2024 | Lenovo LOQ 15IRX9 i5-13450HX, NVIDIA GeForce RTX 4060 Laptop GPU | 2.4 kg | 23.9 mm | 15.60" | 1920x1080 | |
| 83.7 % | v8 | 06 / 2024 | SCHENKER XMG Core 15 (M24) R7 8845HS, NVIDIA GeForce RTX 4060 Laptop GPU | 2.1 kg | 21.9 mm | 15.30" | 2560x1600 | |
| 83.2 % v7 (old) | v7 (old) | 03 / 2024 | Gigabyte G6X 9KG (2024) i7-13650HX, NVIDIA GeForce RTX 4060 Laptop GPU | 2.6 kg | 25.1 mm | 16.00" | 1920x1200 | |
| 84.3 % v7 (old) | v7 (old) | 05 / 2024 | HP Victus 16 (2024) i7-14700HX, NVIDIA GeForce RTX 4060 Laptop GPU | 2.4 kg | 23.9 mm | 16.10" | 1920x1080 | |
| 85.5 % v7 (old) | v7 (old) | 02 / 2024 | Dell G16, i7-13650HX, RTX 4060 i7-13650HX, NVIDIA GeForce RTX 4060 Laptop GPU | 2.8 kg | 25.65 mm | 16.00" | 2560x1600 |
请注意:我们最近更新了评级系统,第 8 版的结果无法与第 7 版的结果进行比较。更多信息 此处.
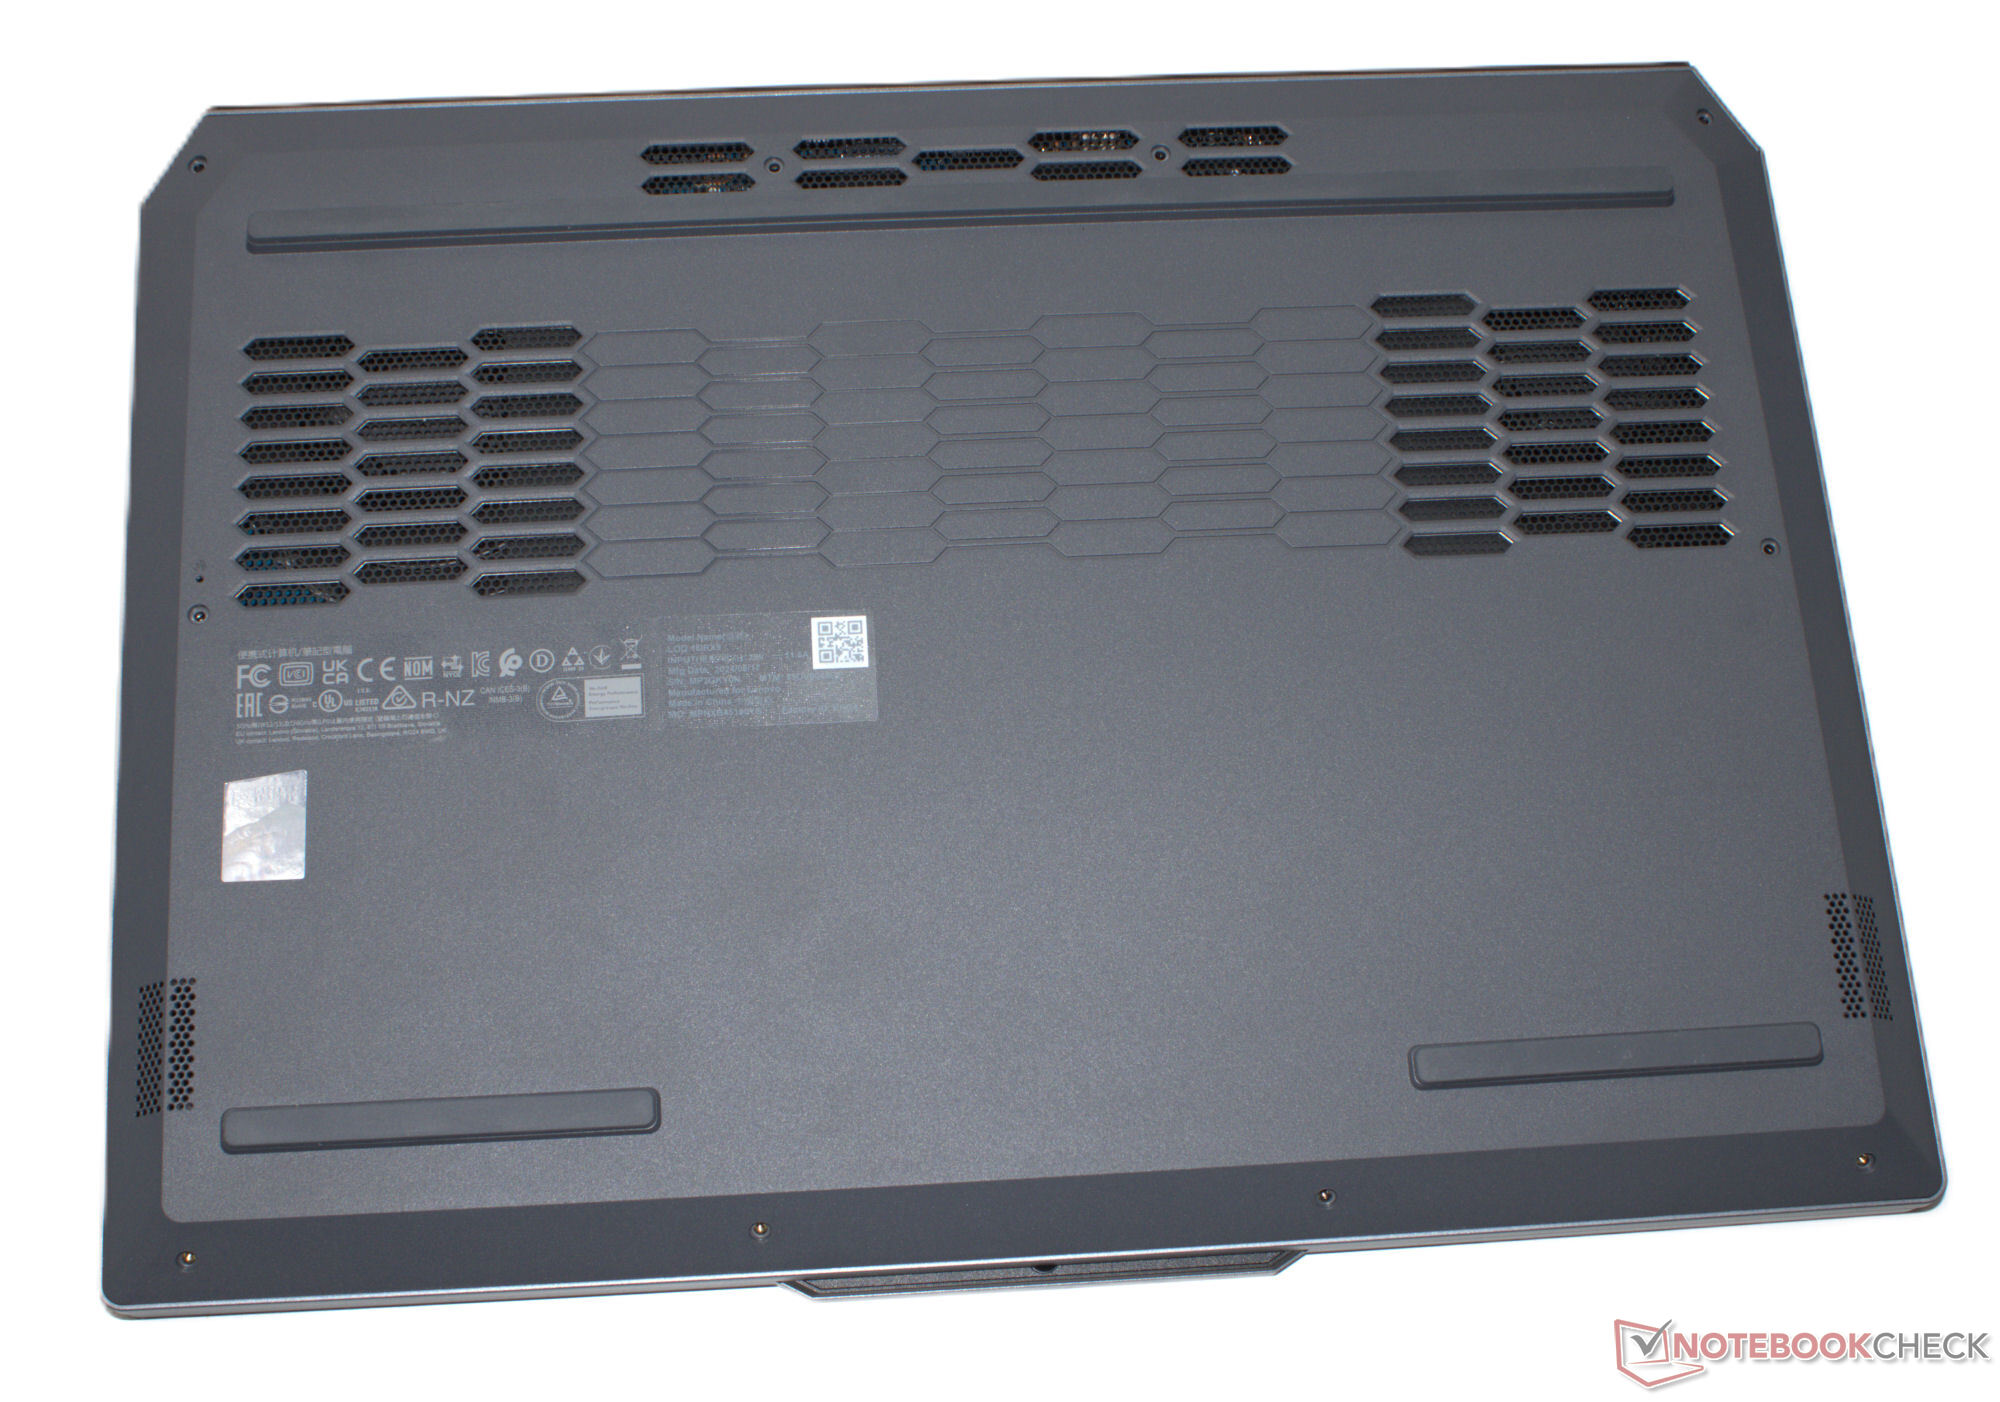
外壳和连接性 - 不带 USB 4 但带 Power Delivery 的 LOQ
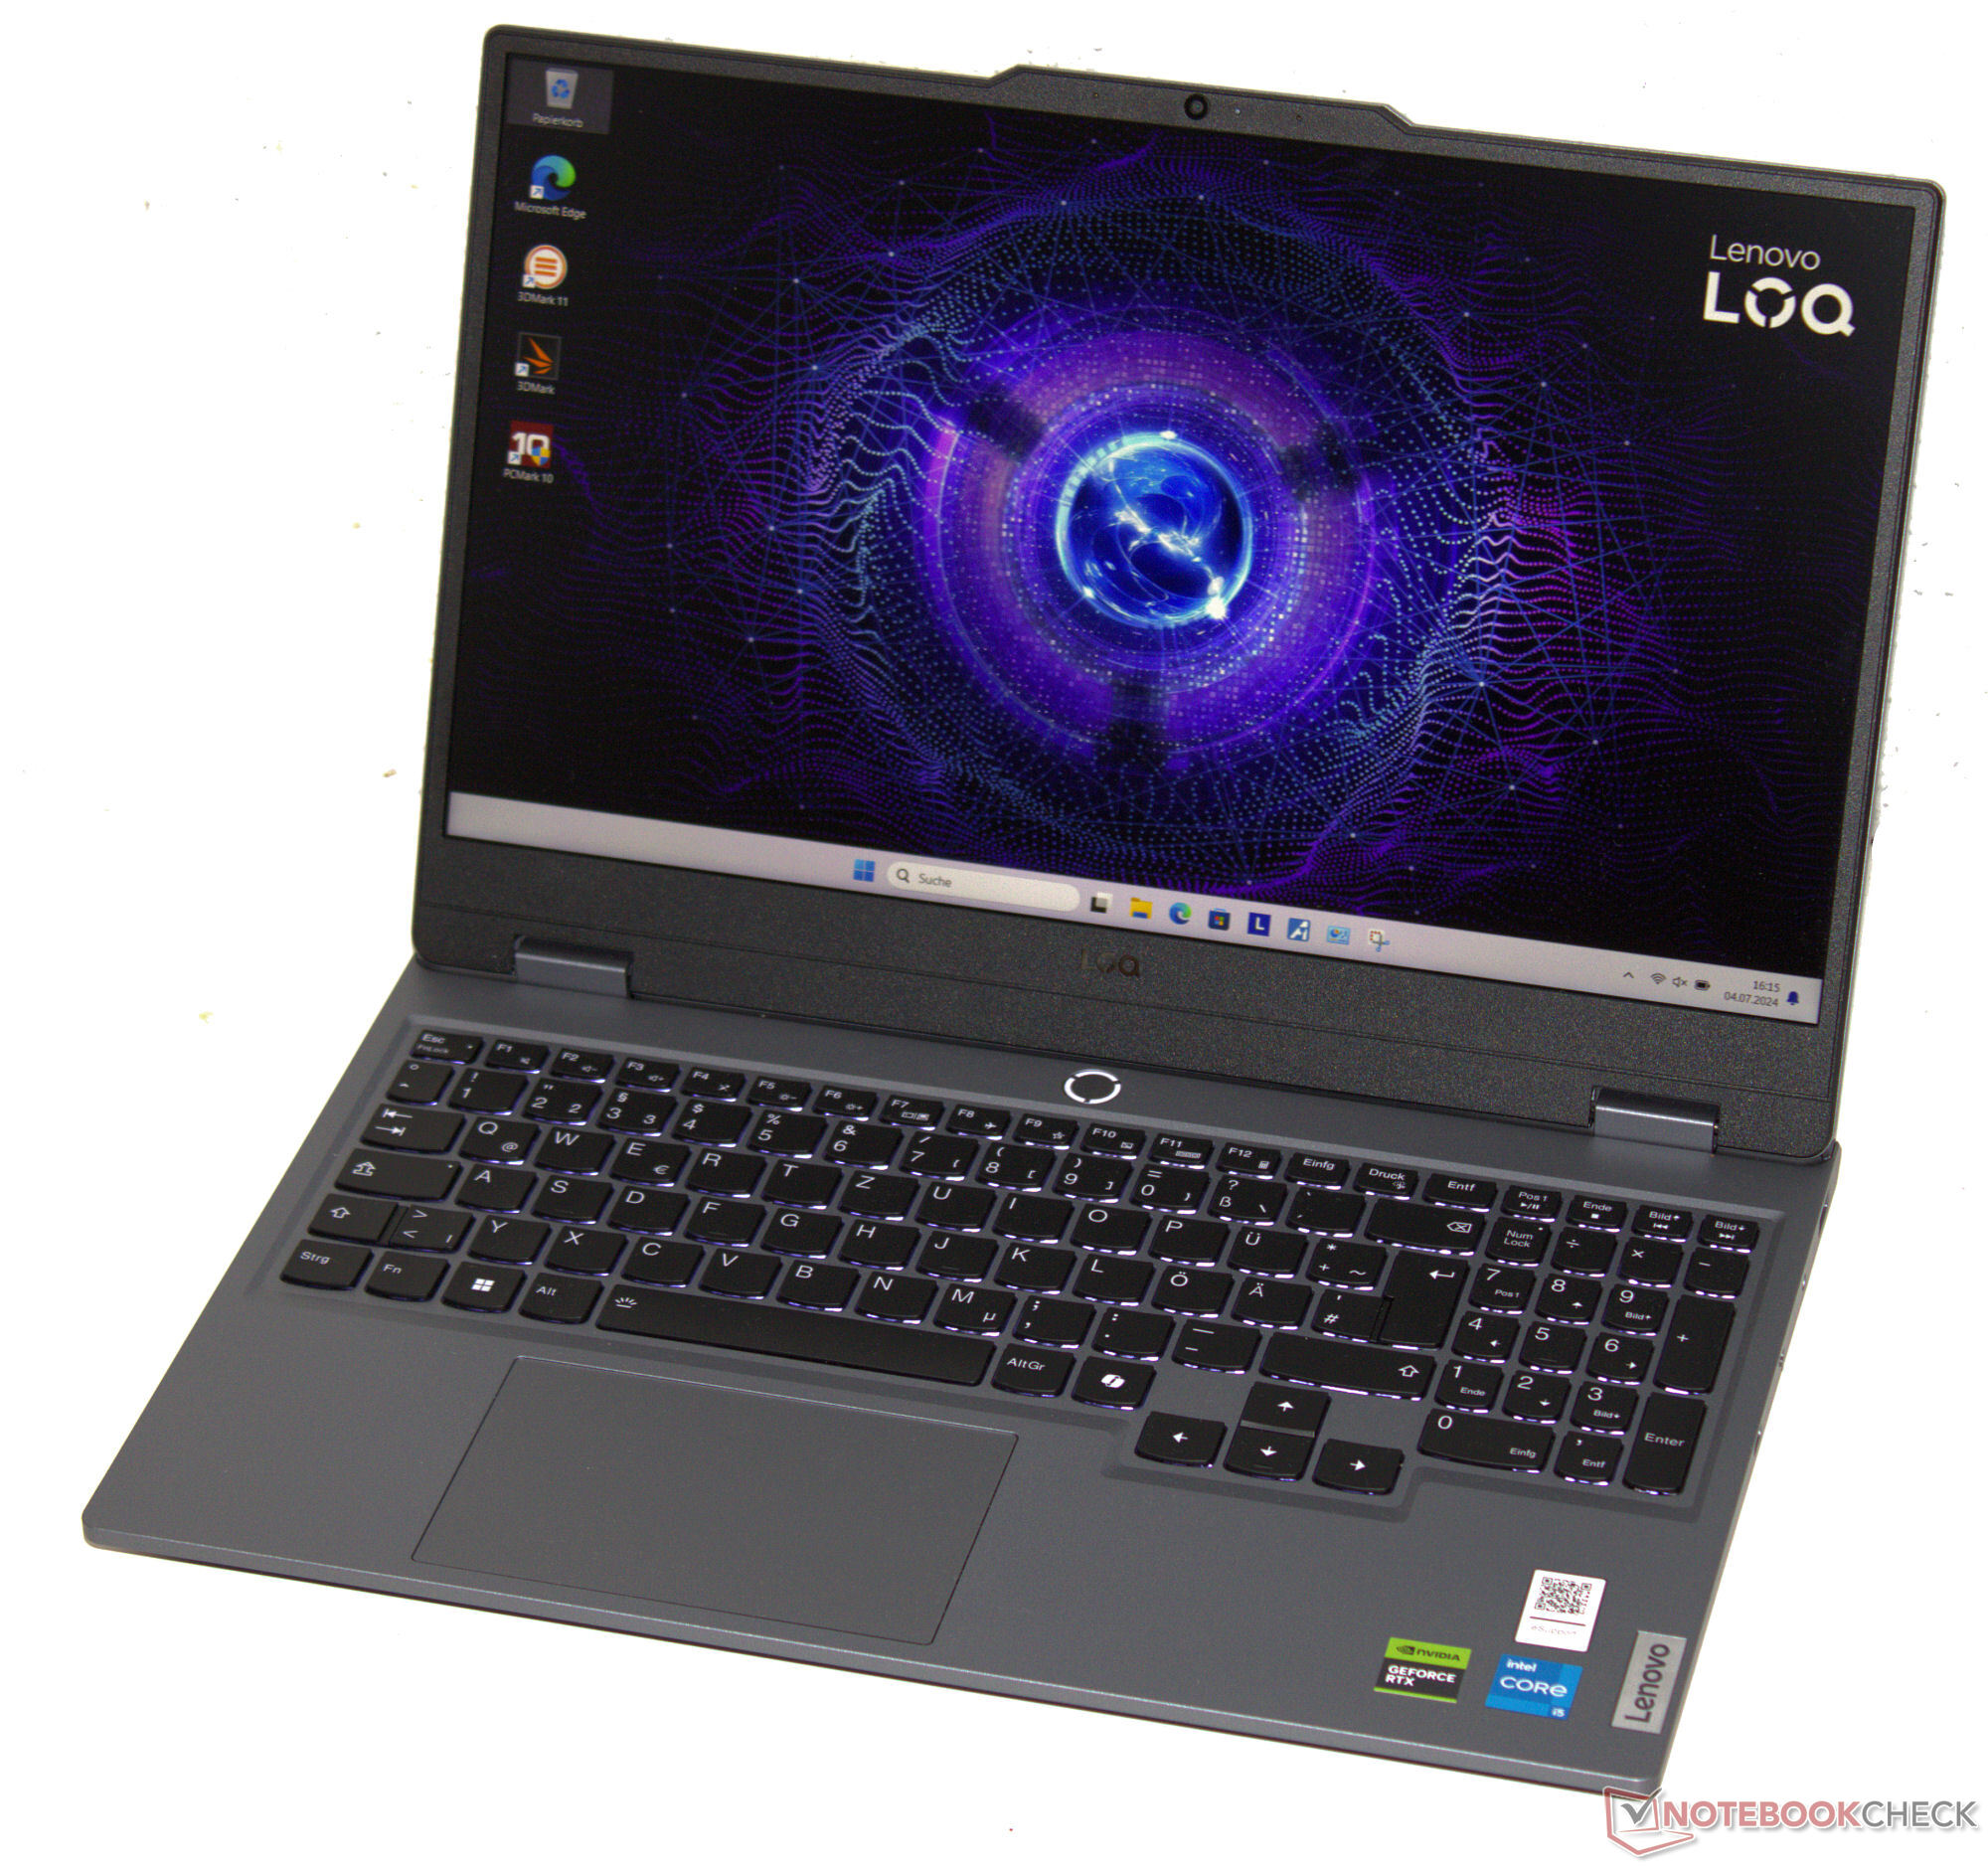
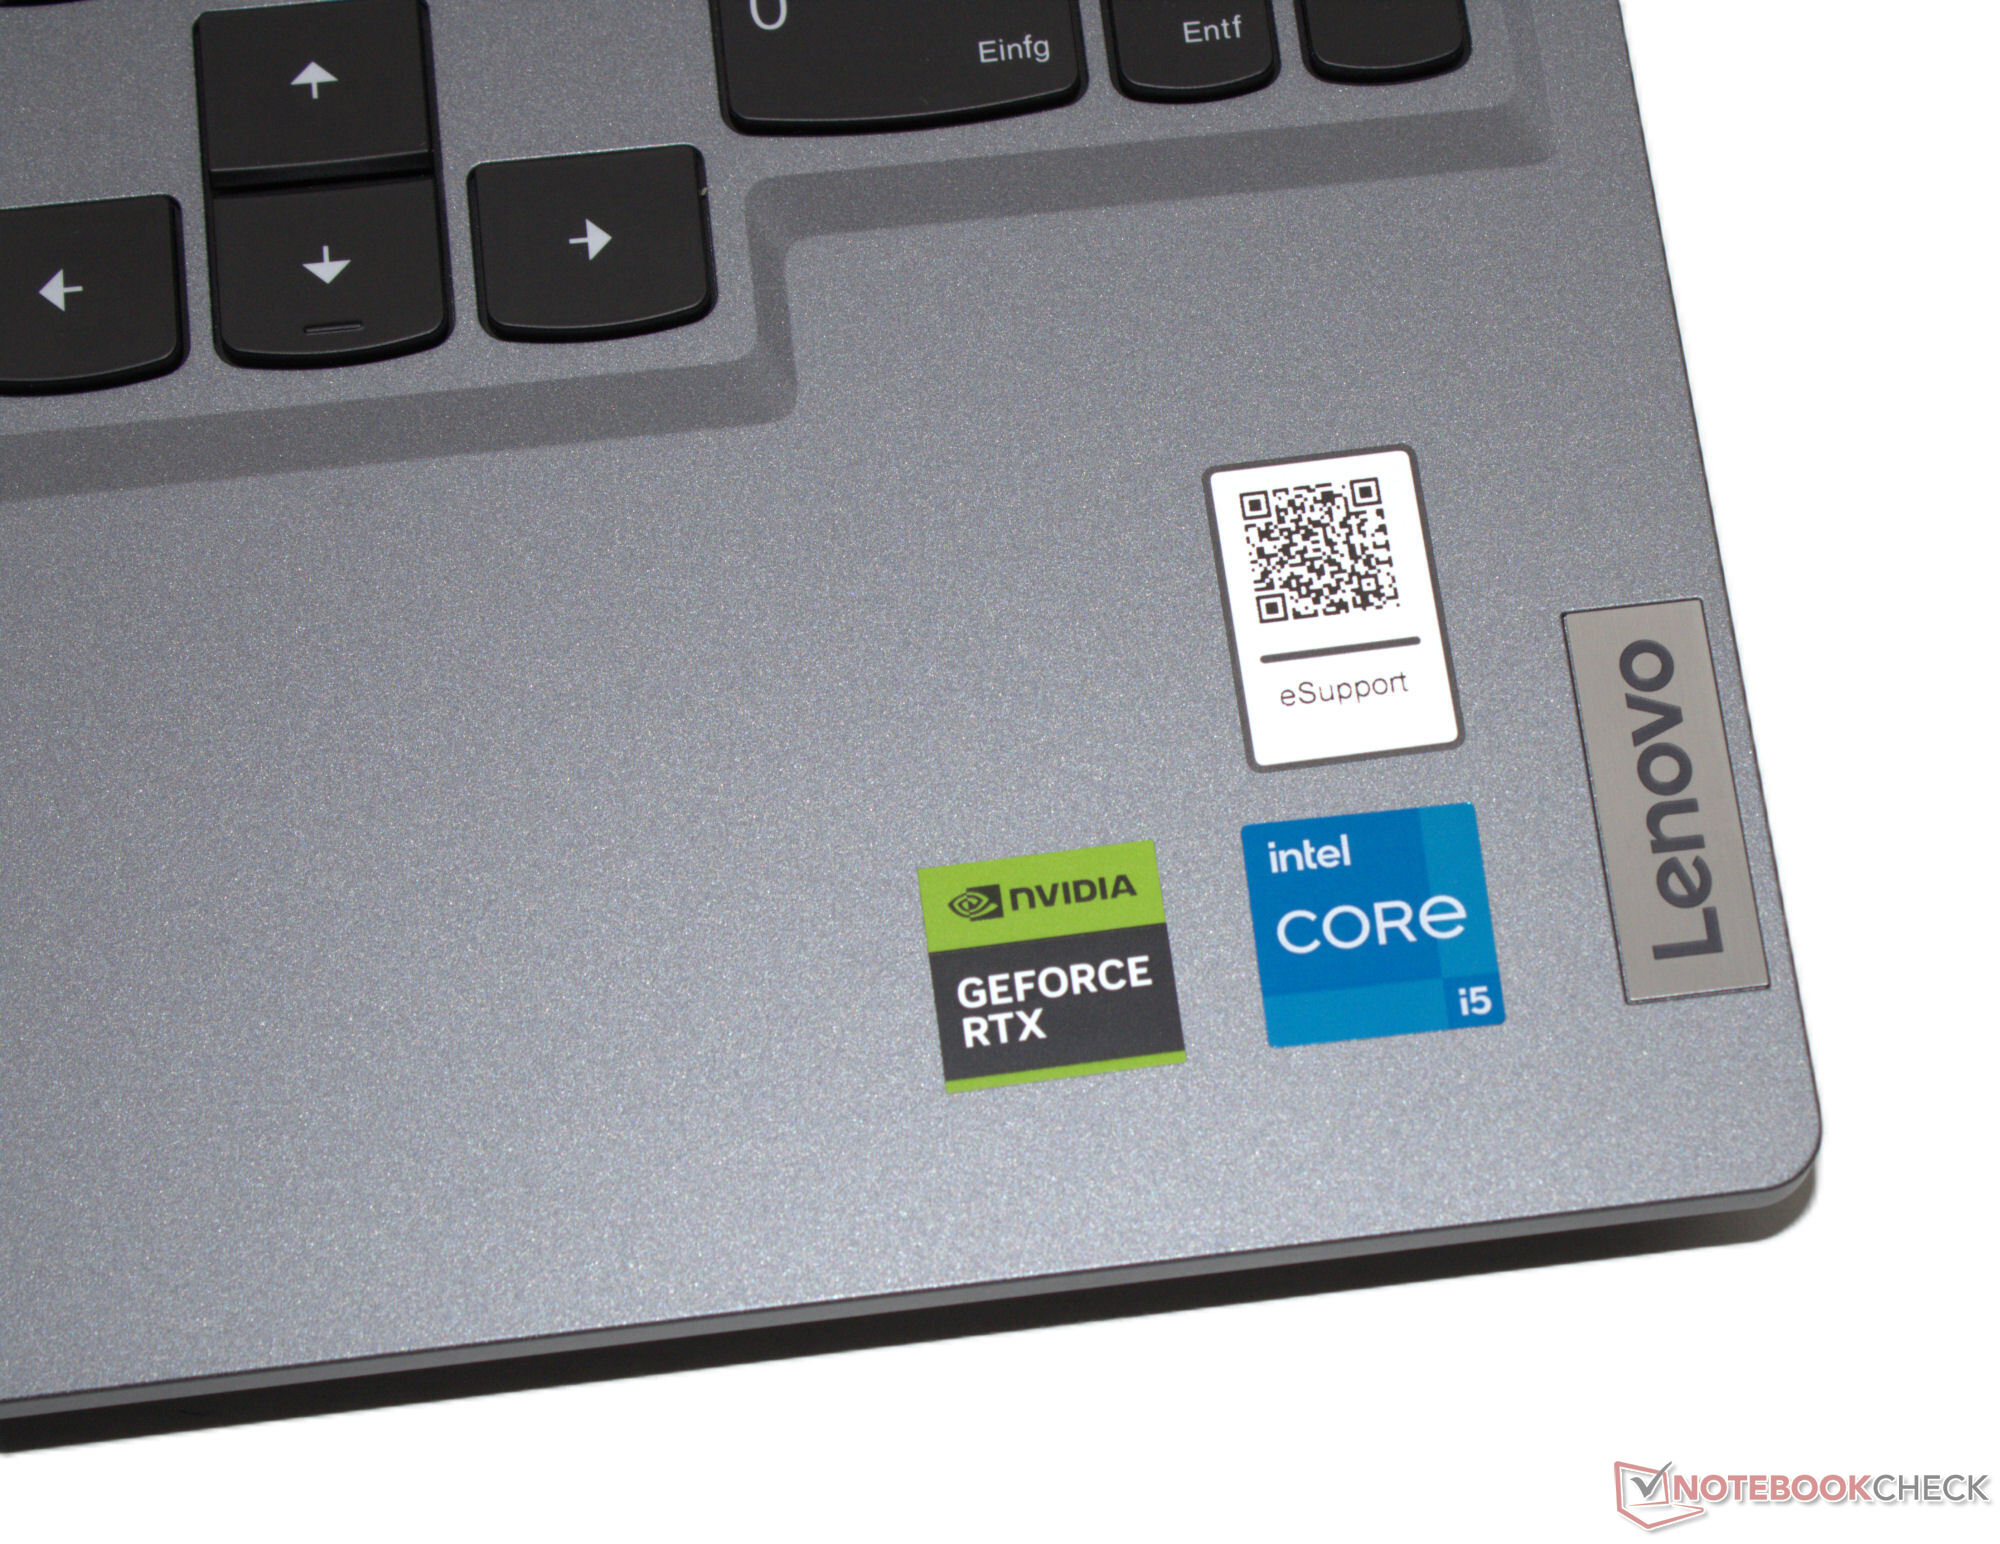
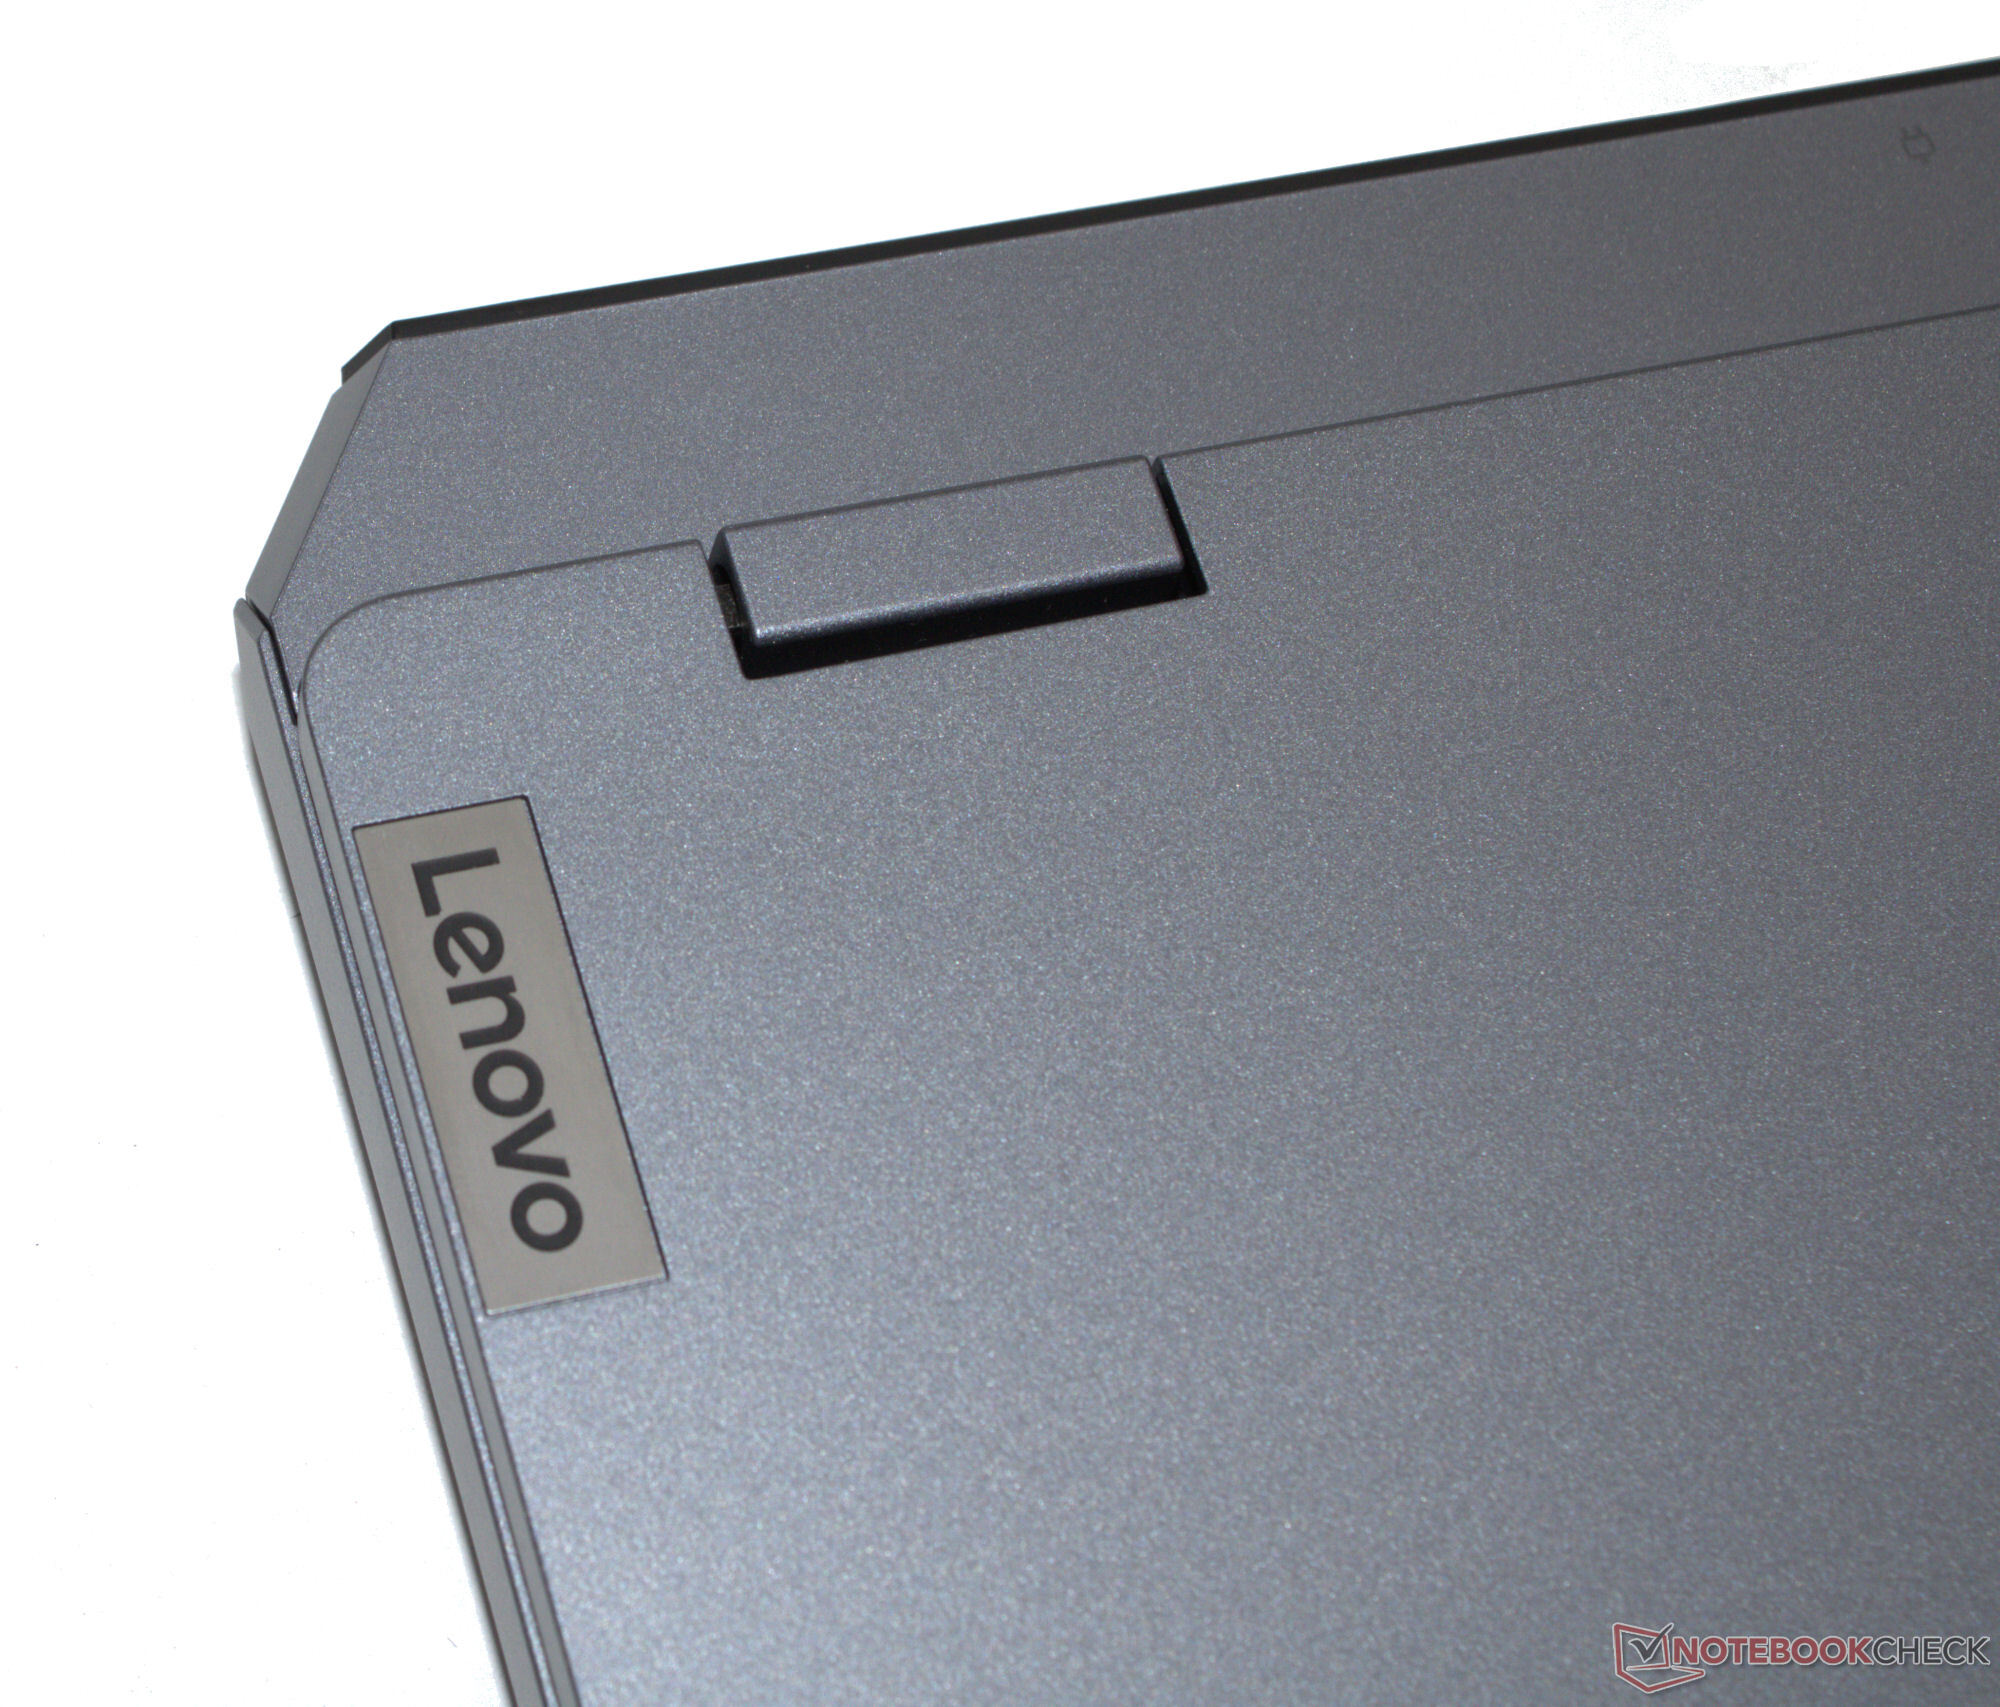
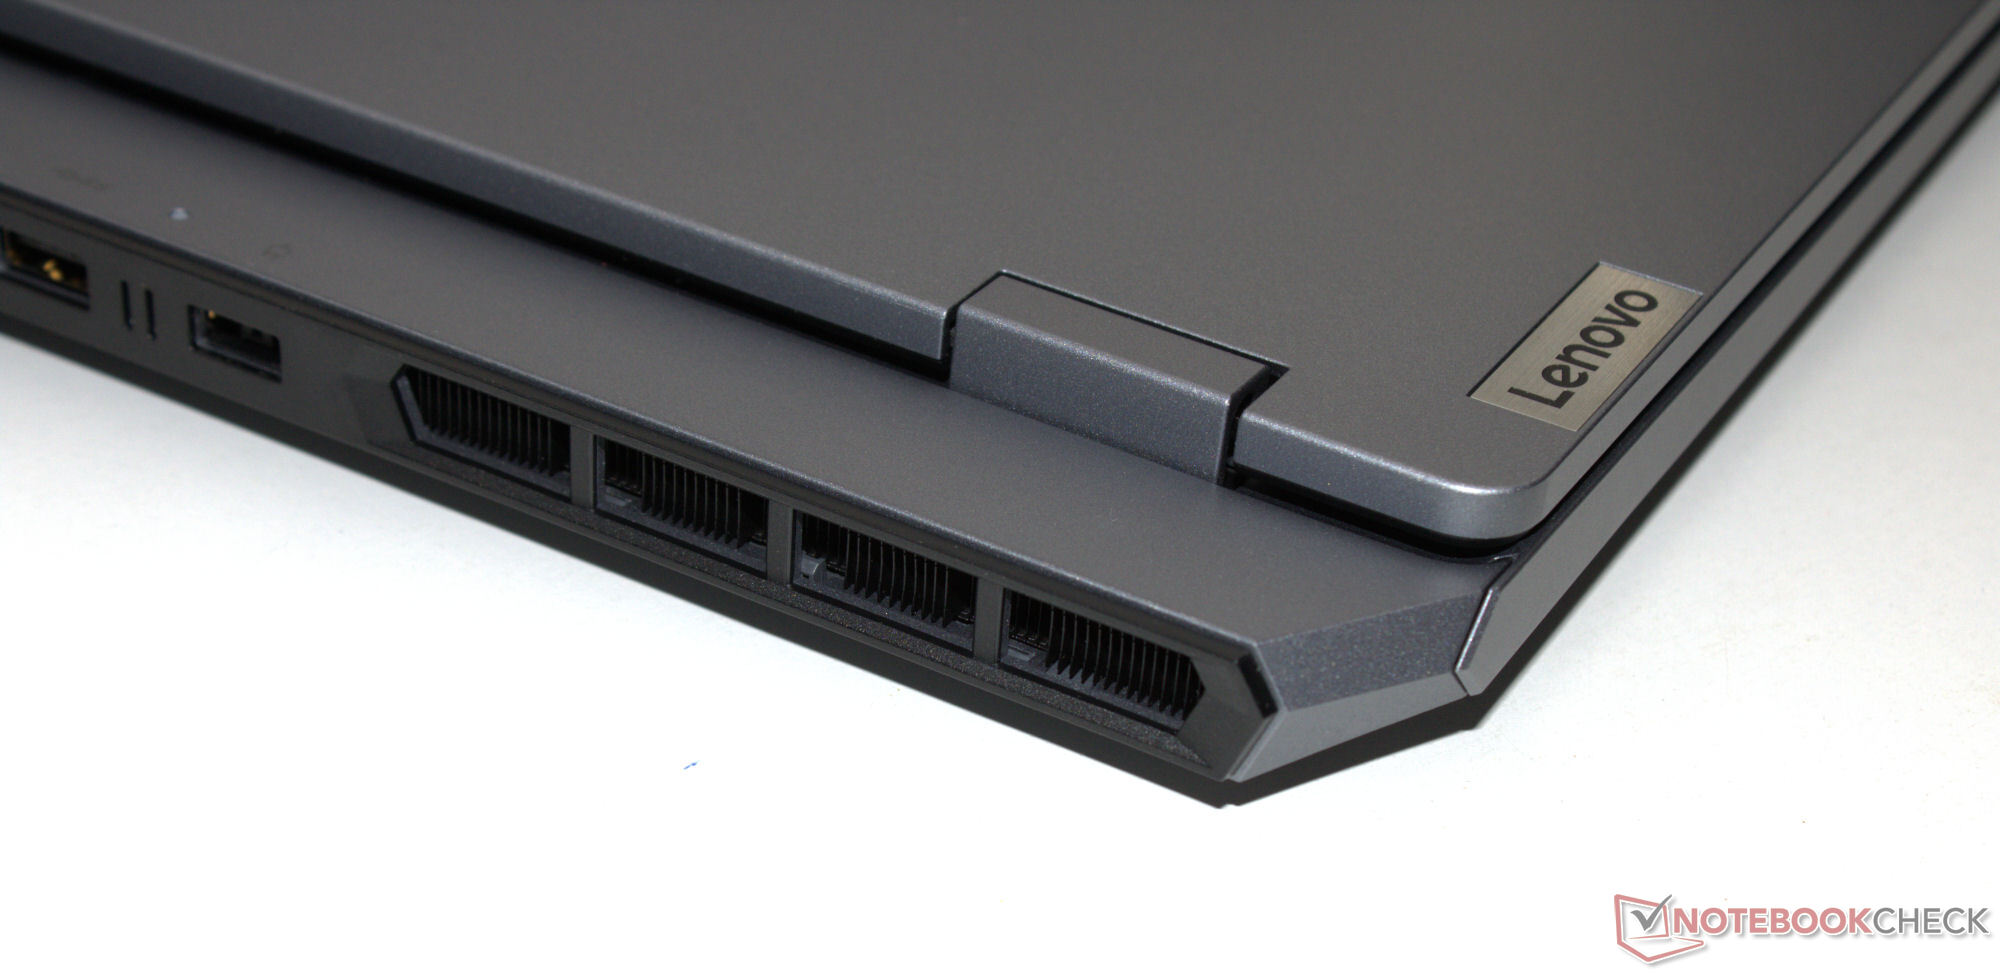
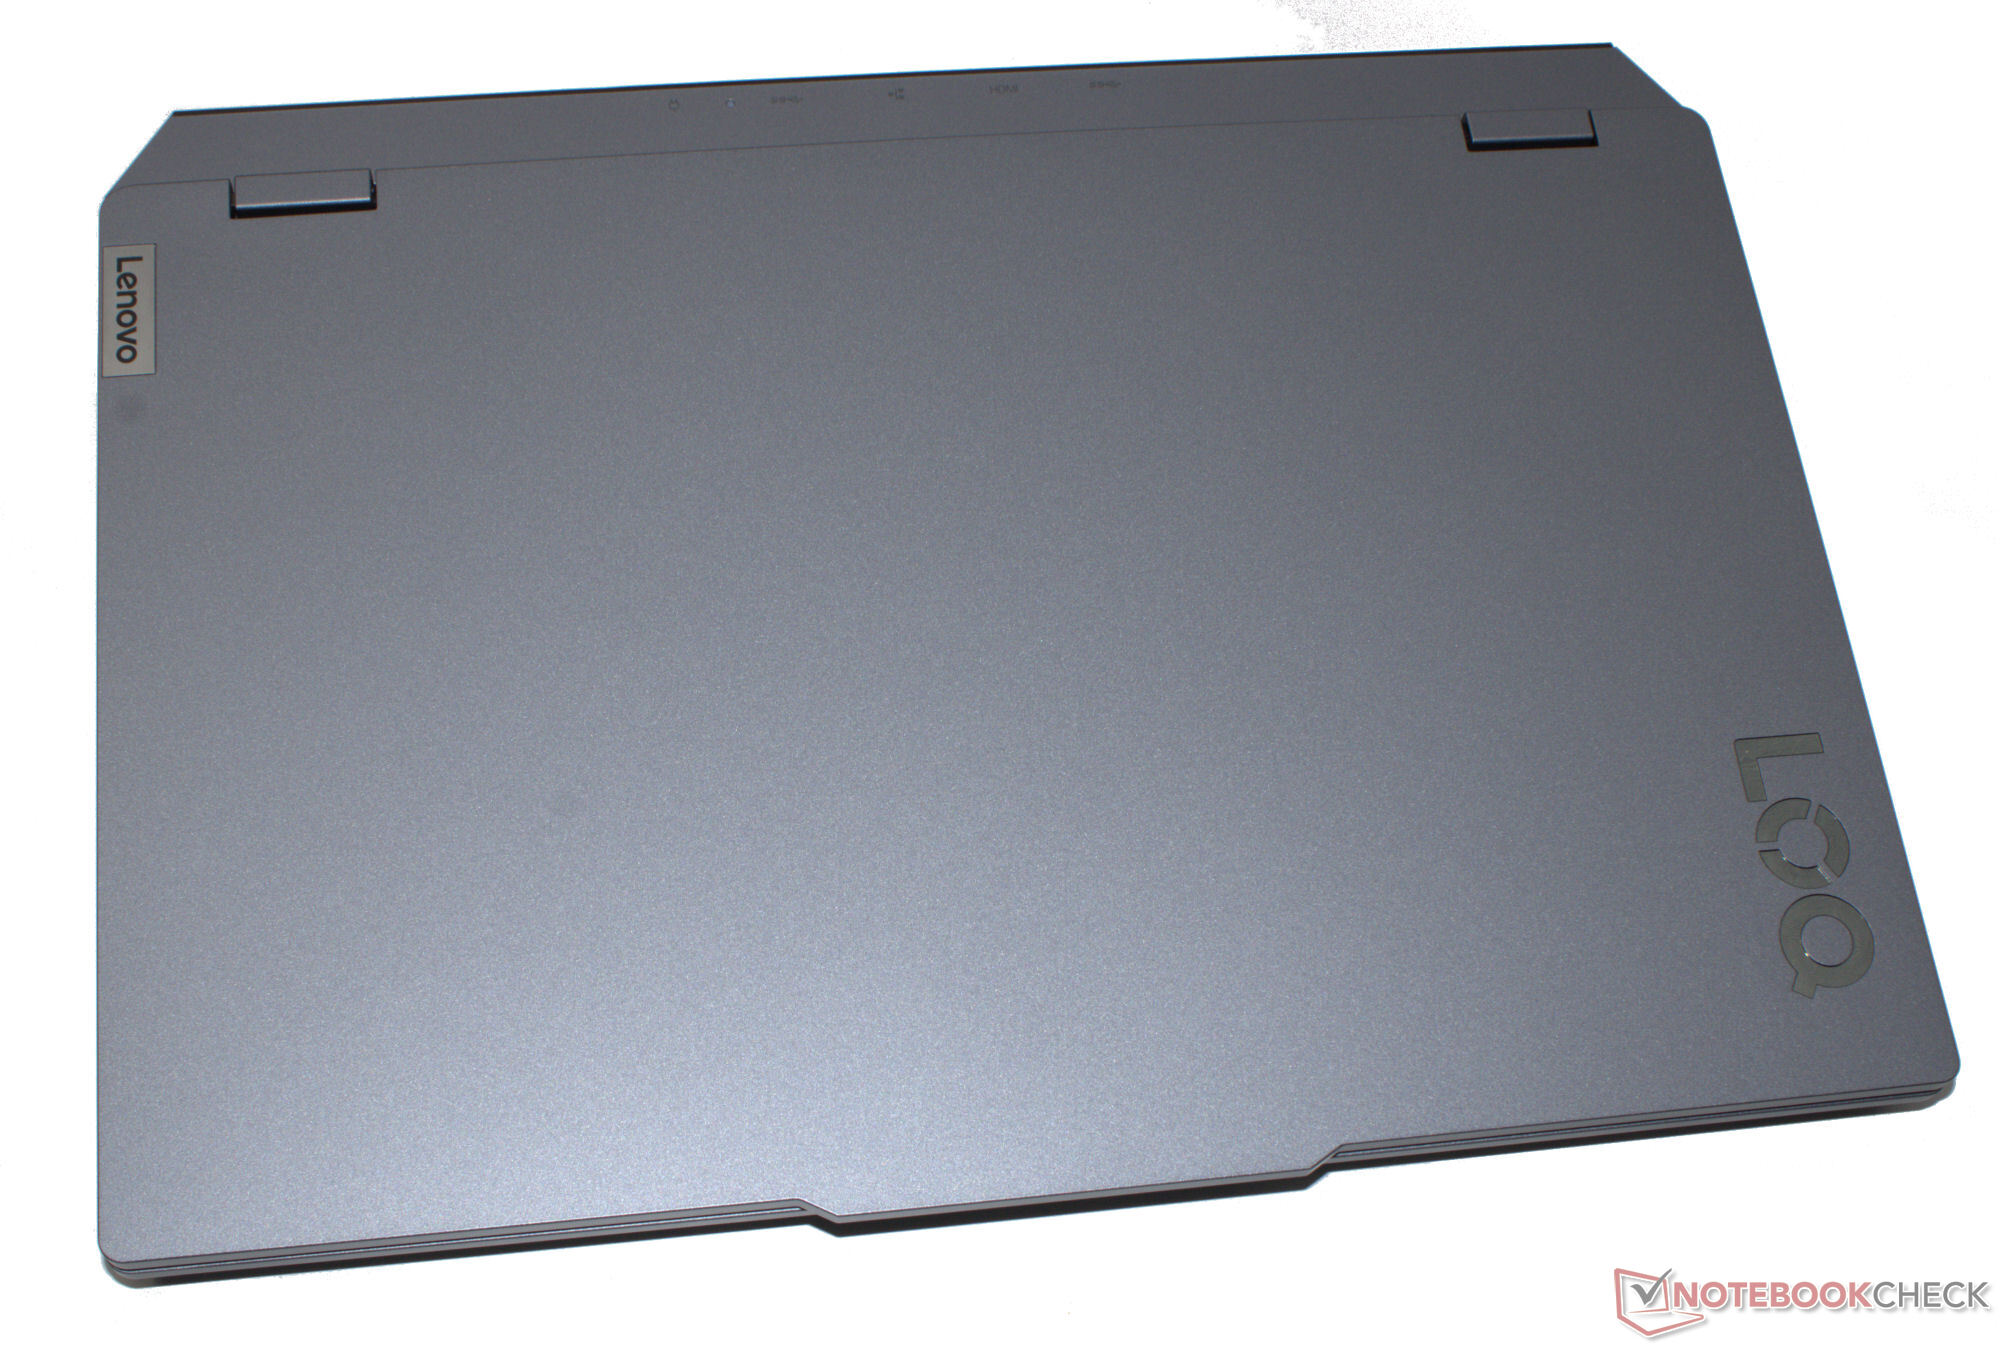
笔记本电脑的硬件安装在一个哑光灰色(月光灰)塑料外壳内,总体看起来非常时尚。盖子和底座可以轻微扭动,但还可以接受。它的稳定性还不错。盖子的最大开启角度可达 180 度。该机型上看不到游戏笔记本电脑常见的 LED 灯带。
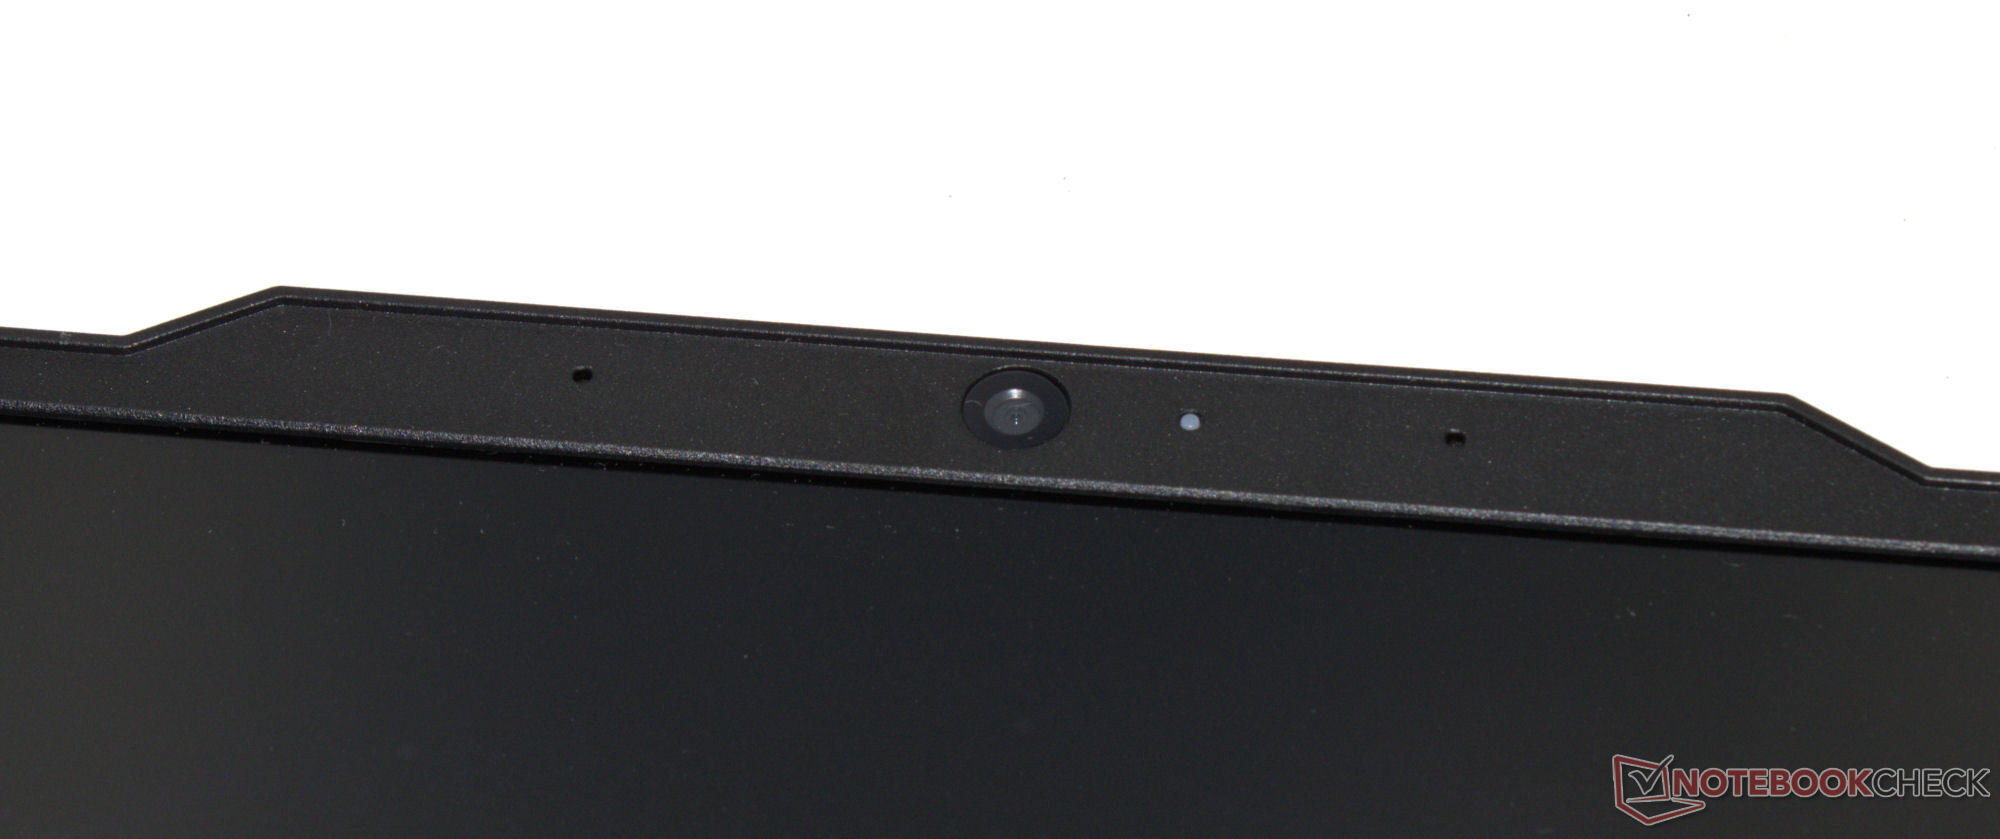
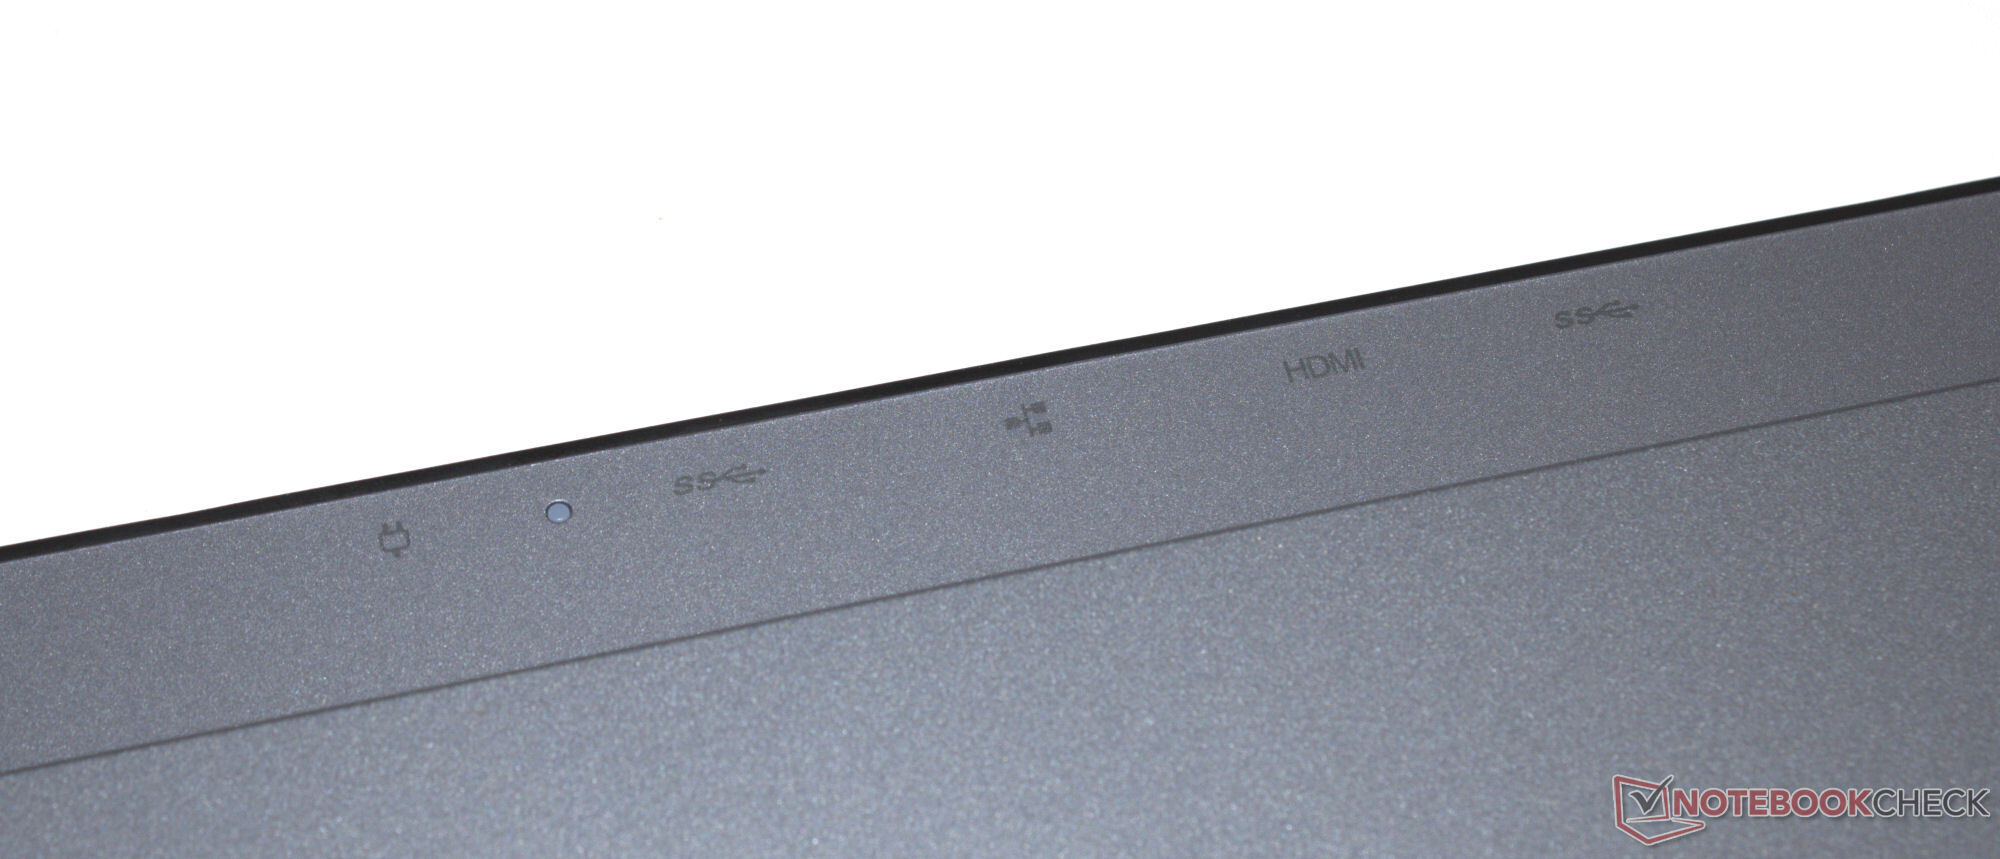
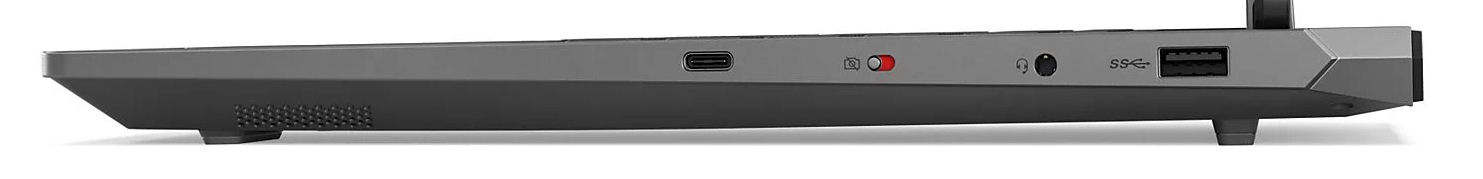
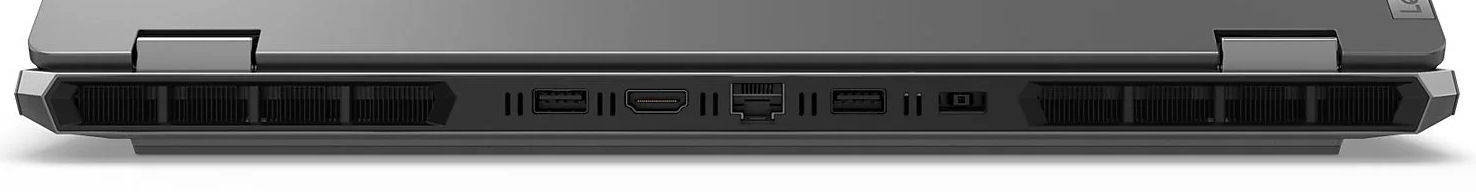
三个 USB-A 端口(USB 3.2 Gen 1)和一个 USB-C 端口(USB 3.2 Gen 2)足以满足大多数用户的需求。后者支持 Power Delivery 和显示 ALT 模式。这款笔记本电脑总共有两个视频输出接口(1x HDMI、1x DP)。其网络摄像头(210 万像素,带开关)效果一般。联想认为 SD 卡读卡器没有必要。
我们测得的 WiFi 数据传输速率很稳定,但仍落后于当今的水平。联想笔记本电脑的 Realtek WiFi 6 芯片(RTL8852BE)无法达到与许多竞争对手的英特尔芯片相同的速度。


可持续性
笔记本电脑和电源各用一个塑料袋包装,而 LOQ 在运输过程中则用泡沫塑料插件保护。所使用的塑料类型由制造商命名。一个纸套可以保护电源免受刮伤。所有这些都装在一个纸箱里--根据标签,所用木材来自可持续林业。
维修设备应该很容易:底板可以顺利拆下,这样就可以接触到所有硬件。我们在机箱内没有发现任何胶合部件。由于使用的是 Windows 11 操作系统,因此软件更新在未来几年都会得到保证。联想的支持将于 2029 年 12 月 31 日结束。
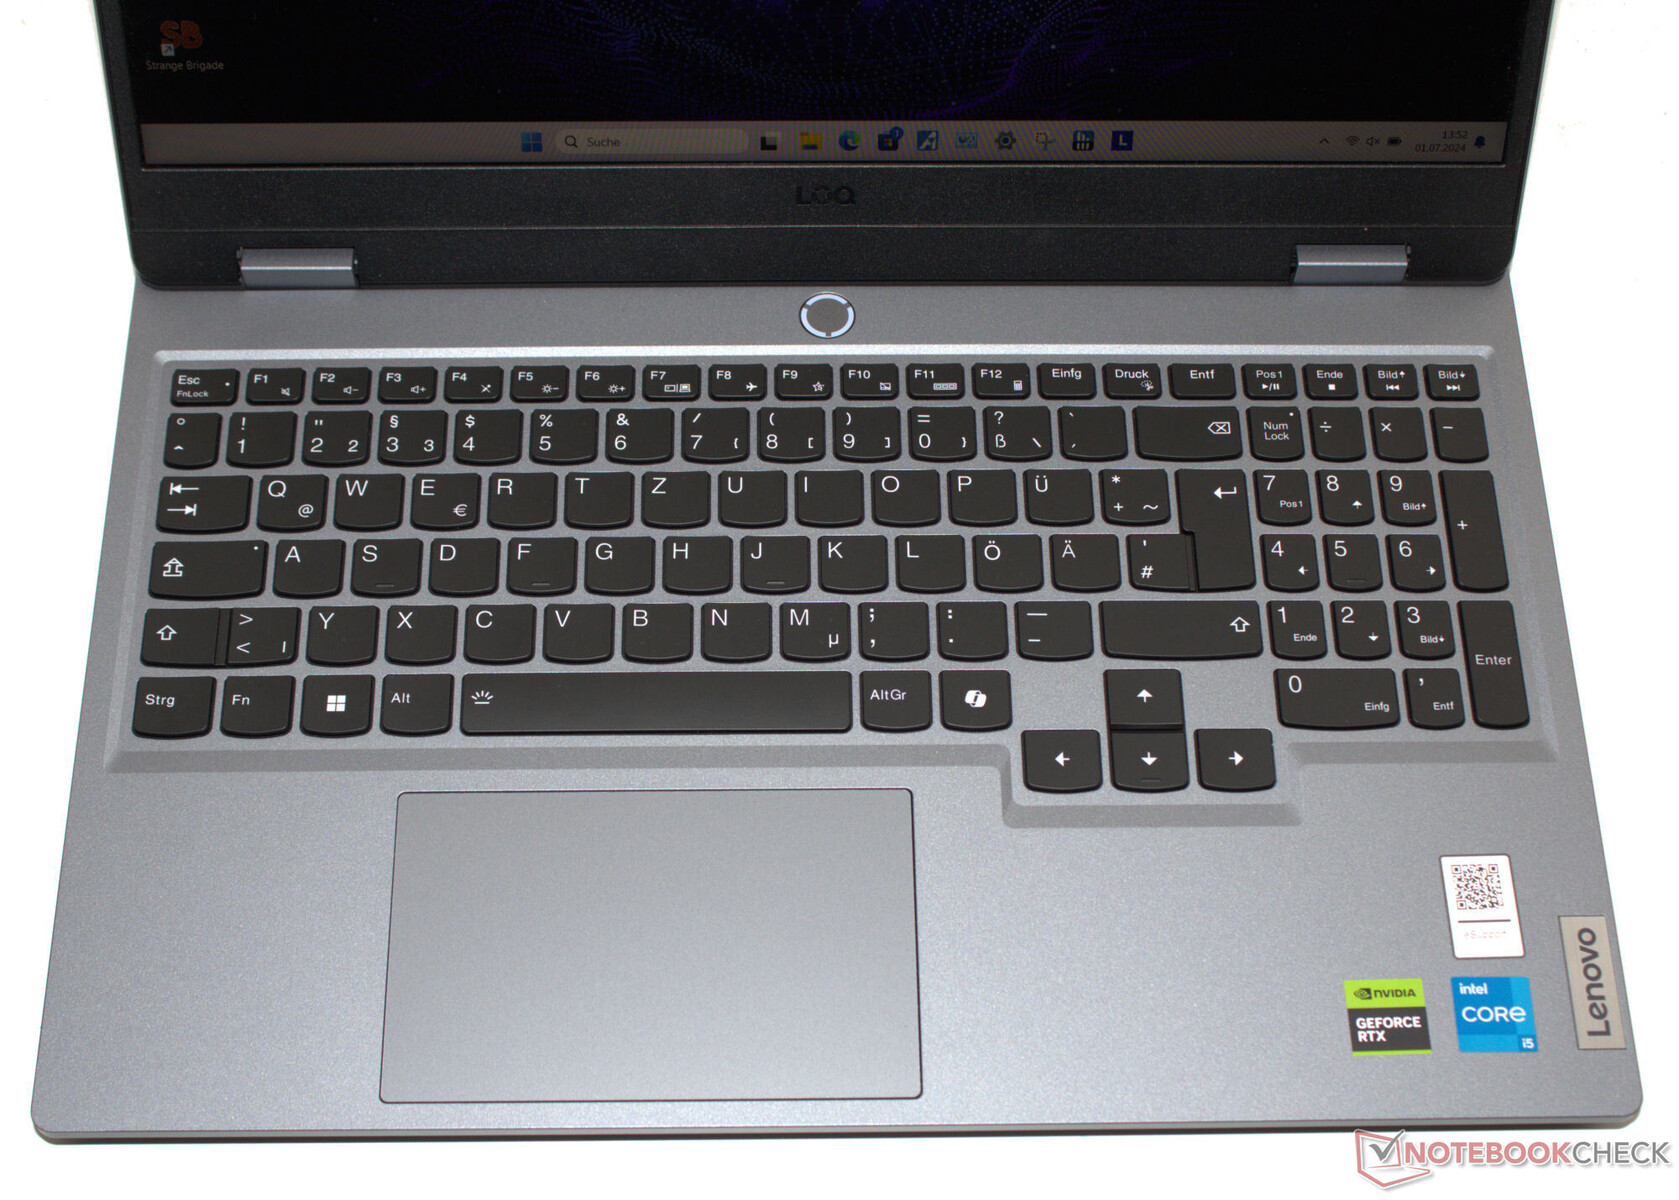
输入设备 - 联想笔记本电脑配备大型方向键
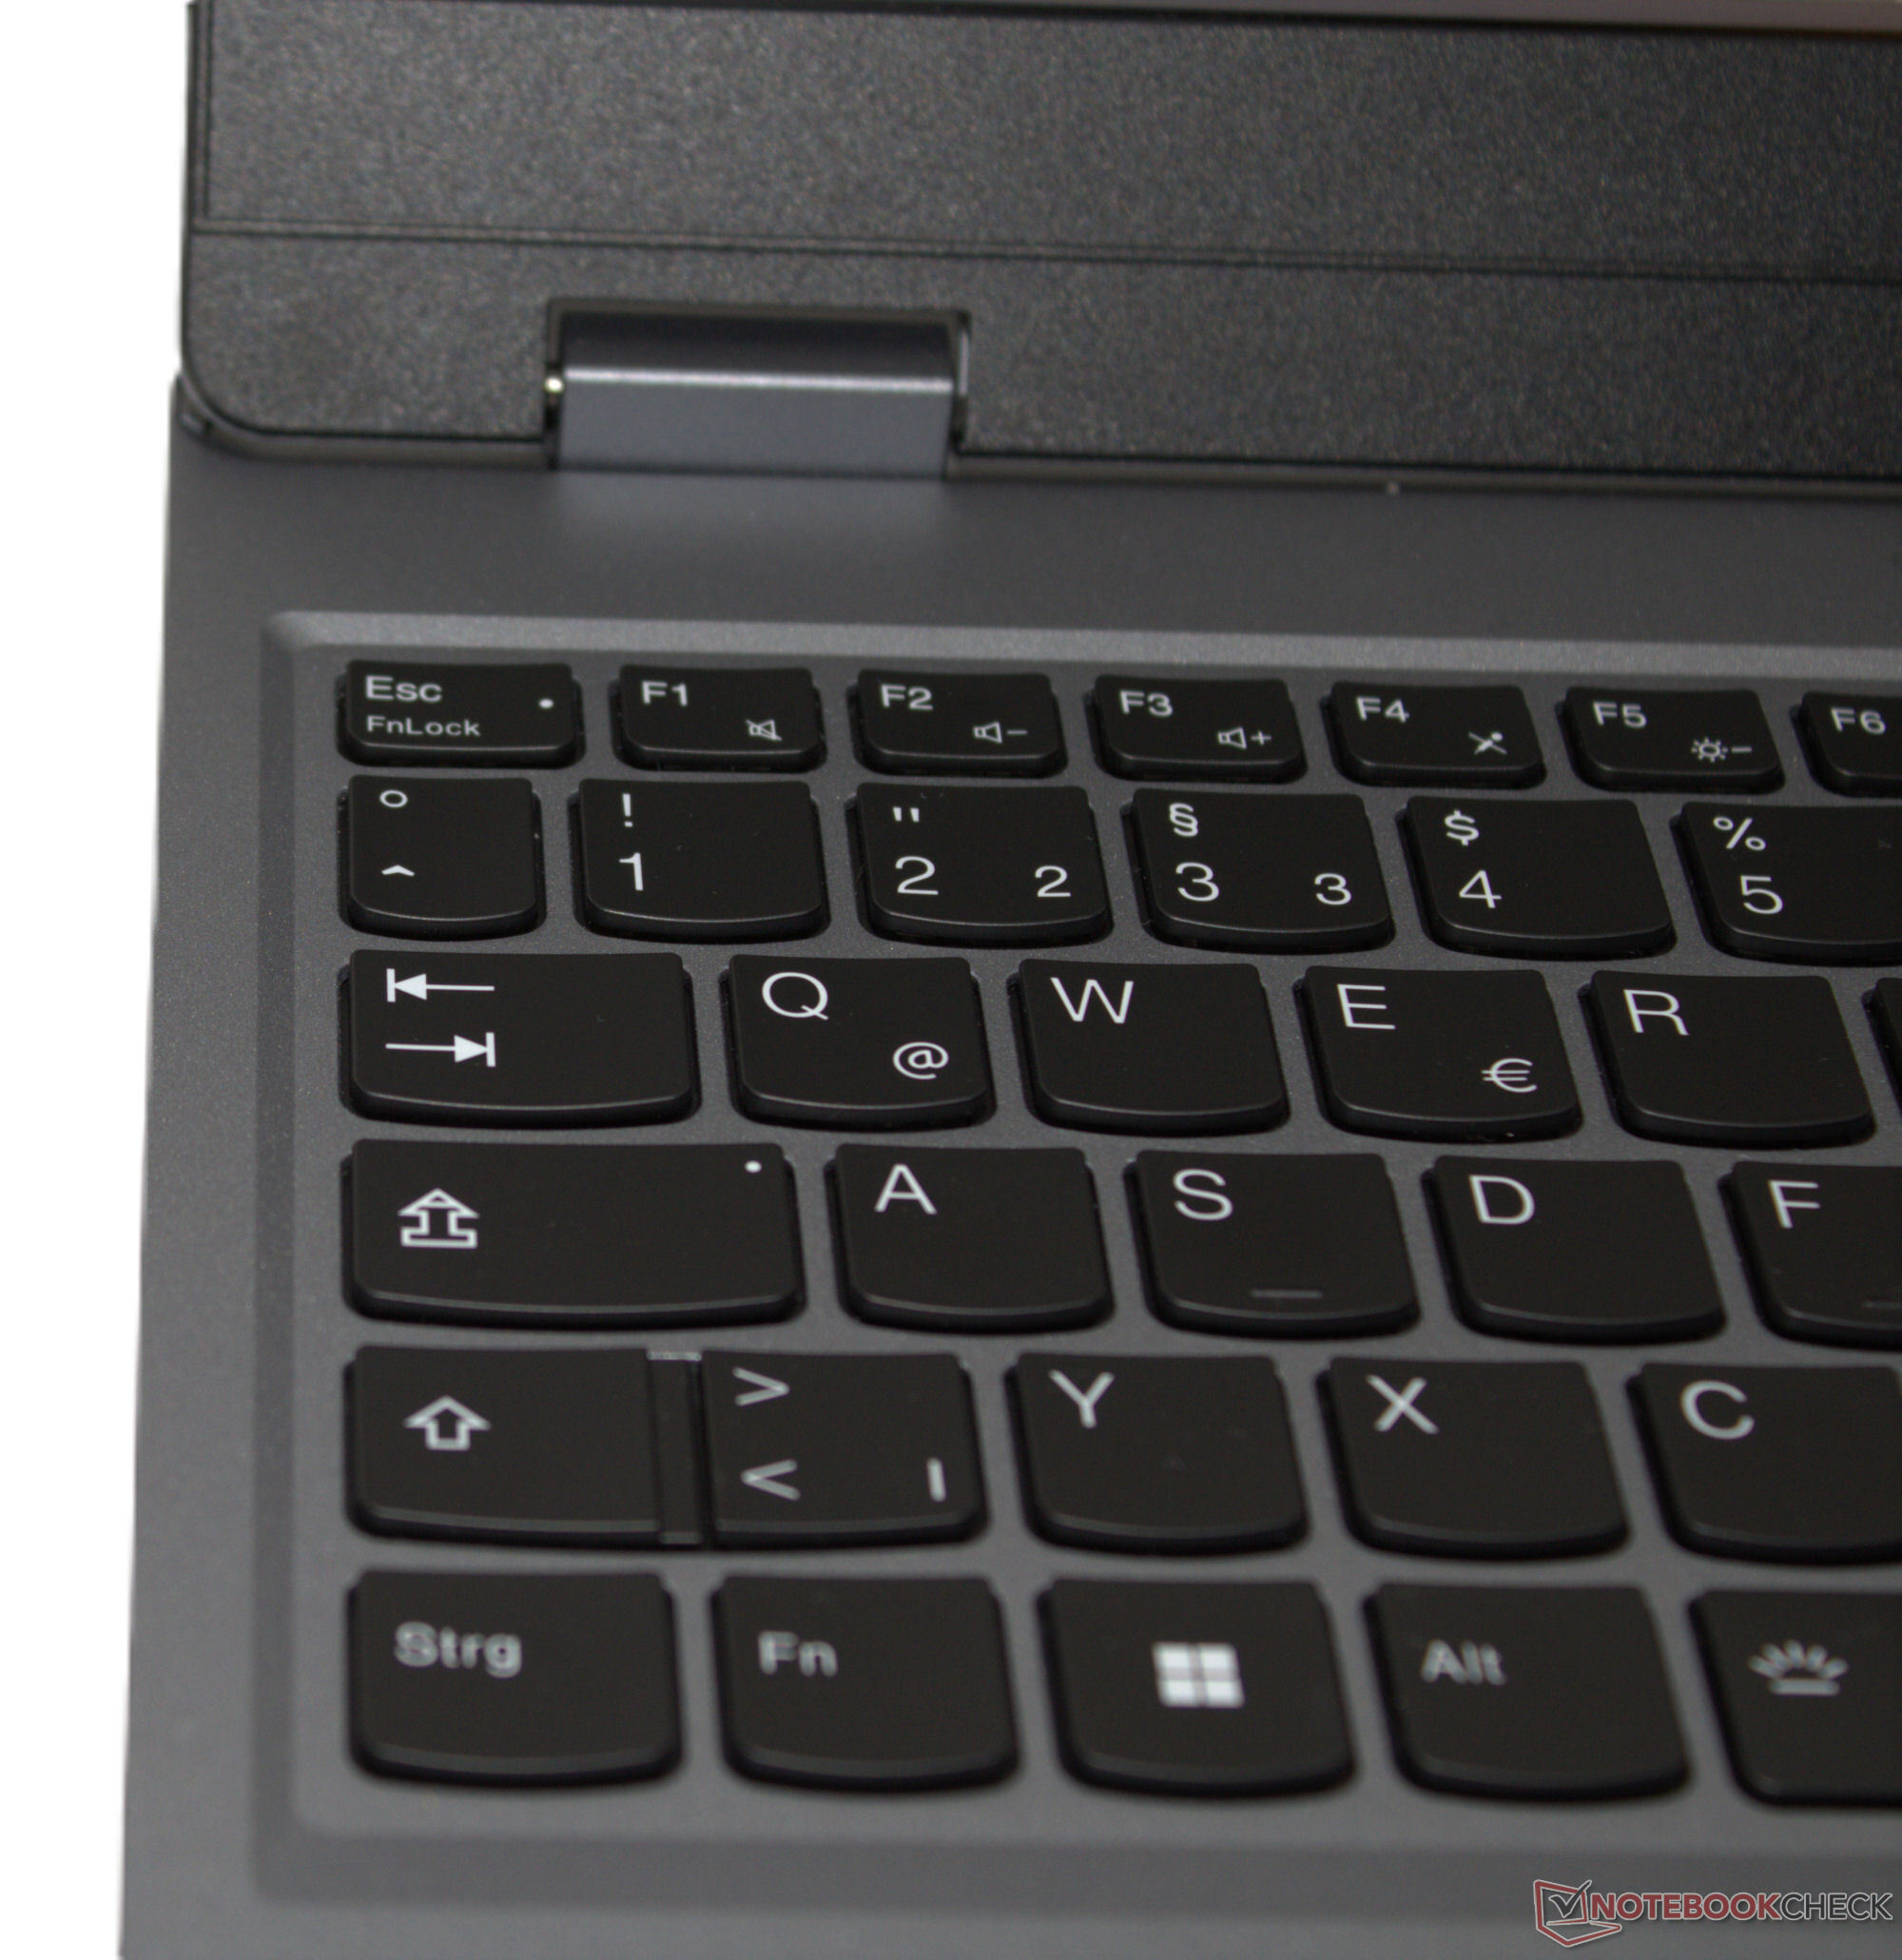
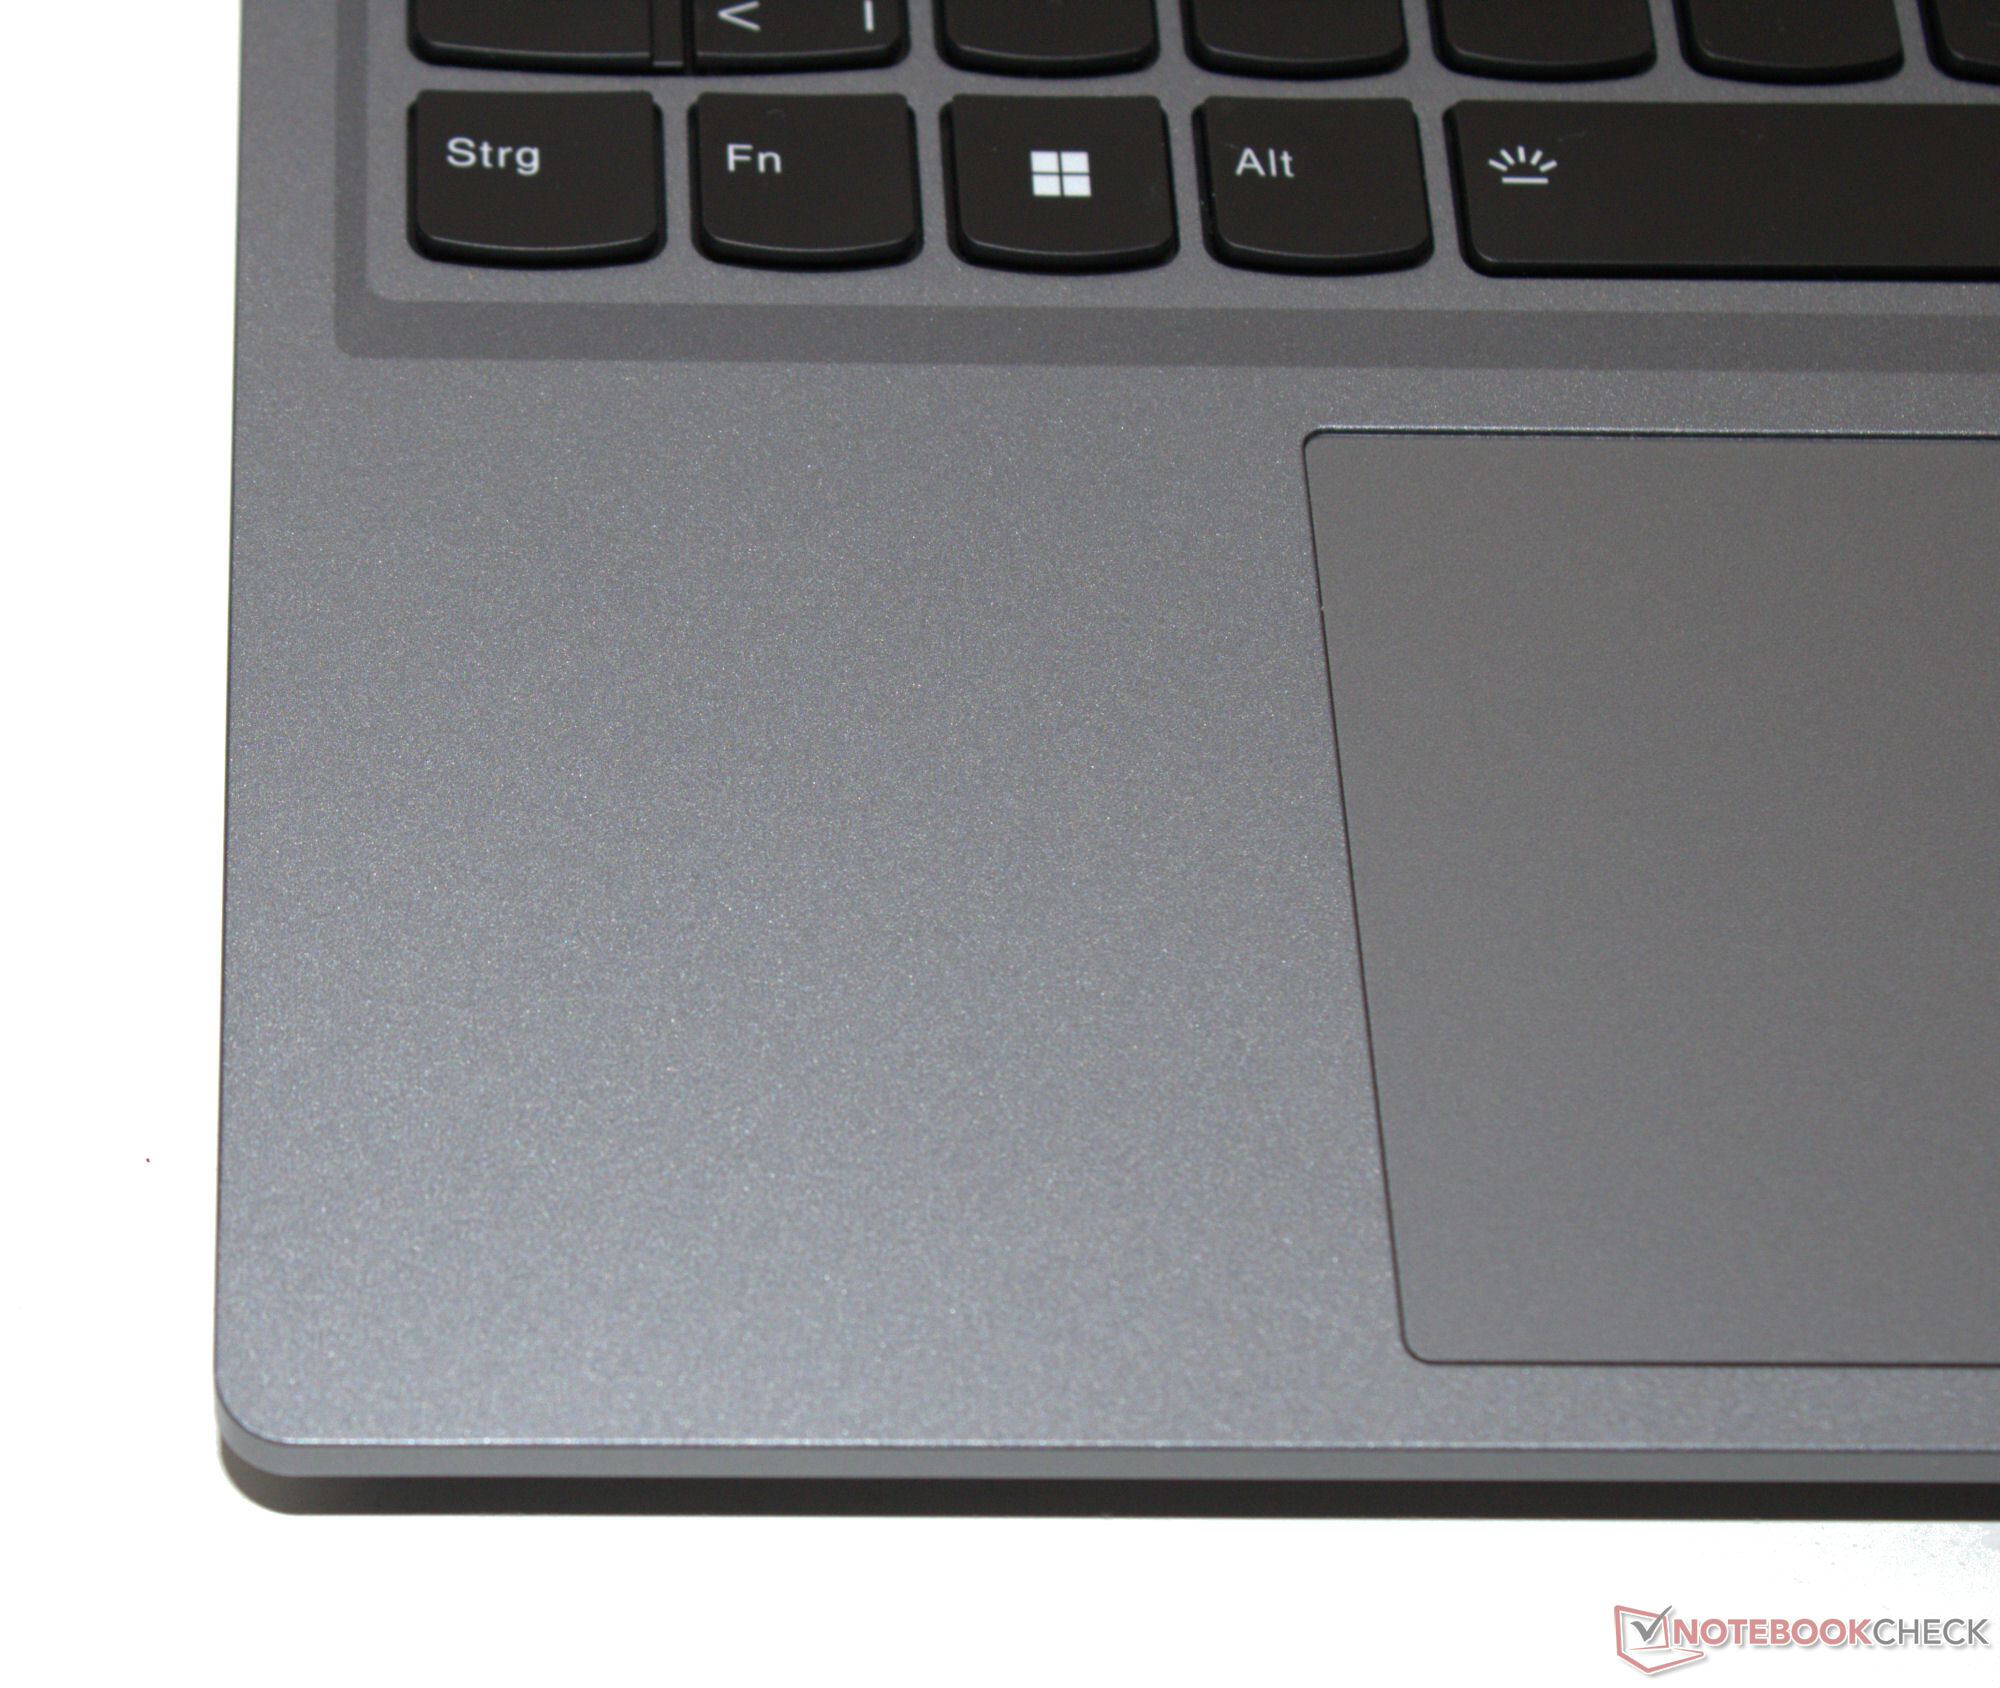
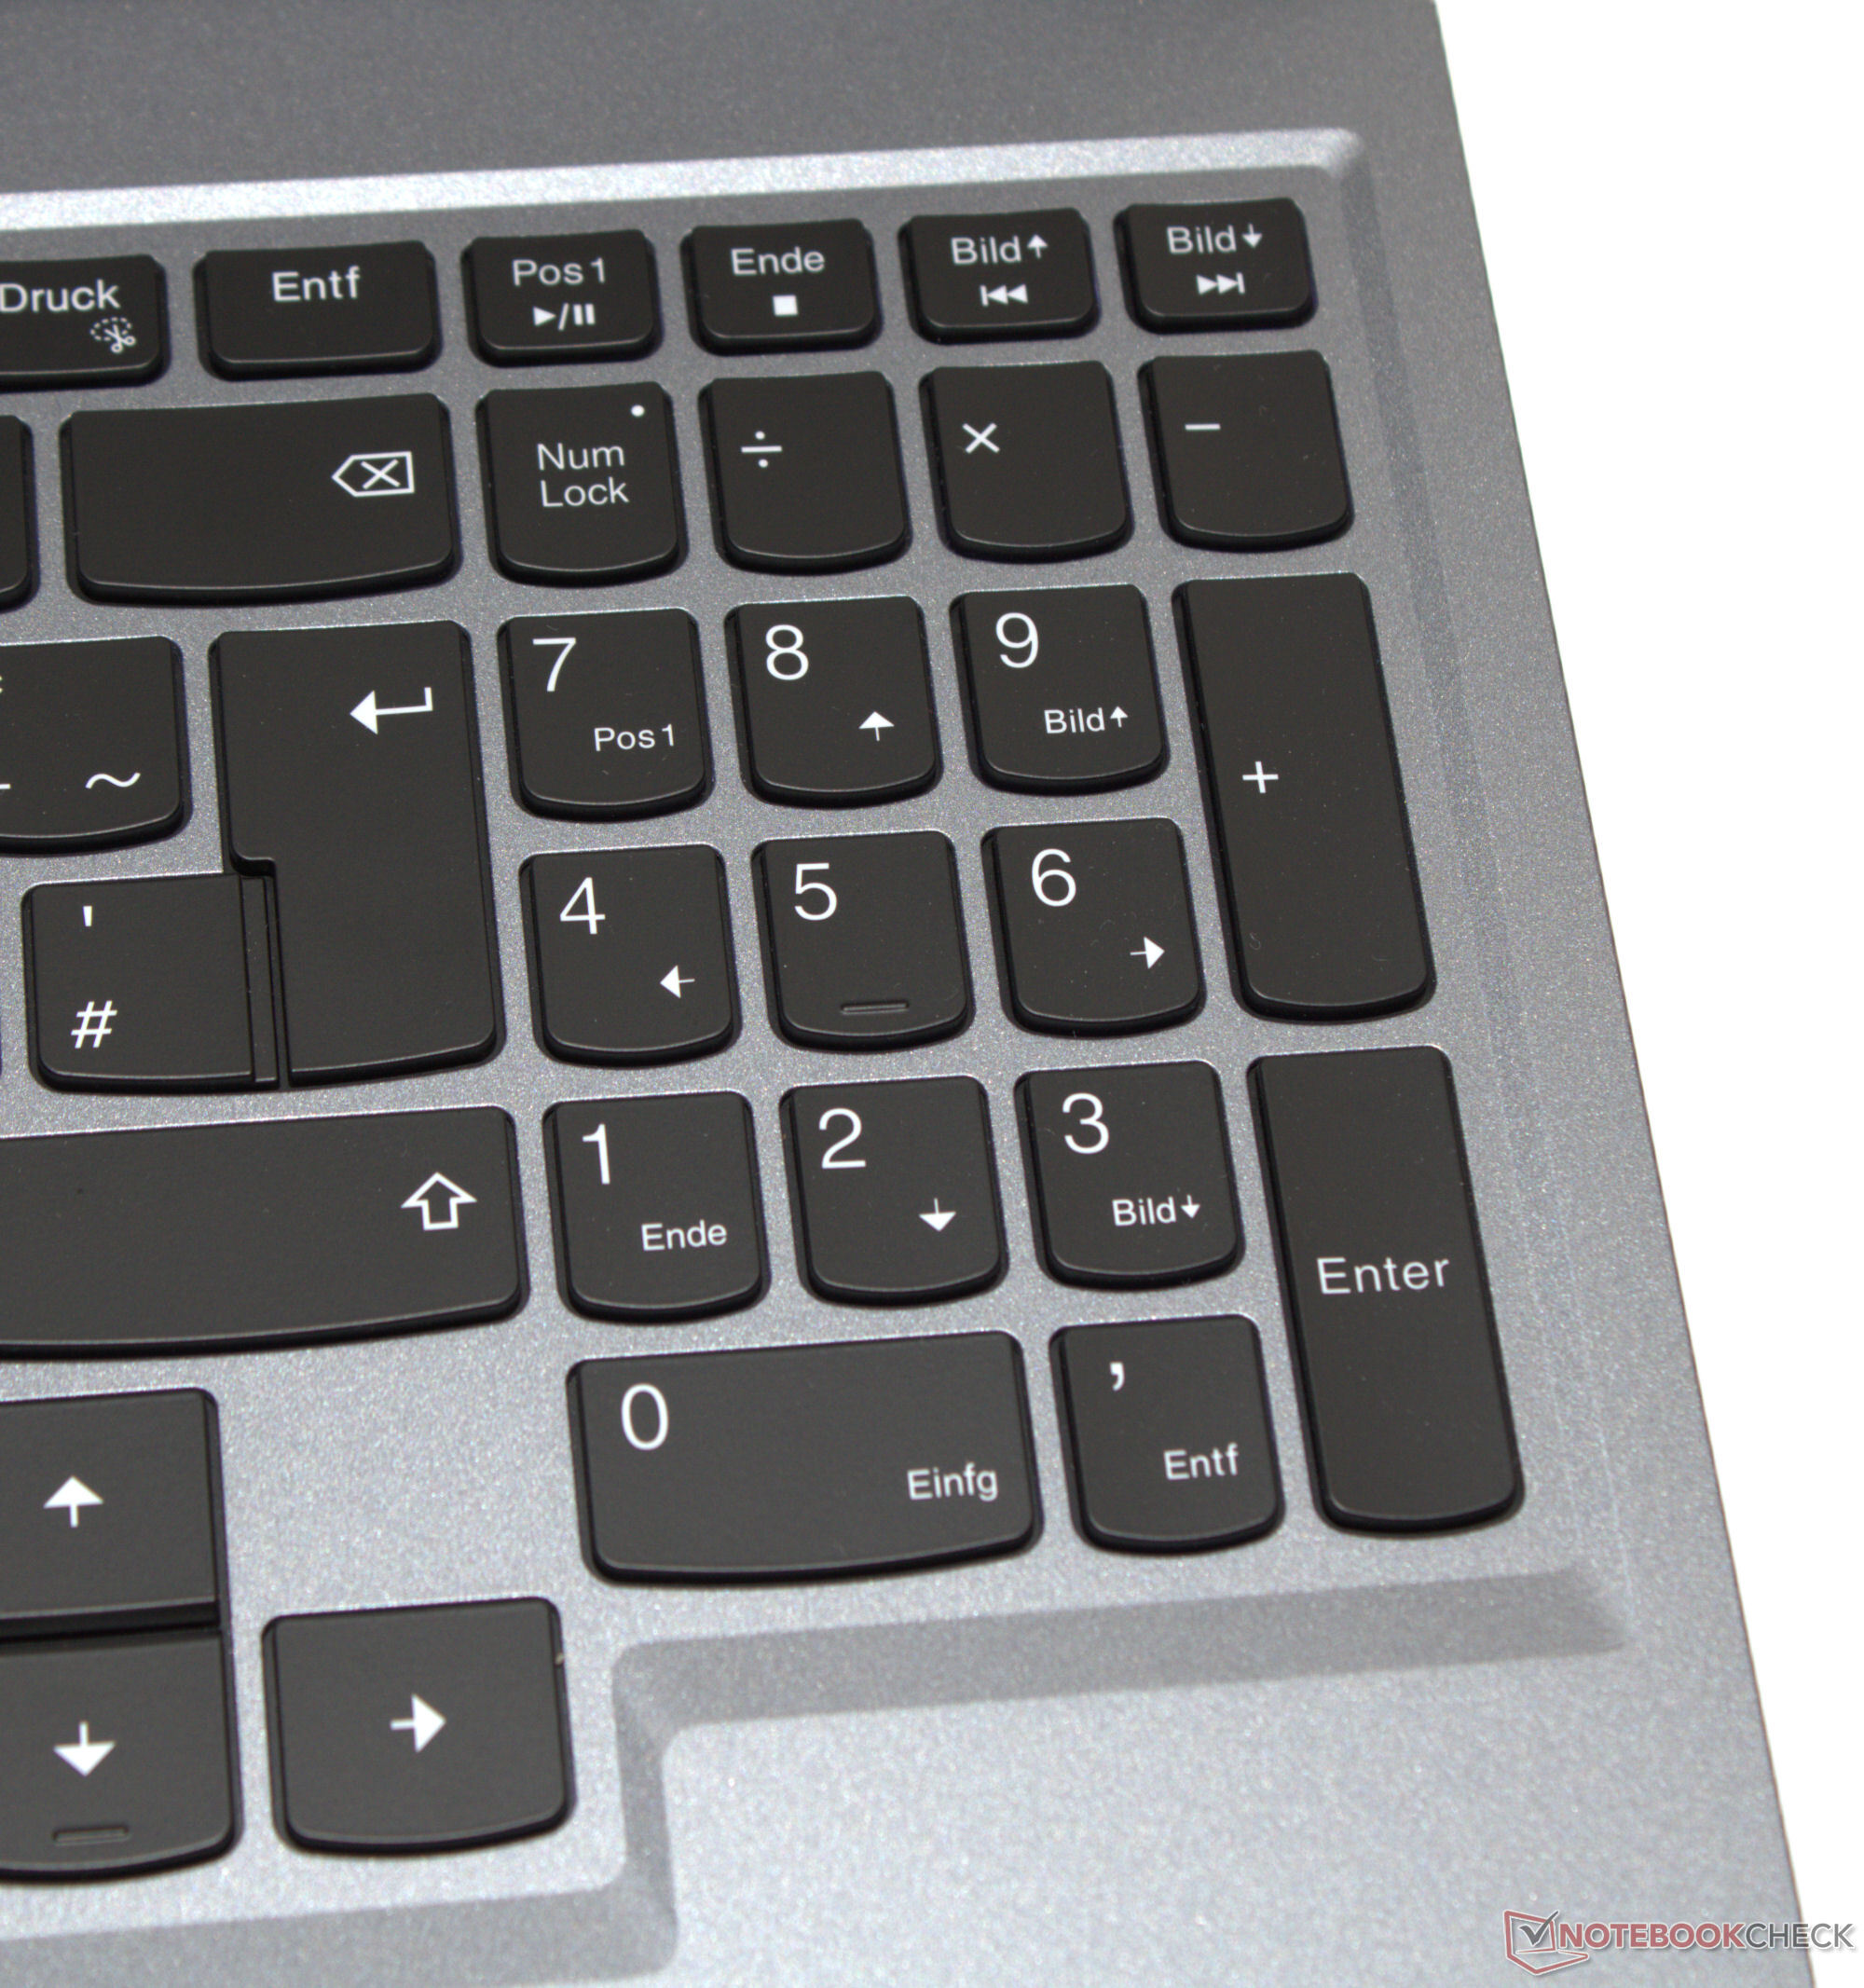
带有白色背光的 Chiclet 键盘延伸至笔记本电脑的整个宽度,而且还配有数字键盘。按键的形状和排列符合我们熟悉的联想布局。凹面按键提供了良好的阻力和清晰的压力点。键盘在键入时略有倾斜,但这不是问题。优点偏移的全尺寸方向键使用起来很舒适。多点触摸点击板(约 12 x 7.5 厘米)具有较短的提升和清晰的压力点,可作为鼠标的替代品。
显示屏 - 板载 IPS
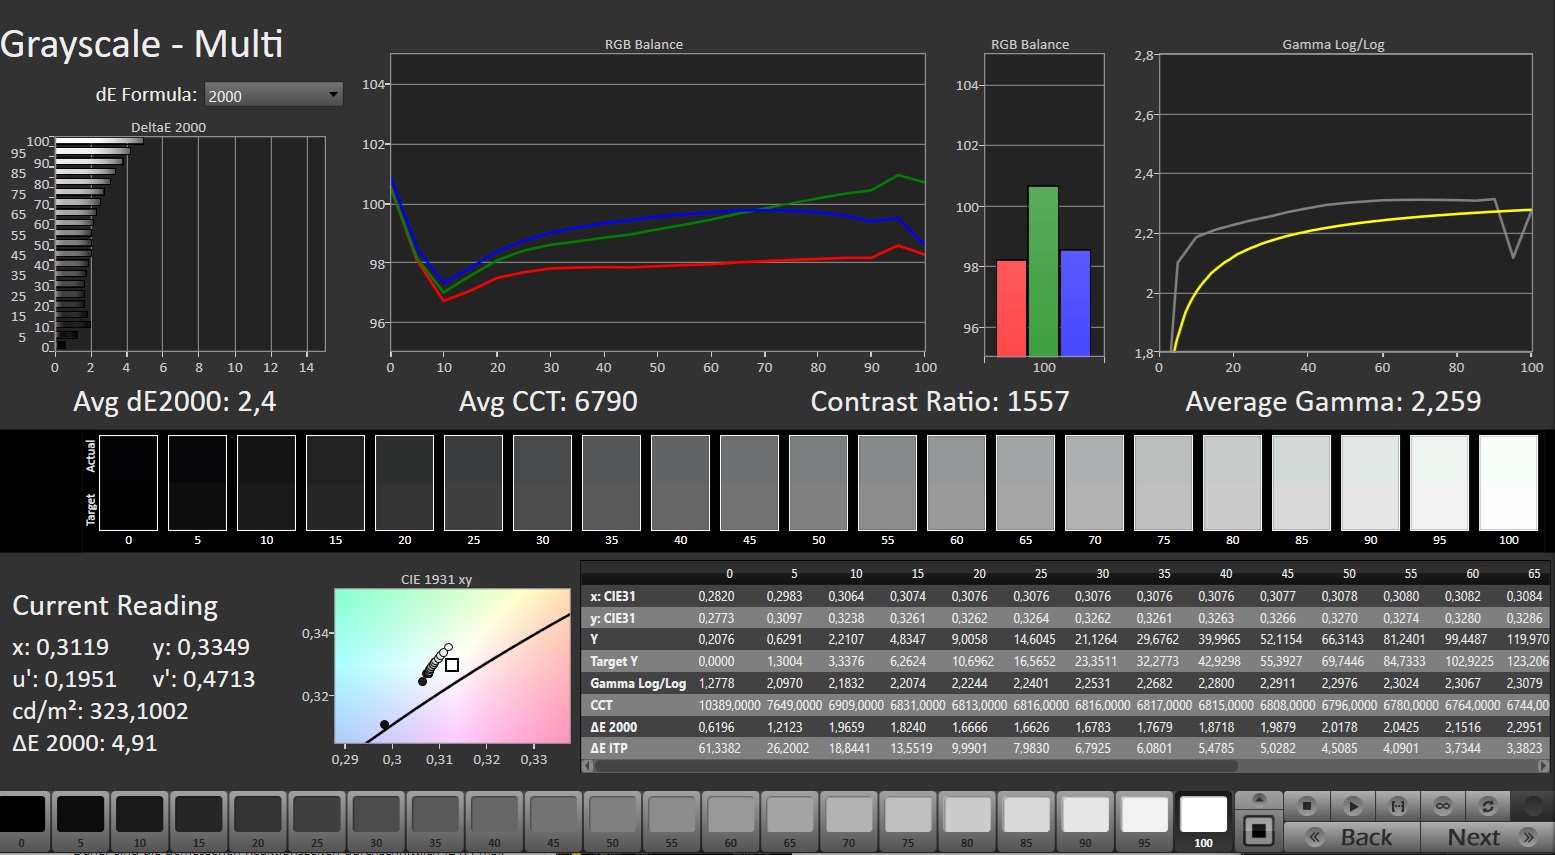
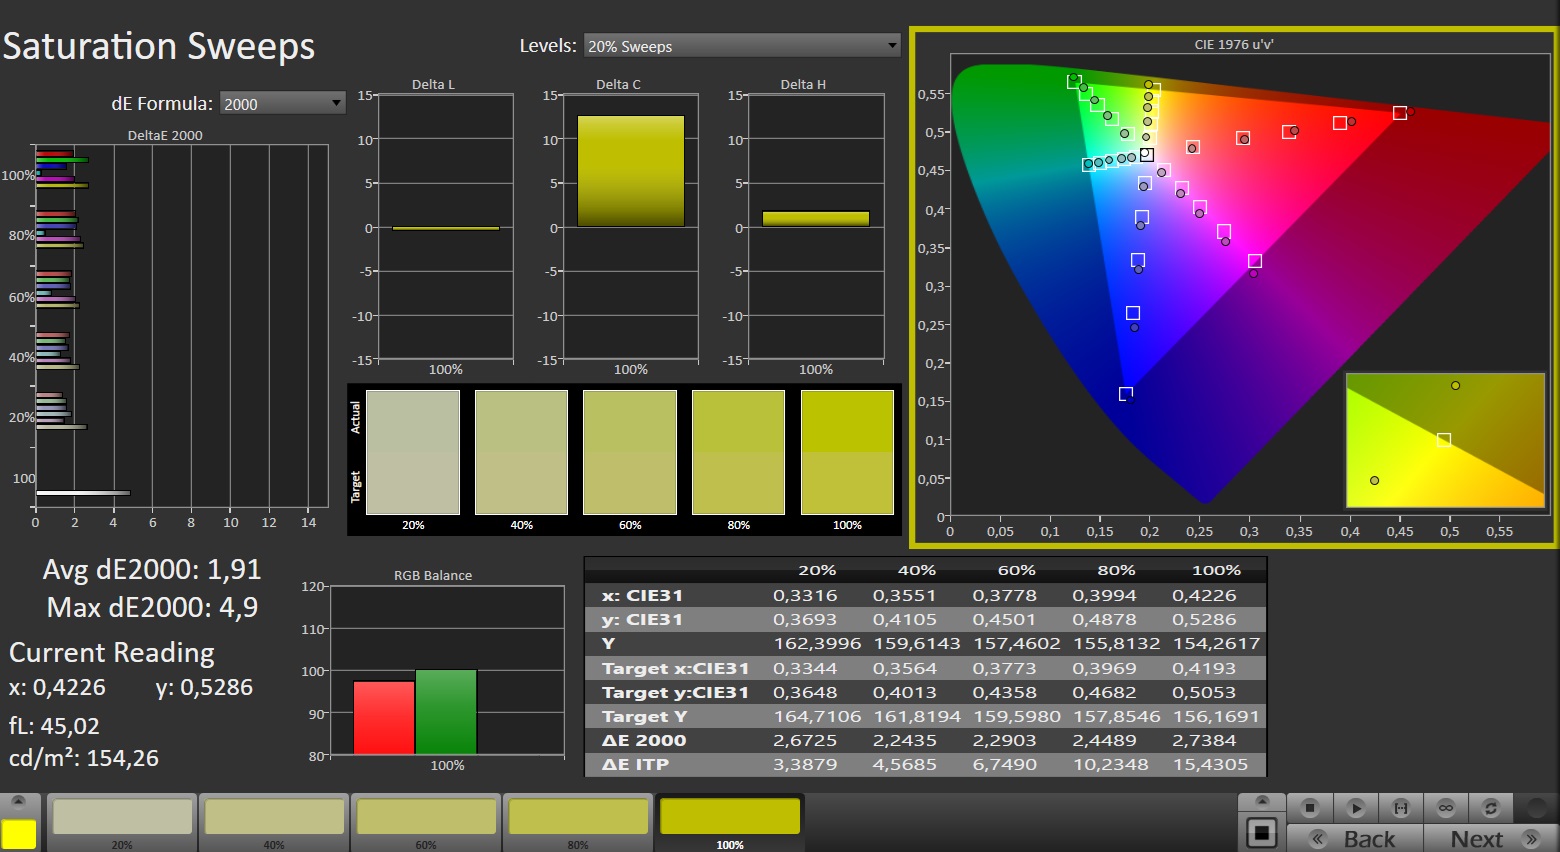
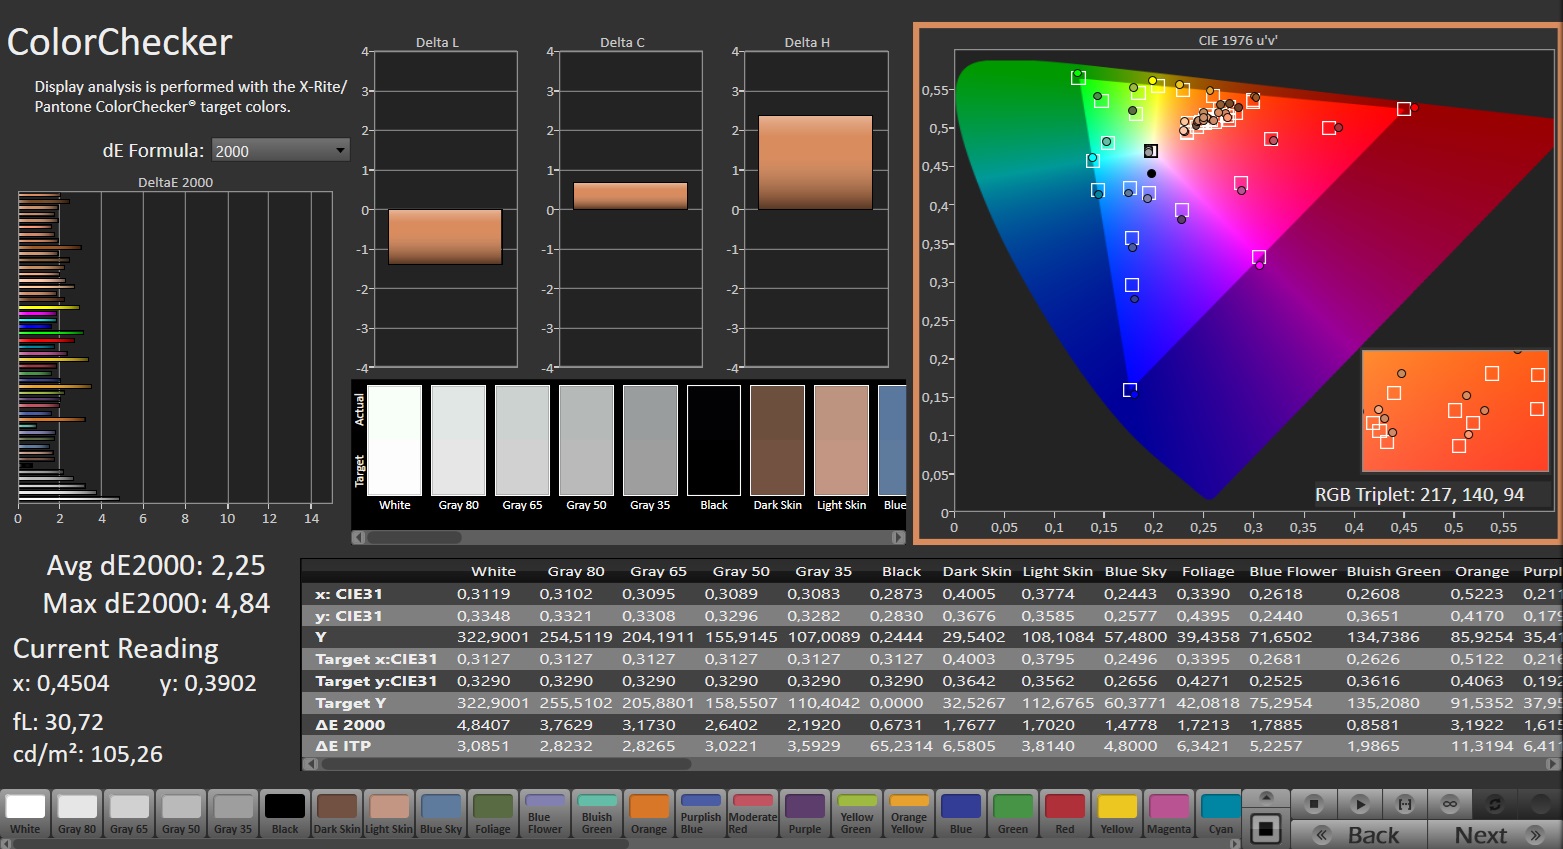
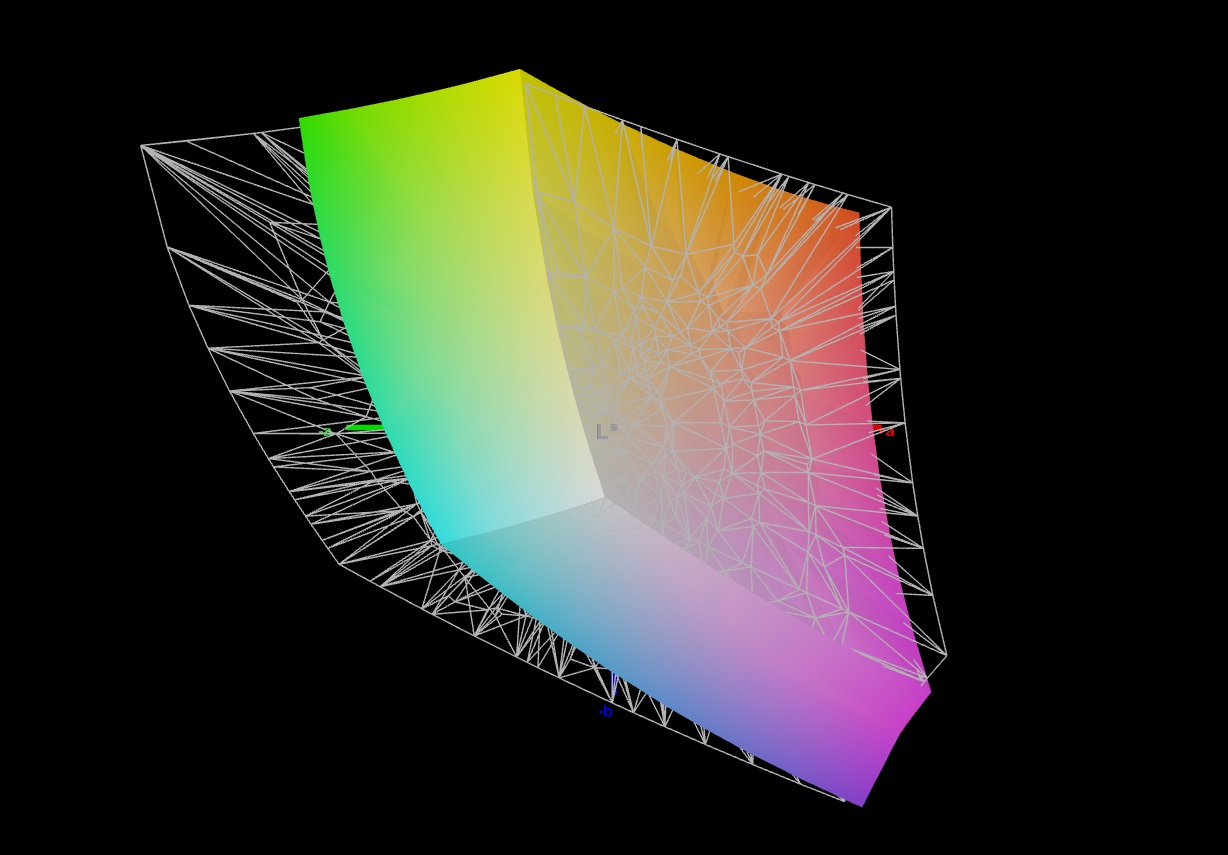
联想为 LOQ 配备了视角稳定的 144 Hz 面板(FHD,IPS),宽高比为 16:9,支持 G-Sync。良好的对比度被略低的最大亮度所抵消。总的来说,该显示屏是为室内使用而设计的,但在天气条件合适的情况下也可以在室外阅读。在我们的测试中没有发现 PWM 闪烁。

| |||||||||||||||||||||||||
Brightness Distribution: 88 %
Center on Battery: 306 cd/m²
Contrast: 1457:1 (Black: 0.21 cd/m²)
ΔE Color 2.25 | 0.5-29.43 Ø4.87, calibrated: 1.45
ΔE Greyscale 2.4 | 0.5-98 Ø5.1
72.6% AdobeRGB 1998 (Argyll 2.2.0 3D)
99.1% sRGB (Argyll 2.2.0 3D)
73.7% Display P3 (Argyll 2.2.0 3D)
Gamma: 2.259
| Lenovo LOQ 15IRX9 BOE NJ NE156FHM-NX9, IPS, 1920x1080, 15.6" | SCHENKER XMG Core 15 (M24) BOE NJ NE153QDM-NZ1 (BOE0C8E), IPS, 2560x1600, 15.3" | Gigabyte G6X 9KG (2024) BOE NE160WUM-NX6, IPS, 1920x1200, 16" | HP Victus 16 (2024) Chi Mei CMN163E, IPS, 1920x1080, 16.1" | Dell G16, i7-13650HX, RTX 4060 Chi Mei CMN161D (160GME), IPS, 2560x1600, 16" | |
|---|---|---|---|---|---|
| Display | 1% | -40% | -41% | -5% | |
| Display P3 Coverage | 73.7 | 73.2 -1% | 41.8 -43% | 41.3 -44% | 67.5 -8% |
| sRGB Coverage | 99.1 | 100 1% | 62.4 -37% | 61.7 -38% | 98.5 -1% |
| AdobeRGB 1998 Coverage | 72.6 | 74.6 3% | 43.3 -40% | 42.7 -41% | 69.3 -5% |
| Response Times | 68% | 4% | 25% | 68% | |
| Response Time Grey 50% / Grey 80% * | 42.2 ? | 9.6 ? 77% | 40.5 ? 4% | 28.6 ? 32% | 7.6 ? 82% |
| Response Time Black / White * | 22.6 ? | 9.2 ? 59% | 21.6 ? 4% | 18.7 ? 17% | 10.4 ? 54% |
| PWM Frequency | |||||
| Screen | 6% | -68% | -78% | -15% | |
| Brightness middle | 306 | 635 108% | 353 15% | 287 -6% | 369 21% |
| Brightness | 287 | 604 110% | 318 11% | 288 0% | 344 20% |
| Brightness Distribution | 88 | 91 3% | 81 -8% | 86 -2% | 89 1% |
| Black Level * | 0.21 | 0.64 -205% | 0.21 -0% | 0.19 10% | 0.26 -24% |
| Contrast | 1457 | 992 -32% | 1681 15% | 1511 4% | 1419 -3% |
| Colorchecker dE 2000 * | 2.25 | 1.89 16% | 5.21 -132% | 5.46 -143% | 3.04 -35% |
| Colorchecker dE 2000 max. * | 4.84 | 3.14 35% | 19.95 -312% | 20.36 -321% | 5.56 -15% |
| Colorchecker dE 2000 calibrated * | 1.45 | 1.14 21% | 3.61 -149% | 3.52 -143% | 2.35 -62% |
| Greyscale dE 2000 * | 2.4 | 2.53 -5% | 3.6 -50% | 4.8 -100% | 3.38 -41% |
| Gamma | 2.259 97% | 2.36 93% | 2.367 93% | 2.108 104% | 2.47 89% |
| CCT | 6790 96% | 6434 101% | 7138 91% | 6442 101% | 6040 108% |
| Total Average (Program / Settings) | 25% /
14% | -35% /
-52% | -31% /
-55% | 16% /
-1% |
* ... smaller is better
开箱即用,显示屏校准良好:偏差约为 2.25,达到了目标值(DeltaE < 3)。对屏幕进行校准后,偏差降至 1.45,确保了灰阶色调更加均衡。该面板几乎可以完整地显示 sRGB 空间,但无法显示 AdobeRGB 和 DCI P3 空间。
Display Response Times
| ↔ Response Time Black to White | ||
|---|---|---|
| 22.6 ms ... rise ↗ and fall ↘ combined | ↗ 11.2 ms rise | 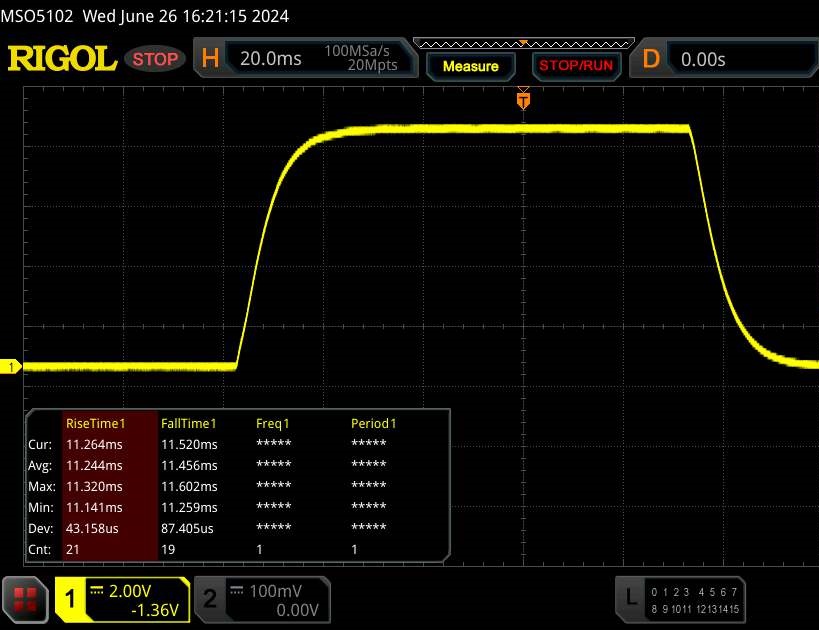 |
| ↘ 11.4 ms fall | ||
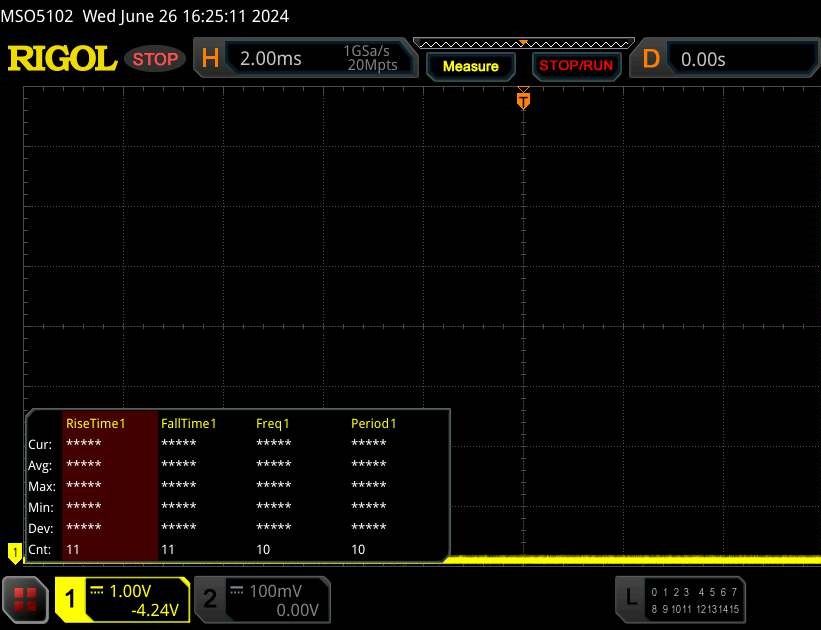
| The screen shows good response rates in our tests, but may be too slow for competitive gamers. In comparison, all tested devices range from 0.1 (minimum) to 240 (maximum) ms. » 48 % of all devices are better. This means that the measured response time is similar to the average of all tested devices (20.8 ms). | ||
| ↔ Response Time 50% Grey to 80% Grey | ||
| 42.2 ms ... rise ↗ and fall ↘ combined | ↗ 19.1 ms rise | 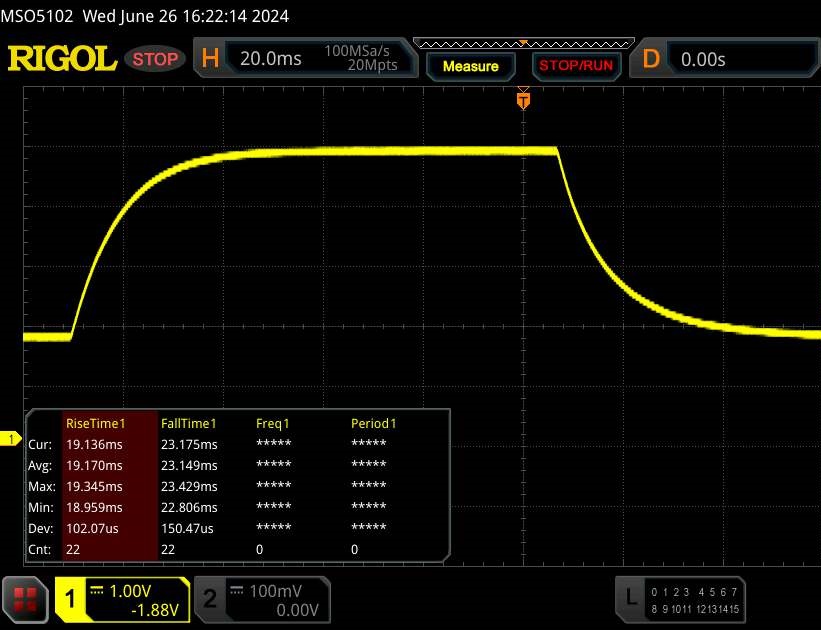 |
| ↘ 23.1 ms fall | ||
| The screen shows slow response rates in our tests and will be unsatisfactory for gamers. In comparison, all tested devices range from 0.165 (minimum) to 636 (maximum) ms. » 68 % of all devices are better. This means that the measured response time is worse than the average of all tested devices (32.5 ms). | ||
Screen Flickering / PWM (Pulse-Width Modulation)
| Screen flickering / PWM not detected |  | ||
In comparison: 53 % of all tested devices do not use PWM to dim the display. If PWM was detected, an average of 8516 (minimum: 5 - maximum: 343500) Hz was measured. | |||
性能 - Raptor Lake 和 Ada Lovelace 为笔记本电脑提供动力
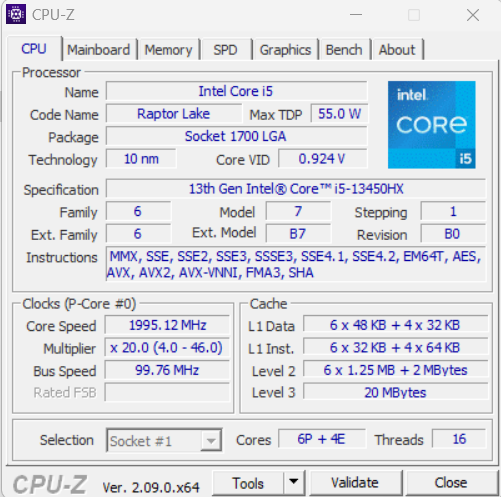
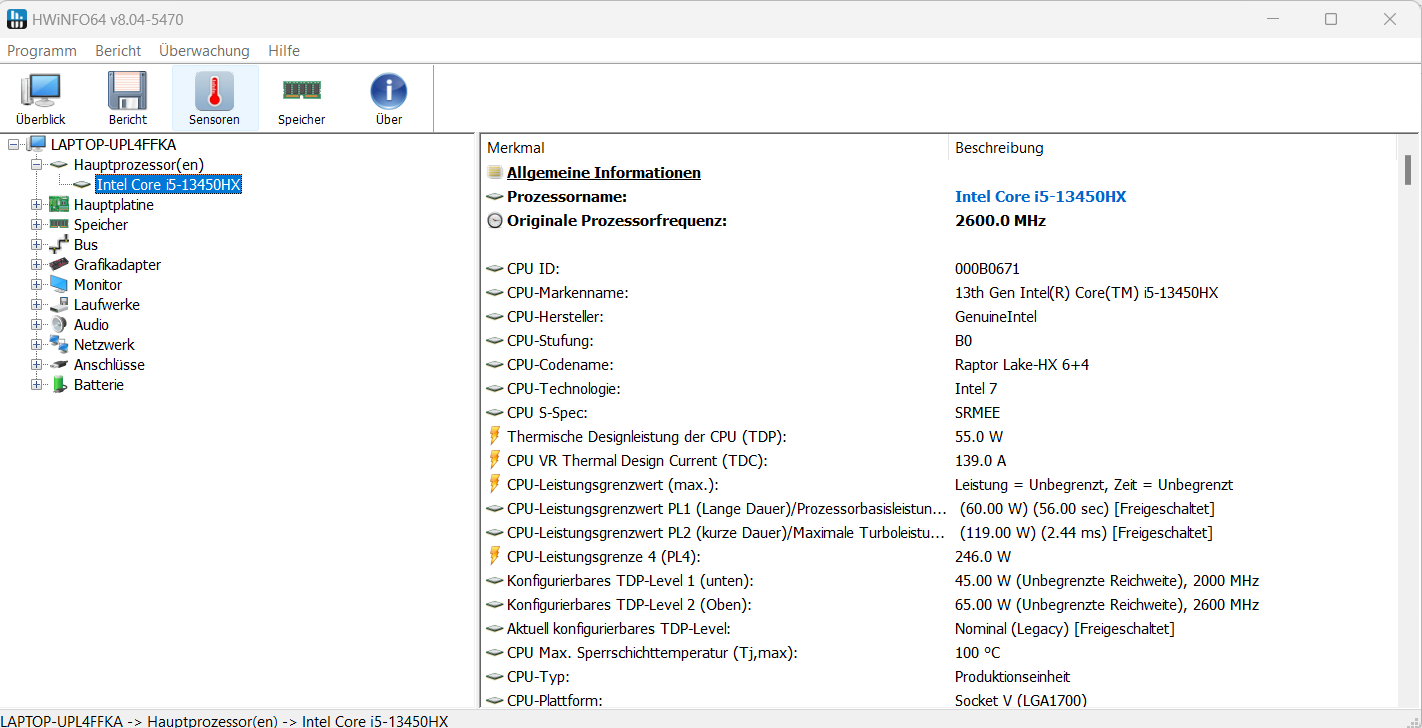
LOQ 机型是入门级游戏笔记本电脑。联想提供各种不同的配置--既有 AMD APU,也有英特尔 CPU。Raptor Lake 和 Ada Lovelace(酷睿 i5-13450HX 和GeForce RTX 4060)为本测试设备提供了动力。它的售价约为 1,300 美元(含 Windows 11)或略高于 1,000 美元(不含 Windows)。
测试条件
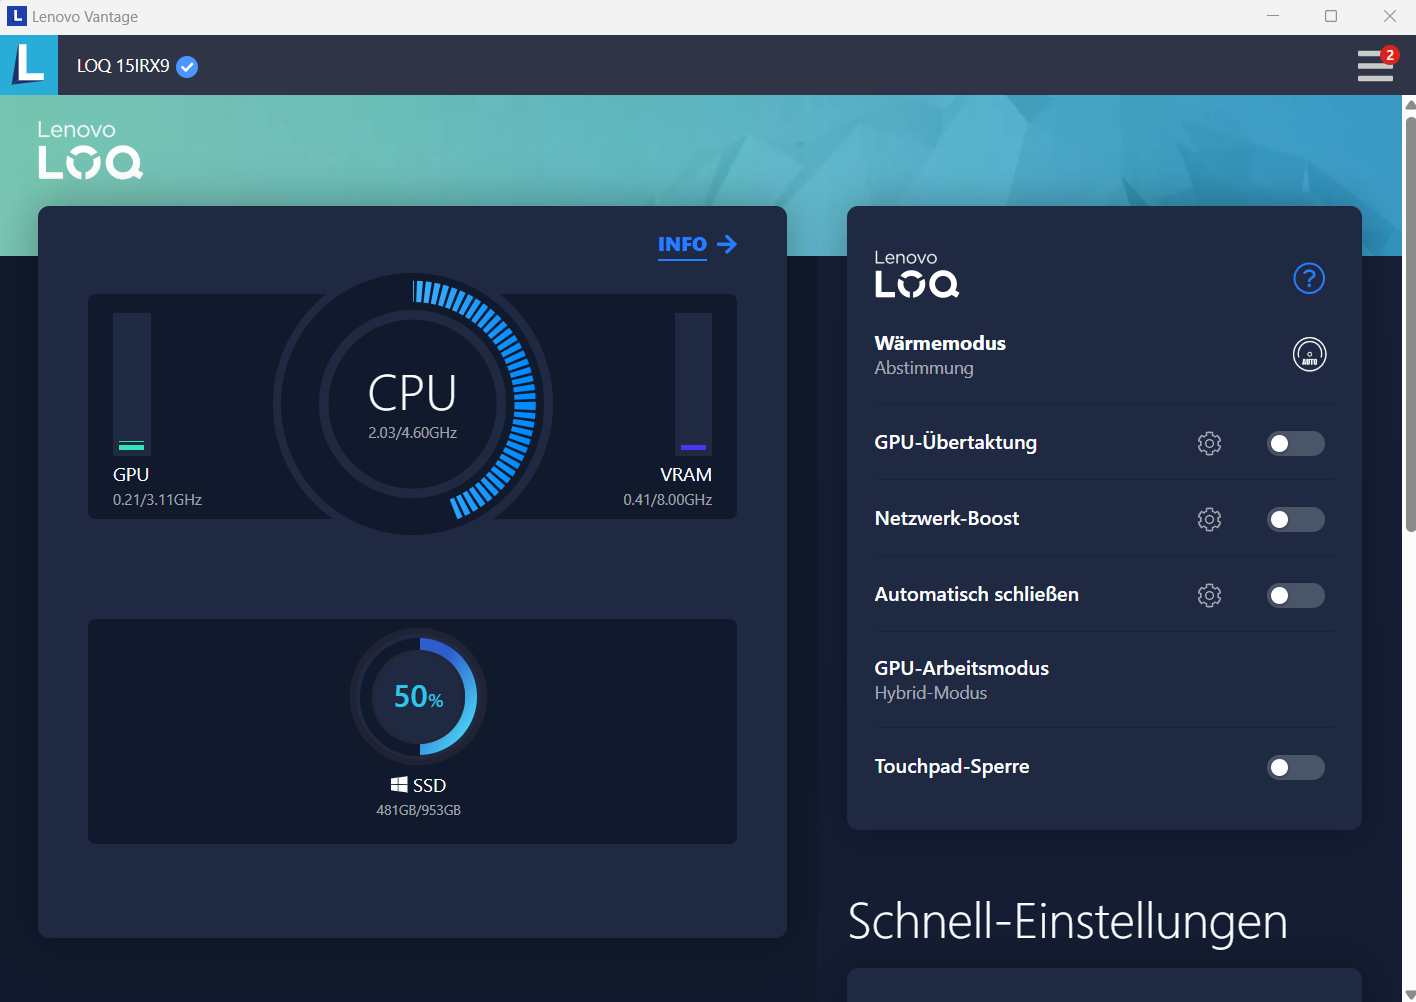
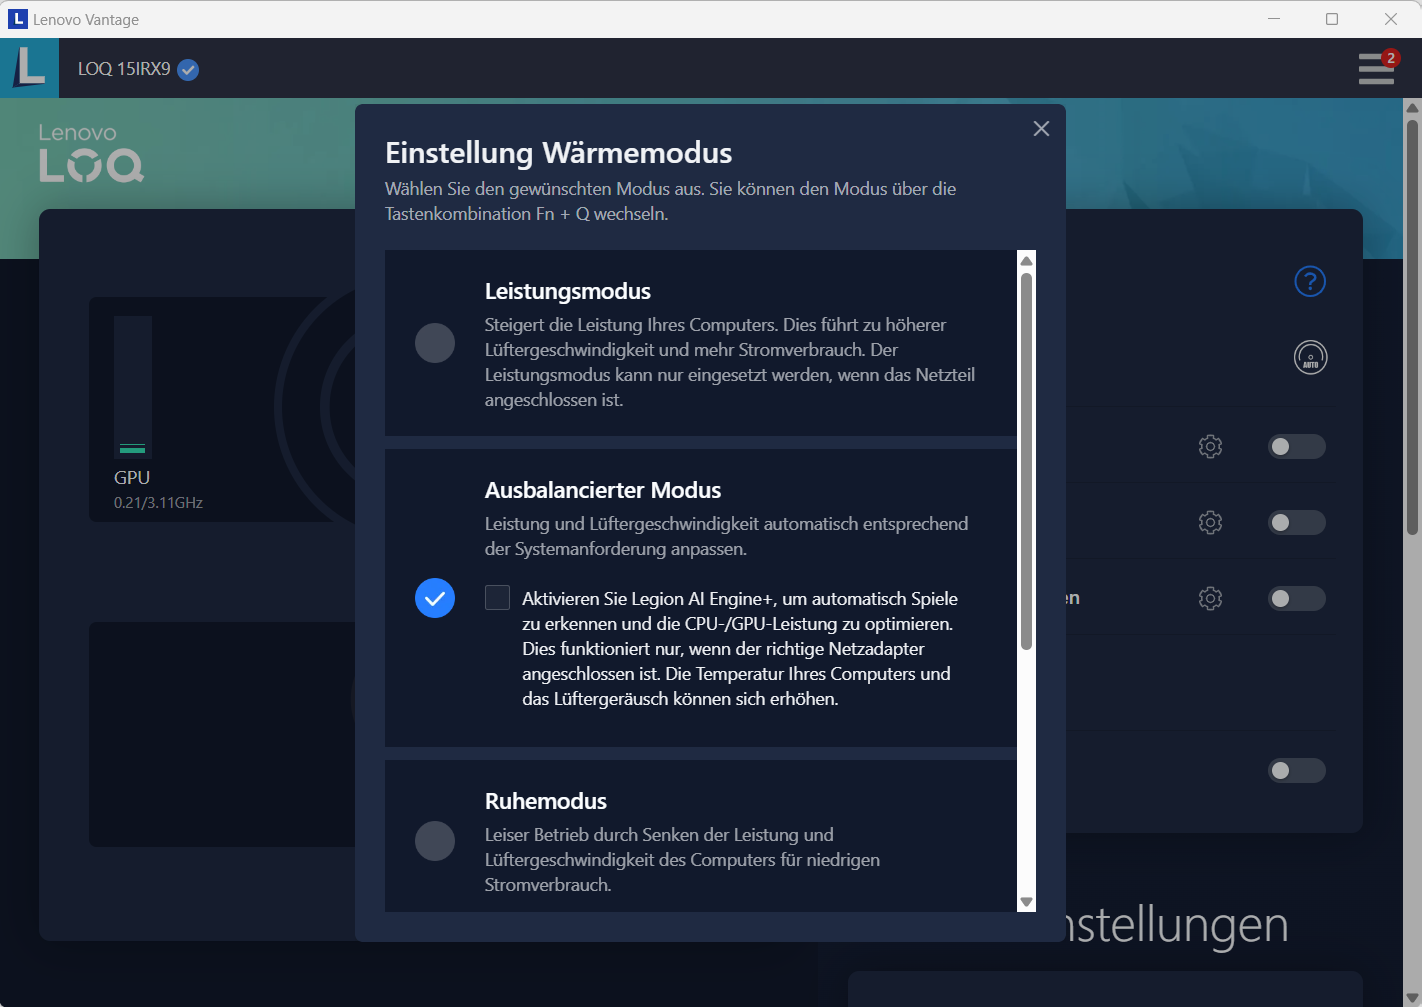
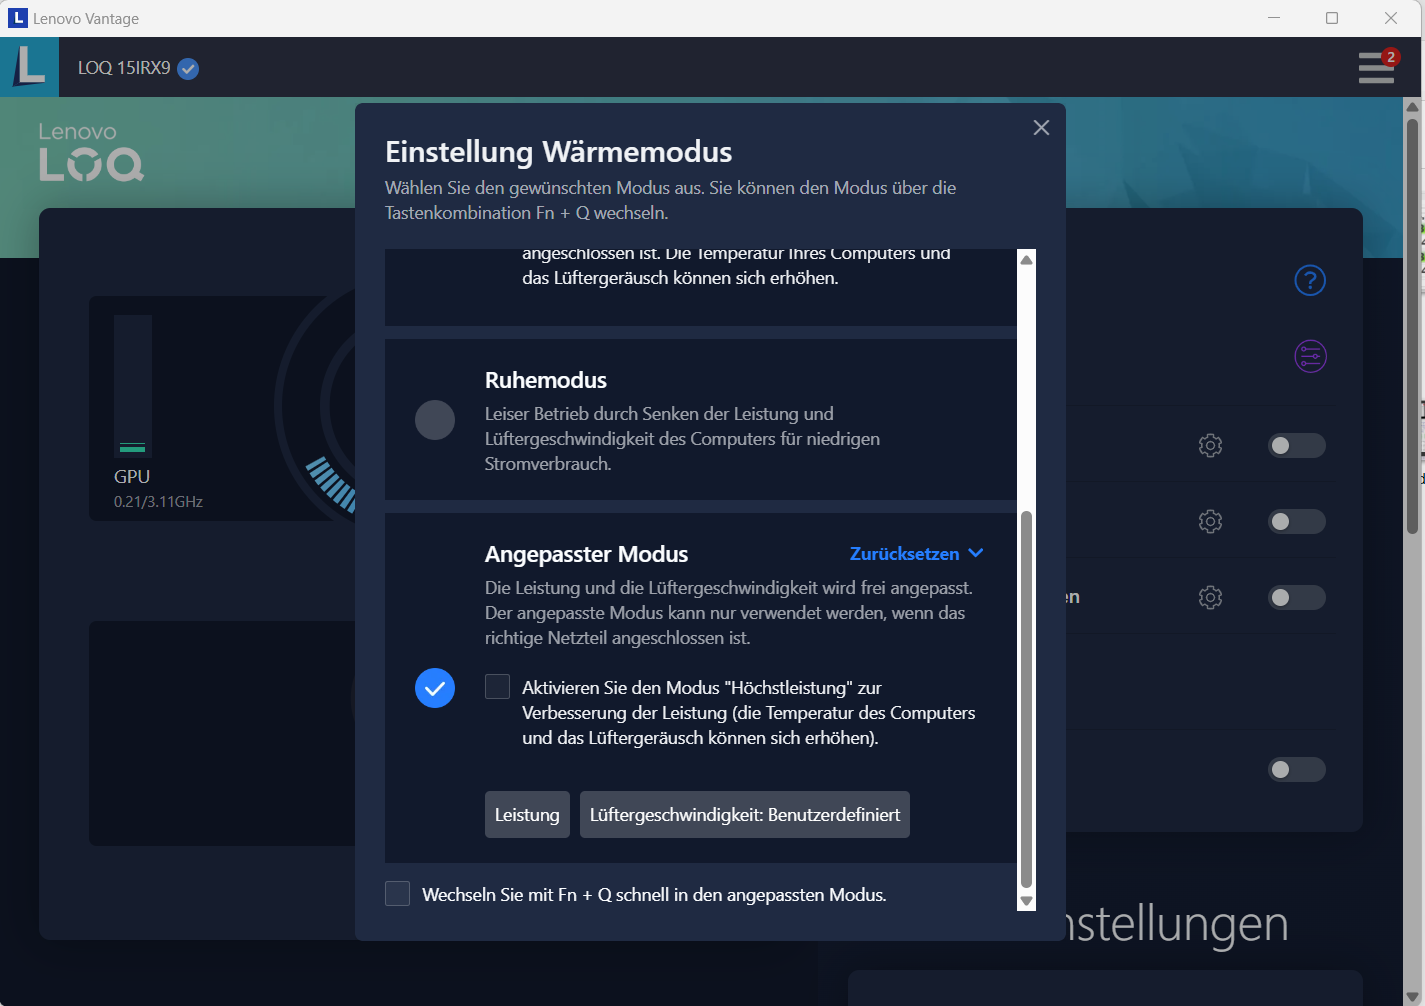
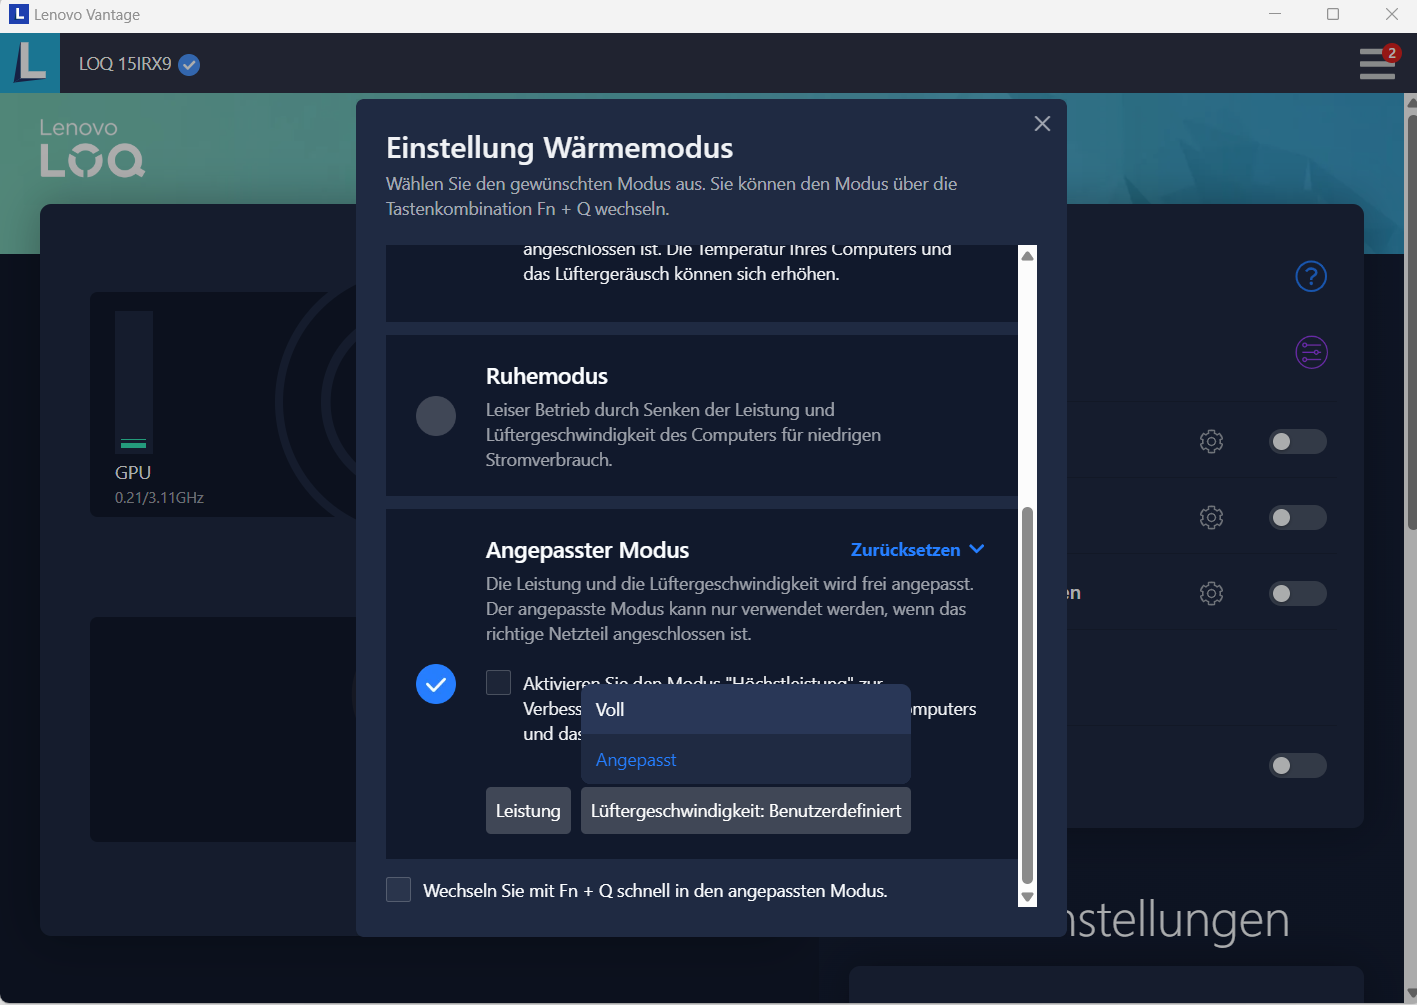
笔记本电脑提供三种制造商特定的性能模式(见表),可通过组合键 "Fn "+"Q "进行切换。我们使用了平衡模式(基准测试)和安静模式(电池测试)。
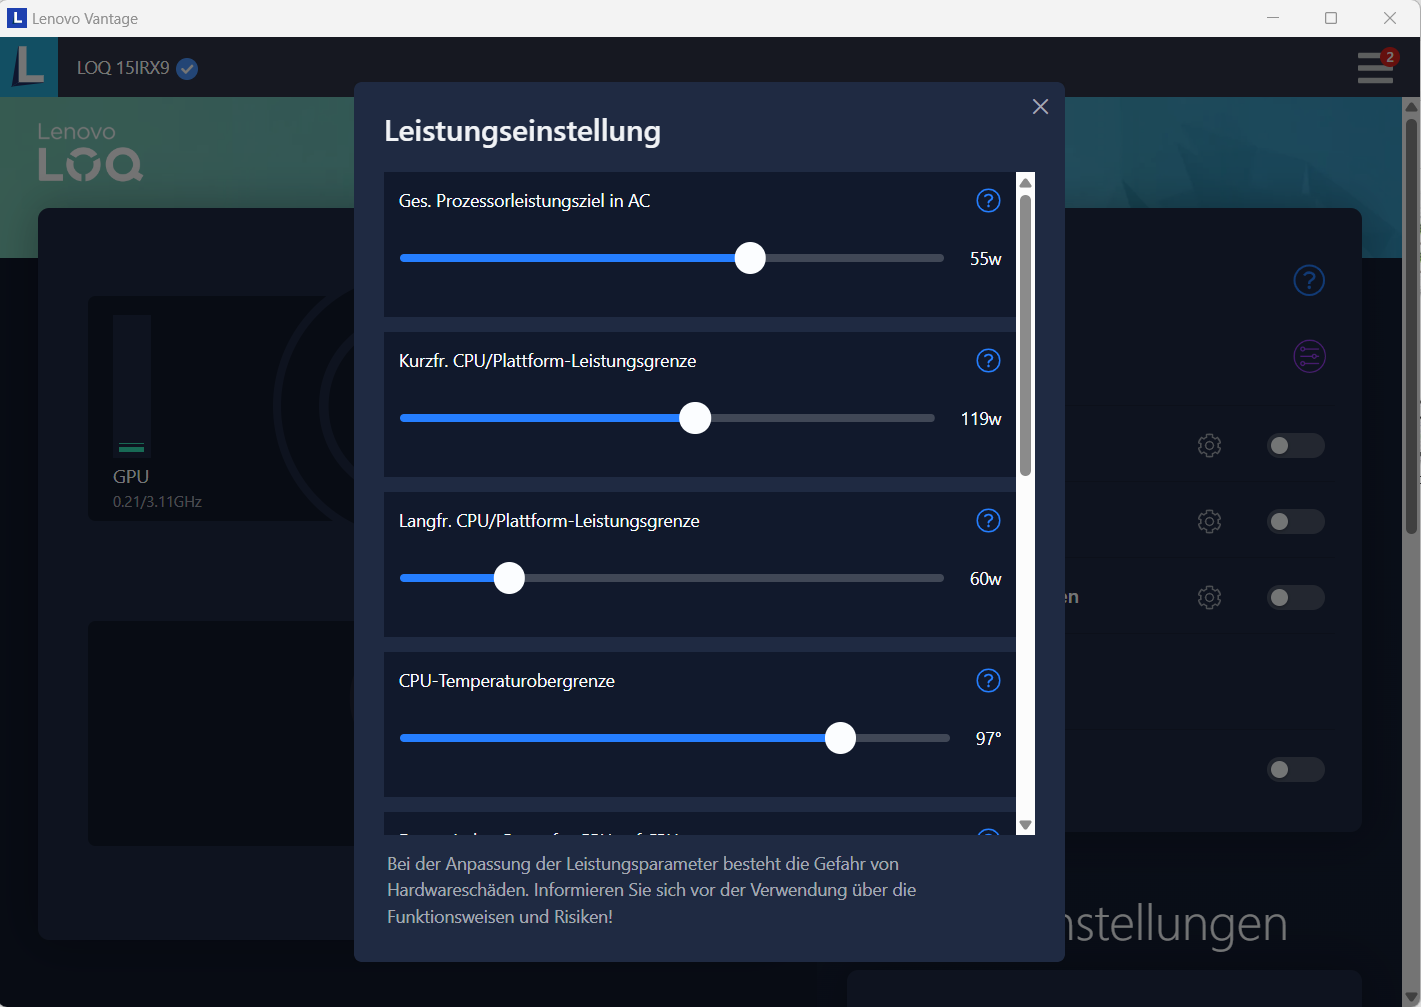
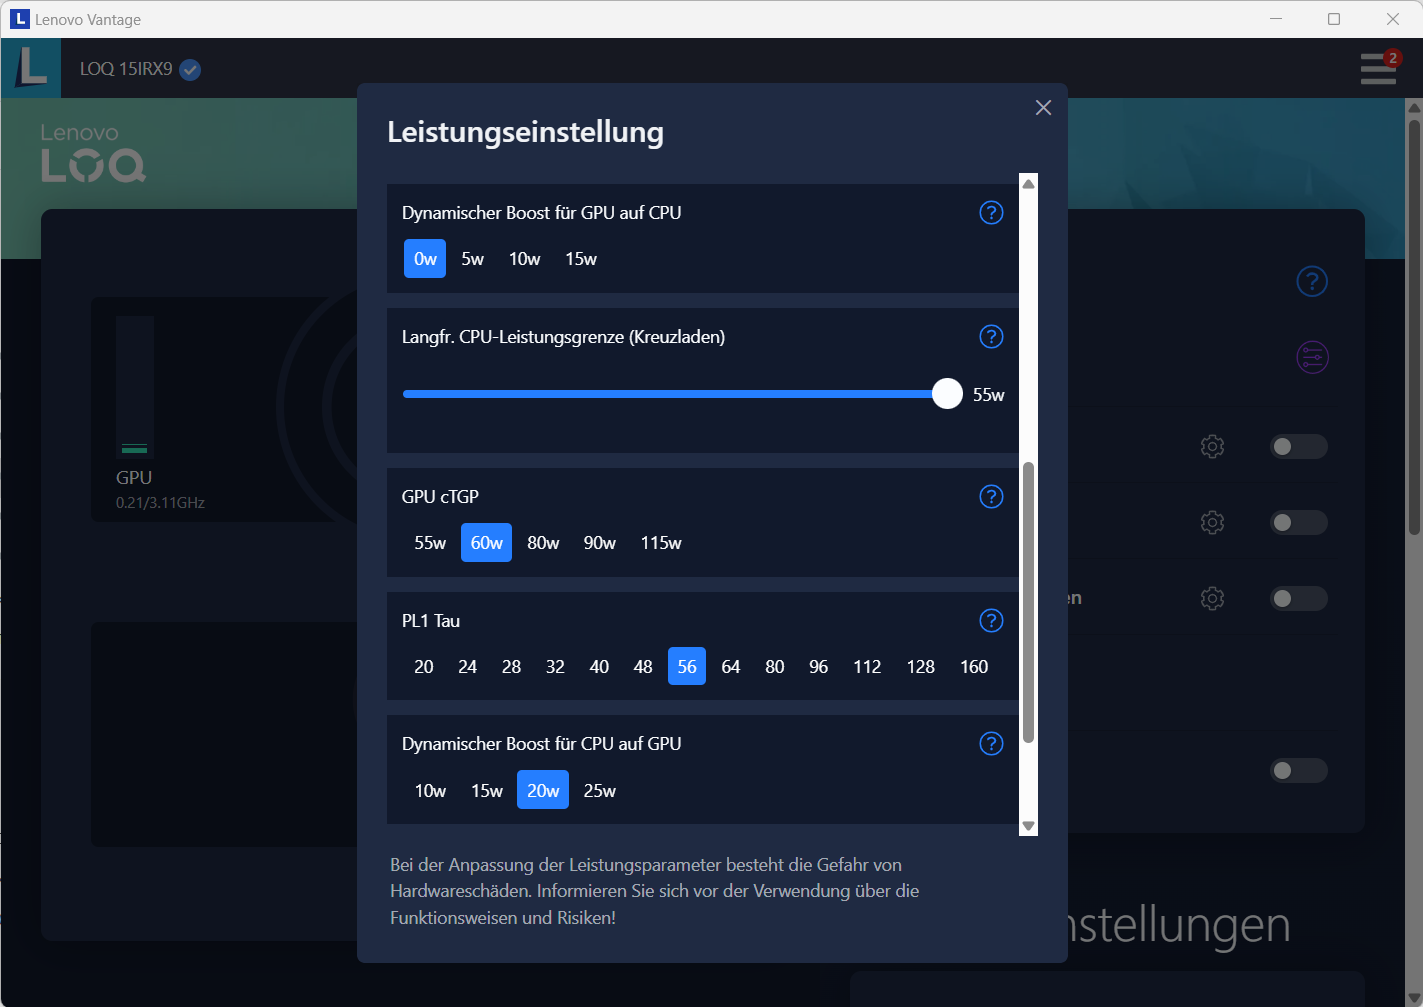
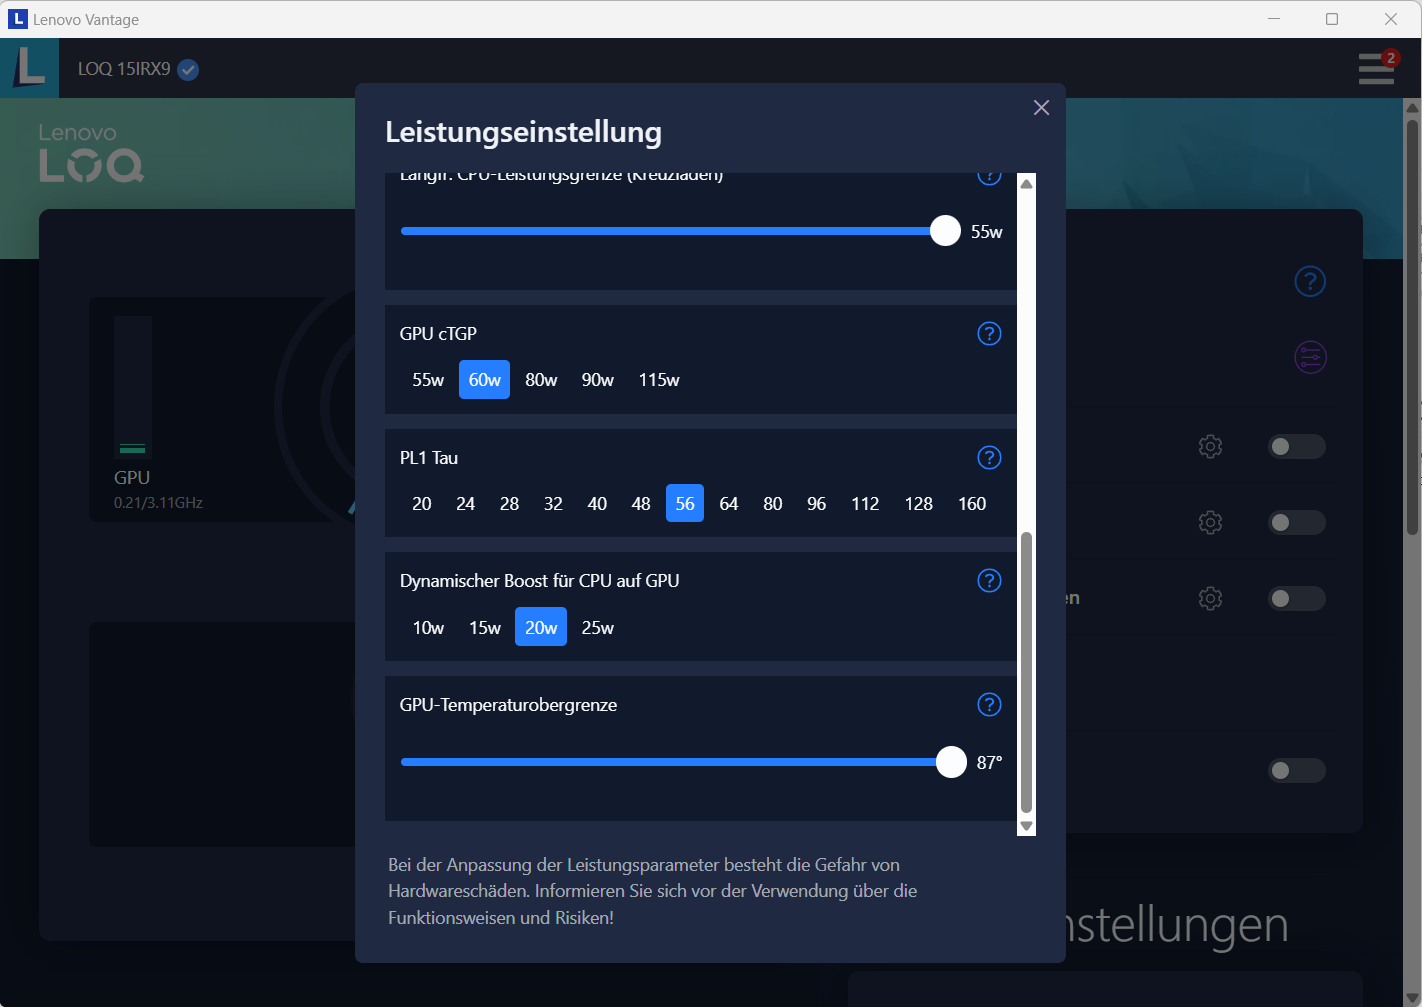
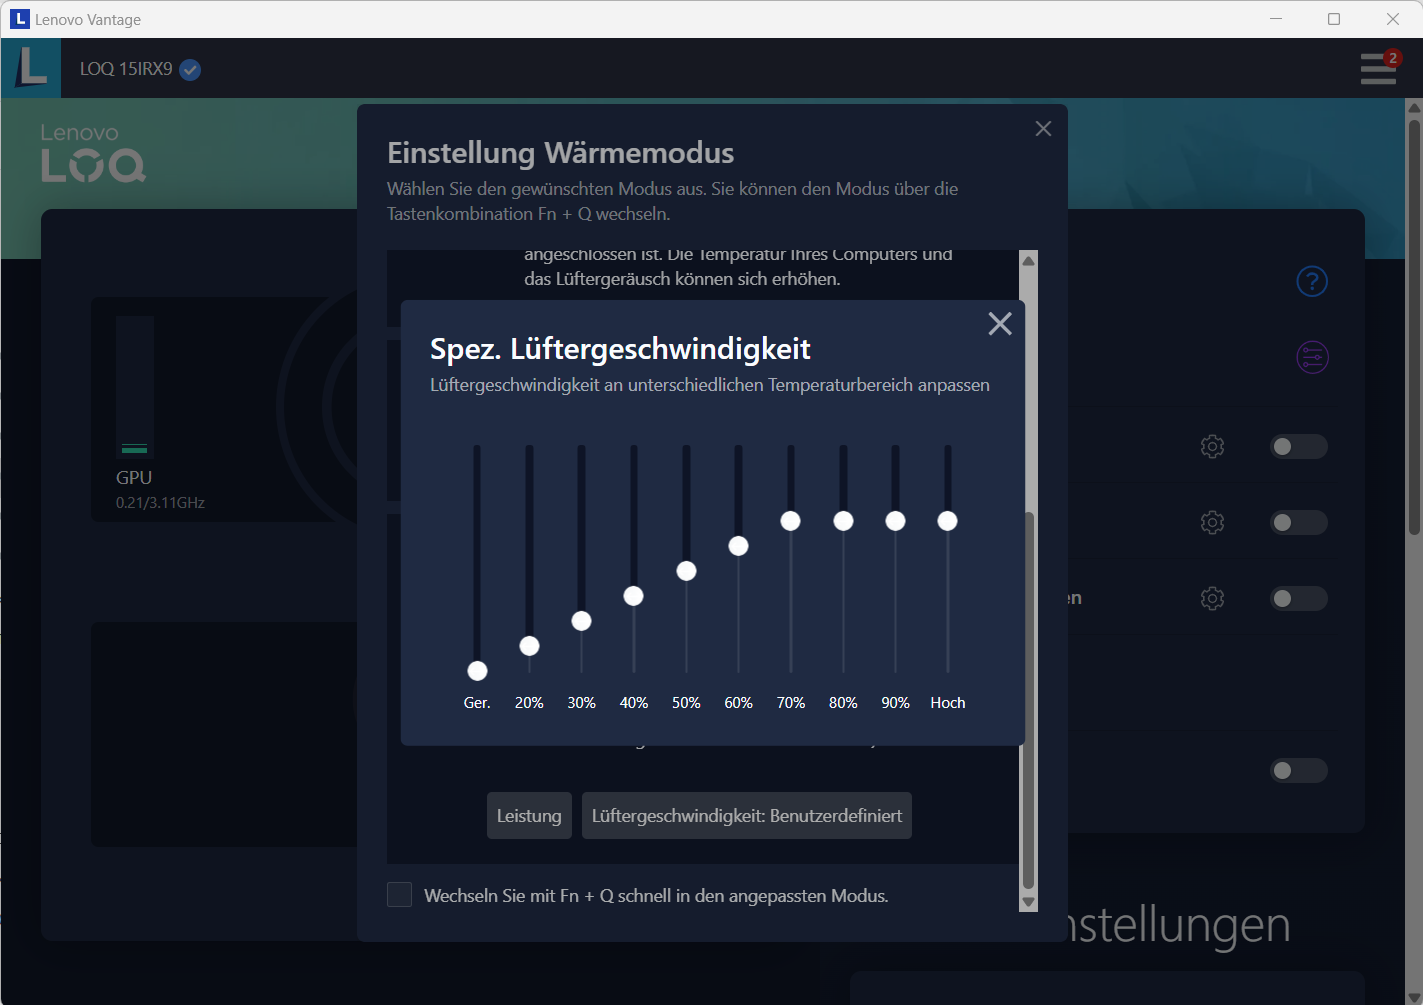
第四种模式(自定义)可通过联想 Vantage(笔记本电脑的控制中心)选择。这样就可以单独设置处理器(功率限制)或图形处理器(TGP、动态提升、温度限制)的性能设置和风扇速度。还可以独立于配置文件对 GPU 和显存进行超频。
| 性能模式 | 平衡模式 | 静音模式 | |
|---|---|---|---|
| 功率限制 1 (HWInfo) | 90 瓦 | 60 瓦 | 55 瓦 |
| 功率限制 2 (HWInfo) | 162 瓦 | 119 瓦 | 65 瓦 |
| 噪音 (CP 2077 Phantom Liberty) | 54 dB(A) | 48 dB(A) | 39 dB(A) |
| 性能(CP 2077 Phantom Liberty) | 70 fps | 66 fps | 52 fps |
处理器
酷睿 i5-13450HX 酷睿 i5-13450HXRaptor Lake)的 10 个 CPU 内核(6P + 4E = 16 个线程)的最高时钟频率分别为 4.6 GHz(P)和 3.4 GHz(E)。连续多线程负载(CB15 Loop)导致其时钟频率从第一次运行到第四次运行(平衡模式)一直下降。之后,它保持稳定。性能模式则将时钟频率保持在较高水平。
基准测试结果正如我们所料(平衡模式),性能模式带来了(非常小的)优势。在比较范围内,酷睿 i5 的表现最差,因为它的计算核心数量最少。对于预算有限的游戏玩家来说,这款 CPU 是一个合适的选择。
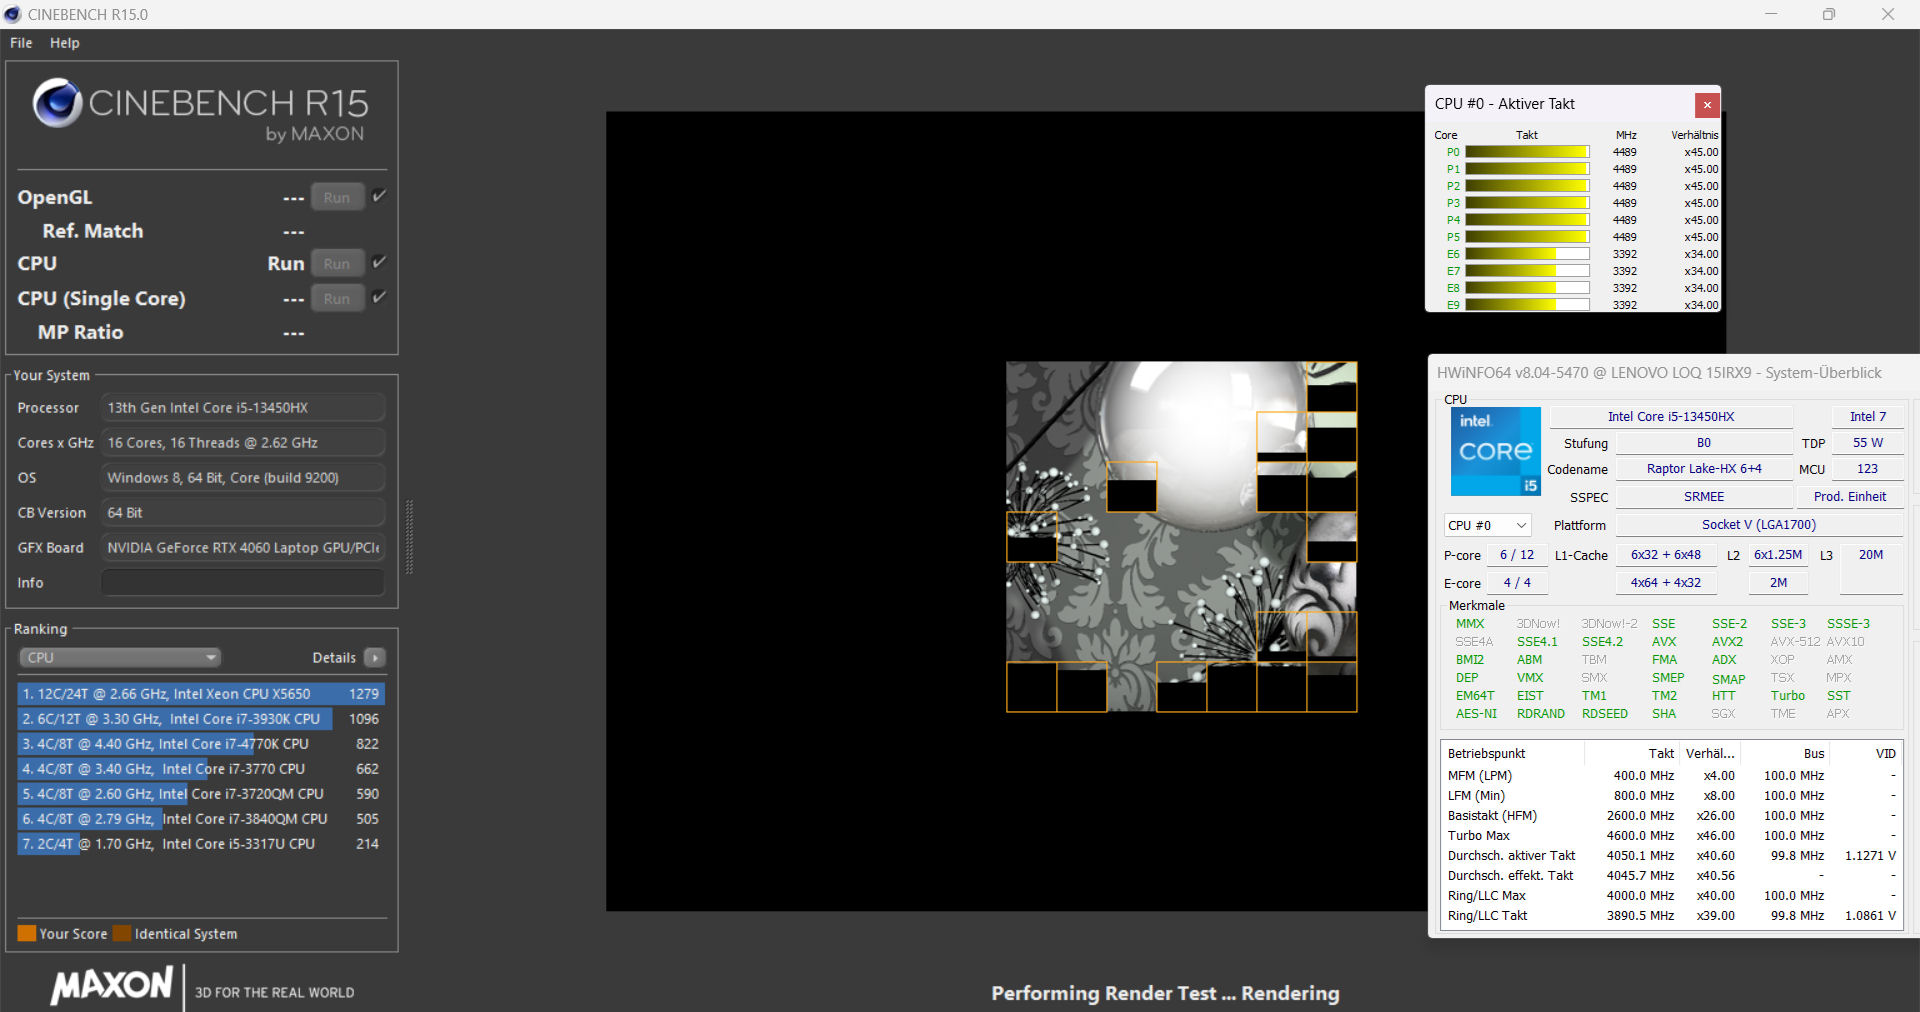
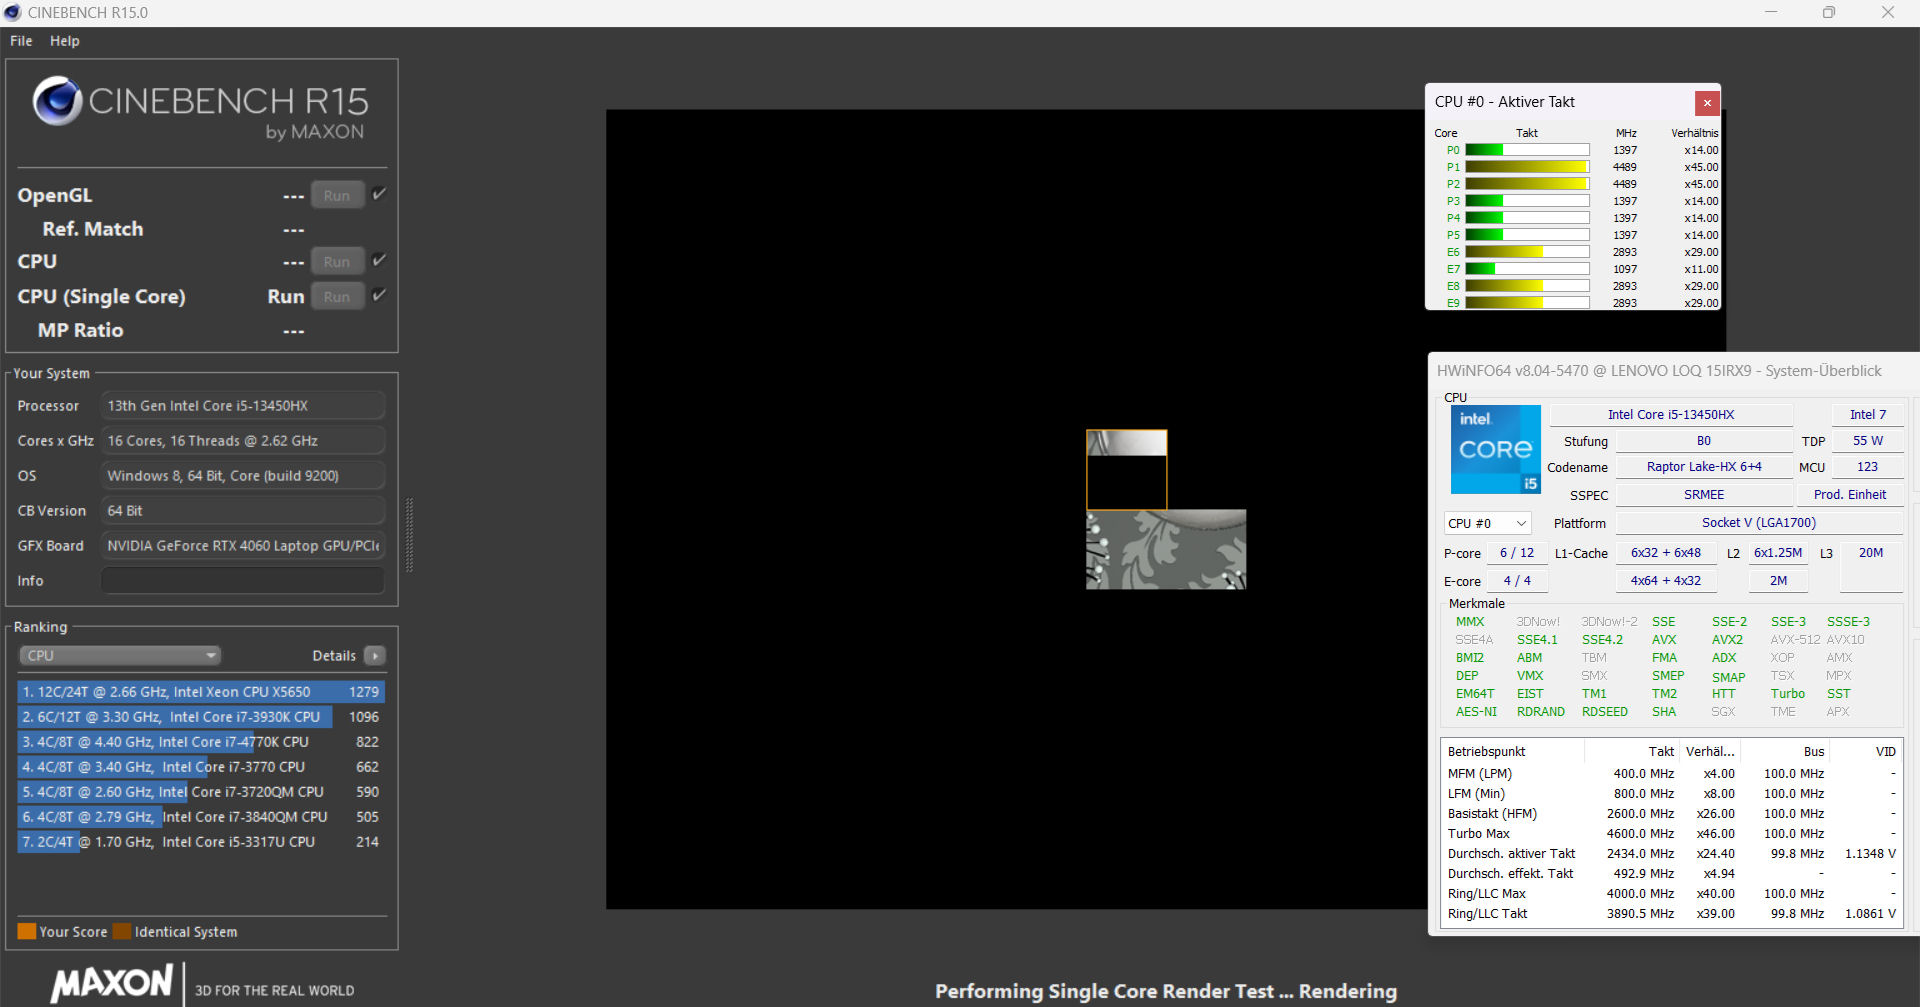
Cinebench R15 Multi continuous test
| CPU Performance Rating - Percent | |
| Average of class Gaming | |
| HP Victus 16 (2024) | |
| SCHENKER XMG Core 15 (M24) | |
| Dell G16, i7-13650HX, RTX 4060 | |
| Gigabyte G6X 9KG (2024) | |
| Lenovo LOQ 15IRX9 | |
| Average Intel Core i5-13450HX | |
| Lenovo LOQ 15IRX9 | |
| Cinebench R23 | |
| Multi Core | |
| HP Victus 16 (2024) | |
| Average of class Gaming (5668 - 39652, n=151, last 2 years) | |
| Dell G16, i7-13650HX, RTX 4060 | |
| Gigabyte G6X 9KG (2024) | |
| SCHENKER XMG Core 15 (M24) | |
| Lenovo LOQ 15IRX9 (Leistungsmodus) | |
| Average Intel Core i5-13450HX (16575 - 17234, n=3) | |
| Lenovo LOQ 15IRX9 | |
| Single Core | |
| Dell G16, i7-13650HX, RTX 4060 | |
| Average of class Gaming (1136 - 2252, n=151, last 2 years) | |
| Gigabyte G6X 9KG (2024) | |
| SCHENKER XMG Core 15 (M24) | |
| Lenovo LOQ 15IRX9 (Leistungsmodus) | |
| Average Intel Core i5-13450HX (1710 - 1766, n=3) | |
| Lenovo LOQ 15IRX9 | |
| HP Victus 16 (2024) | |
| Cinebench R20 | |
| CPU (Multi Core) | |
| HP Victus 16 (2024) | |
| Average of class Gaming (2179 - 15517, n=151, last 2 years) | |
| Dell G16, i7-13650HX, RTX 4060 | |
| Gigabyte G6X 9KG (2024) | |
| SCHENKER XMG Core 15 (M24) | |
| Lenovo LOQ 15IRX9 (Leistungsmodus) | |
| Average Intel Core i5-13450HX (6489 - 6595, n=3) | |
| Lenovo LOQ 15IRX9 | |
| CPU (Single Core) | |
| Average of class Gaming (439 - 866, n=151, last 2 years) | |
| Dell G16, i7-13650HX, RTX 4060 | |
| Gigabyte G6X 9KG (2024) | |
| SCHENKER XMG Core 15 (M24) | |
| Lenovo LOQ 15IRX9 (Leistungsmodus) | |
| Average Intel Core i5-13450HX (652 - 680, n=3) | |
| Lenovo LOQ 15IRX9 | |
| HP Victus 16 (2024) | |
| Cinebench R15 | |
| CPU Multi 64Bit | |
| HP Victus 16 (2024) | |
| Average of class Gaming (905 - 6074, n=154, last 2 years) | |
| Dell G16, i7-13650HX, RTX 4060 | |
| SCHENKER XMG Core 15 (M24) | |
| Gigabyte G6X 9KG (2024) | |
| Lenovo LOQ 15IRX9 (Leistungsmodus) | |
| Lenovo LOQ 15IRX9 | |
| Average Intel Core i5-13450HX (2427 - 2505, n=3) | |
| CPU Single 64Bit | |
| SCHENKER XMG Core 15 (M24) | |
| Average of class Gaming (191.9 - 343, n=151, last 2 years) | |
| Dell G16, i7-13650HX, RTX 4060 | |
| Gigabyte G6X 9KG (2024) | |
| Lenovo LOQ 15IRX9 (Leistungsmodus) | |
| Average Intel Core i5-13450HX (239 - 251, n=3) | |
| Lenovo LOQ 15IRX9 | |
| HP Victus 16 (2024) | |
| Blender - v2.79 BMW27 CPU | |
| Lenovo LOQ 15IRX9 | |
| Gigabyte G6X 9KG (2024) | |
| Average Intel Core i5-13450HX (196 - 229, n=3) | |
| Lenovo LOQ 15IRX9 (Leistungsmodus) | |
| SCHENKER XMG Core 15 (M24) | |
| Average of class Gaming (81 - 555, n=144, last 2 years) | |
| HP Victus 16 (2024) | |
| Dell G16, i7-13650HX, RTX 4060 | |
| 7-Zip 18.03 | |
| 7z b 4 | |
| HP Victus 16 (2024) | |
| Average of class Gaming (23795 - 144064, n=149, last 2 years) | |
| Dell G16, i7-13650HX, RTX 4060 | |
| SCHENKER XMG Core 15 (M24) | |
| Gigabyte G6X 9KG (2024) | |
| Lenovo LOQ 15IRX9 (Leistungsmodus) | |
| Average Intel Core i5-13450HX (59026 - 62204, n=3) | |
| Lenovo LOQ 15IRX9 | |
| 7z b 4 -mmt1 | |
| SCHENKER XMG Core 15 (M24) | |
| Average of class Gaming (4199 - 7573, n=149, last 2 years) | |
| Dell G16, i7-13650HX, RTX 4060 | |
| Gigabyte G6X 9KG (2024) | |
| HP Victus 16 (2024) | |
| Lenovo LOQ 15IRX9 (Leistungsmodus) | |
| Average Intel Core i5-13450HX (5370 - 5576, n=3) | |
| Lenovo LOQ 15IRX9 | |
| Geekbench 6.4 | |
| Multi-Core | |
| HP Victus 16 (2024) (6.2.1) | |
| Average of class Gaming (5340 - 21668, n=119, last 2 years) | |
| SCHENKER XMG Core 15 (M24) (6.2.1) | |
| Dell G16, i7-13650HX, RTX 4060 (6.2.1) | |
| Gigabyte G6X 9KG (2024) (6.2.1) | |
| Lenovo LOQ 15IRX9 (6.2.1, Leistungsmodus) | |
| Average Intel Core i5-13450HX (12619 - 12799, n=3) | |
| Lenovo LOQ 15IRX9 (6.2.1) | |
| Single-Core | |
| SCHENKER XMG Core 15 (M24) (6.2.1) | |
| Average of class Gaming (1490 - 3219, n=119, last 2 years) | |
| Dell G16, i7-13650HX, RTX 4060 (6.2.1) | |
| Gigabyte G6X 9KG (2024) (6.2.1) | |
| Lenovo LOQ 15IRX9 (6.2.1, Leistungsmodus) | |
| Average Intel Core i5-13450HX (2381 - 2448, n=3) | |
| Lenovo LOQ 15IRX9 (6.2.1) | |
| HP Victus 16 (2024) (6.2.1) | |
| Geekbench 5.5 | |
| Multi-Core | |
| HP Victus 16 (2024) | |
| Average of class Gaming (4557 - 25855, n=148, last 2 years) | |
| Gigabyte G6X 9KG (2024) | |
| SCHENKER XMG Core 15 (M24) | |
| Dell G16, i7-13650HX, RTX 4060 | |
| Lenovo LOQ 15IRX9 | |
| Average Intel Core i5-13450HX (11973 - 12022, n=3) | |
| Lenovo LOQ 15IRX9 (Leistungsmodus) | |
| Single-Core | |
| SCHENKER XMG Core 15 (M24) | |
| Average of class Gaming (986 - 2423, n=148, last 2 years) | |
| Dell G16, i7-13650HX, RTX 4060 | |
| Gigabyte G6X 9KG (2024) | |
| Lenovo LOQ 15IRX9 (Leistungsmodus) | |
| Average Intel Core i5-13450HX (1696 - 1763, n=3) | |
| HP Victus 16 (2024) | |
| Lenovo LOQ 15IRX9 | |
| HWBOT x265 Benchmark v2.2 - 4k Preset | |
| Average of class Gaming (6.72 - 42.9, n=148, last 2 years) | |
| SCHENKER XMG Core 15 (M24) | |
| HP Victus 16 (2024) | |
| Lenovo LOQ 15IRX9 (Leistungsmodus) | |
| Dell G16, i7-13650HX, RTX 4060 | |
| Gigabyte G6X 9KG (2024) | |
| Average Intel Core i5-13450HX (16.9 - 20.5, n=3) | |
| Lenovo LOQ 15IRX9 | |
| LibreOffice - 20 Documents To PDF | |
| Average Intel Core i5-13450HX (49.5 - 96.6, n=3) | |
| Lenovo LOQ 15IRX9 (6.3.4.2) | |
| HP Victus 16 (2024) (6.3.4.2) | |
| Dell G16, i7-13650HX, RTX 4060 (6.3.4.2) | |
| Lenovo LOQ 15IRX9 (6.3.4.2, Leistungsmodus) | |
| SCHENKER XMG Core 15 (M24) (6.3.4.2) | |
| Average of class Gaming (19 - 96.6, n=147, last 2 years) | |
| Gigabyte G6X 9KG (2024) (6.3.4.2) | |
| R Benchmark 2.5 - Overall mean | |
| HP Victus 16 (2024) | |
| Lenovo LOQ 15IRX9 | |
| Average Intel Core i5-13450HX (0.4582 - 0.4838, n=3) | |
| Lenovo LOQ 15IRX9 (Leistungsmodus) | |
| Average of class Gaming (0.3609 - 0.759, n=150, last 2 years) | |
| Gigabyte G6X 9KG (2024) | |
| SCHENKER XMG Core 15 (M24) | |
| Dell G16, i7-13650HX, RTX 4060 | |
| Dell G16, i7-13650HX, RTX 4060 | |
* ... smaller is better
AIDA64: FP32 Ray-Trace | FPU Julia | CPU SHA3 | CPU Queen | FPU SinJulia | FPU Mandel | CPU AES | CPU ZLib | FP64 Ray-Trace | CPU PhotoWorxx
| Performance Rating | |
| SCHENKER XMG Core 15 (M24) | |
| Average of class Gaming | |
| Dell G16, i7-13650HX, RTX 4060 | |
| HP Victus 16 (2024) | |
| Lenovo LOQ 15IRX9 | |
| Average Intel Core i5-13450HX | |
| Gigabyte G6X 9KG (2024) | |
| Lenovo LOQ 15IRX9 | |
| AIDA64 / FP32 Ray-Trace | |
| SCHENKER XMG Core 15 (M24) (v6.92.6600) | |
| Average of class Gaming (4986 - 81639, n=147, last 2 years) | |
| Dell G16, i7-13650HX, RTX 4060 (v6.92.6600) | |
| Lenovo LOQ 15IRX9 (v6.92.6600, Leistungsmodus) | |
| HP Victus 16 (2024) (v6.92.6600) | |
| Average Intel Core i5-13450HX (13747 - 17767, n=3) | |
| Lenovo LOQ 15IRX9 (v6.92.6600) | |
| Gigabyte G6X 9KG (2024) (v6.92.6600) | |
| AIDA64 / FPU Julia | |
| SCHENKER XMG Core 15 (M24) (v6.92.6600) | |
| Average of class Gaming (25360 - 252486, n=147, last 2 years) | |
| Dell G16, i7-13650HX, RTX 4060 (v6.92.6600) | |
| HP Victus 16 (2024) (v6.92.6600) | |
| Lenovo LOQ 15IRX9 (v6.92.6600, Leistungsmodus) | |
| Average Intel Core i5-13450HX (71834 - 83862, n=3) | |
| Lenovo LOQ 15IRX9 (v6.92.6600) | |
| Gigabyte G6X 9KG (2024) (v6.92.6600) | |
| AIDA64 / CPU SHA3 | |
| SCHENKER XMG Core 15 (M24) (v6.92.6600) | |
| Average of class Gaming (1339 - 10389, n=147, last 2 years) | |
| Dell G16, i7-13650HX, RTX 4060 (v6.92.6600) | |
| HP Victus 16 (2024) (v6.92.6600) | |
| Lenovo LOQ 15IRX9 (v6.92.6600) | |
| Lenovo LOQ 15IRX9 (v6.92.6600, Leistungsmodus) | |
| Average Intel Core i5-13450HX (3519 - 3530, n=3) | |
| Gigabyte G6X 9KG (2024) (v6.92.6600) | |
| AIDA64 / CPU Queen | |
| HP Victus 16 (2024) (v6.92.6600) | |
| SCHENKER XMG Core 15 (M24) (v6.92.6600) | |
| Average of class Gaming (50699 - 200651, n=147, last 2 years) | |
| Gigabyte G6X 9KG (2024) (v6.92.6600) | |
| Dell G16, i7-13650HX, RTX 4060 (v6.92.6600) | |
| Lenovo LOQ 15IRX9 (v6.92.6600) | |
| Average Intel Core i5-13450HX (85888 - 86148, n=3) | |
| Lenovo LOQ 15IRX9 (v6.92.6600, Leistungsmodus) | |
| AIDA64 / FPU SinJulia | |
| SCHENKER XMG Core 15 (M24) (v6.92.6600) | |
| Average of class Gaming (4800 - 32988, n=147, last 2 years) | |
| HP Victus 16 (2024) (v6.92.6600) | |
| Dell G16, i7-13650HX, RTX 4060 (v6.92.6600) | |
| Lenovo LOQ 15IRX9 (v6.92.6600, Leistungsmodus) | |
| Lenovo LOQ 15IRX9 (v6.92.6600) | |
| Average Intel Core i5-13450HX (9325 - 9354, n=3) | |
| Gigabyte G6X 9KG (2024) (v6.92.6600) | |
| AIDA64 / FPU Mandel | |
| SCHENKER XMG Core 15 (M24) (v6.92.6600) | |
| Average of class Gaming (12321 - 134044, n=147, last 2 years) | |
| Dell G16, i7-13650HX, RTX 4060 (v6.92.6600) | |
| Lenovo LOQ 15IRX9 (v6.92.6600, Leistungsmodus) | |
| HP Victus 16 (2024) (v6.92.6600) | |
| Average Intel Core i5-13450HX (34956 - 42825, n=3) | |
| Lenovo LOQ 15IRX9 (v6.92.6600) | |
| Gigabyte G6X 9KG (2024) (v6.92.6600) | |
| AIDA64 / CPU AES | |
| Average of class Gaming (19065 - 328679, n=147, last 2 years) | |
| SCHENKER XMG Core 15 (M24) (v6.92.6600) | |
| Dell G16, i7-13650HX, RTX 4060 (v6.92.6600) | |
| HP Victus 16 (2024) (v6.92.6600) | |
| Average Intel Core i5-13450HX (70296 - 70680, n=3) | |
| Lenovo LOQ 15IRX9 (v6.92.6600) | |
| Lenovo LOQ 15IRX9 (v6.92.6600, Leistungsmodus) | |
| Gigabyte G6X 9KG (2024) (v6.92.6600) | |
| AIDA64 / CPU ZLib | |
| Average of class Gaming (373 - 2531, n=147, last 2 years) | |
| Dell G16, i7-13650HX, RTX 4060 (v6.92.6600) | |
| HP Victus 16 (2024) (v6.92.6600) | |
| Gigabyte G6X 9KG (2024) (v6.92.6600) | |
| Lenovo LOQ 15IRX9 (v6.92.6600) | |
| Average Intel Core i5-13450HX (977 - 1002, n=3) | |
| Lenovo LOQ 15IRX9 (v6.92.6600, Leistungsmodus) | |
| SCHENKER XMG Core 15 (M24) (v6.92.6600) | |
| AIDA64 / FP64 Ray-Trace | |
| SCHENKER XMG Core 15 (M24) (v6.92.6600) | |
| Average of class Gaming (2540 - 43430, n=147, last 2 years) | |
| Dell G16, i7-13650HX, RTX 4060 (v6.92.6600) | |
| Lenovo LOQ 15IRX9 (v6.92.6600, Leistungsmodus) | |
| HP Victus 16 (2024) (v6.92.6600) | |
| Average Intel Core i5-13450HX (7428 - 9561, n=3) | |
| Lenovo LOQ 15IRX9 (v6.92.6600) | |
| Gigabyte G6X 9KG (2024) (v6.92.6600) | |
| AIDA64 / CPU PhotoWorxx | |
| SCHENKER XMG Core 15 (M24) (v6.92.6600) | |
| Average of class Gaming (10805 - 60161, n=147, last 2 years) | |
| HP Victus 16 (2024) (v6.92.6600) | |
| Gigabyte G6X 9KG (2024) (v6.92.6600) | |
| Lenovo LOQ 15IRX9 (v6.92.6600) | |
| Lenovo LOQ 15IRX9 (v6.92.6600, Leistungsmodus) | |
| Average Intel Core i5-13450HX (36014 - 36764, n=3) | |
| Dell G16, i7-13650HX, RTX 4060 (v6.92.6600) | |
系统性能
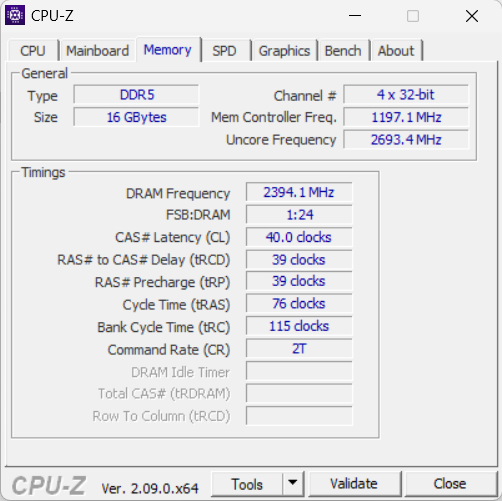
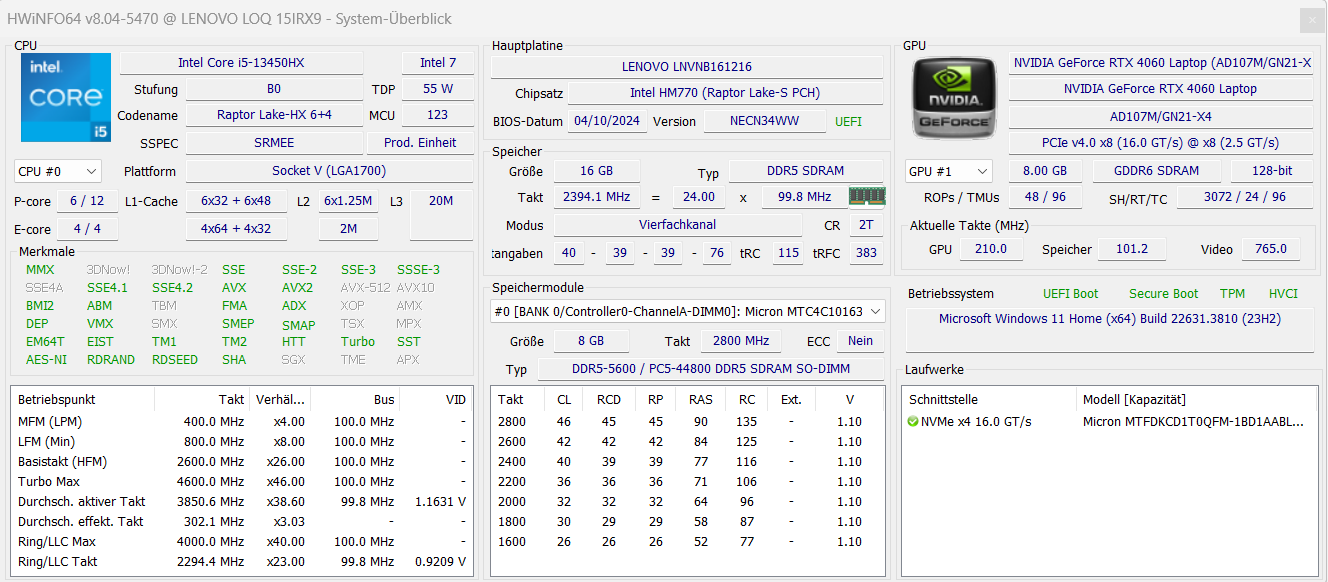
运行流畅的系统并不缺乏性能:电脑在处理游戏、渲染和流媒体方面没有任何问题。内存的传输速率符合 DDR5-5600 内存的预期。

CrossMark: Overall | Productivity | Creativity | Responsiveness
WebXPRT 3: Overall
WebXPRT 4: Overall
Mozilla Kraken 1.1: Total
| PCMark 10 / Score | |
| SCHENKER XMG Core 15 (M24) | |
| Average of class Gaming (5776 - 9852, n=133, last 2 years) | |
| Gigabyte G6X 9KG (2024) | |
| HP Victus 16 (2024) | |
| Dell G16, i7-13650HX, RTX 4060 | |
| Lenovo LOQ 15IRX9 | |
| Average Intel Core i5-13450HX, NVIDIA GeForce RTX 4060 Laptop GPU (n=1) | |
| PCMark 10 / Essentials | |
| HP Victus 16 (2024) | |
| Average of class Gaming (9057 - 12600, n=133, last 2 years) | |
| Gigabyte G6X 9KG (2024) | |
| SCHENKER XMG Core 15 (M24) | |
| Dell G16, i7-13650HX, RTX 4060 | |
| Lenovo LOQ 15IRX9 | |
| Average Intel Core i5-13450HX, NVIDIA GeForce RTX 4060 Laptop GPU (n=1) | |
| PCMark 10 / Productivity | |
| SCHENKER XMG Core 15 (M24) | |
| Gigabyte G6X 9KG (2024) | |
| Dell G16, i7-13650HX, RTX 4060 | |
| HP Victus 16 (2024) | |
| Average of class Gaming (6662 - 14612, n=133, last 2 years) | |
| Lenovo LOQ 15IRX9 | |
| Average Intel Core i5-13450HX, NVIDIA GeForce RTX 4060 Laptop GPU (n=1) | |
| PCMark 10 / Digital Content Creation | |
| SCHENKER XMG Core 15 (M24) | |
| Average of class Gaming (6807 - 18475, n=133, last 2 years) | |
| Dell G16, i7-13650HX, RTX 4060 | |
| Gigabyte G6X 9KG (2024) | |
| Lenovo LOQ 15IRX9 | |
| Average Intel Core i5-13450HX, NVIDIA GeForce RTX 4060 Laptop GPU (n=1) | |
| HP Victus 16 (2024) | |
| CrossMark / Overall | |
| Gigabyte G6X 9KG (2024) | |
| HP Victus 16 (2024) | |
| Average of class Gaming (1247 - 2344, n=114, last 2 years) | |
| SCHENKER XMG Core 15 (M24) | |
| Dell G16, i7-13650HX, RTX 4060 | |
| Lenovo LOQ 15IRX9 | |
| Average Intel Core i5-13450HX, NVIDIA GeForce RTX 4060 Laptop GPU (n=1) | |
| CrossMark / Productivity | |
| Gigabyte G6X 9KG (2024) | |
| Average of class Gaming (1299 - 2204, n=114, last 2 years) | |
| SCHENKER XMG Core 15 (M24) | |
| HP Victus 16 (2024) | |
| Dell G16, i7-13650HX, RTX 4060 | |
| Lenovo LOQ 15IRX9 | |
| Average Intel Core i5-13450HX, NVIDIA GeForce RTX 4060 Laptop GPU (n=1) | |
| CrossMark / Creativity | |
| HP Victus 16 (2024) | |
| SCHENKER XMG Core 15 (M24) | |
| Average of class Gaming (1275 - 2660, n=114, last 2 years) | |
| Gigabyte G6X 9KG (2024) | |
| Dell G16, i7-13650HX, RTX 4060 | |
| Lenovo LOQ 15IRX9 | |
| Average Intel Core i5-13450HX, NVIDIA GeForce RTX 4060 Laptop GPU (n=1) | |
| CrossMark / Responsiveness | |
| Gigabyte G6X 9KG (2024) | |
| HP Victus 16 (2024) | |
| Lenovo LOQ 15IRX9 | |
| Average Intel Core i5-13450HX, NVIDIA GeForce RTX 4060 Laptop GPU (n=1) | |
| Average of class Gaming (1030 - 2330, n=114, last 2 years) | |
| Dell G16, i7-13650HX, RTX 4060 | |
| SCHENKER XMG Core 15 (M24) | |
| WebXPRT 3 / Overall | |
| SCHENKER XMG Core 15 (M24) (Chrome 82) | |
| Gigabyte G6X 9KG (2024) (Chrome 82) | |
| Average of class Gaming (215 - 480, n=127, last 2 years) | |
| HP Victus 16 (2024) (Chrome 82) | |
| Dell G16, i7-13650HX, RTX 4060 (Chrome 82) | |
| Lenovo LOQ 15IRX9 (Chrome 82) | |
| Average Intel Core i5-13450HX, NVIDIA GeForce RTX 4060 Laptop GPU (n=1) | |
| WebXPRT 4 / Overall | |
| Average of class Gaming (176.4 - 335, n=115, last 2 years) | |
| SCHENKER XMG Core 15 (M24) (Chrome 105.0.0.0) | |
| Gigabyte G6X 9KG (2024) (Chrome 105.0.0.0) | |
| HP Victus 16 (2024) (Chrome 105.0.0.0) | |
| Lenovo LOQ 15IRX9 (Chrome 105.0.0.0) | |
| Average Intel Core i5-13450HX, NVIDIA GeForce RTX 4060 Laptop GPU (n=1) | |
| Mozilla Kraken 1.1 / Total | |
| Lenovo LOQ 15IRX9 (Chrome 82) | |
| Average Intel Core i5-13450HX, NVIDIA GeForce RTX 4060 Laptop GPU (n=1) | |
| HP Victus 16 (2024) (Chrome 82) | |
| Gigabyte G6X 9KG (2024) (Chrome 82) | |
| Dell G16, i7-13650HX, RTX 4060 (Chrome 82) | |
| Average of class Gaming (409 - 674, n=139, last 2 years) | |
| SCHENKER XMG Core 15 (M24) (Chrome 82) | |
* ... smaller is better
| PCMark 10 Score | 6929 points | |
Help | ||
| AIDA64 / Memory Copy | |
| SCHENKER XMG Core 15 (M24) (v6.92.6600) | |
| HP Victus 16 (2024) (v6.92.6600) | |
| Average of class Gaming (21750 - 97515, n=147, last 2 years) | |
| Gigabyte G6X 9KG (2024) (v6.92.6600) | |
| Dell G16, i7-13650HX, RTX 4060 (v6.92.6600) | |
| Average Intel Core i5-13450HX (58673 - 58861, n=3) | |
| Lenovo LOQ 15IRX9 (v6.92.6600) | |
| AIDA64 / Memory Read | |
| HP Victus 16 (2024) (v6.92.6600) | |
| Average of class Gaming (22956 - 102937, n=147, last 2 years) | |
| Gigabyte G6X 9KG (2024) (v6.92.6600) | |
| Lenovo LOQ 15IRX9 (v6.92.6600) | |
| Average Intel Core i5-13450HX (66626 - 69024, n=3) | |
| Dell G16, i7-13650HX, RTX 4060 (v6.92.6600) | |
| SCHENKER XMG Core 15 (M24) (v6.92.6600) | |
| AIDA64 / Memory Write | |
| SCHENKER XMG Core 15 (M24) (v6.92.6600) | |
| Average of class Gaming (22297 - 108954, n=147, last 2 years) | |
| HP Victus 16 (2024) (v6.92.6600) | |
| Gigabyte G6X 9KG (2024) (v6.92.6600) | |
| Lenovo LOQ 15IRX9 (v6.92.6600) | |
| Average Intel Core i5-13450HX (58540 - 60196, n=3) | |
| Dell G16, i7-13650HX, RTX 4060 (v6.92.6600) | |
| AIDA64 / Memory Latency | |
| HP Victus 16 (2024) (v6.92.6600) | |
| Average of class Gaming (59.5 - 259, n=147, last 2 years) | |
| Lenovo LOQ 15IRX9 (v6.92.6600) | |
| Average Intel Core i5-13450HX (90 - 94.2, n=3) | |
| Dell G16, i7-13650HX, RTX 4060 (v6.92.6600) | |
| Gigabyte G6X 9KG (2024) (v6.92.6600) | |
| SCHENKER XMG Core 15 (M24) (v6.92.6600) | |
* ... smaller is better
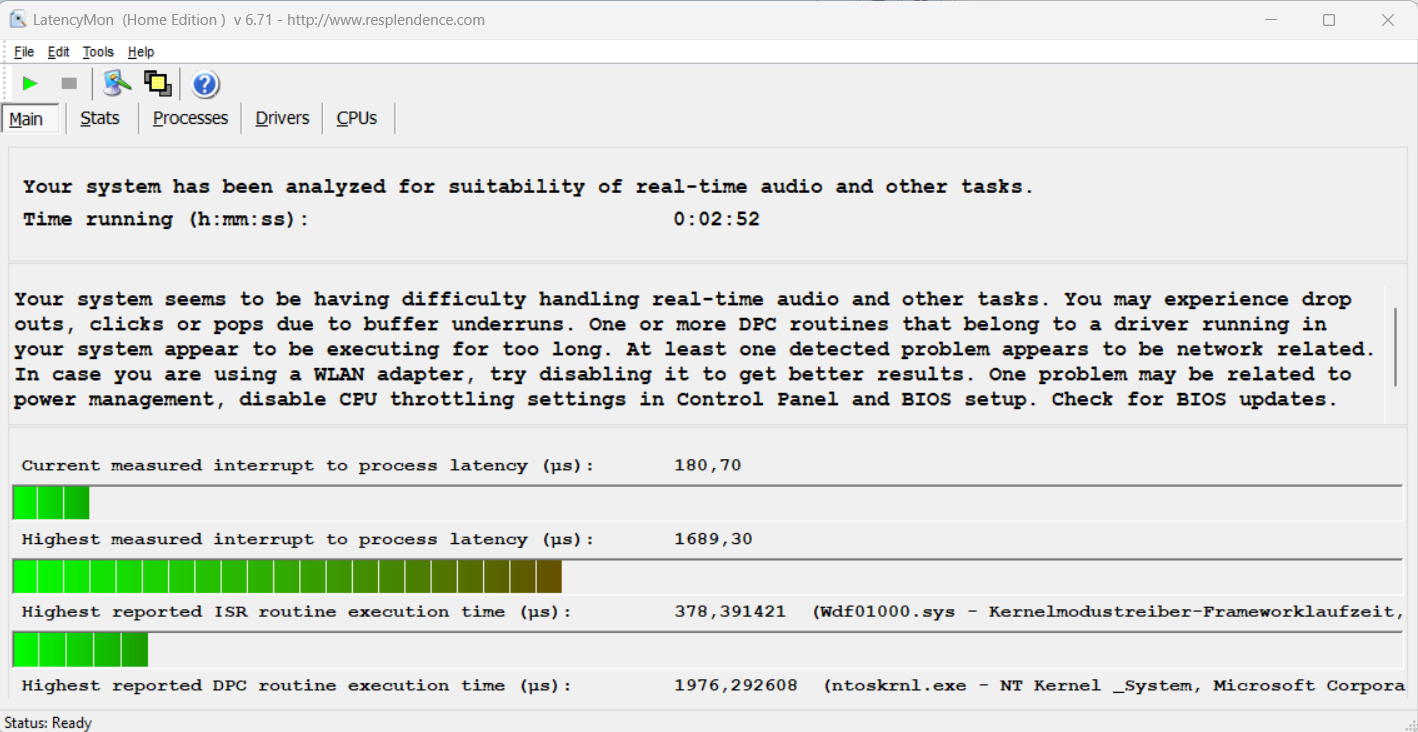
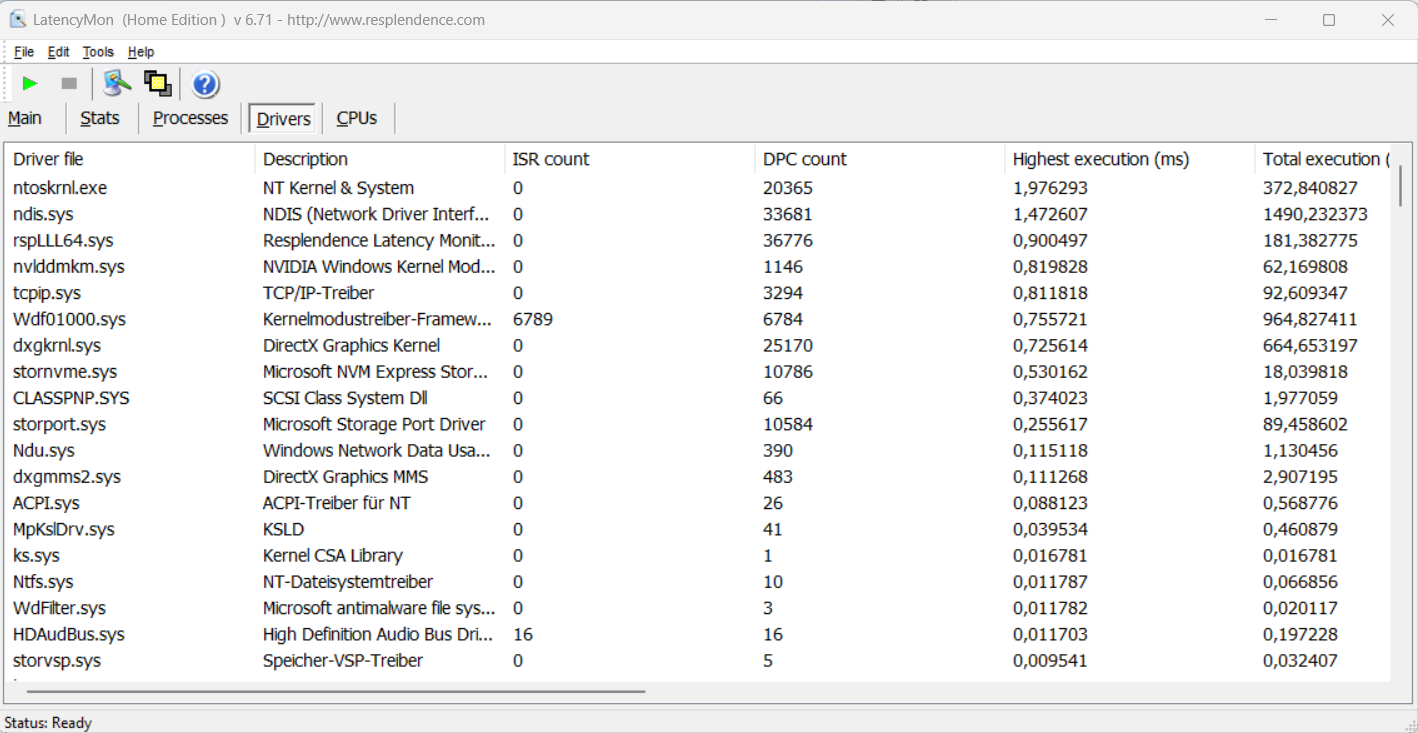
DPC 延迟
标准延迟测试(网上冲浪、4K 视频播放、Prime95 高负载)发现了一些异常。该系统似乎不适合实时视频和音频编辑。未来的软件更新可能会带来改进,甚至恶化。
| DPC Latencies / LatencyMon - interrupt to process latency (max), Web, Youtube, Prime95 | |
| Gigabyte G6X 9KG (2024) | |
| Lenovo LOQ 15IRX9 | |
| SCHENKER XMG Core 15 (M24) | |
| Dell G16, i7-13650HX, RTX 4060 | |
| HP Victus 16 (2024) | |
* ... smaller is better
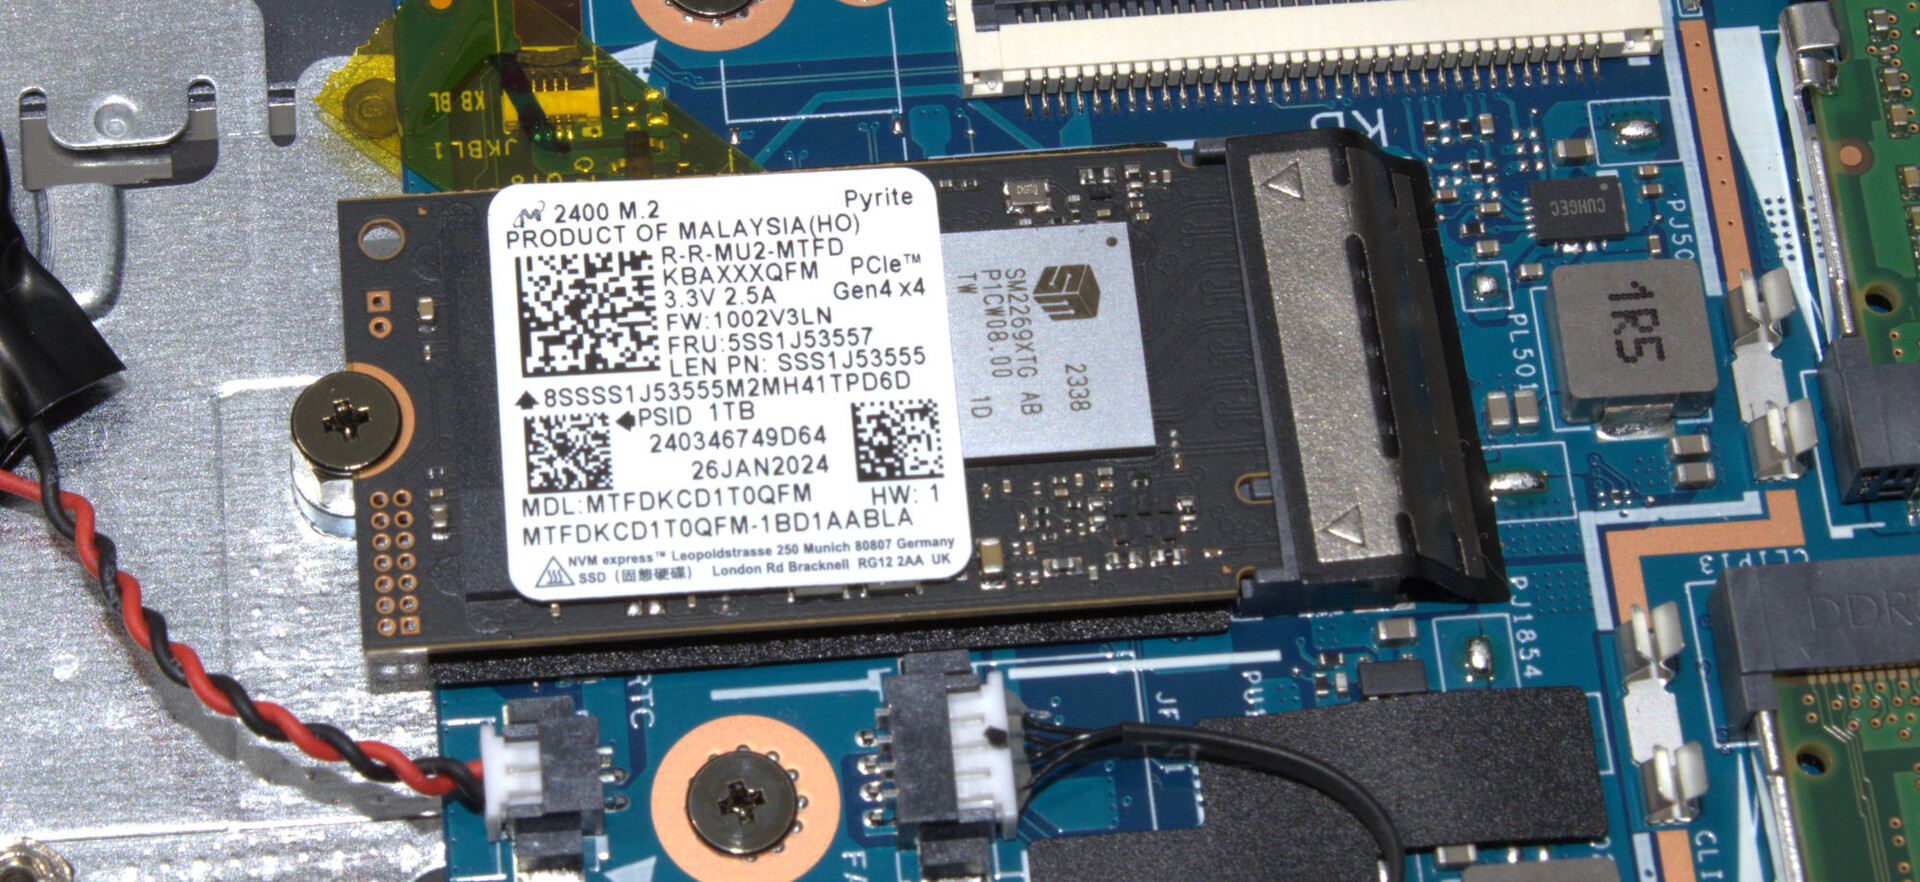
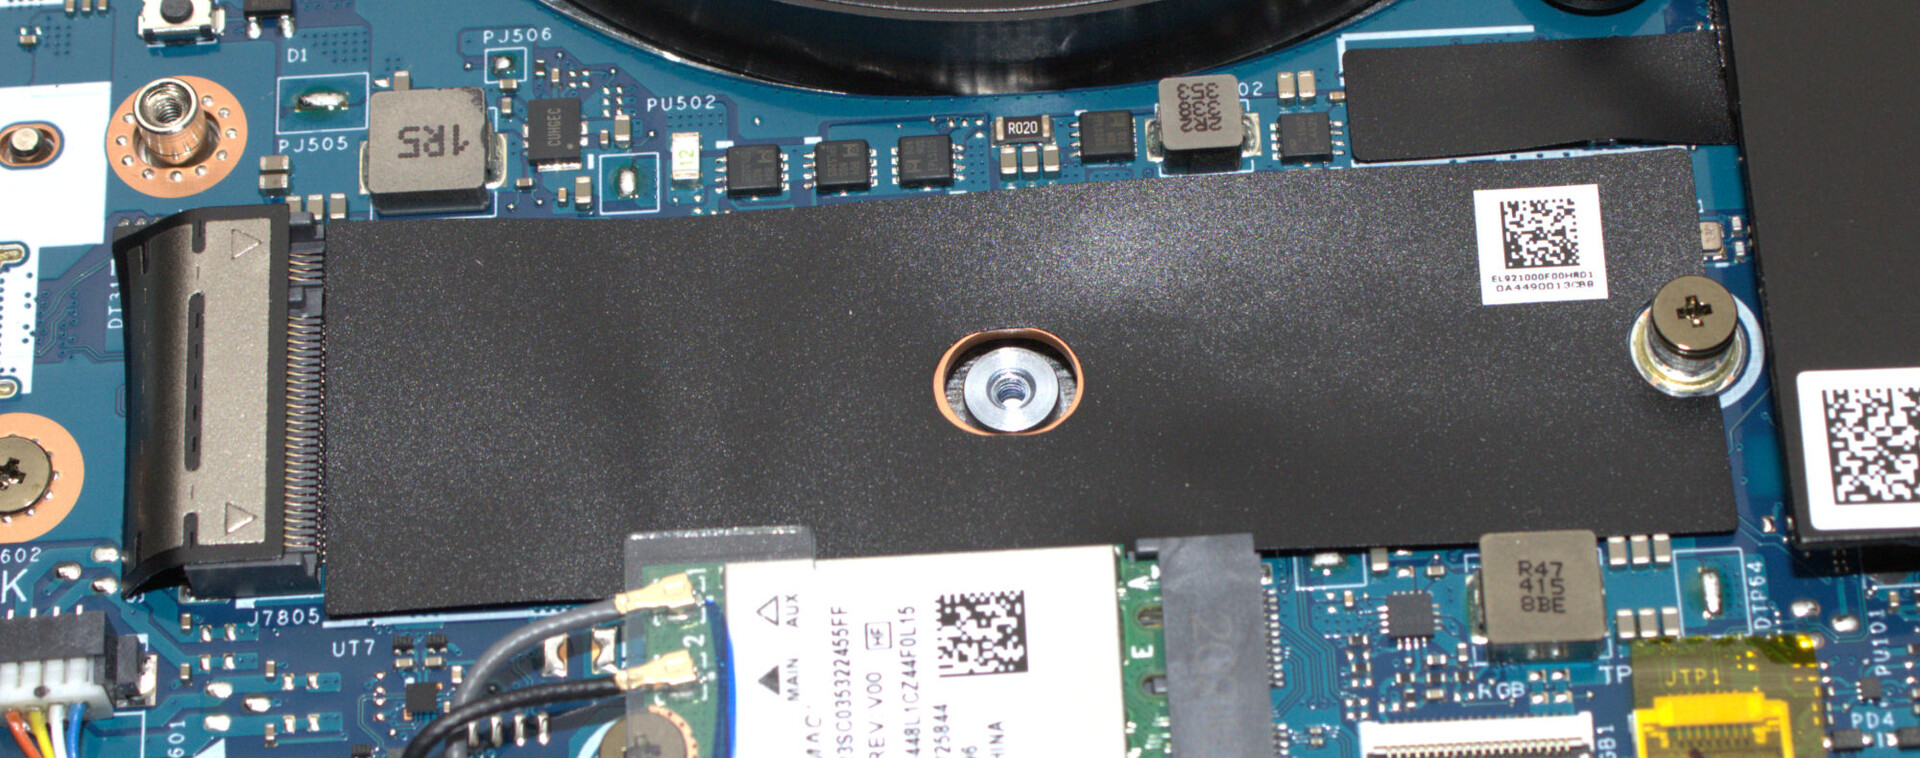
存储设备
LOQ 可容纳两块 PCIe 4 固态硬盘(M.2 2280 或 M.2 2242)。我们测试设备中的美光固态硬盘(1 TB,M.2 2242)提供了不错的数据传输速率,但它并不能被归类为顶级固态硬盘型号之一。在 DiskSpd 循环的后期过程中,我们注意到了一些热引起的节流现象。

* ... smaller is better
Reading continuous performance: DiskSpd Read Loop, Queue Depth 8
图形卡
......(英文 GeForce RTX 4060(3,072 个着色器、128 位总线、8 GB GDDR6、115 瓦)代表了 Nvidia 当前移动 GPU 阵容中的中端产品。它可以在高至最高设置下进行全高清游戏。其基准测试结果和帧率与 RTX-4060 的平均值(平衡模式)大致相当。性能模式的数值有所提高。在 dGPU 和 Optimus 之间切换无需重启:支持高级 Optimus。
| 3DMark Performance Rating - Percent | |
| Average of class Gaming | |
| SCHENKER XMG Core 15 (M24) | |
| Lenovo LOQ 15IRX9 | |
| Dell G16, i7-13650HX, RTX 4060 | |
| Lenovo LOQ 15IRX9 | |
| Gigabyte G6X 9KG (2024) | |
| HP Victus 16 (2024) | |
| Average NVIDIA GeForce RTX 4060 Laptop GPU | |
| 3DMark 11 - 1280x720 Performance GPU | |
| Average of class Gaming (10741 - 72178, n=143, last 2 years) | |
| SCHENKER XMG Core 15 (M24) | |
| Lenovo LOQ 15IRX9 (Leistungsmodus) | |
| Dell G16, i7-13650HX, RTX 4060 | |
| Lenovo LOQ 15IRX9 | |
| Gigabyte G6X 9KG (2024) | |
| HP Victus 16 (2024) | |
| Average NVIDIA GeForce RTX 4060 Laptop GPU (28136 - 38912, n=57) | |
| 3DMark | |
| 1920x1080 Fire Strike Graphics | |
| Average of class Gaming (2913 - 56116, n=155, last 2 years) | |
| SCHENKER XMG Core 15 (M24) | |
| Lenovo LOQ 15IRX9 (Leistungsmodus) | |
| Lenovo LOQ 15IRX9 | |
| Gigabyte G6X 9KG (2024) | |
| Dell G16, i7-13650HX, RTX 4060 | |
| HP Victus 16 (2024) | |
| Average NVIDIA GeForce RTX 4060 Laptop GPU (20533 - 29656, n=54) | |
| 2560x1440 Time Spy Graphics | |
| Average of class Gaming (2295 - 24599, n=151, last 2 years) | |
| SCHENKER XMG Core 15 (M24) | |
| Lenovo LOQ 15IRX9 (Leistungsmodus) | |
| Dell G16, i7-13650HX, RTX 4060 | |
| Average NVIDIA GeForce RTX 4060 Laptop GPU (7484 - 11451, n=56) | |
| HP Victus 16 (2024) | |
| Gigabyte G6X 9KG (2024) | |
| Lenovo LOQ 15IRX9 | |
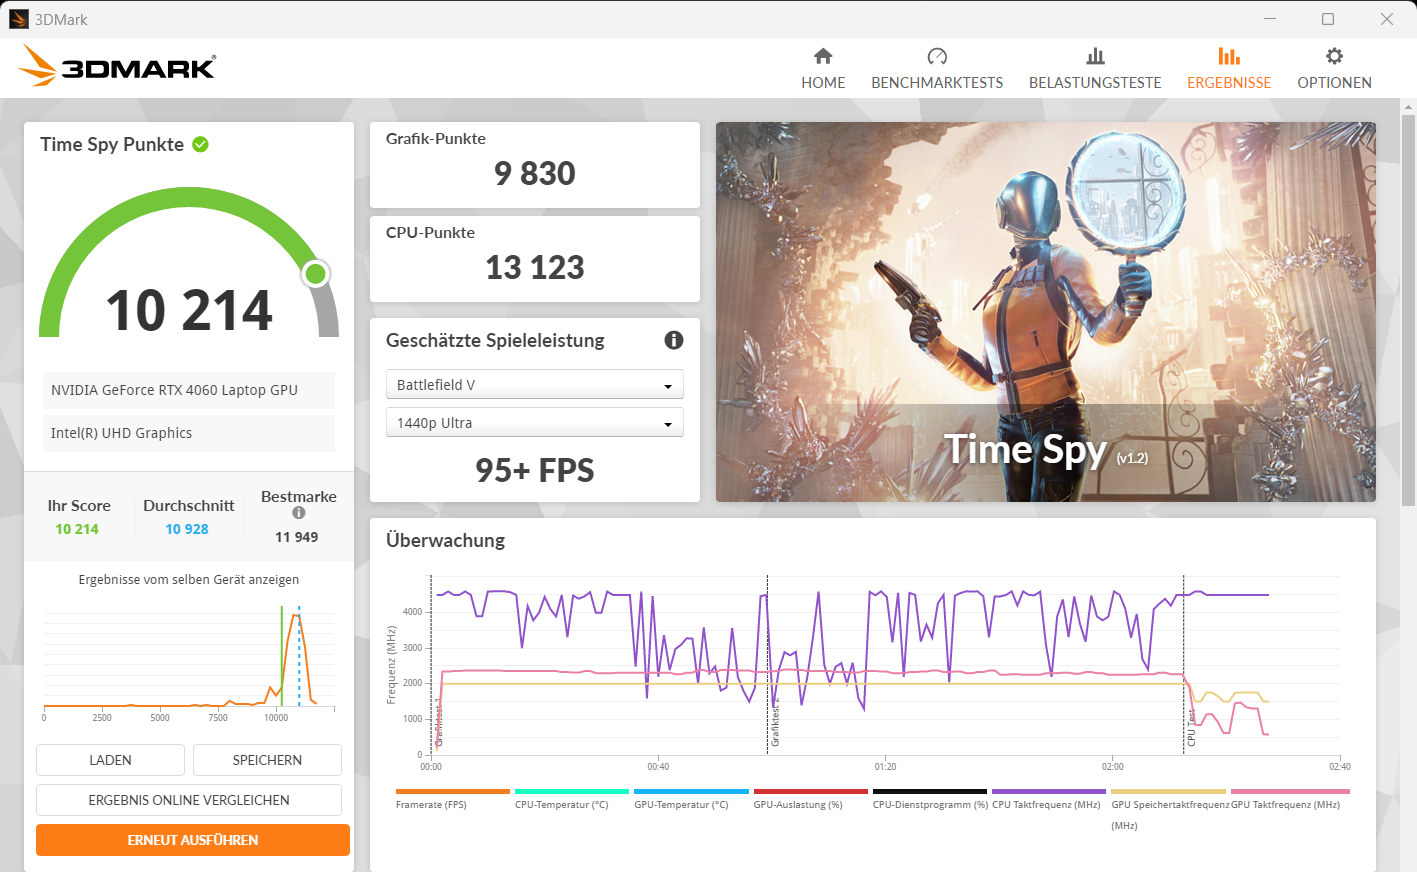
| 3DMark 11 Performance | 30755 points | |
| 3DMark Fire Strike Score | 22788 points | |
| 3DMark Time Spy Score | 10214 points | |
| 3DMark Steel Nomad Score | 2143 points | |
Help | ||
| Geekbench 5.5 | |
| OpenCL Score | |
| Average of class Gaming (5039 - 270235, n=150, last 2 years) | |
| SCHENKER XMG Core 15 (M24) | |
| Lenovo LOQ 15IRX9 (Leistungsmodus) | |
| Lenovo LOQ 15IRX9 | |
| Gigabyte G6X 9KG (2024) | |
| Dell G16, i7-13650HX, RTX 4060 | |
| HP Victus 16 (2024) | |
| Average NVIDIA GeForce RTX 4060 Laptop GPU (5039 - 112238, n=53) | |
| Vulkan Score 5.5 | |
| SCHENKER XMG Core 15 (M24) | |
| Lenovo LOQ 15IRX9 (Leistungsmodus) | |
| Lenovo LOQ 15IRX9 | |
| Average of class Gaming (9296 - 176078, n=103, last 2 years) | |
| Average NVIDIA GeForce RTX 4060 Laptop GPU (28838 - 87612, n=31) | |
| HP Victus 16 (2024) | |
| Gigabyte G6X 9KG (2024) | |
| Geekbench 6.4 | |
| GPU OpenCL | |
| Average of class Gaming (4321 - 234213, n=118, last 2 years) | |
| Gigabyte G6X 9KG (2024) (6.2.1) | |
| SCHENKER XMG Core 15 (M24) (6.2.1) | |
| HP Victus 16 (2024) (6.2.1) | |
| Dell G16, i7-13650HX, RTX 4060 (6.2.1) | |
| Lenovo LOQ 15IRX9 (6.2.1, Leistungsmodus) | |
| Lenovo LOQ 15IRX9 (6.2.1) | |
| Average NVIDIA GeForce RTX 4060 Laptop GPU (4321 - 100831, n=40) | |
| GPU Vulkan | |
| SCHENKER XMG Core 15 (M24) (6.2.1) | |
| Lenovo LOQ 15IRX9 (6.2.1, Leistungsmodus) | |
| Gigabyte G6X 9KG (2024) (6.2.1) | |
| Lenovo LOQ 15IRX9 (6.2.1) | |
| HP Victus 16 (2024) (6.2.1) | |
| Average of class Gaming (4286 - 231659, n=110, last 2 years) | |
| Average NVIDIA GeForce RTX 4060 Laptop GPU (4286 - 101001, n=36) | |
| Dell G16, i7-13650HX, RTX 4060 (6.2.1) | |
| V-Ray 5 Benchmark | |
| GPU RTX | |
| Average of class Gaming (556 - 4011, n=88, last 2 years) | |
| Gigabyte G6X 9KG (2024) (5.0.1) | |
| HP Victus 16 (2024) (5.0.1) | |
| Lenovo LOQ 15IRX9 (5.0.1, Leistungsmodus) | |
| Dell G16, i7-13650HX, RTX 4060 (5.0.1) | |
| Average NVIDIA GeForce RTX 4060 Laptop GPU (1387 - 1817, n=28) | |
| Lenovo LOQ 15IRX9 (5.0.1) | |
| GPU CUDA | |
| Average of class Gaming (300 - 3229, n=90, last 2 years) | |
| Lenovo LOQ 15IRX9 (5.0.1, Leistungsmodus) | |
| Gigabyte G6X 9KG (2024) (5.0.1) | |
| Lenovo LOQ 15IRX9 (5.0.1) | |
| HP Victus 16 (2024) (5.0.1) | |
| Average NVIDIA GeForce RTX 4060 Laptop GPU (957 - 1294, n=29) | |
| Dell G16, i7-13650HX, RTX 4060 (5.0.1) | |
| CPU | |
| Average of class Gaming (3562 - 30302, n=92, last 2 years) | |
| HP Victus 16 (2024) (5.0.1) | |
| Average NVIDIA GeForce RTX 4060 Laptop GPU (8364 - 21065, n=28) | |
| Gigabyte G6X 9KG (2024) (5.0.1) | |
| Lenovo LOQ 15IRX9 (5.0.1, Leistungsmodus) | |
| Dell G16, i7-13650HX, RTX 4060 (5.0.1) | |
| Lenovo LOQ 15IRX9 (5.0.1) | |
| V-Ray Benchmark Next 4.10 | |
| GPU | |
| SCHENKER XMG Core 15 (M24) (v4.10.07 ) | |
| Average of class Gaming (54 - 1317, n=122, last 2 years) | |
| Gigabyte G6X 9KG (2024) (v4.10.07 ) | |
| Lenovo LOQ 15IRX9 (v4.10.07, Leistungsmodus) | |
| Average NVIDIA GeForce RTX 4060 Laptop GPU (483 - 715, n=46) | |
| HP Victus 16 (2024) (v4.10.07 ) | |
| Lenovo LOQ 15IRX9 (v4.10.07 ) | |
| CPU | |
| HP Victus 16 (2024) (v4.10.07 ) | |
| Average of class Gaming (5413 - 44129, n=122, last 2 years) | |
| Average NVIDIA GeForce RTX 4060 Laptop GPU (12680 - 32360, n=46) | |
| SCHENKER XMG Core 15 (M24) (v4.10.07 ) | |
| Gigabyte G6X 9KG (2024) (v4.10.07 ) | |
| Lenovo LOQ 15IRX9 (v4.10.07, Leistungsmodus) | |
| Lenovo LOQ 15IRX9 (v4.10.07 ) | |
* ... smaller is better
| Performance Rating - Percent | |
| Average of class Gaming | |
| SCHENKER XMG Core 15 (M24) | |
| Dell G16, i7-13650HX, RTX 4060 | |
| Lenovo LOQ 15IRX9 | |
| Gigabyte G6X 9KG (2024) | |
| Average NVIDIA GeForce RTX 4060 Laptop GPU | |
| HP Victus 16 (2024) | |
| Lenovo LOQ 15IRX9 | |
| Cyberpunk 2077 2.2 Phantom Liberty - 1920x1080 Ultra Preset (FSR off) | |
| SCHENKER XMG Core 15 (M24) (2.12) | |
| Average of class Gaming (6.76 - 158, n=90, last 2 years) | |
| Lenovo LOQ 15IRX9 (2.02, Leistungsmodus) | |
| Average NVIDIA GeForce RTX 4060 Laptop GPU (56.4 - 93.1, n=31) | |
| Lenovo LOQ 15IRX9 (2.02) | |
| Dell G16, i7-13650HX, RTX 4060 (2.11) | |
| Gigabyte G6X 9KG (2024) (2.02) | |
| HP Victus 16 (2024) (2.02) | |
| GTA V - 1920x1080 Highest Settings possible AA:4xMSAA + FX AF:16x | |
| Dell G16, i7-13650HX, RTX 4060 | |
| SCHENKER XMG Core 15 (M24) | |
| Lenovo LOQ 15IRX9 (Leistungsmodus) | |
| Gigabyte G6X 9KG (2024) | |
| Lenovo LOQ 15IRX9 | |
| Average of class Gaming (12.1 - 168.2, n=132, last 2 years) | |
| HP Victus 16 (2024) | |
| Average NVIDIA GeForce RTX 4060 Laptop GPU (76.9 - 126.3, n=48) | |
| Final Fantasy XV Benchmark - 1920x1080 High Quality | |
| Average of class Gaming (19.2 - 201, n=144, last 2 years) | |
| Lenovo LOQ 15IRX9 (1.3, Leistungsmodus) | |
| SCHENKER XMG Core 15 (M24) (1.3) | |
| Dell G16, i7-13650HX, RTX 4060 (1.3) | |
| Gigabyte G6X 9KG (2024) (1.3) | |
| Lenovo LOQ 15IRX9 (1.3) | |
| HP Victus 16 (2024) (1.3) | |
| Average NVIDIA GeForce RTX 4060 Laptop GPU (75.1 - 109.8, n=51) | |
| Strange Brigade - 1920x1080 ultra AA:ultra AF:16 | |
| Average of class Gaming (38.9 - 420, n=140, last 2 years) | |
| SCHENKER XMG Core 15 (M24) (1.47.22.14 D3D12) | |
| Dell G16, i7-13650HX, RTX 4060 (1.47.22.14 D3D12) | |
| Lenovo LOQ 15IRX9 (1.47.22.14 D3D12, Leistungsmodus) | |
| Lenovo LOQ 15IRX9 (1.47.22.14 D3D12) | |
| Gigabyte G6X 9KG (2024) (1.47.22.14 D3D12) | |
| Average NVIDIA GeForce RTX 4060 Laptop GPU (135.3 - 210, n=50) | |
| HP Victus 16 (2024) (1.47.22.14 D3D12) | |
| Dota 2 Reborn - 1920x1080 ultra (3/3) best looking | |
| HP Victus 16 (2024) | |
| Dell G16, i7-13650HX, RTX 4060 | |
| Average of class Gaming (65.1 - 220, n=148, last 2 years) | |
| Average NVIDIA GeForce RTX 4060 Laptop GPU (115 - 183.8, n=53) | |
| Lenovo LOQ 15IRX9 (Leistungsmodus) | |
| Gigabyte G6X 9KG (2024) | |
| Lenovo LOQ 15IRX9 | |
| SCHENKER XMG Core 15 (M24) | |
| X-Plane 11.11 - 1920x1080 high (fps_test=3) | |
| Dell G16, i7-13650HX, RTX 4060 | |
| Gigabyte G6X 9KG (2024) | |
| Average of class Gaming (32.8 - 166.2, n=151, last 2 years) | |
| Average NVIDIA GeForce RTX 4060 Laptop GPU (60.7 - 141.1, n=54) | |
| Lenovo LOQ 15IRX9 (Leistungsmodus) | |
| HP Victus 16 (2024) | |
| SCHENKER XMG Core 15 (M24) | |
| Lenovo LOQ 15IRX9 | |
| Dragon's Dogma 2 - 1920x1080 High Preset | |
| Average of class Gaming (49.5 - 80, n=8, last 2 years) | |
| HP Victus 16 (2024) | |
| Lenovo LOQ 15IRX9 | |
| Average NVIDIA GeForce RTX 4060 Laptop GPU (57.2 - 67.7, n=5) | |
| Razer Blade 14 Mid 23 | |
| F1 24 - 1920x1080 Ultra High Preset AA:T AF:16x | |
| Average of class Gaming (54.1 - 148, n=19, last 2 years) | |
| Average NVIDIA GeForce RTX 4060 Laptop GPU (47.5 - 61.6, n=10) | |
| Razer Blade 14 Mid 23 | |
| Lenovo LOQ 15IRX9 (1122588) | |
| Counter-Strike 2 - 1920x1080 Very High Preset | |
| Razer Blade 14 Mid 23 | |
| Average NVIDIA GeForce RTX 4060 Laptop GPU (123.9 - 139.1, n=2) | |
| Lenovo LOQ 15IRX9 | |
| Average of class Gaming (11.5 - 189.7, n=10, last 2 years) | |
| Senua's Saga Hellblade 2 - 1920x1080 High Preset | |
| Average of class Gaming (38.4 - 78.8, n=6, last 2 years) | |
| Average NVIDIA GeForce RTX 4060 Laptop GPU (37.6 - 39.5, n=3) | |
| Lenovo LOQ 15IRX9 | |
| Razer Blade 14 Mid 23 | |
| Ghost of Tsushima - 1920x1080 Very High Preset AA:T | |
| Lenovo LOQ 15IRX9 | |
| Average NVIDIA GeForce RTX 4060 Laptop GPU (55.6 - 63.4, n=5) | |
| Average of class Gaming (28.5 - 73.7, n=7, last 2 years) | |
| Razer Blade 14 Mid 23 | |
Cyberpunk 2077 ultra FPS diagram
| low | med. | high | ultra | |
|---|---|---|---|---|
| GTA V (2015) | 184.4 | 181.5 | 175.5 | 112.6 |
| Dota 2 Reborn (2015) | 171.2 | 156.8 | 149.4 | 141 |
| Final Fantasy XV Benchmark (2018) | 198.9 | 138.5 | 99.9 | |
| X-Plane 11.11 (2018) | 139.6 | 118.4 | 92.2 | |
| Strange Brigade (2018) | 425 | 260 | 209 | 182.7 |
| Cyberpunk 2077 2.2 Phantom Liberty (2023) | 118.9 | 94.3 | 80.1 | 71.4 |
| Counter-Strike 2 (2023) | 195.3 | 195 | 157 | 123.9 |
| Dragon's Dogma 2 (2024) | 70.6 | 63.3 | ||
| Ghost of Tsushima (2024) | 91 | 81.7 | 74.5 | 60.6 |
| Senua's Saga Hellblade 2 (2024) | 64.1 | 53.2 | 38.4 | |
| F1 24 (2024) | 216 | 201 | 162.5 | 54.1 |
排放与电量 - 电池寿命低于平均水平的联想 LOQ
噪音排放
在噪音方面,这款笔记本电脑的表现符合同类产品的预期:在负载情况下,它会产生大量噪音。玩《赛博朋克 2077》时产生的噪音为 48 dB(A)(平衡模式)和 54 dB(A)(性能模式)。静音模式可将噪音水平降至更适中的数值,但代价是笔记本电脑的性能下降。在降低设置的情况下,仍然可以玩游戏。
风扇控制需要重新调整:怠速运转时,风扇会反复短暂启动--从长远来看,这种行为非常恼人。有时,风扇还会持续运转,声音清晰可闻。
Noise Level
| Idle |
| 26 / 34 / 36 dB(A) |
| Load |
| 48 / 50 dB(A) |
 | ||
30 dB silent 40 dB(A) audible 50 dB(A) loud |
||
min: | ||
| Lenovo LOQ 15IRX9 NVIDIA GeForce RTX 4060 Laptop GPU, i5-13450HX, Micron 2400 MTFDKCD1T0QFM | SCHENKER XMG Core 15 (M24) NVIDIA GeForce RTX 4060 Laptop GPU, R7 8845HS, Samsung 990 Pro 1 TB | Gigabyte G6X 9KG (2024) NVIDIA GeForce RTX 4060 Laptop GPU, i7-13650HX, Gigabyte AG450E1024-SI | HP Victus 16 (2024) NVIDIA GeForce RTX 4060 Laptop GPU, i7-14700HX, Kioxia XG8 KXG80ZNV512G | Dell G16, i7-13650HX, RTX 4060 NVIDIA GeForce RTX 4060 Laptop GPU, i7-13650HX, WD PC SN740 SDDPNQD-1T00 | |
|---|---|---|---|---|---|
| Noise | 14% | -4% | 4% | 20% | |
| off / environment * | 25 | 23 8% | 26 -4% | 25 -0% | 23 8% |
| Idle Minimum * | 26 | 23 12% | 30 -15% | 28 -8% | 23 12% |
| Idle Average * | 34 | 23 32% | 32 6% | 29 15% | 23 32% |
| Idle Maximum * | 36 | 23 36% | 35 3% | 33 8% | 27.96 22% |
| Load Average * | 48 | 38.92 19% | 51 -6% | 45 6% | 27.96 42% |
| Cyberpunk 2077 ultra * | 48 | 52.06 -8% | |||
| Load Maximum * | 50 | 52.09 -4% | 54 -8% | 48 4% | 47.89 4% |
| Witcher 3 ultra * | 50.96 | 51 | 43 | 47.89 |
* ... smaller is better
温度
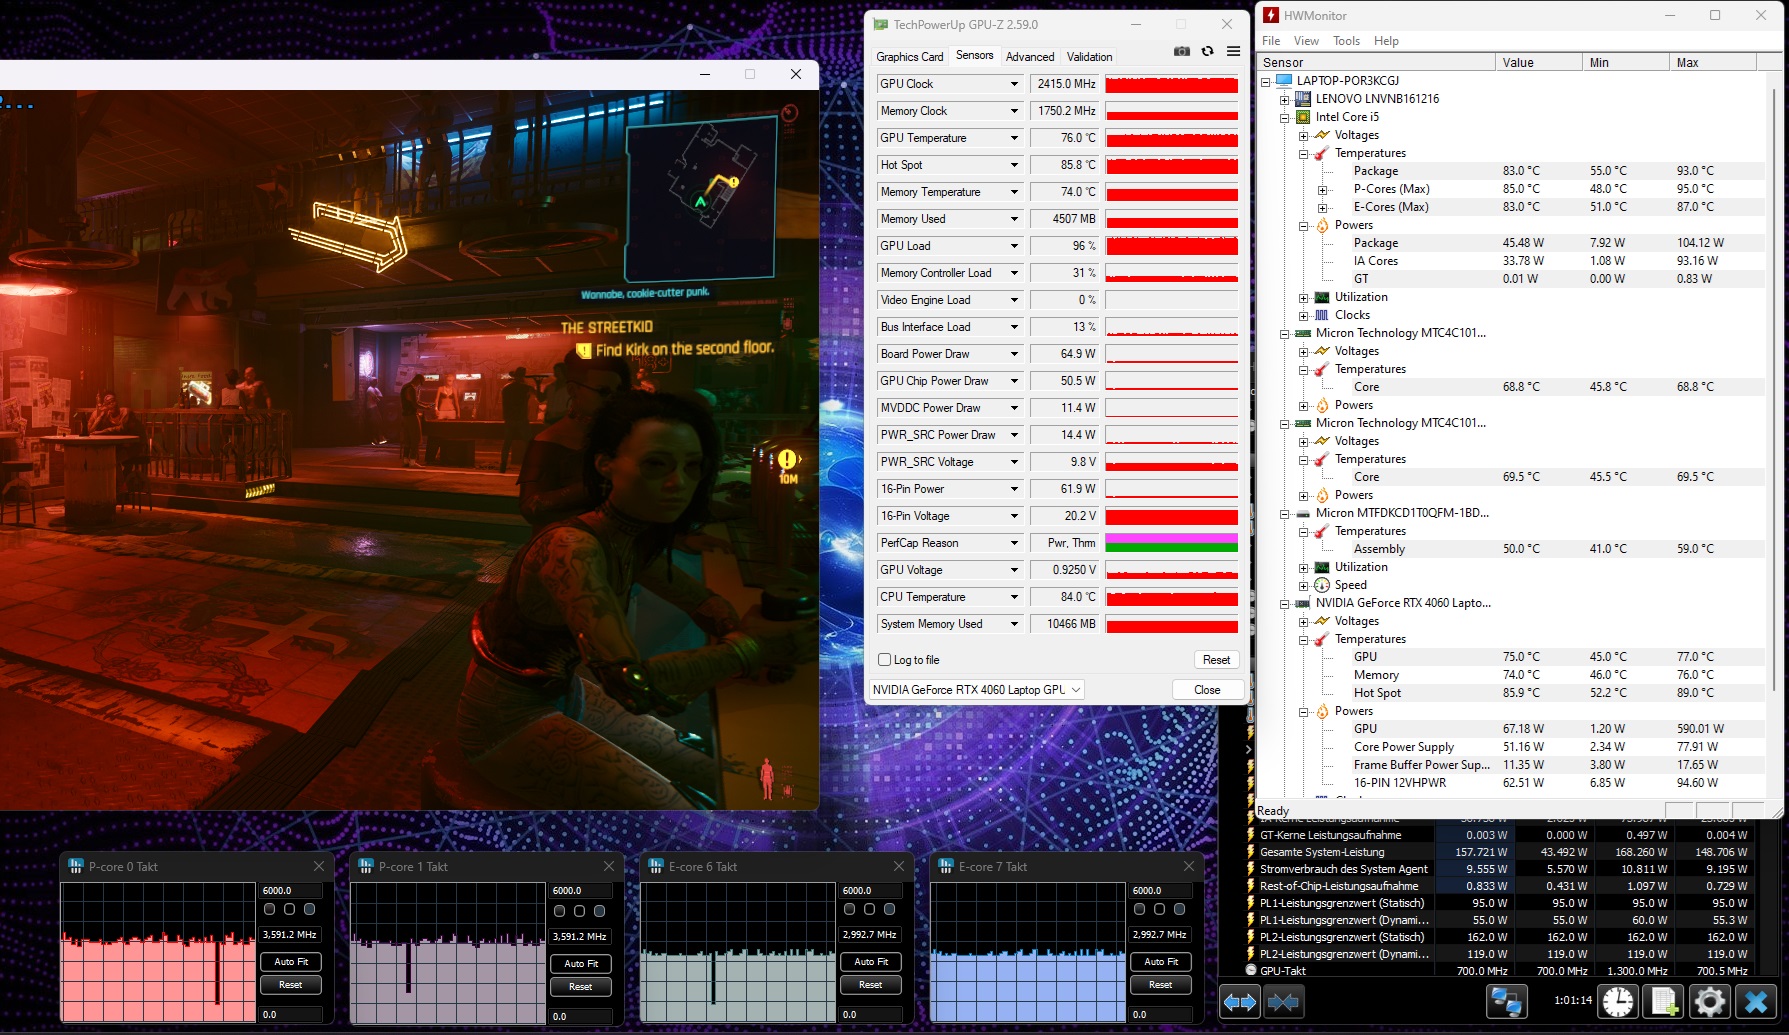
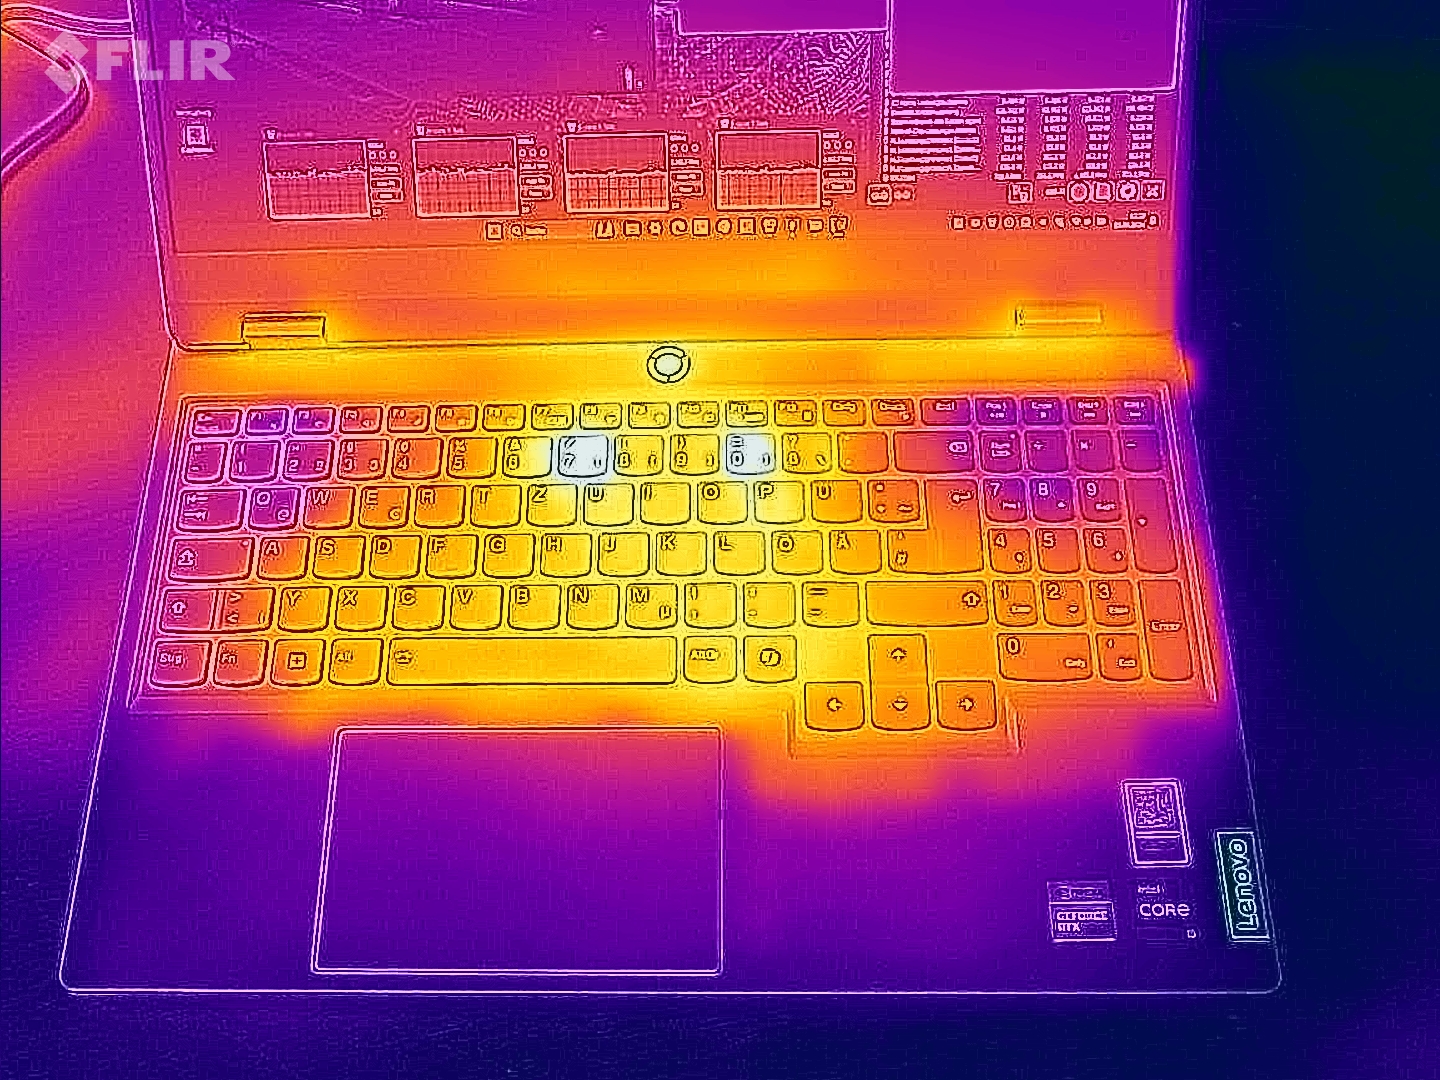
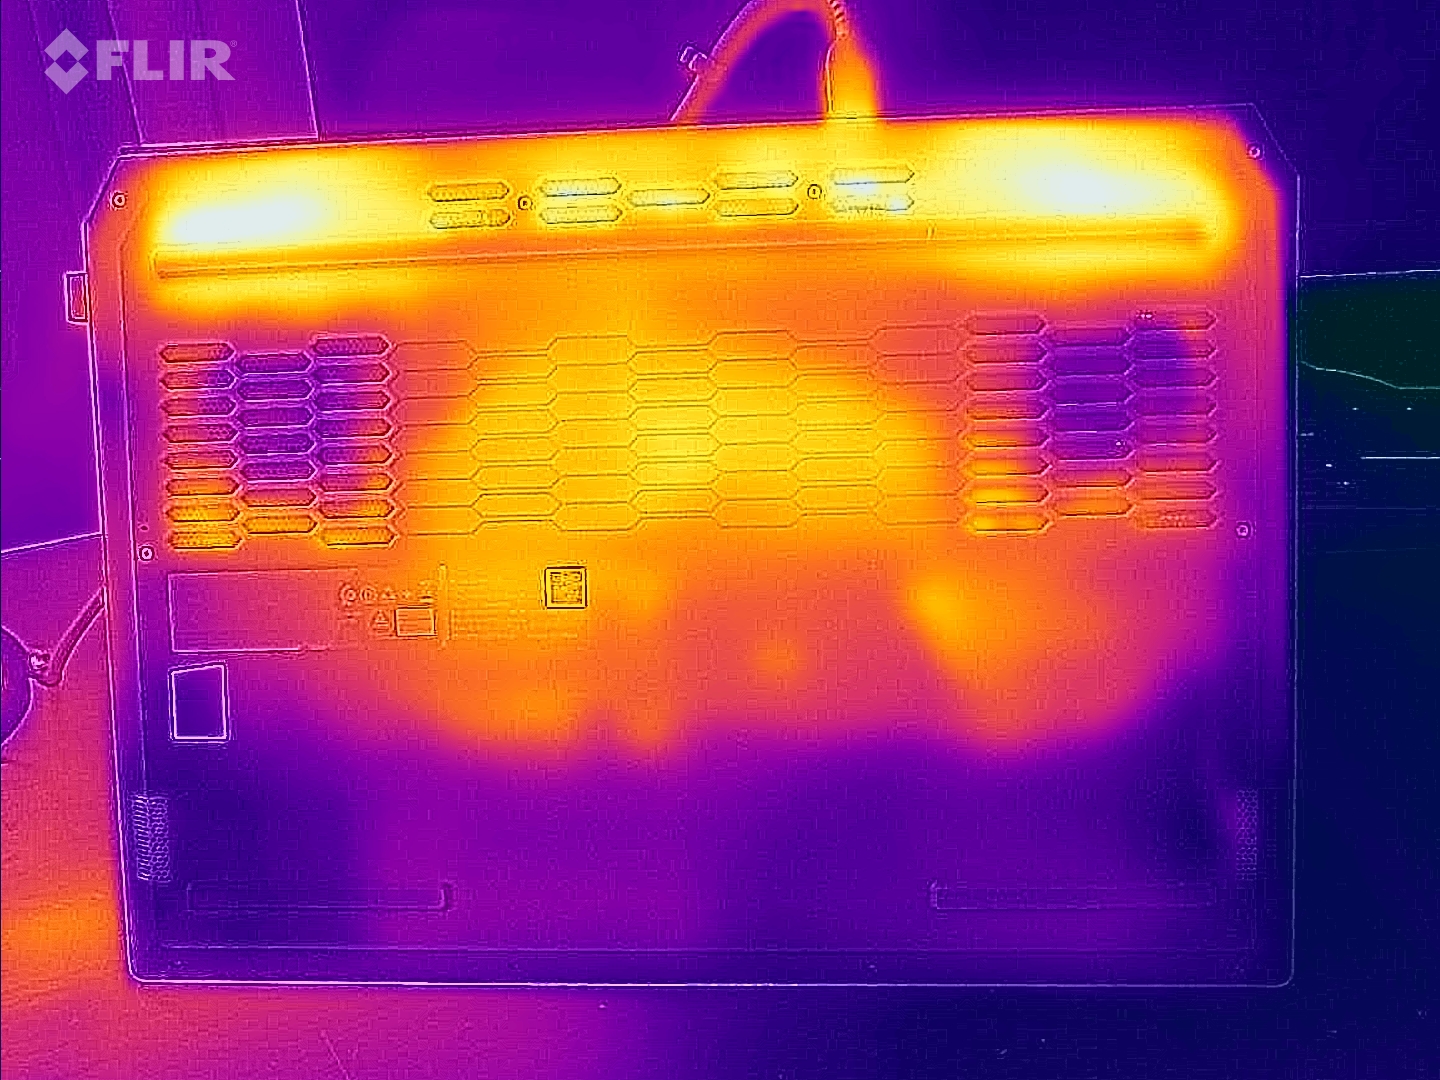
在负载情况下(压力测试、赛博朋克),笔记本电脑会明显发热:有时会超过 50 摄氏度。在日常使用(办公、上网)过程中,它的温度值也高于许多对比设备。掌托的温度保持在半合理状态。
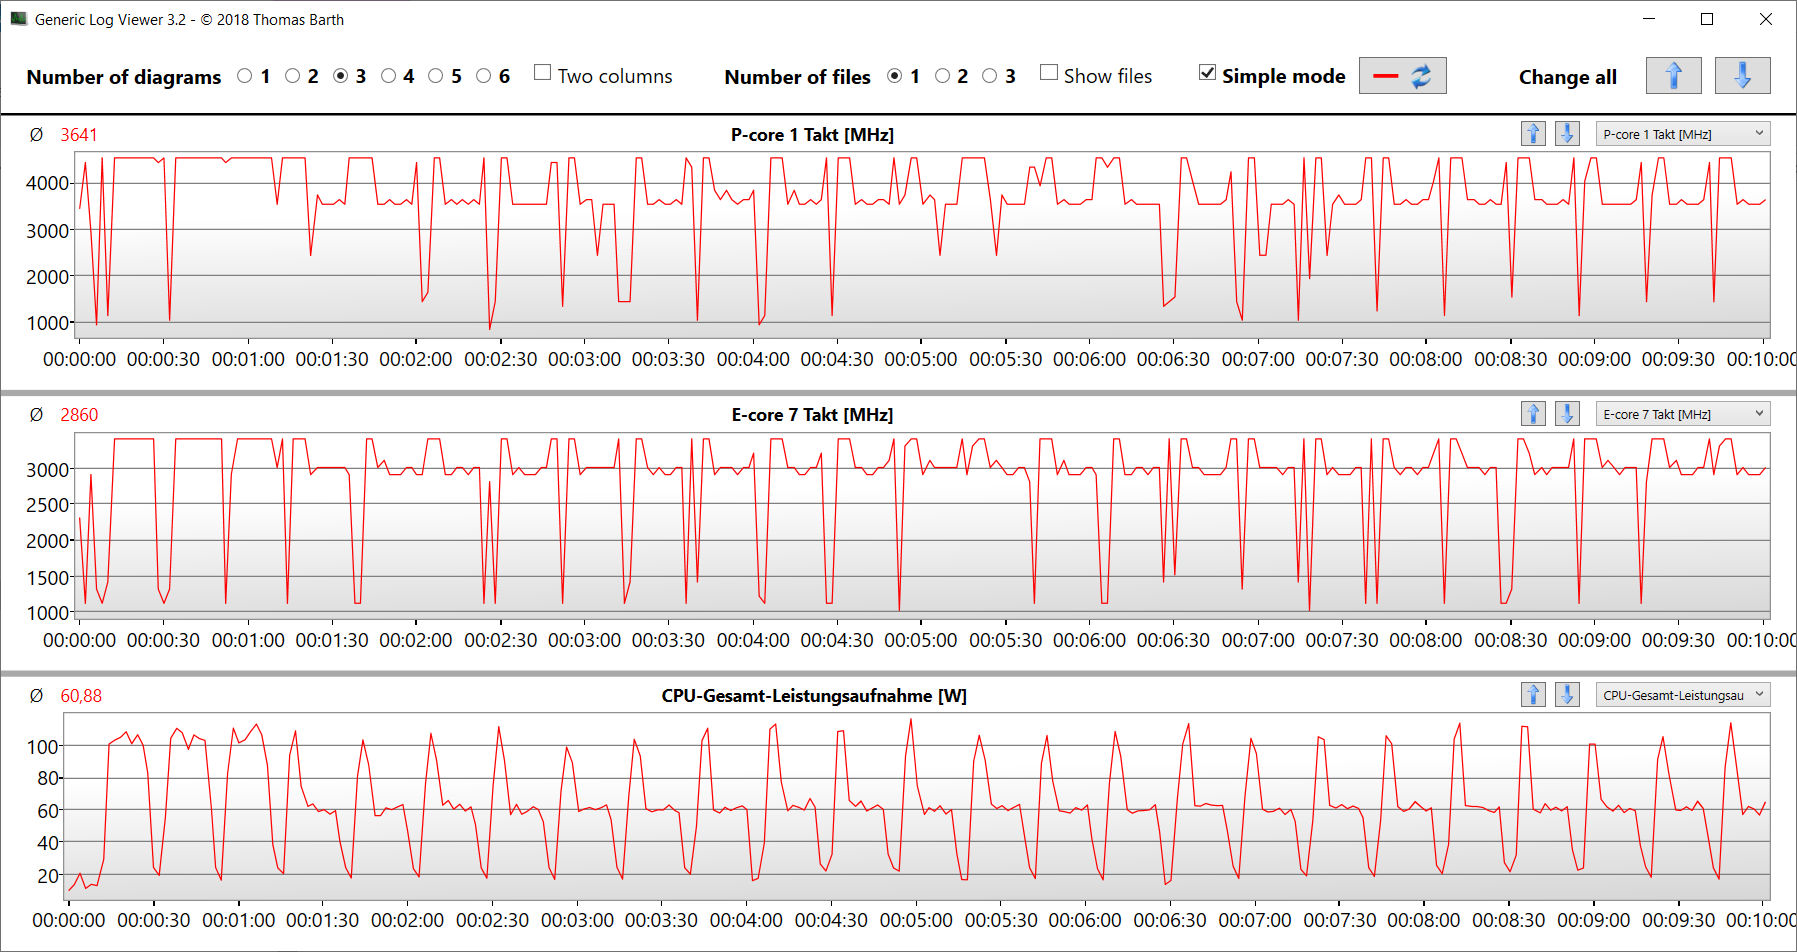
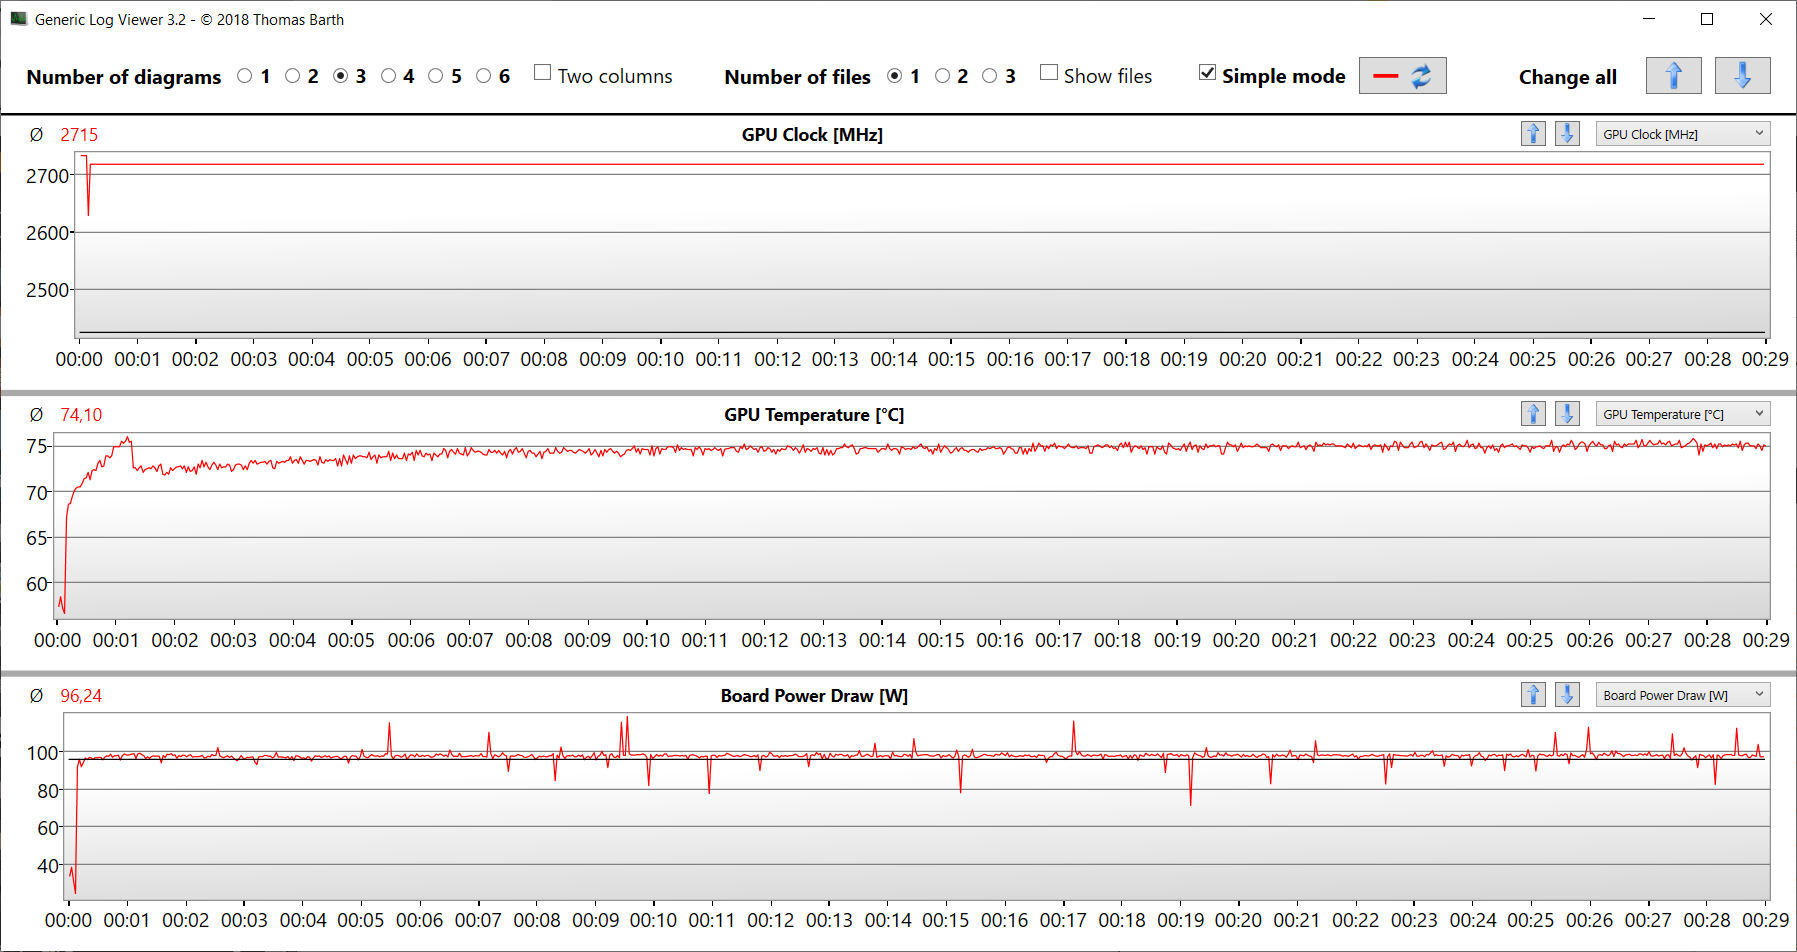
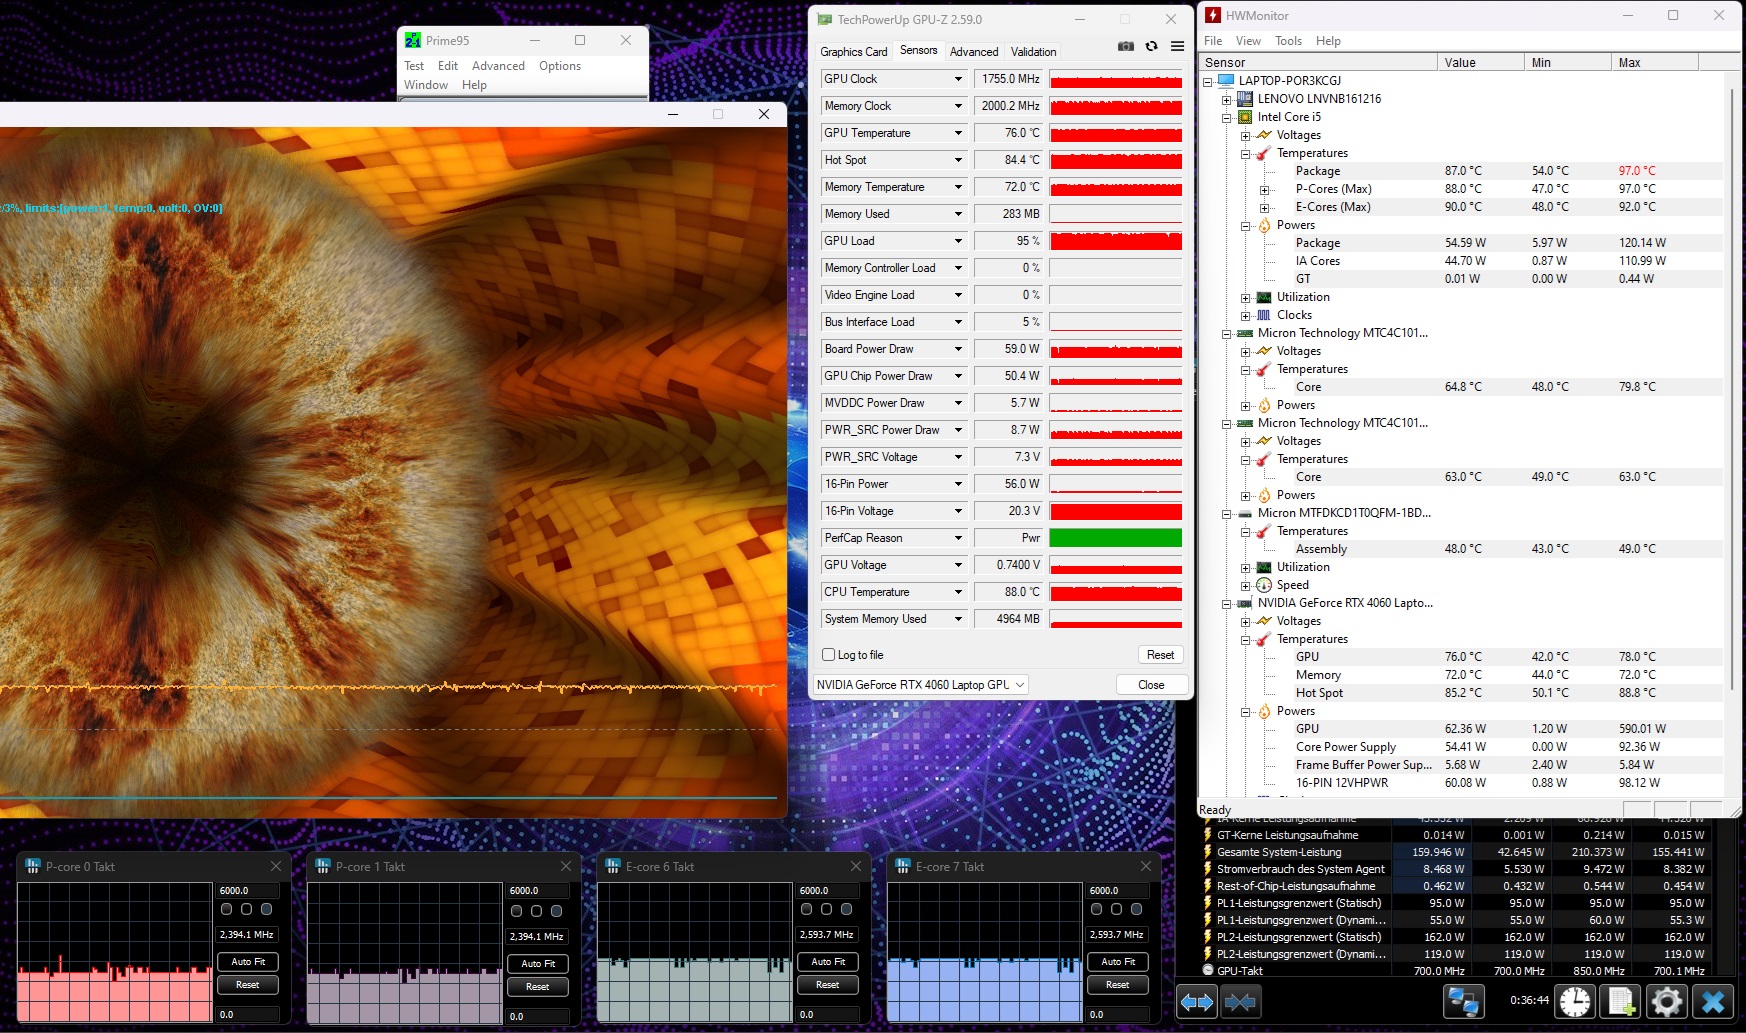
极端情况(使用 Prime95 和 Furmark 进行连续运行压力测试)检查了系统在满负荷情况下的稳定性。CPU 主频约为 2.4 GHz(P)和 2.6 GHz(E),图形核心的频率约为 1,800 MHz。
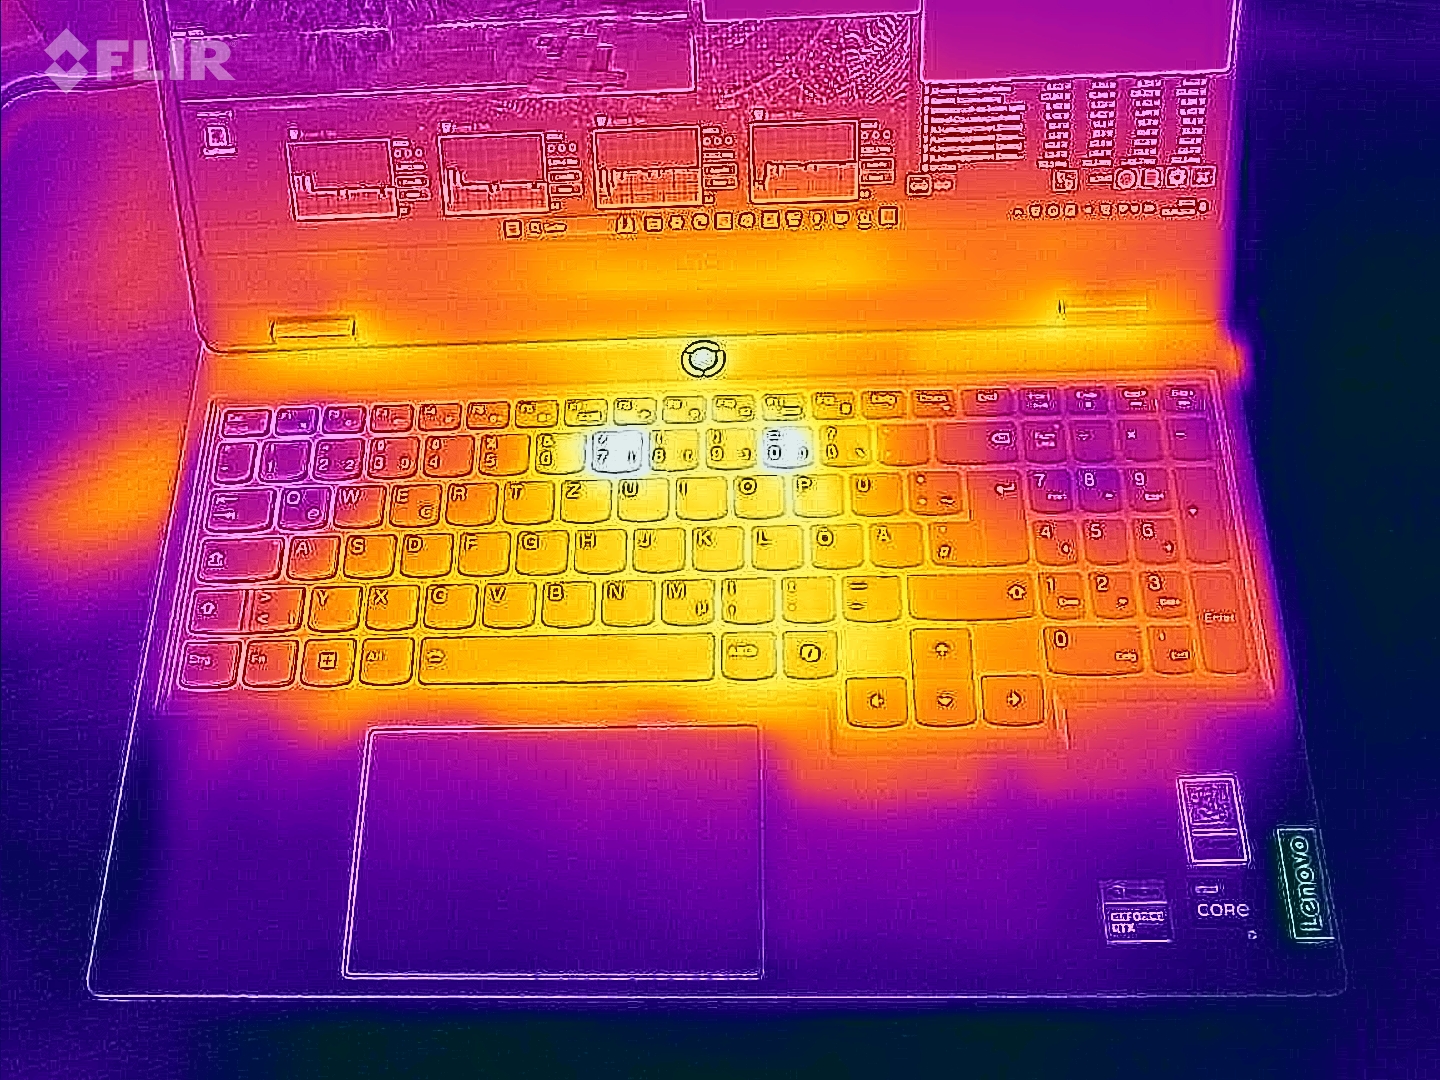
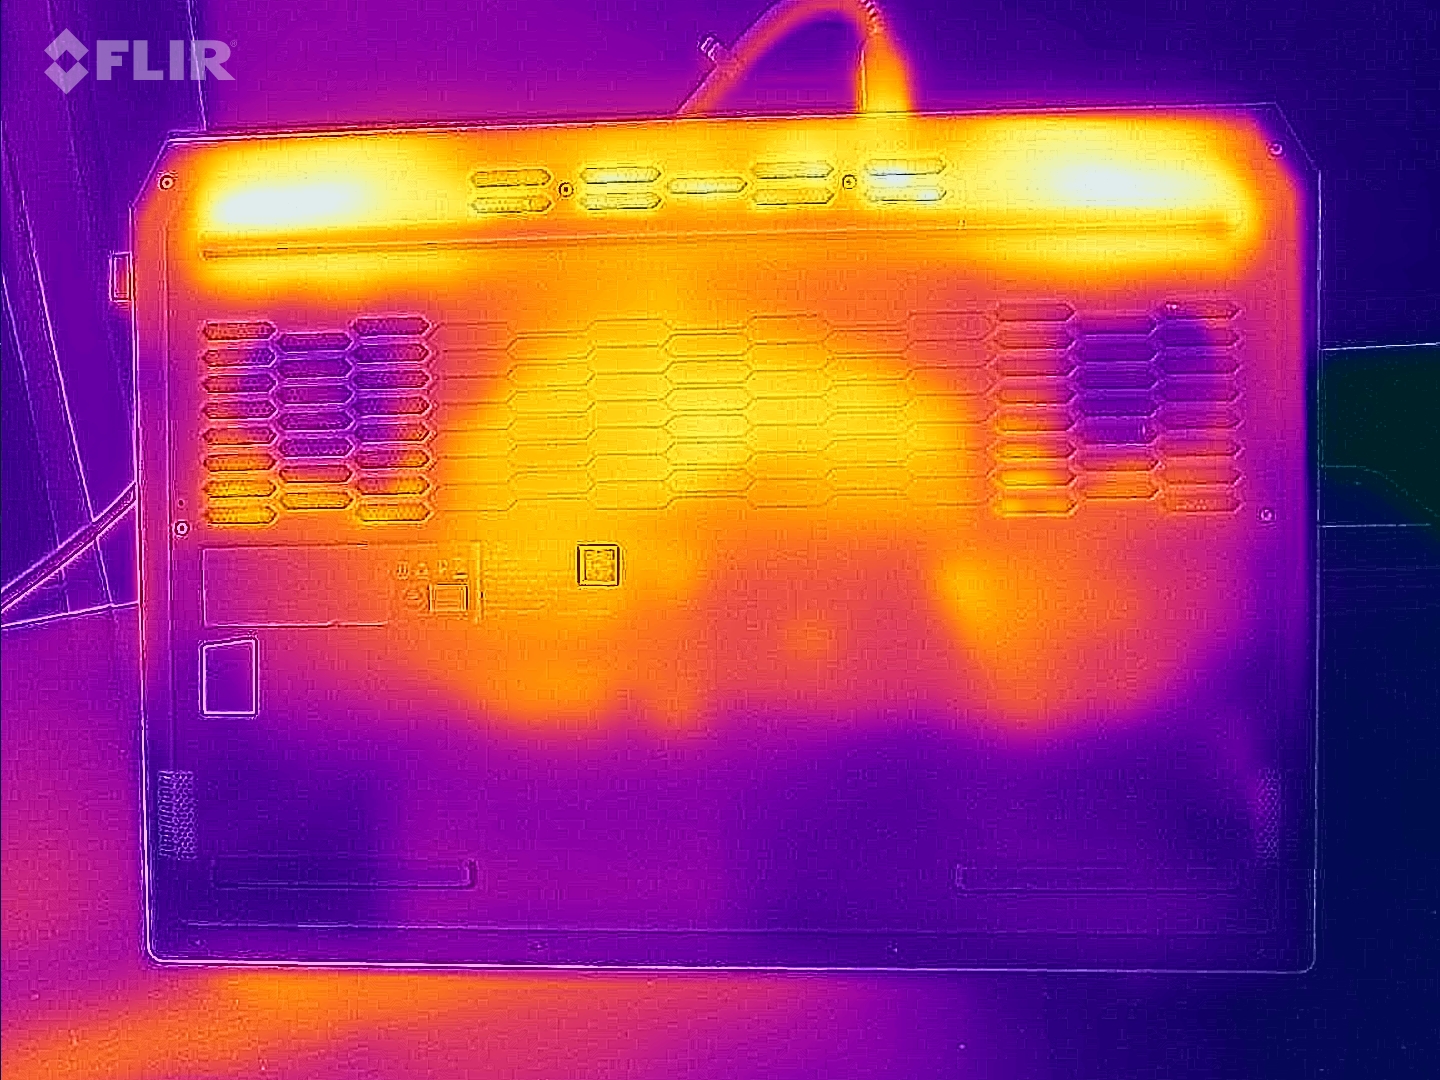
(-) The maximum temperature on the upper side is 47 °C / 117 F, compared to the average of 40.4 °C / 105 F, ranging from 21.2 to 68.8 °C for the class Gaming.
(-) The bottom heats up to a maximum of 58 °C / 136 F, compared to the average of 43.2 °C / 110 F
(+) In idle usage, the average temperature for the upper side is 30.2 °C / 86 F, compared to the device average of 33.9 °C / 93 F.
(-) 3: The average temperature for the upper side is 41.7 °C / 107 F, compared to the average of 33.9 °C / 93 F for the class Gaming.
(±) The palmrests and touchpad can get very hot to the touch with a maximum of 38 °C / 100.4 F.
(-) The average temperature of the palmrest area of similar devices was 28.9 °C / 84 F (-9.1 °C / -16.4 F).
| Lenovo LOQ 15IRX9 Intel Core i5-13450HX, NVIDIA GeForce RTX 4060 Laptop GPU | SCHENKER XMG Core 15 (M24) AMD Ryzen 7 8845HS, NVIDIA GeForce RTX 4060 Laptop GPU | Gigabyte G6X 9KG (2024) Intel Core i7-13650HX, NVIDIA GeForce RTX 4060 Laptop GPU | HP Victus 16 (2024) Intel Core i7-14700HX, NVIDIA GeForce RTX 4060 Laptop GPU | Dell G16, i7-13650HX, RTX 4060 Intel Core i7-13650HX, NVIDIA GeForce RTX 4060 Laptop GPU | |
|---|---|---|---|---|---|
| Heat | -8% | 9% | 15% | -3% | |
| Maximum Upper Side * | 47 | 52 -11% | 41 13% | 50 -6% | 49 -4% |
| Maximum Bottom * | 58 | 61 -5% | 43 26% | 50 14% | 58 -0% |
| Idle Upper Side * | 32 | 35 -9% | 32 -0% | 25 22% | 35 -9% |
| Idle Bottom * | 36 | 39 -8% | 37 -3% | 26 28% | 35 3% |
* ... smaller is better
发言人
立体声扬声器产生的音效总体上可以接受。不过,多一点低音也未尝不可。
Lenovo LOQ 15IRX9 audio analysis
(±) | speaker loudness is average but good (81 dB)
Bass 100 - 315 Hz
(±) | reduced bass - on average 14.6% lower than median
(±) | linearity of bass is average (9.6% delta to prev. frequency)
Mids 400 - 2000 Hz
(+) | balanced mids - only 2.1% away from median
(+) | mids are linear (3.6% delta to prev. frequency)
Highs 2 - 16 kHz
(±) | higher highs - on average 5.9% higher than median
(±) | linearity of highs is average (8.2% delta to prev. frequency)
Overall 100 - 16.000 Hz
(+) | overall sound is linear (14.7% difference to median)
Compared to same class
» 27% of all tested devices in this class were better, 7% similar, 66% worse
» The best had a delta of 6%, average was 18%, worst was 132%
Compared to all devices tested
» 17% of all tested devices were better, 4% similar, 79% worse
» The best had a delta of 4%, average was 24%, worst was 134%
SCHENKER XMG Core 15 (M24) audio analysis
(±) | speaker loudness is average but good (79.12 dB)
Bass 100 - 315 Hz
(-) | nearly no bass - on average 16.7% lower than median
(-) | bass is not linear (15.7% delta to prev. frequency)
Mids 400 - 2000 Hz
(+) | balanced mids - only 4.5% away from median
(+) | mids are linear (4.4% delta to prev. frequency)
Highs 2 - 16 kHz
(+) | balanced highs - only 1% away from median
(+) | highs are linear (2.7% delta to prev. frequency)
Overall 100 - 16.000 Hz
(+) | overall sound is linear (13.7% difference to median)
Compared to same class
» 20% of all tested devices in this class were better, 6% similar, 74% worse
» The best had a delta of 6%, average was 18%, worst was 132%
Compared to all devices tested
» 13% of all tested devices were better, 3% similar, 83% worse
» The best had a delta of 4%, average was 24%, worst was 134%
耗电量
对于已安装的硬件来说,它的功耗非常正常。赛博朋克和压力测试都是在耗电量相对稳定的情况下进行的。电源装置的功率为 230 瓦,刚好够用。
| Off / Standby | |
| Idle | |
| Load |
|
Key:
min: | |
| Lenovo LOQ 15IRX9 Intel Core i5-13450HX, NVIDIA GeForce RTX 4060 Laptop GPU | SCHENKER XMG Core 15 (M24) AMD Ryzen 7 8845HS, NVIDIA GeForce RTX 4060 Laptop GPU | Gigabyte G6X 9KG (2024) Intel Core i7-13650HX, NVIDIA GeForce RTX 4060 Laptop GPU | HP Victus 16 (2024) Intel Core i7-14700HX, NVIDIA GeForce RTX 4060 Laptop GPU | Dell G16, i7-13650HX, RTX 4060 Intel Core i7-13650HX, NVIDIA GeForce RTX 4060 Laptop GPU | |
|---|---|---|---|---|---|
| Power Consumption | 20% | 2% | 1% | 6% | |
| Idle Minimum * | 13 | 9.3 28% | 12 8% | 9 31% | 11 15% |
| Idle Average * | 18 | 12.9 28% | 13 28% | 15 17% | 14.8 18% |
| Idle Maximum * | 24 | 12.8 47% | 27 -13% | 23 4% | 16.8 30% |
| Load Average * | 85 | 105 -24% | 123 -45% | 103.7 -22% | |
| Cyberpunk 2077 ultra * | 155.7 | ||||
| Cyberpunk 2077 ultra external monitor * | 150.9 | ||||
| Load Maximum * | 232 | 286 -23% | 210 9% | 241 -4% | 255 -10% |
| Witcher 3 ultra * | 167 | 167.8 | 143.7 | 185 |
* ... smaller is better
Power consumption Cyberpunk 2077 / stress test
Power consumption with external monitor
运行时间
在我们的实际 WLAN 测试中,这款 15.6 英寸设备的运行时间为 5:20 小时(使用脚本访问网站时的负载映射),这并不是一个出色的数值。其电池容量(60 瓦时)相对较低,这一点显而易见。
Pros
Cons
评语 - 经济实惠的游戏机

LOQ 允许在高至最高设置下进行全高清游戏--酷睿 i5-13450HX 酷睿 i5-13450HX和 GeForce RTX 4060使之成为可能。这样,CPU 和 GPU 就能以持续的高时钟频率运行。PCIe 4 SSD(1 TB)可确保缩短加载时间。
联想的 LOQ 15IRX9 是一款经济实惠的全高清游戏笔记本电脑,但也存在一两个小瑕疵。
使用静音模式可以将高辐射降至中等水平,但代价是笔记本电脑的性能下降。它的风扇控制也需要改进:在空闲模式下,风扇会持续运行或脉动,这完全没有必要。
联想坚持使用 16:9 长宽比的屏幕,让你白白寻找 16:10 的屏幕。安装的 15.6 英寸面板(FHD、144 Hz、G-Sync、sRGB)效果不错,但亮度还可以再提高一些。这款笔记本电脑不提供 Thunderbolt 4 或 USB 4 接口。不过:它的 USB-C 端口(USB 3.2 Gen 2)支持 Power Delivery 和 Display ALT 模式。该设备的电池续航时间不会打破任何世界纪录。
您可以选择 技嘉 G6X 9KG.它的 CPU 性能稍强,采用 16 英寸 16:10 屏幕,运行时间也更长。在色彩空间覆盖率方面,它落后于 LOQ。
价格和供应情况
在撰写本文时,我们配置的联想LOQ 15IRX9可以通过亚马逊以1279美元的价格购买。
请注意:我们最近更新了评级系统,第 8 版的结果无法与第 7 版的结果进行比较。更多信息 此处.
Lenovo LOQ 15IRX9
- 07/08/2024 v8
Sascha Mölck
 Total Sustainability Score:
 Transparency
The selection of devices to be reviewed is made by our editorial team. The test sample was provided to the author as a loan by the manufacturer or retailer for the purpose of this review. The lender had no influence on this review, nor did the manufacturer receive a copy of this review before publication. There was no obligation to publish this review. We never accept compensation or payment in return for our reviews. As an independent media company, Notebookcheck is not subjected to the authority of manufacturers, retailers or publishers.
This is how Notebookcheck is testing
Every year, Notebookcheck independently reviews hundreds of laptops and smartphones using standardized procedures to ensure that all results are comparable. We have continuously developed our test methods for around 20 years and set industry standards in the process. In our test labs, high-quality measuring equipment is utilized by experienced technicians and editors. These tests involve a multi-stage validation process. Our complex rating system is based on hundreds of well-founded measurements and benchmarks, which maintains objectivity. Further information on our test methods can be found here.
Price comparison

