

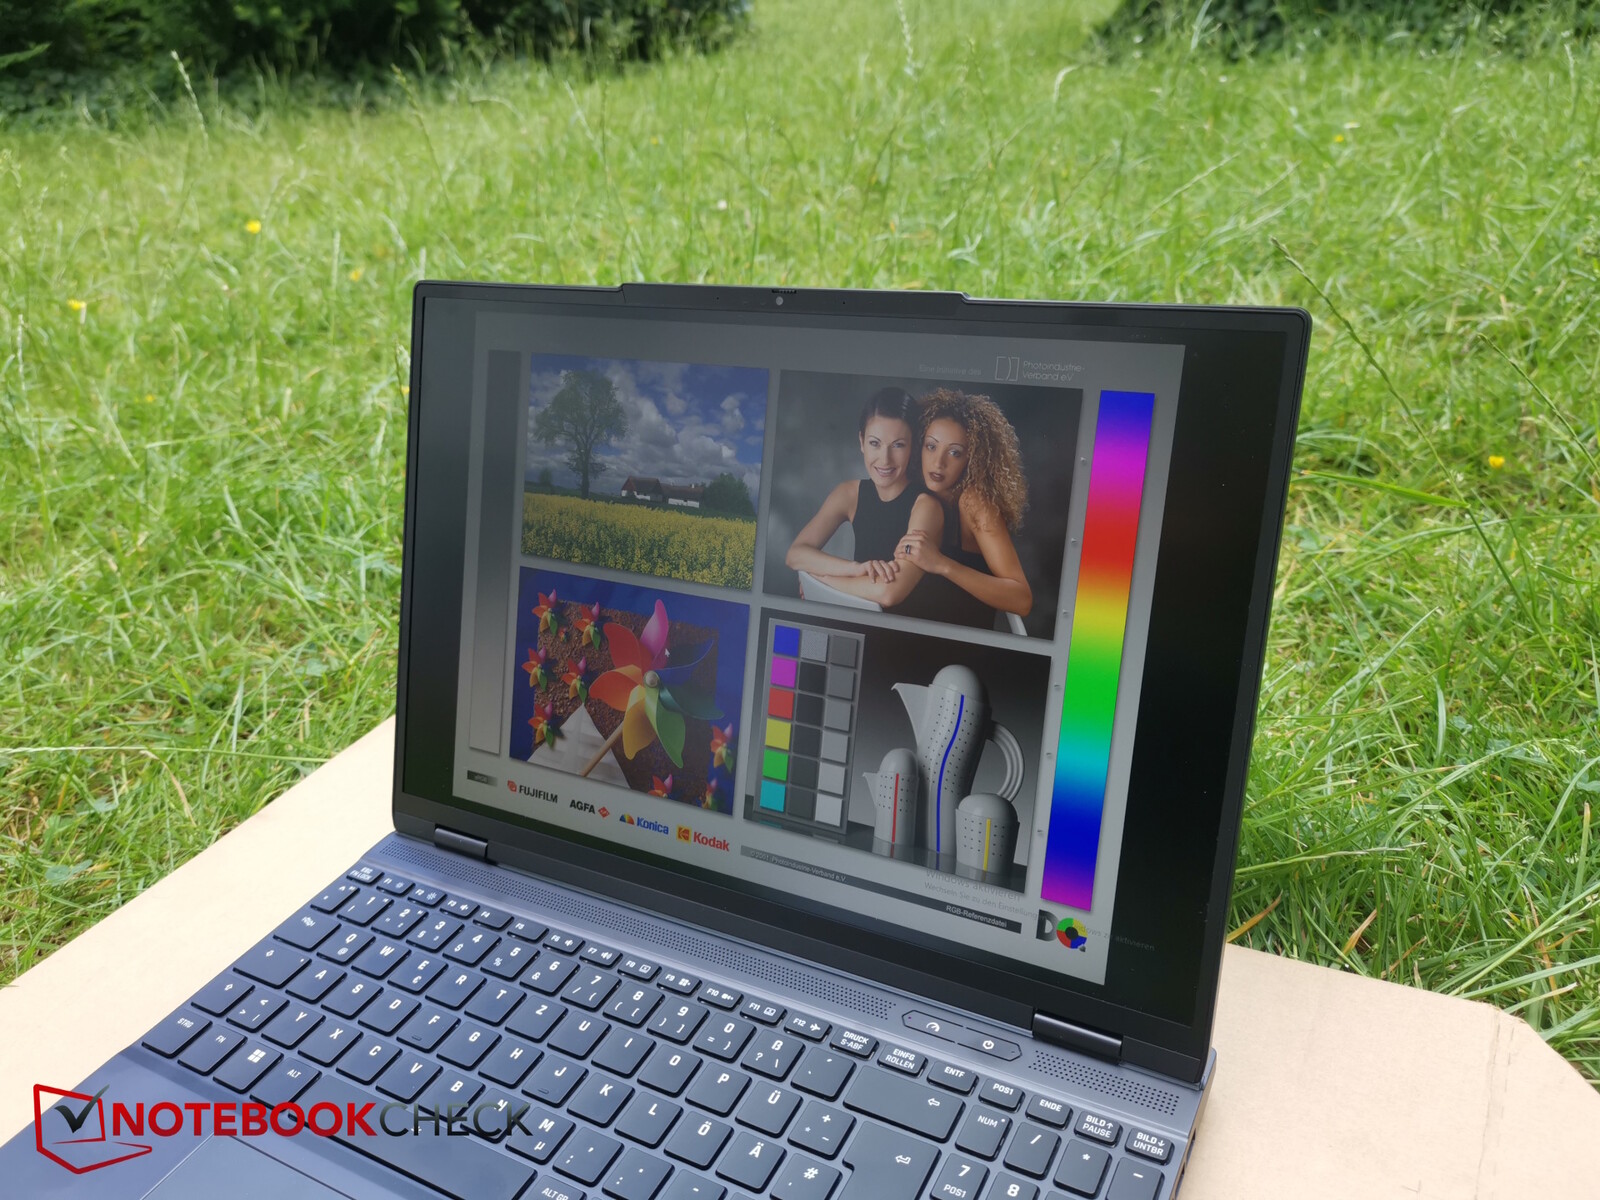
SCHENKER XMG Core 15 (M24) 笔记本电脑评测:来自德国的高级金属外壳游戏机

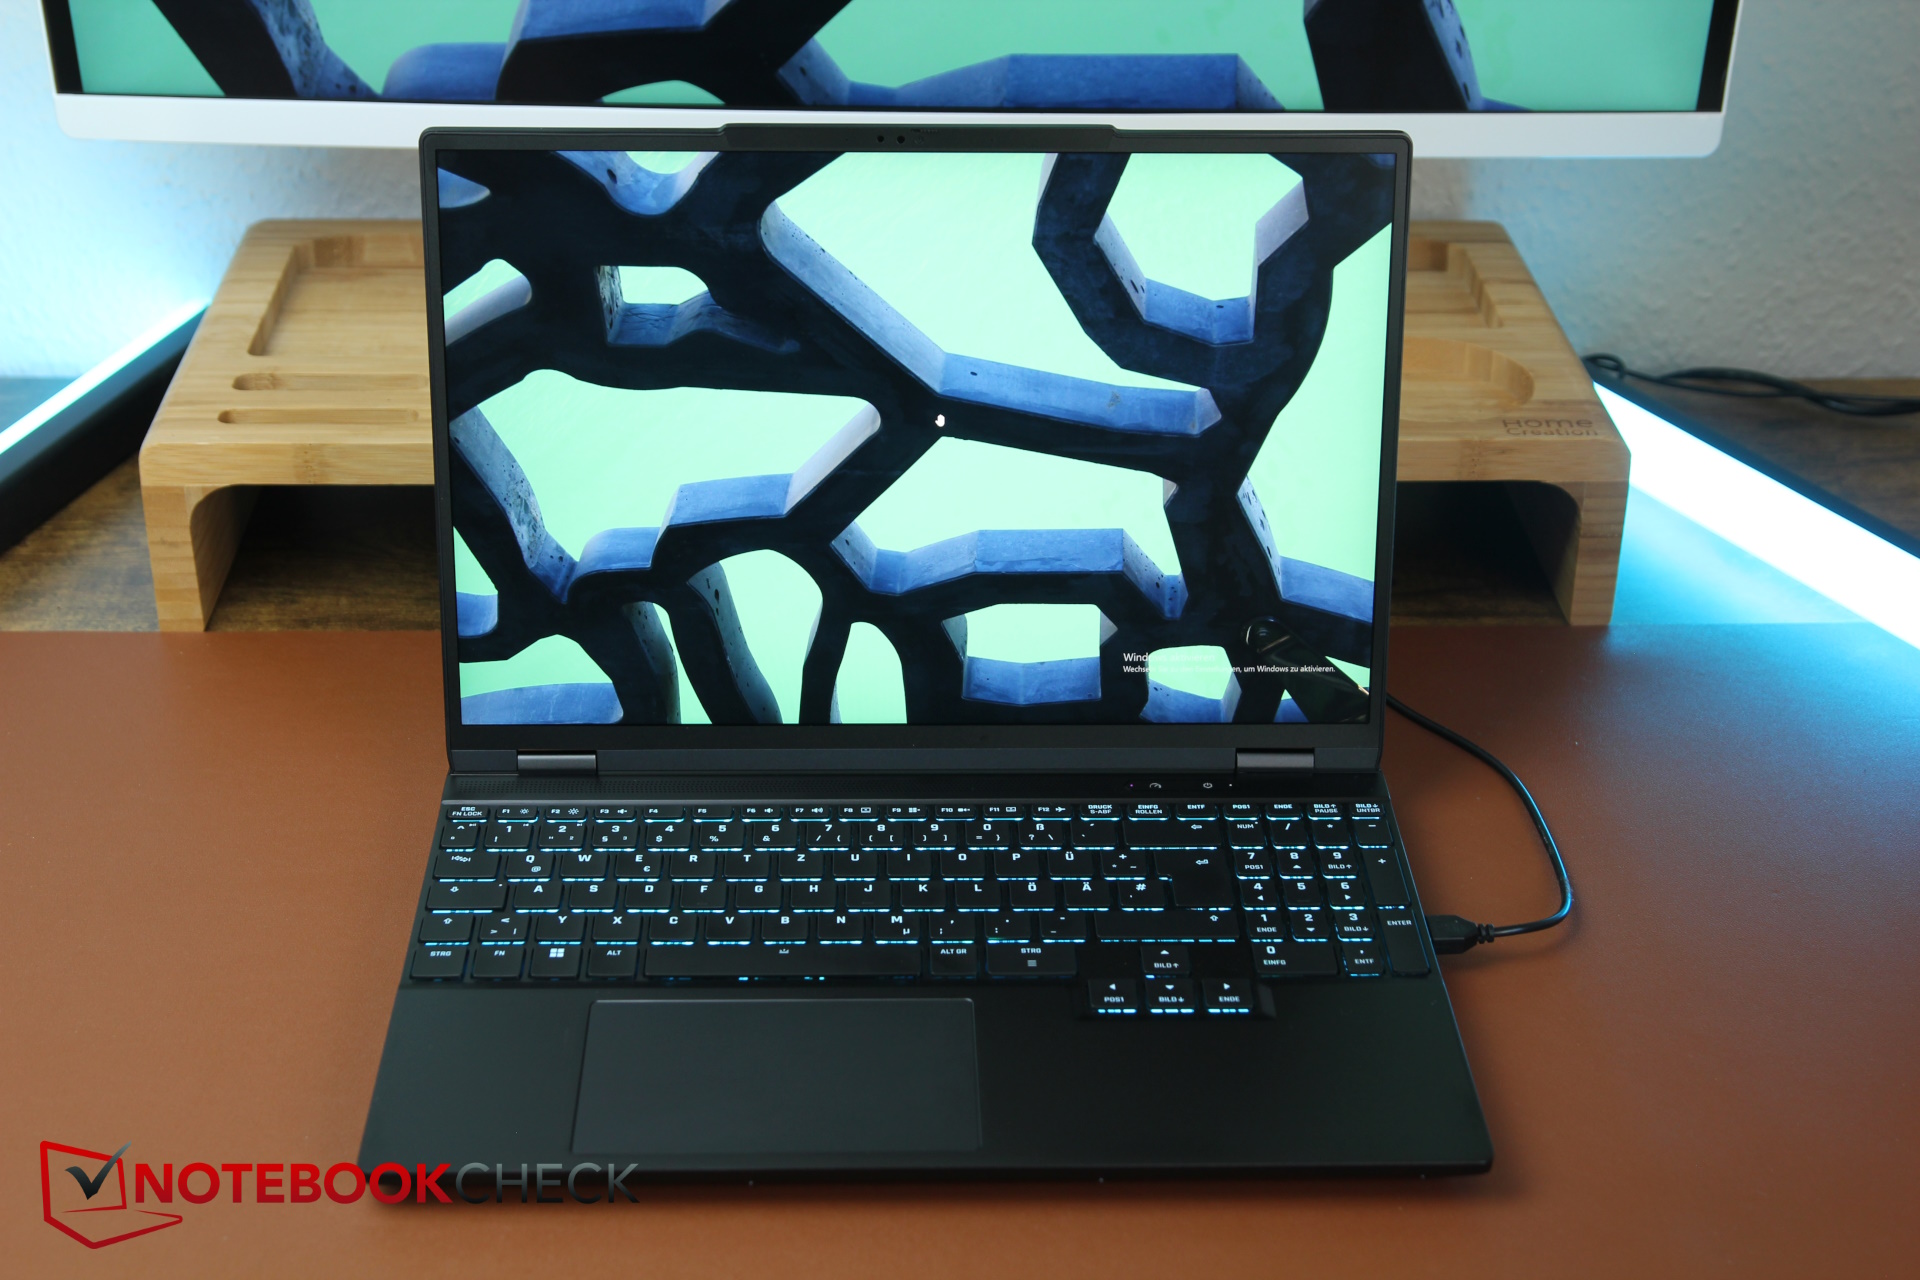
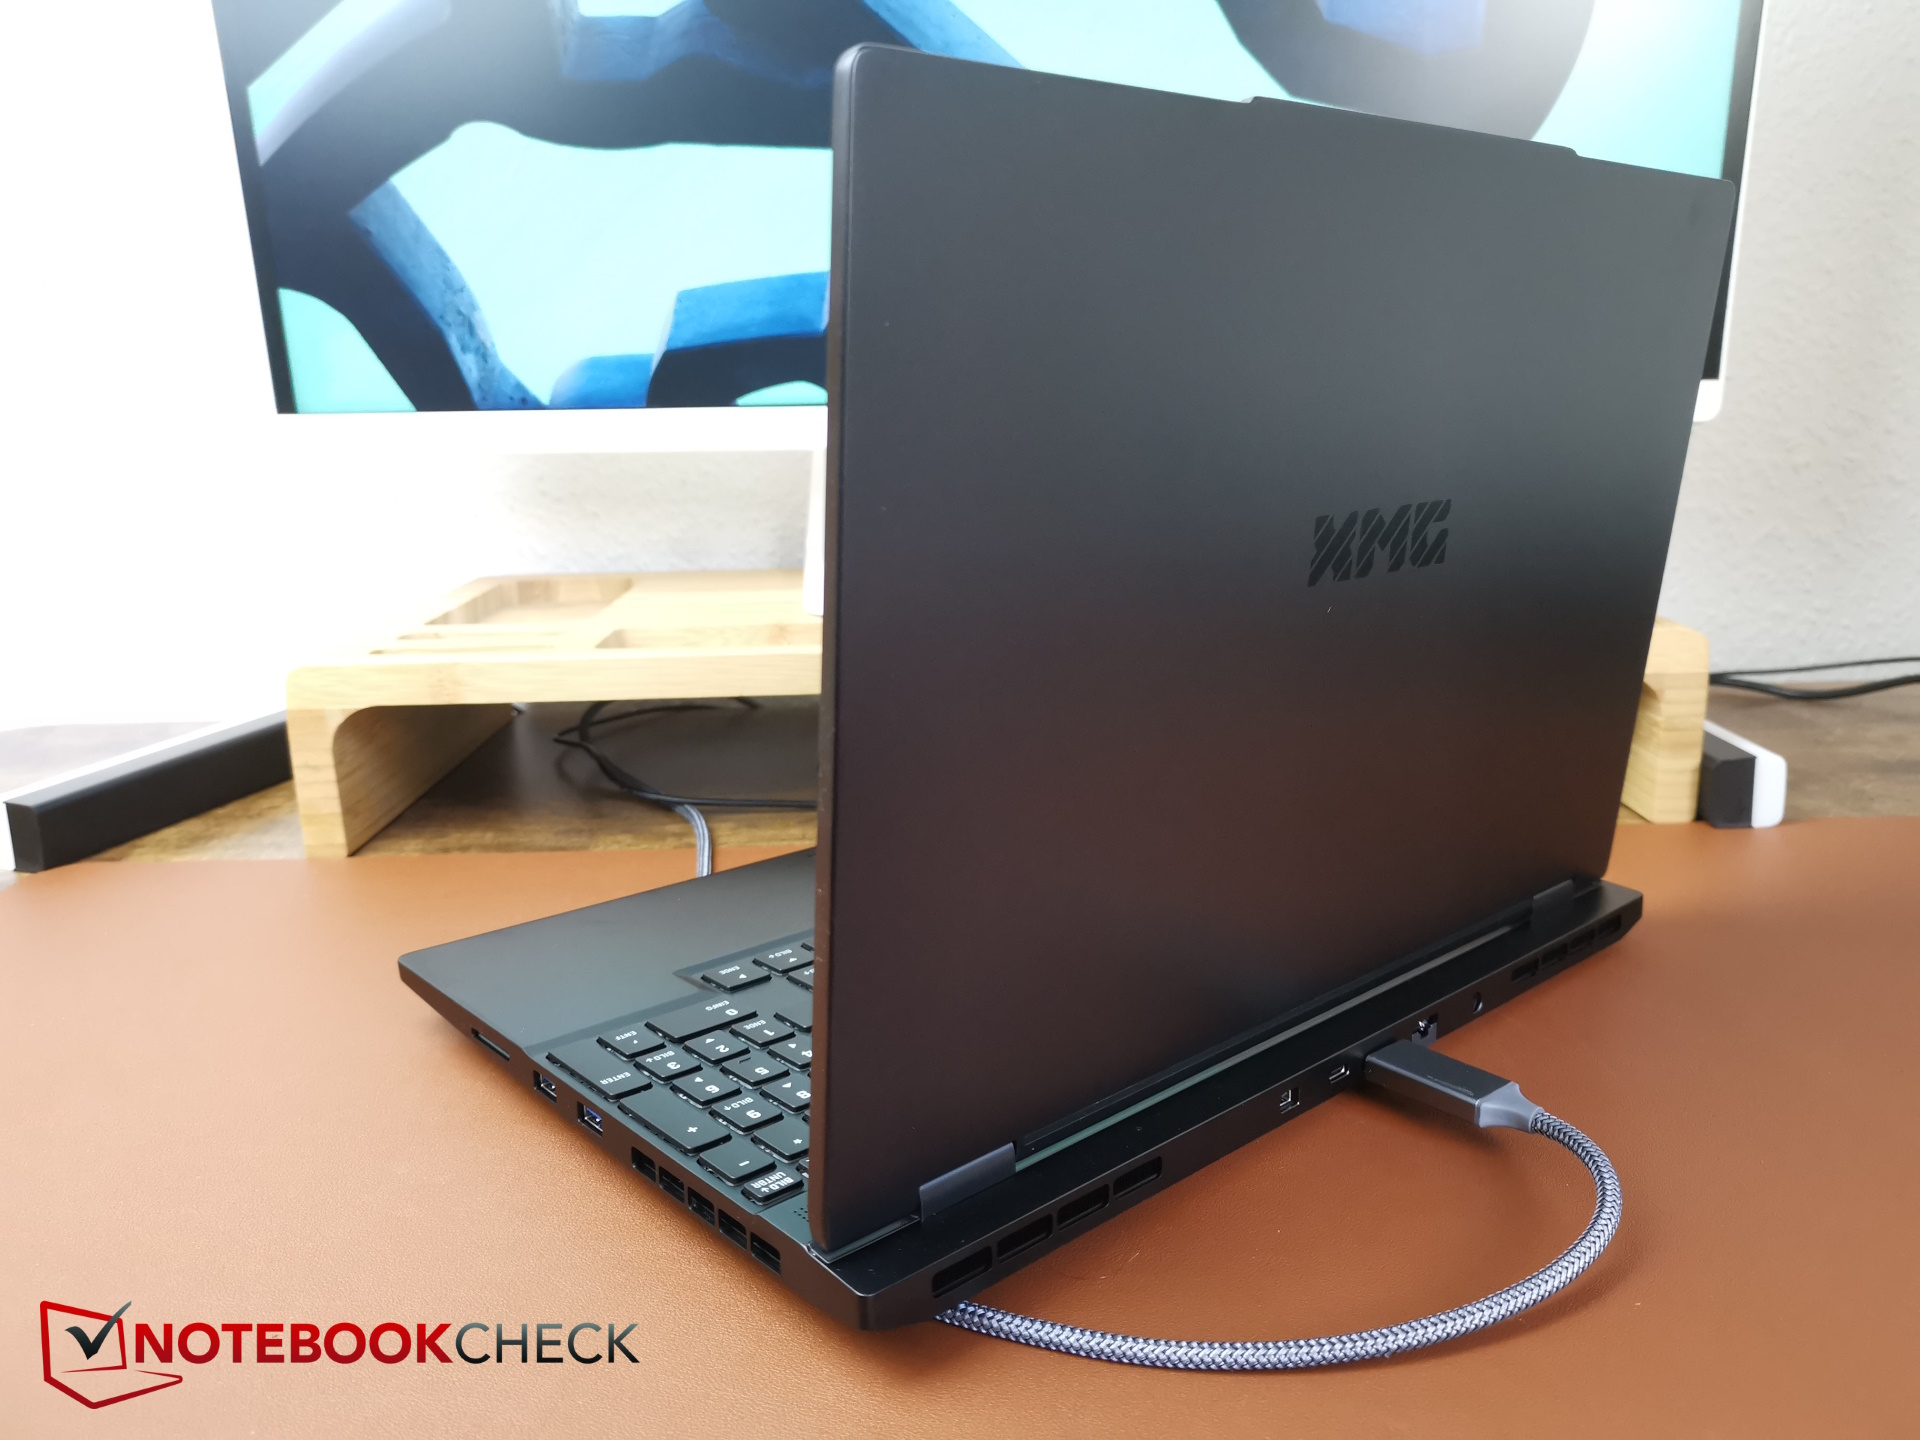
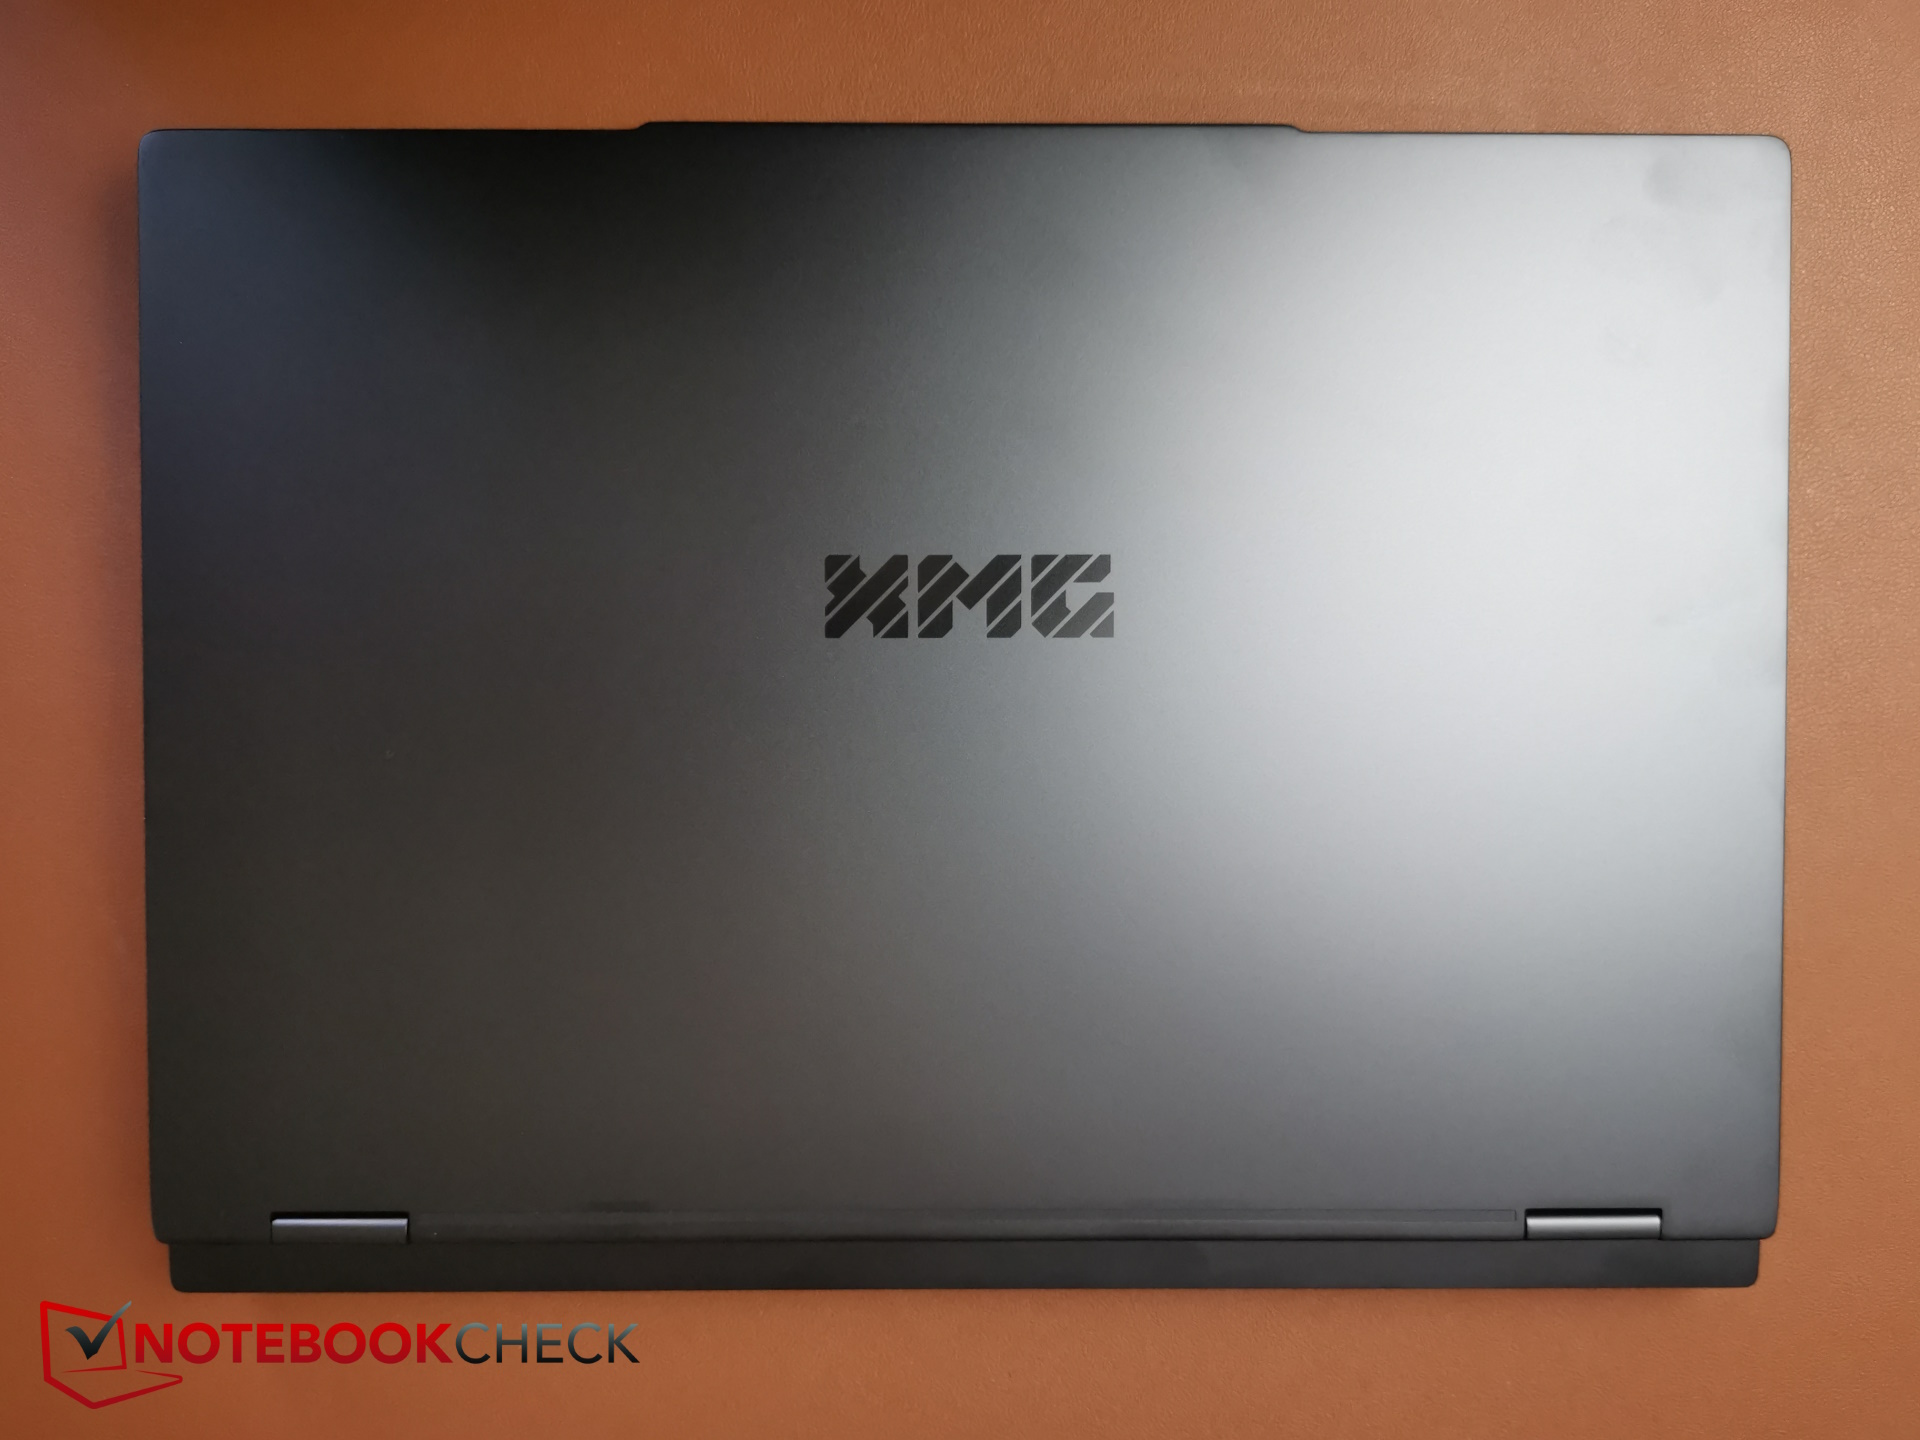
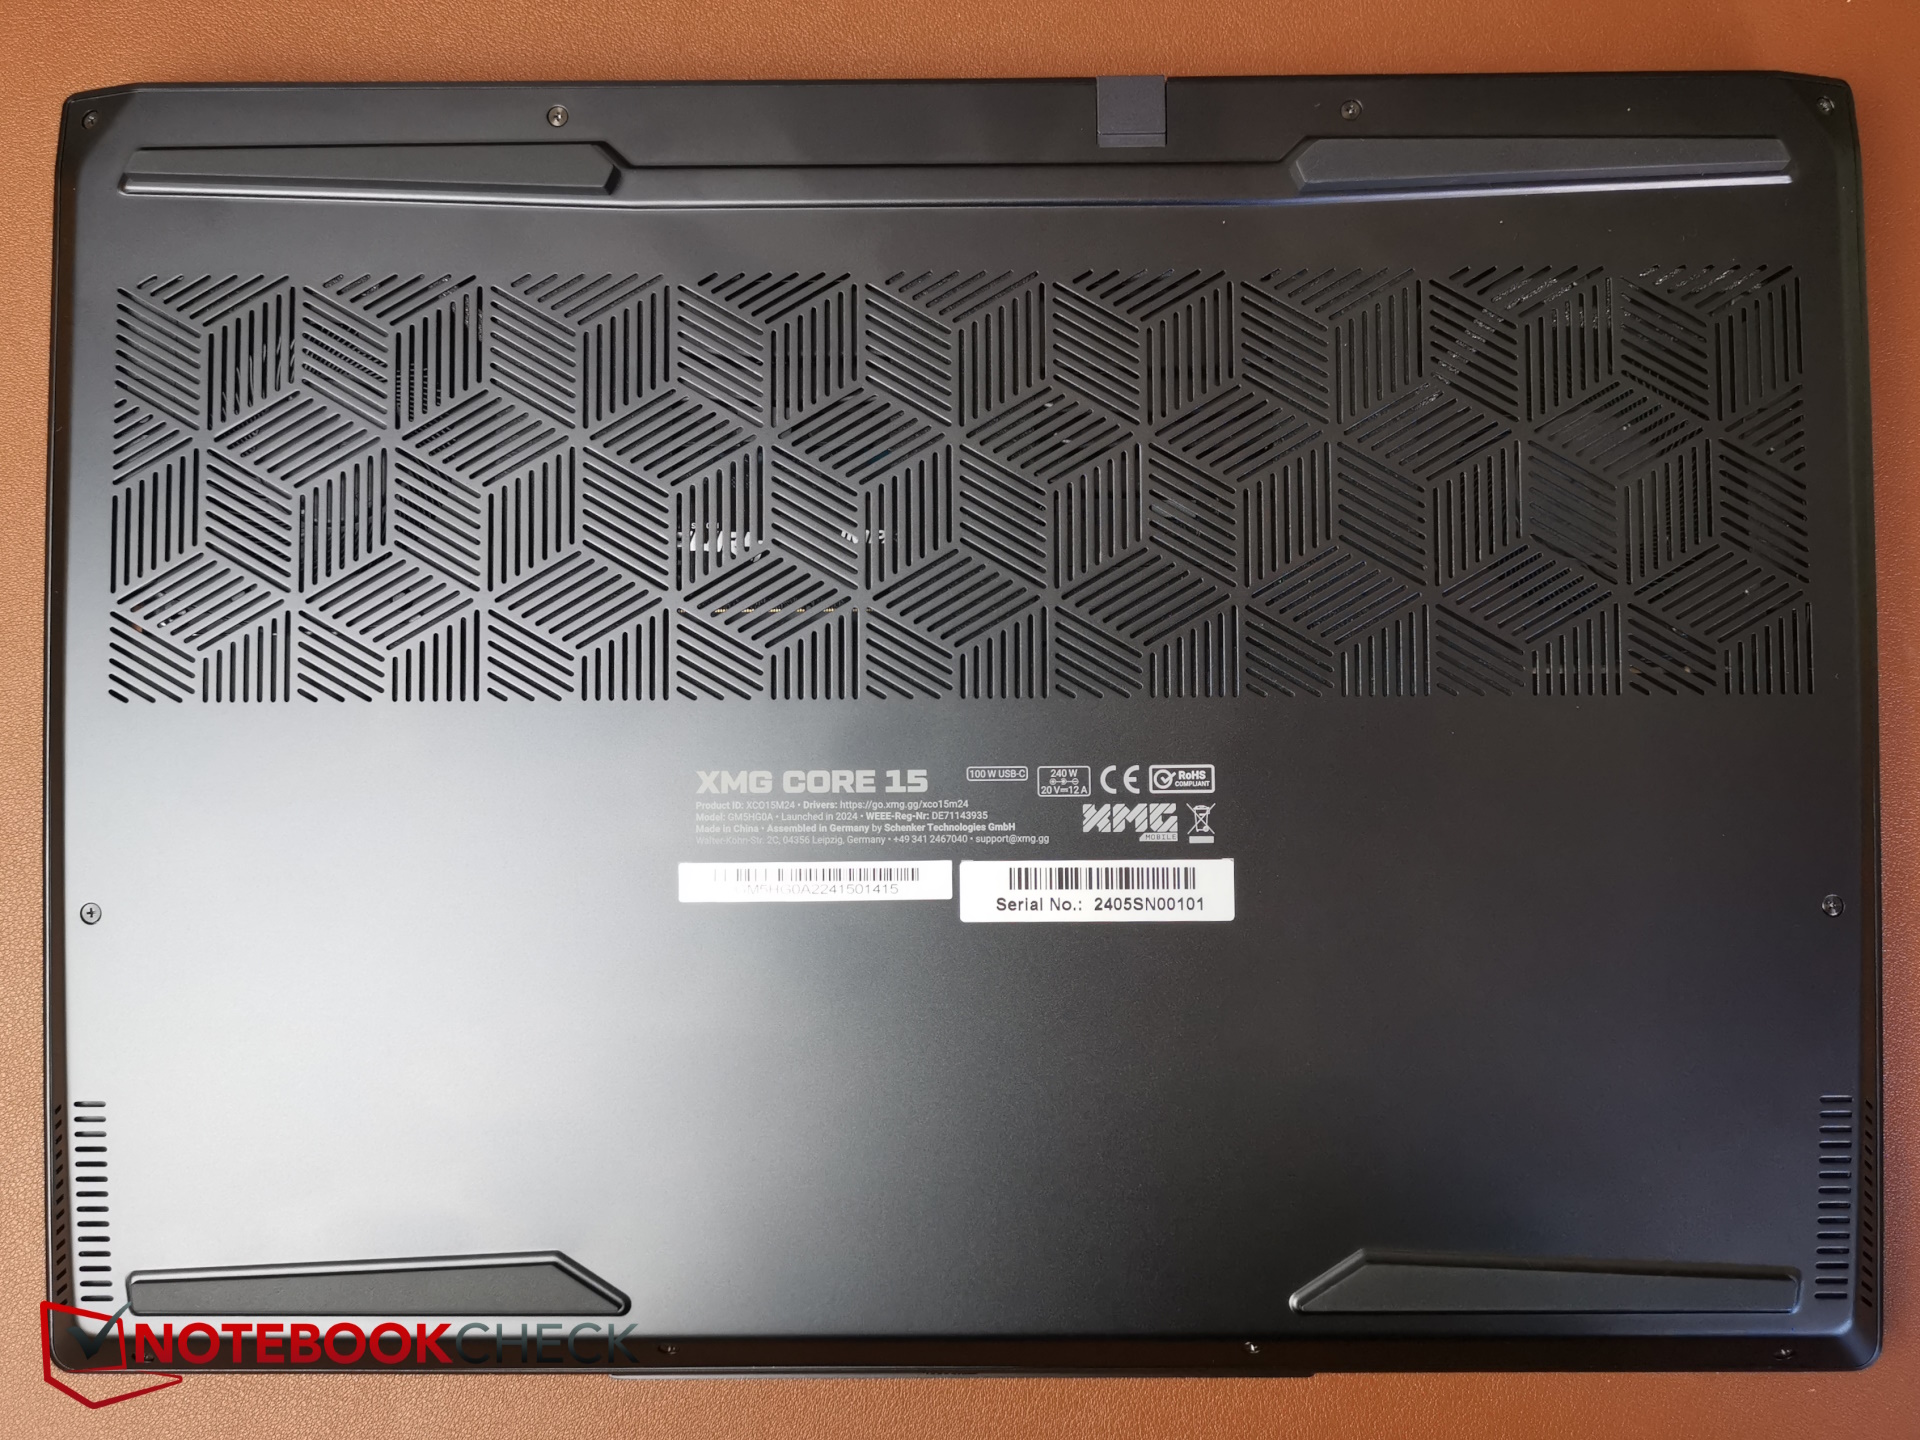
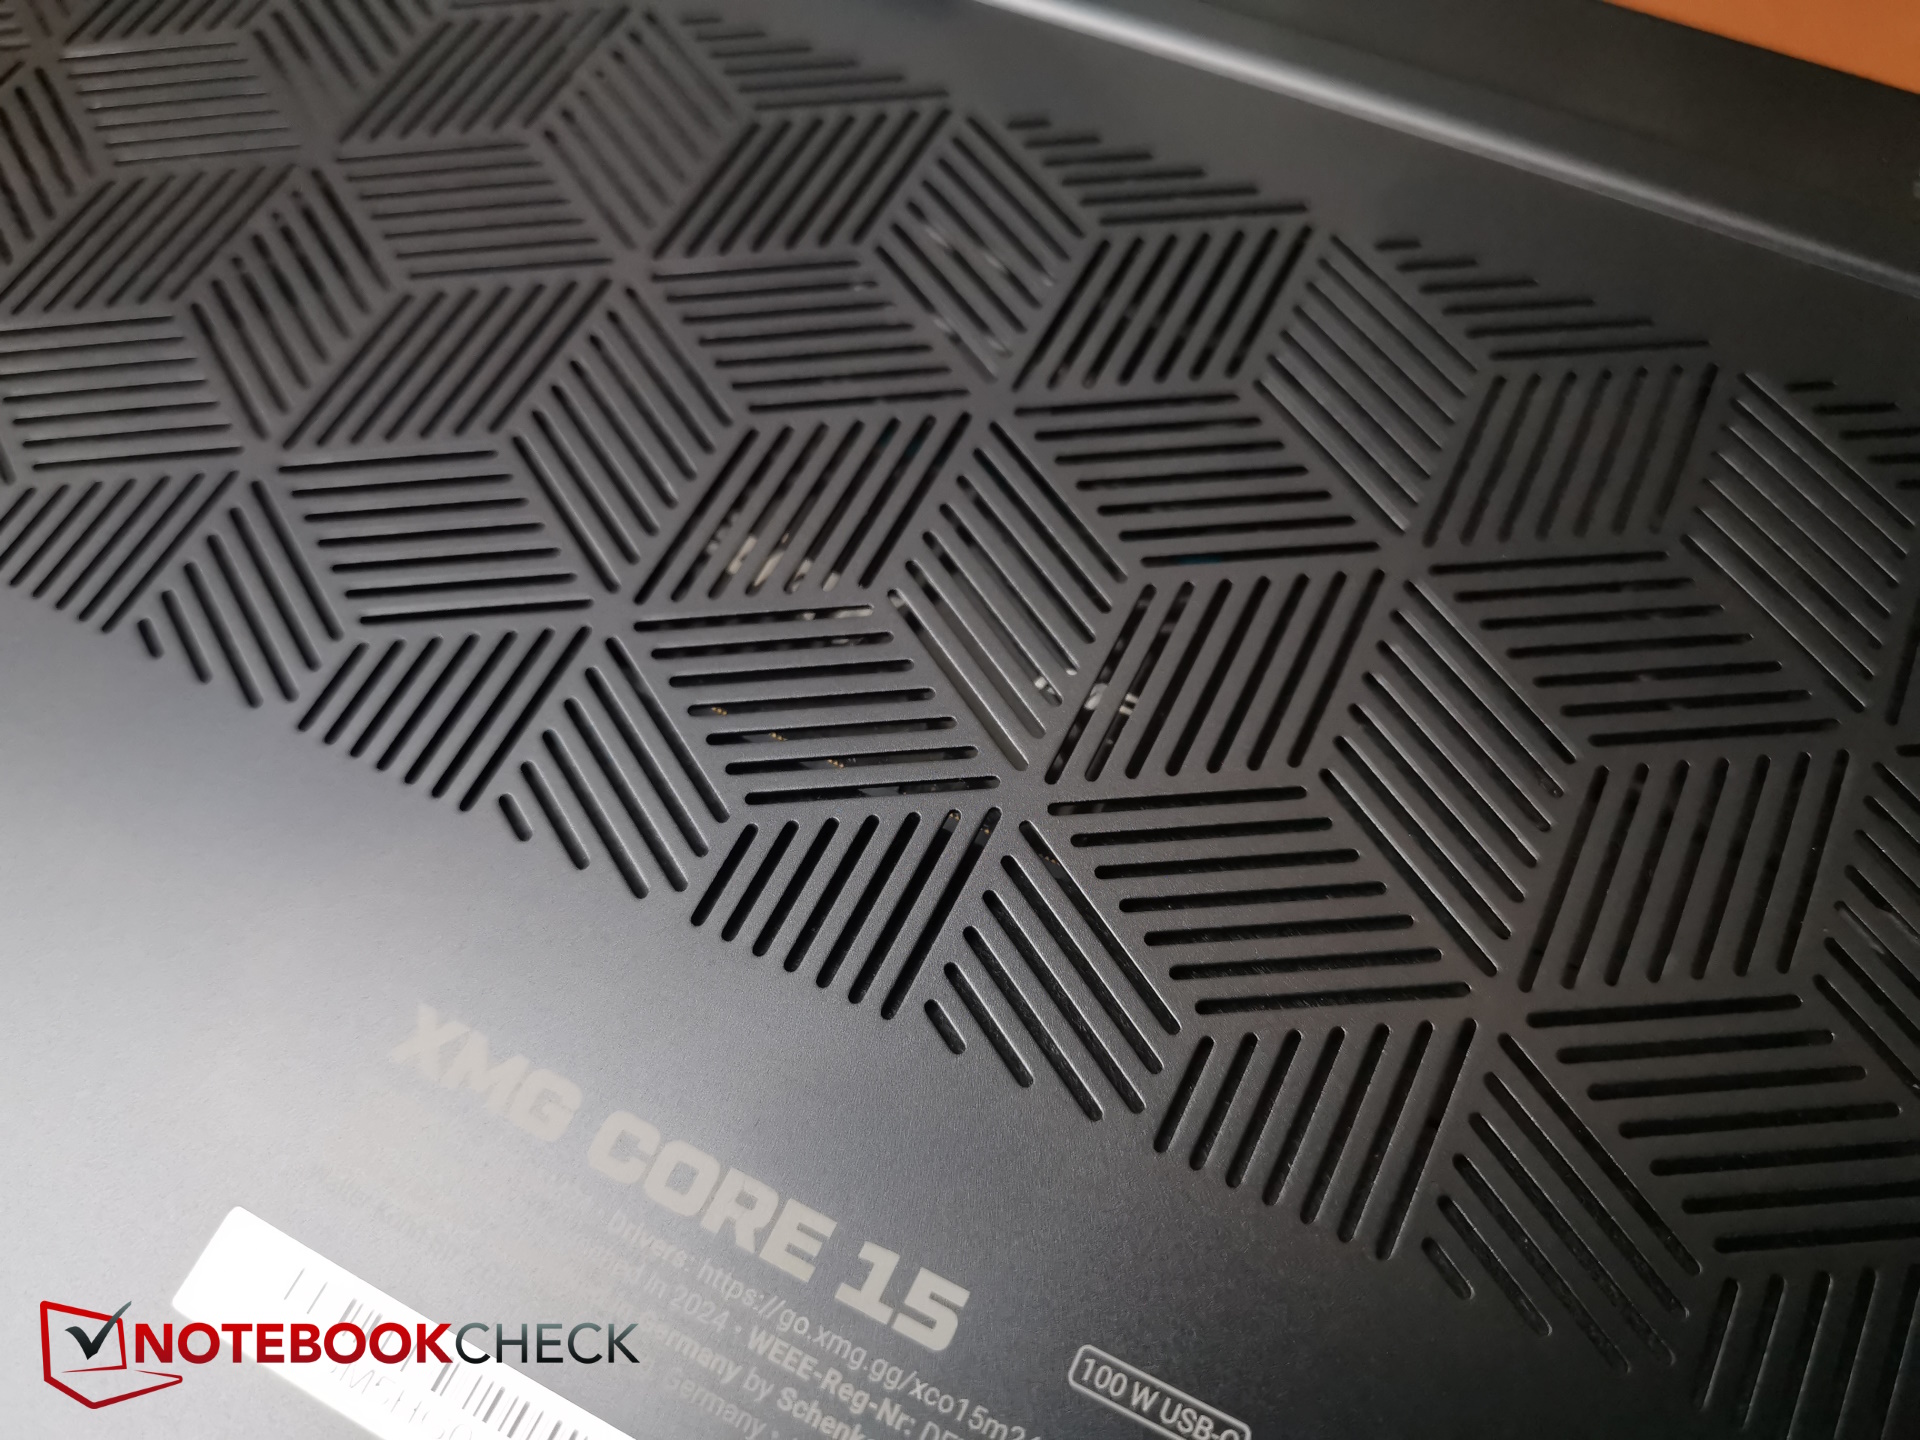
据申克称,目前的 Core 15 是一款略微缩小的 Fusion 15.尽管如此,Core 15 仍保留了光滑的金属外壳,给人以良好的外观和感觉。制造商称其为 "卧底游戏",因为铝制外壳也应该吸引创作者,而不一定是游戏笔记本电脑。
不过,酷睿 15 不仅缩小了尺寸,还改变了一些东西。例如,笔记本处理器由英特尔 Gen14 HX CPU 改为当前一代的 AMD Ryzen 处理器,这在一定程度上降低了价格,但绝非更差。
由于目前几乎不再有 15 英寸笔记本电脑配备当前的 CPU,因此我们将 15.3 英寸酷睿 15 与 16 英寸游戏和多媒体笔记本电脑进行比较,后者配备了 RTX 4060如 戴尔 G16和 联想Legion 5i 16 G9以及 惠普 Victus 16.此外,我们当然还与 Fusion 15 进行了比较,并对自去年的 申克 XMG Pro 15 E23.
请注意:我们的新评级系统是 V8,这意味着现在的分数更低了。在旧的 V7 评分系统 V7 下,Core 15 的得分在 88% 到 89% 之间。您可以 这里。
潜在的竞争对手比较
Rating | Date | Model | Weight | Height | Size | Resolution | Price |
|---|---|---|---|---|---|---|---|
| 83.7 % | 06 / 2024 | SCHENKER XMG Core 15 (M24) R7 8845HS, NVIDIA GeForce RTX 4060 Laptop GPU | 2.1 kg | 21.9 mm | 15.30" | 2560x1600 | |
| 89.1 % v7 (old) | 02 / 2024 | Lenovo Legion 5 16IRX G9 i7-14650HX, NVIDIA GeForce RTX 4060 Laptop GPU | 2.4 kg | 25.2 mm | 16.00" | 2560x1600 | |
| 84.3 % v7 (old) | 05 / 2024 | HP Victus 16 (2024) i7-14700HX, NVIDIA GeForce RTX 4060 Laptop GPU | 2.4 kg | 23.9 mm | 16.10" | 1920x1080 | |
| 85.5 % v7 (old) | 02 / 2024 | Dell G16, i7-13650HX, RTX 4060 i7-13650HX, NVIDIA GeForce RTX 4060 Laptop GPU | 2.8 kg | 25.65 mm | 16.00" | 2560x1600 | |
| 88.9 % v7 (old) | 05 / 2024 | SCHENKER XMG Fusion 15 (Early 24) i9-14900HX, NVIDIA GeForce RTX 4070 Laptop GPU | 2.1 kg | 21.9 mm | 15.30" | 2560x1600 | |
| 86.2 % v7 (old) | 07 / 2023 | SCHENKER XMG Pro 15 (E23) i9-13900HX, NVIDIA GeForce RTX 4060 Laptop GPU | 2.4 kg | 24.9 mm | 15.60" | 2560x1440 |
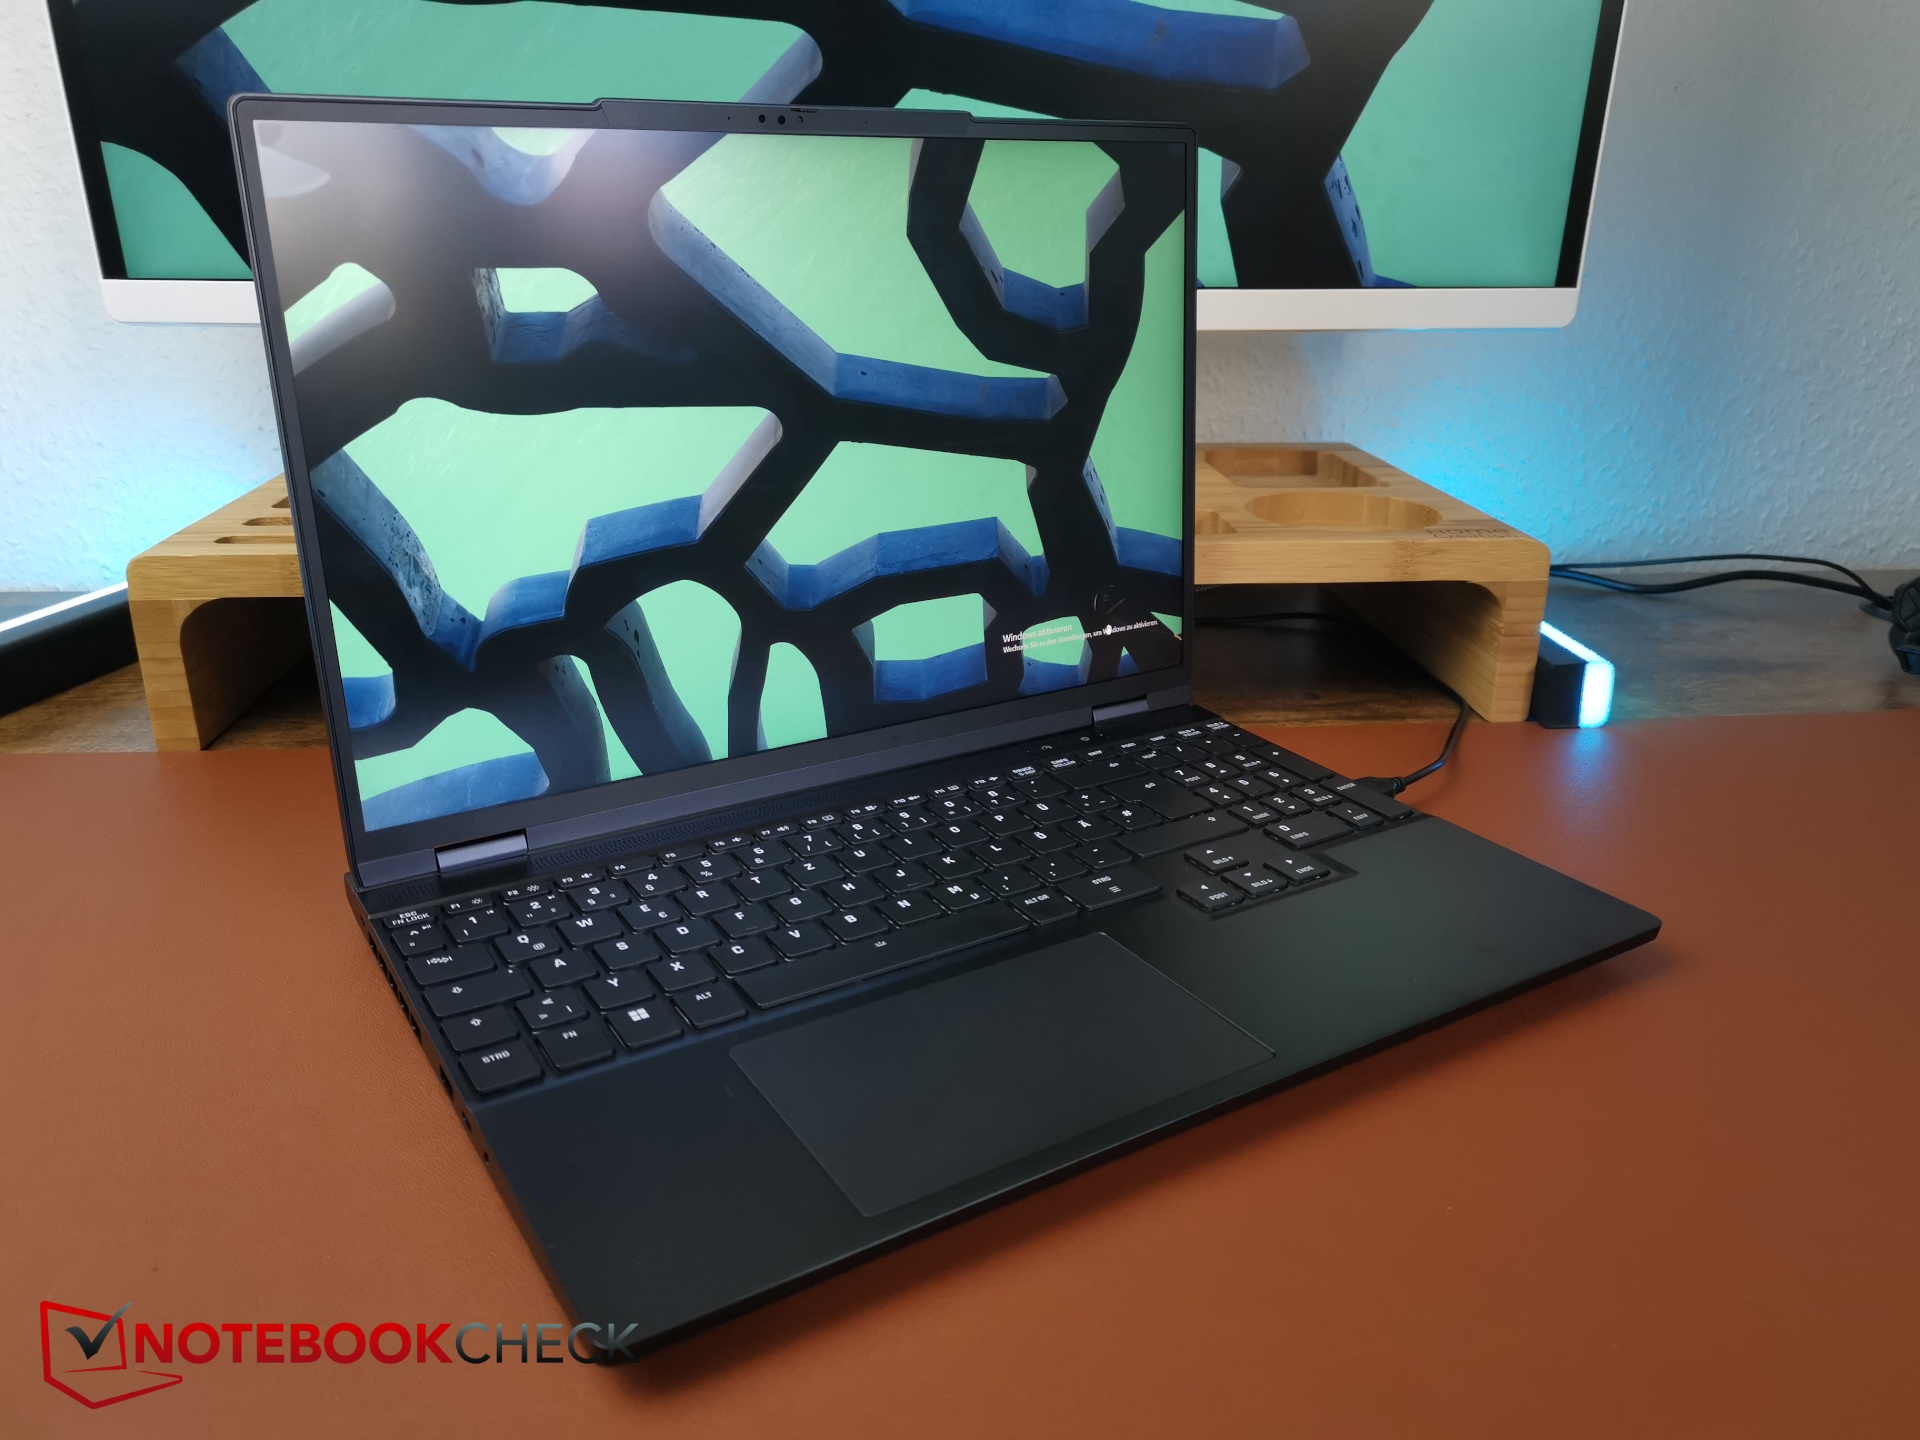
尺寸比较
目前,采用当前 CPU 的 15 英寸游戏机似乎已几乎绝迹,而酷睿 15 的独特之处就在于其不同寻常的 15.3 英寸规格。制造商认为,目前的 16 英寸笔记本电脑几乎没有更大的,这意味着你现在可以在几乎相同尺寸的机箱中获得更大的显示屏。
然而,在酷睿 15 上,你可以看到一些 16 英寸的竞争对手明显更大了。除此之外,它们还更厚更重。尽管竞争对手使用了更多的塑料,但酷睿 15 的厚度和重量却更胜一筹。在这一点上,Core 15 为移动性加分。
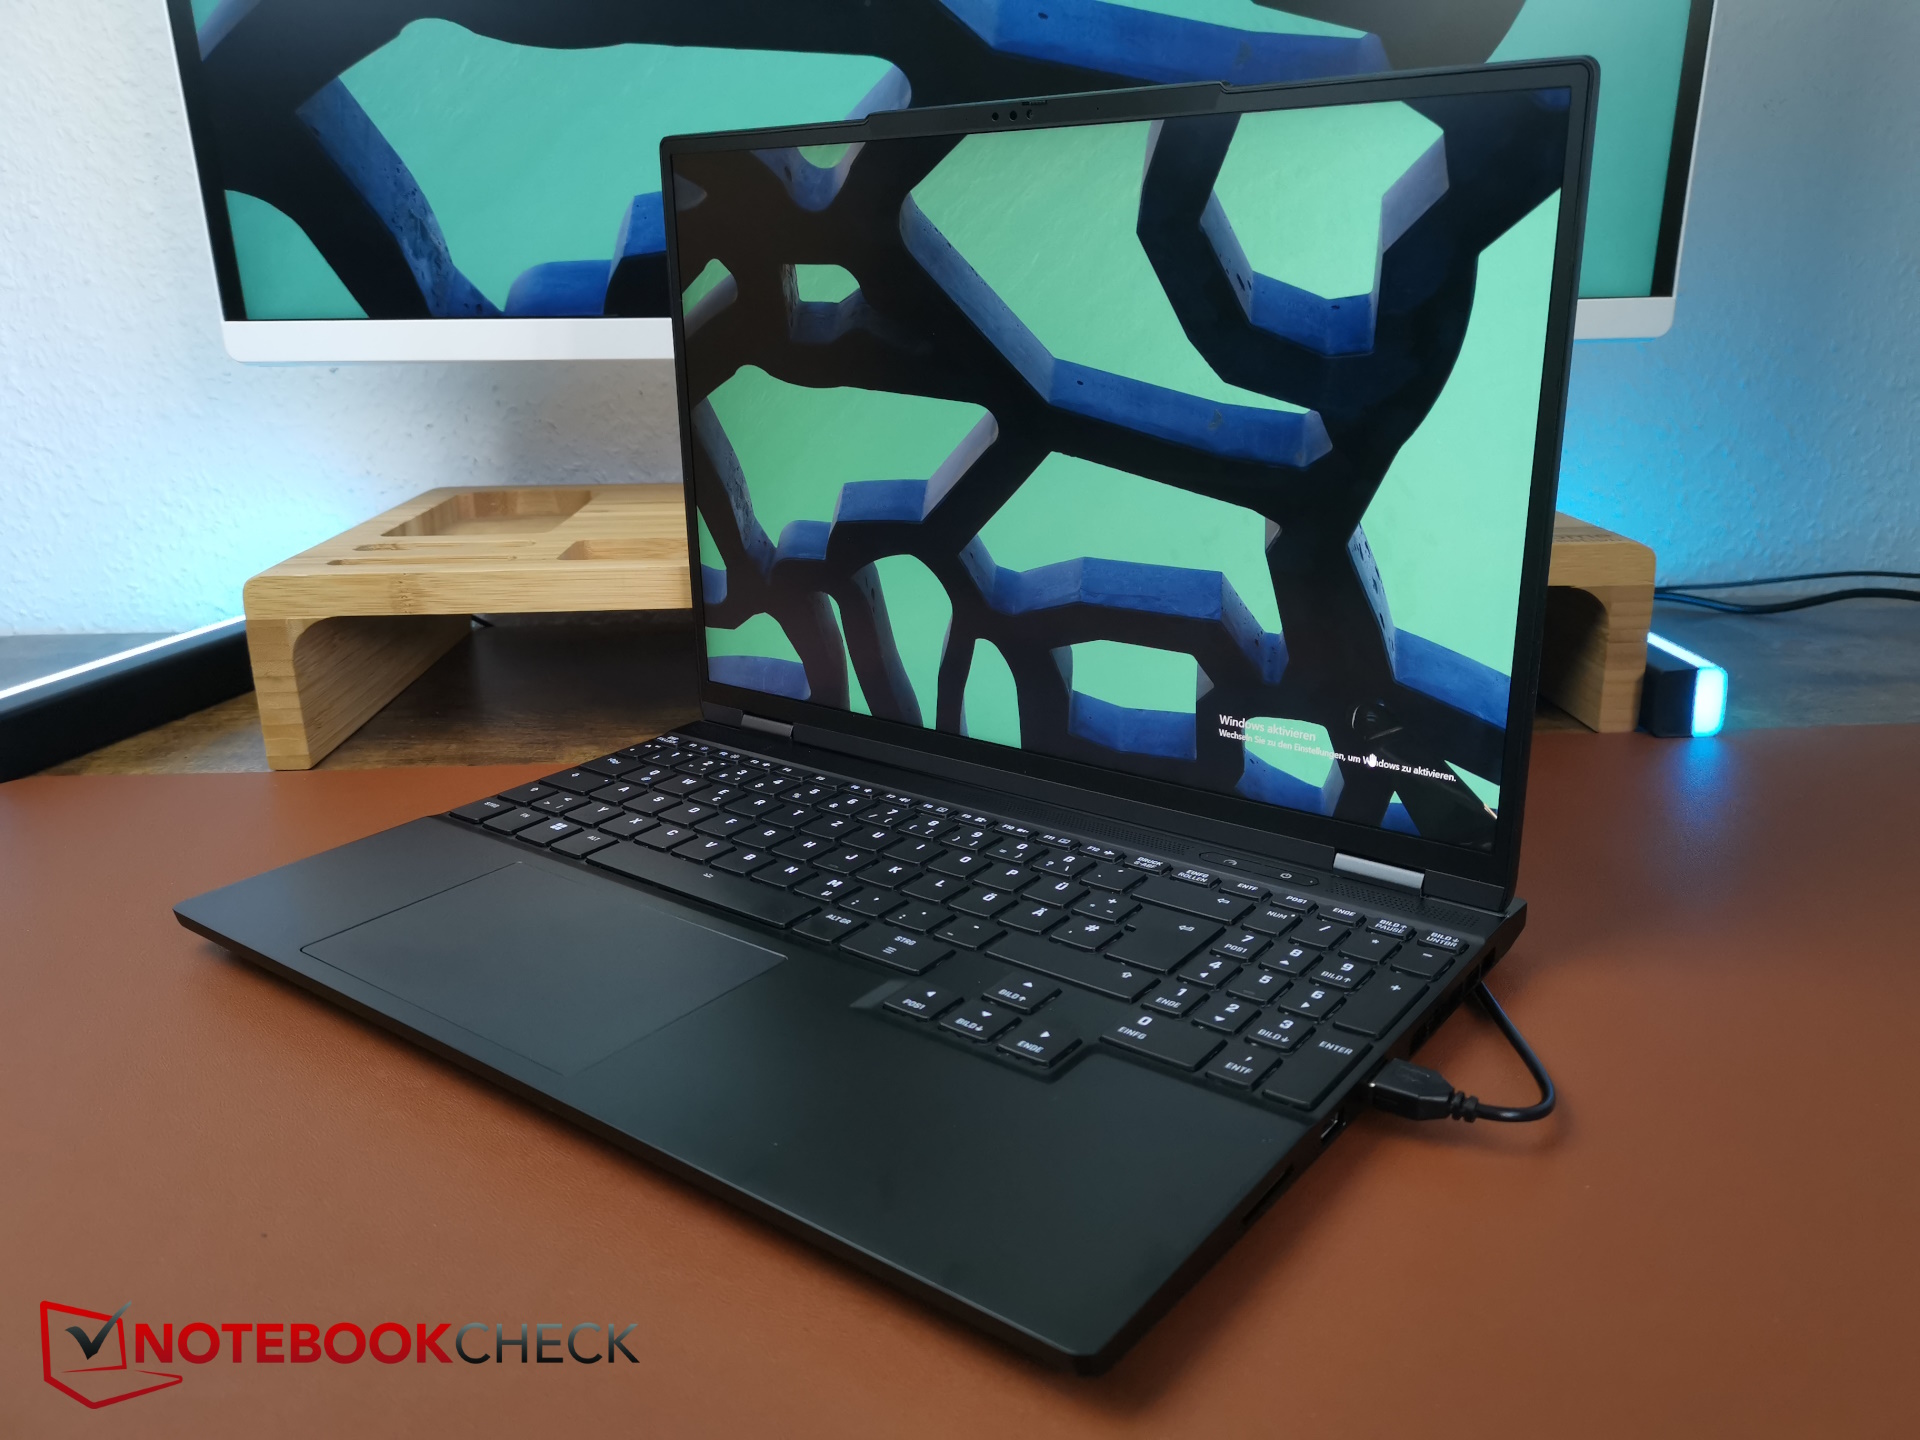
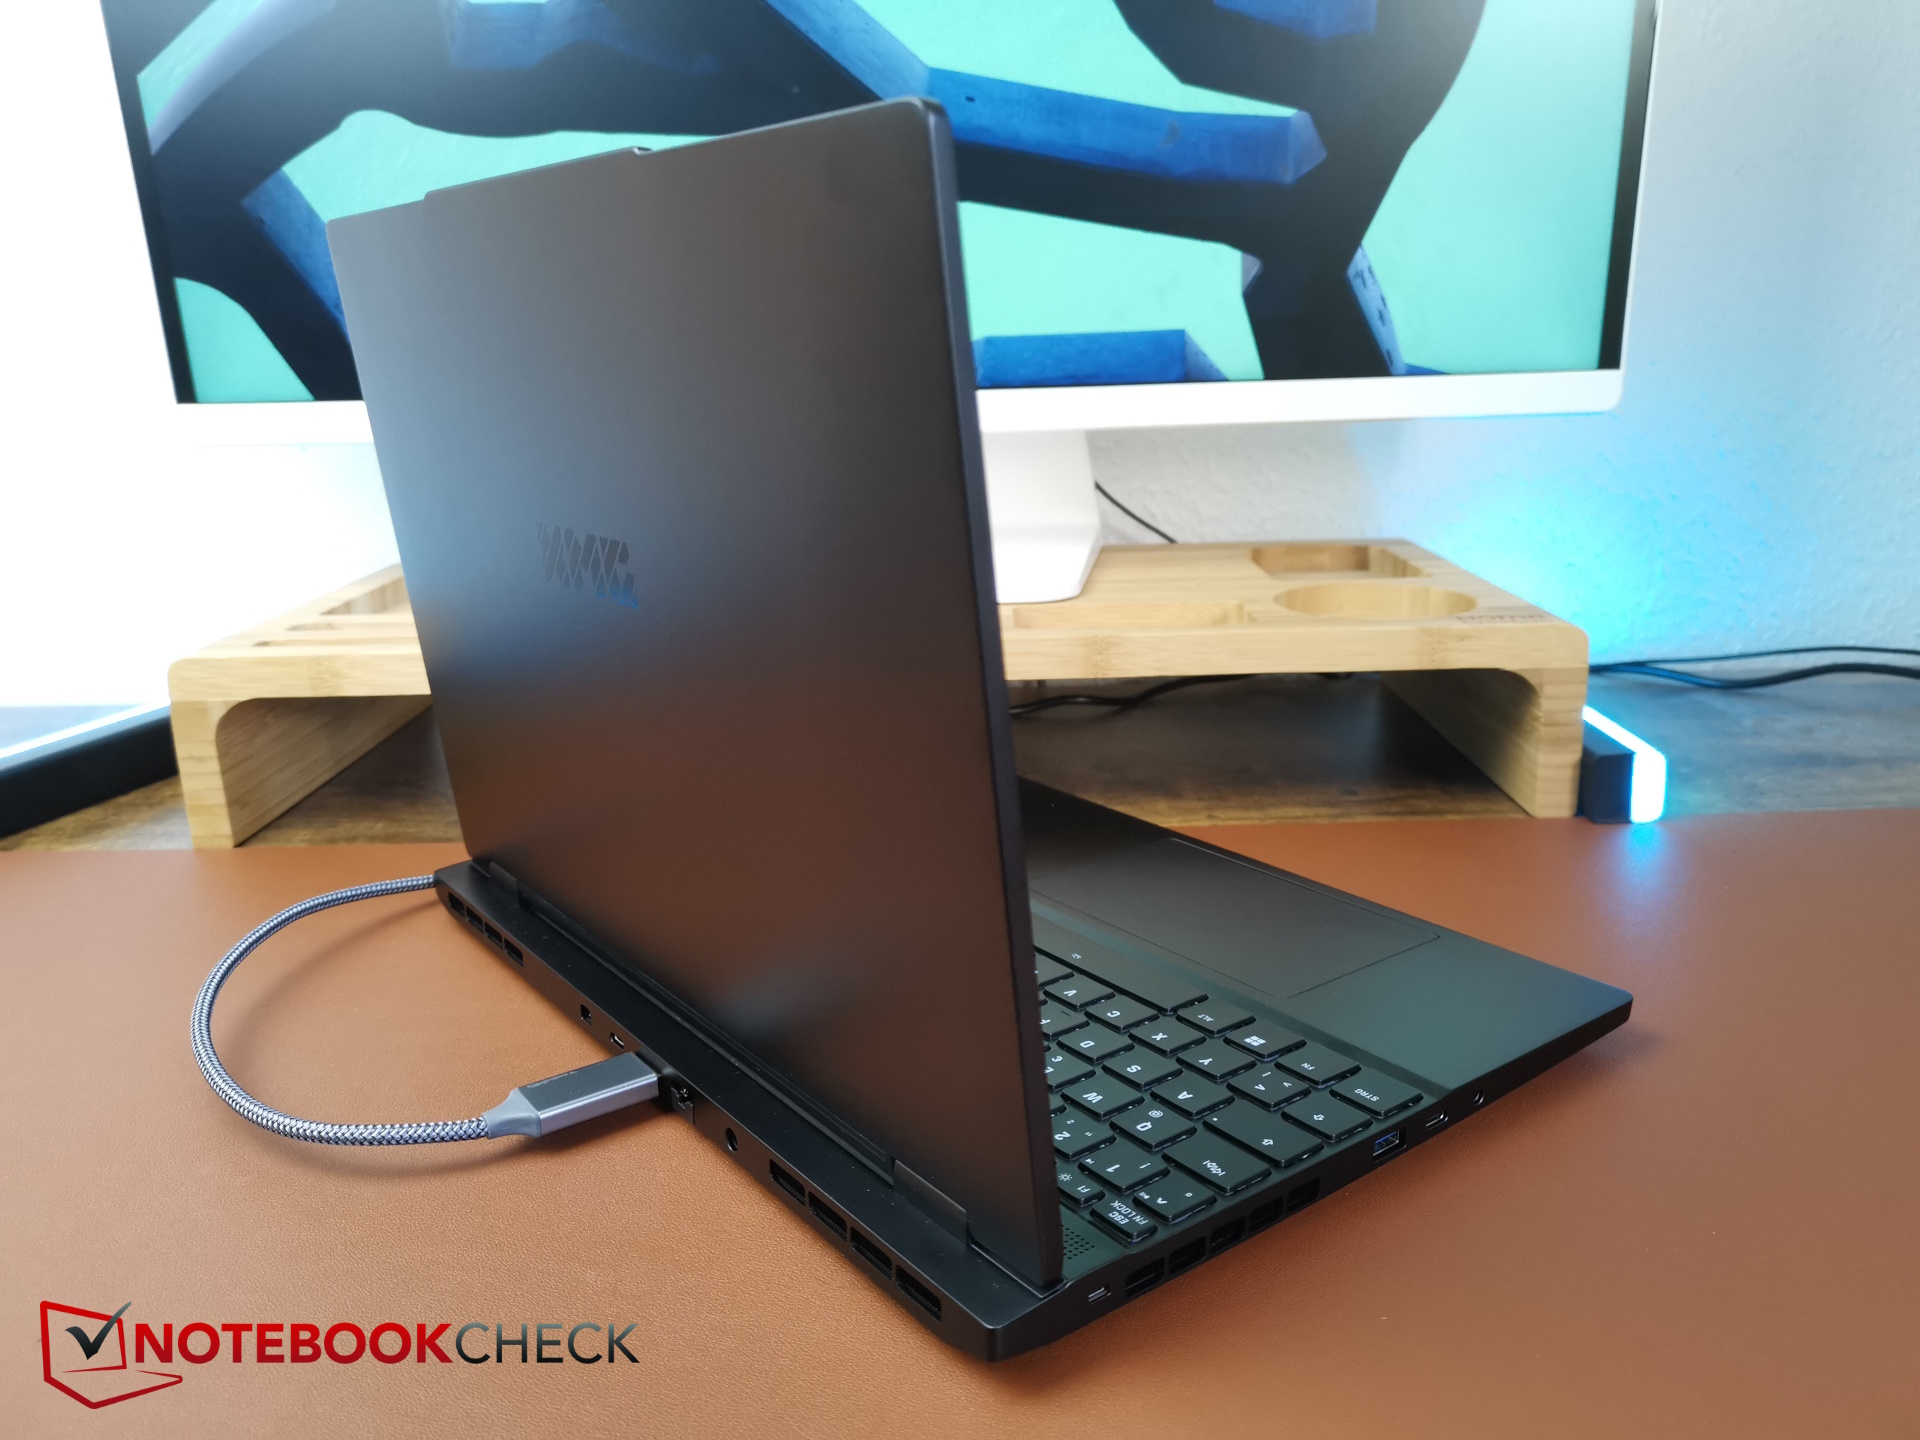
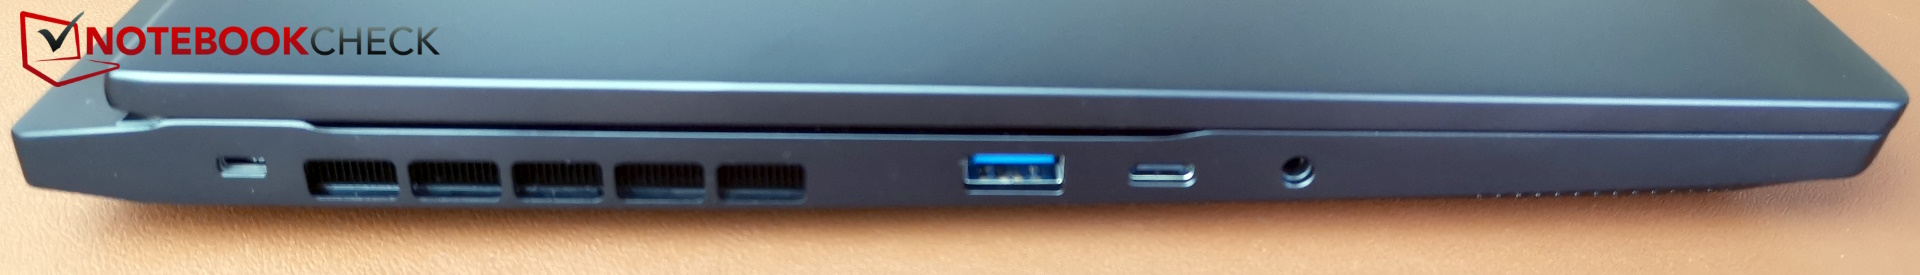
港口
与配备英特尔 CPU 的 Fusion 不同,AMD Core 没有配备 Thunderbolt 4 和 USB 4。取而代之的是 USB-C 3.2 Gen 2,尽管它提供高达 100 W(20V,5 A)的功率传输。
与 Fusion 相比,Core 还有一个额外的优势:与 Fusion 相比,Core 还拥有 Fusion 所没有的专用 mini DisplayPort。
一个有趣的附带说明:2023 年初,我们最近评测过的 最近评测的酷睿 15仍配备了用于外部散热的 XMG Oasis 水接口。现在,在更新、更轻薄的酷睿 15 上已经没有这些接口了,看来 XMG 已经放弃了对这一生产系列的尝试。
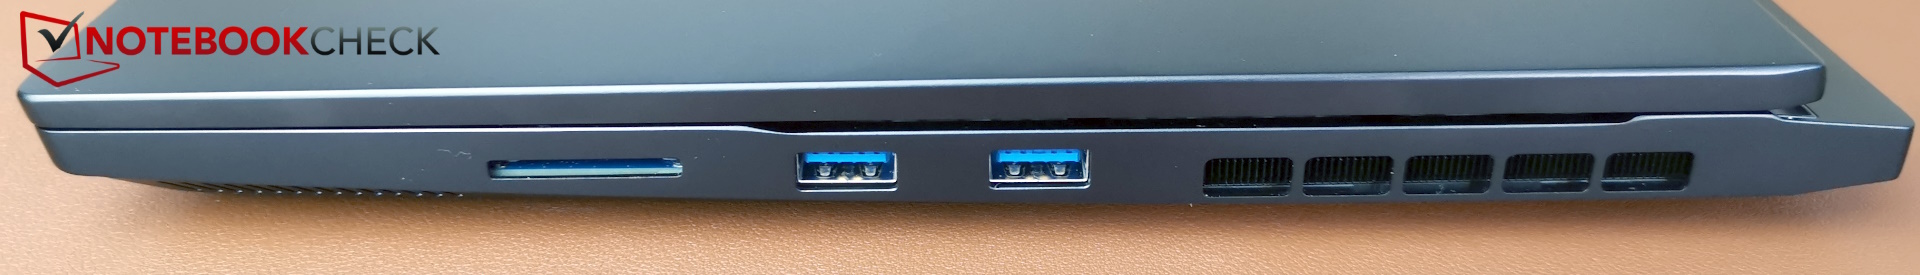
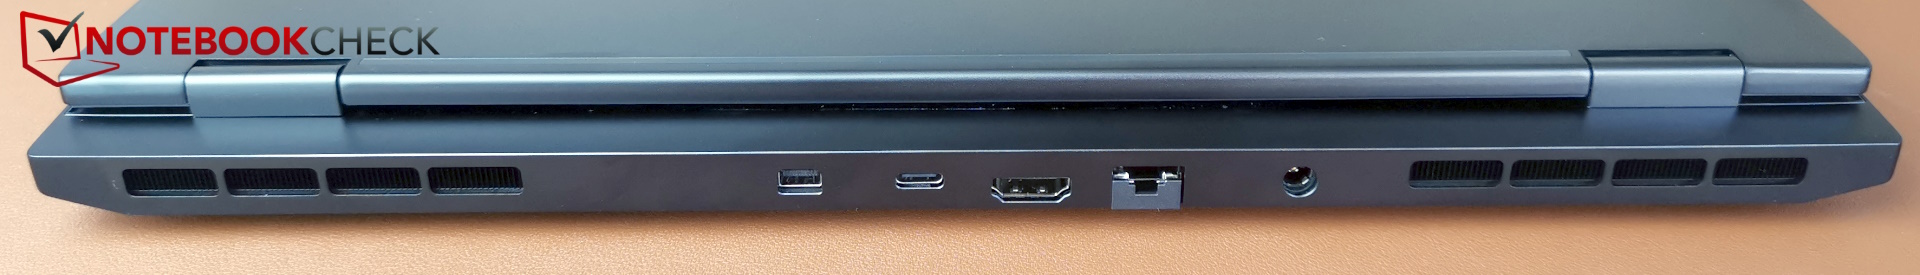
SD 读卡器
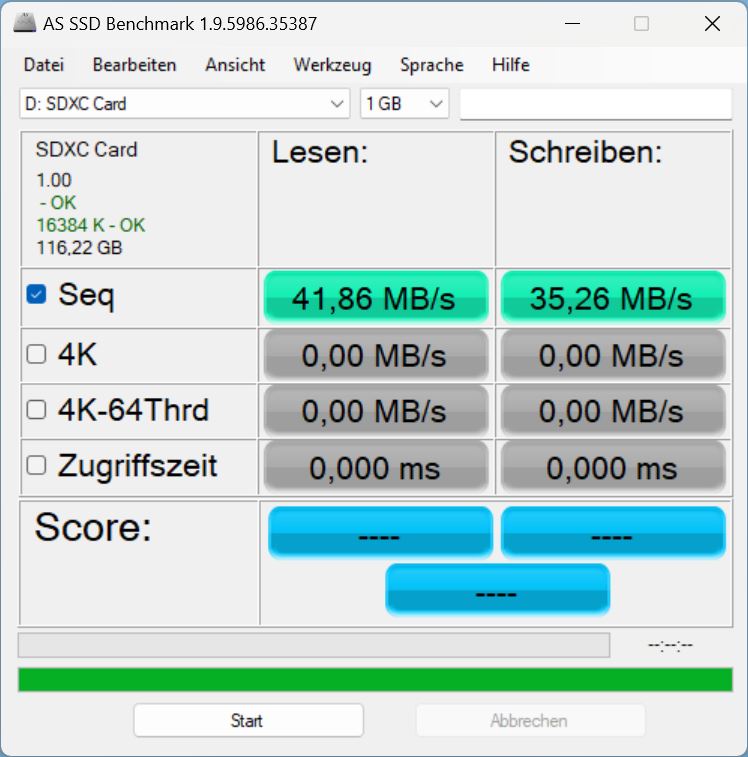
SD 读卡器可以读取全尺寸的卡,但没有锁定装置,这意味着卡会伸出来。
遗憾的是,Fusion 15 的读卡器性能本来就很一般,现在又降低了一半,这意味着酷睿 15 属于同类产品中性能最慢的几款。
| SD Card Reader | |
| average JPG Copy Test (av. of 3 runs) | |
| Average of class Gaming (19 - 197.3, n=68, last 2 years) | |
| SCHENKER XMG Pro 15 (E23) | |
| SCHENKER XMG Fusion 15 (Early 24) (AV PRO microSD 128 GB V60) | |
| SCHENKER XMG Core 15 (M24) | |
| Lenovo Legion 5 16IRX G9 | |
| maximum AS SSD Seq Read Test (1GB) | |
| Average of class Gaming (25.8 - 263, n=67, last 2 years) | |
| SCHENKER XMG Pro 15 (E23) | |
| SCHENKER XMG Fusion 15 (Early 24) (AV PRO microSD 128 GB V60) | |
| SCHENKER XMG Core 15 (M24) | |
| Lenovo Legion 5 16IRX G9 | |
交流
制造商在收到笔记本后告诉我们,我们的评测机型不小心安装了英特尔 AX211 WiF,就像 Fusion 15 一样。事实上,酷睿 15 并非如此。
通常情况下,英特尔 AX200 是酷睿 15 的标准配置,只需额外支付 15 美元,就能获得配备 Wi-Fi 6E 的 AMD Wi-Fi 6E RZ616。不过,我们目前还无法测试其速度。

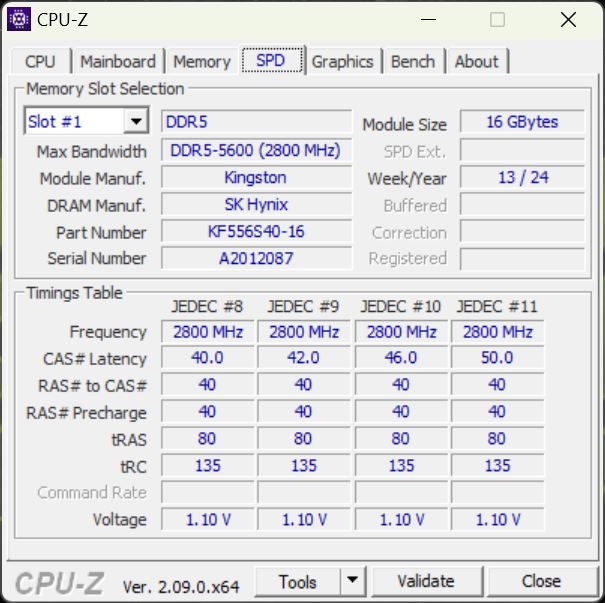
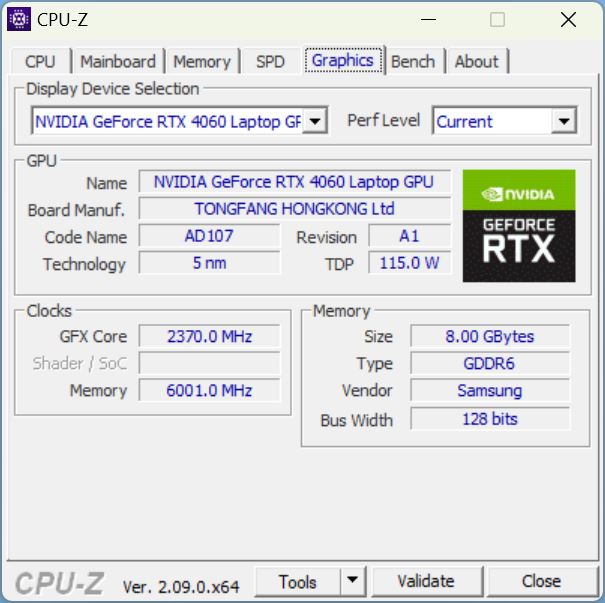
 NVIDIA GeForce RTX 4060 Laptop GPU, R7 8845HS, Samsung 990 Pro 1 TB")
 NVIDIA GeForce RTX 4060 Laptop GPU, R7 8845HS, Samsung 990 Pro 1 TB")
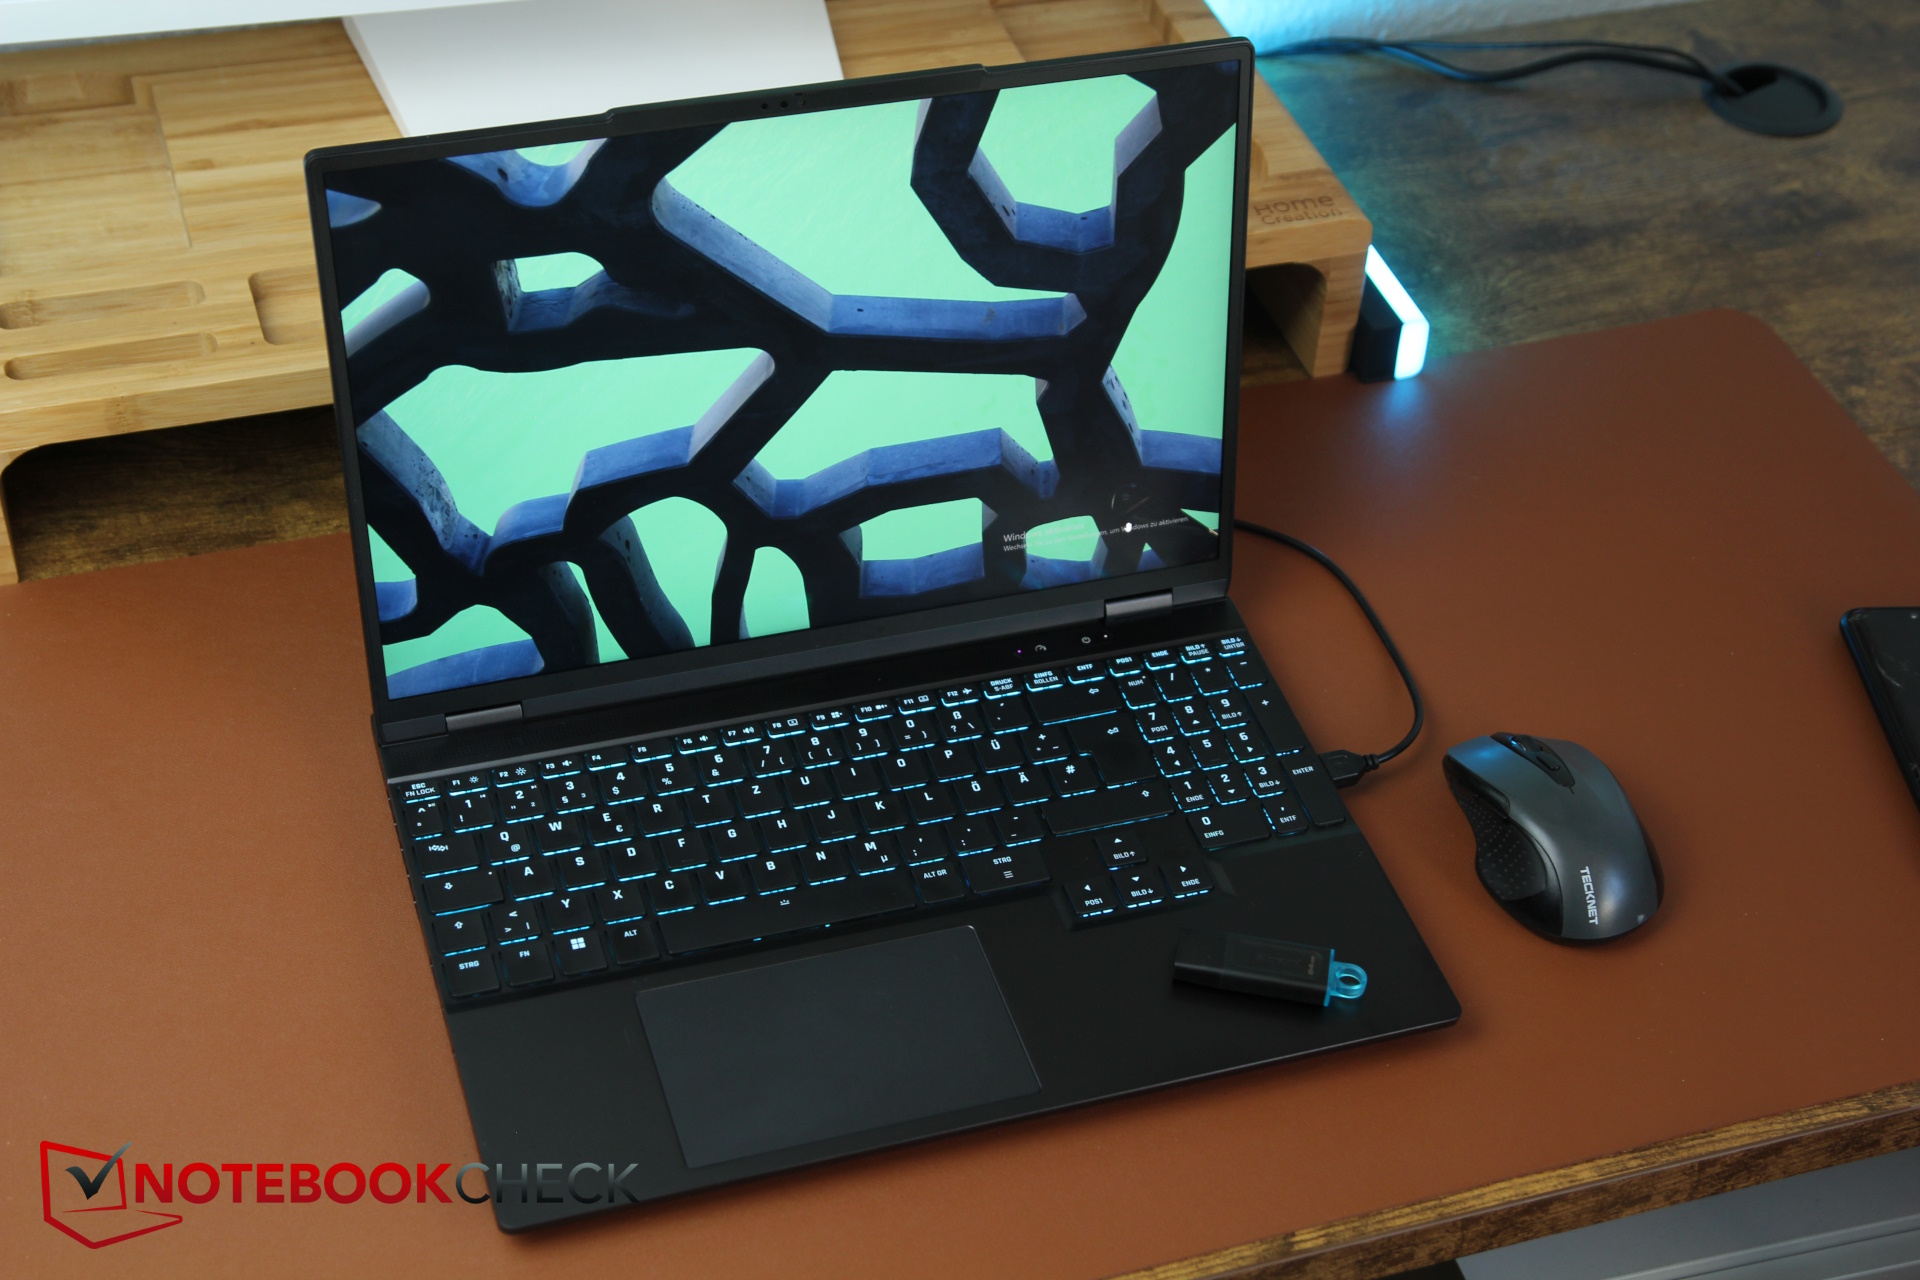
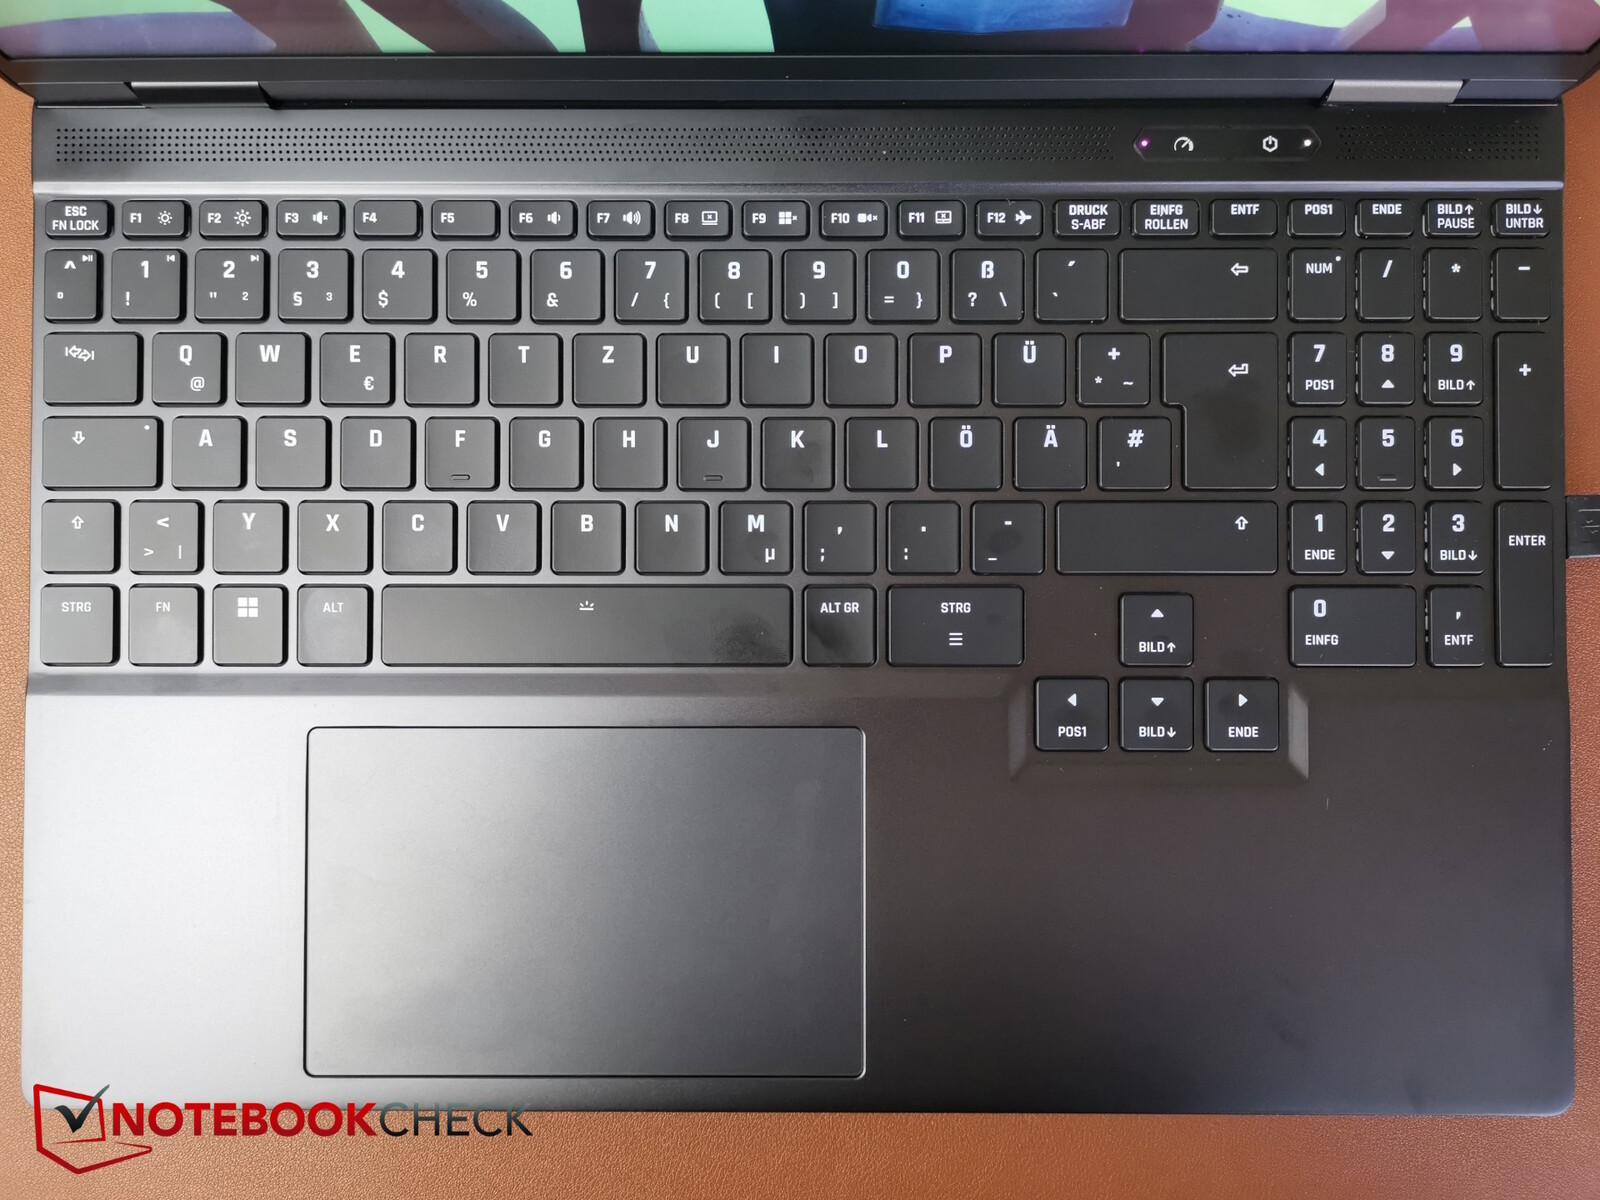
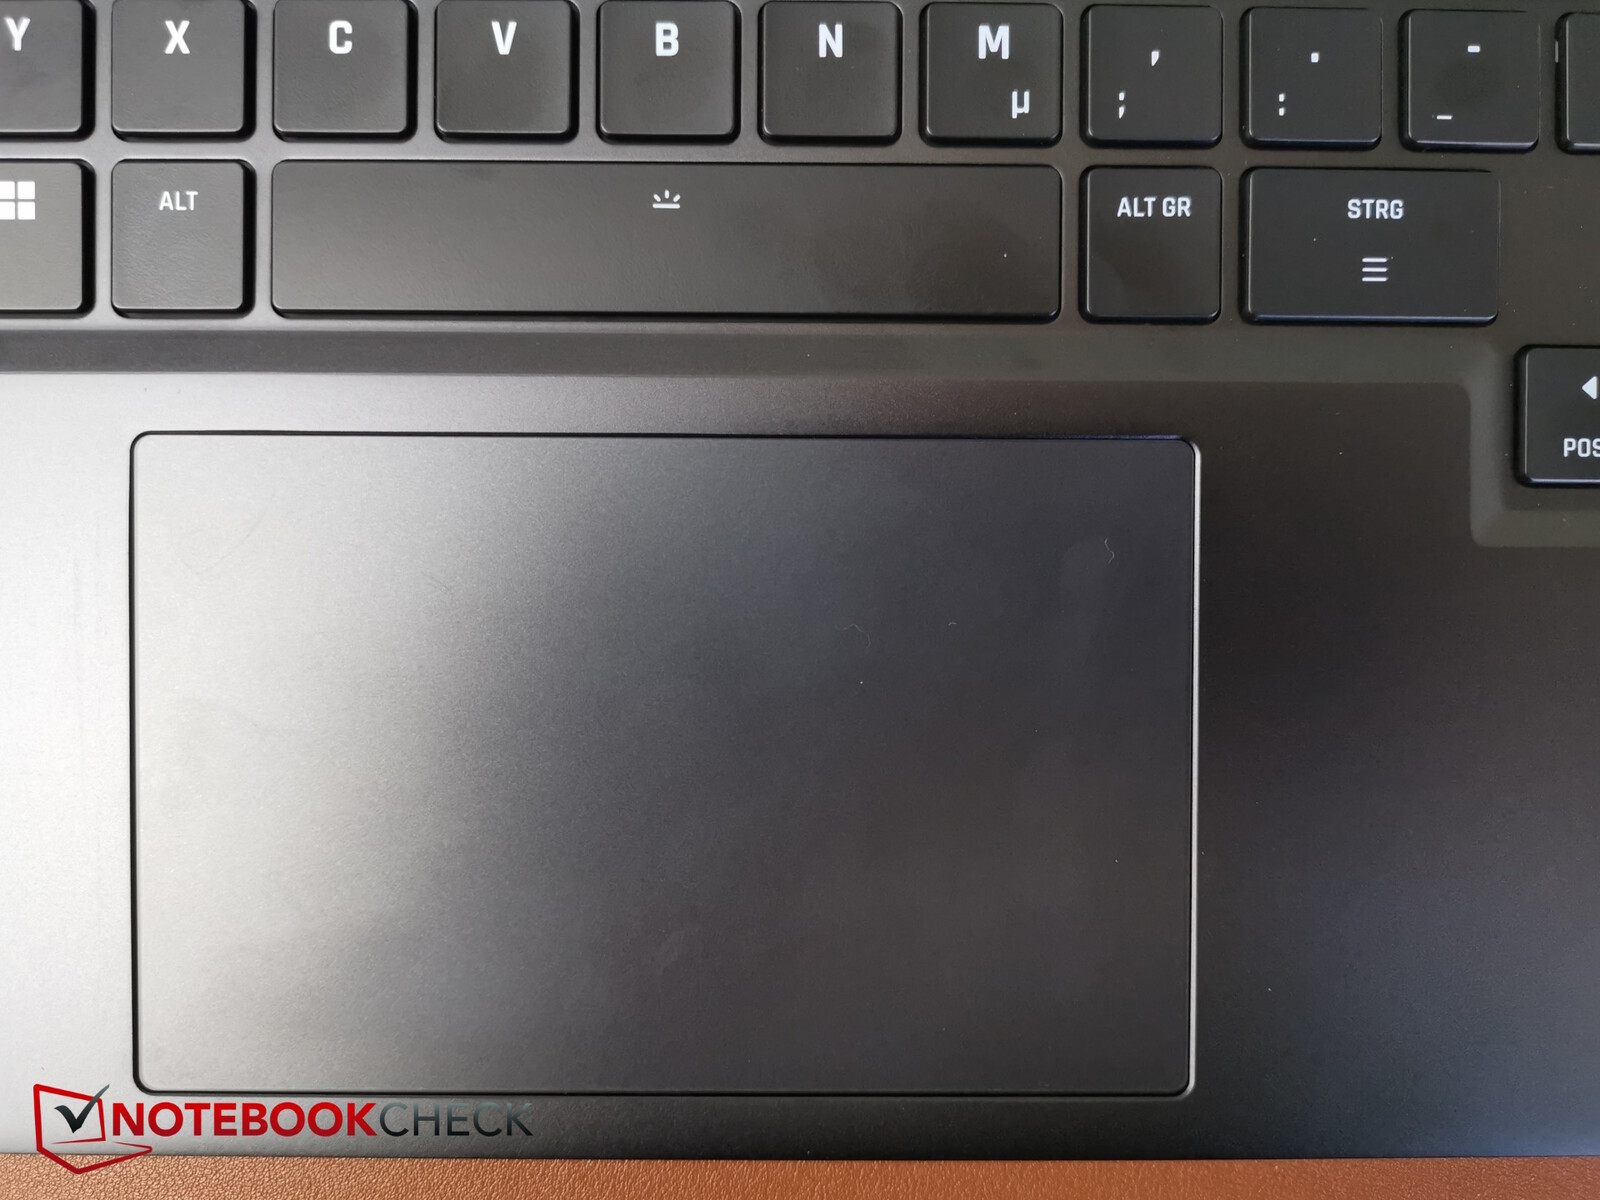
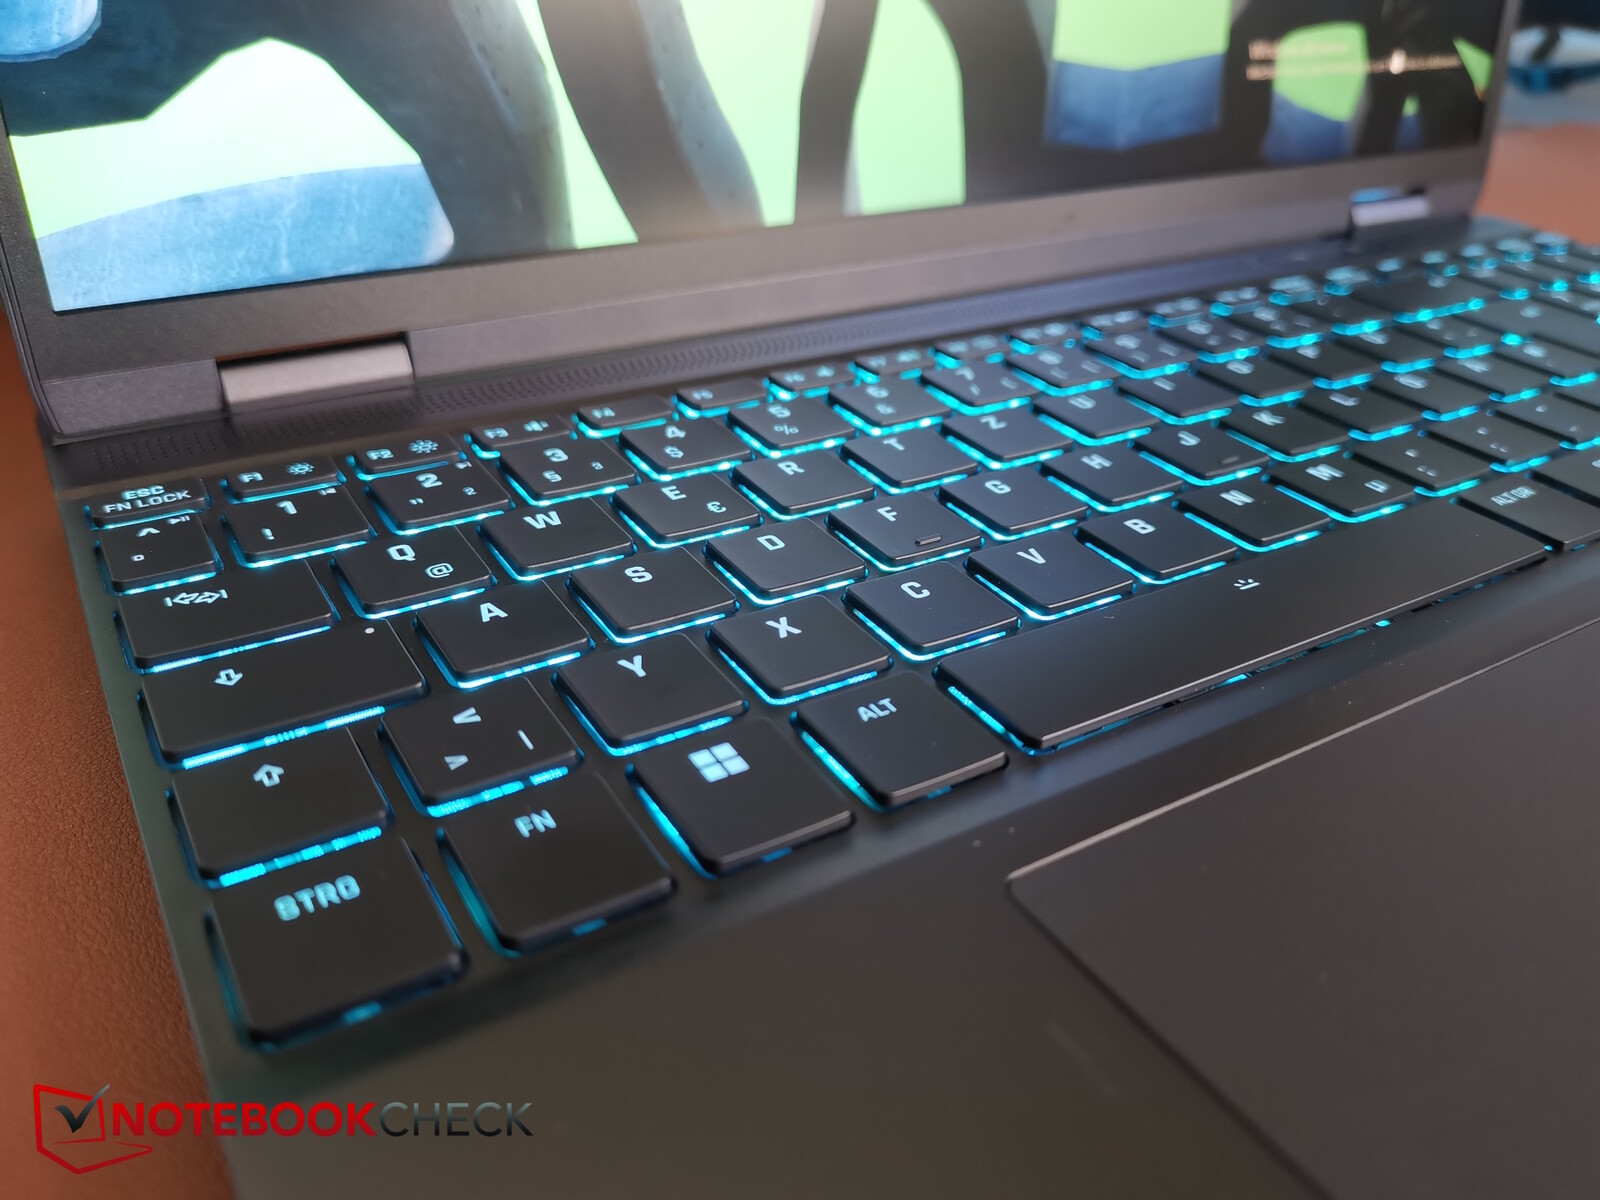
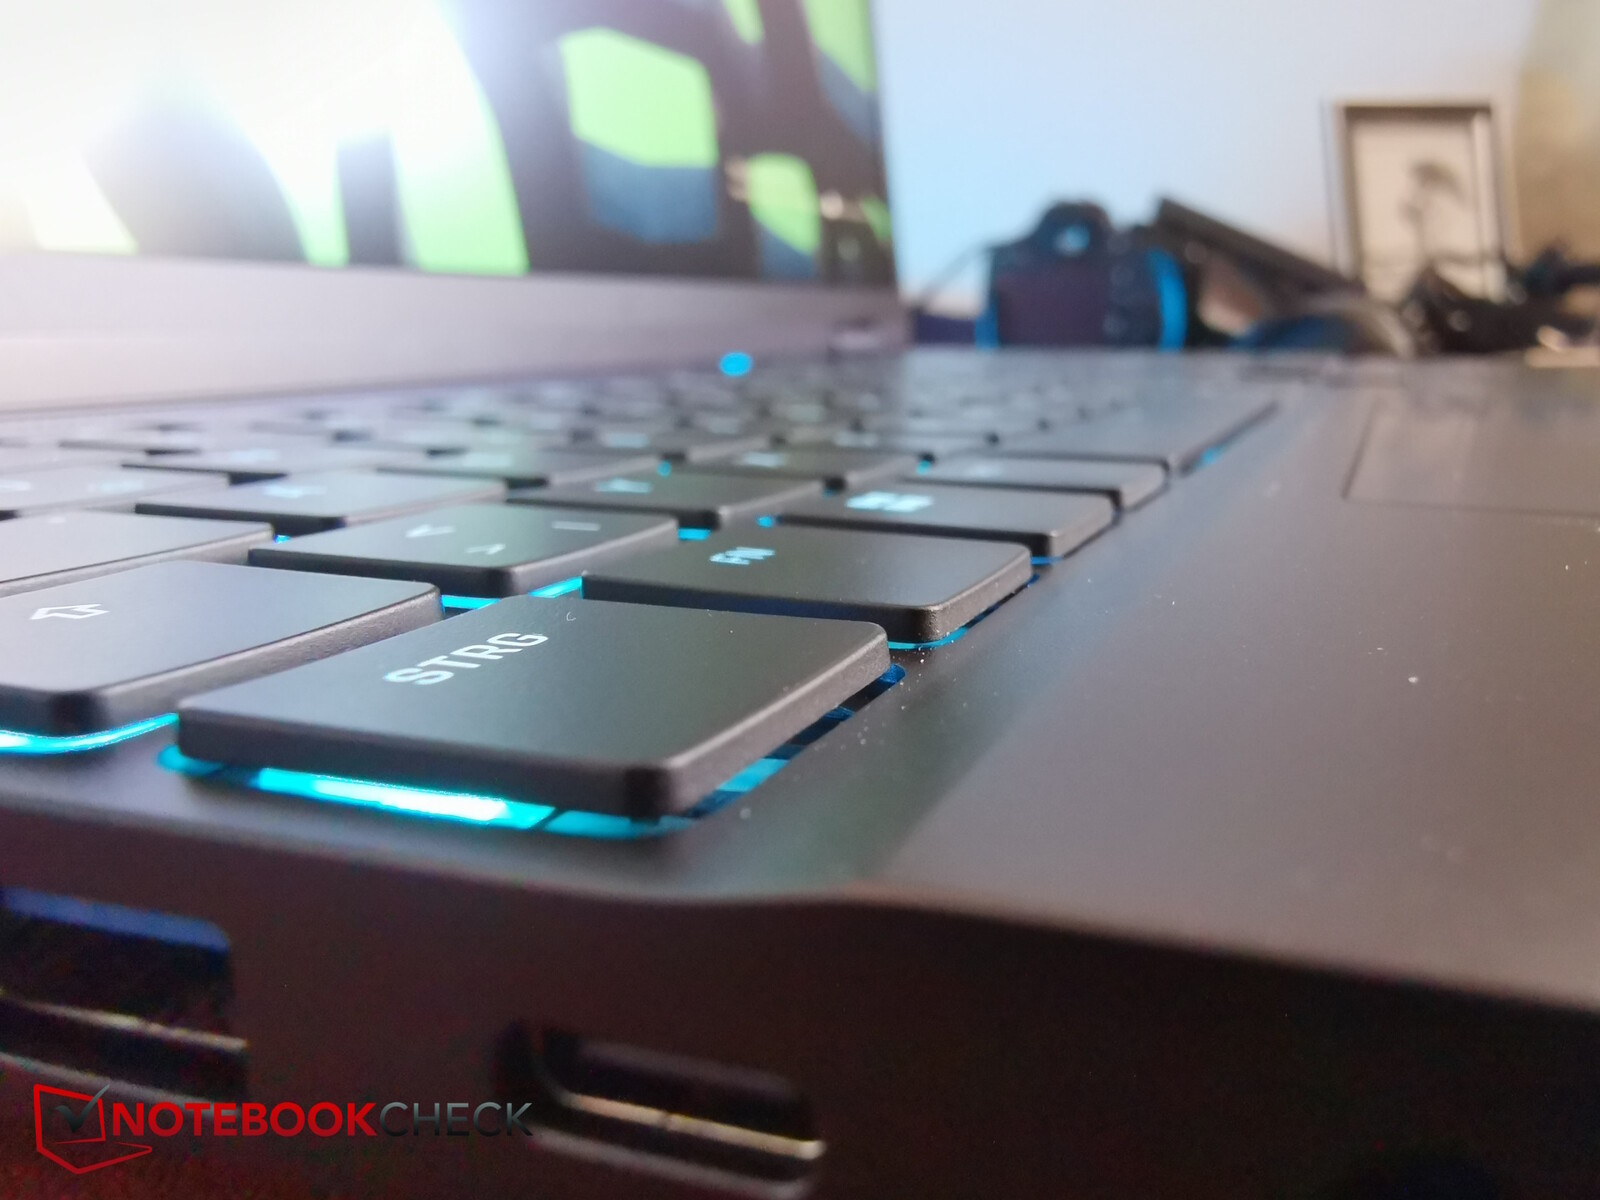
输入设备 - 最大限度地利用空间
与 Fusion 15 不同,Core 15 没有单独的 RGB 键照明。相反,它只有一个照明区。虽然没有那么多可选的 LED 设置,但一切仍然清晰可见。
键盘还缺少 N 键翻转和防鬼键功能,至少根据数据表是这样。不过,您可以通过键盘上的按键切换性能配置文件。
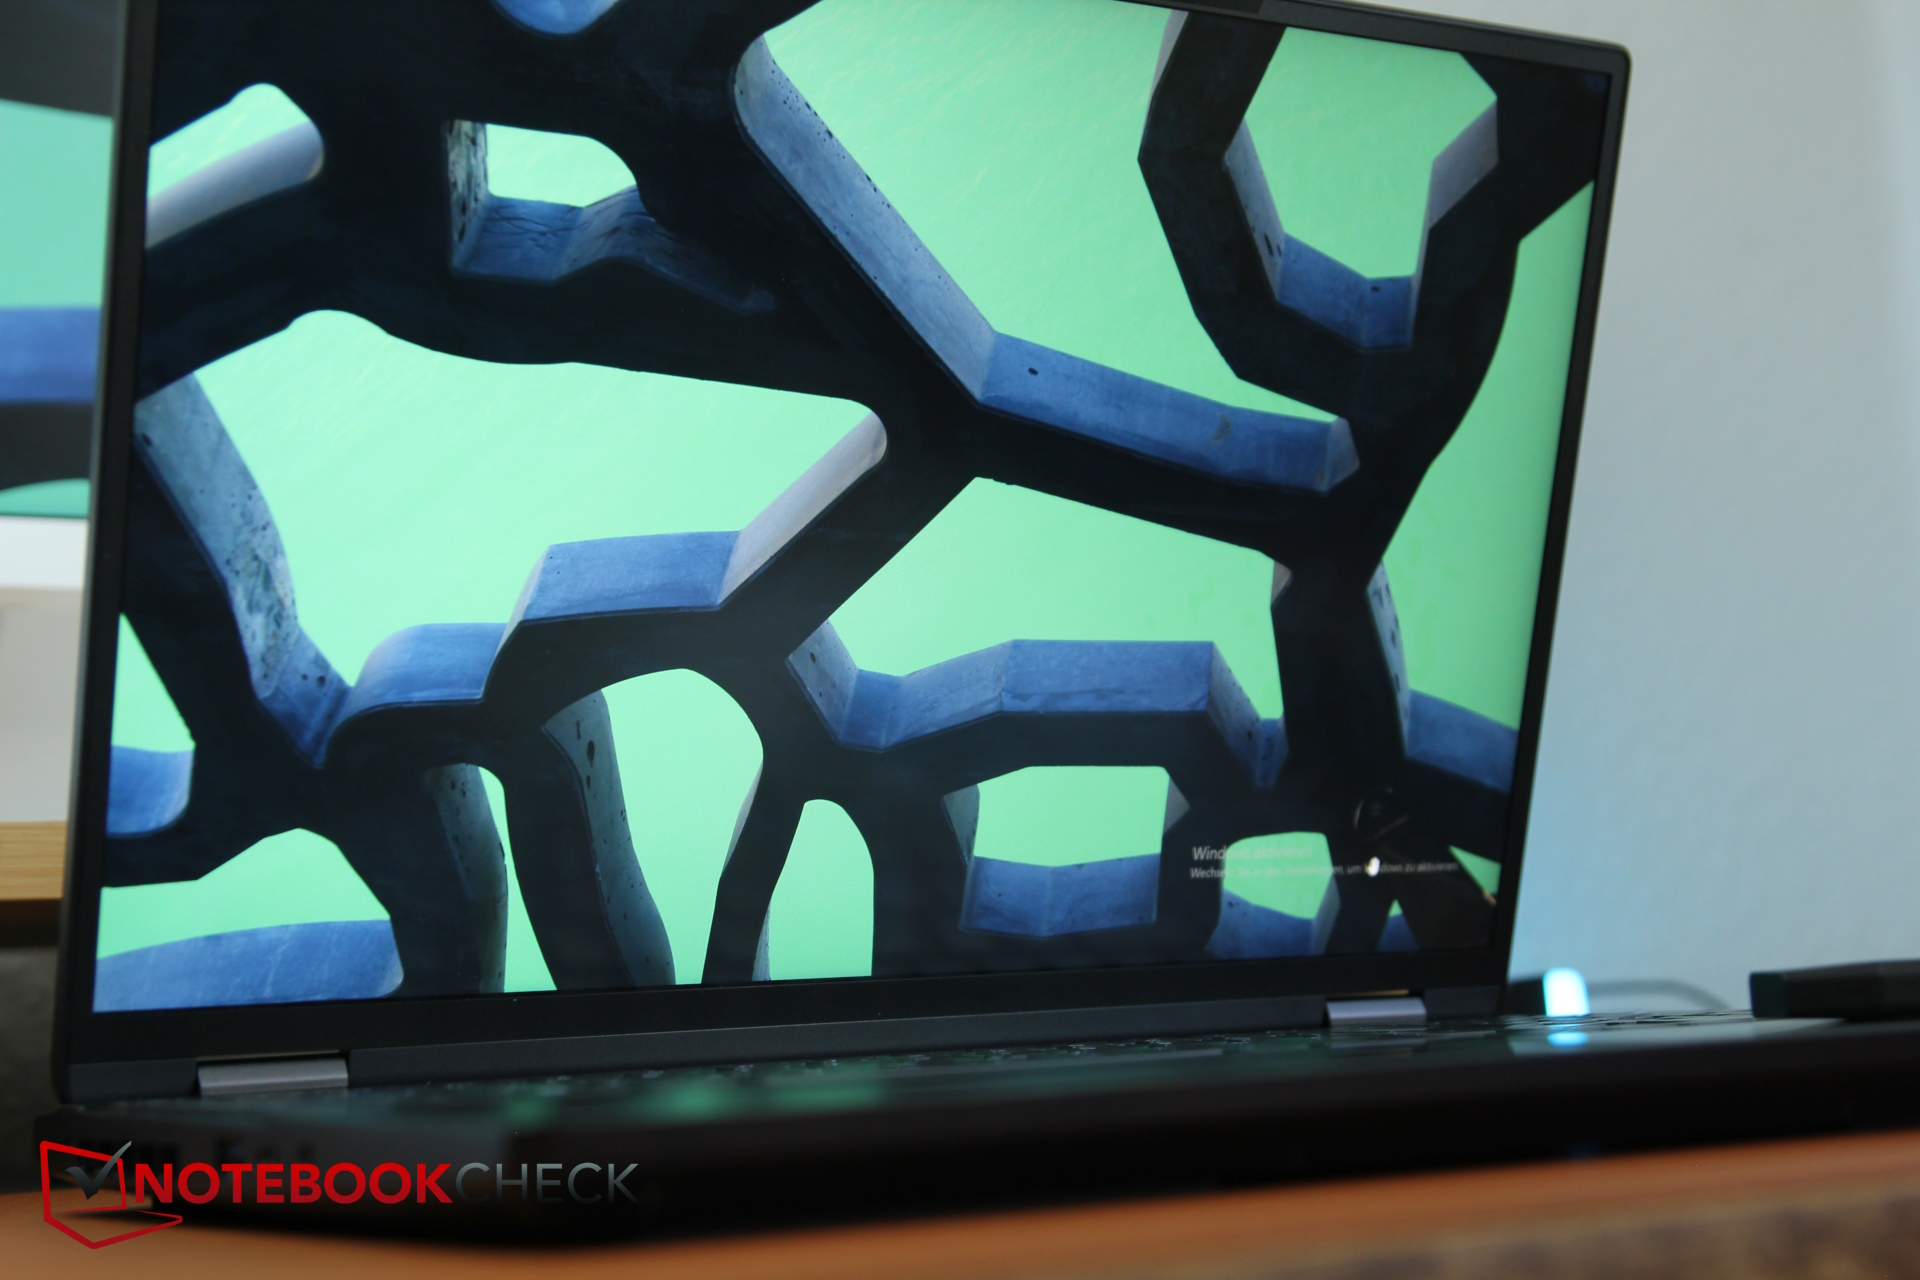
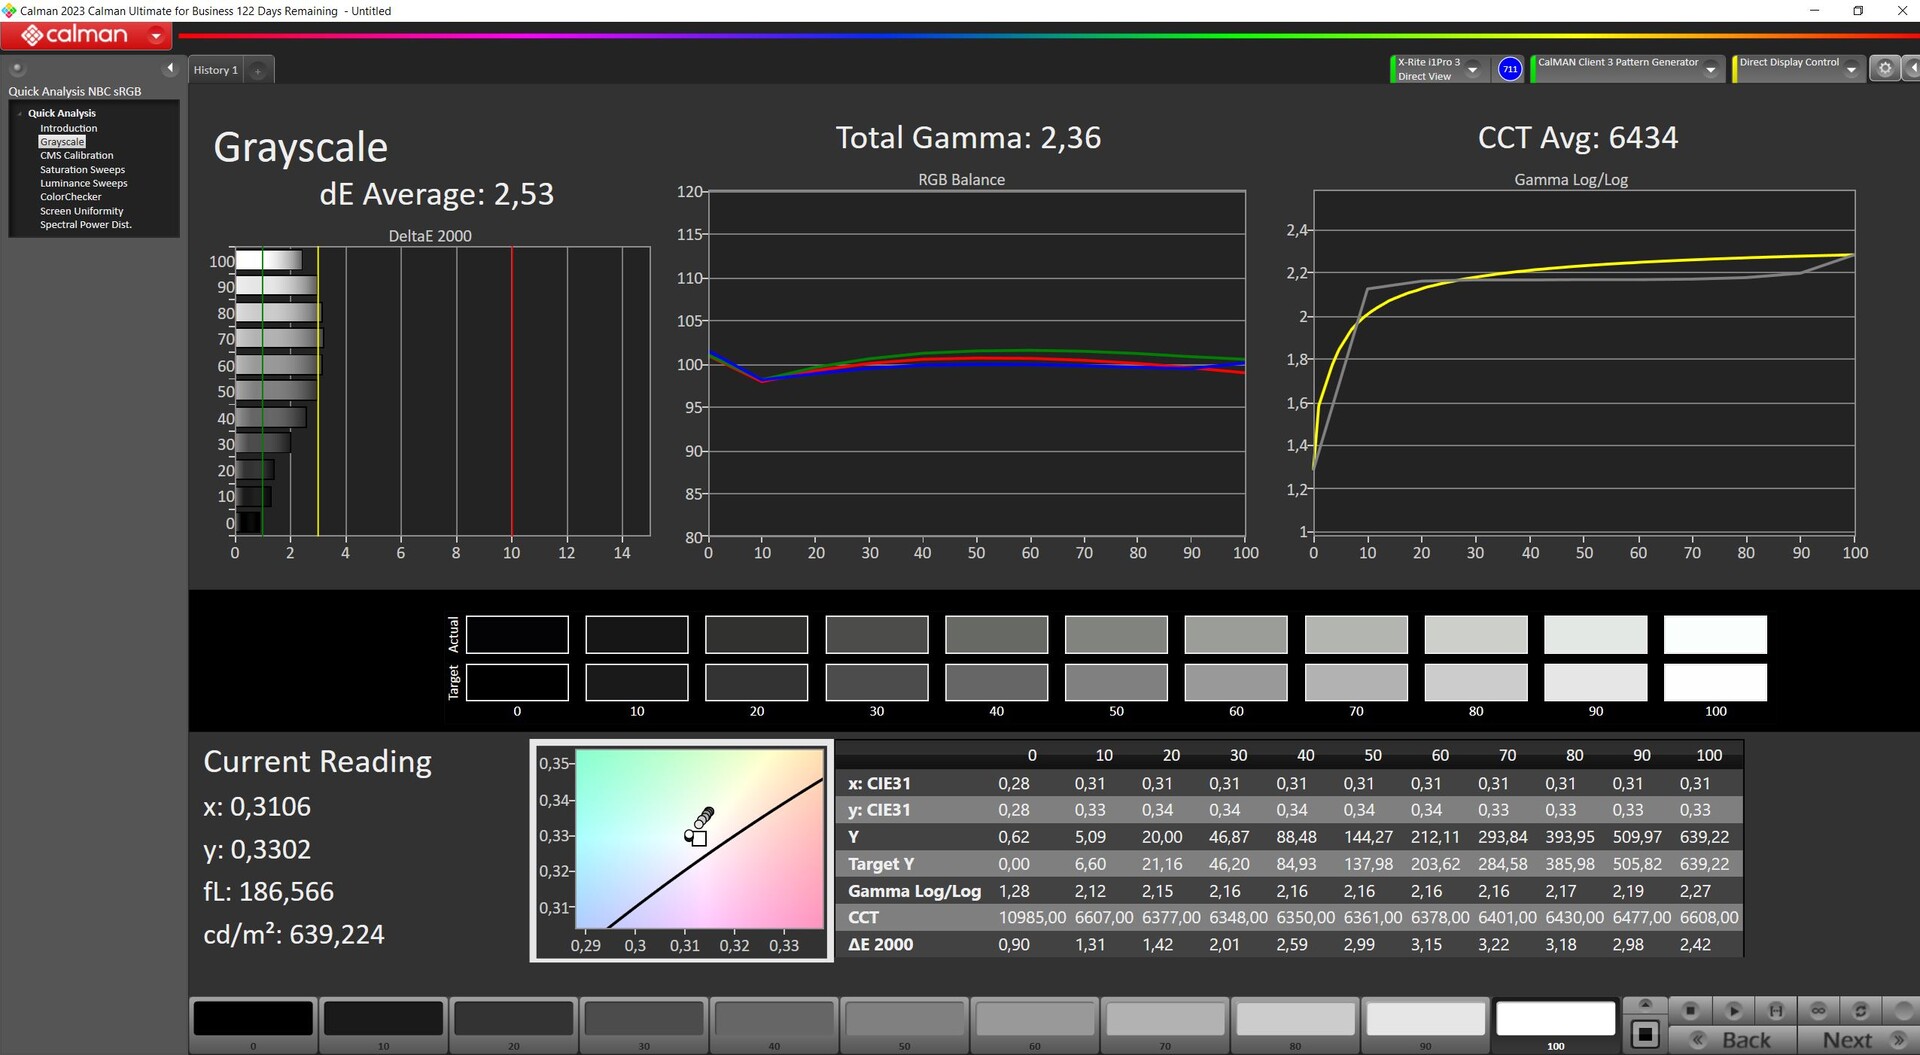
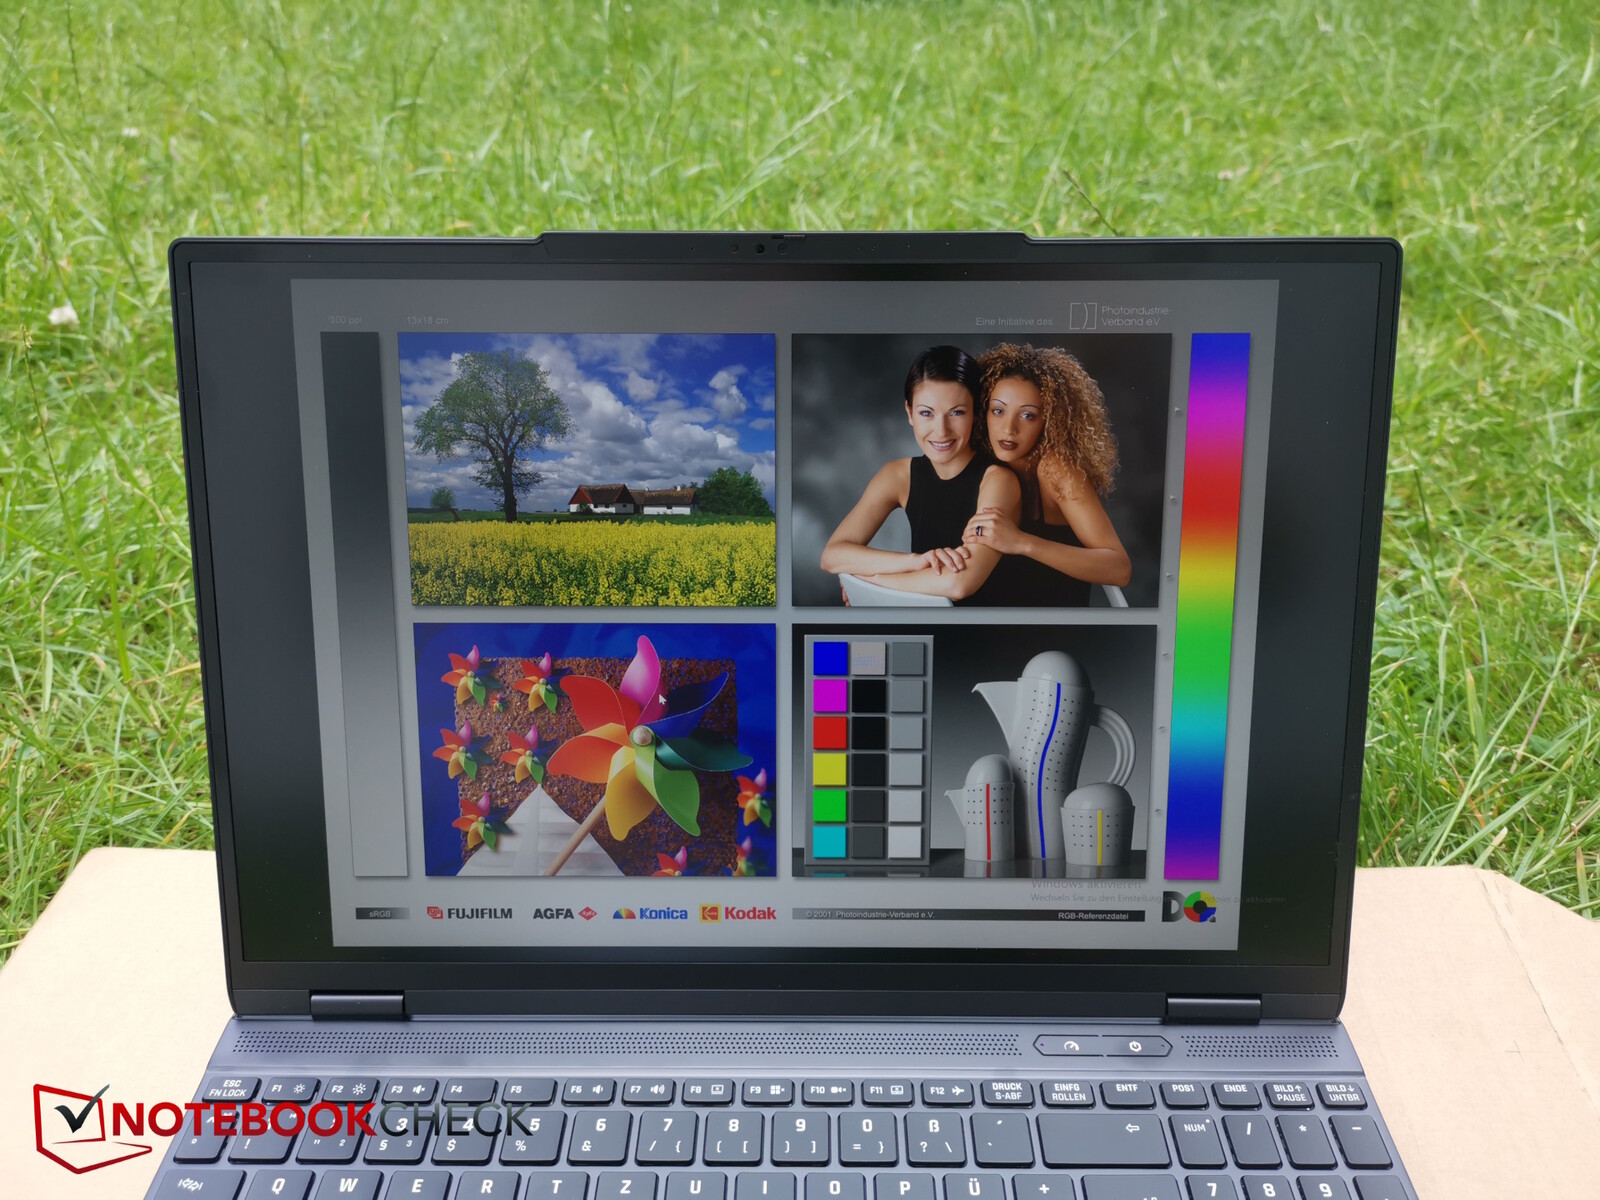
显示屏 - 500 尼特、sRGB、1600p
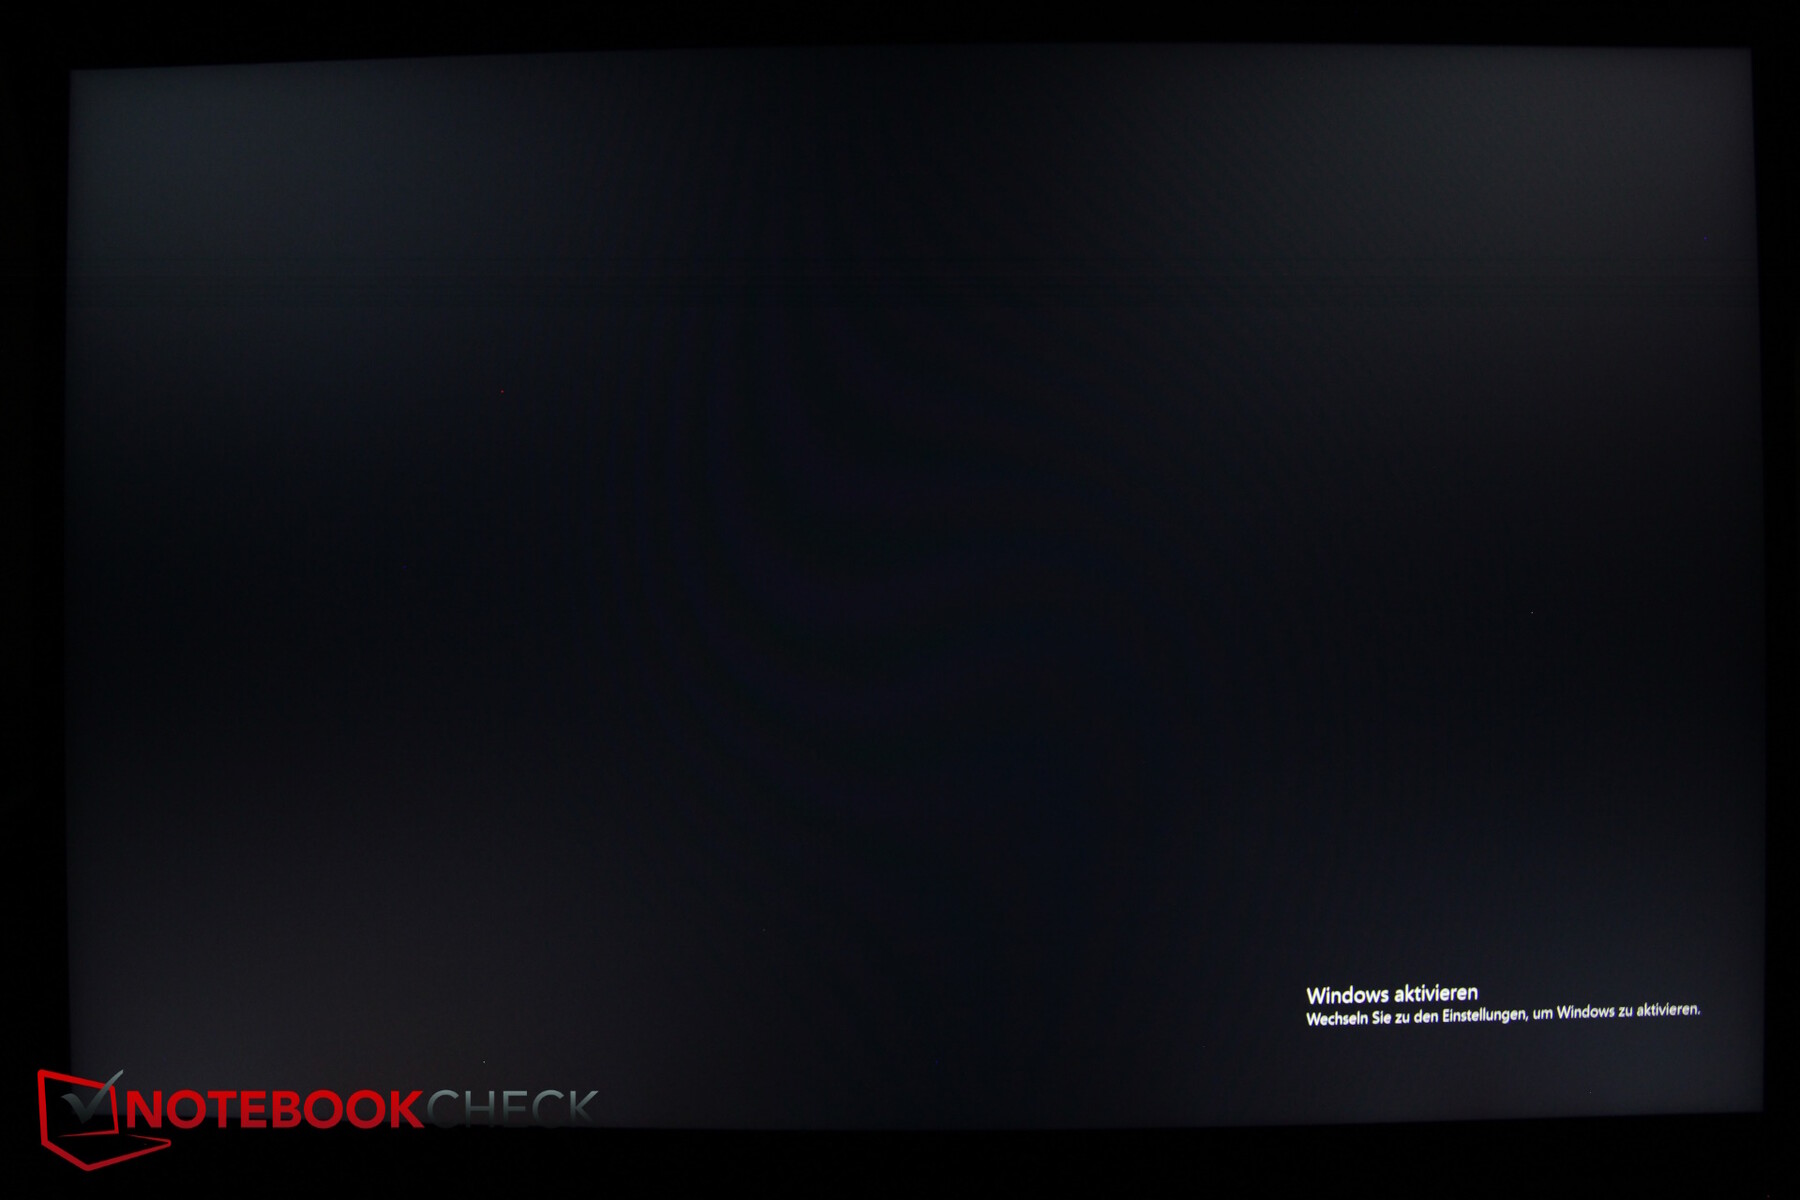
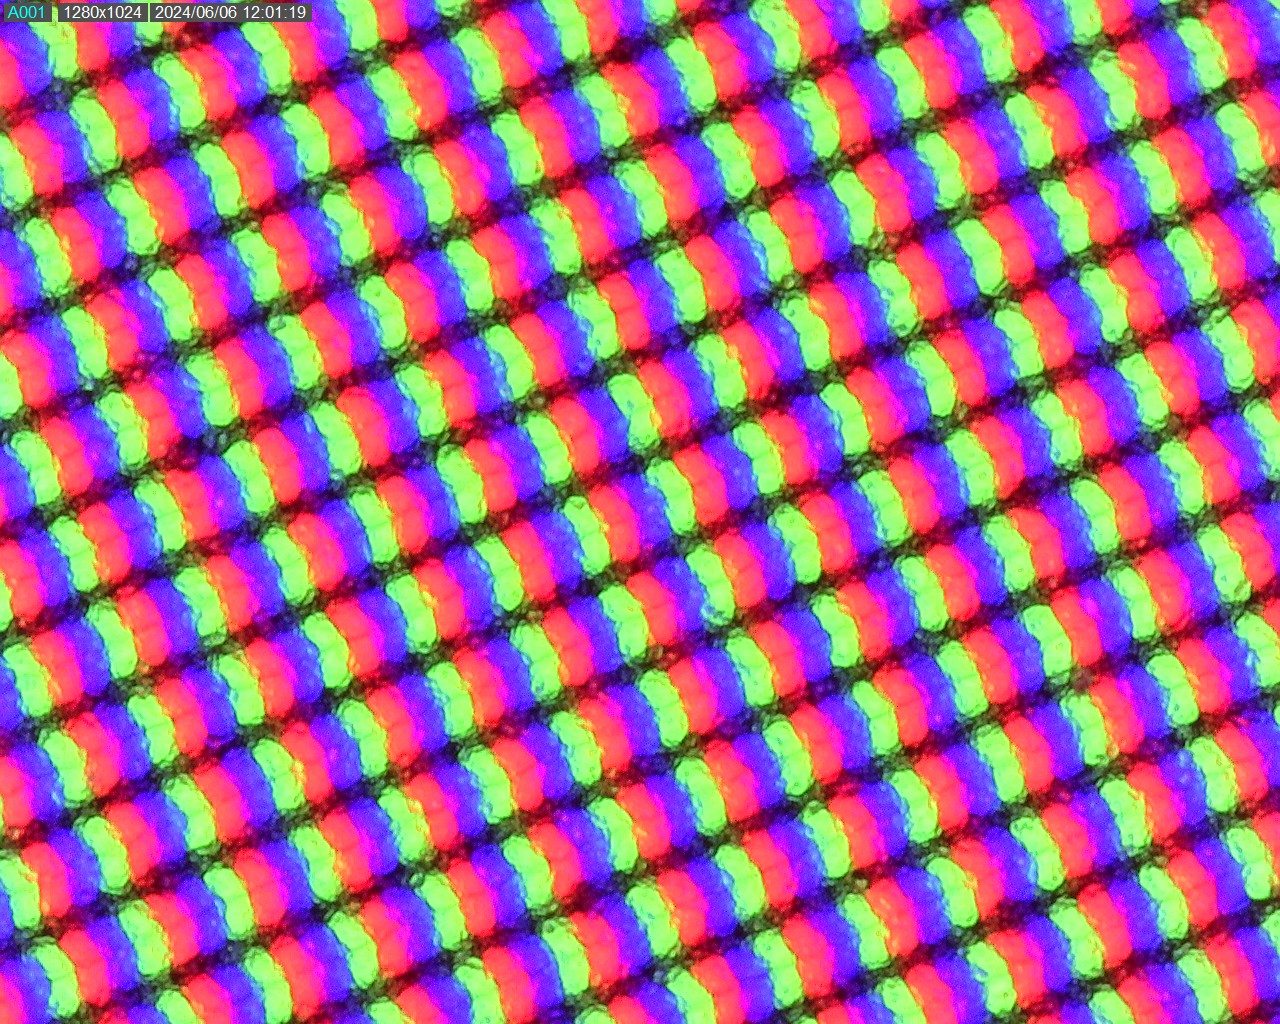
Core 采用与 Fusion 相同的面板。虽然我们测得的亮度明显更高(600 尼特对 460 尼特),但这是以黑色水平为代价的,对比度因此受到影响。
在最低亮度下,显示屏的背光也太亮了,但仍然照得很均匀。
在亮度为 45% 左右(150 尼特)时,我们测得的亮度为 150 尼特。在较暗的显示屏下,色彩准确度和黑度都略有提高。
遗憾的是,没有其他显示屏可供选择,但显示屏亮度很高,响应时间足够快,没有 PWM,同样,背光出血也不明显。
| |||||||||||||||||||||||||
Brightness Distribution: 91 %
Center on Battery: 635 cd/m²
Contrast: 992:1 (Black: 0.64 cd/m²)
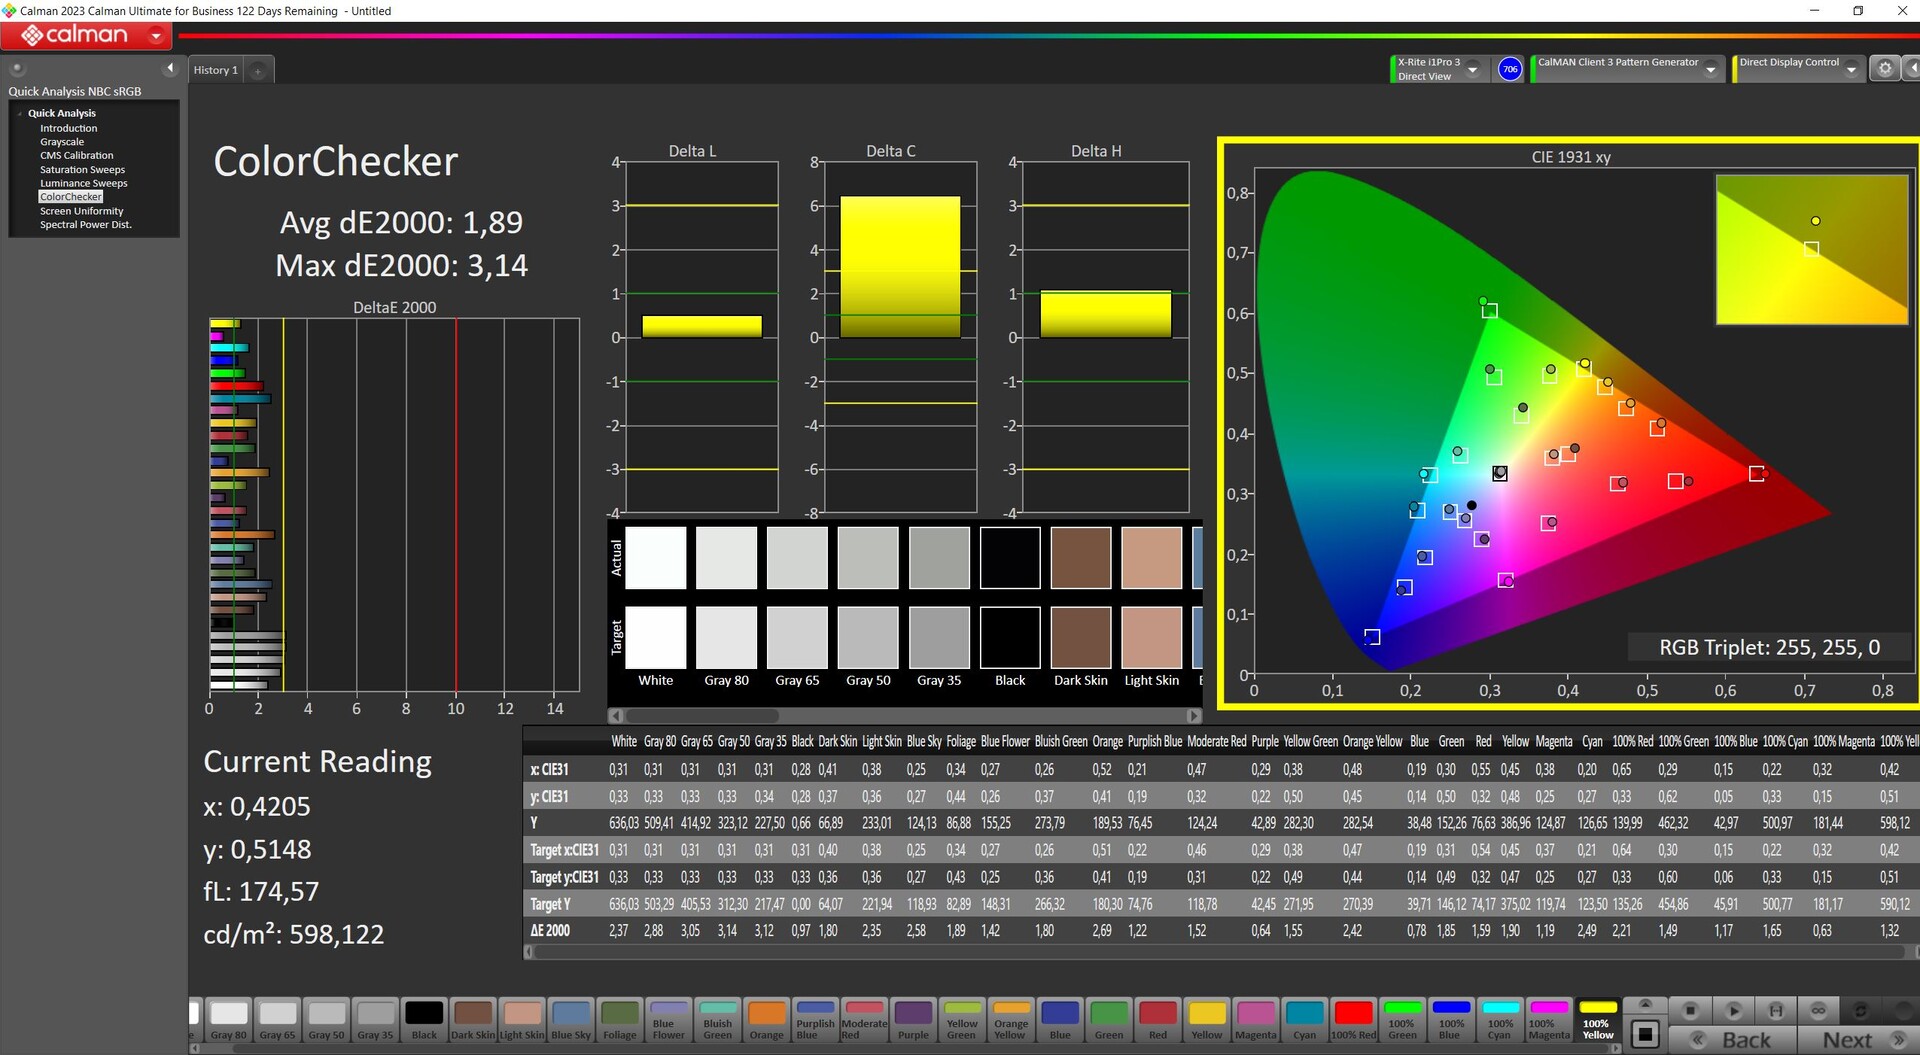
ΔE Color 1.89 | 0.5-29.43 Ø4.87, calibrated: 1.14
ΔE Greyscale 2.53 | 0.5-98 Ø5.1
74.6% AdobeRGB 1998 (Argyll 2.2.0 3D)
100% sRGB (Argyll 2.2.0 3D)
73.2% Display P3 (Argyll 2.2.0 3D)
Gamma: 2.36
| SCHENKER XMG Core 15 (M24) BOE NJ NE153QDM-NZ1 (BOE0C8E), IPS, 2560x1600, 15.3" | Lenovo Legion 5 16IRX G9 NE160QDM-NZ3, IPS, 2560x1600, 16" | HP Victus 16 (2024) Chi Mei CMN163E, IPS, 1920x1080, 16.1" | Dell G16, i7-13650HX, RTX 4060 Chi Mei CMN161D (160GME), IPS, 2560x1600, 16" | SCHENKER XMG Fusion 15 (Early 24) BOE NJ NE153QDM-NZ1, IPS, 2560x1600, 15.3" | SCHENKER XMG Pro 15 (E23) BOE0AD1, IPS, 2560x1440, 15.6" | |
|---|---|---|---|---|---|---|
| Display | -1% | -42% | -5% | 0% | 16% | |
| Display P3 Coverage | 73.2 | 72.4 -1% | 41.3 -44% | 67.5 -8% | 73.5 0% | 97.8 34% |
| sRGB Coverage | 100 | 100 0% | 61.7 -38% | 98.5 -1% | 100 0% | 99.9 0% |
| AdobeRGB 1998 Coverage | 74.6 | 74.1 -1% | 42.7 -43% | 69.3 -7% | 75 1% | 85.4 14% |
| Response Times | -13% | -151% | 4% | 46% | -25% | |
| Response Time Grey 50% / Grey 80% * | 9.6 ? | 12.5 ? -30% | 28.6 ? -198% | 7.6 ? 21% | 5 ? 48% | 14 ? -46% |
| Response Time Black / White * | 9.2 ? | 8.7 ? 5% | 18.7 ? -103% | 10.4 ? -13% | 5.2 ? 43% | 9.6 ? -4% |
| PWM Frequency | ||||||
| Screen | 22% | -114% | -29% | -11% | -24% | |
| Brightness middle | 635 | 526 -17% | 287 -55% | 369 -42% | 491 -23% | 322 -49% |
| Brightness | 604 | 500 -17% | 288 -52% | 344 -43% | 460 -24% | 301 -50% |
| Brightness Distribution | 91 | 87 -4% | 86 -5% | 89 -2% | 89 -2% | 85 -7% |
| Black Level * | 0.64 | 0.33 48% | 0.19 70% | 0.26 59% | 0.47 27% | 0.36 44% |
| Contrast | 992 | 1594 61% | 1511 52% | 1419 43% | 1045 5% | 894 -10% |
| Colorchecker dE 2000 * | 1.89 | 1.2 37% | 5.46 -189% | 3.04 -61% | 2.16 -14% | 1.98 -5% |
| Colorchecker dE 2000 max. * | 3.14 | 2.1 33% | 20.36 -548% | 5.56 -77% | 4.44 -41% | 5.24 -67% |
| Colorchecker dE 2000 calibrated * | 1.14 | 1 12% | 3.52 -209% | 2.35 -106% | 1.14 -0% | 1.98 -74% |
| Greyscale dE 2000 * | 2.53 | 1.3 49% | 4.8 -90% | 3.38 -34% | 3.3 -30% | 2.44 4% |
| Gamma | 2.36 93% | 2.23 99% | 2.108 104% | 2.47 89% | 2.204 100% | 2.42 91% |
| CCT | 6434 101% | 6391 102% | 6442 101% | 6040 108% | 6286 103% | 6984 93% |
| Total Average (Program / Settings) | 3% /
13% | -102% /
-104% | -10% /
-19% | 12% /
-1% | -11% /
-15% |
* ... smaller is better
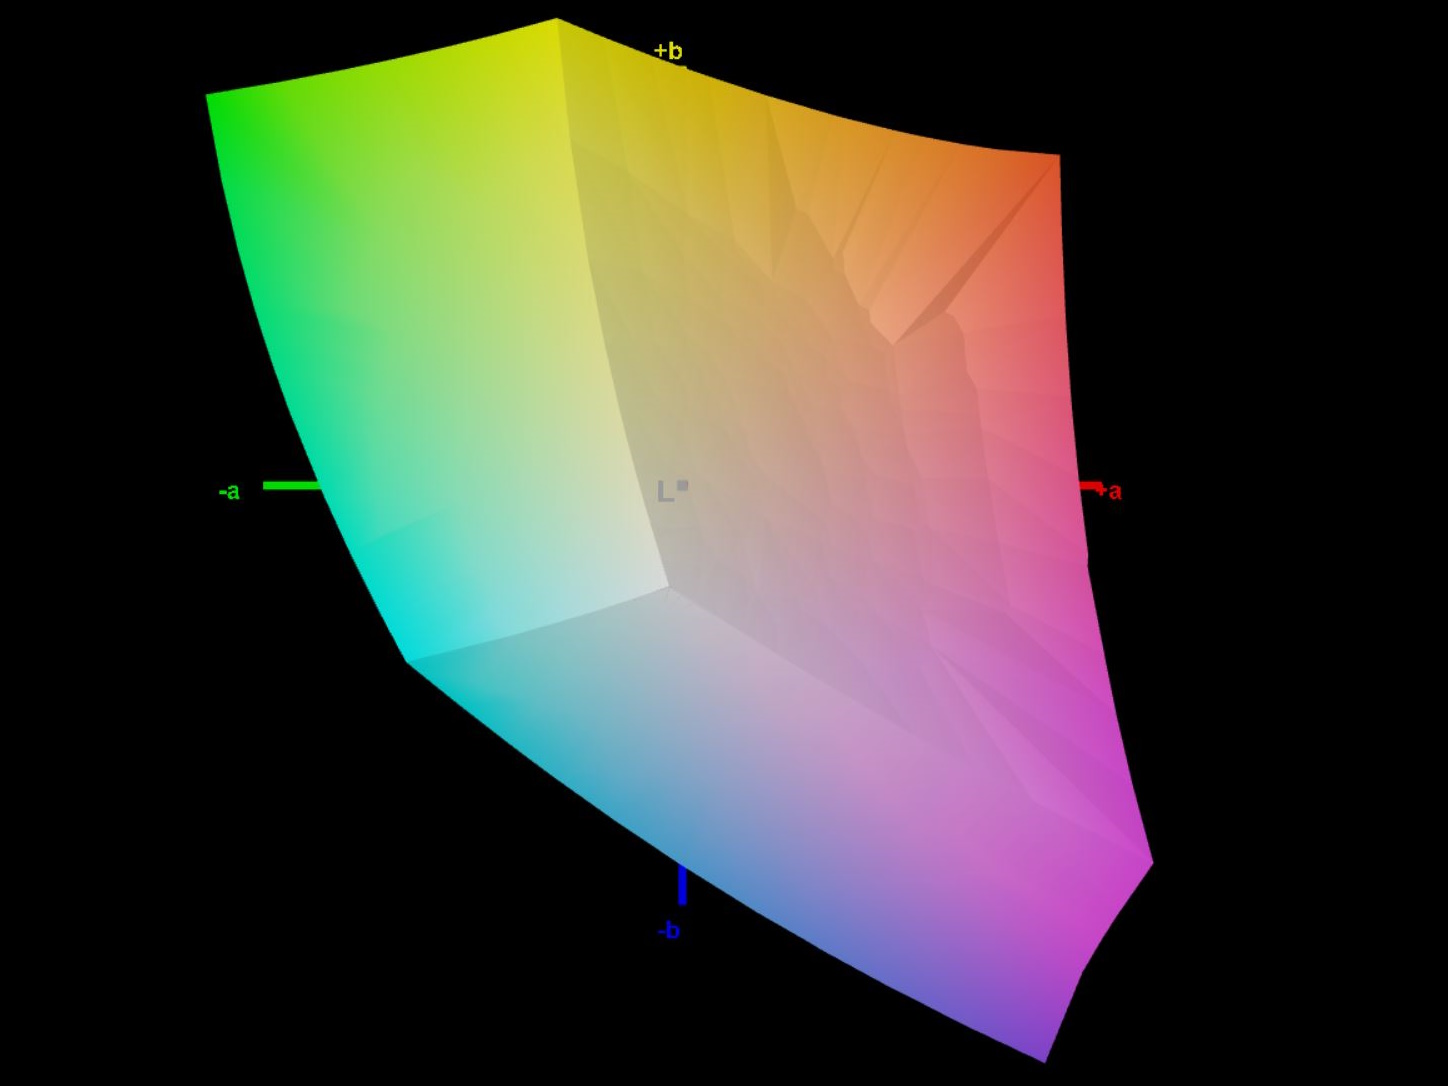
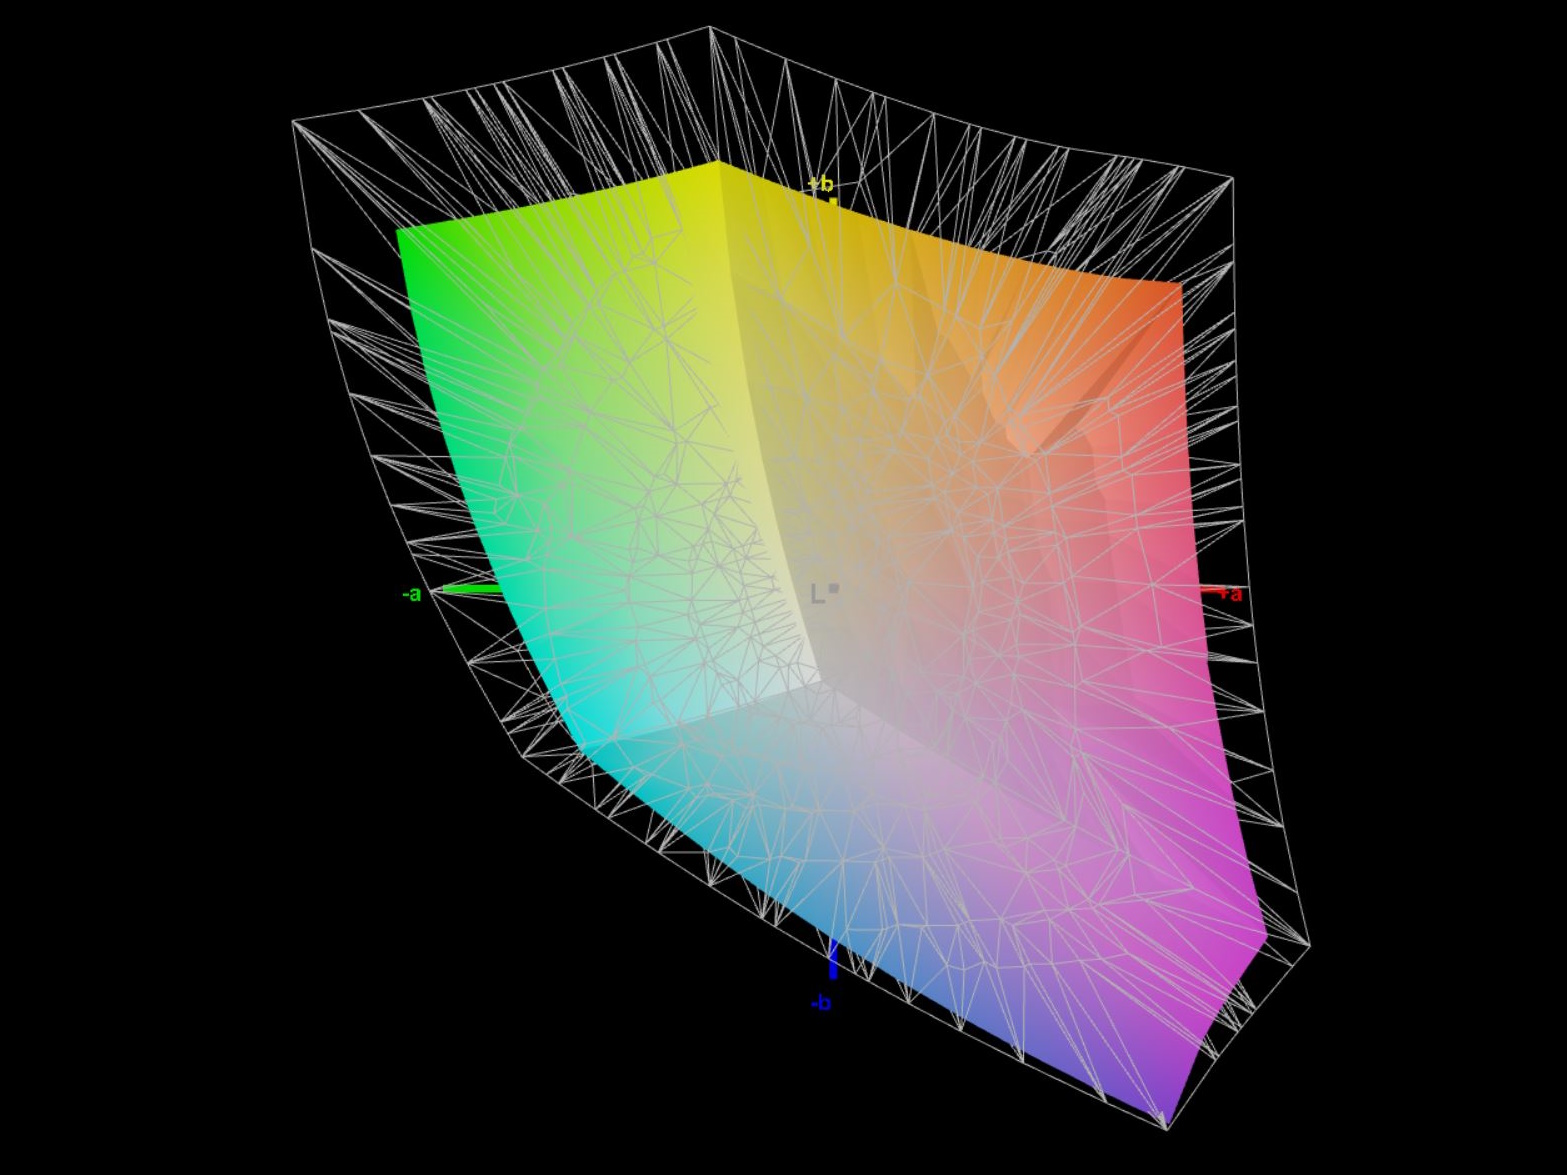
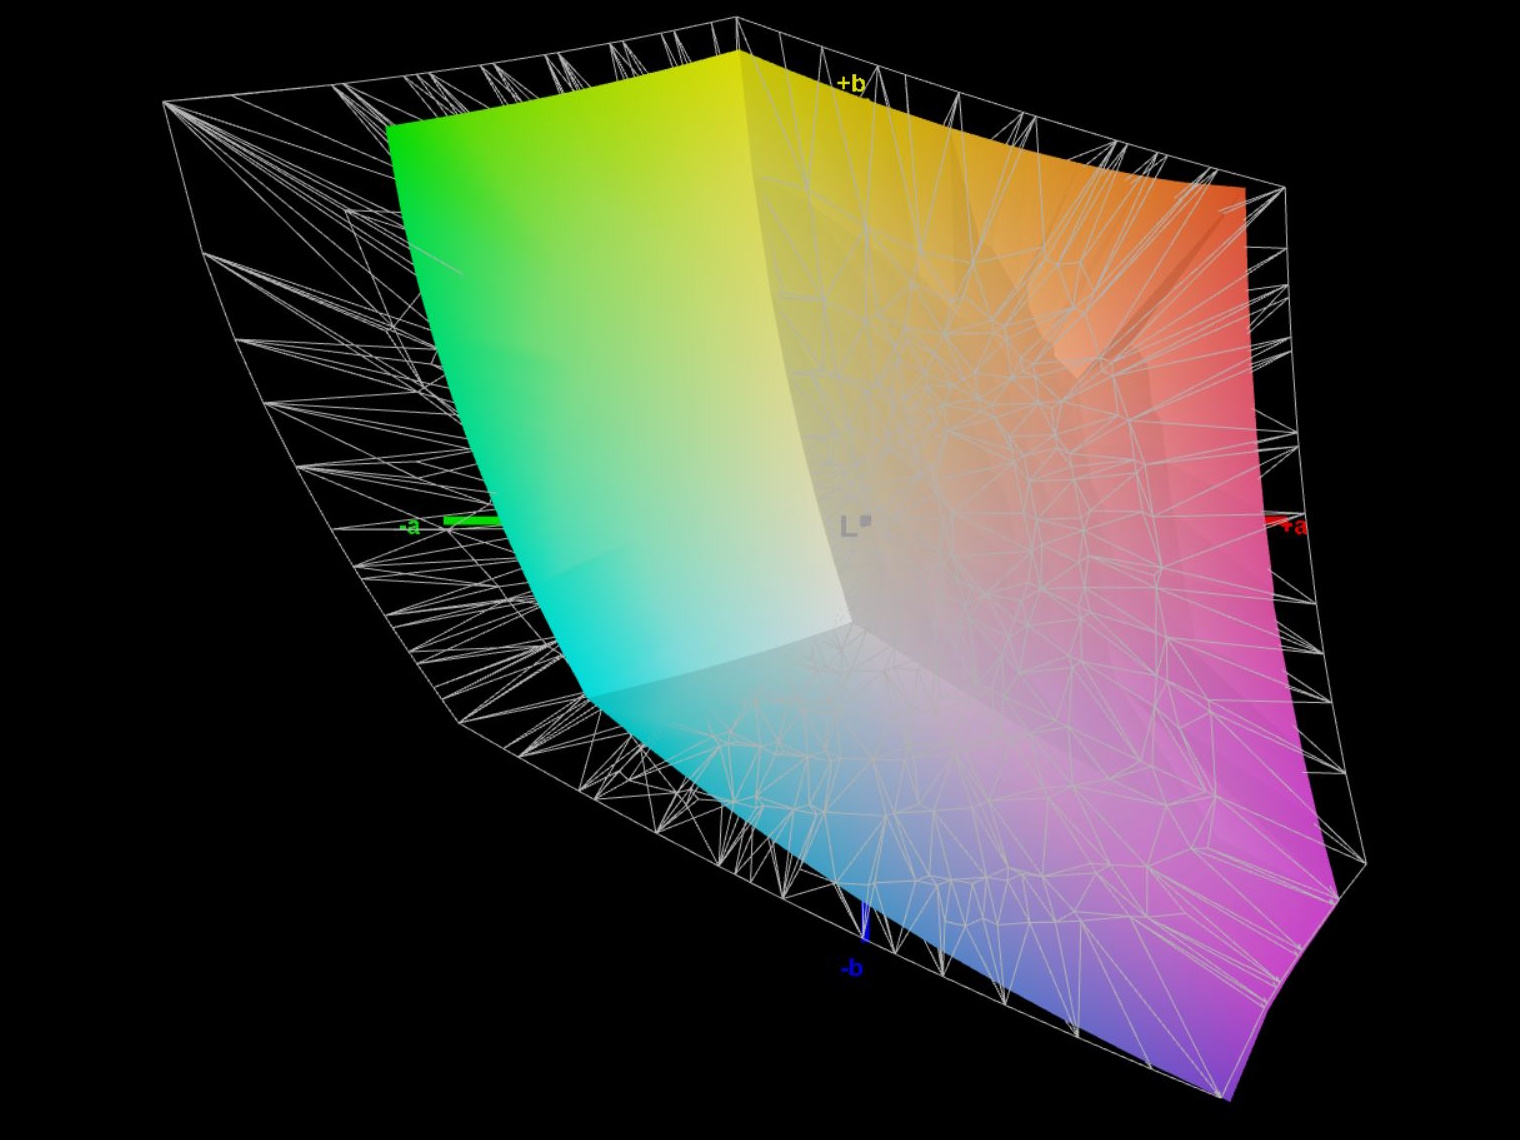
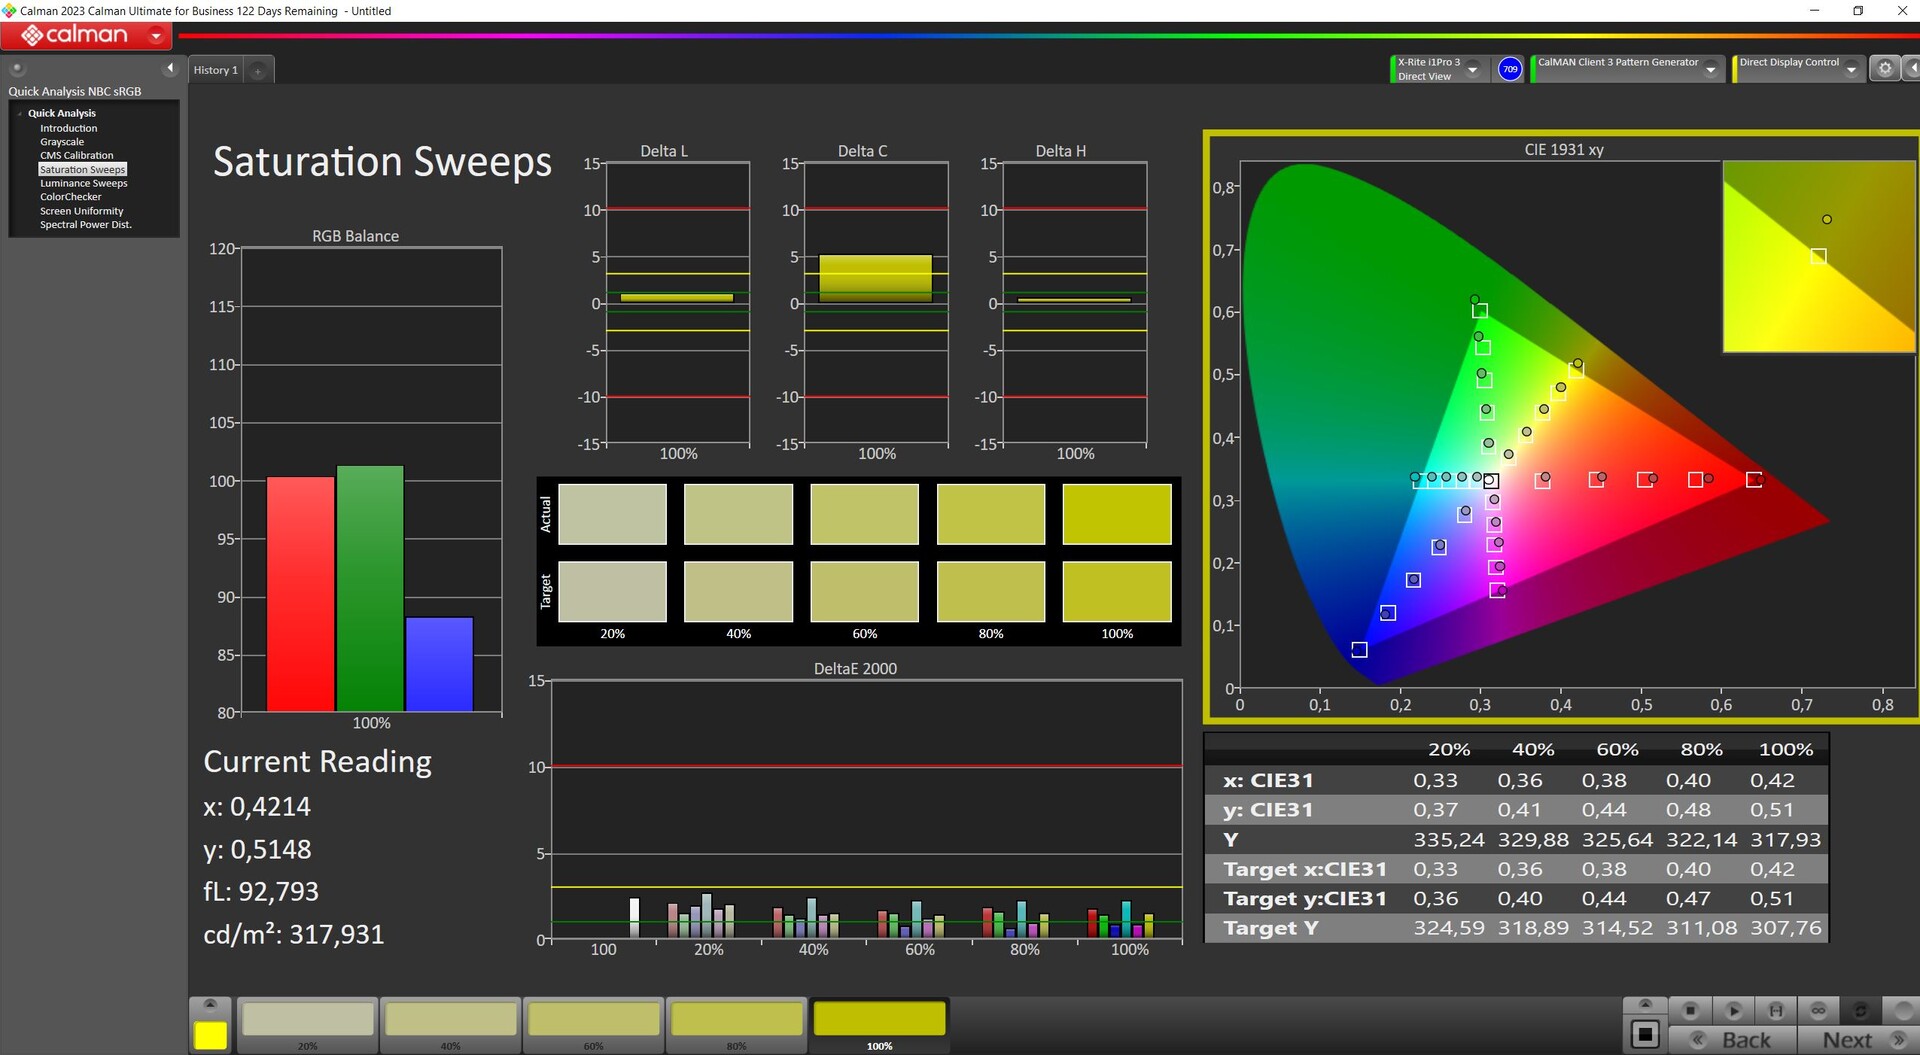
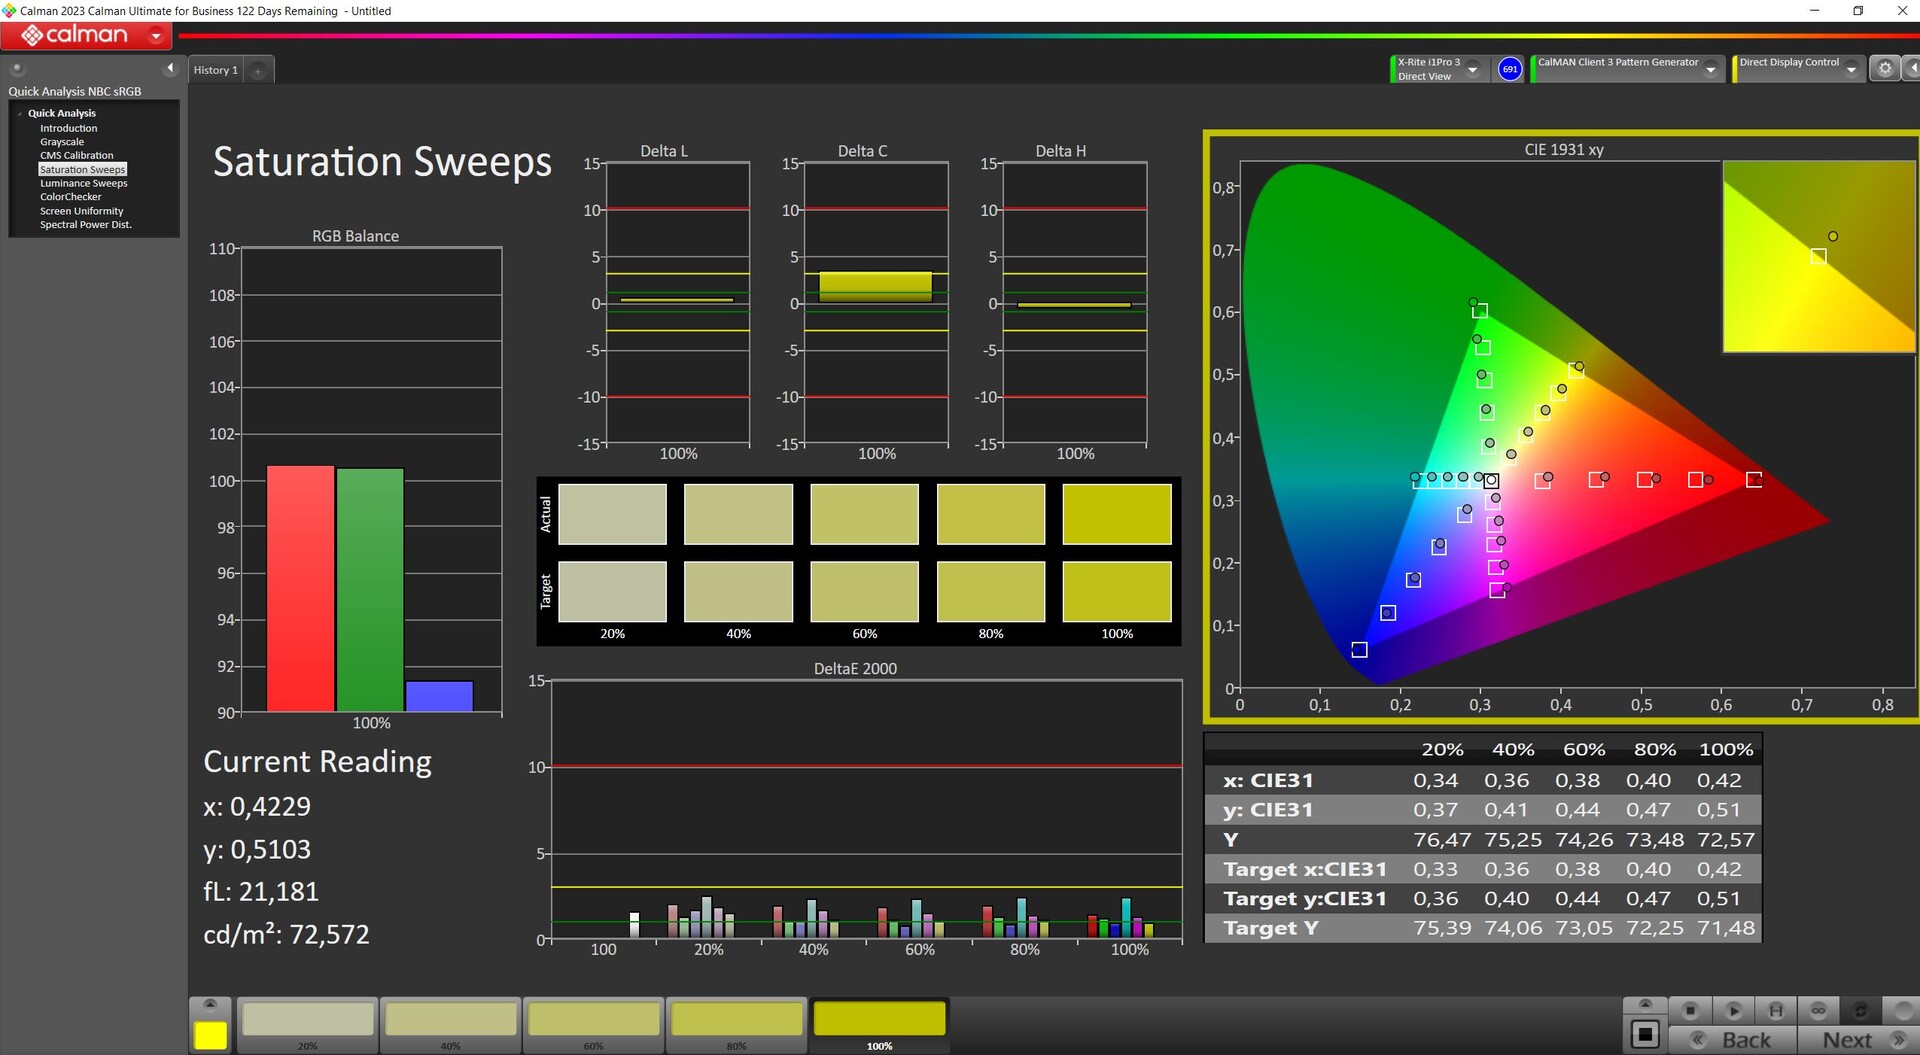
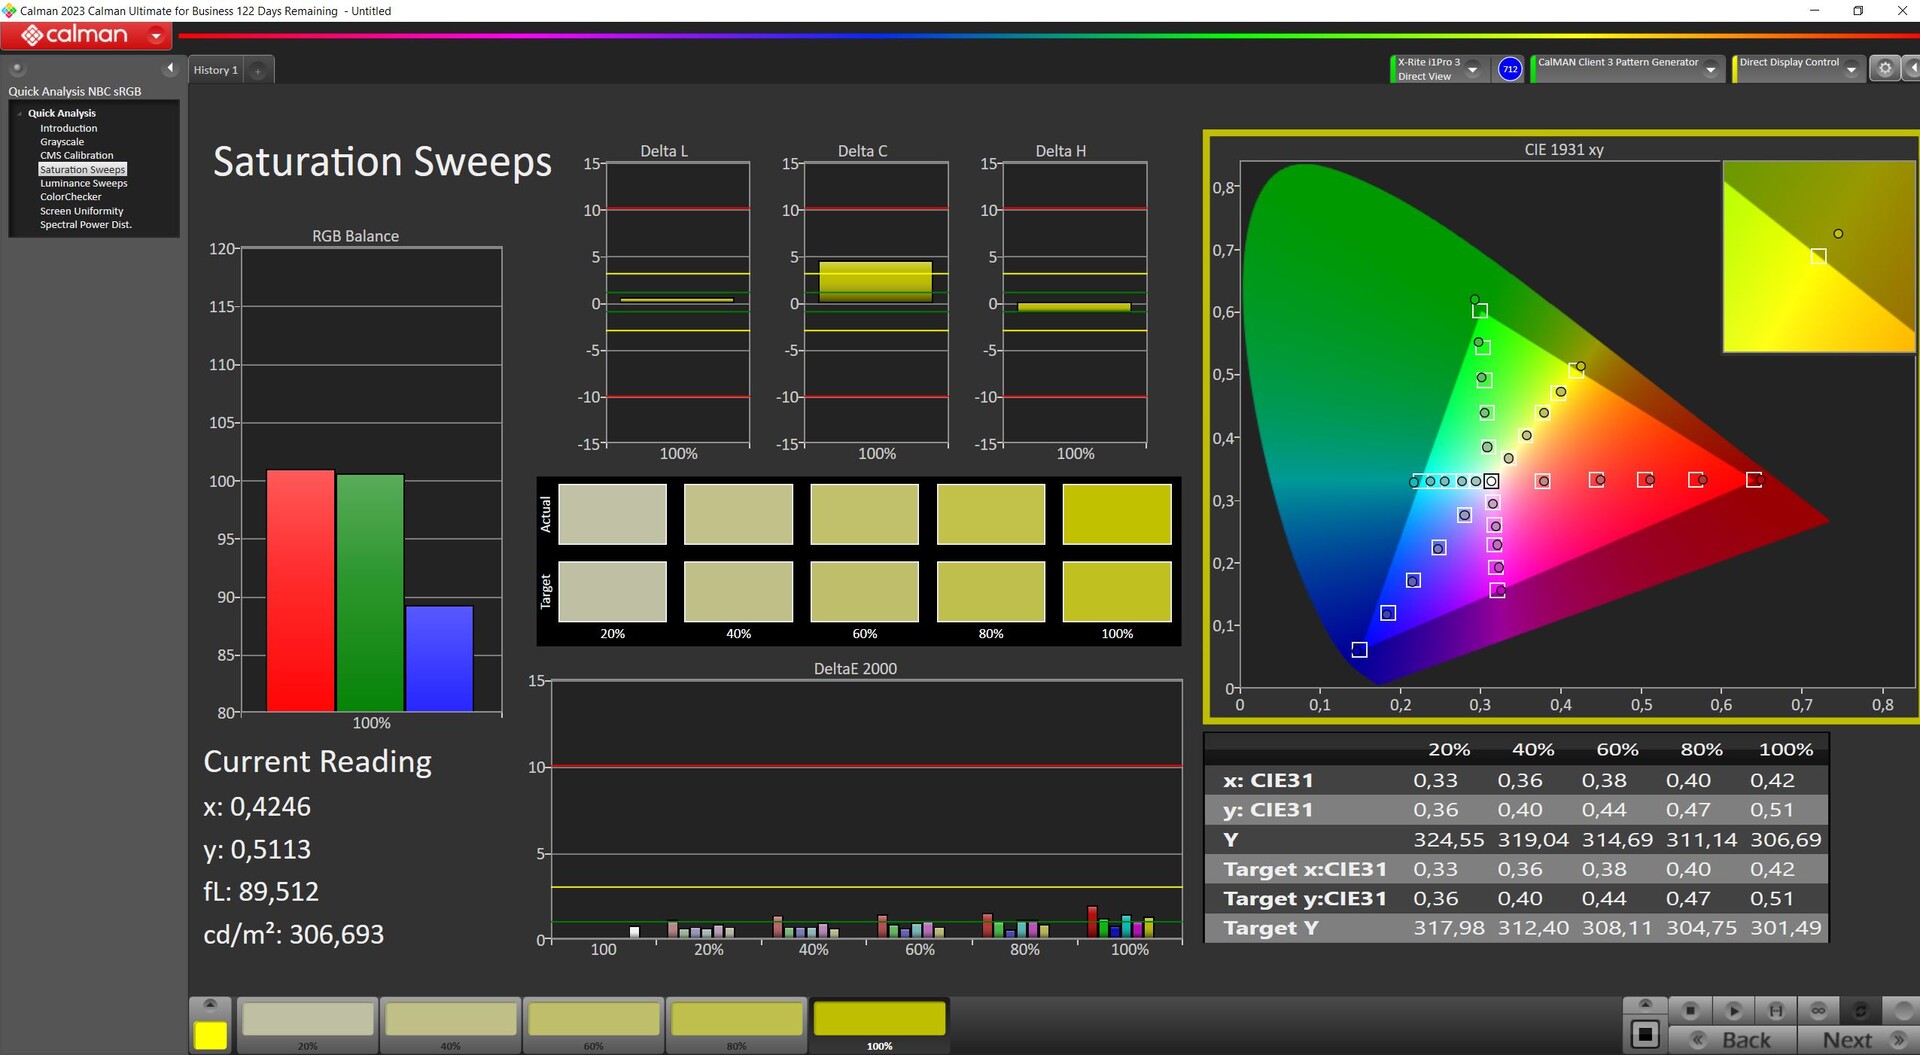
色彩空间覆盖率
与 Fusion 15 一样,sRGB 完全覆盖,P3 和 AdobeRGB 约为 73% 至 75%。
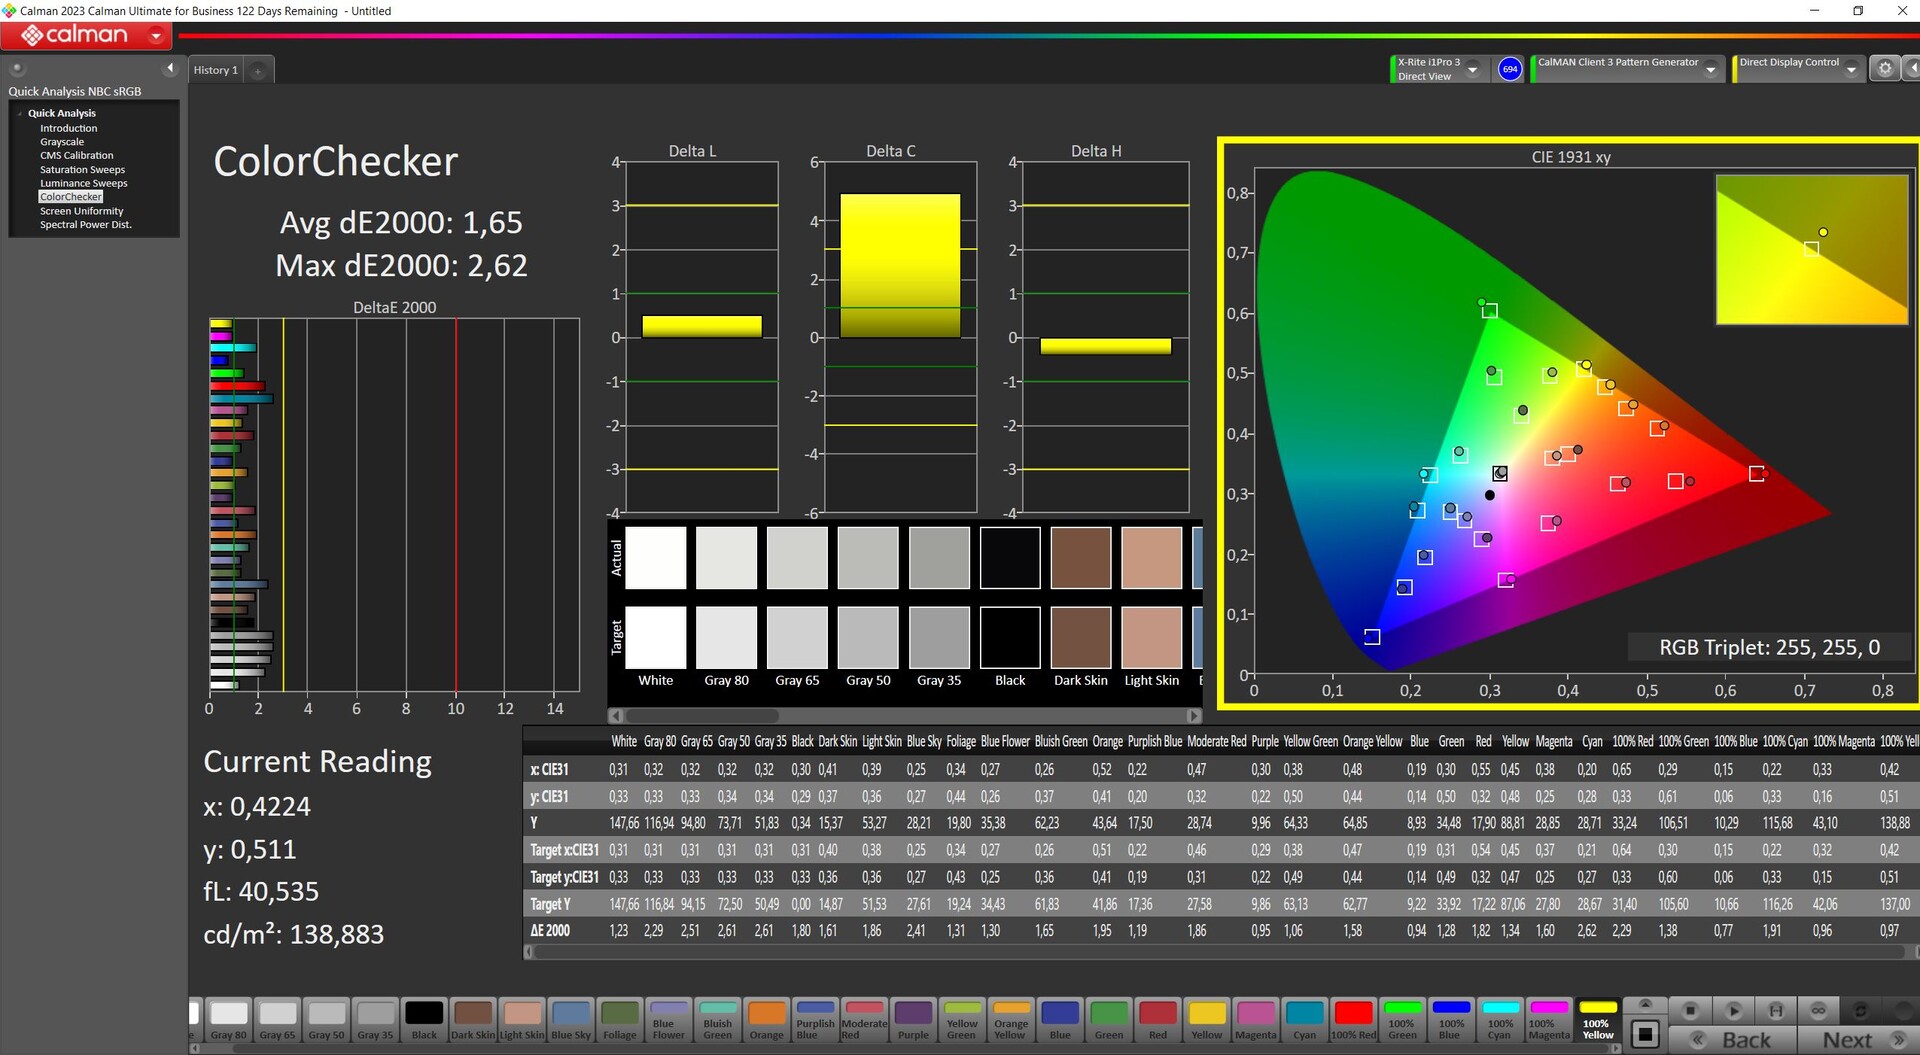
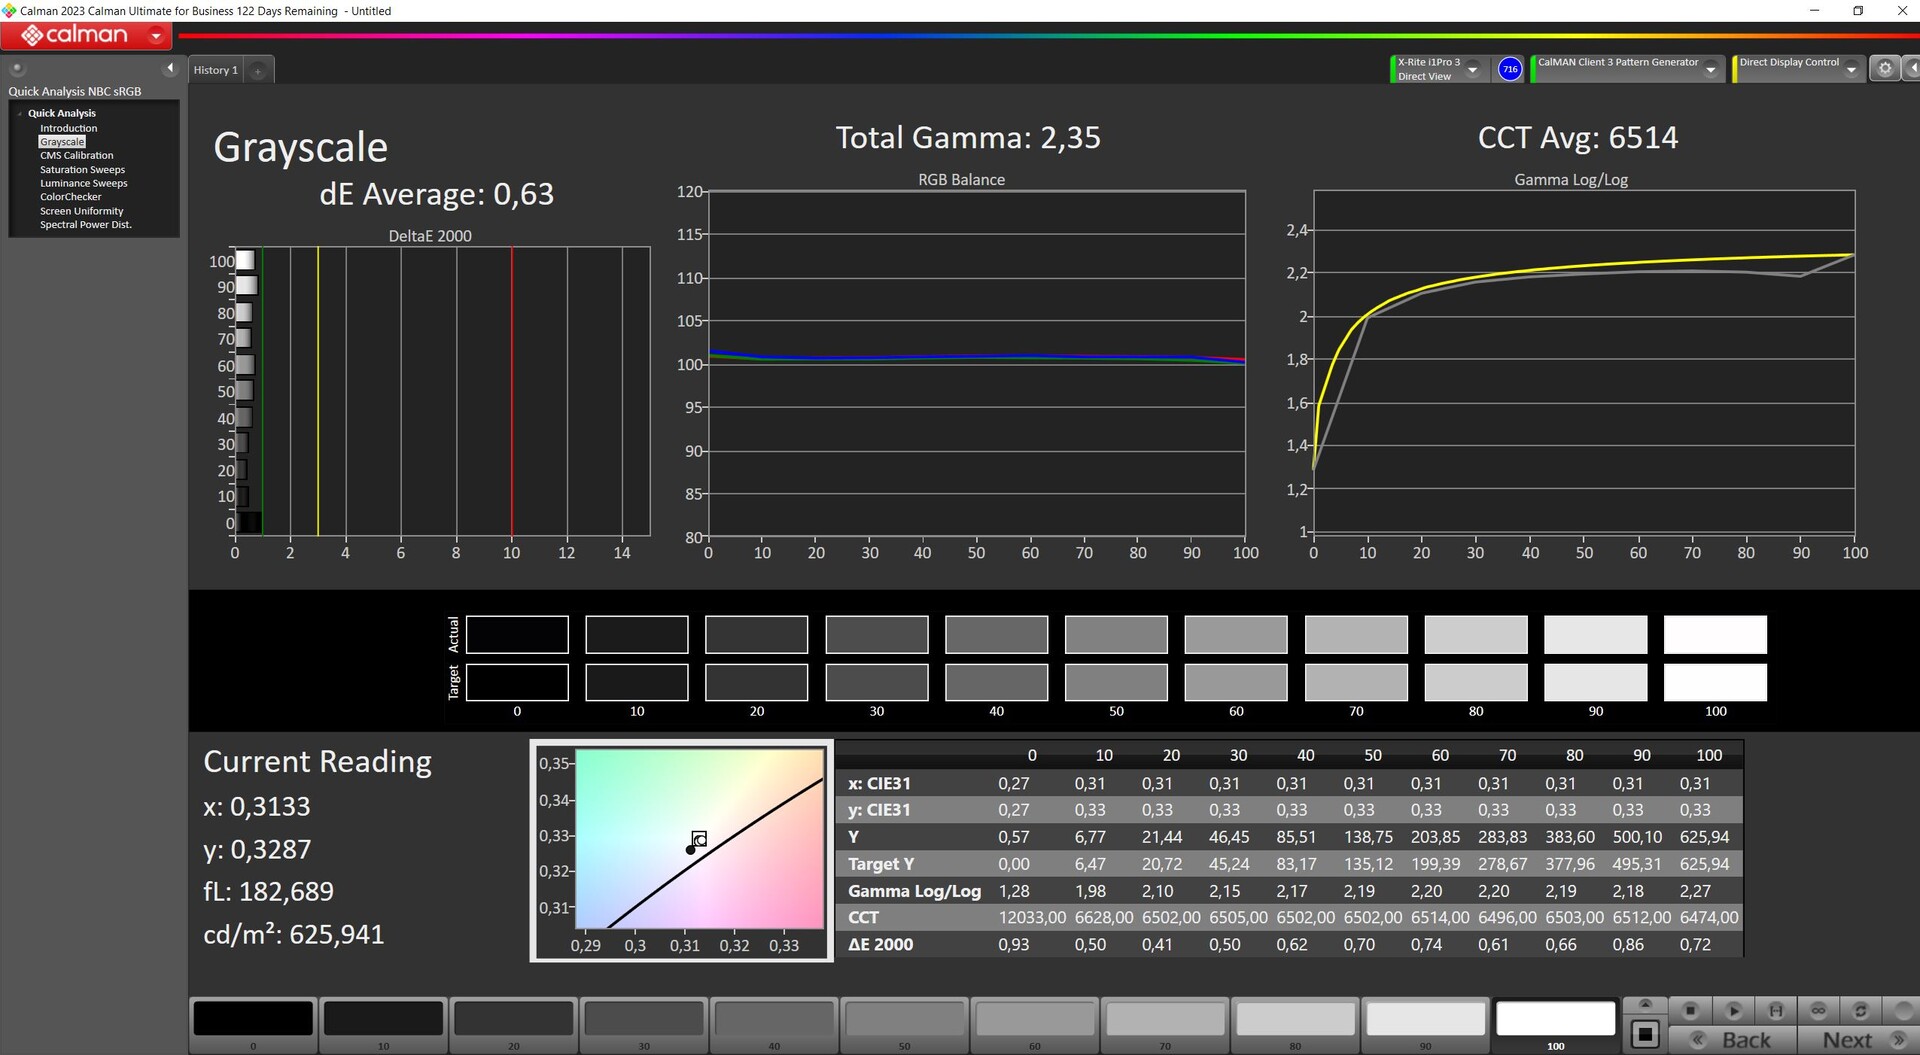
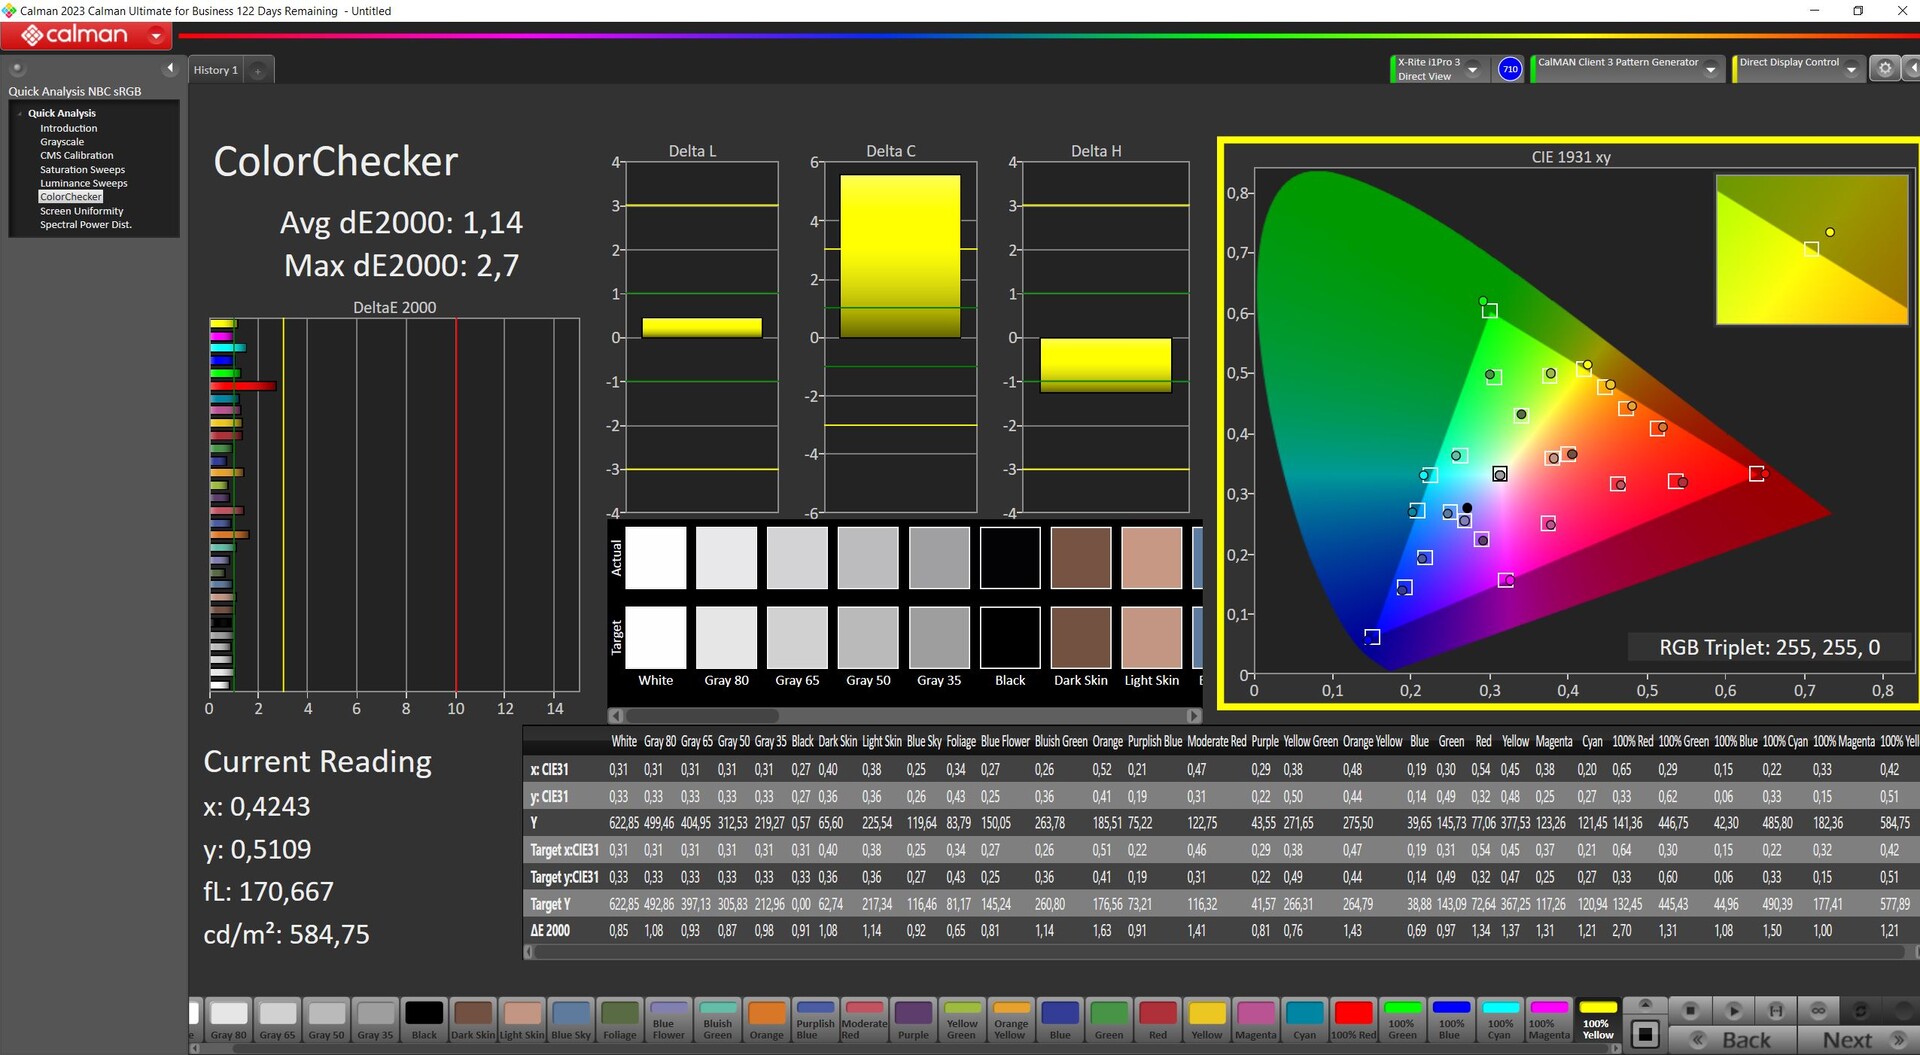
色彩精度
开箱后,面板的校准效果不错,DeltaE 值低于 3。不过,黑色值明显过高。将亮度降低到 150 尼特不仅能改善这种情况,还能使 DeltaE 值略有下降。
在原生最大亮度下进行手动校准,尽管亮度值已经不错,但仍有奇效,能明显减小偏差。因此,面板的校准效果非常好,至少在 sRGB 下色彩准确度非常高。在最大亮度下,黑色值仍然过高,导致对比度下降。

Display Response Times
| ↔ Response Time Black to White | ||
|---|---|---|
| 9.2 ms ... rise ↗ and fall ↘ combined | ↗ 4.6 ms rise | 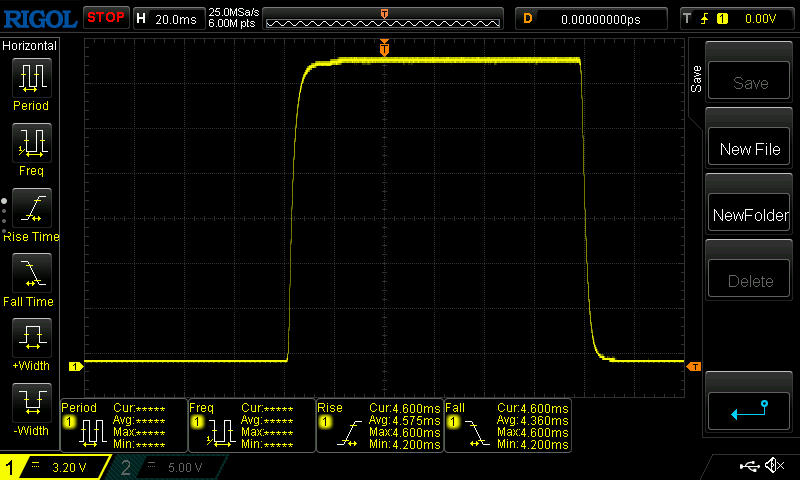 |
| ↘ 4.6 ms fall | ||
| The screen shows fast response rates in our tests and should be suited for gaming. In comparison, all tested devices range from 0.1 (minimum) to 240 (maximum) ms. » 23 % of all devices are better. This means that the measured response time is better than the average of all tested devices (20.8 ms). | ||
| ↔ Response Time 50% Grey to 80% Grey | ||
| 9.6 ms ... rise ↗ and fall ↘ combined | ↗ 4.6 ms rise | 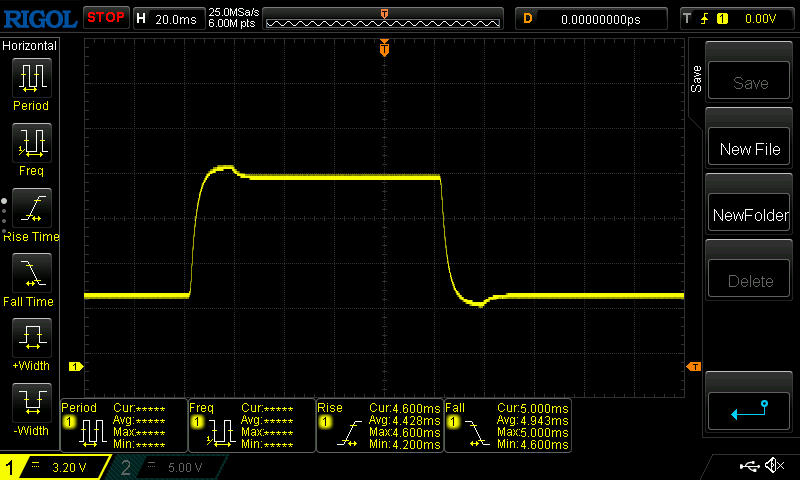 |
| ↘ 5 ms fall | ||
| The screen shows fast response rates in our tests and should be suited for gaming. In comparison, all tested devices range from 0.165 (minimum) to 636 (maximum) ms. » 20 % of all devices are better. This means that the measured response time is better than the average of all tested devices (32.5 ms). | ||
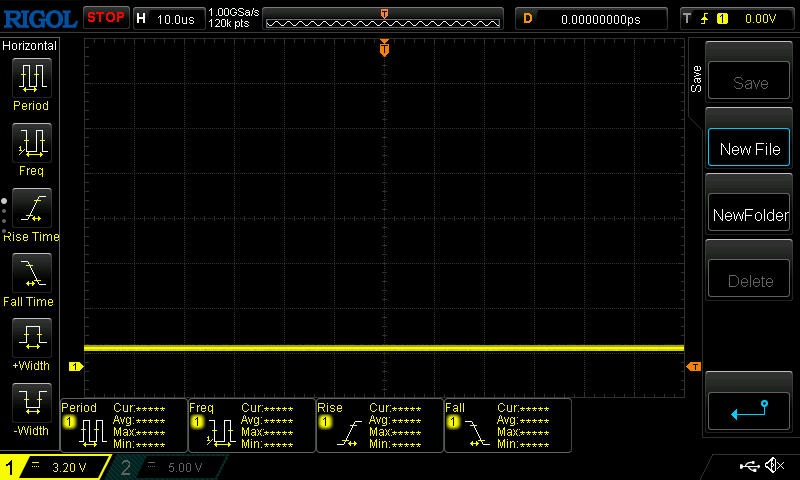
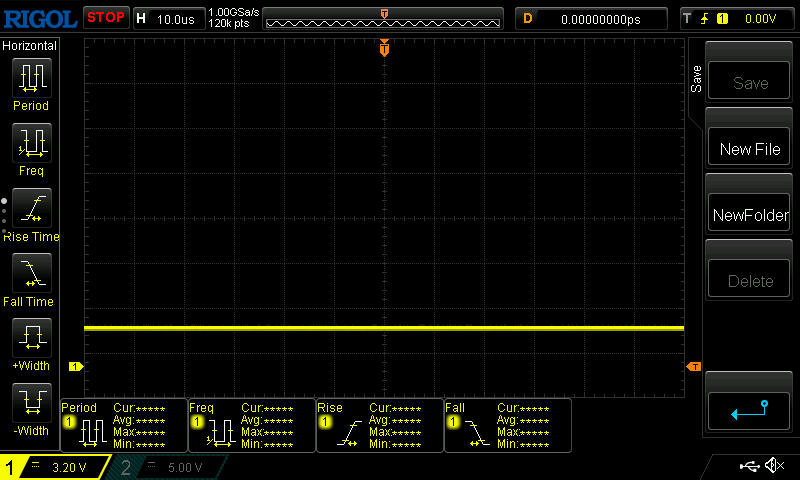
Screen Flickering / PWM (Pulse-Width Modulation)
| Screen flickering / PWM not detected |  | ||
In comparison: 53 % of all tested devices do not use PWM to dim the display. If PWM was detected, an average of 8529 (minimum: 5 - maximum: 343500) Hz was measured. | |||
高亮度和哑光显示屏确保您在阴暗处使用该设备时不会有太大问题,内容仍然清晰可辨。不过,对比度可以再高一些,而且应避免阳光直射。

性能 - 比配备 HX 和 RTX 4070 的 Fusion 慢 20
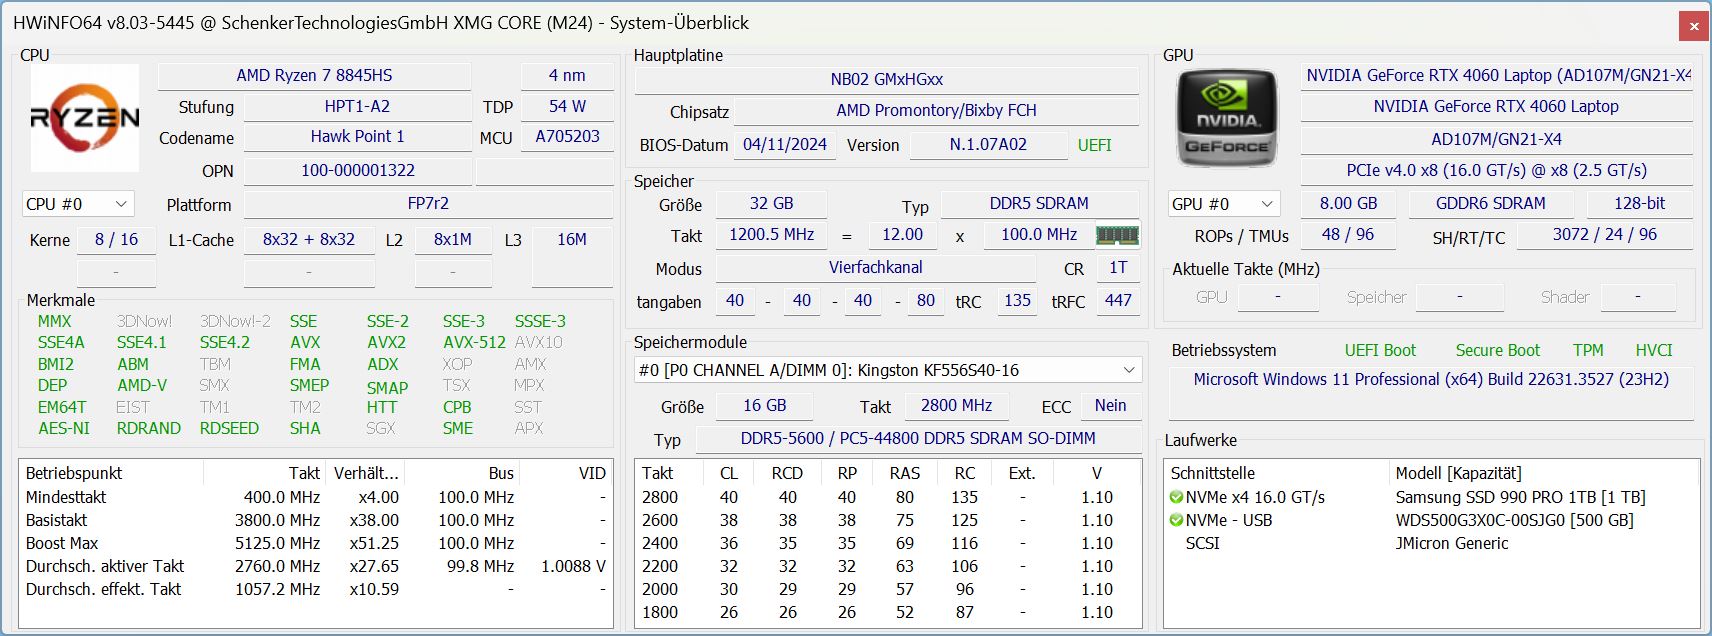
使用 Ryzen 7 8845HS, RTX 4060和 32GB 内存,XMG 酷睿 15 将自己定位为中端游戏笔记本电脑,并以此为市场定位。其黑色、相对纤薄、时尚的全铝外壳赋予了这款笔记本电脑低调的外观,这也会让内容创作者对它产生兴趣。令人遗憾的是,申克公司没有提供任何额外的显示选项,因为校准良好的屏幕 "只能 "显示 sRGB。这对于照片编辑,尤其是视频编辑来说,可能是一个不必要的破坏性标准。因此,我们也希望将来能看到 DisplayP3 选项。
测试条件
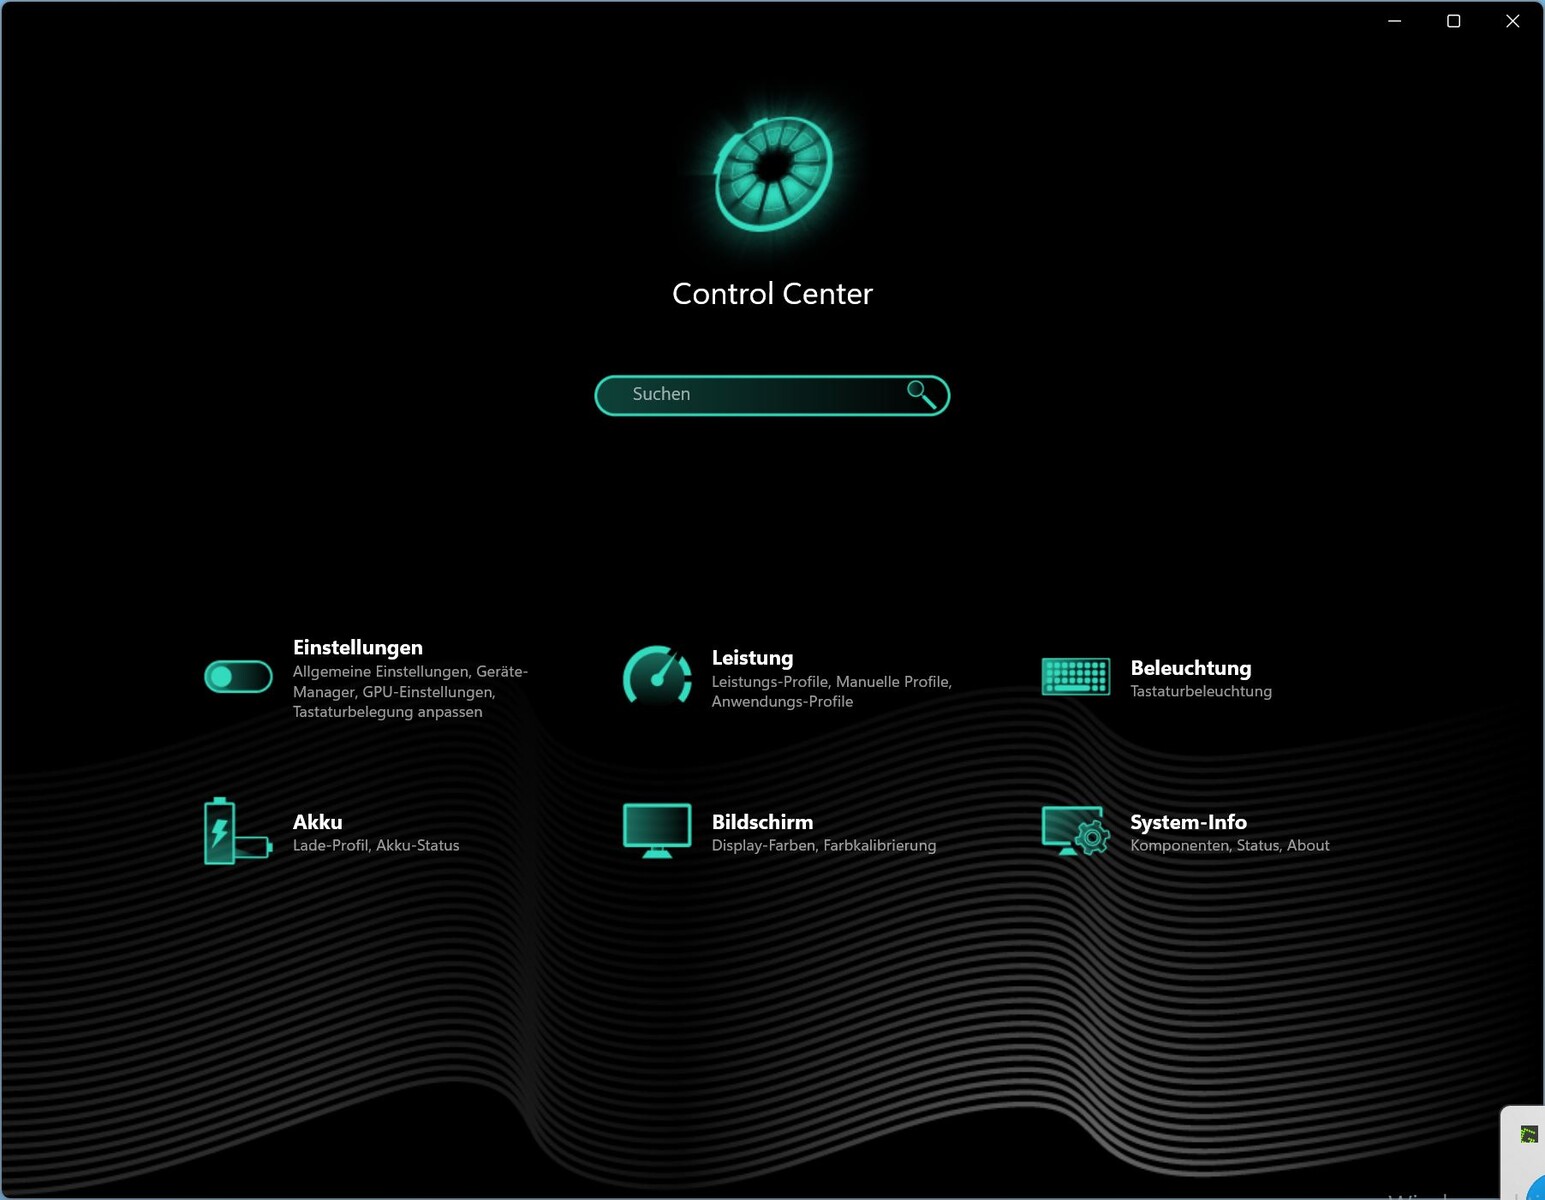
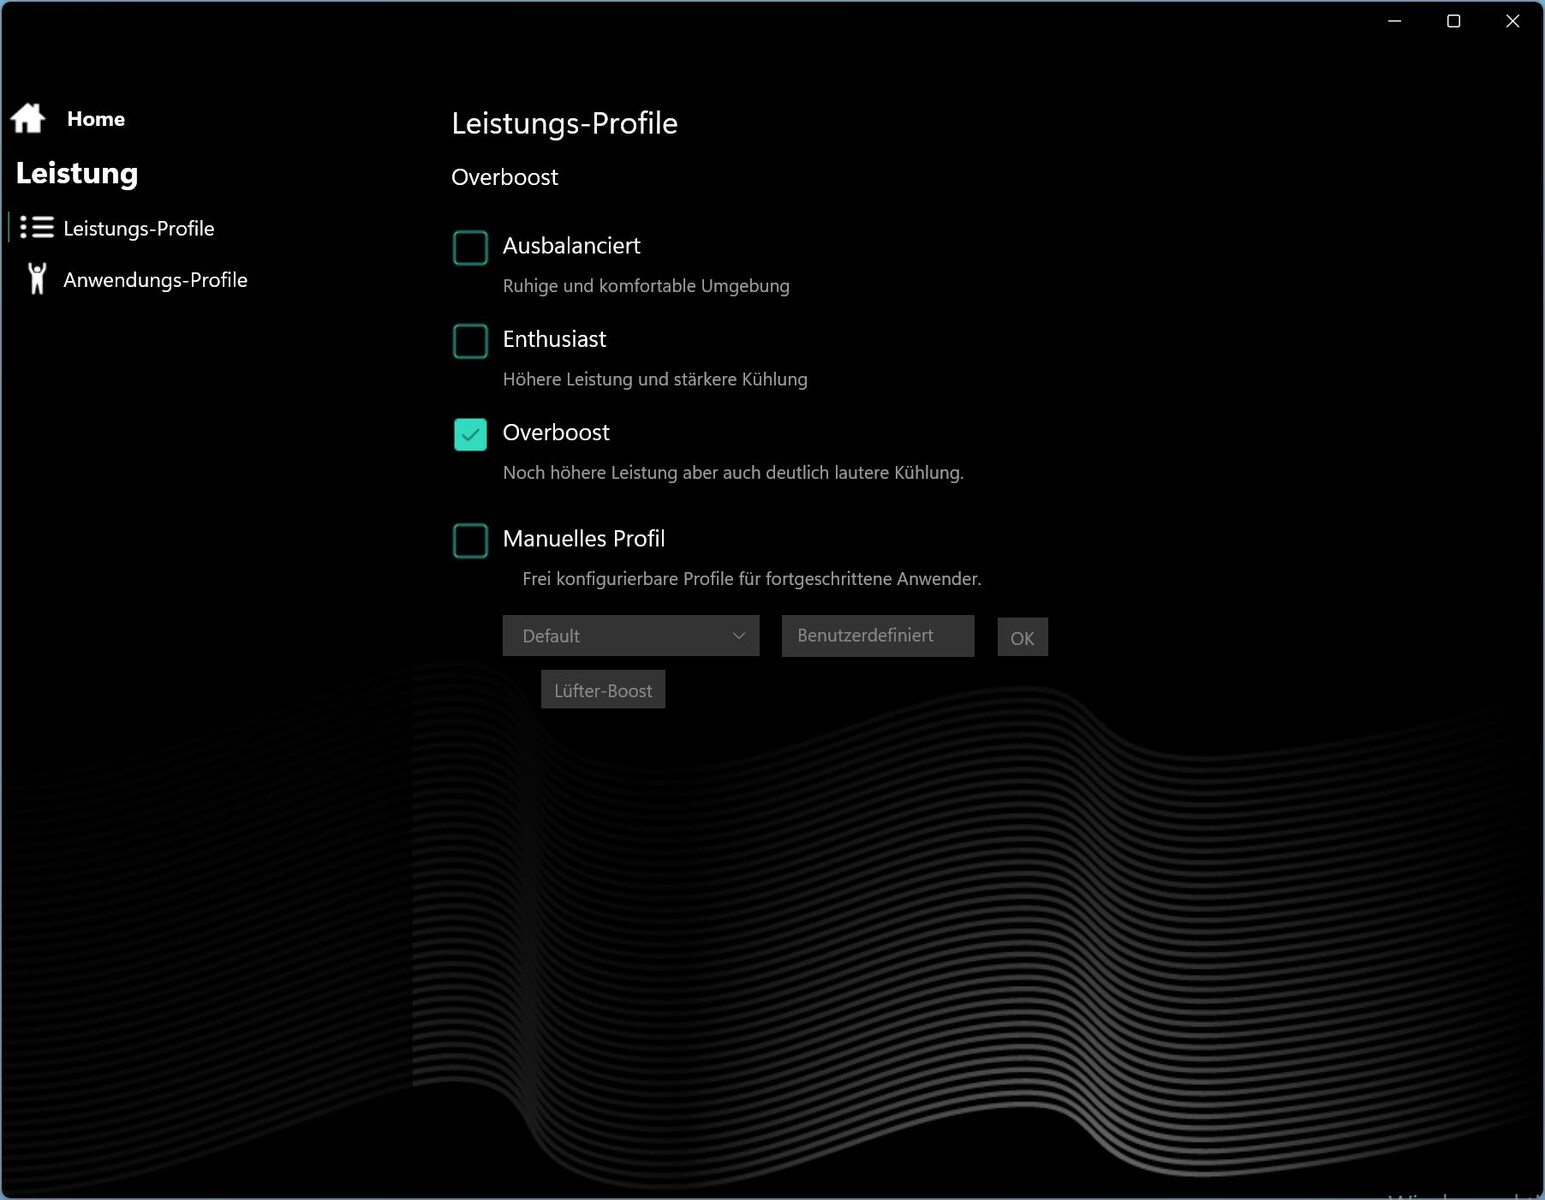
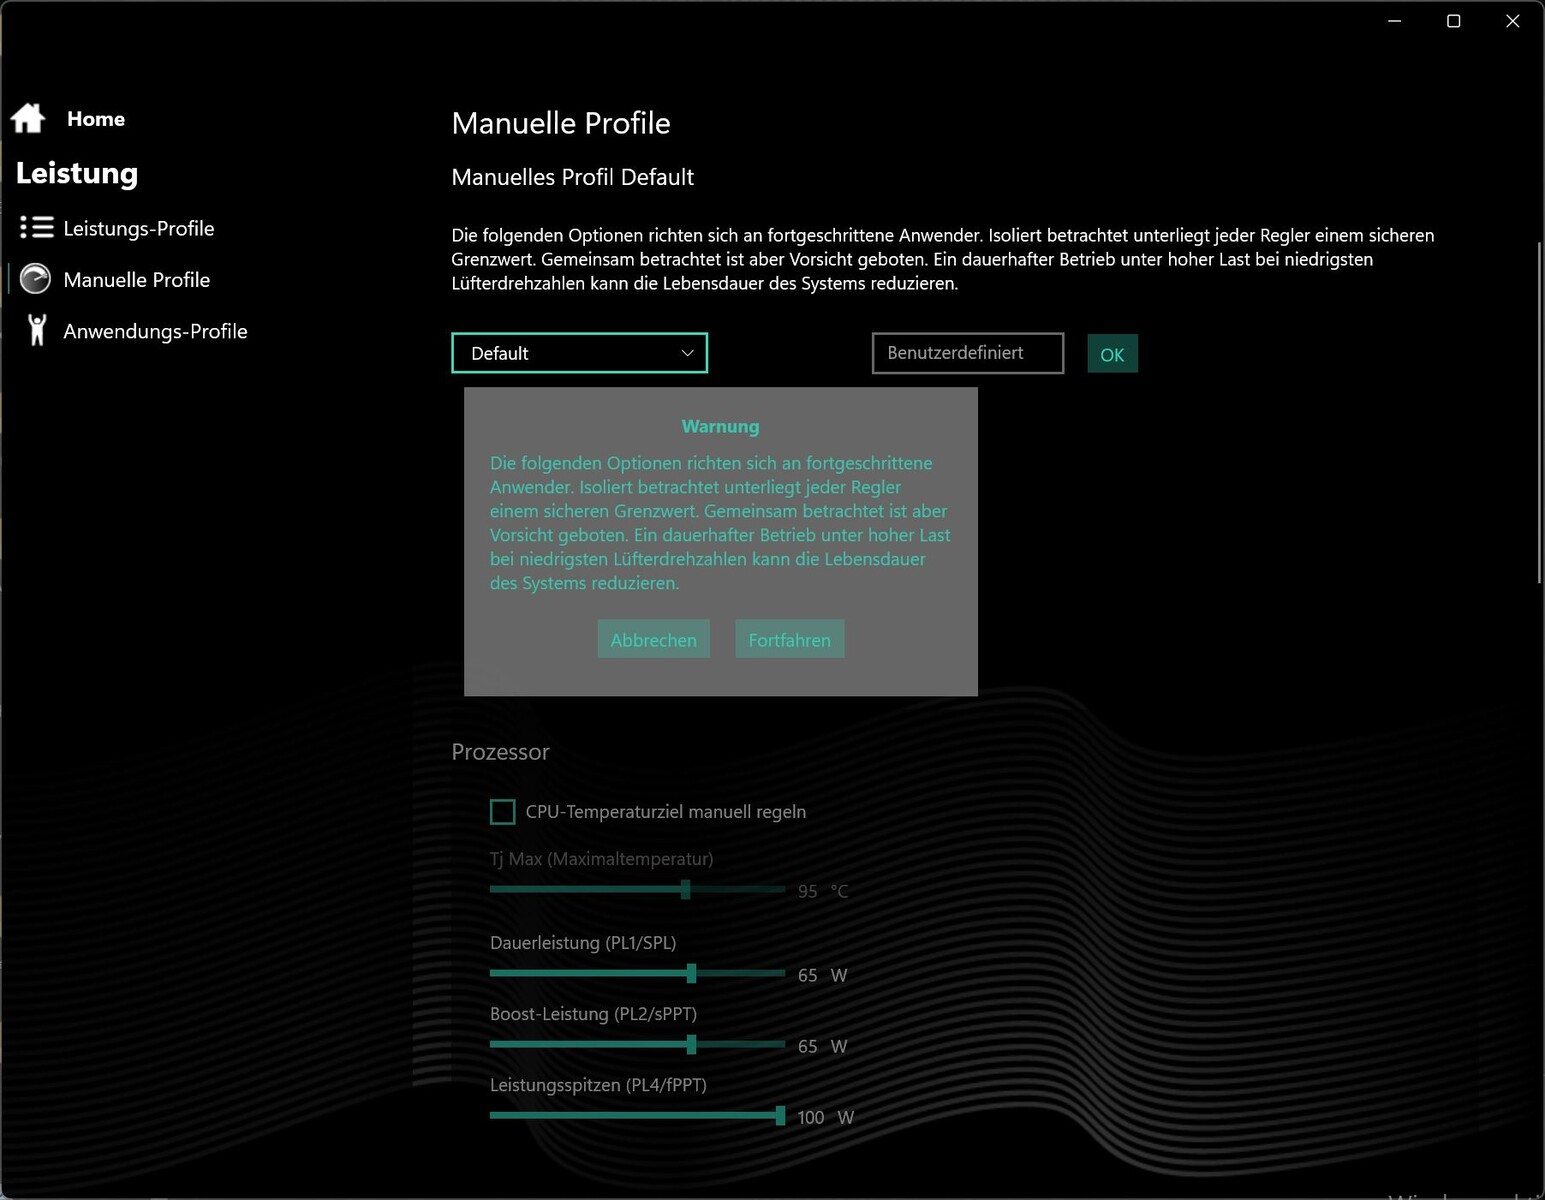
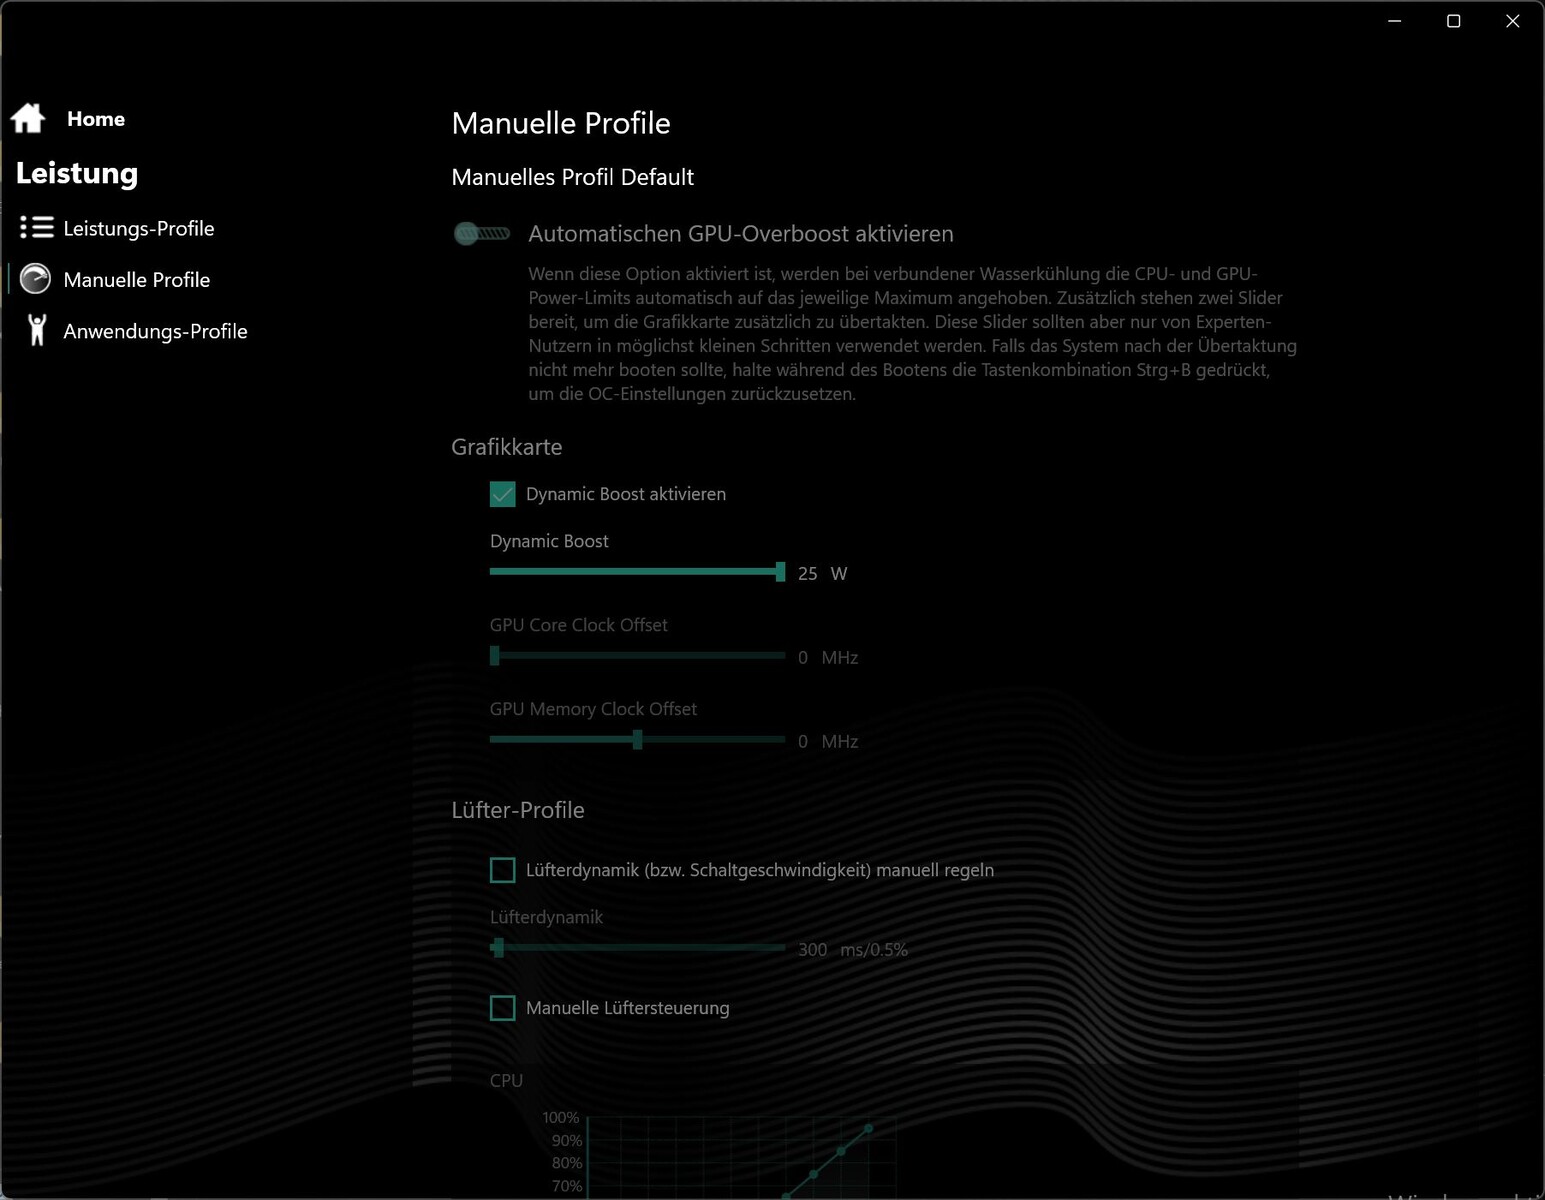
在通用控制中心 (Tulpar例如,Tulpar 使用相同的 CC)中,提供了 3 个预设性能配置文件(平衡、发烧、超增压)和一个手动配置文件。在后者中,可以激活风扇增压,并定义 CPU 目标温度、风扇曲线等。在通过 MUX 进行的常规设置下,GPU 可从混合型切换为 dGPU,随后需要重新启动。
在性能基准测试中,我们选择了超频模式,在电池测试中则使用了平衡模式。我们还提供了其他模式下的性能值。
处理器
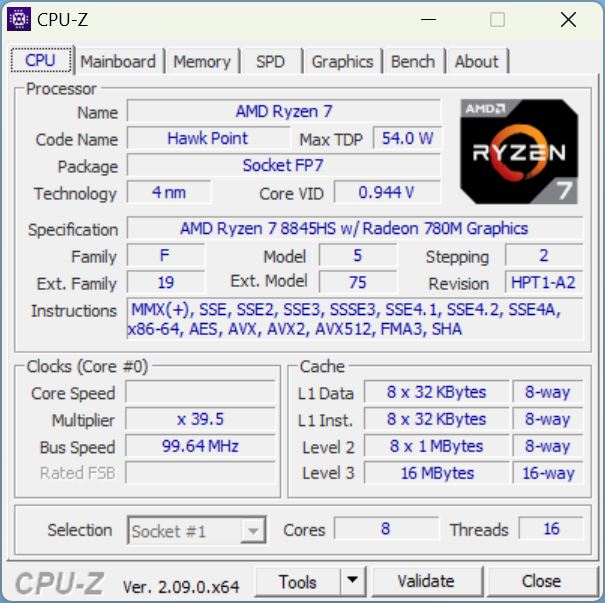
所有酷睿 15 SKU 均配备相同的处理器。处理器 AMD Ryzen 7 8845HS是采用 Zen 4 架构的鹰点系列中速度第二快的 CPU。它拥有 8 个内核和超线程技术,这意味着它可以同时处理 16 个线程。这些内核的基本时钟频率为 3.8 GHz,可单独超频至 5.1 GHz。
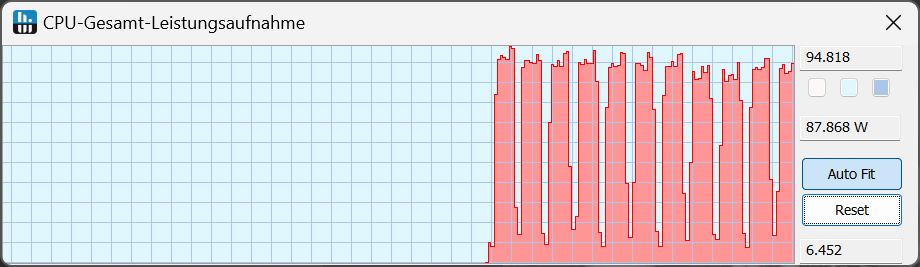
在 Cinebench R15 连续测试中,我们的 AMD Core 15 表现非常稳定,但主要低于配备英特尔 Gen14 HX CPU 的笔记本电脑。这其实并不奇怪,因为 AMD CPU 的最大功耗仅为短暂的 90 W,而较长时间的功耗为 80 W。只有戴尔 G16 在较好的起始性能后,耗电量低于 Ryzen 7 在酷睿中的稳定性能水平。
在所有 CPU 测试中,我们的 Ryzen 7 完全达到了目标。但遗憾的是,我们的酷睿再次排名最后,因为其英特尔 HX 竞争对手的性能更强一些。不过,与戴尔 G16 或惠普 Victus 16 的差距确实微乎其微。Legion 5i 或搭载英特尔处理器的 Fusion 15 优势明显。
在 Cinebench R15 多核测试中,离墙性能下降了约 35%。
| 性能配置文件/测量值 | Cinebench R15 首次运行得分 | CPU 功耗,单位 W |
|---|---|---|
| 超频 | 2,908 | 持续 80 - 94 |
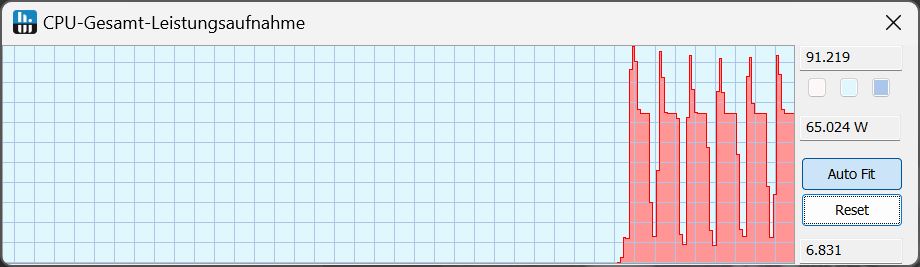
| 发烧级 | 2,749 | 短时间 90,然后 65 |
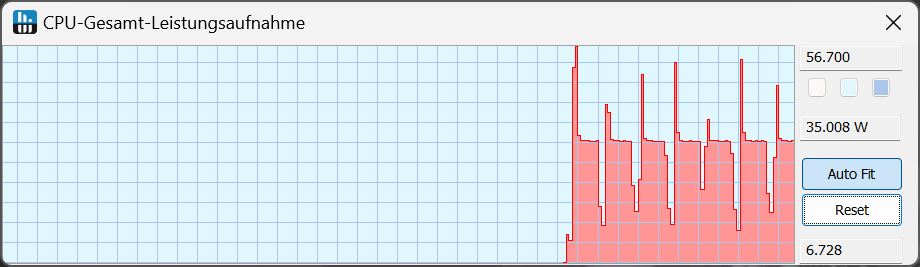
| 平衡型 | 2,277 | 短时间 59,然后 35 |
| 电池 | 1,909 | 短时间 30,然后 25 |
Cinebench R15 Multi Continuous Test
Cinebench R23: Multi Core | Single Core
Cinebench R20: CPU (Multi Core) | CPU (Single Core)
Cinebench R15: CPU Multi 64Bit | CPU Single 64Bit
Blender: v2.79 BMW27 CPU
7-Zip 18.03: 7z b 4 | 7z b 4 -mmt1
Geekbench 6.4: Multi-Core | Single-Core
Geekbench 5.5: Multi-Core | Single-Core
HWBOT x265 Benchmark v2.2: 4k Preset
LibreOffice : 20 Documents To PDF
R Benchmark 2.5: Overall mean
| CPU Performance Rating | |
| SCHENKER XMG Fusion 15 (Early 24) | |
| Lenovo Legion 5 16IRX G9 | |
| SCHENKER XMG Pro 15 (E23) -2! | |
| Average of class Gaming | |
| HP Victus 16 (2024) | |
| Dell G16, i7-13650HX, RTX 4060 | |
| SCHENKER XMG Core 15 (M24) | |
| Average AMD Ryzen 7 8845HS | |
| Cinebench R23 / Multi Core | |
| SCHENKER XMG Pro 15 (E23) | |
| Lenovo Legion 5 16IRX G9 | |
| HP Victus 16 (2024) | |
| SCHENKER XMG Fusion 15 (Early 24) | |
| Average of class Gaming (5668 - 39652, n=150, last 2 years) | |
| Dell G16, i7-13650HX, RTX 4060 | |
| SCHENKER XMG Core 15 (M24) | |
| Average AMD Ryzen 7 8845HS (14895 - 18037, n=12) | |
| Cinebench R23 / Single Core | |
| SCHENKER XMG Fusion 15 (Early 24) | |
| Lenovo Legion 5 16IRX G9 | |
| Dell G16, i7-13650HX, RTX 4060 | |
| Average of class Gaming (1136 - 2252, n=150, last 2 years) | |
| SCHENKER XMG Pro 15 (E23) | |
| SCHENKER XMG Core 15 (M24) | |
| Average AMD Ryzen 7 8845HS (1623 - 1783, n=12) | |
| HP Victus 16 (2024) | |
| Cinebench R20 / CPU (Multi Core) | |
| Lenovo Legion 5 16IRX G9 | |
| SCHENKER XMG Pro 15 (E23) | |
| HP Victus 16 (2024) | |
| SCHENKER XMG Fusion 15 (Early 24) | |
| Average of class Gaming (2179 - 15517, n=150, last 2 years) | |
| Dell G16, i7-13650HX, RTX 4060 | |
| SCHENKER XMG Core 15 (M24) | |
| Average AMD Ryzen 7 8845HS (5808 - 7026, n=12) | |
| Cinebench R20 / CPU (Single Core) | |
| SCHENKER XMG Fusion 15 (Early 24) | |
| Lenovo Legion 5 16IRX G9 | |
| Average of class Gaming (439 - 866, n=150, last 2 years) | |
| SCHENKER XMG Pro 15 (E23) | |
| Dell G16, i7-13650HX, RTX 4060 | |
| SCHENKER XMG Core 15 (M24) | |
| Average AMD Ryzen 7 8845HS (673 - 698, n=12) | |
| HP Victus 16 (2024) | |
| Cinebench R15 / CPU Multi 64Bit | |
| SCHENKER XMG Pro 15 (E23) | |
| HP Victus 16 (2024) | |
| Lenovo Legion 5 16IRX G9 | |
| SCHENKER XMG Fusion 15 (Early 24) | |
| Average of class Gaming (905 - 6074, n=154, last 2 years) | |
| Dell G16, i7-13650HX, RTX 4060 | |
| SCHENKER XMG Core 15 (M24) | |
| Average AMD Ryzen 7 8845HS (2342 - 2908, n=12) | |
| Cinebench R15 / CPU Single 64Bit | |
| Lenovo Legion 5 16IRX G9 | |
| SCHENKER XMG Fusion 15 (Early 24) | |
| SCHENKER XMG Core 15 (M24) | |
| Average of class Gaming (191.9 - 343, n=151, last 2 years) | |
| Average AMD Ryzen 7 8845HS (269 - 283, n=12) | |
| Dell G16, i7-13650HX, RTX 4060 | |
| SCHENKER XMG Pro 15 (E23) | |
| HP Victus 16 (2024) | |
| Blender / v2.79 BMW27 CPU | |
| Average AMD Ryzen 7 8845HS (179 - 216, n=12) | |
| SCHENKER XMG Core 15 (M24) | |
| Average of class Gaming (81 - 555, n=144, last 2 years) | |
| HP Victus 16 (2024) | |
| Dell G16, i7-13650HX, RTX 4060 | |
| SCHENKER XMG Pro 15 (E23) | |
| Lenovo Legion 5 16IRX G9 | |
| SCHENKER XMG Fusion 15 (Early 24) | |
| 7-Zip 18.03 / 7z b 4 | |
| SCHENKER XMG Fusion 15 (Early 24) | |
| Lenovo Legion 5 16IRX G9 | |
| SCHENKER XMG Pro 15 (E23) | |
| HP Victus 16 (2024) | |
| Average of class Gaming (23795 - 144064, n=149, last 2 years) | |
| Dell G16, i7-13650HX, RTX 4060 | |
| SCHENKER XMG Core 15 (M24) | |
| Average AMD Ryzen 7 8845HS (62669 - 74664, n=12) | |
| 7-Zip 18.03 / 7z b 4 -mmt1 | |
| SCHENKER XMG Fusion 15 (Early 24) | |
| Lenovo Legion 5 16IRX G9 | |
| SCHENKER XMG Core 15 (M24) | |
| SCHENKER XMG Pro 15 (E23) | |
| Average AMD Ryzen 7 8845HS (5197 - 6714, n=12) | |
| Average of class Gaming (4199 - 7573, n=149, last 2 years) | |
| Dell G16, i7-13650HX, RTX 4060 | |
| HP Victus 16 (2024) | |
| Geekbench 6.4 / Multi-Core | |
| SCHENKER XMG Fusion 15 (Early 24) | |
| Lenovo Legion 5 16IRX G9 | |
| HP Victus 16 (2024) | |
| Average of class Gaming (5340 - 21668, n=119, last 2 years) | |
| SCHENKER XMG Core 15 (M24) | |
| Dell G16, i7-13650HX, RTX 4060 | |
| Average AMD Ryzen 7 8845HS (11073 - 14014, n=16) | |
| Geekbench 6.4 / Single-Core | |
| SCHENKER XMG Fusion 15 (Early 24) | |
| Lenovo Legion 5 16IRX G9 | |
| SCHENKER XMG Core 15 (M24) | |
| Average of class Gaming (1490 - 3219, n=119, last 2 years) | |
| Average AMD Ryzen 7 8845HS (2510 - 2698, n=14) | |
| Dell G16, i7-13650HX, RTX 4060 | |
| HP Victus 16 (2024) | |
| Geekbench 5.5 / Multi-Core | |
| SCHENKER XMG Pro 15 (E23) | |
| SCHENKER XMG Fusion 15 (Early 24) | |
| Lenovo Legion 5 16IRX G9 | |
| HP Victus 16 (2024) | |
| Average of class Gaming (4557 - 25855, n=148, last 2 years) | |
| SCHENKER XMG Core 15 (M24) | |
| Dell G16, i7-13650HX, RTX 4060 | |
| Average AMD Ryzen 7 8845HS (11256 - 12726, n=13) | |
| Geekbench 5.5 / Single-Core | |
| SCHENKER XMG Fusion 15 (Early 24) | |
| SCHENKER XMG Core 15 (M24) | |
| Lenovo Legion 5 16IRX G9 | |
| Average AMD Ryzen 7 8845HS (1765 - 2004, n=13) | |
| Average of class Gaming (986 - 2423, n=148, last 2 years) | |
| Dell G16, i7-13650HX, RTX 4060 | |
| SCHENKER XMG Pro 15 (E23) | |
| HP Victus 16 (2024) | |
| HWBOT x265 Benchmark v2.2 / 4k Preset | |
| Lenovo Legion 5 16IRX G9 | |
| SCHENKER XMG Fusion 15 (Early 24) | |
| SCHENKER XMG Pro 15 (E23) | |
| Average of class Gaming (6.72 - 42.9, n=148, last 2 years) | |
| SCHENKER XMG Core 15 (M24) | |
| HP Victus 16 (2024) | |
| Dell G16, i7-13650HX, RTX 4060 | |
| Average AMD Ryzen 7 8845HS (18.6 - 22.7, n=12) | |
| LibreOffice / 20 Documents To PDF | |
| HP Victus 16 (2024) | |
| Dell G16, i7-13650HX, RTX 4060 | |
| SCHENKER XMG Pro 15 (E23) | |
| Average AMD Ryzen 7 8845HS (44.4 - 77, n=12) | |
| SCHENKER XMG Core 15 (M24) | |
| Average of class Gaming (19 - 96.6, n=147, last 2 years) | |
| Lenovo Legion 5 16IRX G9 | |
| SCHENKER XMG Fusion 15 (Early 24) | |
| R Benchmark 2.5 / Overall mean | |
| HP Victus 16 (2024) | |
| SCHENKER XMG Pro 15 (E23) | |
| Average AMD Ryzen 7 8845HS (0.4304 - 0.4935, n=12) | |
| Average of class Gaming (0.3609 - 0.759, n=150, last 2 years) | |
| SCHENKER XMG Core 15 (M24) | |
| Dell G16, i7-13650HX, RTX 4060 | |
| Dell G16, i7-13650HX, RTX 4060 | |
| Lenovo Legion 5 16IRX G9 | |
| SCHENKER XMG Fusion 15 (Early 24) | |
* ... smaller is better
AIDA64: FP32 Ray-Trace | FPU Julia | CPU SHA3 | CPU Queen | FPU SinJulia | FPU Mandel | CPU AES | CPU ZLib | FP64 Ray-Trace | CPU PhotoWorxx
| Performance Rating | |
| SCHENKER XMG Fusion 15 (Early 24) | |
| SCHENKER XMG Core 15 (M24) | |
| Average AMD Ryzen 7 8845HS | |
| Average of class Gaming | |
| SCHENKER XMG Pro 15 (E23) | |
| Lenovo Legion 5 16IRX G9 | |
| Dell G16, i7-13650HX, RTX 4060 | |
| HP Victus 16 (2024) | |
| AIDA64 / FP32 Ray-Trace | |
| SCHENKER XMG Core 15 (M24) | |
| Average AMD Ryzen 7 8845HS (23708 - 29544, n=12) | |
| Average of class Gaming (4986 - 81639, n=147, last 2 years) | |
| SCHENKER XMG Fusion 15 (Early 24) | |
| Lenovo Legion 5 16IRX G9 | |
| Dell G16, i7-13650HX, RTX 4060 | |
| SCHENKER XMG Pro 15 (E23) | |
| HP Victus 16 (2024) | |
| AIDA64 / FPU Julia | |
| SCHENKER XMG Core 15 (M24) | |
| Average AMD Ryzen 7 8845HS (99659 - 125873, n=12) | |
| Average of class Gaming (25360 - 252486, n=147, last 2 years) | |
| SCHENKER XMG Fusion 15 (Early 24) | |
| SCHENKER XMG Pro 15 (E23) | |
| Lenovo Legion 5 16IRX G9 | |
| Dell G16, i7-13650HX, RTX 4060 | |
| HP Victus 16 (2024) | |
| AIDA64 / CPU SHA3 | |
| SCHENKER XMG Fusion 15 (Early 24) | |
| SCHENKER XMG Core 15 (M24) | |
| Average of class Gaming (1339 - 10389, n=147, last 2 years) | |
| SCHENKER XMG Pro 15 (E23) | |
| Average AMD Ryzen 7 8845HS (4332 - 5180, n=12) | |
| Dell G16, i7-13650HX, RTX 4060 | |
| Lenovo Legion 5 16IRX G9 | |
| HP Victus 16 (2024) | |
| AIDA64 / CPU Queen | |
| SCHENKER XMG Pro 15 (E23) | |
| SCHENKER XMG Fusion 15 (Early 24) | |
| HP Victus 16 (2024) | |
| SCHENKER XMG Core 15 (M24) | |
| Average AMD Ryzen 7 8845HS (109458 - 124695, n=12) | |
| Average of class Gaming (50699 - 200651, n=147, last 2 years) | |
| Dell G16, i7-13650HX, RTX 4060 | |
| Lenovo Legion 5 16IRX G9 | |
| AIDA64 / FPU SinJulia | |
| SCHENKER XMG Core 15 (M24) | |
| Average AMD Ryzen 7 8845HS (14062 - 15519, n=12) | |
| SCHENKER XMG Fusion 15 (Early 24) | |
| Average of class Gaming (4800 - 32988, n=147, last 2 years) | |
| SCHENKER XMG Pro 15 (E23) | |
| Lenovo Legion 5 16IRX G9 | |
| HP Victus 16 (2024) | |
| Dell G16, i7-13650HX, RTX 4060 | |
| AIDA64 / FPU Mandel | |
| SCHENKER XMG Core 15 (M24) | |
| Average AMD Ryzen 7 8845HS (53436 - 67367, n=12) | |
| Average of class Gaming (12321 - 134044, n=147, last 2 years) | |
| SCHENKER XMG Fusion 15 (Early 24) | |
| Lenovo Legion 5 16IRX G9 | |
| Dell G16, i7-13650HX, RTX 4060 | |
| SCHENKER XMG Pro 15 (E23) | |
| HP Victus 16 (2024) | |
| AIDA64 / CPU AES | |
| SCHENKER XMG Fusion 15 (Early 24) | |
| Average of class Gaming (19065 - 328679, n=147, last 2 years) | |
| Average AMD Ryzen 7 8845HS (64515 - 172642, n=12) | |
| SCHENKER XMG Pro 15 (E23) | |
| SCHENKER XMG Core 15 (M24) | |
| Lenovo Legion 5 16IRX G9 | |
| Dell G16, i7-13650HX, RTX 4060 | |
| HP Victus 16 (2024) | |
| AIDA64 / CPU ZLib | |
| SCHENKER XMG Fusion 15 (Early 24) | |
| SCHENKER XMG Pro 15 (E23) | |
| Average of class Gaming (373 - 2531, n=147, last 2 years) | |
| Lenovo Legion 5 16IRX G9 | |
| Dell G16, i7-13650HX, RTX 4060 | |
| HP Victus 16 (2024) | |
| Average AMD Ryzen 7 8845HS (627 - 1080, n=12) | |
| SCHENKER XMG Core 15 (M24) | |
| AIDA64 / FP64 Ray-Trace | |
| SCHENKER XMG Core 15 (M24) | |
| Average AMD Ryzen 7 8845HS (12361 - 15911, n=12) | |
| Average of class Gaming (2540 - 43430, n=147, last 2 years) | |
| SCHENKER XMG Fusion 15 (Early 24) | |
| Dell G16, i7-13650HX, RTX 4060 | |
| Lenovo Legion 5 16IRX G9 | |
| SCHENKER XMG Pro 15 (E23) | |
| HP Victus 16 (2024) | |
| AIDA64 / CPU PhotoWorxx | |
| SCHENKER XMG Pro 15 (E23) | |
| SCHENKER XMG Fusion 15 (Early 24) | |
| SCHENKER XMG Core 15 (M24) | |
| Average of class Gaming (10805 - 60161, n=147, last 2 years) | |
| HP Victus 16 (2024) | |
| Average AMD Ryzen 7 8845HS (33192 - 41668, n=12) | |
| Dell G16, i7-13650HX, RTX 4060 | |
| Lenovo Legion 5 16IRX G9 | |
系统性能
虽然我们的评测系统在纯 CPU 分数上稍有落后,但在 PCMark 10 分数上却领先于 HX 竞争对手。在基本功能方面,它的得分处于中等水平,但在工作效率方面,它却遥遥领先,在内容创建方面更是名列前茅。
在 CrossMark 中,戴尔 G16 稍逊一筹,其他竞争对手稍稍领先于我们的 AMD Core 15。
CrossMark: Overall | Productivity | Creativity | Responsiveness
WebXPRT 3: Overall
WebXPRT 4: Overall
Mozilla Kraken 1.1: Total
| PCMark 10 / Score | |
| SCHENKER XMG Core 15 (M24) | |
| SCHENKER XMG Fusion 15 (Early 24) | |
| Average AMD Ryzen 7 8845HS, NVIDIA GeForce RTX 4060 Laptop GPU (7538 - 8822, n=2) | |
| Average of class Gaming (5776 - 9852, n=133, last 2 years) | |
| Lenovo Legion 5 16IRX G9 | |
| HP Victus 16 (2024) | |
| SCHENKER XMG Pro 15 (E23) | |
| Dell G16, i7-13650HX, RTX 4060 | |
| PCMark 10 / Essentials | |
| SCHENKER XMG Fusion 15 (Early 24) | |
| SCHENKER XMG Pro 15 (E23) | |
| Lenovo Legion 5 16IRX G9 | |
| HP Victus 16 (2024) | |
| Average of class Gaming (9057 - 12600, n=133, last 2 years) | |
| SCHENKER XMG Core 15 (M24) | |
| Average AMD Ryzen 7 8845HS, NVIDIA GeForce RTX 4060 Laptop GPU (9936 - 10061, n=2) | |
| Dell G16, i7-13650HX, RTX 4060 | |
| PCMark 10 / Productivity | |
| SCHENKER XMG Core 15 (M24) | |
| Average AMD Ryzen 7 8845HS, NVIDIA GeForce RTX 4060 Laptop GPU (9789 - 14612, n=2) | |
| SCHENKER XMG Fusion 15 (Early 24) | |
| SCHENKER XMG Pro 15 (E23) | |
| Dell G16, i7-13650HX, RTX 4060 | |
| HP Victus 16 (2024) | |
| Average of class Gaming (6662 - 14612, n=133, last 2 years) | |
| Lenovo Legion 5 16IRX G9 | |
| PCMark 10 / Digital Content Creation | |
| SCHENKER XMG Fusion 15 (Early 24) | |
| SCHENKER XMG Core 15 (M24) | |
| Average of class Gaming (6807 - 18475, n=133, last 2 years) | |
| Average AMD Ryzen 7 8845HS, NVIDIA GeForce RTX 4060 Laptop GPU (11953 - 12674, n=2) | |
| Lenovo Legion 5 16IRX G9 | |
| Dell G16, i7-13650HX, RTX 4060 | |
| HP Victus 16 (2024) | |
| SCHENKER XMG Pro 15 (E23) | |
| CrossMark / Overall | |
| SCHENKER XMG Fusion 15 (Early 24) | |
| Lenovo Legion 5 16IRX G9 | |
| SCHENKER XMG Pro 15 (E23) | |
| HP Victus 16 (2024) | |
| Average of class Gaming (1247 - 2344, n=114, last 2 years) | |
| SCHENKER XMG Core 15 (M24) | |
| Average AMD Ryzen 7 8845HS, NVIDIA GeForce RTX 4060 Laptop GPU (n=1) | |
| Dell G16, i7-13650HX, RTX 4060 | |
| CrossMark / Productivity | |
| SCHENKER XMG Fusion 15 (Early 24) | |
| Lenovo Legion 5 16IRX G9 | |
| SCHENKER XMG Pro 15 (E23) | |
| Average of class Gaming (1299 - 2204, n=114, last 2 years) | |
| SCHENKER XMG Core 15 (M24) | |
| Average AMD Ryzen 7 8845HS, NVIDIA GeForce RTX 4060 Laptop GPU (n=1) | |
| HP Victus 16 (2024) | |
| Dell G16, i7-13650HX, RTX 4060 | |
| CrossMark / Creativity | |
| SCHENKER XMG Fusion 15 (Early 24) | |
| Lenovo Legion 5 16IRX G9 | |
| SCHENKER XMG Pro 15 (E23) | |
| HP Victus 16 (2024) | |
| SCHENKER XMG Core 15 (M24) | |
| Average AMD Ryzen 7 8845HS, NVIDIA GeForce RTX 4060 Laptop GPU (n=1) | |
| Average of class Gaming (1275 - 2660, n=114, last 2 years) | |
| Dell G16, i7-13650HX, RTX 4060 | |
| CrossMark / Responsiveness | |
| SCHENKER XMG Fusion 15 (Early 24) | |
| Lenovo Legion 5 16IRX G9 | |
| HP Victus 16 (2024) | |
| SCHENKER XMG Pro 15 (E23) | |
| Average of class Gaming (1030 - 2330, n=114, last 2 years) | |
| Dell G16, i7-13650HX, RTX 4060 | |
| SCHENKER XMG Core 15 (M24) | |
| Average AMD Ryzen 7 8845HS, NVIDIA GeForce RTX 4060 Laptop GPU (n=1) | |
| WebXPRT 3 / Overall | |
| SCHENKER XMG Fusion 15 (Early 24) | |
| SCHENKER XMG Pro 15 (E23) | |
| Lenovo Legion 5 16IRX G9 | |
| SCHENKER XMG Core 15 (M24) | |
| Average AMD Ryzen 7 8845HS, NVIDIA GeForce RTX 4060 Laptop GPU (305 - 305, n=2) | |
| Average of class Gaming (215 - 480, n=127, last 2 years) | |
| HP Victus 16 (2024) | |
| Dell G16, i7-13650HX, RTX 4060 | |
| WebXPRT 4 / Overall | |
| SCHENKER XMG Fusion 15 (Early 24) | |
| Lenovo Legion 5 16IRX G9 | |
| SCHENKER XMG Pro 15 (E23) | |
| Average of class Gaming (176.4 - 335, n=115, last 2 years) | |
| SCHENKER XMG Core 15 (M24) | |
| HP Victus 16 (2024) | |
| Average AMD Ryzen 7 8845HS, NVIDIA GeForce RTX 4060 Laptop GPU (176.4 - 264, n=2) | |
| Mozilla Kraken 1.1 / Total | |
| HP Victus 16 (2024) | |
| SCHENKER XMG Pro 15 (E23) | |
| Average AMD Ryzen 7 8845HS, NVIDIA GeForce RTX 4060 Laptop GPU (496 - 523, n=2) | |
| Dell G16, i7-13650HX, RTX 4060 | |
| Average of class Gaming (409 - 674, n=139, last 2 years) | |
| SCHENKER XMG Core 15 (M24) | |
| Lenovo Legion 5 16IRX G9 | |
| SCHENKER XMG Fusion 15 (Early 24) | |
* ... smaller is better
| PCMark 10 Score | 8822 points | |
Help | ||
| AIDA64 / Memory Copy | |
| SCHENKER XMG Fusion 15 (Early 24) | |
| SCHENKER XMG Pro 15 (E23) | |
| SCHENKER XMG Core 15 (M24) | |
| Average AMD Ryzen 7 8845HS (61459 - 71873, n=12) | |
| HP Victus 16 (2024) | |
| Average of class Gaming (21750 - 97515, n=147, last 2 years) | |
| Lenovo Legion 5 16IRX G9 | |
| Dell G16, i7-13650HX, RTX 4060 | |
| AIDA64 / Memory Read | |
| SCHENKER XMG Fusion 15 (Early 24) | |
| SCHENKER XMG Pro 15 (E23) | |
| HP Victus 16 (2024) | |
| Lenovo Legion 5 16IRX G9 | |
| Average of class Gaming (22956 - 102937, n=147, last 2 years) | |
| Dell G16, i7-13650HX, RTX 4060 | |
| SCHENKER XMG Core 15 (M24) | |
| Average AMD Ryzen 7 8845HS (49866 - 61976, n=12) | |
| AIDA64 / Memory Write | |
| SCHENKER XMG Core 15 (M24) | |
| Average AMD Ryzen 7 8845HS (68425 - 93239, n=12) | |
| SCHENKER XMG Pro 15 (E23) | |
| SCHENKER XMG Fusion 15 (Early 24) | |
| Average of class Gaming (22297 - 108954, n=147, last 2 years) | |
| HP Victus 16 (2024) | |
| Dell G16, i7-13650HX, RTX 4060 | |
| Lenovo Legion 5 16IRX G9 | |
| AIDA64 / Memory Latency | |
| Average AMD Ryzen 7 8845HS (82.5 - 117, n=12) | |
| HP Victus 16 (2024) | |
| Average of class Gaming (59.5 - 259, n=147, last 2 years) | |
| Dell G16, i7-13650HX, RTX 4060 | |
| Lenovo Legion 5 16IRX G9 | |
| SCHENKER XMG Core 15 (M24) | |
| SCHENKER XMG Pro 15 (E23) | |
| SCHENKER XMG Fusion 15 (Early 24) | |
* ... smaller is better
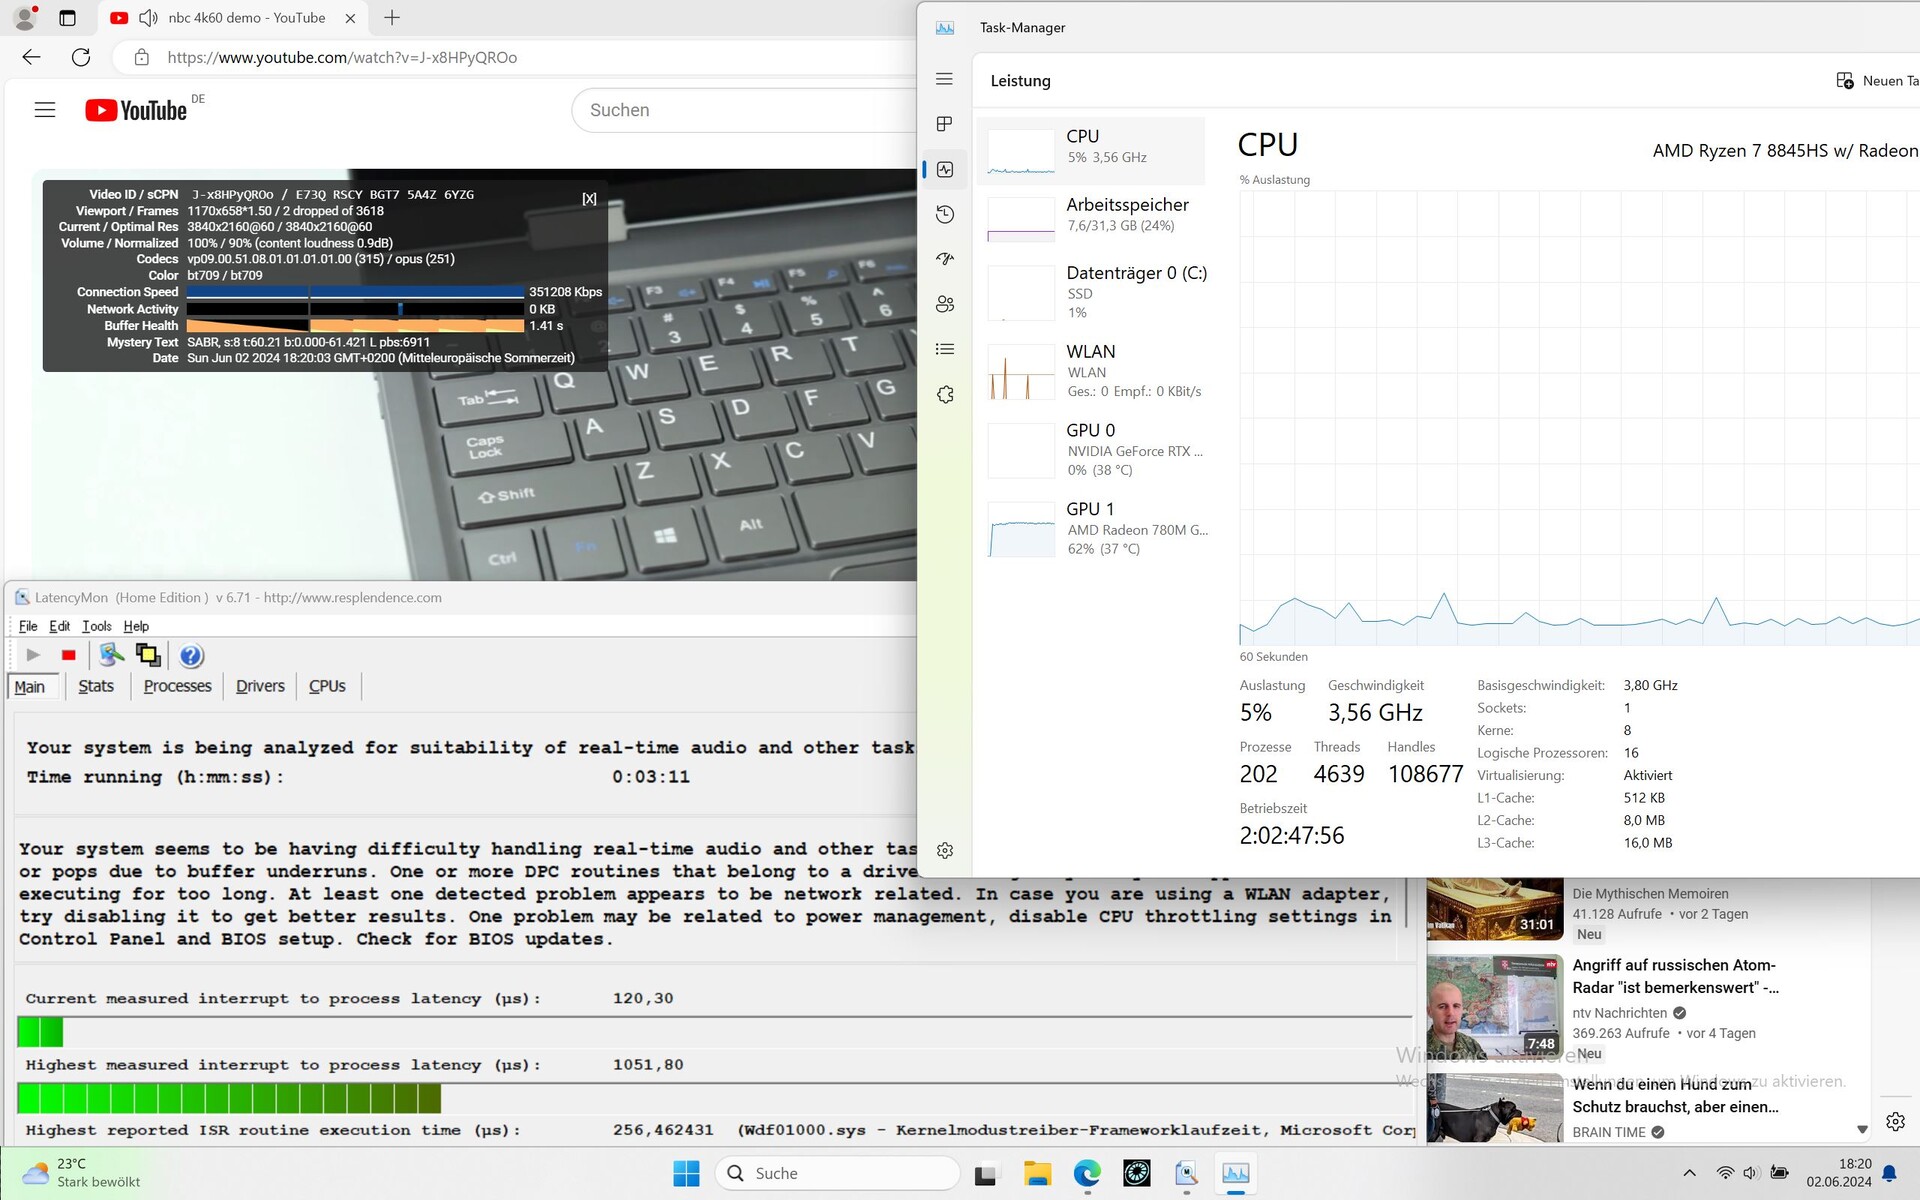
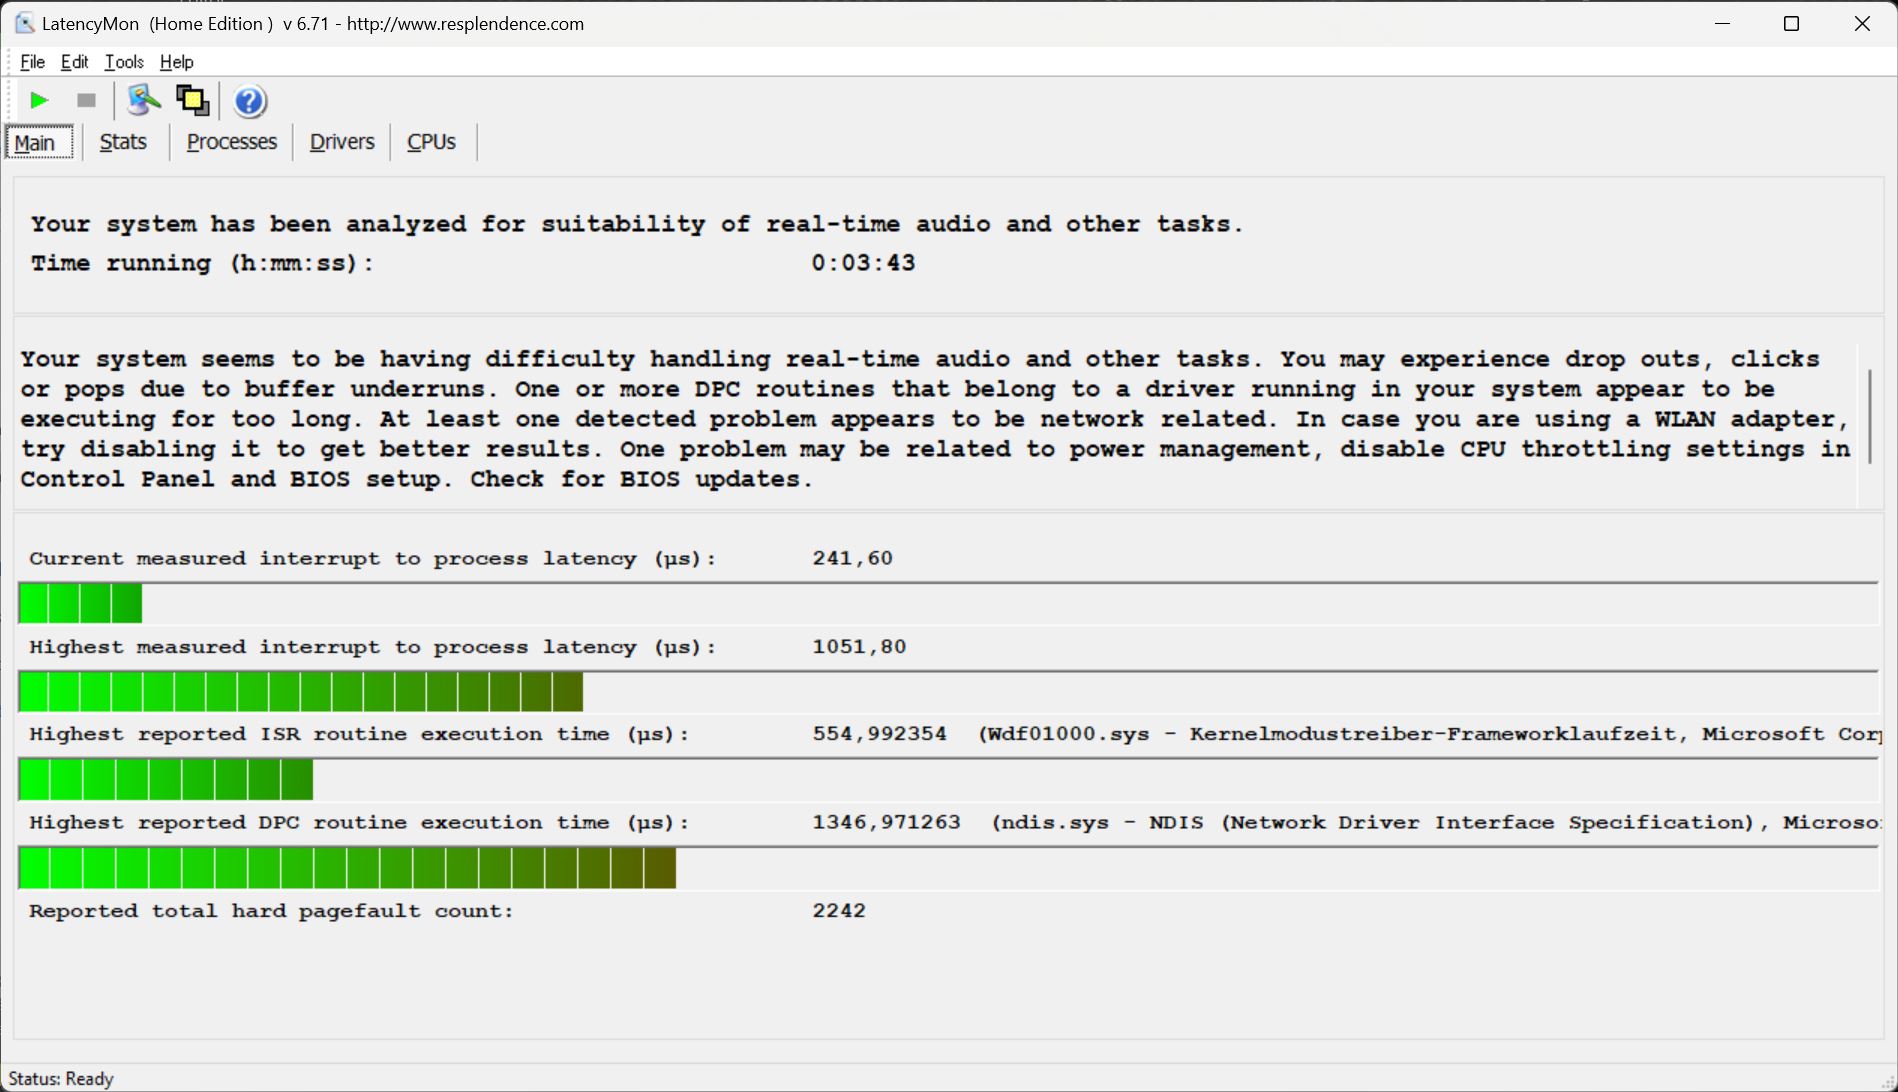
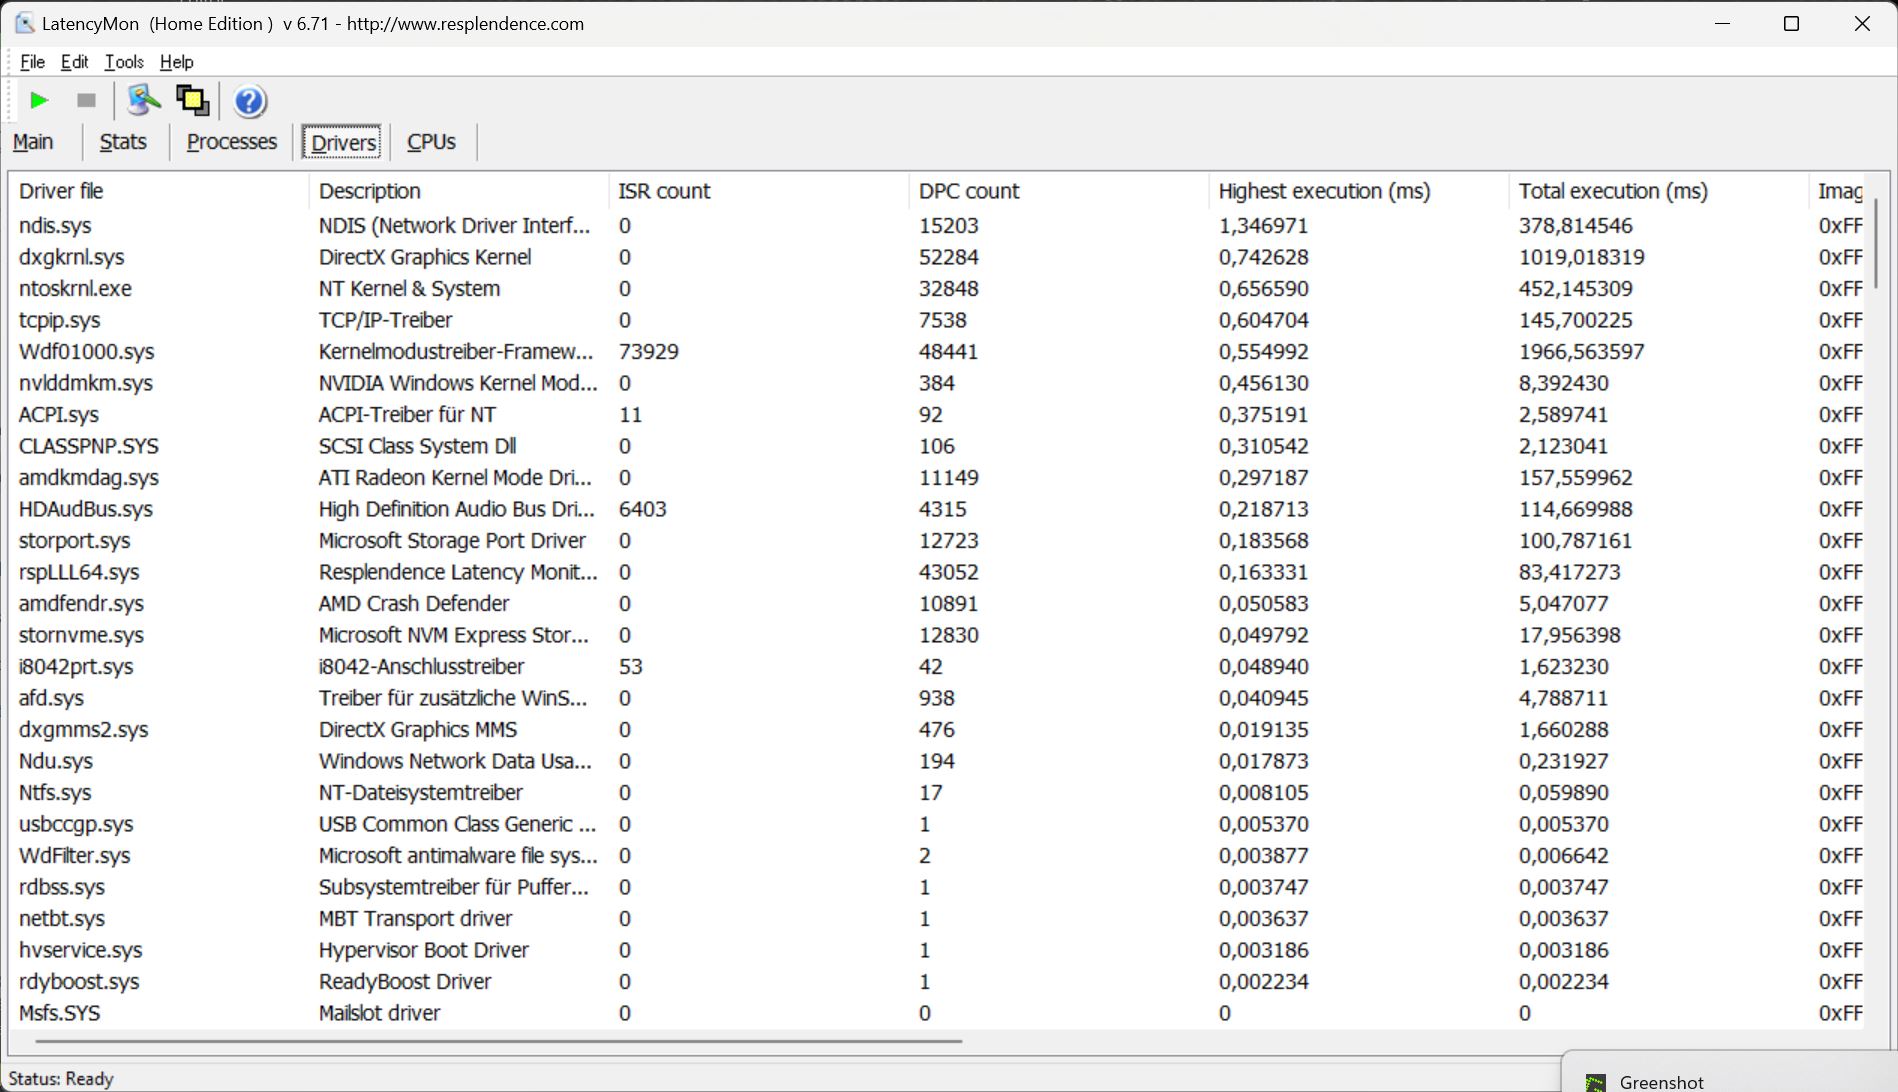
DPC 延迟
打开浏览器时,延迟极小,还不会造成任何问题。当打开多个浏览器标签页时,延迟值会有所增加。在播放 4K/60fps YouTube 视频时也是如此,内部 GPU 的负载率为 62%,似乎相当高。结果是出现了两次掉帧,并在延迟排名中名列第二。
| DPC Latencies / LatencyMon - interrupt to process latency (max), Web, Youtube, Prime95 | |
| Lenovo Legion 5 16IRX G9 | |
| SCHENKER XMG Core 15 (M24) | |
| Dell G16, i7-13650HX, RTX 4060 | |
| SCHENKER XMG Pro 15 (E23) | |
| HP Victus 16 (2024) | |
| SCHENKER XMG Fusion 15 (Early 24) | |
* ... smaller is better
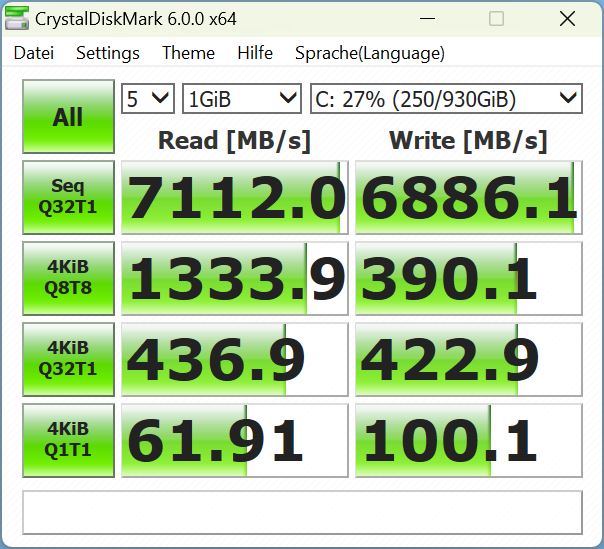
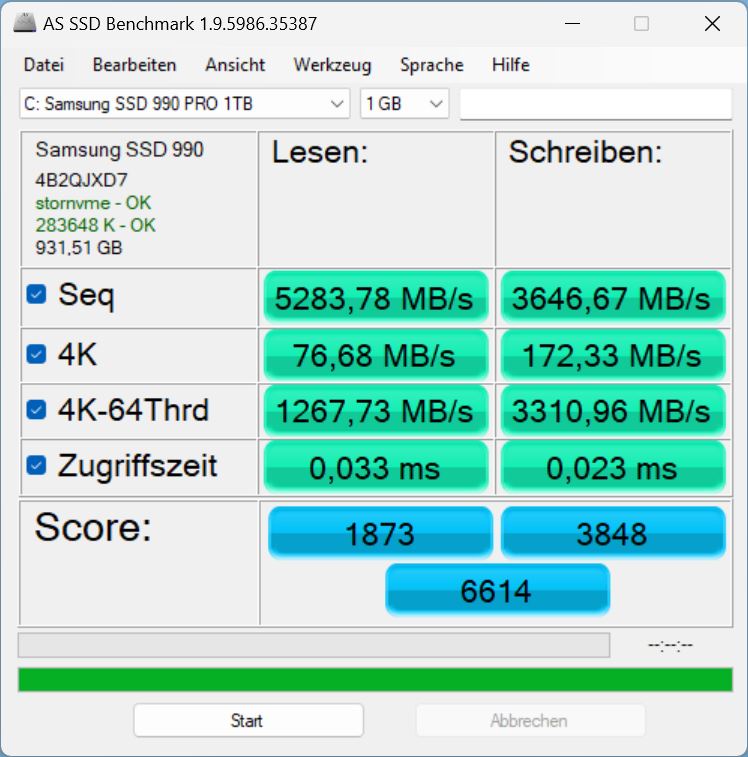
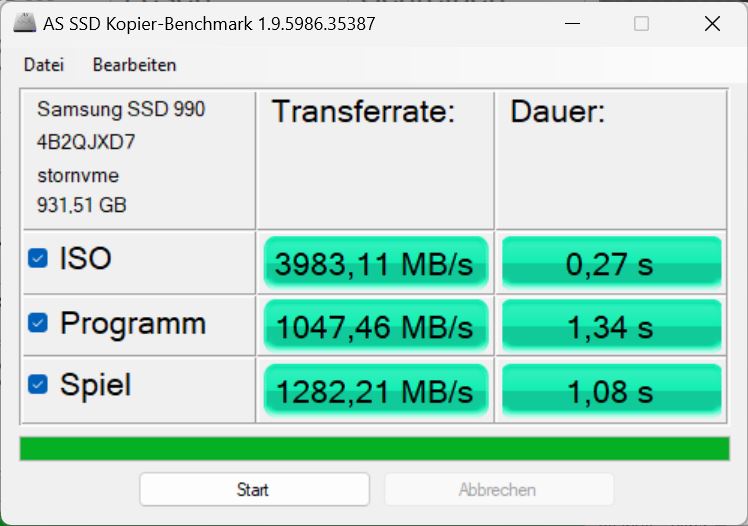
大容量存储器
在我们的评测机型中,申克为其配备了速度极快的三星 990 Pro,存储容量为 1 TB,Core 15 可以配备六家不同公司的固态硬盘,包括该制造商的各种型号。
根据所使用的测试软件(CrystalDiskMark 6、AS SSD、Disksdp),固态硬盘的性能有好有坏,但总的来说,990 Pro 仍是一款速度极快的 PCIe 4.0 NVMe 固态硬盘,在我们的评测机型上运行 Diskspd 循环时,它也表现出了非常稳定的高性能。

* ... smaller is better
Continuous Performance Read: DiskSpd Read Loop, Queue Depth 8
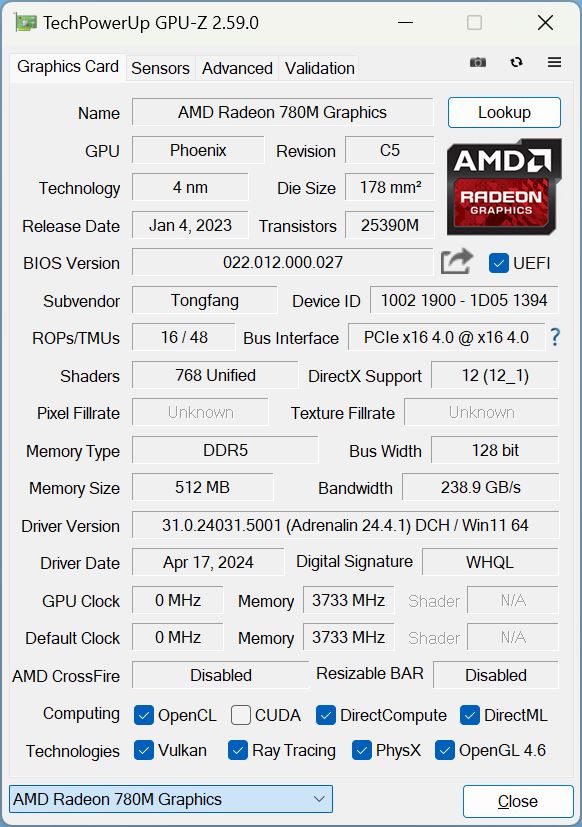
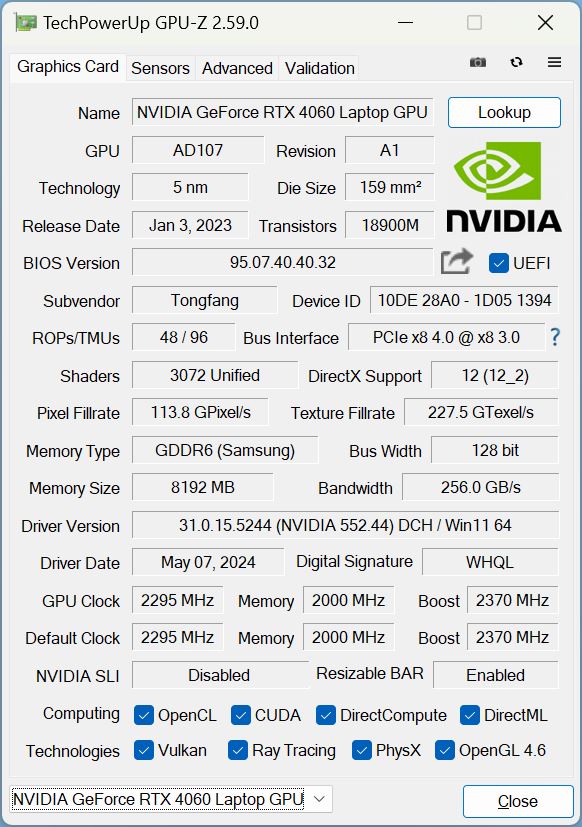
图形卡
一个 Nvidia Geforce RTX 4060作为 GPU,不过,只需额外支付 200 美元,酷睿 15 还可配备 RTX 4070如 Fusion 15 中的那款。
在 3DMark 测试中,Core 15 的表现异常出色。在所有测试中,即使是配备了 RTX 4070 的 Fusion 也只有 8% 的优势,而酷睿 15 则紧随其后,排在基于 4060 的竞争对手前面,位列第二。
游戏性能并不像 3DMark 的结果那么好,但这完全与 CPU 密集型游戏有关,如《DOTA 2 Reborn》或《X-Plane》。抛开这些游戏不谈,在 CPU 密集型游戏方面,酷睿 15 与最好的 RTX 4060 比较设备不相上下。后者以 60fps 以上的速度运行全高清下的所有游戏,甚至在原生 QHD 分辨率下也没有出现任何问题,尽管《赛博朋克 2077》等游戏偶尔会低于 60fps 大关。
Witcher 3 图表显示,在游戏通常的昼夜节奏下,一个多小时的性能非常稳定。在这方面,其性能也与 RTX 4060 竞争产品处于同一水平。下表显示了与各种性能配置文件相关的分数,唯一不一致的是平衡模式。在最初的几分钟里,它显示出与发烧友模式相同的性能,帧率和耗电量随后短暂下降,仅能保持在电池模式下的水平。
在电池模式下,Fire Strike ,3D 性能下降了约 39%。
| 性能曲线/值 | Witcher 3 FPS (开始 - 5 分钟后) | GPU 速度 | GPU 功耗 | 容量 | 消耗量 |
|---|---|---|---|---|---|
| 超频 | 103 - 101 | 2,720 MHz | 108.5 W | 50.96 dB | 167 W |
| 发烧级 | 97 - 92 | 2,640 MHz | 102.7 | 49 dB | 156 W |
| 平衡型 | 97 - 65 | 1,880 MHz | 47.86 W | 最初为 39.75,几分钟后达到一致的 31 dB | 最初为 154,然后为 67 W |
| 3DMark 11 Performance | 34005 points | |
| 3DMark Cloud Gate Standard Score | 69309 points | |
| 3DMark Fire Strike Score | 26988 points | |
| 3DMark Time Spy Score | 11597 points | |
Help | ||
* ... smaller is better
| The Witcher 3 - 1920x1080 Ultra Graphics & Postprocessing (HBAO+) | |
| SCHENKER XMG Pro 15 (E23) | |
| SCHENKER XMG Fusion 15 (Early 24) | |
| Average of class Gaming (18.4 - 214, n=119, last 2 years) | |
| SCHENKER XMG Core 15 (M24) | |
| Dell G16, i7-13650HX, RTX 4060 | |
| HP Victus 16 (2024) | |
| Lenovo Legion 5 16IRX G9 | |
| GTA V - 1920x1080 Highest Settings possible AA:4xMSAA + FX AF:16x | |
| SCHENKER XMG Fusion 15 (Early 24) | |
| Lenovo Legion 5 16IRX G9 | |
| Dell G16, i7-13650HX, RTX 4060 | |
| SCHENKER XMG Core 15 (M24) | |
| Average of class Gaming (12.1 - 168.2, n=132, last 2 years) | |
| HP Victus 16 (2024) | |
| SCHENKER XMG Pro 15 (E23) | |
| Final Fantasy XV Benchmark - 1920x1080 High Quality | |
| SCHENKER XMG Fusion 15 (Early 24) | |
| Average of class Gaming (19.2 - 201, n=144, last 2 years) | |
| SCHENKER XMG Core 15 (M24) | |
| Lenovo Legion 5 16IRX G9 | |
| Dell G16, i7-13650HX, RTX 4060 | |
| HP Victus 16 (2024) | |
| Dota 2 Reborn - 1920x1080 ultra (3/3) best looking | |
| SCHENKER XMG Fusion 15 (Early 24) | |
| Lenovo Legion 5 16IRX G9 | |
| SCHENKER XMG Pro 15 (E23) | |
| HP Victus 16 (2024) | |
| Dell G16, i7-13650HX, RTX 4060 | |
| Average of class Gaming (65.1 - 220, n=148, last 2 years) | |
| SCHENKER XMG Core 15 (M24) | |
Witcher 3 FPS diagram
| low | med. | high | ultra | QHD | 4K | |
|---|---|---|---|---|---|---|
| GTA V (2015) | 185 | 180.5 | 174.7 | 116.7 | 91.7 | |
| The Witcher 3 (2015) | 402.5 | 337.4 | 215.5 | 111.7 | 83.4 | |
| Dota 2 Reborn (2015) | 165.2 | 150.9 | 145.4 | 135.2 | 131.5 | |
| Final Fantasy XV Benchmark (2018) | 225 | 153.7 | 107.2 | 79.4 | ||
| X-Plane 11.11 (2018) | 143.5 | 125.1 | 97.2 | 90.7 | ||
| Far Cry 5 (2018) | 162 | 142 | 137 | 128 | 108 | |
| Strange Brigade (2018) | 434 | 305 | 242 | 204 | 136.3 | |
| Baldur's Gate 3 (2023) | 160.3 | 125.7 | 110.7 | 105.5 | 72.2 | |
| Cyberpunk 2077 2.2 Phantom Liberty (2023) | 136.1 | 107.2 | 91 | 93.1 | 48.2 | |
| Skull & Bones (2024) | 146 | 127 | 101 | 73 | 57 |
排放与能源--烫手山芋但经济实惠
噪音排放
在台式机上空闲运行时,风扇大多处于不活动状态。然而,哪怕是最轻微的日常负载,如打开浏览器上网,风扇也会被激活,然后以 27 分贝的低噪音嗡嗡作响。通常情况下,您需要处理的就是这种音量。
在重负载情况下,风扇音量会增加到 52 分贝,但当负载期结束后,风扇又会很快安静下来。但在相当长的一段时间内,即使是在空闲运行时,风扇也不会再次安静下来。
相比之下,惠普 Victus 和戴尔 G16 在游戏时的噪音要小一些,而随着Legion 5 的噪音越来越大,酷睿 15 的噪音介于这两款设备之间。
Noise Level
| Idle |
| 23 / 23 / 23 dB(A) |
| Load |
| 38.92 / 52.09 dB(A) |
 | ||
30 dB silent 40 dB(A) audible 50 dB(A) loud |
||
min: | ||
| SCHENKER XMG Core 15 (M24) NVIDIA GeForce RTX 4060 Laptop GPU, R7 8845HS, Samsung 990 Pro 1 TB | Lenovo Legion 5 16IRX G9 NVIDIA GeForce RTX 4060 Laptop GPU, i7-14650HX, Samsung PM9A1 MZVL21T0HCLR | HP Victus 16 (2024) NVIDIA GeForce RTX 4060 Laptop GPU, i7-14700HX, Kioxia XG8 KXG80ZNV512G | Dell G16, i7-13650HX, RTX 4060 NVIDIA GeForce RTX 4060 Laptop GPU, i7-13650HX, WD PC SN740 SDDPNQD-1T00 | SCHENKER XMG Fusion 15 (Early 24) NVIDIA GeForce RTX 4070 Laptop GPU, i9-14900HX, Samsung 990 Pro 1 TB | SCHENKER XMG Pro 15 (E23) NVIDIA GeForce RTX 4060 Laptop GPU, i9-13900HX, Crucial P5 Plus 1TB CT1000P5PSSD8 | |
|---|---|---|---|---|---|---|
| Noise | -14% | -13% | 3% | -18% | -9% | |
| off / environment * | 23 | 24 -4% | 25 -9% | 23 -0% | 25 -9% | 24 -4% |
| Idle Minimum * | 23 | 24 -4% | 28 -22% | 23 -0% | 27 -17% | 24 -4% |
| Idle Average * | 23 | 28.8 -25% | 29 -26% | 23 -0% | 28 -22% | 24 -4% |
| Idle Maximum * | 23 | 32 -39% | 33 -43% | 27.96 -22% | 33 -43% | 24 -4% |
| Load Average * | 38.92 | 45.5 -17% | 45 -16% | 27.96 28% | 52 -34% | 53.65 -38% |
| Witcher 3 ultra * | 50.96 | 53.1 -4% | 43 16% | 47.89 6% | 51 -0% | 53.53 -5% |
| Cyberpunk 2077 ultra * | 52.06 | |||||
| Load Maximum * | 52.09 | 55.7 -7% | 48 8% | 47.89 8% | 53 -2% | 53.65 -3% |
* ... smaller is better
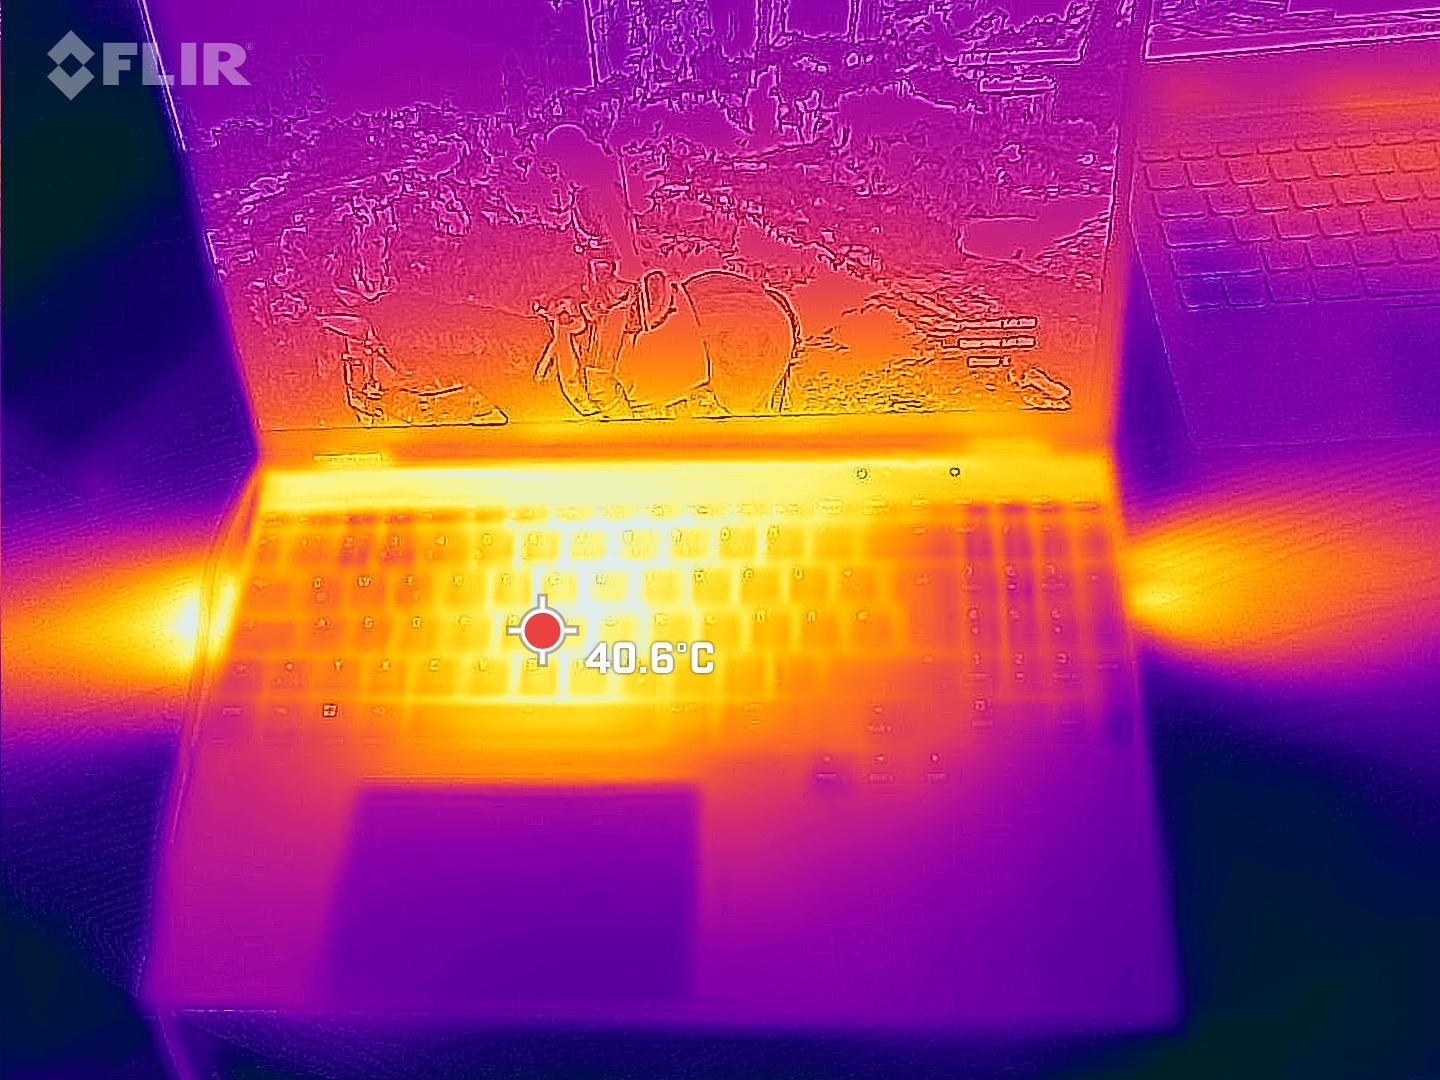
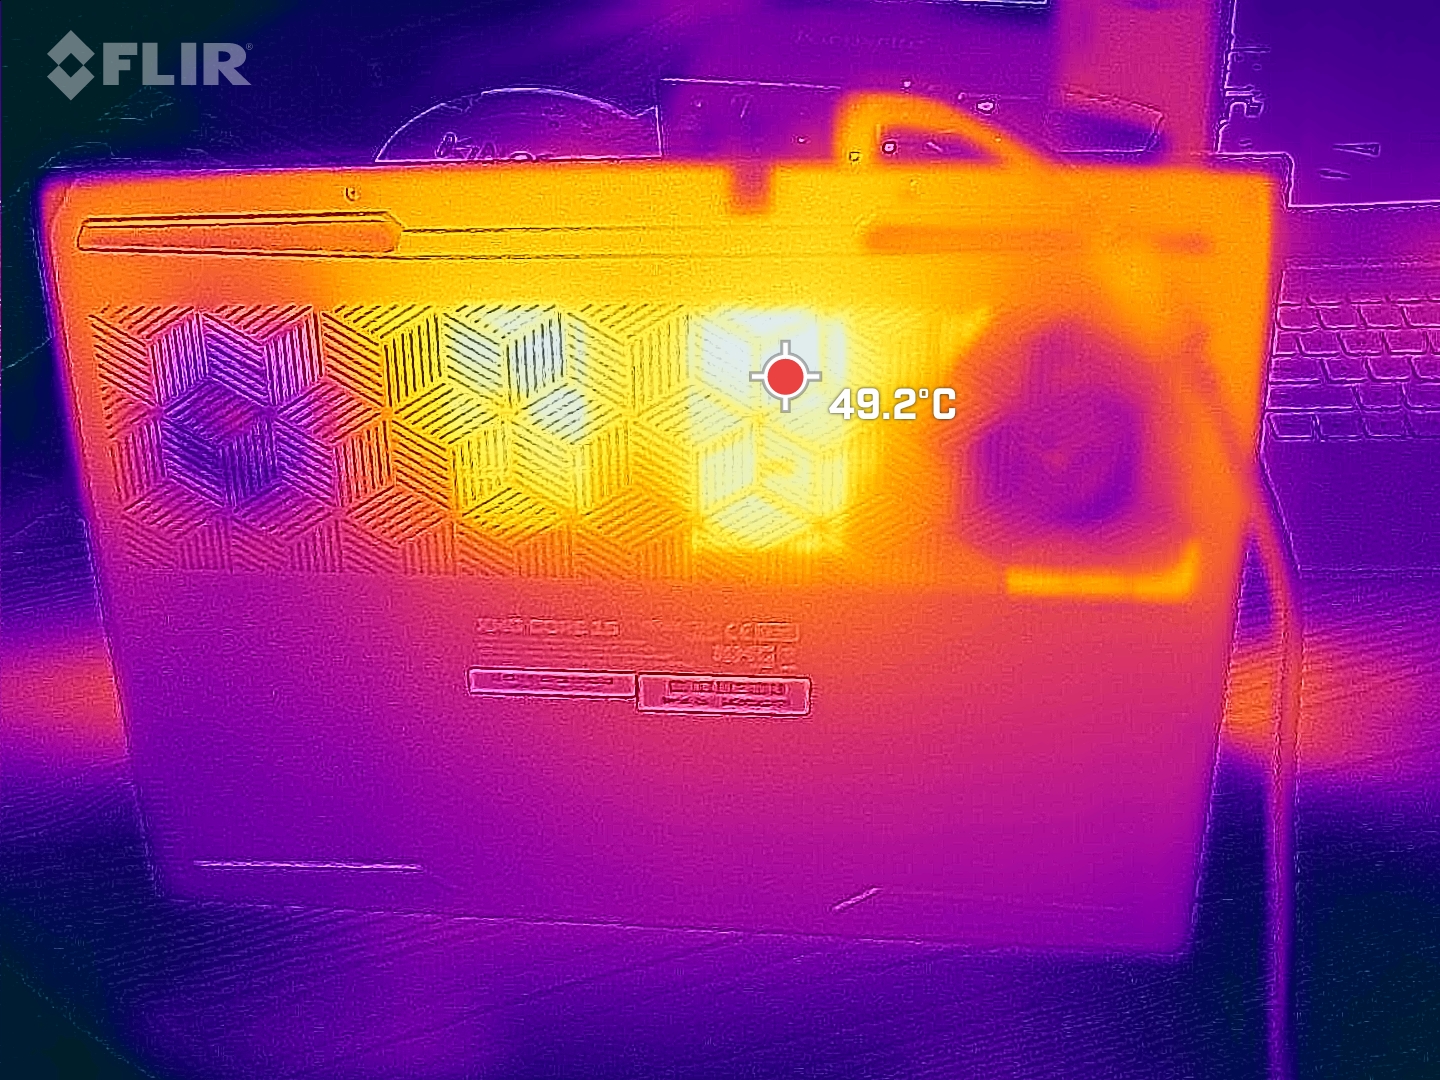
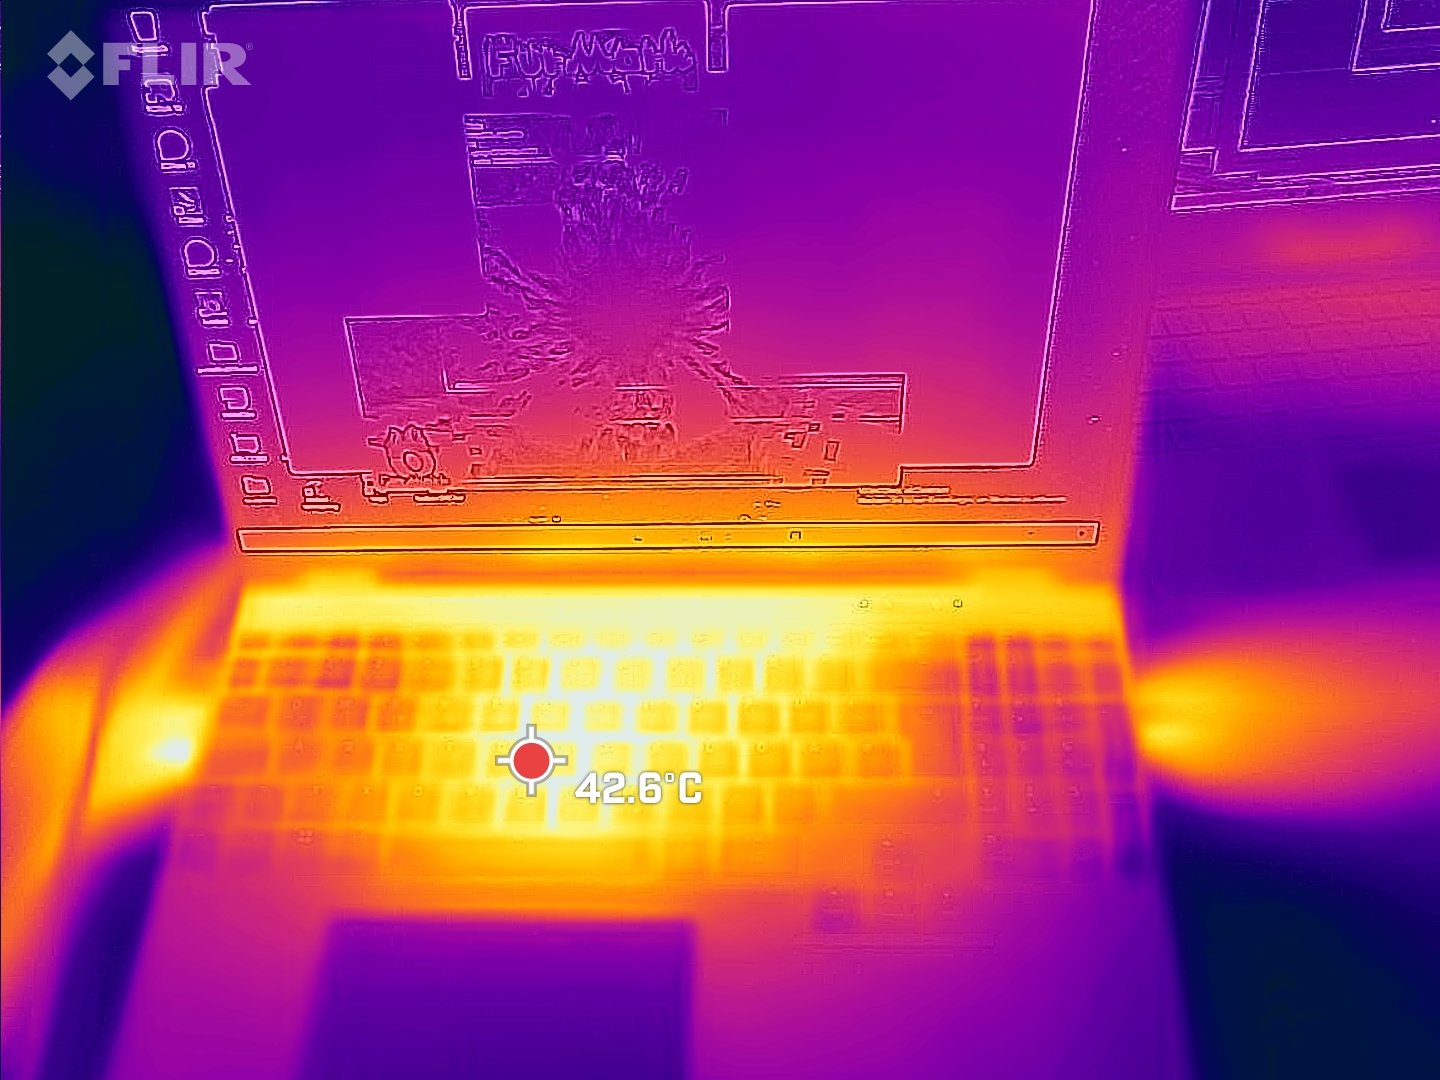
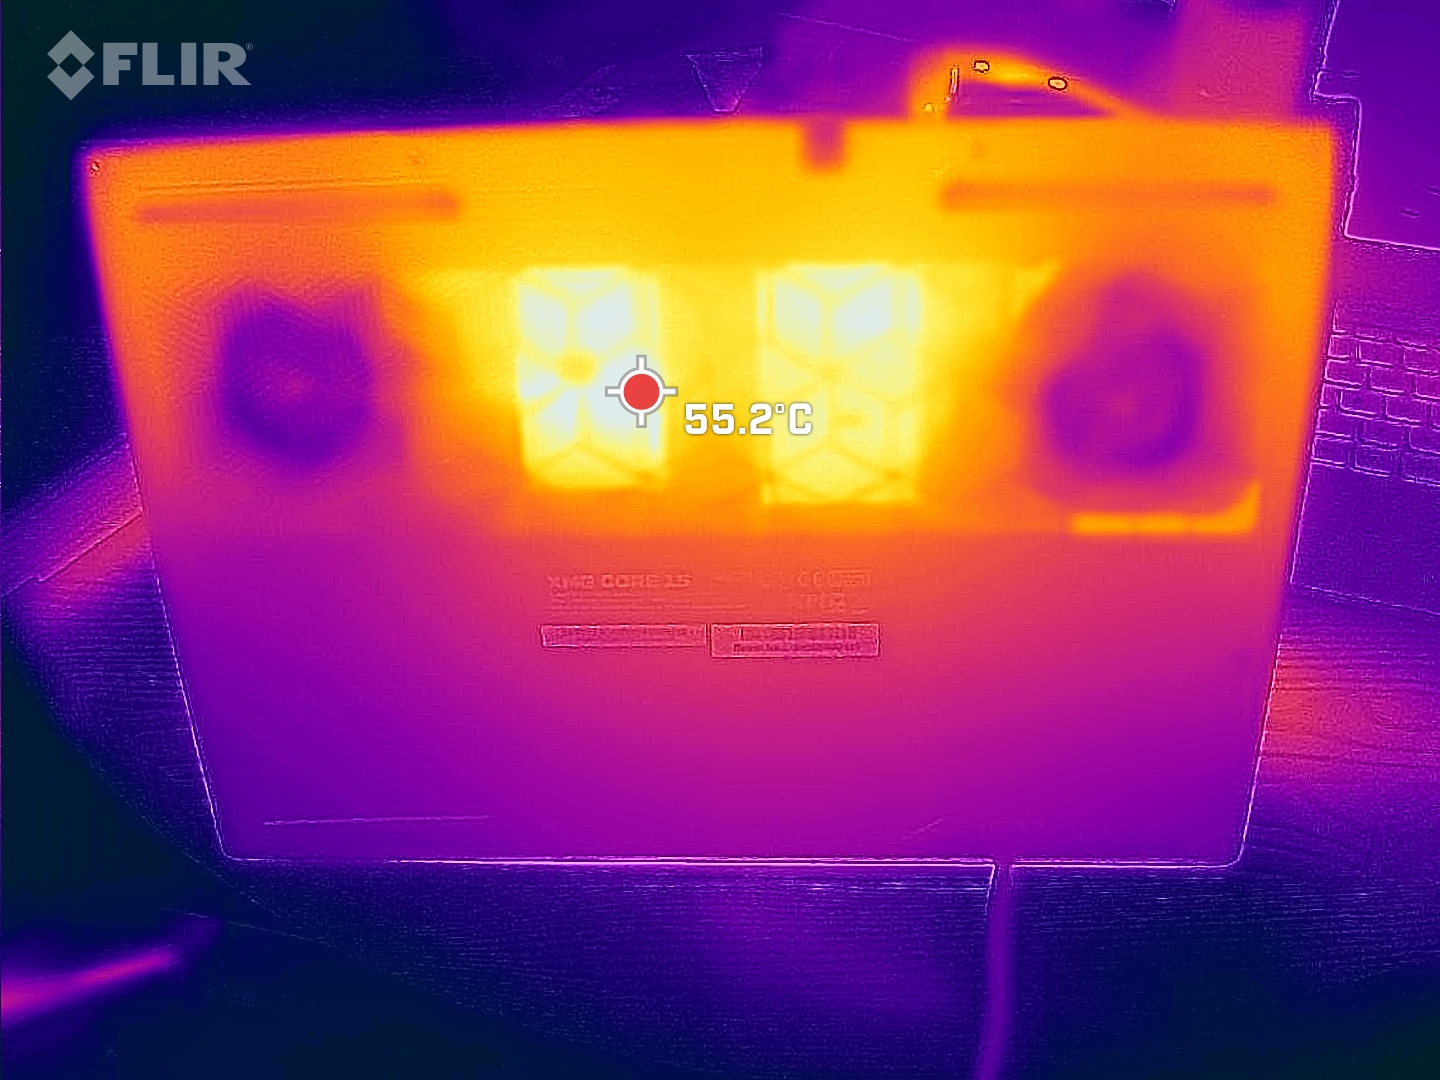
温度
酷睿 15 实际上并不凉爽,金属外壳发热量很大,成为额外的热源,尤其是在机身底部。掌托则相对凉爽。
即使在关闭风扇的情况下空闲运行,温度约为 35 °C,温度也相当高,但在合理范围内。玩游戏时,设备底部显示屏中央的热点温度高达 55°C,在压力测试中略高于 60°C。在这一区域,竞争产品的温度要低得多,即使是配备更强大 GPU 的 Fusion 15 也不例外。这也可能会对 RTX 4070 配置产生影响,导致可能的热节流。
(-) The maximum temperature on the upper side is 52 °C / 126 F, compared to the average of 40.4 °C / 105 F, ranging from 21.2 to 68.8 °C for the class Gaming.
(-) The bottom heats up to a maximum of 61 °C / 142 F, compared to the average of 43.2 °C / 110 F
(±) In idle usage, the average temperature for the upper side is 32.7 °C / 91 F, compared to the device average of 33.9 °C / 93 F.
(-) Playing The Witcher 3, the average temperature for the upper side is 39.2 °C / 103 F, compared to the device average of 33.9 °C / 93 F.
(+) The palmrests and touchpad are reaching skin temperature as a maximum (34 °C / 93.2 F) and are therefore not hot.
(-) The average temperature of the palmrest area of similar devices was 28.9 °C / 84 F (-5.1 °C / -9.2 F).
| SCHENKER XMG Core 15 (M24) AMD Ryzen 7 8845HS, NVIDIA GeForce RTX 4060 Laptop GPU | Lenovo Legion 5 16IRX G9 Intel Core i7-14650HX, NVIDIA GeForce RTX 4060 Laptop GPU | HP Victus 16 (2024) Intel Core i7-14700HX, NVIDIA GeForce RTX 4060 Laptop GPU | Dell G16, i7-13650HX, RTX 4060 Intel Core i7-13650HX, NVIDIA GeForce RTX 4060 Laptop GPU | SCHENKER XMG Fusion 15 (Early 24) Intel Core i9-14900HX, NVIDIA GeForce RTX 4070 Laptop GPU | SCHENKER XMG Pro 15 (E23) Intel Core i9-13900HX, NVIDIA GeForce RTX 4060 Laptop GPU | |
|---|---|---|---|---|---|---|
| Heat | 18% | 21% | 5% | 16% | 12% | |
| Maximum Upper Side * | 52 | 40.4 22% | 50 4% | 49 6% | 48 8% | 50 4% |
| Maximum Bottom * | 61 | 43.8 28% | 50 18% | 58 5% | 56 8% | 50 18% |
| Idle Upper Side * | 35 | 30.3 13% | 25 29% | 35 -0% | 28 20% | 33 6% |
| Idle Bottom * | 39 | 35.3 9% | 26 33% | 35 10% | 29 26% | 32 18% |
* ... smaller is better
发言人
高音和中音线性均衡,但低音几乎听不到,扬声器的音量还可以再大一些。可通过 3.5 毫米耳机接口连接模拟音频设备。
SCHENKER XMG Core 15 (M24) audio analysis
(±) | speaker loudness is average but good (79.12 dB)
Bass 100 - 315 Hz
(-) | nearly no bass - on average 16.7% lower than median
(-) | bass is not linear (15.7% delta to prev. frequency)
Mids 400 - 2000 Hz
(+) | balanced mids - only 4.5% away from median
(+) | mids are linear (4.4% delta to prev. frequency)
Highs 2 - 16 kHz
(+) | balanced highs - only 1% away from median
(+) | highs are linear (2.7% delta to prev. frequency)
Overall 100 - 16.000 Hz
(+) | overall sound is linear (13.7% difference to median)
Compared to same class
» 20% of all tested devices in this class were better, 6% similar, 74% worse
» The best had a delta of 6%, average was 18%, worst was 132%
Compared to all devices tested
» 13% of all tested devices were better, 4% similar, 83% worse
» The best had a delta of 4%, average was 24%, worst was 134%
Apple MacBook Pro 16 2021 M1 Pro audio analysis
(+) | speakers can play relatively loud (84.7 dB)
Bass 100 - 315 Hz
(+) | good bass - only 3.8% away from median
(+) | bass is linear (5.2% delta to prev. frequency)
Mids 400 - 2000 Hz
(+) | balanced mids - only 1.3% away from median
(+) | mids are linear (2.1% delta to prev. frequency)
Highs 2 - 16 kHz
(+) | balanced highs - only 1.9% away from median
(+) | highs are linear (2.7% delta to prev. frequency)
Overall 100 - 16.000 Hz
(+) | overall sound is linear (4.6% difference to median)
Compared to same class
» 0% of all tested devices in this class were better, 0% similar, 100% worse
» The best had a delta of 5%, average was 18%, worst was 45%
Compared to all devices tested
» 0% of all tested devices were better, 0% similar, 100% worse
» The best had a delta of 4%, average was 24%, worst was 134%
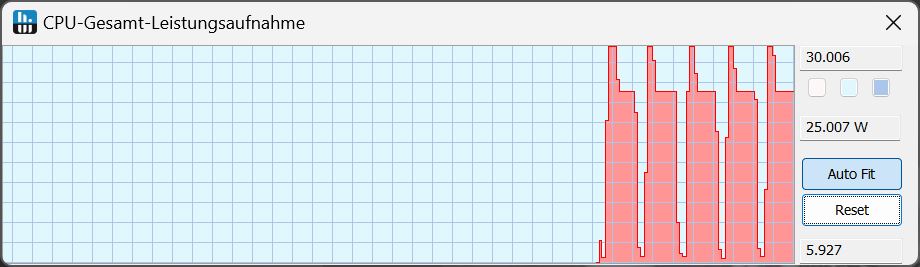
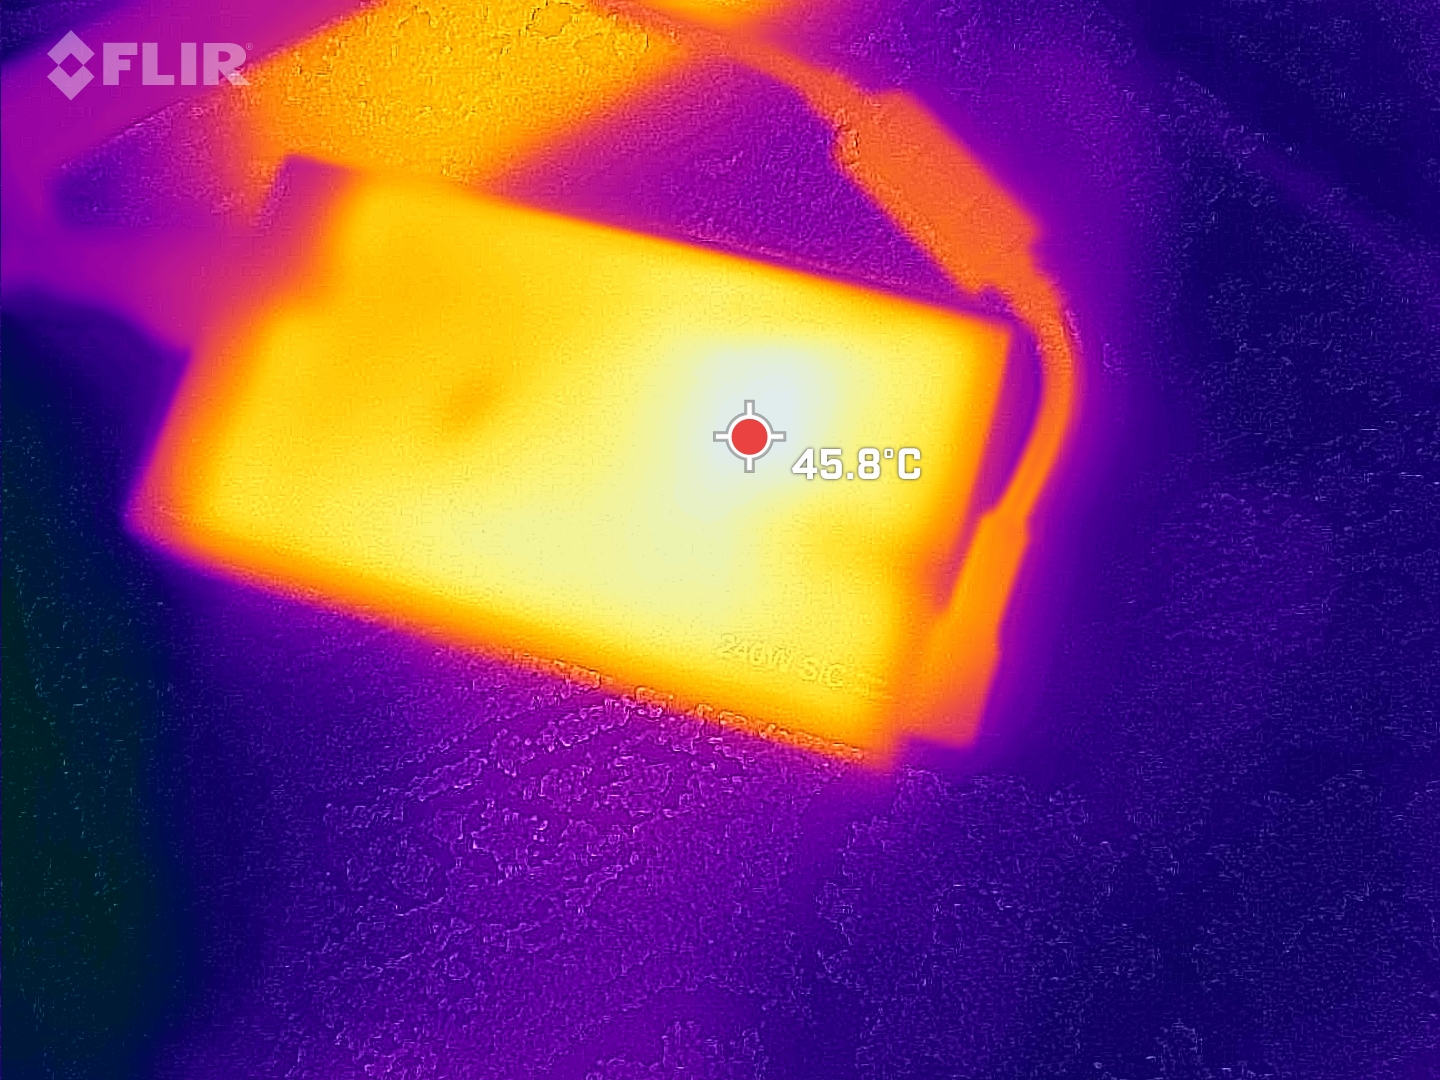
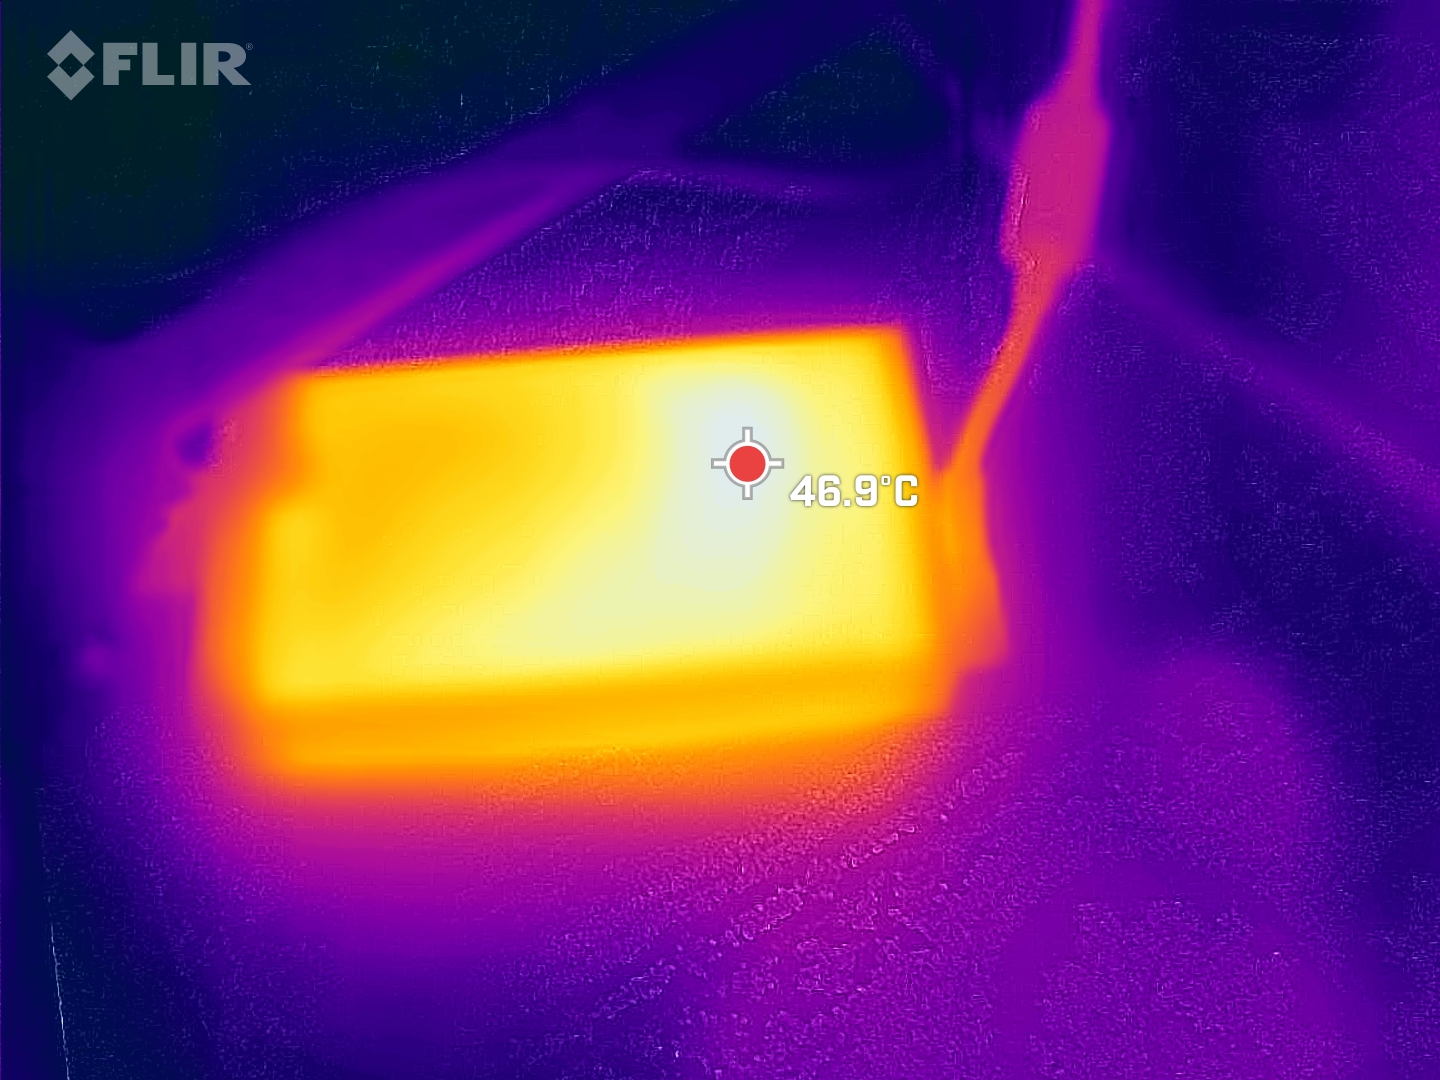
耗电量
酷睿 15 比竞争对手略微经济一些,尤其是在空闲运行时--这一切都非常好。游戏时的功耗也保持适中。
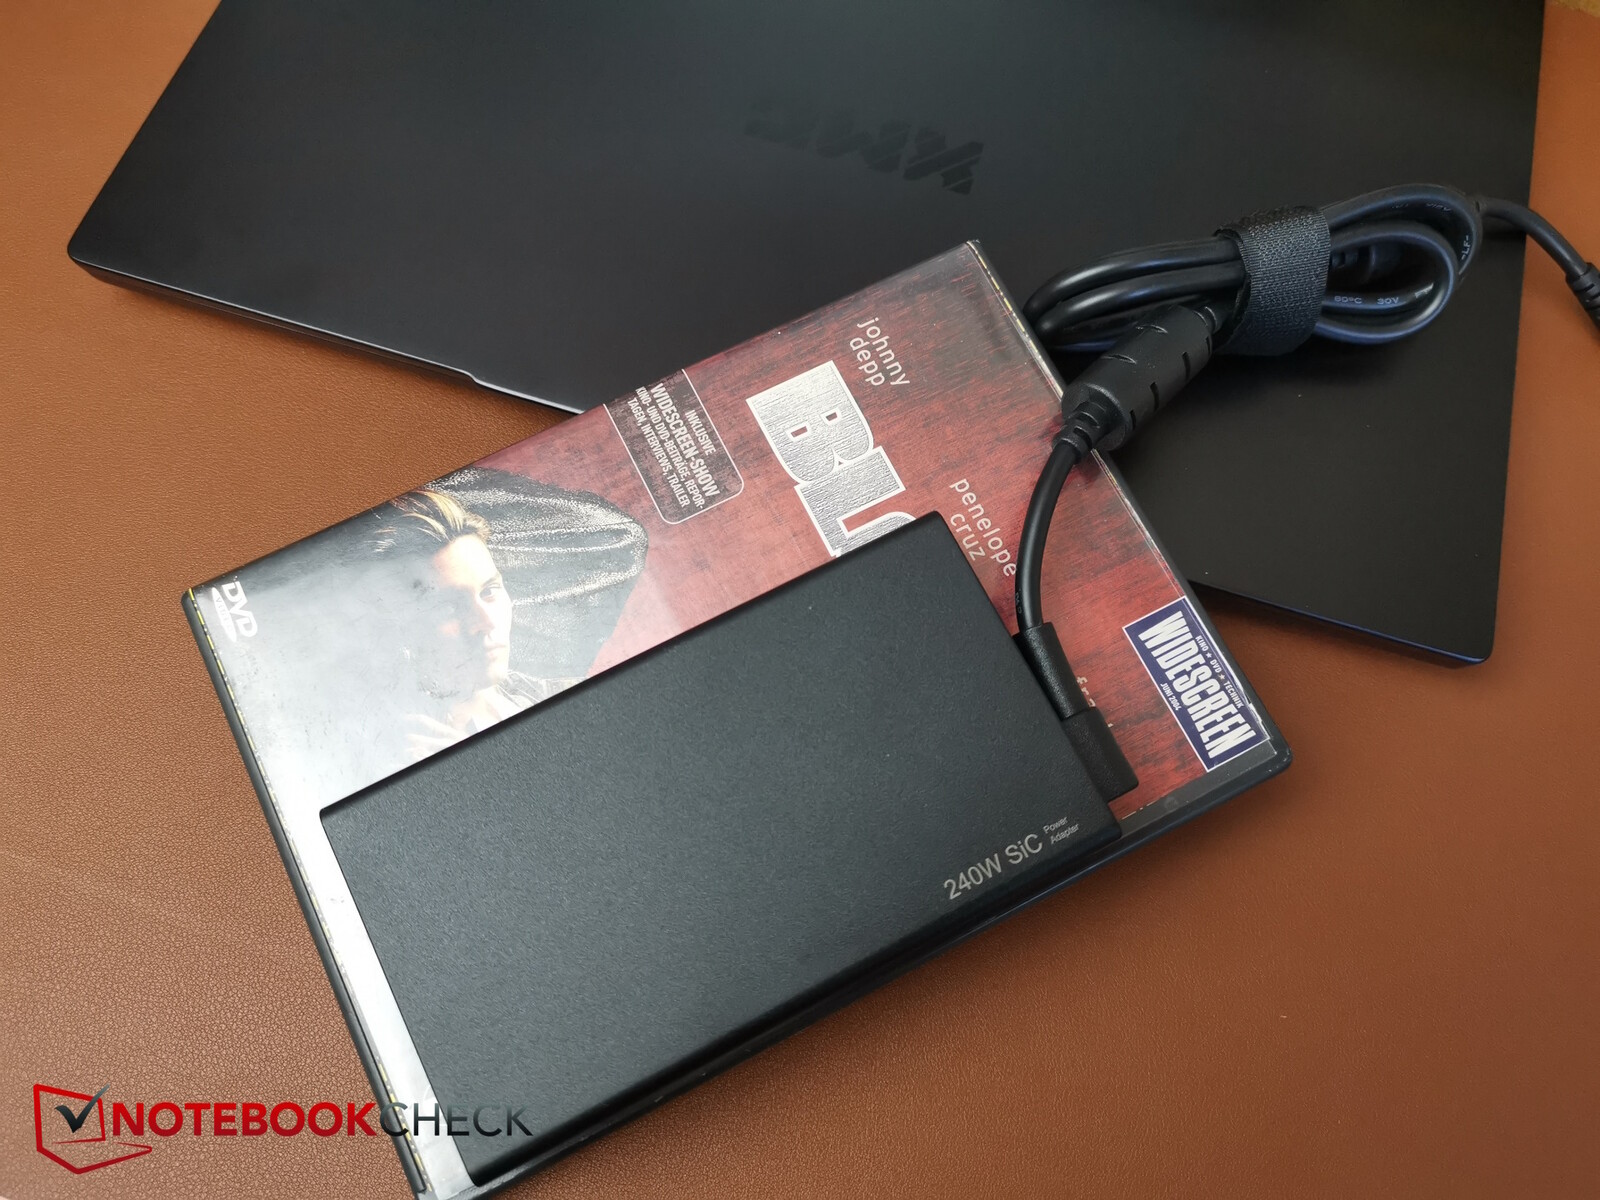
在压力测试中,我们暂时测得的消耗值高达 286 W,理论上可能会让 240 W 的 PSU 不堪重负。不过,这些负载峰值实际上只是暂时的。在游戏过程中,我们测得的平均耗电量仅为 167 W,而这正是 PSU 能够始终承受的。
说到 PSU,申克似乎在缩小尺寸方面做了改进。制造商不再使用笨重的 240 瓦 Chicony PSU,而是采用了 240 瓦的设备,但外形尺寸却小了很多。这对移动性非常有利。
| Off / Standby | |
| Idle | |
| Load |
|
Key:
min: | |
| SCHENKER XMG Core 15 (M24) R7 8845HS, NVIDIA GeForce RTX 4060 Laptop GPU, Samsung 990 Pro 1 TB, IPS, 2560x1600, 15.3" | Lenovo Legion 5 16IRX G9 i7-14650HX, NVIDIA GeForce RTX 4060 Laptop GPU, Samsung PM9A1 MZVL21T0HCLR, IPS, 2560x1600, 16" | HP Victus 16 (2024) i7-14700HX, NVIDIA GeForce RTX 4060 Laptop GPU, Kioxia XG8 KXG80ZNV512G, IPS, 1920x1080, 16.1" | Dell G16, i7-13650HX, RTX 4060 i7-13650HX, NVIDIA GeForce RTX 4060 Laptop GPU, WD PC SN740 SDDPNQD-1T00, IPS, 2560x1600, 16" | SCHENKER XMG Fusion 15 (Early 24) i9-14900HX, NVIDIA GeForce RTX 4070 Laptop GPU, Samsung 990 Pro 1 TB, IPS, 2560x1600, 15.3" | SCHENKER XMG Pro 15 (E23) i9-13900HX, NVIDIA GeForce RTX 4060 Laptop GPU, Crucial P5 Plus 1TB CT1000P5PSSD8, IPS, 2560x1440, 15.6" | Average NVIDIA GeForce RTX 4060 Laptop GPU | Average of class Gaming | |
|---|---|---|---|---|---|---|---|---|
| Power Consumption | -36% | -13% | -13% | -20% | -100% | -20% | -45% | |
| Idle Minimum * | 9.3 | 15.4 -66% | 9 3% | 11 -18% | 8 14% | 21.6 -132% | 11.5 ? -24% | 13.4 ? -44% |
| Idle Average * | 12.9 | 19.7 -53% | 15 -16% | 14.8 -15% | 14 -9% | 29 -125% | 16 ? -24% | 18.9 ? -47% |
| Idle Maximum * | 12.8 | 20.7 -62% | 23 -80% | 16.8 -31% | 26 -103% | 42.7 -234% | 20.3 ? -59% | 26.3 ? -105% |
| Witcher 3 ultra * | 167 | 191.3 -15% | 143.7 14% | 185 -11% | 192.7 -15% | 189 -13% | ||
| Load Maximum * | 286 | 246.6 14% | 241 16% | 255 11% | 244 15% | 269 6% | 210 ? 27% | 244 ? 15% |
| Load Average * | 102.6 | 123 | 103.7 | 118 | 190 | 92.9 ? | 102.7 ? |
* ... smaller is better
Power consumption Witcher 3 / stress test
Power consumption with an external monitor
电池寿命
作为标准配置,申克安装了一块 80 Wh 的电池。不过,只需额外支付约 70 美元,该设备就可以配置更大的 99.8 Wh 电池,也就是我们评测机型上的电池。
在降低亮度为 150 尼特的情况下,酷睿 15 可在 Wi-Fi 或视频测试中持续工作约 7 小时。如果把亮度调到最大,在 Wi-Fi 测试中不到 5 小时就会熄灭。总体而言,我们的电池续航时间非常不错,尽管Legion 的 80 Wh 电池似乎也能提供类似的性能。
| SCHENKER XMG Core 15 (M24) R7 8845HS, NVIDIA GeForce RTX 4060 Laptop GPU, 99.8 Wh | Lenovo Legion 5 16IRX G9 i7-14650HX, NVIDIA GeForce RTX 4060 Laptop GPU, 80 Wh | HP Victus 16 (2024) i7-14700HX, NVIDIA GeForce RTX 4060 Laptop GPU, 83 Wh | Dell G16, i7-13650HX, RTX 4060 i7-13650HX, NVIDIA GeForce RTX 4060 Laptop GPU, 86 Wh | SCHENKER XMG Fusion 15 (Early 24) i9-14900HX, NVIDIA GeForce RTX 4070 Laptop GPU, 99.8 Wh | SCHENKER XMG Pro 15 (E23) i9-13900HX, NVIDIA GeForce RTX 4060 Laptop GPU, 80 Wh | Average of class Gaming | |
|---|---|---|---|---|---|---|---|
| Battery Runtime | -42% | -43% | -48% | -13% | -43% | -42% | |
| H.264 | 608 | 576 -5% | 381 -37% | 602 -1% | 447 ? -26% | ||
| WiFi v1.3 | 889 | 444 -50% | 511 -43% | 378 -57% | 480 -46% | 343.1 -61% | 387 ? -56% |
| Load | 151 | 46 -70% | 76 -50% | 164 9% | 115 -24% | 84.5 ? -44% | |
| Reader / Idle | 911 | 585 ? |
Pros
Cons
结论 - 性能良好,价格实惠,冷却效果可能会有所改善
Core 15 的价格至少比 Fusion 15 便宜 200 美元。但代价是,它不能使用 Thunderbolt 技术和更强大的 CPU。后者导致 CPU 性能明显下降近 20%。不过,在大多数 3D 游戏中,你并不会真正注意到这一点。Fusion 在这方面可能会快 20%,但这要归功于它的 RTX 4070。RTX 4060 变体应该也能达到同样的速度。
我们喜欢 Core 的金属外壳工艺,以及在内存和固态硬盘方面良好的可扩展性选择。键盘、3D 性能和电池续航时间也很不错。
唯一的 "诟病 "是底座的金属表面在重负载时会产生大量热量。在这方面,制造商今后应加以改进,并优化散热系统。
XMG Core 15 是一款功能强大的 3D 游戏机,具有良好的制造质量,其中包括在负载情况下温度略高的金属外壳。
去年的 XMG Pro 15 是值得一看的替代产品。去年的 HX CPU 仍然比这里的 AMD 处理器更快,而且 Pro 还配备了 Thunderbolt 4。Legion 5i 也是一个不错的选择,尤其是价格更低的 Campuspoint 版本。
价格和供应情况
在Schenker 商店在德国,酷睿 15 的起价约为 1,500 美元(当前汇率)。由于配备了更大的电池、Wi-Fi 6E、更多内存和三星 990 Pro 固态硬盘,我们的评测机型价格约为 1700 美元。相比之下,Fusion 15 的起价约为 1600 美元。
SCHENKER XMG Core 15 (M24)
- 07/17/2024 v8
Christian Hintze
 Total Sustainability Score:
 Transparency
The selection of devices to be reviewed is made by our editorial team. The test sample was provided to the author as a loan by the manufacturer or retailer for the purpose of this review. The lender had no influence on this review, nor did the manufacturer receive a copy of this review before publication. There was no obligation to publish this review. We never accept compensation or payment in return for our reviews. As an independent media company, Notebookcheck is not subjected to the authority of manufacturers, retailers or publishers.
This is how Notebookcheck is testing
Every year, Notebookcheck independently reviews hundreds of laptops and smartphones using standardized procedures to ensure that all results are comparable. We have continuously developed our test methods for around 20 years and set industry standards in the process. In our test labs, high-quality measuring equipment is utilized by experienced technicians and editors. These tests involve a multi-stage validation process. Our complex rating system is based on hundreds of well-founded measurements and benchmarks, which maintains objectivity. Further information on our test methods can be found here.
Price comparison

